Embed Size (px)
Citation preview
The Business Cycle Largely a "Dance of the Dollar"Author(s): Irving FisherSource: Journal of the American Statistical Association, Vol. 18, No. 144 (Dec., 1923), pp. 1024-1028Published by: American Statistical AssociationStable URL: http://www.jstor.org/stable/2965663 .
Accessed: 14/06/2014 13:47
Your use of the JSTOR archive indicates your acceptance of the Terms & Conditions of Use, available at .http://www.jstor.org/page/info/about/policies/terms.jsp
.JSTOR is a not-for-profit service that helps scholars, researchers, and students discover, use, and build upon a wide range ofcontent in a trusted digital archive. We use information technology and tools to increase productivity and facilitate new formsof scholarship. For more information about JSTOR, please contact [email protected].
.
American Statistical Association is collaborating with JSTOR to digitize, preserve and extend access to Journalof the American Statistical Association.
http://www.jstor.org
This content downloaded from 194.29.185.25 on Sat, 14 Jun 2014 13:47:00 PMAll use subject to JSTOR Terms and Conditions
1024 American Statistical As8ociation [76
NOTES
THE BUSINESS CYCLE LARGELY A "DANCE OF THE DOLLAR"'
BY IRviNG FISHER
Hitherto the effort to explain and forecast the "Business Cycle" has been chiefly empirical. I suspect that we shall, in the future, make greater progress by employing more analysis. Instead of beginning with actual historical "cycles" which are, in each case, a composite resultant of innumerable forces, we shall trace the action of the chief forces themselves. I further suspect that the principal force affecting the cycle is the real rate of interest, the sum of the money rate of in- terest and the rate of appreciation (positive or negative) of the purchas- ing power of the dollar.2
I here present some preliminary findings as to one only of the two components of the real rate of interest, namely, the appreciation (or depreciation) of the purchasing power of the dollar or, otherwise ex- pressed, the rapidity of fall (or rise) of the price level.
The various business services which have sprung up during the last decade all seem to recognize that the price level is of vital importance, but its real role has been missed because the price level itself has been looked to instead of its rate of change.
They have made the mistake of treating the price curve like popula- tion, trade, etc., which grow with the growth of the country, and have attempted to discover a "secular trend" and estimate the oscillations about this trend. Some of these services, when the war wrought its havoc with prices, simply omitted the price curve altogether through the period of greatest disturbance although it was precisely under such circumstances that its r6le in disturbing business was most im- portant and, as we shall see, most evident.
The distinction between a curve portraying the price level and a curve portraying its rapidity of change is the same sort of distinction as that between any mathematical function and its differential quotient or first derivative. It is exemplified by the distinction between dis-
'Expansion of remarks at the Annual Meeting of the National Monetary Association, June 7, 1923. 2 This view was foreshadowed in my "Appreciation and Interest" (Publications of the American Eco-
nomic Association, Vol. XI, No. 4, 1896, e. g. p. 410) and in subsequent writings. It was emphasized by me in the discussion at the dinner of the American Statistical Association, December 15, 1922.
This content downloaded from 194.29.185.25 on Sat, 14 Jun 2014 13:47:00 PMAll use subject to JSTOR Terms and Conditions
77] Notes 1025
tance and velocity, or velocity and acceleration, or energy and power, or the height of a hill and its steepness.
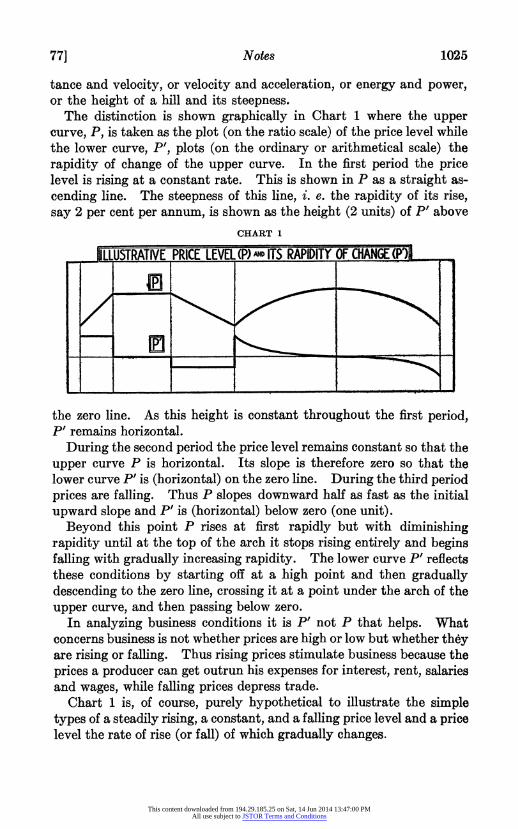
The distinction is shown graphically in Chart 1 where the upper curve, P, is taken as the plot (on the ratio scale) of the price level while the lower curve, P', plots (on the ordinary or arithmetical scale) the rapidity of change of the upper curve. In the first period the price level is rising at a constant rate. This is shown in P as a straight as- cending line. The steepness of this line, i. e. the rapidity of its rise, say 2 per cent per annum, is shown as the height (2 units) of P' above
CHART 1
LLUSTRATIVE PRICE LEVEL (P) IT RAPIDITY O CHANGE (PI
the zero line. As this height is constant throughout the first period, P' remains horizontal.
During the second period the price level remains constant so that the upper curve P is horizontal. Its slope is therefore zero so that the lower curve P' is (horizontal) on the zero line. During the third period prices are falling. Thus P slopes downward half as fast as the initial upward slope and P' is (horizontal) below zero (one unit).
Beyond this point P rises at first rapidly but with diminishing rapidity until at the top of the arch it stops rising entirely and begins falling with gradually increasing rapidity. The lower curve P' reflects these conditions by starting off at a high point and then gradually descending to the zero line, crossing it at a point under the arch of the upper curve, and then passing below zero.
In analyzing business conditions it is P' not P that helps. What concerns business is not whether prices are high or low but whether they are rising or falling. Thus rising prices stimulate business because the prices a producer can get outrun his expenses for interest, rent, salaries and wages, while falling prices depress trade.
Chart 1 is, of course, purely hypothetical to illustrate the simple types of a steadily rising, a constant, and a falling price level and a price level the rate of rise (or fall) of which gradually changes.
This content downloaded from 194.29.185.25 on Sat, 14 Jun 2014 13:47:00 PMAll use subject to JSTOR Terms and Conditions
1026 American Statistical Association [78
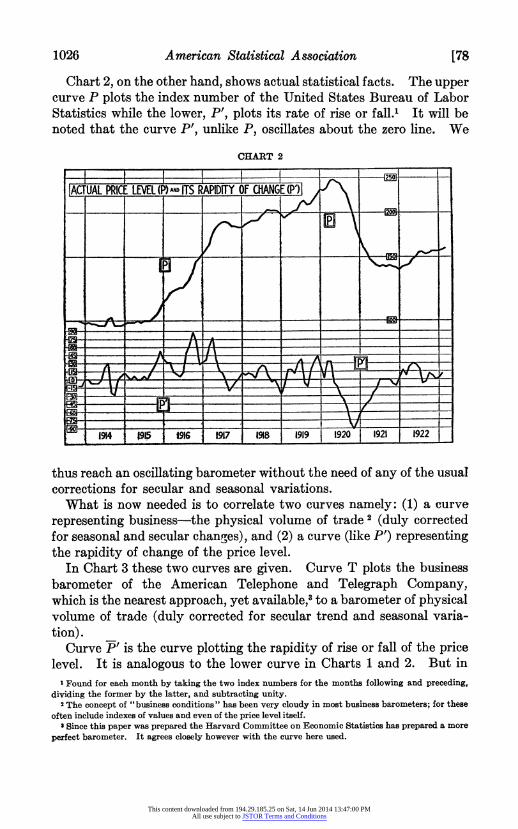
Chart 2, on the other hand, shows actual statistical facts. The upper curve P plots the index number of the United States Bureau of Labor Statistics while the lower, P', plots its rate of rise or fall.' It will be noted that the curve F', unlike P, oscillates about the zero line. We
CHART 2
'I'III I A
?UAC PtRICF .LEVL (JA )ITSE APIDITY )FCAGE (P') I v
thus reach an oscillating barometer without the need of any of the usual corrections for secular and seasonal variations.
What is now needed is to correlate two curves namely: (1) a curve representing business-the physical volume of trade 2 (duly corrected for seasonal and secular changres), and (2) a curve (like ') representing the rapidity of change of the price level.
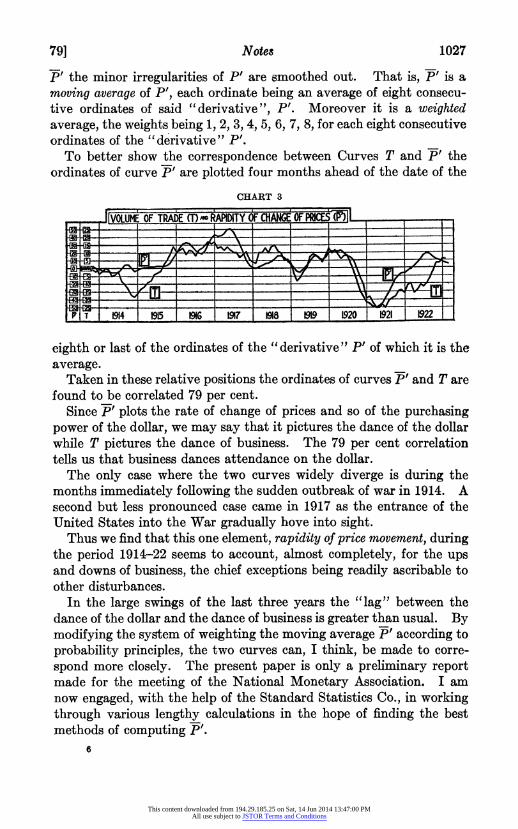
In Chart 3 these two curves are given. Curve T plots the business barometer of the American Telephone and Telegraph Company, which is the nearest approach, yet available,' to a barometer of physical volume of trade (duly corrected for secular trend and seasonal varia- tion).
Curve P' is the curve plotting the rapidity of rise or fall of the price level. It is analogous to the lower curve in Charts 1 and 2. But in
eFound for each month by taking the two index numbers for the months following and preceding, dividing the former by the latter, and subtracting unity.
2 The concept of " business conditions" has been very cloudy in most business barometers; for these often include indexes of values and even of the price level itself.
ISince this paper was prepared the Harvard Committee on Economic Statistics has prepared a more perfect barometer. It agrees closely however with the curve here used.
This content downloaded from 194.29.185.25 on Sat, 14 Jun 2014 13:47:00 PMAll use subject to JSTOR Terms and Conditions
79] Notes 1027
P' the minor irregularities of P' are smoothed out. That is, P' is a moving average of F', each ordinate being an average of eight consecu- tive ordinates of said "derivative", P'. Moreover it is a weighted average, the weights being 1, 2, 3, 4, 5, 6, 7, 8, for each eight consecutive ordinates of the "derivative" P'.
To better show the correspondence between Curves T and P' the ordinates of curve P' are plotted four months ahead of the date of the
CHART 3
J[voLr OF TRADE M RATY OF CHANGE OF L
T X 914 1 5 e9G6 97 98 9 1920 1921 1 2 2
eighth or last of the ordinates of the " derivative " P' of which it is the average.
Taken in these relative positions the ordinates of curves P' and T are found to be correlated 79 per cent.
Since P' plots the rate of change of prices and so of the purchasing power of the dollar, we may say that it pictures the dance of the dollar while T pictures the dance of business. The 79 per cent correlation tells us that business dances attendance on the dollar.
The only case where the two curves widely diverge is during the months immediately following the sudden outbreak of war in 1914. A second but less pronounced case came in 1917 as the entrance of the United States into the War gradually hove into sight.
Thus we find that this one element, rapidity of price movement, during the period 1914-22 seems to account, almost completely, for the ups and downs of business, the chief exceptions being readily ascribable to other disturbances.
In the large swings of the last three years the "lag" between the dance of the dollar and the dance of business is greater than usual. By modifying the system of weighting the moving average P' according to probability principles, the two curves can, I think, be made to corre- spond more closely. The present paper is only a preliminary report made for the meeting of the National Monetary Association. I am now engaged, with the help of the Standard Statistics Co., in working through various lengthy calculations in the hope of finding the best methods of computing P'.
6
This content downloaded from 194.29.185.25 on Sat, 14 Jun 2014 13:47:00 PMAll use subject to JSTOR Terms and Conditions
1028 American Statistical Association [80
After such an analysis, it may be possible to make a synthesis with the rate of interest and other factors by which we can not only better under- stand, but also better forecast business conditions-to say nothing of controlling them.
ABRIDGED LIFE TABLES FOR HEALTH OFFICERS
ILLUSTRATED BY A SHORT TABLE FOR THE REGISTRATION STATES IN 1921
BY CHARLES C. GROVE, Statistical Bureau, Metropolitan Life Insurance Company
This paper is to present on a single sheet the short form of a life table in complete detail, so that it can be followed by health officers towards learning how to make tables of their own. The best way to learn how to construct a table is to construct one. Count on occupying two days in getting the steps of the process, then on more days to give you facility and speed in making other tables. Tables such as these have been constructed as a routine procedure in the Metropolitan Life Insurance Co. and, because they have proved advantageous, it was suggested by Dr. Dublin, that the method should be made gener- ally available.
The best means available today of studying the value and effective- ness of public health efforts and measures is through the death rates and expectations of life tables. Personally, the writer, were he a physician, would not be satisfied to have his work thus judged. But, until we can get careful and accurate morbidity statistics, life tables must re- main the best means. When we can know with assurance of the inci- dence of diseases; the age, sex, color of the afflicted; the duration and outcome of the case; and have this information over a period of years, we can begin to form judgments as to the value of the present health movement.
The process of making such abridged tables has been presented by Mr. George King in the Supplement to the Seventy-Fifth Annual Report of the Registrar-General of Births, Deaths and Marriages in England and Wales, Part 1,-Life Tables, pages 26 and following. This report is not easily available for all. In practice difficulties may arise in clos- ing out the table due to the uncertainty of the data at the older ages. Mr. King himself, locus citus, page 27, says, "At these older ages the statistics are very uncertain, and each case must be treated on its merits, and methods must be devised to meet its special difference, and in order that we may carry the table of log px beyond the point to which the original data take it, we must arrange to have a final constant differ-
This content downloaded from 194.29.185.25 on Sat, 14 Jun 2014 13:47:00 PMAll use subject to JSTOR Terms and Conditions

![Member FINRA/SIPC2015, the dollar has been largely range bound [Figure 2]. Imbalances may occur if the dollar gets too strong relative to other currencies, particularly in EM — representing](https://img.pdfslide.net/doc/110x75/6015ad65713ac236966eda61/member-finra-2015-the-dollar-has-been-largely-range-bound-figure-2-imbalances.jpg)
![àäQCÅyCjüíz©ÅàtèCríüü©nCKtpànChourtOCUSTYL… [ 9 ] The ...Experimental music, opera, theater, and dance are largely confined to concert halls and theaters, far removed](https://img.pdfslide.net/doc/110x75/6126d25d52ccd4569813c1b2/qcycjztcrncktpnchourtocustyl-9-the-experimental.jpg)

![Member FINRA/SIPC€¦ · 2015, the dollar has been largely range bound [Figure 2]. Imbalances may occur if the dollar gets too strong relative to other currencies, particularly in](https://img.pdfslide.net/doc/110x75/6015ae1eb0563f41e27ecfa1/member-finrasipc-2015-the-dollar-has-been-largely-range-bound-figure-2-imbalances.jpg)