Embed Size (px)
Citation preview
The Chemistry of the Vasa
- Iron, Acids and Degradation
Gunnar Almkvist Faculty of Natural Resources and Agricultural Science
Department of Chemistry Uppsala
Doctoral Thesis Swedish University of Agricultural Sciences
Uppsala 2008
Acta Universitatis agriculturae Sueciae
2008:57
ISSN 1652-6880 ISBN 978-91-85913-90-9 © 2008 Gunnar Almkvist, Uppsala Tryck: SLU Service/Repro, Uppsala 2008
The Chemistry of the Vasa - Iron, Acids and Degradation
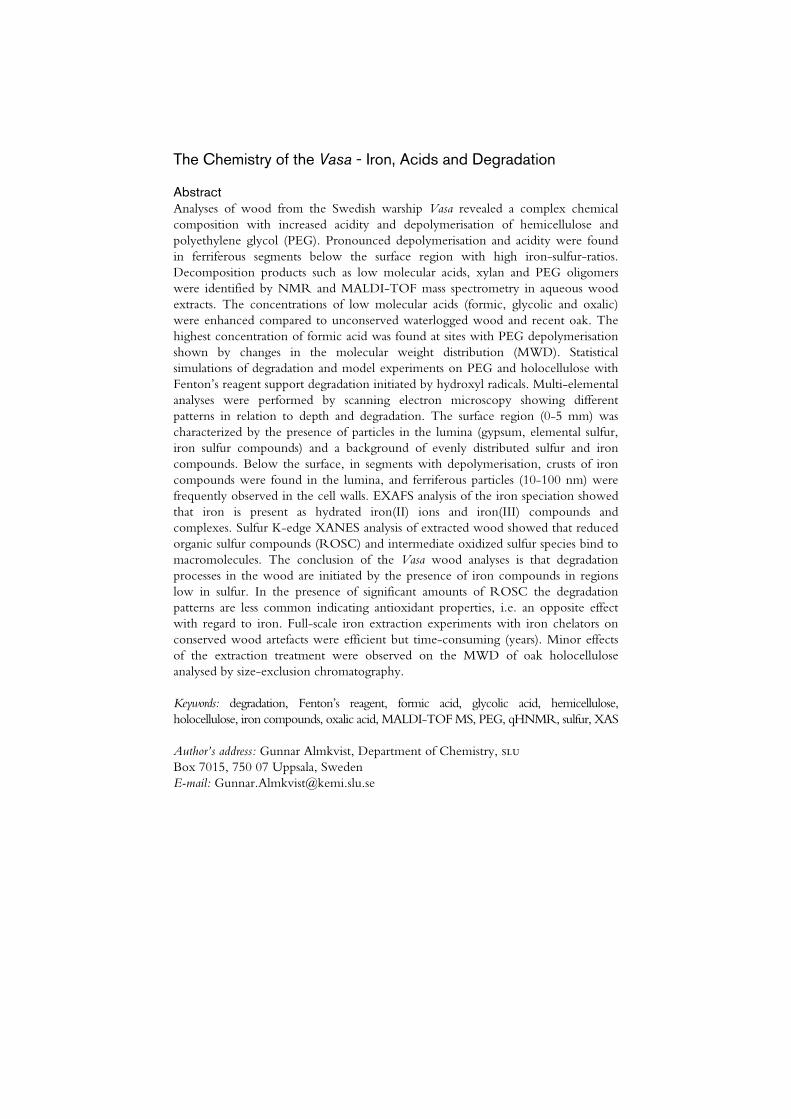
Abstract Analyses of wood from the Swedish warship Vasa revealed a complex chemical composition with increased acidity and depolymerisation of hemicellulose and polyethylene glycol (PEG). Pronounced depolymerisation and acidity were found in ferriferous segments below the surface region with high iron-sulfur-ratios. Decomposition products such as low molecular acids, xylan and PEG oligomers were identified by NMR and MALDI-TOF mass spectrometry in aqueous wood extracts. The concentrations of low molecular acids (formic, glycolic and oxalic) were enhanced compared to unconserved waterlogged wood and recent oak. The highest concentration of formic acid was found at sites with PEG depolymerisation shown by changes in the molecular weight distribution (MWD). Statistical simulations of degradation and model experiments on PEG and holocellulose with Fenton’s reagent support degradation initiated by hydroxyl radicals. Multi-elemental analyses were performed by scanning electron microscopy showing different patterns in relation to depth and degradation. The surface region (0-5 mm) was characterized by the presence of particles in the lumina (gypsum, elemental sulfur, iron sulfur compounds) and a background of evenly distributed sulfur and iron compounds. Below the surface, in segments with depolymerisation, crusts of iron compounds were found in the lumina, and ferriferous particles (10-100 nm) were frequently observed in the cell walls. EXAFS analysis of the iron speciation showed that iron is present as hydrated iron(II) ions and iron(III) compounds and complexes. Sulfur K-edge XANES analysis of extracted wood showed that reduced organic sulfur compounds (ROSC) and intermediate oxidized sulfur species bind to macromolecules. The conclusion of the Vasa wood analyses is that degradation processes in the wood are initiated by the presence of iron compounds in regions low in sulfur. In the presence of significant amounts of ROSC the degradation patterns are less common indicating antioxidant properties, i.e. an opposite effect with regard to iron. Full-scale iron extraction experiments with iron chelators on conserved wood artefacts were efficient but time-consuming (years). Minor effects of the extraction treatment were observed on the MWD of oak holocellulose analysed by size-exclusion chromatography.
Keywords: degradation, Fenton’s reagent, formic acid, glycolic acid, hemicellulose, holocellulose, iron compounds, oxalic acid, MALDI-TOF MS, PEG, qHNMR, sulfur, XAS
Author’s address: Gunnar Almkvist, Department of Chemistry, slu Box 7015, 750 07 Uppsala, Sweden E-mail: [email protected]
4
Uppå det sjunkna skeppet haver jag med flit låtit arbeta och god förhoppning haft något att utträtta ...
Amiral Klas Fleming i en skrivelse till konungen den 27 november 1629
5
Contents
List of Publications 7
Abbreviations 8
1 General background and aims 9
2 The history of the Vasa from a chemical perspective 11 2.1 The wood 11 2.2 Waves of diffusion 13
2.2.1 The time in the sea 1628-1961 13 2.2.2 The conservation period, 1962-1979 16 2.2.3 Drying and the time in the museum hall, 1980- 18
2.3 Degradation processes in archaeological wood 19 2.3.1 Microbial degradation 20 2.3.2 Chemical degradation and spontaneous wood aging 20
3 Material and methods 25 3.1 Analysis of the Vasa wood 25
3.1.1 Sampling and preparation 25 3.1.2 Extraction of water-soluble compounds 26
3.2 Model experiments – Fenton’s reaction 27 3.3 Iron extraction experiments 27 3.4 Simulation of PEG degradation 27 3.5 Analytical methods 28
3.5.1 Nuclear magnetic resonance spectroscopy 28 3.5.2 X-ray absorption spectroscopy 29 3.5.3 Scanning electron microscopy and energy dispersive
spectroscopy 32 3.5.4 Atomic absorption spectroscopy and ion-coupled plasma atomic emission spectroscopy 33 3.5.5 MALDI-TOF mass spectrometry 33 3.5.6 pHXXXXXXXXXXXXXXXXXXX 35 3.5.7 Size-exclusion chromatography 36 3.5.8 High-performance anion exchange chromatography 37
4 Results and discussion 39 4.1 Condition of the Vasa wood 39
6
4.1.1 pH and acids 39 4.1.2 The wood components 42 4.1.3 Polyethylene glycol 44 4.1.4 Acidity, degradation patterns and elemental content 46 4.1.5 Micro distribution of elements 48 4.1.6 Iron speciation 52 4.1.7 Sulfur speciation 53
4.2 Degradation in the Vasa wood 59 4.2.1 Degradation before the salvage 59 4.2.2 Are Fenton-type reactions active in situ? 59 4.2.3 Antioxidative effects 61
4.3 Iron extraction 63 4.3.1 High performance iron chelators 63 4.3.2 Extraction - principles and procedures 64 4.3.3 Extraction efficiency and effects 64 4.3.4 Conclusions and recommendations 67
5 Future perspectives 69 5.1 Degradation in a historical perspective 69 5.2 Implications for preservation of waterlogged wood 71
6 Concluding remarks 73
7 Sammanfattning 75
8 Acknowledgements 77
9 References 81
Appendix 87
7
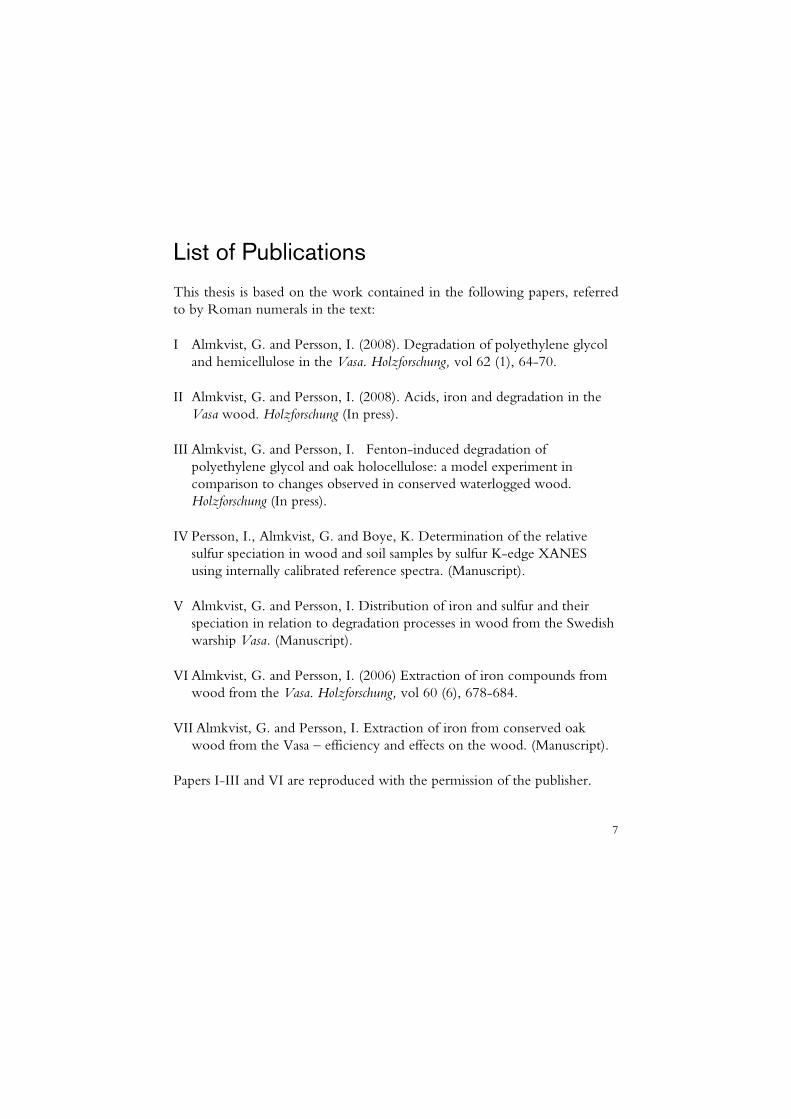
List of Publications
This thesis is based on the work contained in the following papers, referred to by Roman numerals in the text:
I Almkvist, G. and Persson, I. (2008). Degradation of polyethylene glycol and hemicellulose in the Vasa. Holzforschung, vol 62 (1), 64-70.
II Almkvist, G. and Persson, I. (2008). Acids, iron and degradation in the Vasa wood. Holzforschung (In press).
III Almkvist, G. and Persson, I. Fenton-induced degradation of polyethylene glycol and oak holocellulose: a model experiment in comparison to changes observed in conserved waterlogged wood. Holzforschung (In press).
IV Persson, I., Almkvist, G. and Boye, K. Determination of the relative sulfur speciation in wood and soil samples by sulfur K-edge XANES using internally calibrated reference spectra. (Manuscript).
V Almkvist, G. and Persson, I. Distribution of iron and sulfur and their speciation in relation to degradation processes in wood from the Swedish warship Vasa. (Manuscript).
VI Almkvist, G. and Persson, I. (2006) Extraction of iron compounds from wood from the Vasa. Holzforschung, vol 60 (6), 678-684.
VII Almkvist, G. and Persson, I. Extraction of iron from conserved oak wood from the Vasa – efficiency and effects on the wood. (Manuscript).
Papers I-III and VI are reproduced with the permission of the publisher.
8
Abbreviations
AAS atomic absorption spectroscopy BSE back-scattered electron DHB 2,5-dihydroxybenzoic acid DP degree of polymerisation DTPA diethylenetriamine pentaacetic acid EDDHMA ethylenediimino-bis(2-hydroxy-4-methylphenyl)acetic acid EDS electron dispersive spectroscopy EXAFS extended x-ray absorption fine structure FID free induction decay HPAEC high-performance anion-exchange chromatography HPIC high performance iron chelator ICP-AES ion-coupled plasma-atomic emission spectroscopy MALDI-TOF matrix assisted laser desorption ionization time-of-flight MS mass spectrometry MWD molecular weight distribution NMR nuclear magnetic resonance PD Polydispersive PEG polyethylene glycol PEGC end group carboxylated polyethylene glycol qHNMR quantitative proton nuclear magnetic resonance RH relative humidity SEM scanning electron microscopy WAW waterlogged archaeological wood XANES x-ray absorption near edge structure XAS x-ray absorption spectroscopy
9
1 General background and aims
The Swedish warship Vasa has experienced three journeys: the maiden voyage in 1628 that ended in a catastrophe, the salvage and movement to the conservation hall in 1961/1962 and finally the transport to and docking into the exhibition hall in 1989. These journeys include fascinating stories with excitements and dramatic details which are beyond the aim of this thesis. Instead they can be seen as historical markers of different chemical regimes; the time before the ship sank including the formation of the wood, the time on the sea bottom, the time of conservation, and the present and future in the museum.
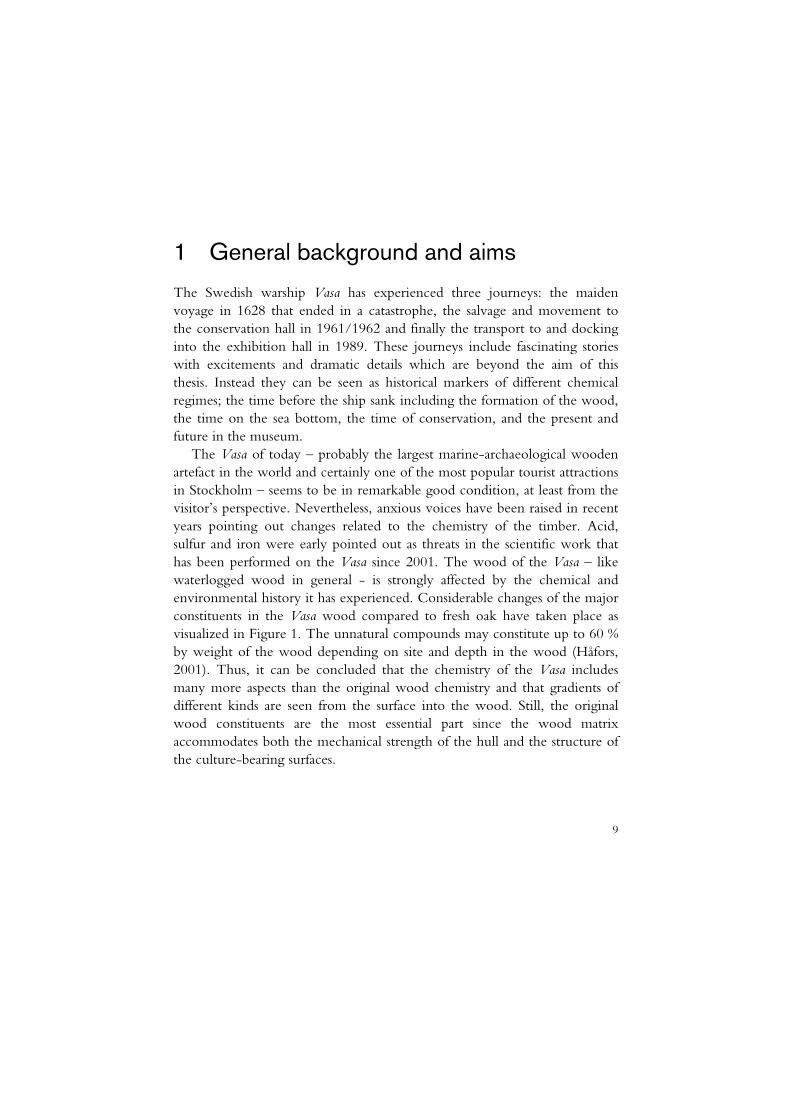
The Vasa of today – probably the largest marine-archaeological wooden artefact in the world and certainly one of the most popular tourist attractions in Stockholm – seems to be in remarkable good condition, at least from the visitor’s perspective. Nevertheless, anxious voices have been raised in recent years pointing out changes related to the chemistry of the timber. Acid, sulfur and iron were early pointed out as threats in the scientific work that has been performed on the Vasa since 2001. The wood of the Vasa – like waterlogged wood in general - is strongly affected by the chemical and environmental history it has experienced. Considerable changes of the major constituents in the Vasa wood compared to fresh oak have taken place as visualized in Figure 1. The unnatural compounds may constitute up to 60 % by weight of the wood depending on site and depth in the wood (Håfors, 2001). Thus, it can be concluded that the chemistry of the Vasa includes many more aspects than the original wood chemistry and that gradients of different kinds are seen from the surface into the wood. Still, the original wood constituents are the most essential part since the wood matrix accommodates both the mechanical strength of the hull and the structure of the culture-bearing surfaces.
10
Lignin Lignin Lignin
Cellulose
Cellulose
Cellulose
PEG
PEG Hemi-celluloses Hemi-
cellulosesHemi-
celluloses
Inorganiccompounds
Inorganiccompounds
Inorganiccompounds
Recent oak wood Vasa oak wood
Surface region Below surface
Figure 1. Schematic figures of the distribution of the main constituents in recent oak wood and Vasa oak wood. Inorganic compounds are presented as oxides. Water and extractives are excluded. Data compiled from Fengel et al. (1984) , Lindfors et al. (2008) and Sandström et al. (2003).
Not only has the overall composition been altered, different degradation patterns have also been observed: detrimental acidic salt precipitation at the surfaces (Sandström et al., 2001b) and signs of depolymerisation mainly in the ferriferous inner parts of the wood (Lindfors et al., 2008).
The common factor of these degradation processes is the presence of incorporated elements, e.g. iron and sulfur. The first objective of this thesis is the iron compounds and their impact on degradation of the wood constituents, the conservation agent polyethylene glycol (PEG) and future preservation. What are the threats and the prerequisites? The sulfur distribution and speciation have been investigated extensively (Fors, 2008) but some new aspects of sulfur chemistry in relation to iron and its catalytic behaviour will be presented as well. The second aim is to describe and evaluate the efficiency and effects of a method using high performing iron chelators (HPIC) for extraction of iron compounds from conserved archaeological wood.
This thesis will summarize the current chemistry and status of the conserved wood and discuss the degradation processes and their potential. In order to do so, we need to adopt a historical perspective which includes a large time-span of multiple biological, chemical and physical processes.
11
2 The history of the Vasa from a chemical perspective
As stated above, the Vasa has experienced three journeys and the intervening periods of time have all made their impression on the wood. For archaeo-logical wood in general, the former environmental history will strongly determine the stability of an artefact and the possibility to undergo future alteration. This chapter will give a survey of the history of the Vasa from a chemical perspective. The main prerequisite for the hull (and indeed for this thesis!) – the wood and its constituents – will be described briefly focusing only on topics relevant to the problems of today.
A number of different tree species were used when the Vasa was constructed and decorated. However, since over 90 % of the weight of the hull is of oak (Quercus robur), and this species dominates in the load-bearing components, the chemistry and anatomy of wood and related issues refer mainly to oak or hardwood in the descriptions below.
2.1 The wood
Large supplies of wood were needed for the building of the Vasa hull. The trees with large dimensions had grown for a long time and some of them had their ‘roots’ in the early Middle Ages. The wood that was formed during that time had the same properties and qualities as the wood of today.
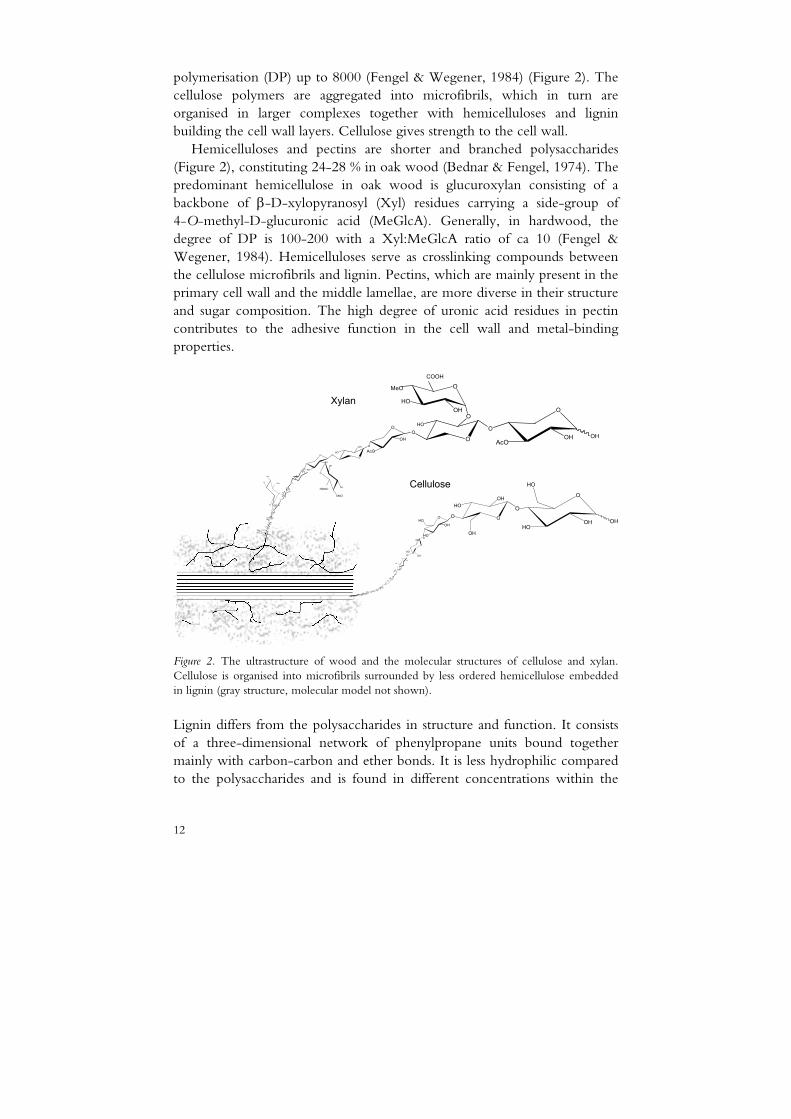
Wood is a tissue, a sophisticated complex of cells with various functions in the living tree. The major hardwood cell types are vessels, fibre tracheids and parenchyma whose functions are to conduct water and nutrients, to support the wood mechanically and to store energy. The wood tissue consists of three main polymeric constituents (Figure 2) together with an abundance of other minor compounds. Cellulose is a linear polymer of β-D-glucose linked by 1→4 glucosidic bonds to large molecules with a degree of
12
polymerisation (DP) up to 8000 (Fengel & Wegener, 1984) (Figure 2). The cellulose polymers are aggregated into microfibrils, which in turn are organised in larger complexes together with hemicelluloses and lignin building the cell wall layers. Cellulose gives strength to the cell wall.
Hemicelluloses and pectins are shorter and branched polysaccharides (Figure 2), constituting 24-28 % in oak wood (Bednar & Fengel, 1974). The predominant hemicellulose in oak wood is glucuroxylan consisting of a backbone of β-D-xylopyranosyl (Xyl) residues carrying a side-group of 4-O-methyl-D-glucuronic acid (MeGlcA). Generally, in hardwood, the degree of DP is 100-200 with a Xyl:MeGlcA ratio of ca 10 (Fengel & Wegener, 1984). Hemicelluloses serve as crosslinking compounds between the cellulose microfibrils and lignin. Pectins, which are mainly present in the primary cell wall and the middle lamellae, are more diverse in their structure and sugar composition. The high degree of uronic acid residues in pectin contributes to the adhesive function in the cell wall and metal-binding properties.
.
..
O
O
OH OO
HOO
O
O
HO HO
OH
OO
HO
OH
O
OH OHAcO
O
HOOH
MeO
COOH
O
O
O
O
O
OH
OH
OHOH
O
OHO
OH
O OH
O
OOH
HOO
OH
O
HO
OH
HO
OH
O
OH
OH
MeO
HOOCO
HO
HO
MeO
COOH
OHO
OH
MeO COOH
AcO
Xylan
Cellulose
O
OHO
OHHO OO
HOOH
O
OH
O
OHHO
OH
HO
O
OHO
OH
OH
O
HOOH
HO
OH
OO
O
O
O
OHO
HOOH
OH
O
OHOOH
OOHO OHOH OOHO OHOOHOHOHOOHOH OOHOOH
OH
OHO OHHO
OH
HOOHO OHO OH
OHOH
Figure 2. The ultrastructure of wood and the molecular structures of cellulose and xylan. Cellulose is organised into microfibrils surrounded by less ordered hemicellulose embedded in lignin (gray structure, molecular model not shown).
Lignin differs from the polysaccharides in structure and function. It consists of a three-dimensional network of phenylpropane units bound together mainly with carbon-carbon and ether bonds. It is less hydrophilic compared to the polysaccharides and is found in different concentrations within the
13
cell walls with the highest ones in the middle lamellae. Lignin is considered to give rigidity to the cell walls.
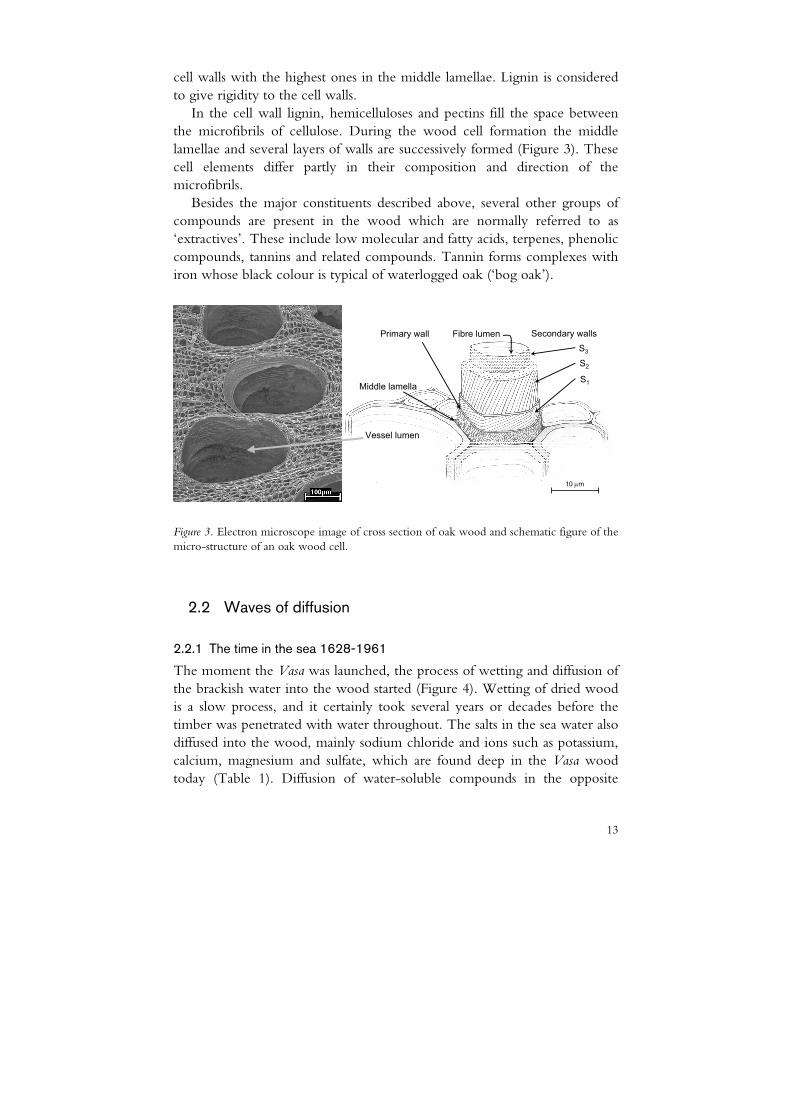
In the cell wall lignin, hemicelluloses and pectins fill the space between the microfibrils of cellulose. During the wood cell formation the middle lamellae and several layers of walls are successively formed (Figure 3). These cell elements differ partly in their composition and direction of the microfibrils.
Besides the major constituents described above, several other groups of compounds are present in the wood which are normally referred to as ‘extractives’. These include low molecular and fatty acids, terpenes, phenolic compounds, tannins and related compounds. Tannin forms complexes with iron whose black colour is typical of waterlogged oak (‘bog oak’).
S3
S2
S1
Secondary wallsPrimary wall
Middle lamella
Vessel lumen
Fibre lumen
10 μm
Figure 3. Electron microscope image of cross section of oak wood and schematic figure of the micro-structure of an oak wood cell.
2.2 Waves of diffusion
2.2.1 The time in the sea 1628-1961
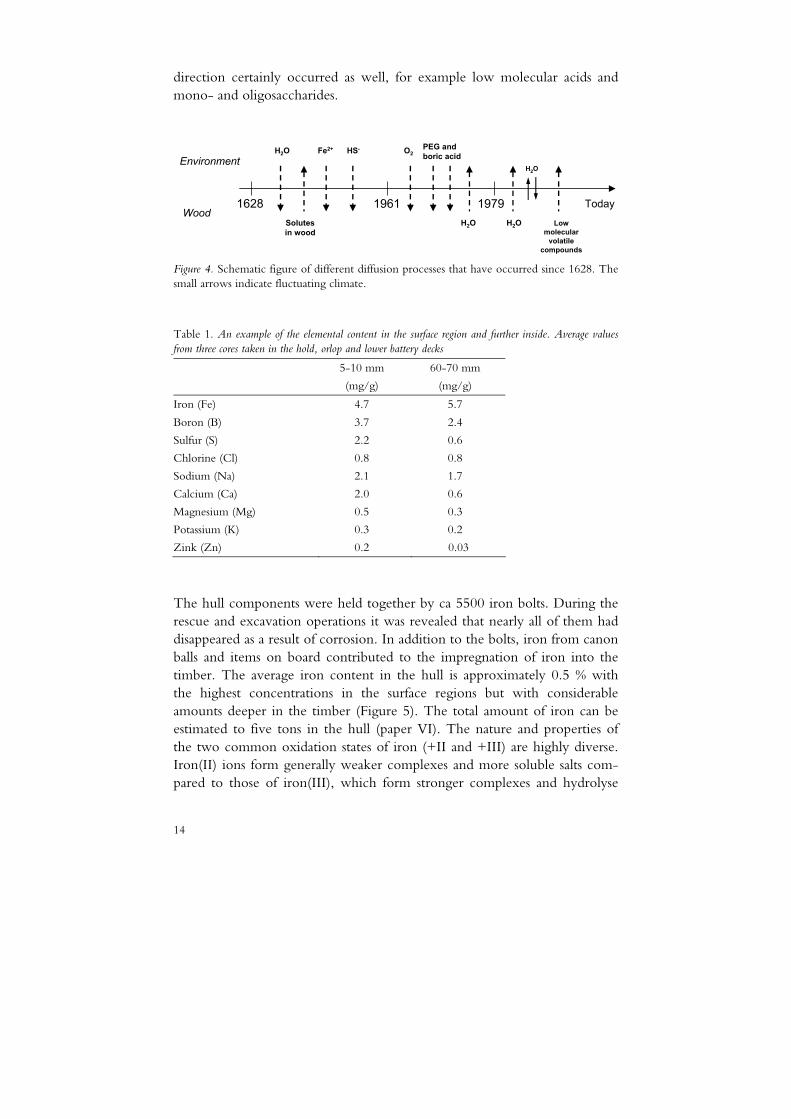
The moment the Vasa was launched, the process of wetting and diffusion of the brackish water into the wood started (Figure 4). Wetting of dried wood is a slow process, and it certainly took several years or decades before the timber was penetrated with water throughout. The salts in the sea water also diffused into the wood, mainly sodium chloride and ions such as potassium, calcium, magnesium and sulfate, which are found deep in the Vasa wood today (Table 1). Diffusion of water-soluble compounds in the opposite
14
direction certainly occurred as well, for example low molecular acids and mono- and oligosaccharides.
1628 Today19791961
Environment
WoodLow
molecularvolatile
compounds
Fe2+ HS-H2O
Solutesin wood
PEG and boric acid
O2
H2O H2O
H2O
Figure 4. Schematic figure of different diffusion processes that have occurred since 1628. The small arrows indicate fluctuating climate.
Table 1. An example of the elemental content in the surface region and further inside. Average values from three cores taken in the hold, orlop and lower battery decks
5-10 mm
(mg/g)
60-70 mm
(mg/g)
Iron (Fe) 4.7 5.7
Boron (B) 3.7 2.4
Sulfur (S) 2.2 0.6
Chlorine (Cl) 0.8 0.8
Sodium (Na) 2.1 1.7
Calcium (Ca) 2.0 0.6
Magnesium (Mg) 0.5 0.3
Potassium (K) 0.3 0.2
Zink (Zn) 0.2 0.03
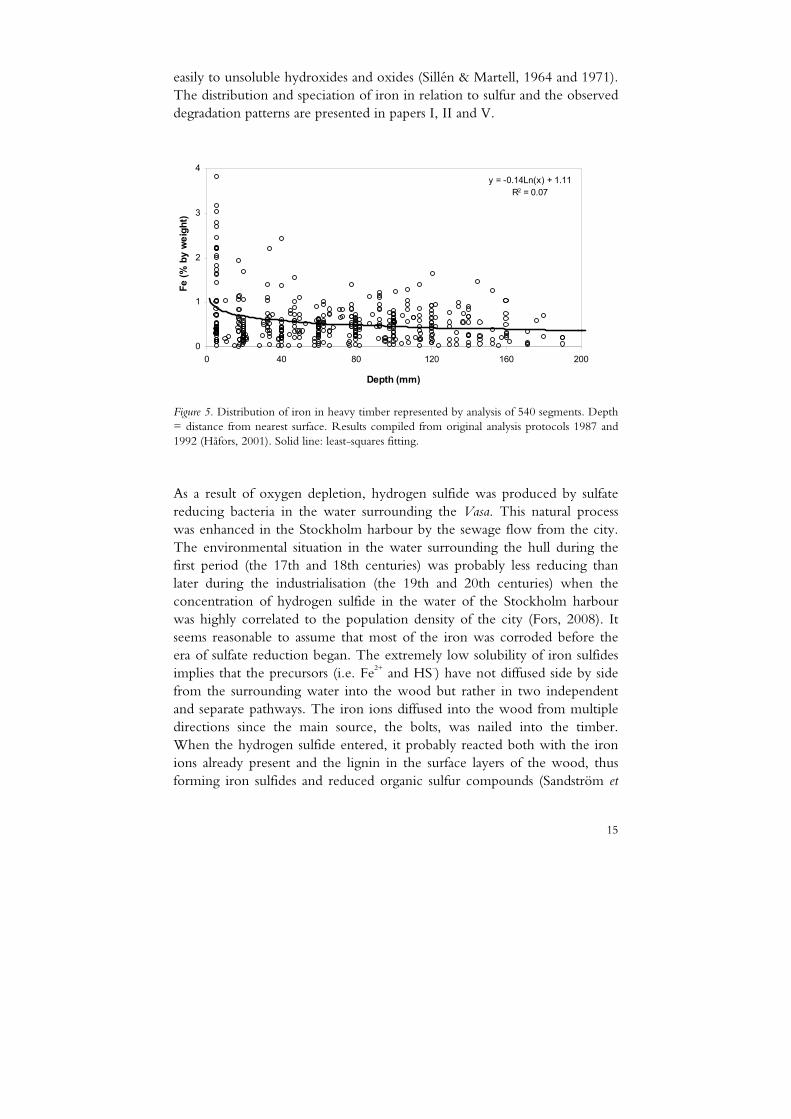
The hull components were held together by ca 5500 iron bolts. During the rescue and excavation operations it was revealed that nearly all of them had disappeared as a result of corrosion. In addition to the bolts, iron from canon balls and items on board contributed to the impregnation of iron into the timber. The average iron content in the hull is approximately 0.5 % with the highest concentrations in the surface regions but with considerable amounts deeper in the timber (Figure 5). The total amount of iron can be estimated to five tons in the hull (paper VI). The nature and properties of the two common oxidation states of iron (+II and +III) are highly diverse. Iron(II) ions form generally weaker complexes and more soluble salts com-pared to those of iron(III), which form stronger complexes and hydrolyse
15
easily to unsoluble hydroxides and oxides (Sillén & Martell, 1964 and 1971). The distribution and speciation of iron in relation to sulfur and the observed degradation patterns are presented in papers I, II and V.
y = -0.14Ln(x) + 1.11R2 = 0.07
0
1
2
3
4
0 40 80 120 160 200
Depth (mm)
Fe (%
by
wei
ght)
Figure 5. Distribution of iron in heavy timber represented by analysis of 540 segments. Depth = distance from nearest surface. Results compiled from original analysis protocols 1987 and 1992 (Håfors, 2001). Solid line: least-squares fitting.
As a result of oxygen depletion, hydrogen sulfide was produced by sulfate reducing bacteria in the water surrounding the Vasa. This natural process was enhanced in the Stockholm harbour by the sewage flow from the city. The environmental situation in the water surrounding the hull during the first period (the 17th and 18th centuries) was probably less reducing than later during the industrialisation (the 19th and 20th centuries) when the concentration of hydrogen sulfide in the water of the Stockholm harbour was highly correlated to the population density of the city (Fors, 2008). It seems reasonable to assume that most of the iron was corroded before the era of sulfate reduction began. The extremely low solubility of iron sulfides implies that the precursors (i.e. Fe2+ and HS-) have not diffused side by side from the surrounding water into the wood but rather in two independent and separate pathways. The iron ions diffused into the wood from multiple directions since the main source, the bolts, was nailed into the timber. When the hydrogen sulfide entered, it probably reacted both with the iron ions already present and the lignin in the surface layers of the wood, thus forming iron sulfides and reduced organic sulfur compounds (Sandström et
16
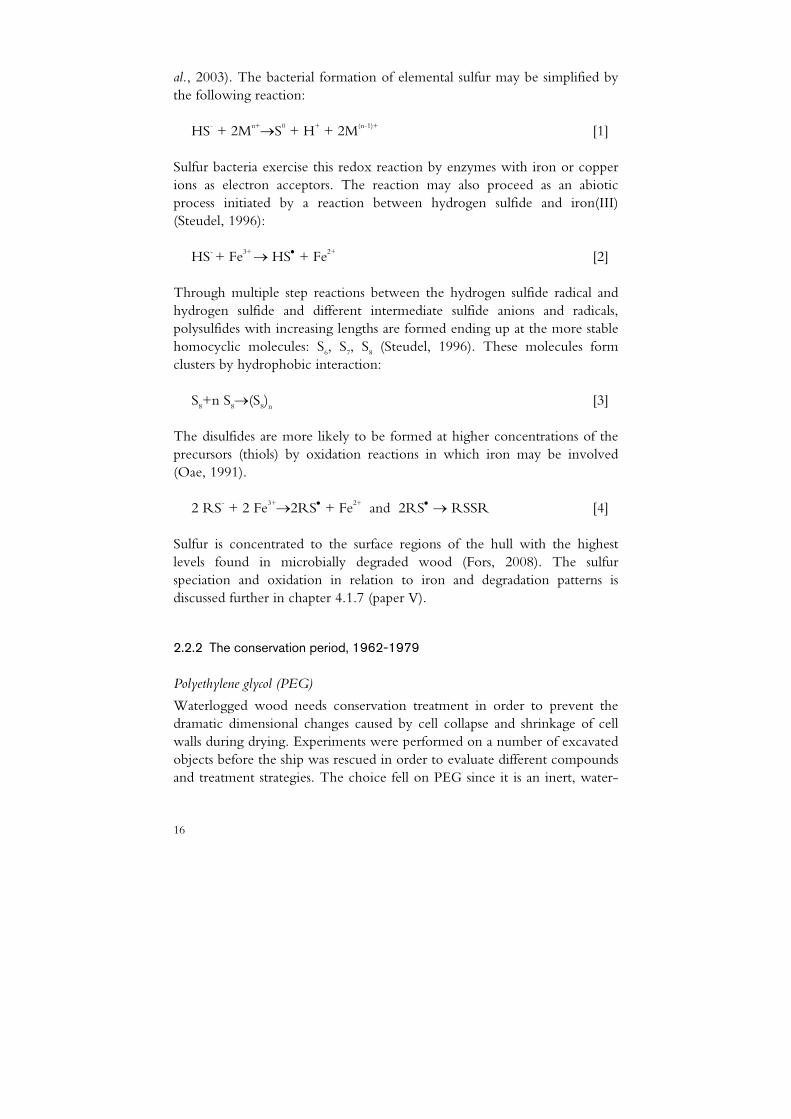
al., 2003). The bacterial formation of elemental sulfur may be simplified by the following reaction:
HS- + 2Mn+→S0 + H+ + 2M(n-1)+ [1]
Sulfur bacteria exercise this redox reaction by enzymes with iron or copper ions as electron acceptors. The reaction may also proceed as an abiotic process initiated by a reaction between hydrogen sulfide and iron(III) (Steudel, 1996):
HS- + Fe3+ → HS• + Fe2+ [2]
Through multiple step reactions between the hydrogen sulfide radical and hydrogen sulfide and different intermediate sulfide anions and radicals, polysulfides with increasing lengths are formed ending up at the more stable homocyclic molecules: S6, S7, S8 (Steudel, 1996). These molecules form clusters by hydrophobic interaction:
S8+n S8→(S8)n [3]
The disulfides are more likely to be formed at higher concentrations of the precursors (thiols) by oxidation reactions in which iron may be involved (Oae, 1991).
2 RS- + 2 Fe3+→2RS• + Fe2+ and 2RS• → RSSR [4]
Sulfur is concentrated to the surface regions of the hull with the highest levels found in microbially degraded wood (Fors, 2008). The sulfur speciation and oxidation in relation to iron and degradation patterns is discussed further in chapter 4.1.7 (paper V).
2.2.2 The conservation period, 1962-1979
Polyethylene glycol (PEG)
Waterlogged wood needs conservation treatment in order to prevent the dramatic dimensional changes caused by cell collapse and shrinkage of cell walls during drying. Experiments were performed on a number of excavated objects before the ship was rescued in order to evaluate different compounds and treatment strategies. The choice fell on PEG since it is an inert, water-
17
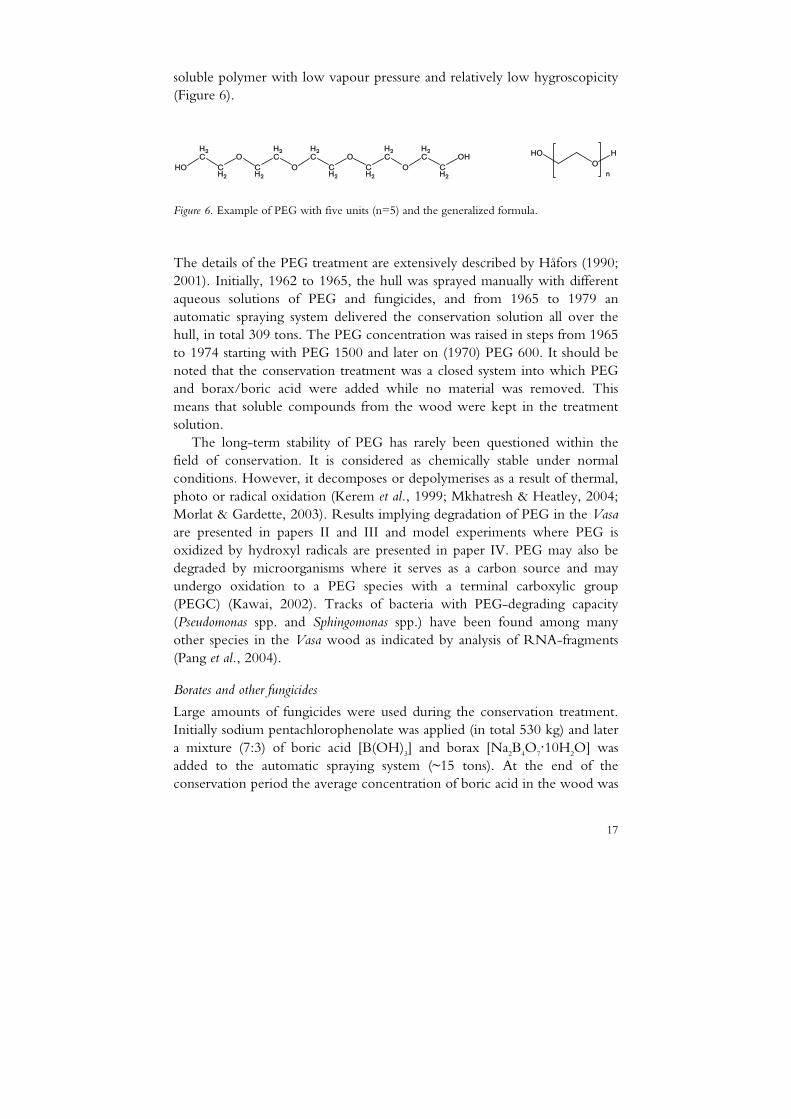
soluble polymer with low vapour pressure and relatively low hygroscopicity (Figure 6).
HO
HO
n
OCH2
H2C
O
H2C
CH2
OCH2
H2C
HOOH
CH2
H2C
O
H2C
CH2
Figure 6. Example of PEG with five units (n=5) and the generalized formula.
The details of the PEG treatment are extensively described by Håfors (1990; 2001). Initially, 1962 to 1965, the hull was sprayed manually with different aqueous solutions of PEG and fungicides, and from 1965 to 1979 an automatic spraying system delivered the conservation solution all over the hull, in total 309 tons. The PEG concentration was raised in steps from 1965 to 1974 starting with PEG 1500 and later on (1970) PEG 600. It should be noted that the conservation treatment was a closed system into which PEG and borax/boric acid were added while no material was removed. This means that soluble compounds from the wood were kept in the treatment solution.
The long-term stability of PEG has rarely been questioned within the field of conservation. It is considered as chemically stable under normal conditions. However, it decomposes or depolymerises as a result of thermal, photo or radical oxidation (Kerem et al., 1999; Mkhatresh & Heatley, 2004; Morlat & Gardette, 2003). Results implying degradation of PEG in the Vasa are presented in papers II and III and model experiments where PEG is oxidized by hydroxyl radicals are presented in paper IV. PEG may also be degraded by microorganisms where it serves as a carbon source and may undergo oxidation to a PEG species with a terminal carboxylic group (PEGC) (Kawai, 2002). Tracks of bacteria with PEG-degrading capacity (Pseudomonas spp. and Sphingomonas spp.) have been found among many other species in the Vasa wood as indicated by analysis of RNA-fragments (Pang et al., 2004).
Borates and other fungicides
Large amounts of fungicides were used during the conservation treatment. Initially sodium pentachlorophenolate was applied (in total 530 kg) and later a mixture (7:3) of boric acid [B(OH)3] and borax [Na2B4O7·10H2O] was added to the automatic spraying system (~15 tons). At the end of the conservation period the average concentration of boric acid in the wood was
18
0.5% throughout the timber (Håfors, 2001). Boric acid is considered relatively non-reactive but the borax anions may form complexes with metal ions. It has been shown that borax enhances the oxidation of pyrite (Wang, 1996).
The buffer capacity of the boric acid/borate system and the function of borax as an acid neutralizer during the spray treatment have been discussed. Sandström et al. (2002b) proposed that all borax added to the system reacted with sulfuric acid formed from sulfur oxidation. Those processes cannot be excluded as active during the conservation but observations presented in paper III contradict the speculation and suggests other sources for the acidification. The ‘consumption’ of boric acid/borax may instead be regarded as a withdrawal of these species into the wood by diffusion.
Increased oxygen levels
We can only speculate on which oxygen levels prevailed in the wood during the conservation. However, it is evident that oxygen – from the day of salvation – started to diffuse into the wood at a much higher rate compared to the time in the sea. The consequences of increased oxygen levels will be discussed below.
2.2.3 Drying and the time in the museum hall, 1980-
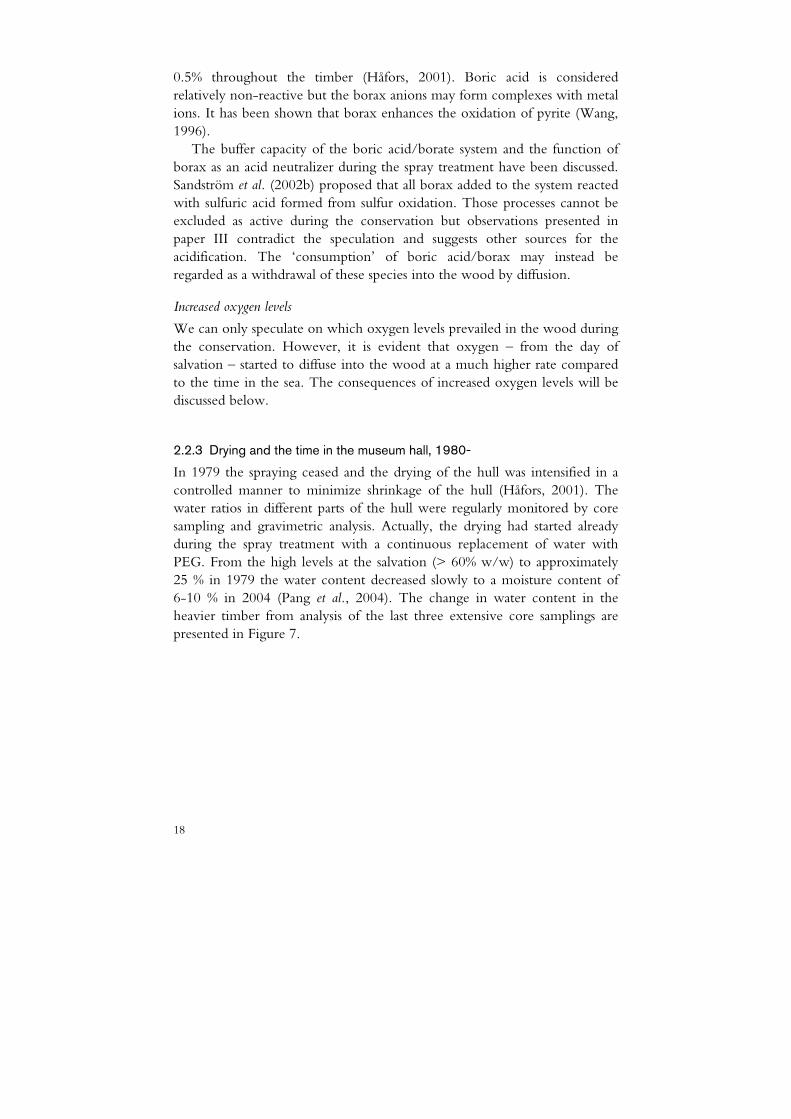
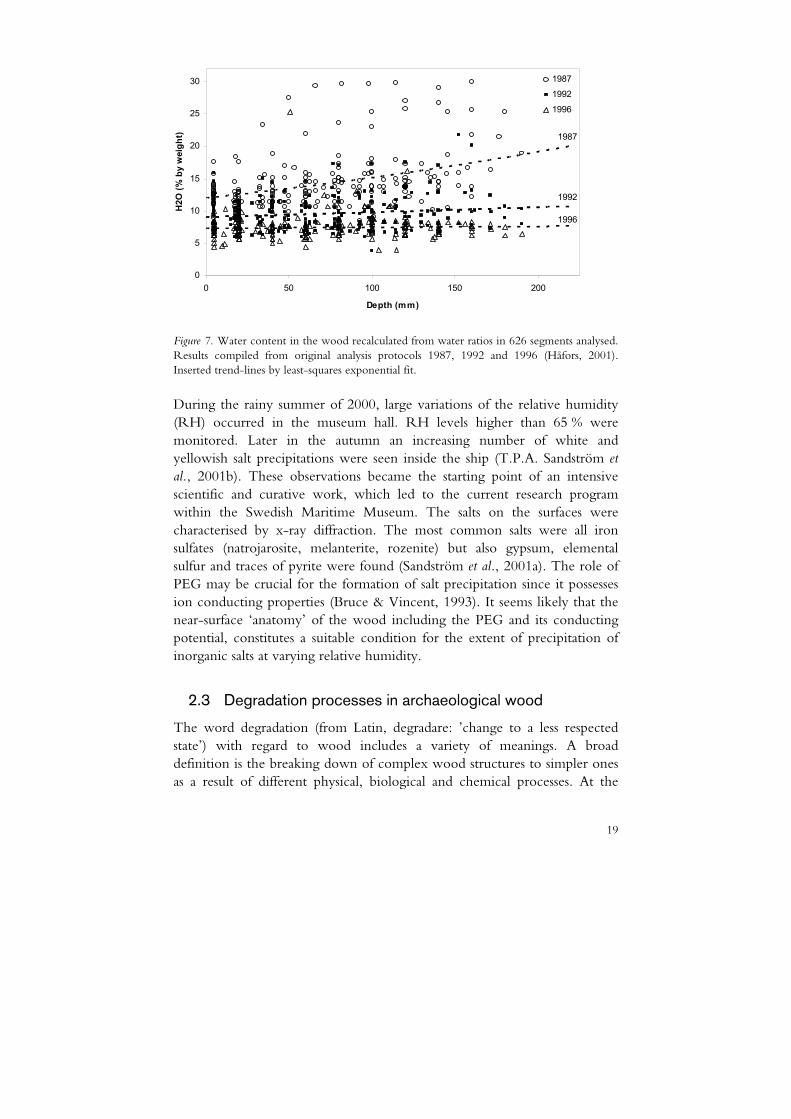
In 1979 the spraying ceased and the drying of the hull was intensified in a controlled manner to minimize shrinkage of the hull (Håfors, 2001). The water ratios in different parts of the hull were regularly monitored by core sampling and gravimetric analysis. Actually, the drying had started already during the spray treatment with a continuous replacement of water with PEG. From the high levels at the salvation (> 60% w/w) to approximately 25 % in 1979 the water content decreased slowly to a moisture content of 6-10 % in 2004 (Pang et al., 2004). The change in water content in the heavier timber from analysis of the last three extensive core samplings are presented in Figure 7.
19
0
5
10
15
20
25
30
0 50 100 150 200
Depth (mm)
H2O
(% b
y w
eigh
t)
1987
1992
1996
1987
1996
1992
Figure 7. Water content in the wood recalculated from water ratios in 626 segments analysed. Results compiled from original analysis protocols 1987, 1992 and 1996 (Håfors, 2001). Inserted trend-lines by least-squares exponential fit.
During the rainy summer of 2000, large variations of the relative humidity (RH) occurred in the museum hall. RH levels higher than 65 % were monitored. Later in the autumn an increasing number of white and yellowish salt precipitations were seen inside the ship (T.P.A. Sandström et al., 2001b). These observations became the starting point of an intensive scientific and curative work, which led to the current research program within the Swedish Maritime Museum. The salts on the surfaces were characterised by x-ray diffraction. The most common salts were all iron sulfates (natrojarosite, melanterite, rozenite) but also gypsum, elemental sulfur and traces of pyrite were found (Sandström et al., 2001a). The role of PEG may be crucial for the formation of salt precipitation since it possesses ion conducting properties (Bruce & Vincent, 1993). It seems likely that the near-surface ‘anatomy’ of the wood including the PEG and its conducting potential, constitutes a suitable condition for the extent of precipitation of inorganic salts at varying relative humidity.
2.3 Degradation processes in archaeological wood
The word degradation (from Latin, degradare: ’change to a less respected state’) with regard to wood includes a variety of meanings. A broad definition is the breaking down of complex wood structures to simpler ones as a result of different physical, biological and chemical processes. At the
20
renaissance of the Vasa after 333 years on the bottom of the Stockholm harbour, the timber was found in remarkably good shape. Only the upper levels of the hull had suffered general destruction due to biological degradation, erosion from streaming water and mechanical damage due to human activities, while the rest of the ship showed low influences of degradation. The main reason for the good status of preservation was the absence of marine borers (Teredo navalis) in the brackish water of the Baltic, which usually strikes wooden artefacts very hard in sea water.
2.3.1 Microbial degradation
Wood in general is very susceptible to microbial degradation in a humid or wet environment, where colonization of fungi is extensive and may break down wood within a few years’ time. The main global fungal wood degraders are brown rot, soft rot and white rot (Eaton & Hale, 1993). However, fungal growth in waterlogged wood is often limited by the oxygen supply and is therefore more common in the outermost surface layers of the wood. Instead, the predominant degraders in waterlogged wood in general are erosion and tunnelling bacteria which degrade wood very slowly from the surface and further inwards (Björdal et al., 2000). This bacterial activity can proceed in almost anoxic conditions leaving only the middle lamellae rich in lignin – a condition of extreme fragility challenging for the conservator (Björdal, 2000).
In a microscopic investigation performed within the ‘Save the Vasa’ project (Björdal & Nilsson, 2007) the extent of microbial degradation was studied and the types of organisms were identified in 17 cores from the ship. It was concluded that the depth of microbial activity was limited to the outermost millimetres of the oak wood with a few exceptions. The degrade-ation patterns were mainly a result of erosion bacteria and soft rot fungi.
It should be emphasized that all microbial degradation is a result of chemical processes, which are catalysed by enzymatic activity produced in the living cell of the microbe. These enzymatic processes are far more effective than the spontaneous abiotic degradation and the end result (water and carbon dioxide), may be accomplished rapidly compared to chemical degradation.
2.3.2 Chemical degradation and spontaneous wood aging
In contrast, if the biological activity is minimized e.g. in a dry or anoxic environment, wood is extremely durable and may resist degradation for thousands of years (Borgin et al., 1975). Even in a long term perspective, wood is resistant in a chemical sense and is altered very slowly by different
21
processes referred to as ‘spontaneous aging’ or chemical degradation through oxidative reactions and hydrolysis. A special case of wood aging is fossilization, where inorganic material is incorporated in the wood matrix simultaneously with alteration of the wood polymers (Fengel, 1991).
The reason for not being effectively oxidized under aerobic conditions is the high activation energies needed for a direct reaction between molecular oxygen and the wood polymers (see below). These activation barriers may be overruled by radiation (e.g UV-light), heat or catalysts (e.g. enzymes or metal ions), which initiate formation of radicals and subsequent reactions with oxygen. Analysis of wood of different ages including sub-fossil wood indicates different kinds of alteration or aging (Fengel, 1991). The most obvious change is the slow depletion of polysaccharides with respect to lignin content. As a result of changes in cellulose structure from a highly ordered to a more amorphous state the water sorption behaviour is changed. Both fossilized wood and waterlogged wood show an increased hygroscopicity and decreased density compared to recent wood (Schniewind, 1990).
It is, however, difficult to distinguish pure abiotic effects from an impact by earlier microbial activity in wood from an old object. Indeed, the general opinion concerning spontaneous aging – now identified as mainly a result of erosion bacteria - until the late 1980s was that the patterns observed were a result of chemical hydrolysis.
Oxidative degradation
Oxidation of polysaccharides, in general, leads to a complex product mixture depending on the different courses of reaction of different carbons in the sugar monomer (Potthast et al., 2006). The oxidation generates new functional groups in the chain (e.g. carbonyl and carboxylic groups) and is accompanied by chain scission and a decreased DP of the polymer. The depolymerisation may be a result of destructive oxidation on the monomers as well as weakening of the glycosidic bonds increasing their susceptibility to hydrolysis (β-elimination) (Luetzow & Theander, 1974).
The slow kinetics of the reaction between molecular oxygen and wood polymers may be accelerated by the presence of transition metals or other compounds, which promote the formation of reactive oxygen species (e.g hydroxyl radicals). The most famous example is Fenton’s reagent (Fenton, 1894) where the hydroxyl radical is formed by the reduction of hydrogen peroxide with iron(II) iron (Eq. 5). The mechanistic details of this reaction are still debated (Dunford, 2002) but the net result is a highly reactive
22
oxygen species, such as the hydroxyl radical (•OH), which will react indiscriminately with any organic molecule (Eq. 6). Fe2+ + H2O2 → Fe3+ + OH- + •OH [5] RH + •OH → R• + H2O [6]
Koenigs (1974) performed experiments on wood with Fenton’s reagent, which gave a general weight loss of the wood and radical changes of the wood polymers. The objective was to show that degradation by brown rot basidiomycetes in wood proceeds through Fenton-type reactions rather than enzymatic processes. Kohdzuma et al. (1991) reported that wood objects exposed to Fenton’s reagent displayed physical and chemical properties of the similar kind as waterlogged wood: a decrease in density and a general loss of wood polymers.
When a radical is formed it may react by oxidizing another molecule which in turn proceeds into a chain reaction (i.e. propagation). One well-known example is the peroxidation of unsaturated lipids, where a radical initiates a chain reaction, which continues as long as oxygen is present and until a radical scavenger stops the process (Lundberg, 1961). Propagated chain reactions in cellulose lead to extensive depolymerisation (Johansson & Lind, 2005).
Oxidation reactions in wood may be inhibited by antioxidants. An antioxidant compound reacts with free radical intermediates or with oxygen, thus being oxidized itself. Logically, antioxidants are often reducing agents such as thiols or polyphenols. Possible groups of antioxidants in the Vasa wood are natural lignin and tannin compounds and reduced sulfur species mainly present in the surface layers (Sandström et al., 2002b). These compounds may be oxidized in the first place, thus protecting the PEG and wood constituents from oxidation.
Hydrolysis
Hydrolysis is a process in which a chemical compound is broken down by reaction with water. In the case of polysaccharides hydrolysis is catalysed by either acids or alkali compounds, often increasing with their concentration. Acid hydrolysis is initiated by protonation of the glycosidic oxygen and proceeds through different pathways, finally leading to fission of the glycosidic bonds (Fengel & Wegener, 1984). In concentrated acid, cellulose will be depolymerised into shorter polymers and oligomers and the reaction may proceed to glucose monomers. Paper or cotton cellulose is susceptible to acid hydrolysis whereas solid wood or fragmented wood withstands
23
hydrolysis for a long time. Ilyama et al. (1989) made experiments with milled wood in 3% sulfuric acid (aq) at ambient temperature. The hemi-celluloses were highly hydrolysed while the cellulose was relatively unaffected even after 3600 h. This experiment may illustrate the fact that the hydrolysis rate of xylose is approximately five times the rate of glucose (Shafizadeh, 1963). Furthermore it shows that hemicelluloses in the wood are much more accessible and susceptible compared to cellulose due to the different chemical and physical structure and organisation of the polysaccharides.
The ether and carbon-carbon bonds in lignin make this polymer resistant to hydrolysis. Lignin may, however, undergo other changes when exposed to acidic conditions. Ander et al. (2004) reported that spruce fibres were harder to delignify compared to oak fibres after prolonged exposure in sulfuric or hydrochloric acid solutions at pH 1. They concluded that hardwood lignin was less condensed compared to softwood lignin due to the high extent of methoxy groups.
There is a fundamental difference between acid hydrolysis and oxidation reactions. In a hydrolysis reaction such as the cleavage of glycosidic bonds in cellulose or hemicellulose, protons act as catalysts but are not consumed or formed in the reaction. The net result is a depolymerisation which is favoured by acidic conditions. Hydrolysis of ester bonds such as acetyl groups on hemicellulose, does not consume protons, but releases a carboxylic acid. In contrast, oxidative degradation, which includes electron transfer, may be much more complicated leading to the formation of radicals and propagated reaction paths.

24
25
3 Material and methods
3.1 Analysis of the Vasa wood
3.1.1 Sampling and preparation
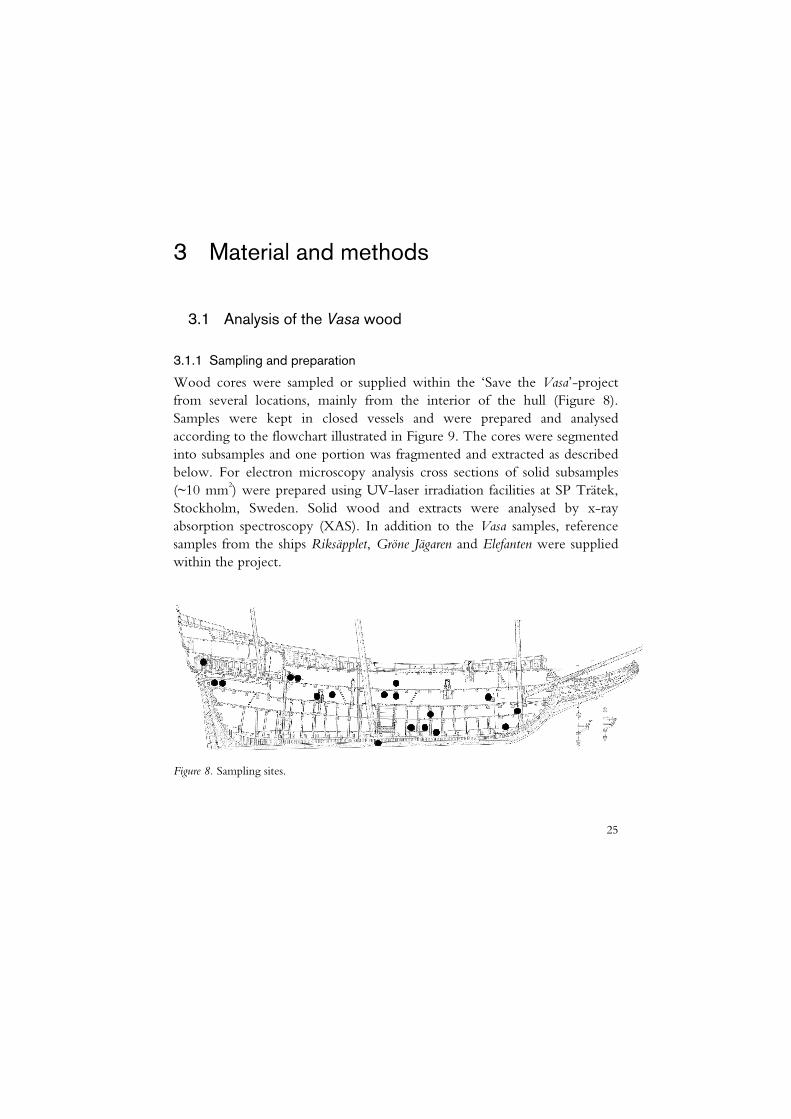
Wood cores were sampled or supplied within the ‘Save the Vasa’-project from several locations, mainly from the interior of the hull (Figure 8). Samples were kept in closed vessels and were prepared and analysed according to the flowchart illustrated in Figure 9. The cores were segmented into subsamples and one portion was fragmented and extracted as described below. For electron microscopy analysis cross sections of solid subsamples (~10 mm2) were prepared using UV-laser irradiation facilities at SP Trätek, Stockholm, Sweden. Solid wood and extracts were analysed by x-ray absorption spectroscopy (XAS). In addition to the Vasa samples, reference samples from the ships Riksäpplet, Gröne Jägaren and Elefanten were supplied within the project.
Figure 8. Sampling sites.
26
Water extraction
Core sampling
Fragmentation
Segmentation
Extract
Solid wood
pH
MALDI-TOF-mass spectrometry
NMR
HDAES (external laboratories)
X-ray spectroscopy (EXAFS and XANES)
Laser cut samples: SEM-EDS
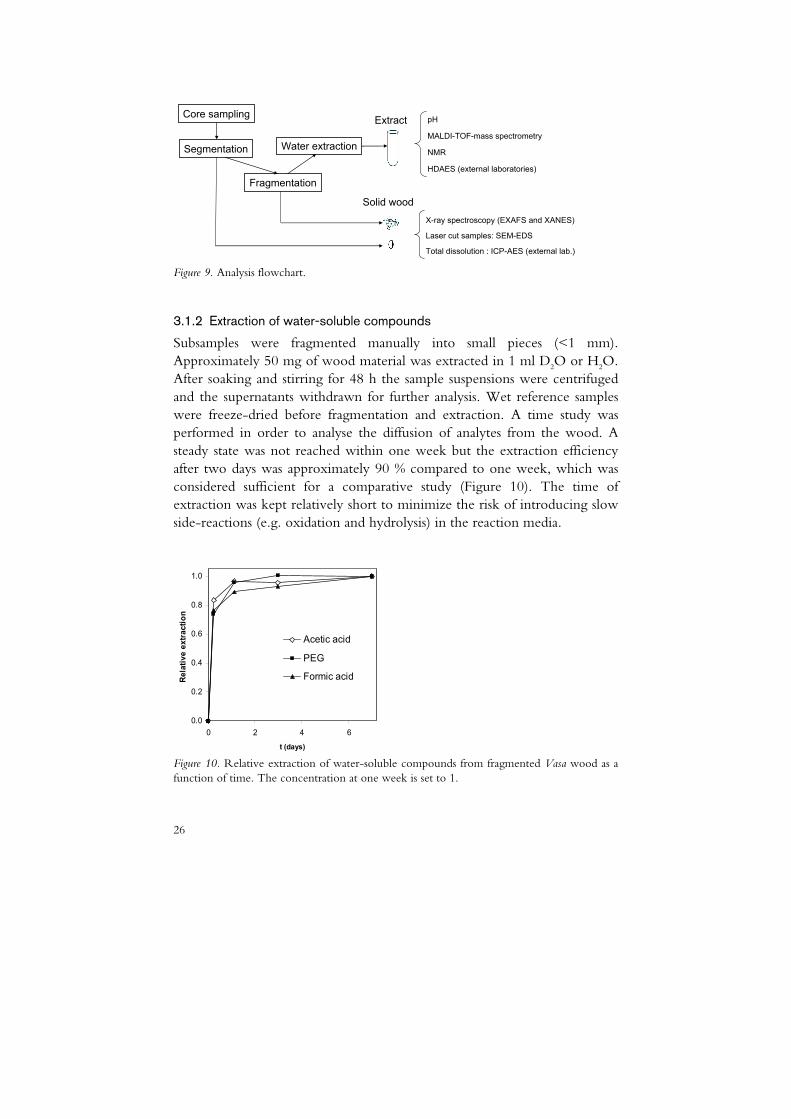
Total dissolution : ICP-AES (external lab.) Figure 9. Analysis flowchart.
3.1.2 Extraction of water-soluble compounds
Subsamples were fragmented manually into small pieces (<1 mm). Approximately 50 mg of wood material was extracted in 1 ml D2O or H2O. After soaking and stirring for 48 h the sample suspensions were centrifuged and the supernatants withdrawn for further analysis. Wet reference samples were freeze-dried before fragmentation and extraction. A time study was performed in order to analyse the diffusion of analytes from the wood. A steady state was not reached within one week but the extraction efficiency after two days was approximately 90 % compared to one week, which was considered sufficient for a comparative study (Figure 10). The time of extraction was kept relatively short to minimize the risk of introducing slow side-reactions (e.g. oxidation and hydrolysis) in the reaction media.
0.0
0.2
0.4
0.6
0.8
1.0
0 2 4 6
t (days)
Rela
tive
extra
ctio
n
Acetic acid
PEG
Formic acid
Figure 10. Relative extraction of water-soluble compounds from fragmented Vasa wood as a function of time. The concentration at one week is set to 1.
27
3.2 Model experiments – Fenton’s reaction
To compare the patterns of PEG and polysaccharide degradation observed in the Vasa wood model experiments were performed. Pure PEG 1500 and prepared holocellulose were subjected to hydroxyl radical attacks induced by Fenton’s reagent (Fe(II)/H2O2). The effects on the polymers were analysed by NMR, MALDI-TOF mass spectrometry and size exclusion chromato-graphy (SEC) (paper III).
3.3 Iron extraction experiments
Loose pieces of wood from the ship or wreck site were used in iron extraction experiments. The wood objects (pine and oak) had had been treated with PEG conservation and exhibited partly the same kind of acidic salt precipitation as found on the Vasa hull. Two different high performance iron chelators (HPIC) were used in aqueous solutions at pH 8-11: diethyl-enetriaminepentaacetic acid (DTPA) and ethylenediimino-bis(2-hydroxy-4-methylphenyl)acetic acid (EDDHMA) (papers VI and VII). The objects were soaked in the extraction solution which was changed regularly. The concentration of the prepared EDDHMA solutions was analysed spectro-photometrically as the Fe(III)-EDDHMA complex, which has an intense red colour and a maximum absorption at 490 nm, εmax= 4720 cm-1M-1. The concentration of DTPA was determined by complexometric titration using a standard magnesium chloride solution and eriochrome black T as indicator (Schwarzenbach & Flaschka, 1965). The concentration of iron in the extracts was followed during the extraction by means of atomic absorption spectroscopy (AAS), see below. The total elemental content of iron in wood samples before and after extraction was analysed by an external laboratory (see below).
3.4 Simulation of PEG degradation
In order to mimic a possible PEG degradation process, a statistical model of the reactions was built in Matlab™ (The MathWorks, Inc., Natick, US, version 7.0.1). In the model, a random cleavage process of the PEG mole-cule was assumed, giving two shorter PEG molecules. The methylene group subjected to the oxidative attack is transferred from the system as a low mol-ecular species (e.g. formic acid) and a new end group (Kerem et al., 1998): PEGn → PEG(n-x-1) + PEGx [7]
28
The cleavage was assumed to be proportional to the chain length of the PEG molecule, which means that all methylene groups present at a certain moment had the same possibility to undergo cleavage. In the original material two normally distributed PEG populations (600 and 1500 u) were merged and the random cleavage model worked on this unified population in several steps, at each step considering the change in molecular weight distribution formed by the cleavages in the previous step. The statistical details on which the programming was based are specified in the Appendix. Different ratios of PEG 600/1500 at the starting point and different numbers of steps were tested in order to compare the resulting molecular distributions to the experimental MALDI-TOF mass spectra in papers I and III.
3.5 Analytical methods
3.5.1 Nuclear magnetic resonance spectroscopy
Nuclear magnetic resonance spectroscopy (NMR) is a very powerful technique for structural determination of organic and inorganic molecules. The method exploits the fact that many atomic nuclei possess magnetic properties (spin) which can be manipulated by radio pulses in an external magnetic field. Depending on the environment (e.g. neighbouring atoms) of a certain nucleus, it will respond to an irradiation pulse containing a broad spectrum of frequencies, and by relaxing it will emit a specific radio frequency. Thus, all nuclei in a sample emit different frequencies simultaneously whose sum can be monitored as a ‘free induction decay’ (FID) in the time domain. By a mathematical treatment (Fourier transformation) the FID is transformed to a frequency domain, where all signals of the nucleus studied will appear at different positions in a spectrum depending on their specific chemical environment - the shifts.
Interaction and correlation between different nuclei can be monitored in a number of so called two-dimensional experiments for detailed structural information of a molecule. The most common experiments, which were also used in this study to elucidate the structure of hemicelluloses and PEG derivatives, are 1H-1H-correlation (‘COSY’ and ‘TOCSY’) and 1H-13C-correlation (‘HSQC’ and ‘HMBC’). Diffusion experiments (‘DOSY’) were performed to differentiate between signals thereby using the fact that the diffusion constants of different molecules are related to their size. For example, PEG and PEG derivatives have much lower diffusion constants compared to low molecular species such as formic and acetic acid.
29
Another important property of the NMR technique is its potential in quantification of analytes. Today, quantitative 1H-NMR (qHNMR) is frequently used in the field of natural product chemistry (Pauli et al., 2005). It is based on the fact that all 1H-protons in a sample will contribute to the FID signal to the same extent as long as the protons are fully relaxed before a new pulse irradiation. The benefit of qHNMR is that it is possible to perform a non-destructive analysis of a complex mixture without any pre-treatment such as derivatization. On the other hand, a reference compound has to be added, which needs to be non-reactive and without any interfering signals in the spectral region of interest. Furthermore, the appropriate relaxation delay has to be determined ensuring a quantitative mode, which normally requires a longer experimental time compared to an ordinary proton experiment.
In this study NMR was used for both structural assignments and quantification of extracted species from the wood, mainly PEG and its derivatives, glucoronoxylan and low molecular acids. The concentration of the analytes was quantified by comparing the relative areas of the analyte signals to the signal of the reference compound (3-(trimethylsilyl)-propanoate-d4). Some of the analyses resulted in NMR-spectra with relatively broad lines. This behaviour was in all probability due to a disturbing magnetic effect of iron(III) ions present in the extracts. By addition of small portions of hydrochloric acid, NaOH or borax buffer to the extracts the effect was minimized.
Parallel quantification of formic and acetic acid revealed no significant difference (p<0.05) between the qHNMR and ion chromatography. One drawback with qHNMR concerning the Vasa wood is that some water-soluble compounds such as oxalate and sulfate provide no signals since they have no proton-bearing carbons (paper III).
3.5.2 X-ray absorption spectroscopy
XAS deals with electronic transitions and the photoelectron production of the element studied. XAS is normally divided into pre-edge, XANES and EXAFS regions as descried elsewhere (Jalilehvand, 2000).
The use of Extended X-ray Absorption Fine Structure Spectroscopy (EXAFS) provides the near atomic environment of the element (Teo, 1986). In an EXAFS experiment, an inner-core electron is excited to continuum, and a photo-electron wave is formed related to the excitation energy. Parts of the photo-electron wave are bounced back by surrounding atoms, thereby interfering with the outgoing wave. This results in positive or negative interference between the out- and ingoing waves depending on
30
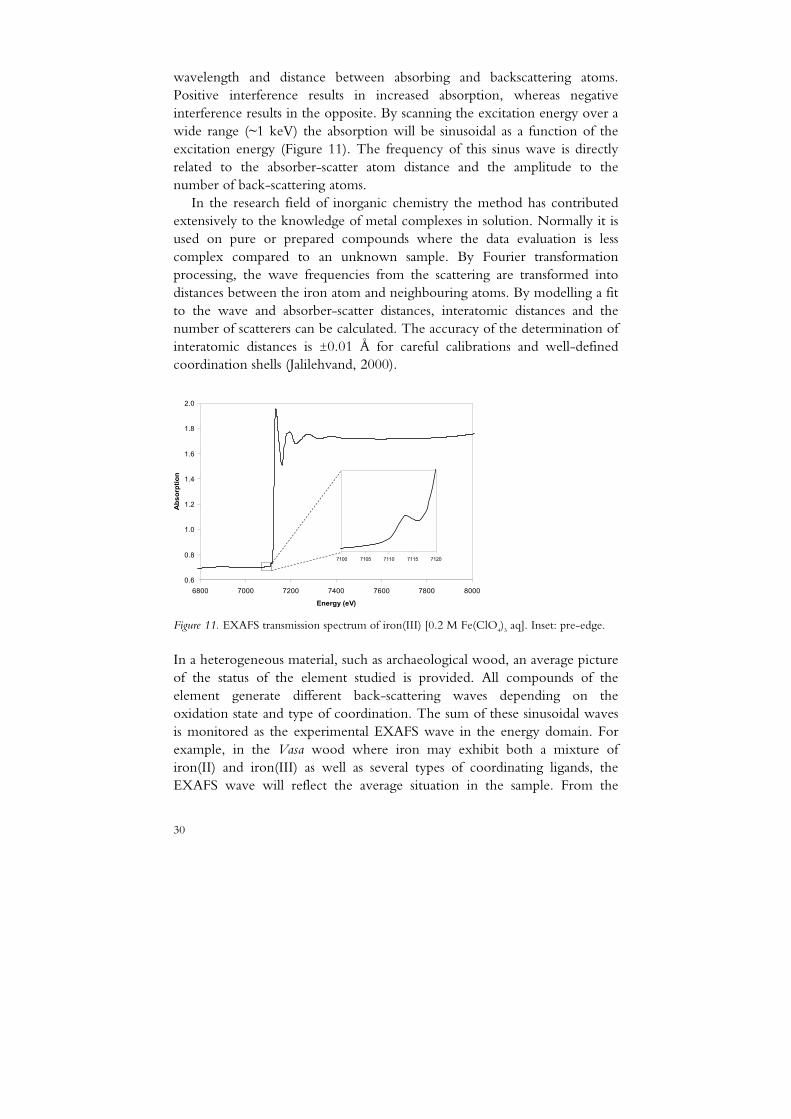
wavelength and distance between absorbing and backscattering atoms. Positive interference results in increased absorption, whereas negative interference results in the opposite. By scanning the excitation energy over a wide range (~1 keV) the absorption will be sinusoidal as a function of the excitation energy (Figure 11). The frequency of this sinus wave is directly related to the absorber-scatter atom distance and the amplitude to the number of back-scattering atoms.
In the research field of inorganic chemistry the method has contributed extensively to the knowledge of metal complexes in solution. Normally it is used on pure or prepared compounds where the data evaluation is less complex compared to an unknown sample. By Fourier transformation processing, the wave frequencies from the scattering are transformed into distances between the iron atom and neighbouring atoms. By modelling a fit to the wave and absorber-scatter distances, interatomic distances and the number of scatterers can be calculated. The accuracy of the determination of interatomic distances is ±0.01 Å for careful calibrations and well-defined coordination shells (Jalilehvand, 2000).
0.6
0.8
1.0
1.2
1.4
1.6
1.8
2.0
6800 7000 7200 7400 7600 7800 8000
Energy (eV)
Abs
orpt
ion
7100 7105 7110 7115 7120
Figure 11. EXAFS transmission spectrum of iron(III) [0.2 M Fe(ClO4)3 aq]. Inset: pre-edge.
In a heterogeneous material, such as archaeological wood, an average picture of the status of the element studied is provided. All compounds of the element generate different back-scattering waves depending on the oxidation state and type of coordination. The sum of these sinusoidal waves is monitored as the experimental EXAFS wave in the energy domain. For example, in the Vasa wood where iron may exhibit both a mixture of iron(II) and iron(III) as well as several types of coordinating ligands, the EXAFS wave will reflect the average situation in the sample. From the
31
envelope (i.e. shape) of the wave some direct information on the dominant type of environment of the element may be derived. For example, heavy neighbouring elements cause an envelope maximum at a higher wave vector, k.
As a complement to the EXAFS wave analysis, useful information may be provided from the 1s→3d pre-edge position (Figure 11). The pre-peak positions of hydrated iron(II) and iron(III) are situated at ~7111.5 eV and ~7113.0 eV, respectively (Westre et al., 1997).
In X-ray absorption near-edge structure (XANES) only the absorption features around the absorption edge are studied. The generation of these features has a complex background, which is very difficult to model theoretically (Jalilehvand, 2000). Therefore, experimental XANES spectra of a series of model compounds are used to interpret XANES spectra of unknown and complex materials such as Vasa wood.
Sulfur K-edge XANES spectroscopy is highly sensitive to the oxidation state of the element and has been proved to be a powerful tool for the studies of sulfur in different research fields (Jalilehvand, 2006). Sulfur K-edge XANES provides information on the functional groups containing sulfur due to the sensitivity of its electronic structure, oxidation state and coordination geometry. The K-edge has a broad range from 2469 eV for reduced species (-II) to oxidized species (+VI) at 2484 eV. Due to the high total absorption in samples at these energies, sulfur K-edge XANES is usually performed in fluorescence mode using Lytle or solid state detectors (see paper IV).
The relative contributions of different sulfur species in natural samples may be estimated by fitting a XANES spectrum with a set of different model compounds (Sandström et al., 2005; Vairavamurthy et al., 1997). Relative quantification of different sulfur species in a sample may be determined with good accuracy as long as effects from self-absorption are negligible. However, in paper IV, it is shown that both the intensity and peak position of some of the sulfur species studied are dependent on the state (solid or solution) and on the solution concentration. Thus, the set of standard compounds must also be calibrated internally to achieve a relative quantification. As a consequence of the diverging spectra of solid and solutions of a compound and the need for internal calibration, the standard spectra must be acquired on dilute solutions. From this follows also that a relative quantification of an unknown sample cannot be performed if the sample contains a heterogeneous mixture in the sense that both pure solid particles and diluted species spread evenly are present. A method for internal calibration is described in paper V.
32
3.5.3 Scanning electron microscopy and energy dispersive spectroscopy
An electron microscope can provide magnification over five orders of magnitude and exhibits great potential for almost all fields of natural sciences. In a scanning electron microscope (SEM) a high-energy electron beam scans a sample interacting with the atoms in the sample. Then, different types of signals are obtained from the sample, e.g. secondary electrons, back-scattered electrons (BSE) and characteristic x-rays. These signals provide information on the surface topography, mean Z-number and elemental composition of the sample, and may be detected in the microscope by different types of detectors.
Besides creating an image of the object studied, information of the general distribution of elements is provided by detecting the BSE. These beam electrons are reflected from the sample by elastic scattering, which is enhanced by the presence of heavy nuclei. When a certain area or particle of interest is identified in a BSE image, it can be analysed for its elemental composition with an energy dispersive spectroscopy detector (EDS). The EDS detects essentially the same fluorescence x-rays as analysed in XANES described above. All elements have their specific fluorescence characteristics originating from the empty core hole that may be generated in different shell levels (K, L, M etc.) when electrons are ejected by the electron beam. Multiple transitions are then possible (α, β, γ etc.) when an electron from an outer shell relaxes. Simultaneously a fluorescent x-ray photon is generated, which is detected by the EDS detector. The methodology has been refined both for identification and accurate quantification of marjor elements in a surface.
Cross sections of solid subsamples (~10 mm2) from the Vasa were prepared using an UV-laser. This technique is preferable compared to razor or microtome cutting since no pre-treatment involving wetting is needed and the common problem with damaged surface structures is minimized (Stehr et al., 1998).
In the current study a SEM equipped with secondary electron BSE detectors has been used (details in paper V). For elemental distribution of mainly iron and sulfur on a micro-level in wood an EDS with a specified resolution of 132 eV at Mn(K) was used. The maximum spatial resolution of the SEM and EDS at the current conditions (20 kV, 21 Pa and 9 mm work-ing distance) was approximately 5 nm and 1 µm, respectively. The quantitative accuracy for standardless analysis of predominant or major elements (>5% w/w) is below 4% and for minor elements (1-5% w/w) 10-20%. However, taking into account the potential sources of errors con-
33
cerning EDS analysis, the results of quantitative microanalysis (<1% w/w) must be regarded as semi-quantitative or indicative.
All SEM analyses were performed at the microscopy unit at Evolutionary Biology Centre, Uppsala University, Sweden.
3.5.4 Atomic absorption spectroscopy and ion-coupled plasma atomic emission spectroscopy
The atomic adsorption spectroscopy (AAS) and ion-coupled plasma atomic emission spectroscopy (ICP-AES) methods are widely used to determine the total content of different elements in extracts or dissolved samples. In the present study AAS was used to monitor the iron concentration in the aqueous extracts from the iron extraction experiments (papers VI & VII). Calibration measurements were carried out using a series of standard iron(III) solutions diluted in either EDDHMA or DTPA.
For the total content of iron and sulfur in solid wood, samples were sent to an external accredited laboratory for dissolution by hydrogen peroxide and concentrated nitric acid before elemental analyis by ICP-AES (ALS Scandinavia AB, Luleå, Sweden).
Results from these analyses are presented in papers I, II, V, VI and VII.
3.5.5 MALDI-TOF mass spectrometry
Matrix-assisted laser desorption/ionization time-of-flight mass spectrometry (MALDI-TOF MS) can be used to determine masses of polar molecules up to 106 Da (Schriemer & Li, 1996). It is widely used to study polymers and is an important analytical tool in the research fields of carbohydrate and protein chemistry and may be applied to an ion or to any molecule that can form an adduct ion (i.e. ionization) during the desorption process. The processes of desorption and ionization are partly unknown but are initiated by an UV-laser pulse, which is absorbed by the matrix compound in which the analyte is embedded on a target plate. Then, by the laser energy both the analyte and matrix molecules are lifted from the target plate and set into random motion (i.e. desorption). Simultaneously some of the analyte molecules form adduct ions. At this point, the ions are exposed to an electrical field that accelerates all ions of the same charge (positive or negative) with the same force into the “field-free region”. In the most commonly used mode, positive ions such as [ROH+Na]+ are accelerated while in negative mode sometimes ions like [RCOO-] are of interest. Since ions of different masses achieve the same kinetic energy, they obtain different velocities and are separated before reaching the detector. Hence a small (i.e. light) molecule will reach the detector before a heavier one and
34
their different ‘times-of-flights’ are monitored. The detector data are presented in a mass spectrum as the intensity versus the mass to charge ratio (m/z). Different techniques may be used to improve the resolution: delayed extraction at the initial desorption/ionization process and a reflector (electrostatic mirror) during the flight.
In the MALDI preparation, a dilute solution of the analyte is mixed with the more concentrated matrix. Typical matrices are aromatic organic com-pounds e.g. 2,5-dihydroxybenzoic acid (DHB), 2,4,6-trihydroxyacetophen-one and retinoic acid. DHB is a good choice for PEG and polysaccharides and was used in this study. The function of the matrix is to separate the analyte molecules from each other and to provide energy absorption from the laser pulse. Furthermore, it also converts the energy absorbed to the analyte and provides an ionization path for the analyte molecules.
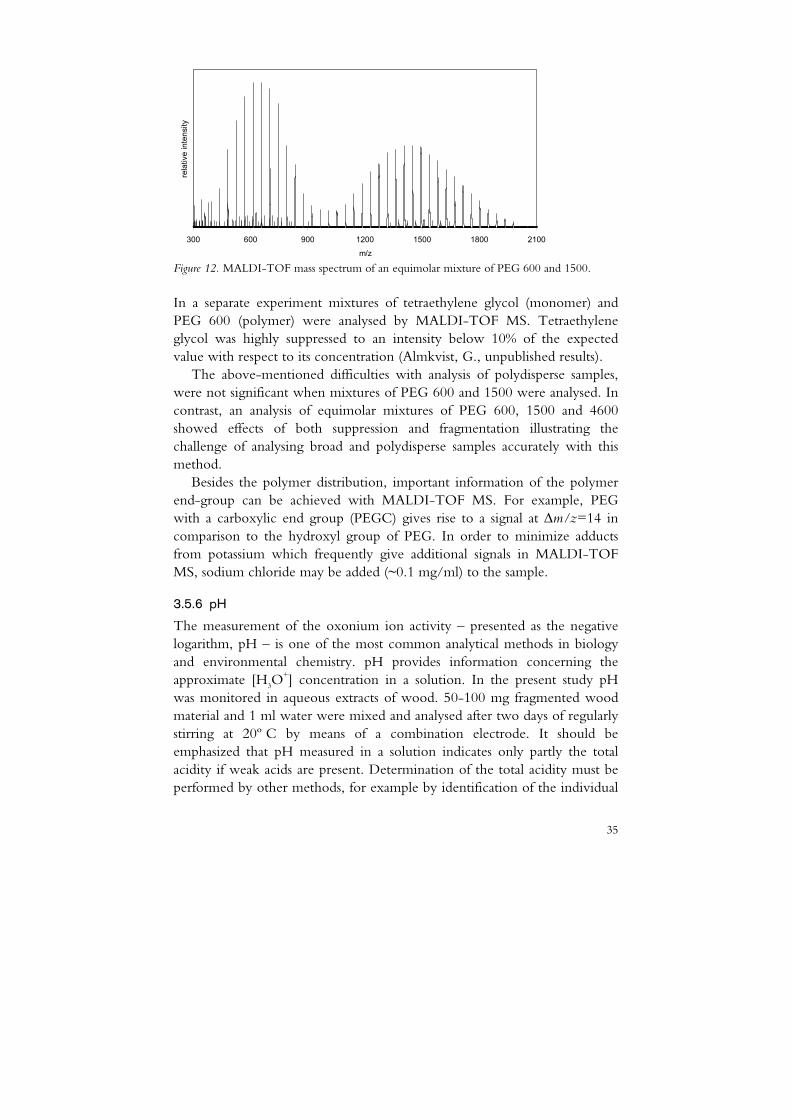
MALDI-TOF MS can be used to determine the average molecular weight of polymers. Figure 12 shows a spectrum of an equimolar mixture of PEG 600 and 1500. In the spectrum the individual oligomers spaced by 44 u from 305.2 to 1978.2 u can be seen. They correspond to the sodiated PEG [HO(CH2CH2O)nH+Na]+. The accuracy of determining the molecular weight of polymers is generally good for narrow and low polydispersity samples (PD<1.2) (Montaudo et al., 1995). For the spectrum in Figure 12, the average molecular weight was calculated, Mw=1200, with PD=1.19. The results show that an overestimation of the average Mw compared to the theoretical value (1050 g/mol) indicates a suppression of the low molecular oligomers compared to the heavier ones. For more polydisperse samples (PD>1.6) the determination of Mw is less reliable. The results may be influenced by the sample preparation as well as several instrument parameters and processes (e.g. laser energy, delayed extraction, fragmentation, detector saturation) (Hanton, 2001). When measuring the average Mw for low molecular polymers the accuracy of MALDI-TOF MS may be influenced by insufficient cationization. Suppression of the low molecular oligomers may lead to an overestimation of the average molecular weight (Parees et al., 1998). By derivatization of ethoxylate polymers Barry et al. (1997) showed that low molecular oligomers below n=4 were suppressed.
35
300 600 900 1200 1500 1800 2100
m/z
rela
tive
inte
nsity
Figure 12. MALDI-TOF mass spectrum of an equimolar mixture of PEG 600 and 1500.
In a separate experiment mixtures of tetraethylene glycol (monomer) and PEG 600 (polymer) were analysed by MALDI-TOF MS. Tetraethylene glycol was highly suppressed to an intensity below 10% of the expected value with respect to its concentration (Almkvist, G., unpublished results).
The above-mentioned difficulties with analysis of polydisperse samples, were not significant when mixtures of PEG 600 and 1500 were analysed. In contrast, an analysis of equimolar mixtures of PEG 600, 1500 and 4600 showed effects of both suppression and fragmentation illustrating the challenge of analysing broad and polydisperse samples accurately with this method.
Besides the polymer distribution, important information of the polymer end-group can be achieved with MALDI-TOF MS. For example, PEG with a carboxylic end group (PEGC) gives rise to a signal at Δm/z=14 in comparison to the hydroxyl group of PEG. In order to minimize adducts from potassium which frequently give additional signals in MALDI-TOF MS, sodium chloride may be added (~0.1 mg/ml) to the sample.
3.5.6 pHXXXXXXXXXXXXXXXXXXX
The measurement of the oxonium ion activity – presented as the negative logarithm, pH – is one of the most common analytical methods in biology and environmental chemistry. pH provides information concerning the approximate [H3O
+] concentration in a solution. In the present study pH was monitored in aqueous extracts of wood. 50-100 mg fragmented wood material and 1 ml water were mixed and analysed after two days of regularly stirring at 20º C by means of a combination electrode. It should be emphasized that pH measured in a solution indicates only partly the total acidity if weak acids are present. Determination of the total acidity must be performed by other methods, for example by identification of the individual
36
acids and their concentrations or by acid-base titration. The latter method was used on a few extracts.
3.5.7 Size-exclusion chromatography
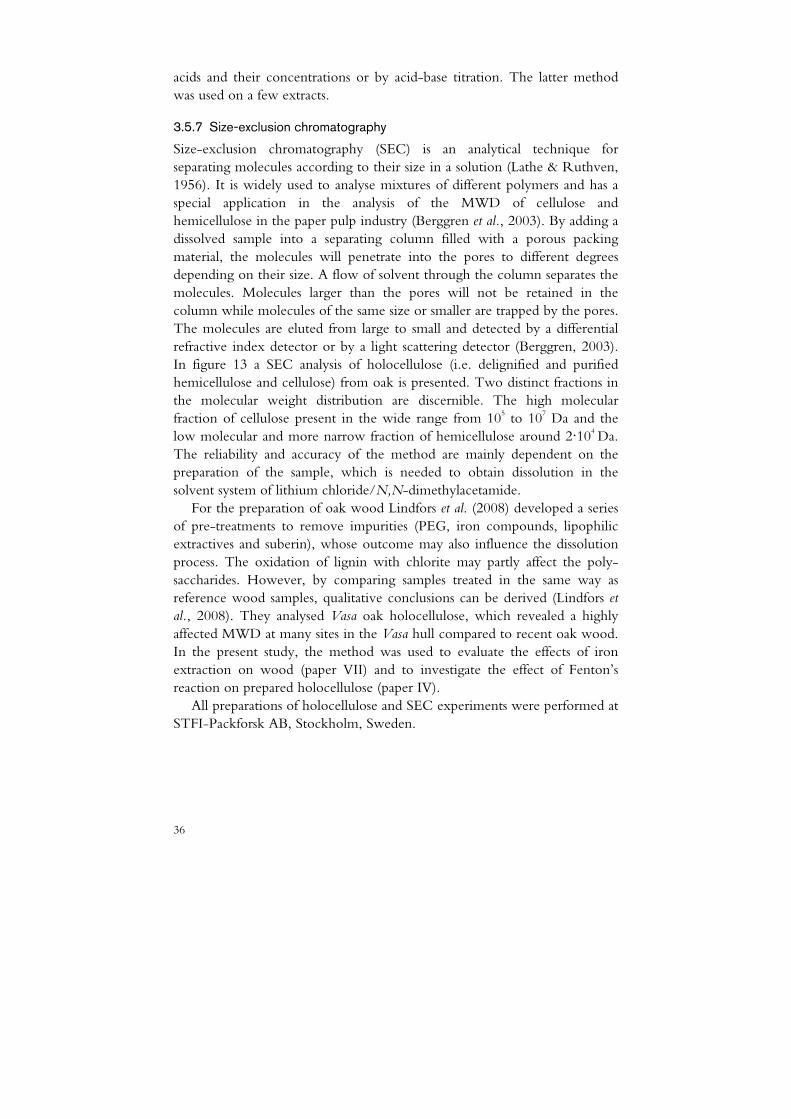
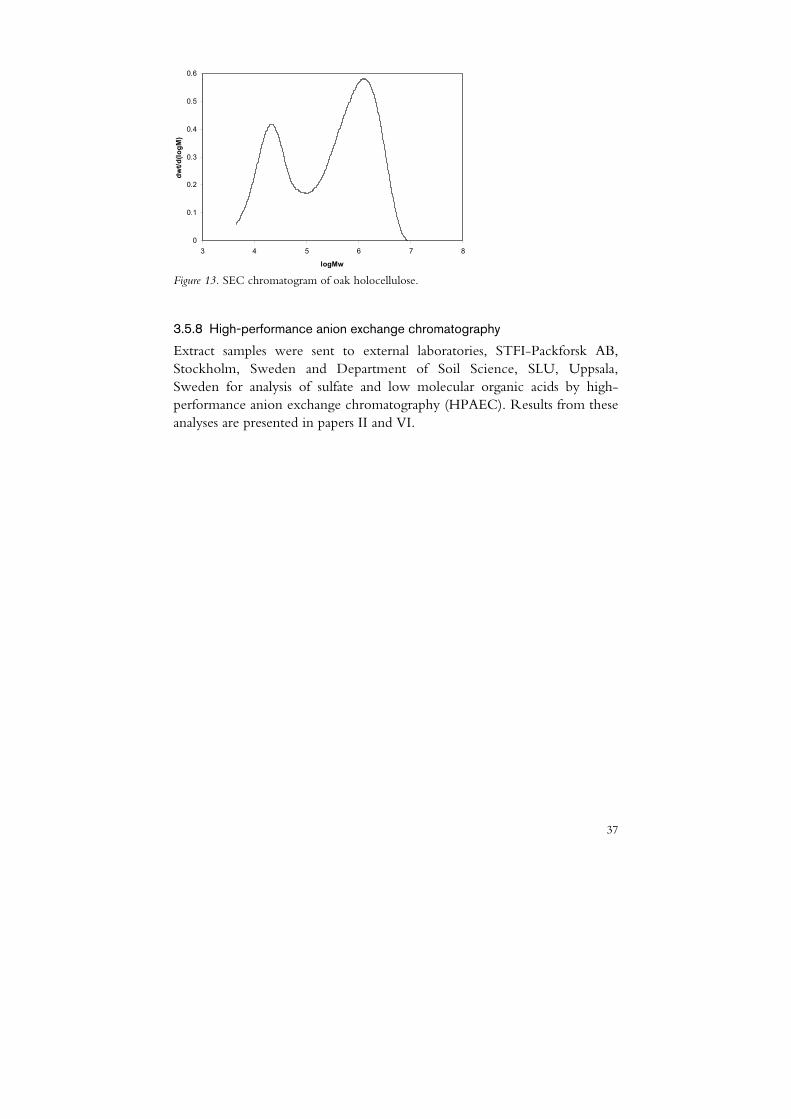
Size-exclusion chromatography (SEC) is an analytical technique for separating molecules according to their size in a solution (Lathe & Ruthven, 1956). It is widely used to analyse mixtures of different polymers and has a special application in the analysis of the MWD of cellulose and hemicellulose in the paper pulp industry (Berggren et al., 2003). By adding a dissolved sample into a separating column filled with a porous packing material, the molecules will penetrate into the pores to different degrees depending on their size. A flow of solvent through the column separates the molecules. Molecules larger than the pores will not be retained in the column while molecules of the same size or smaller are trapped by the pores. The molecules are eluted from large to small and detected by a differential refractive index detector or by a light scattering detector (Berggren, 2003). In figure 13 a SEC analysis of holocellulose (i.e. delignified and purified hemicellulose and cellulose) from oak is presented. Two distinct fractions in the molecular weight distribution are discernible. The high molecular fraction of cellulose present in the wide range from 105 to 107 Da and the low molecular and more narrow fraction of hemicellulose around 2·104 Da. The reliability and accuracy of the method are mainly dependent on the preparation of the sample, which is needed to obtain dissolution in the solvent system of lithium chloride/N,N-dimethylacetamide.
For the preparation of oak wood Lindfors et al. (2008) developed a series of pre-treatments to remove impurities (PEG, iron compounds, lipophilic extractives and suberin), whose outcome may also influence the dissolution process. The oxidation of lignin with chlorite may partly affect the poly-saccharides. However, by comparing samples treated in the same way as reference wood samples, qualitative conclusions can be derived (Lindfors et al., 2008). They analysed Vasa oak holocellulose, which revealed a highly affected MWD at many sites in the Vasa hull compared to recent oak wood. In the present study, the method was used to evaluate the effects of iron extraction on wood (paper VII) and to investigate the effect of Fenton’s reaction on prepared holocellulose (paper IV).
All preparations of holocellulose and SEC experiments were performed at STFI-Packforsk AB, Stockholm, Sweden.
37
0
0.1
0.2
0.3
0.4
0.5
0.6
3 4 5 6 7 8
logMw
dwt/d
(logM
)
Figure 13. SEC chromatogram of oak holocellulose.
3.5.8 High-performance anion exchange chromatography
Extract samples were sent to external laboratories, STFI-Packforsk AB, Stockholm, Sweden and Department of Soil Science, SLU, Uppsala, Sweden for analysis of sulfate and low molecular organic acids by high-performance anion exchange chromatography (HPAEC). Results from these analyses are presented in papers II and VI.

38
39
4 Results and discussion
4.1 Condition of the Vasa wood
4.1.1 pH and acids
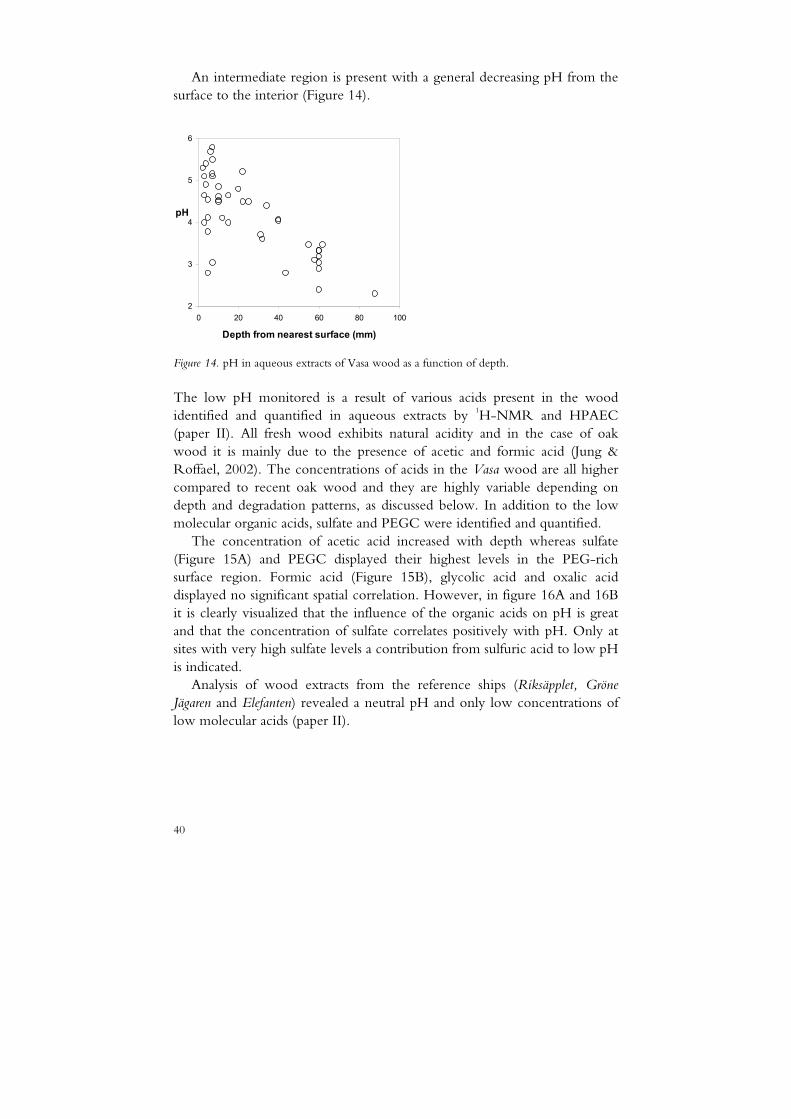
The average pH in aqueous extracts of all Vasa samples investigated was approximately the same as in fresh oak wood (~4.0) (paper I). However, the pH of Vasa wood showed a negative correlation with the distance from the nearest surface (Figure 14). Surface samples display a greater variation in pH, compared to samples below the surface region, with occasionally low pH particularly in samples overlaid with salt precipitation. Low pH values have frequently been observed at salt precipitations when measured with indicator paper (Sandström et al., 2002a). However, the very low pH-values (1-2) were not observed in the aqueous extracts. A probable explanation may be the different methods used. The pH-value of an extract reflects the acidic condition in a segment of a core, typically 10 mm long, whereas the indicator paper used in earlier studies gives a relatively rough value and reflects the absolute surface condition only. Acidic species and salts may have concentrated at the surface by diffusion and migration of acidic species due to variations in humidity in the museum hall when the salt outbreaks were formed (T.P.A. Sandström et al., 2001b).
Despite these two approaches to pH measurement, it is evident that there are two regions in the timber that exhibit low pH. 1) Wood in the surface region that suffers from salt precipitation, which appears more frequently at sites with a more pronounced microbial degradation and high iron and sulfur content (Fors, 2008). 2) Wood from deeper segments with a relatively high iron content.
40
An intermediate region is present with a general decreasing pH from the surface to the interior (Figure 14).
2
3
4
5
6
0 20 40 60 80 100
Depth from nearest surface (mm)
pH
Figure 14. pH in aqueous extracts of Vasa wood as a function of depth.
The low pH monitored is a result of various acids present in the wood identified and quantified in aqueous extracts by 1H-NMR and HPAEC (paper II). All fresh wood exhibits natural acidity and in the case of oak wood it is mainly due to the presence of acetic and formic acid (Jung & Roffael, 2002). The concentrations of acids in the Vasa wood are all higher compared to recent oak wood and they are highly variable depending on depth and degradation patterns, as discussed below. In addition to the low molecular organic acids, sulfate and PEGC were identified and quantified.
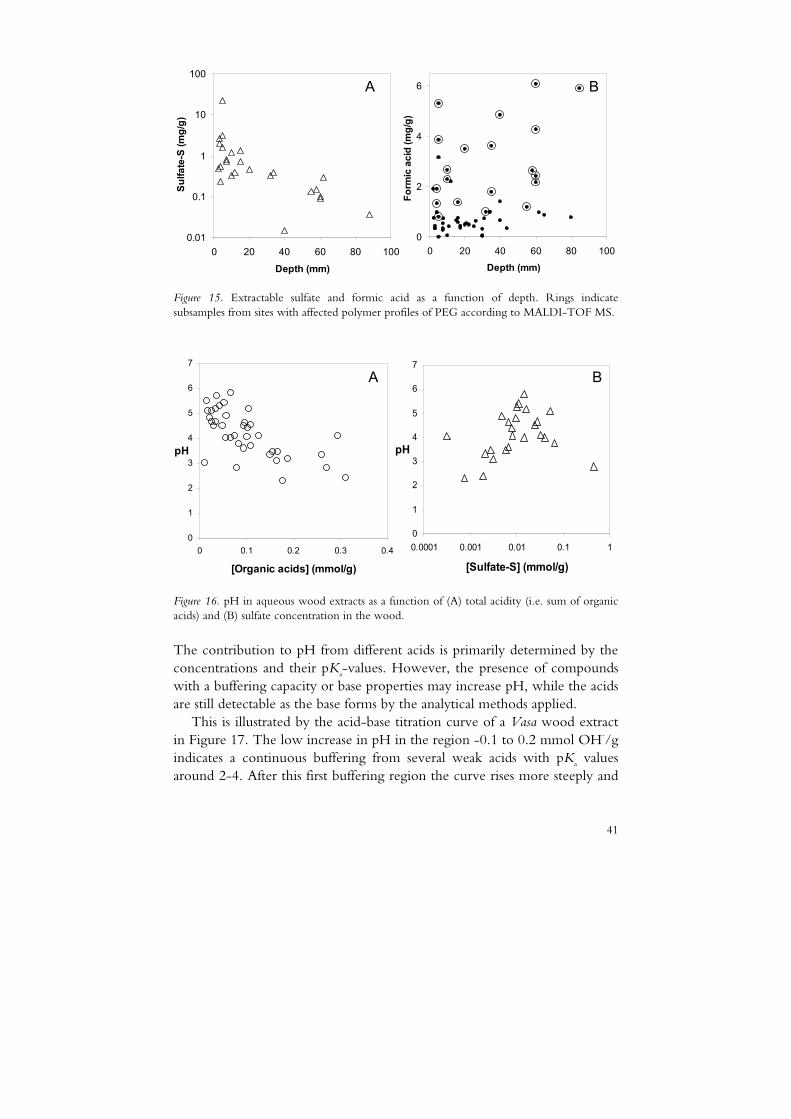
The concentration of acetic acid increased with depth whereas sulfate (Figure 15A) and PEGC displayed their highest levels in the PEG-rich surface region. Formic acid (Figure 15B), glycolic acid and oxalic acid displayed no significant spatial correlation. However, in figure 16A and 16B it is clearly visualized that the influence of the organic acids on pH is great and that the concentration of sulfate correlates positively with pH. Only at sites with very high sulfate levels a contribution from sulfuric acid to low pH is indicated.
Analysis of wood extracts from the reference ships (Riksäpplet, Gröne Jägaren and Elefanten) revealed a neutral pH and only low concentrations of low molecular acids (paper II).
41
0
2
4
6
0 20 40 60 80 100
Depth (mm)
Form
ic a
cid
(mg/
g)
0.01
0.1
1
10
100
0 20 40 60 80 100
Depth (mm)
Sulfa
te-S
(mg/
g)
A B
Figure 15. Extractable sulfate and formic acid as a function of depth. Rings indicate subsamples from sites with affected polymer profiles of PEG according to MALDI-TOF MS.
0
1
2
3
4
5
6
7
0 0.1 0.2 0.3 0.4
[Organic acids] (mmol/g)
pH
0
1
2
3
4
5
6
7
0.0001 0.001 0.01 0.1 1
[Sulfate-S] (mmol/g)
pH
A B
Figure 16. pH in aqueous wood extracts as a function of (A) total acidity (i.e. sum of organic acids) and (B) sulfate concentration in the wood.
The contribution to pH from different acids is primarily determined by the concentrations and their pKa-values. However, the presence of compounds with a buffering capacity or base properties may increase pH, while the acids are still detectable as the base forms by the analytical methods applied.
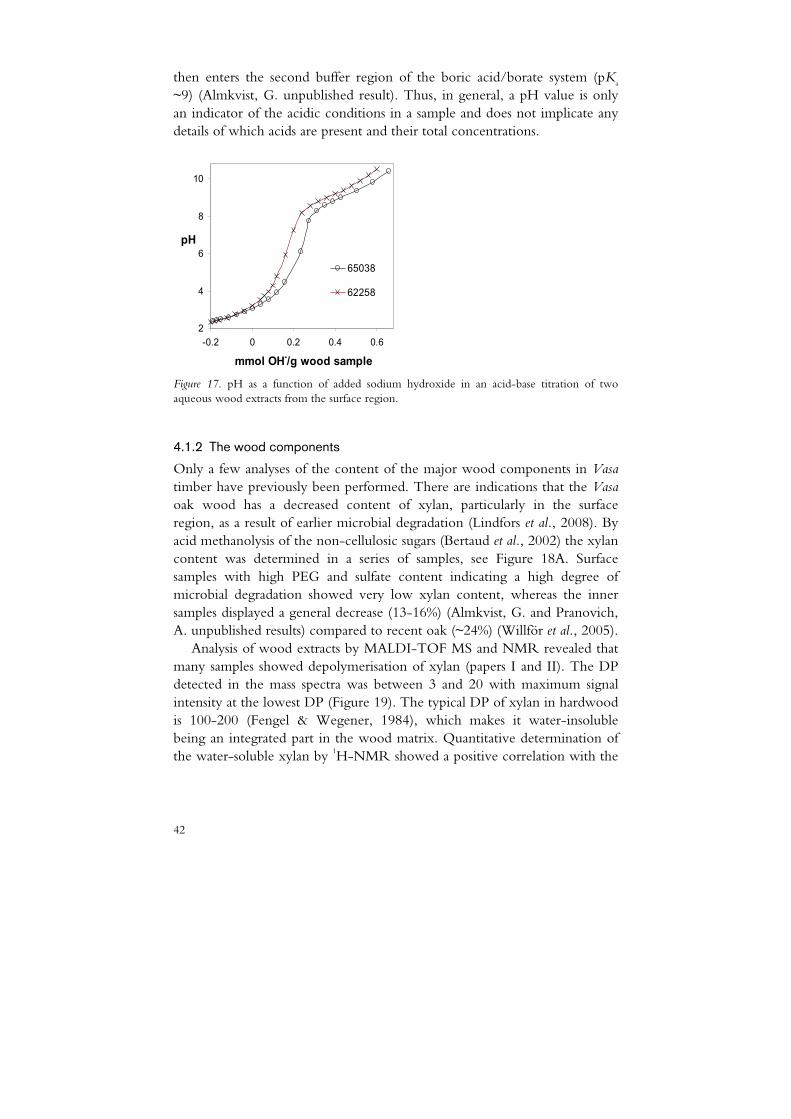
This is illustrated by the acid-base titration curve of a Vasa wood extract in Figure 17. The low increase in pH in the region -0.1 to 0.2 mmol OH-/g indicates a continuous buffering from several weak acids with pKa values around 2-4. After this first buffering region the curve rises more steeply and
42
then enters the second buffer region of the boric acid/borate system (pKa ~9) (Almkvist, G. unpublished result). Thus, in general, a pH value is only an indicator of the acidic conditions in a sample and does not implicate any details of which acids are present and their total concentrations.
2
4
6
8
10
-0.2 0 0.2 0.4 0.6
mmol OH-/g wood sample
pH
65038
62258
Figure 17. pH as a function of added sodium hydroxide in an acid-base titration of two aqueous wood extracts from the surface region.
4.1.2 The wood components
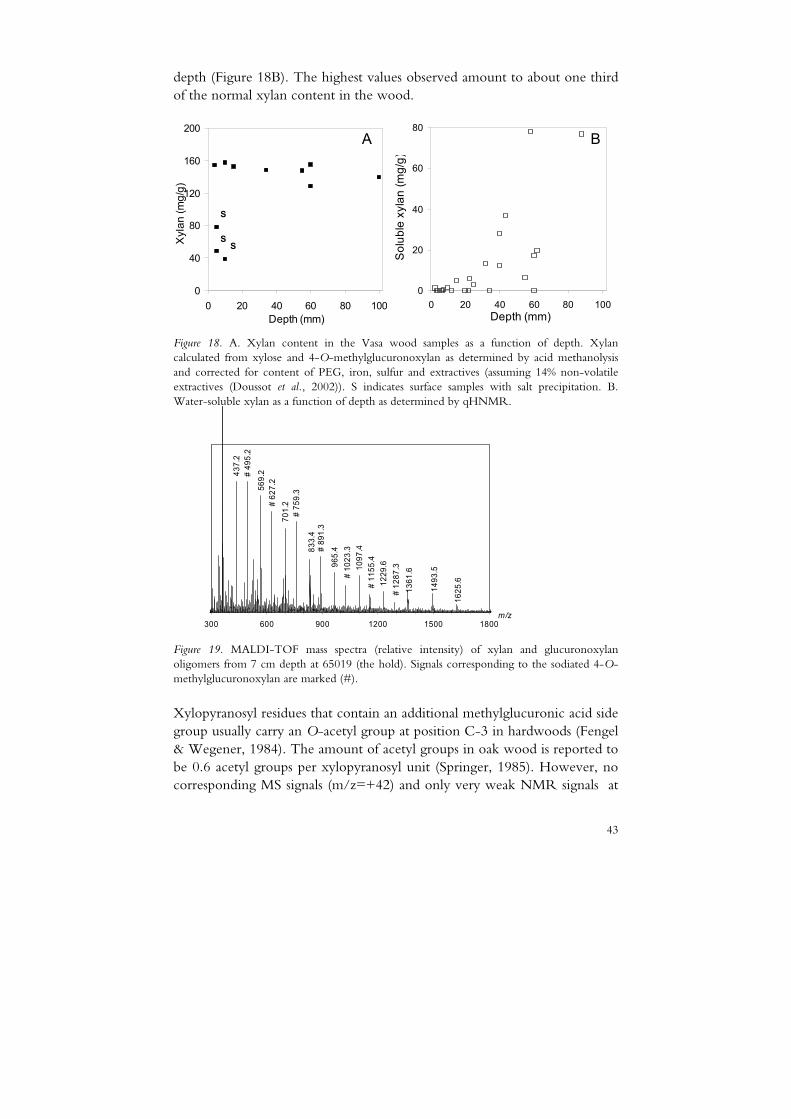
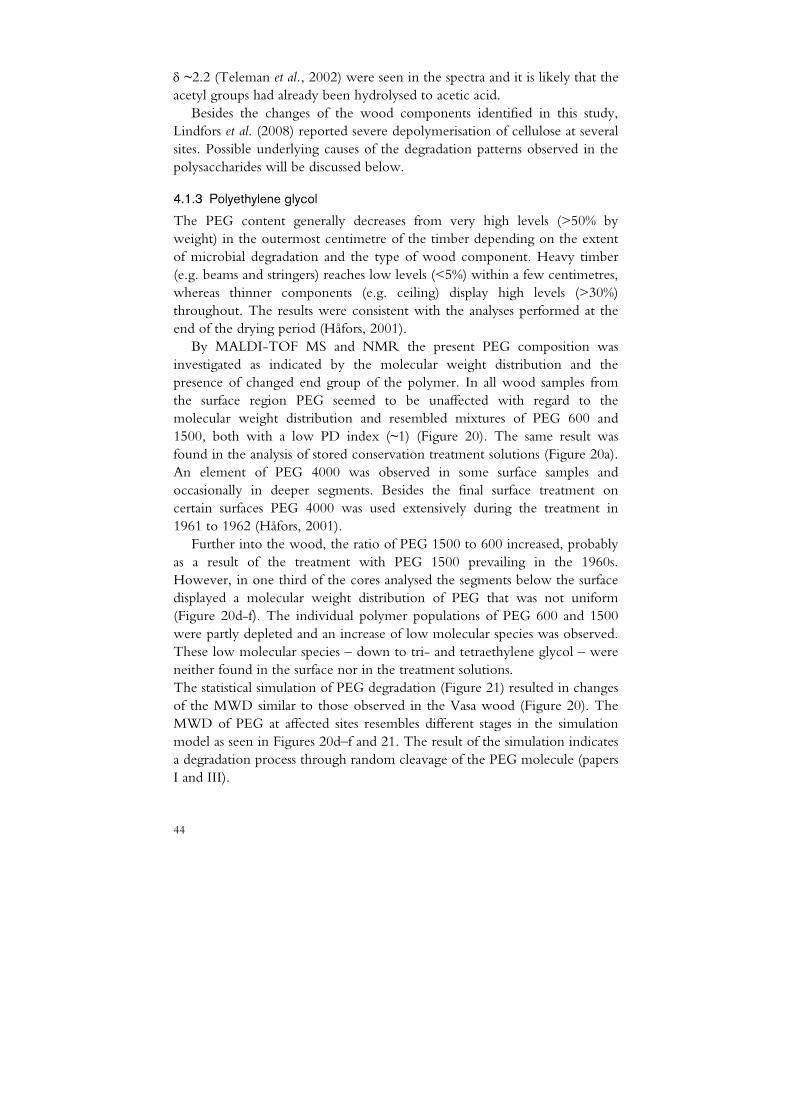
Only a few analyses of the content of the major wood components in Vasa timber have previously been performed. There are indications that the Vasa oak wood has a decreased content of xylan, particularly in the surface region, as a result of earlier microbial degradation (Lindfors et al., 2008). By acid methanolysis of the non-cellulosic sugars (Bertaud et al., 2002) the xylan content was determined in a series of samples, see Figure 18A. Surface samples with high PEG and sulfate content indicating a high degree of microbial degradation showed very low xylan content, whereas the inner samples displayed a general decrease (13-16%) (Almkvist, G. and Pranovich, A. unpublished results) compared to recent oak (~24%) (Willför et al., 2005).
Analysis of wood extracts by MALDI-TOF MS and NMR revealed that many samples showed depolymerisation of xylan (papers I and II). The DP detected in the mass spectra was between 3 and 20 with maximum signal intensity at the lowest DP (Figure 19). The typical DP of xylan in hardwood is 100-200 (Fengel & Wegener, 1984), which makes it water-insoluble being an integrated part in the wood matrix. Quantitative determination of the water-soluble xylan by 1H-NMR showed a positive correlation with the
43
depth (Figure 18B). The highest values observed amount to about one third of the normal xylan content in the wood.
0
40
80
120
160
200
0 20 40 60 80 100 Depth (mm)
Xyl
an (m
g/g)
S
SS
0
20
40
60
80
0 20 40 60 80 100Depth (mm)
Sol
uble
xyl
an (m
g/g)
A B
Figure 18. A. Xylan content in the Vasa wood samples as a function of depth. Xylan calculated from xylose and 4-O-methylglucuronoxylan as determined by acid methanolysis and corrected for content of PEG, iron, sulfur and extractives (assuming 14% non-volatile extractives (Doussot et al., 2002)). S indicates surface samples with salt precipitation. B. Water-soluble xylan as a function of depth as determined by qHNMR.
Figure 19. MALDI-TOF mass spectra (relative intensity) of xylan and glucuronoxylan oligomers from 7 cm depth at 65019 (the hold). Signals corresponding to the sodiated 4-O-methylglucuronoxylan are marked (#).
Xylopyranosyl residues that contain an additional methylglucuronic acid side group usually carry an O-acetyl group at position C-3 in hardwoods (Fengel & Wegener, 1984). The amount of acetyl groups in oak wood is reported to be 0.6 acetyl groups per xylopyranosyl unit (Springer, 1985). However, no corresponding MS signals (m/z=+42) and only very weak NMR signals at
1493
.5
1625
.6
1361
.6#
1287
.3
701.
2
437.
2#
495.
256
9.2
# 62
7.2
# 75
9.3
833.
4#
891.
396
5.4
# 10
23.3
1097
.4#
1155
.412
29.6
300 600 900 1200 1500 1800m/z
44
δ ~2.2 (Teleman et al., 2002) were seen in the spectra and it is likely that the acetyl groups had already been hydrolysed to acetic acid.
Besides the changes of the wood components identified in this study, Lindfors et al. (2008) reported severe depolymerisation of cellulose at several sites. Possible underlying causes of the degradation patterns observed in the polysaccharides will be discussed below.
4.1.3 Polyethylene glycol
The PEG content generally decreases from very high levels (>50% by weight) in the outermost centimetre of the timber depending on the extent of microbial degradation and the type of wood component. Heavy timber (e.g. beams and stringers) reaches low levels (<5%) within a few centimetres, whereas thinner components (e.g. ceiling) display high levels (>30%) throughout. The results were consistent with the analyses performed at the end of the drying period (Håfors, 2001).
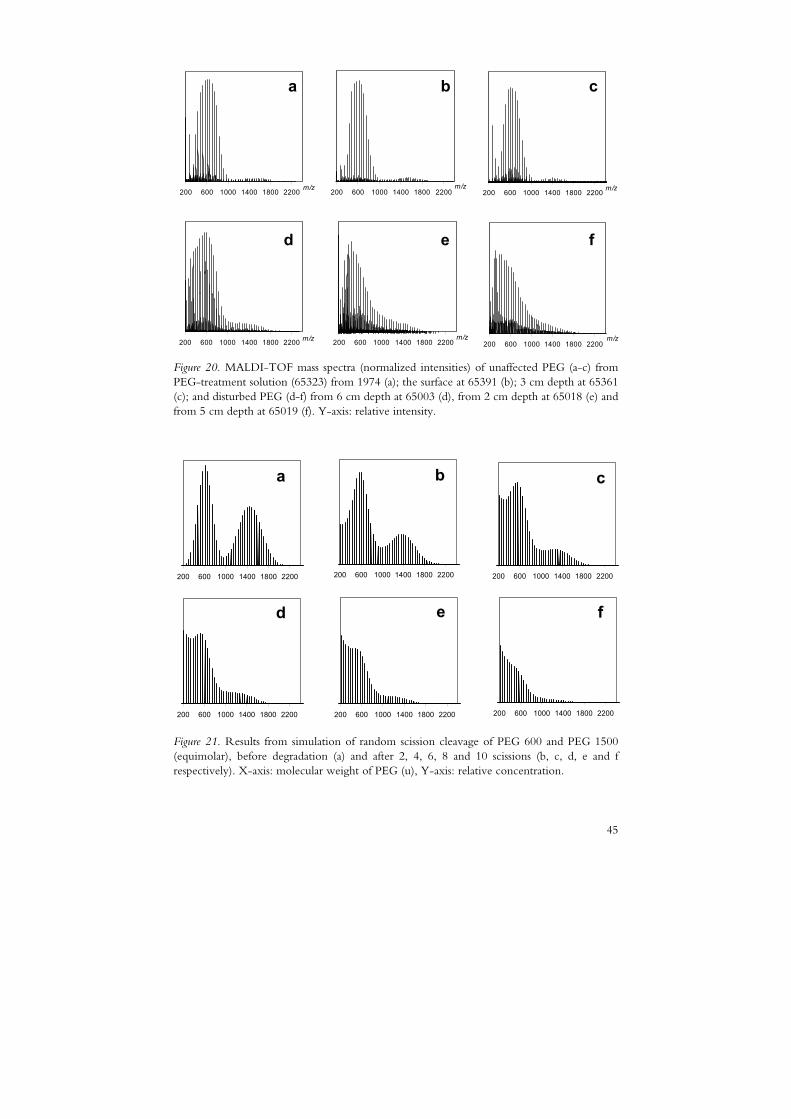
By MALDI-TOF MS and NMR the present PEG composition was investigated as indicated by the molecular weight distribution and the presence of changed end group of the polymer. In all wood samples from the surface region PEG seemed to be unaffected with regard to the molecular weight distribution and resembled mixtures of PEG 600 and 1500, both with a low PD index (~1) (Figure 20). The same result was found in the analysis of stored conservation treatment solutions (Figure 20a). An element of PEG 4000 was observed in some surface samples and occasionally in deeper segments. Besides the final surface treatment on certain surfaces PEG 4000 was used extensively during the treatment in 1961 to 1962 (Håfors, 2001).
Further into the wood, the ratio of PEG 1500 to 600 increased, probably as a result of the treatment with PEG 1500 prevailing in the 1960s. However, in one third of the cores analysed the segments below the surface displayed a molecular weight distribution of PEG that was not uniform (Figure 20d-f). The individual polymer populations of PEG 600 and 1500 were partly depleted and an increase of low molecular species was observed. These low molecular species – down to tri- and tetraethylene glycol – were neither found in the surface nor in the treatment solutions. The statistical simulation of PEG degradation (Figure 21) resulted in changes of the MWD similar to those observed in the Vasa wood (Figure 20). The MWD of PEG at affected sites resembles different stages in the simulation model as seen in Figures 20d–f and 21. The result of the simulation indicates a degradation process through random cleavage of the PEG molecule (papers I and III).
45
200 600 1000 1400 1800 2200m/z
200 600 1000 1400 1800 2200m/z
200 600 1000 1400 1800 2200m/z200 600 1000 1400 1800 2200 m/z
200 600 1000 1400 1800 2200m/z
200 600 1000 1400 1800 2200m/z
a b c
d e f Figure 20. MALDI-TOF mass spectra (normalized intensities) of unaffected PEG (a-c) from PEG-treatment solution (65323) from 1974 (a); the surface at 65391 (b); 3 cm depth at 65361 (c); and disturbed PEG (d-f) from 6 cm depth at 65003 (d), from 2 cm depth at 65018 (e) and from 5 cm depth at 65019 (f). Y-axis: relative intensity.
200 600 1000 1400 1800 2200
a
200 600 1000 1400 1800 2200
b
200 600 1000 1400 1800 2200
c
200 600 1000 1400 1800 2200
d
200 600 1000 1400 1800 2200
e
200 600 1000 1400 1800 2200
f
Figure 21. Results from simulation of random scission cleavage of PEG 600 and PEG 1500 (equimolar), before degradation (a) and after 2, 4, 6, 8 and 10 scissions (b, c, d, e and f respectively). X-axis: molecular weight of PEG (u), Y-axis: relative concentration.
46
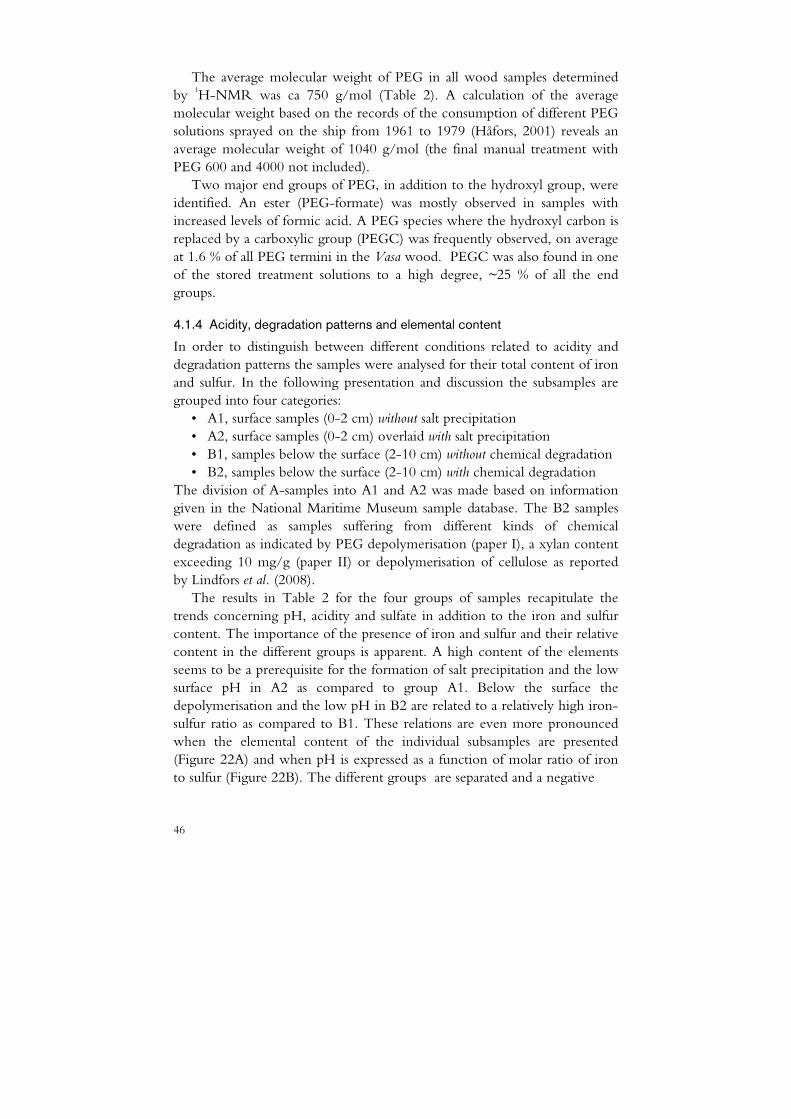
The average molecular weight of PEG in all wood samples determined by 1H-NMR was ca 750 g/mol (Table 2). A calculation of the average molecular weight based on the records of the consumption of different PEG solutions sprayed on the ship from 1961 to 1979 (Håfors, 2001) reveals an average molecular weight of 1040 g/mol (the final manual treatment with PEG 600 and 4000 not included).
Two major end groups of PEG, in addition to the hydroxyl group, were identified. An ester (PEG-formate) was mostly observed in samples with increased levels of formic acid. A PEG species where the hydroxyl carbon is replaced by a carboxylic group (PEGC) was frequently observed, on average at 1.6 % of all PEG termini in the Vasa wood. PEGC was also found in one of the stored treatment solutions to a high degree, ~25 % of all the end groups.
4.1.4 Acidity, degradation patterns and elemental content
In order to distinguish between different conditions related to acidity and degradation patterns the samples were analysed for their total content of iron and sulfur. In the following presentation and discussion the subsamples are grouped into four categories:
• A1, surface samples (0-2 cm) without salt precipitation • A2, surface samples (0-2 cm) overlaid with salt precipitation • B1, samples below the surface (2-10 cm) without chemical degradation • B2, samples below the surface (2-10 cm) with chemical degradation
The division of A-samples into A1 and A2 was made based on information given in the National Maritime Museum sample database. The B2 samples were defined as samples suffering from different kinds of chemical degradation as indicated by PEG depolymerisation (paper I), a xylan content exceeding 10 mg/g (paper II) or depolymerisation of cellulose as reported by Lindfors et al. (2008).
The results in Table 2 for the four groups of samples recapitulate the trends concerning pH, acidity and sulfate in addition to the iron and sulfur content. The importance of the presence of iron and sulfur and their relative content in the different groups is apparent. A high content of the elements seems to be a prerequisite for the formation of salt precipitation and the low surface pH in A2 as compared to group A1. Below the surface the depolymerisation and the low pH in B2 are related to a relatively high iron-sulfur ratio as compared to B1. These relations are even more pronounced when the elemental content of the individual subsamples are presented (Figure 22A) and when pH is expressed as a function of molar ratio of iron to sulfur (Figure 22B). The different groups are separated and a negative
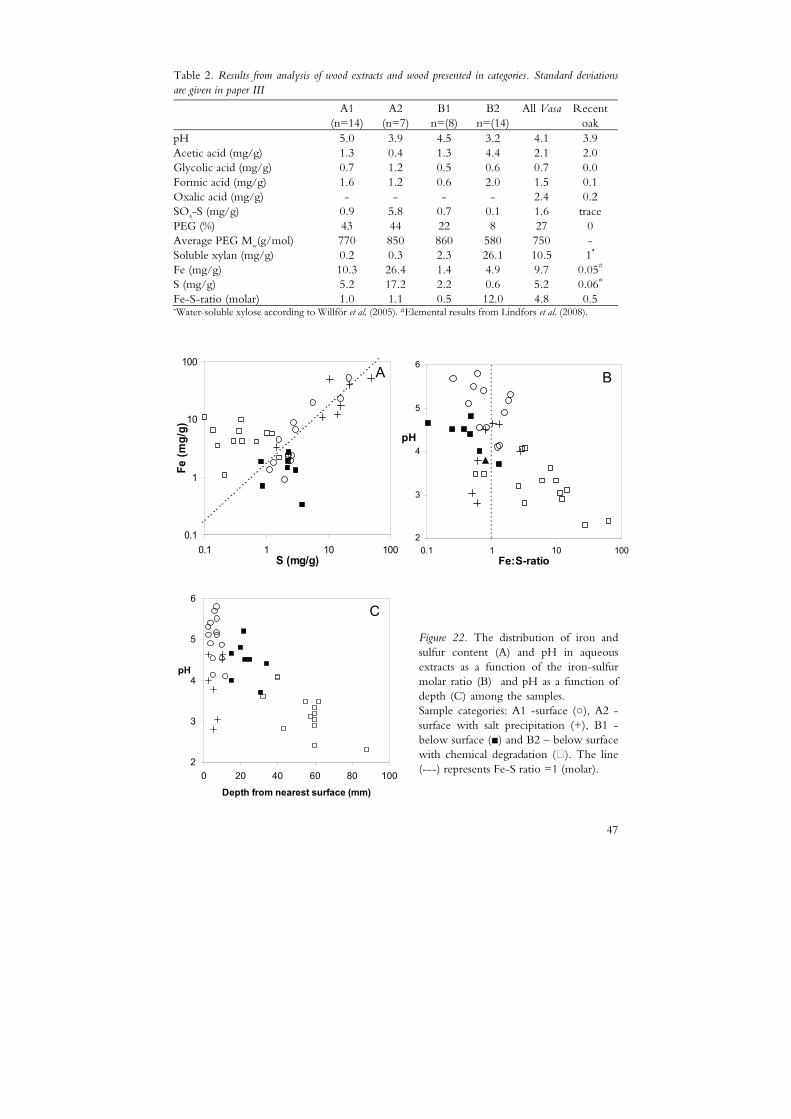
47
2
3
4
5
6
0 20 40 60 80 100
Depth from nearest surface (mm)
pH
C
Table 2. Results from analysis of wood extracts and wood presented in categories. Standard deviations are given in paper III
A1 (n=14)
A2 (n=7)
B1 n=(8)
B2 n=(14)
All Vasa Recent oak
pH 5.0 3.9 4.5 3.2 4.1 3.9 Acetic acid (mg/g) 1.3 0.4 1.3 4.4 2.1 2.0 Glycolic acid (mg/g) 0.7 1.2 0.5 0.6 0.7 0.0 Formic acid (mg/g) 1.6 1.2 0.6 2.0 1.5 0.1 Oxalic acid (mg/g) - - - - 2.4 0.2 SO4-S (mg/g) 0.9 5.8 0.7 0.1 1.6 trace PEG (%) 43 44 22 8 27 0 Average PEG Mw(g/mol) 770 850 860 580 750 - Soluble xylan (mg/g) 0.2 0.3 2.3 26.1 10.5 1* Fe (mg/g) 10.3 26.4 1.4 4.9 9.7 0.05# S (mg/g) 5.2 17.2 2.2 0.6 5.2 0.06# Fe-S-ratio (molar) 1.0 1.1 0.5 12.0 4.8 0.5 *Water-soluble xylose according to Willför et al. (2005). #Elemental results from Lindfors et al. (2008).
0.1
1
10
100
0.1 1 10 100S (mg/g)
Fe (m
g/g)
2
3
4
5
6
0.1 1 10 100Fe:S-ratio
pH
A B
Figure 22. The distribution of iron and sulfur content (A) and pH in aqueous extracts as a function of the iron-sulfur molar ratio (B) and pH as a function of depth (C) among the samples.XXX X X Sample categories: A1 -surface (○), A2 - surface with salt precipitation (+), B1 - below surface (■) and B2 – below surface with chemical degradation (). The line (---) represents Fe-S ratio =1 (molar).
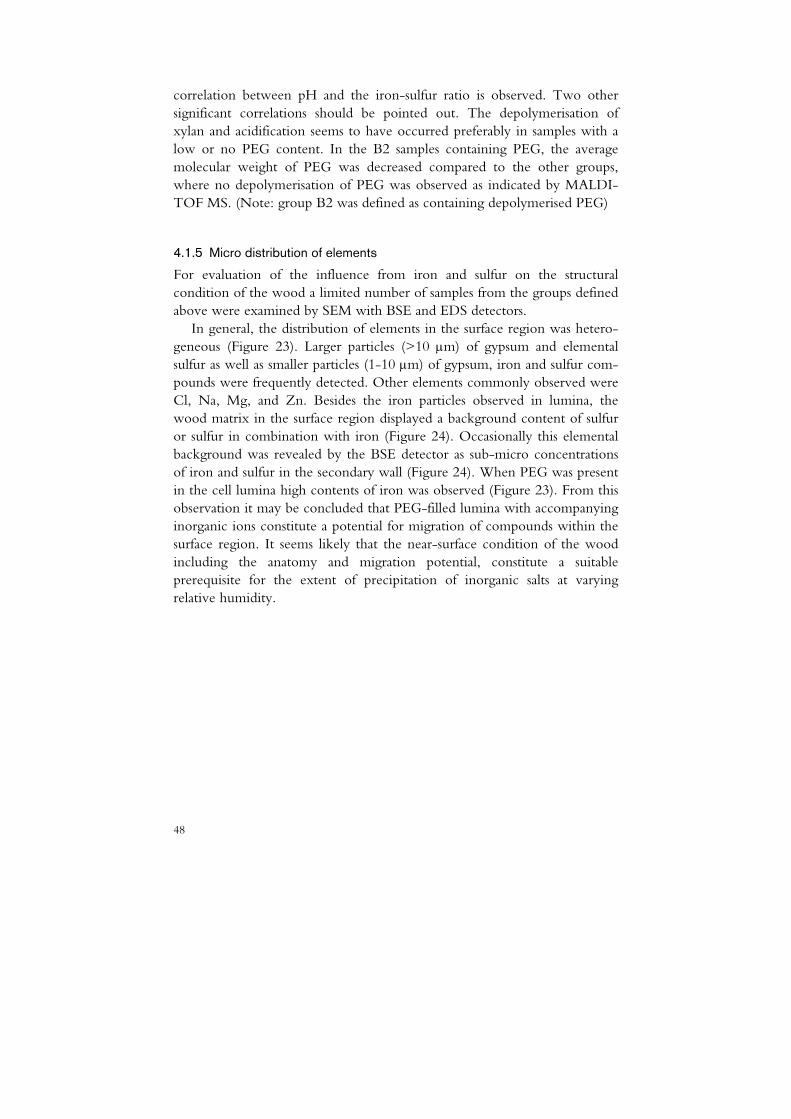
48
correlation between pH and the iron-sulfur ratio is observed. Two other significant correlations should be pointed out. The depolymerisation of xylan and acidification seems to have occurred preferably in samples with a low or no PEG content. In the B2 samples containing PEG, the average molecular weight of PEG was decreased compared to the other groups, where no depolymerisation of PEG was observed as indicated by MALDI-TOF MS. (Note: group B2 was defined as containing depolymerised PEG)
4.1.5 Micro distribution of elements
For evaluation of the influence from iron and sulfur on the structural condition of the wood a limited number of samples from the groups defined above were examined by SEM with BSE and EDS detectors.
In general, the distribution of elements in the surface region was hetero-geneous (Figure 23). Larger particles (>10 μm) of gypsum and elemental sulfur as well as smaller particles (1-10 μm) of gypsum, iron and sulfur com-pounds were frequently detected. Other elements commonly observed were Cl, Na, Mg, and Zn. Besides the iron particles observed in lumina, the wood matrix in the surface region displayed a background content of sulfur or sulfur in combination with iron (Figure 24). Occasionally this elemental background was revealed by the BSE detector as sub-micro concentrations of iron and sulfur in the secondary wall (Figure 24). When PEG was present in the cell lumina high contents of iron was observed (Figure 23). From this observation it may be concluded that PEG-filled lumina with accompanying inorganic ions constitute a potential for migration of compounds within the surface region. It seems likely that the near-surface condition of the wood including the anatomy and migration potential, constitute a suitable prerequisite for the extent of precipitation of inorganic salts at varying relative humidity.
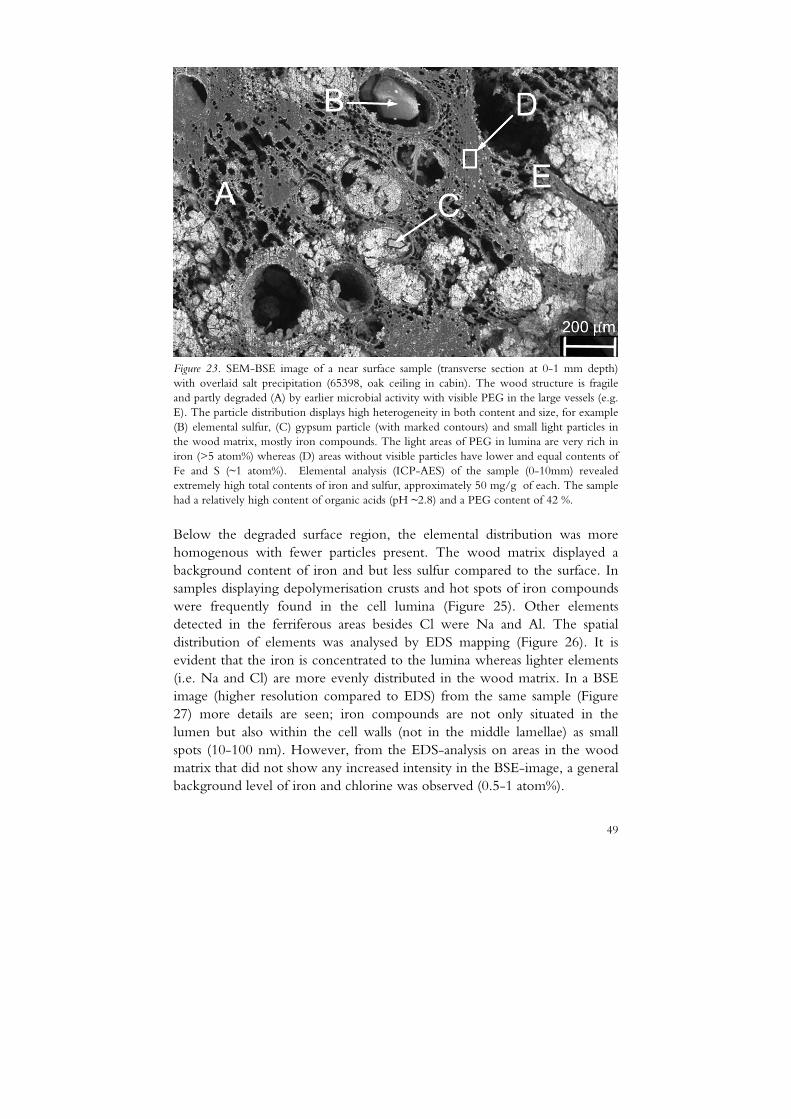
49
Figure 23. SEM-BSE image of a near surface sample (transverse section at 0-1 mm depth) with overlaid salt precipitation (65398, oak ceiling in cabin). The wood structure is fragile and partly degraded (A) by earlier microbial activity with visible PEG in the large vessels (e.g. E). The particle distribution displays high heterogeneity in both content and size, for example (B) elemental sulfur, (C) gypsum particle (with marked contours) and small light particles in the wood matrix, mostly iron compounds. The light areas of PEG in lumina are very rich in iron (>5 atom%) whereas (D) areas without visible particles have lower and equal contents of Fe and S (~1 atom%). Elemental analysis (ICP-AES) of the sample (0-10mm) revealed extremely high total contents of iron and sulfur, approximately 50 mg/g of each. The sample had a relatively high content of organic acids (pH ~2.8) and a PEG content of 42 %.
Below the degraded surface region, the elemental distribution was more homogenous with fewer particles present. The wood matrix displayed a background content of iron and but less sulfur compared to the surface. In samples displaying depolymerisation crusts and hot spots of iron compounds were frequently found in the cell lumina (Figure 25). Other elements detected in the ferriferous areas besides Cl were Na and Al. The spatial distribution of elements was analysed by EDS mapping (Figure 26). It is evident that the iron is concentrated to the lumina whereas lighter elements (i.e. Na and Cl) are more evenly distributed in the wood matrix. In a BSE image (higher resolution compared to EDS) from the same sample (Figure 27) more details are seen; iron compounds are not only situated in the lumen but also within the cell walls (not in the middle lamellae) as small spots (10-100 nm). However, from the EDS-analysis on areas in the wood matrix that did not show any increased intensity in the BSE-image, a general background level of iron and chlorine was observed (0.5-1 atom%).
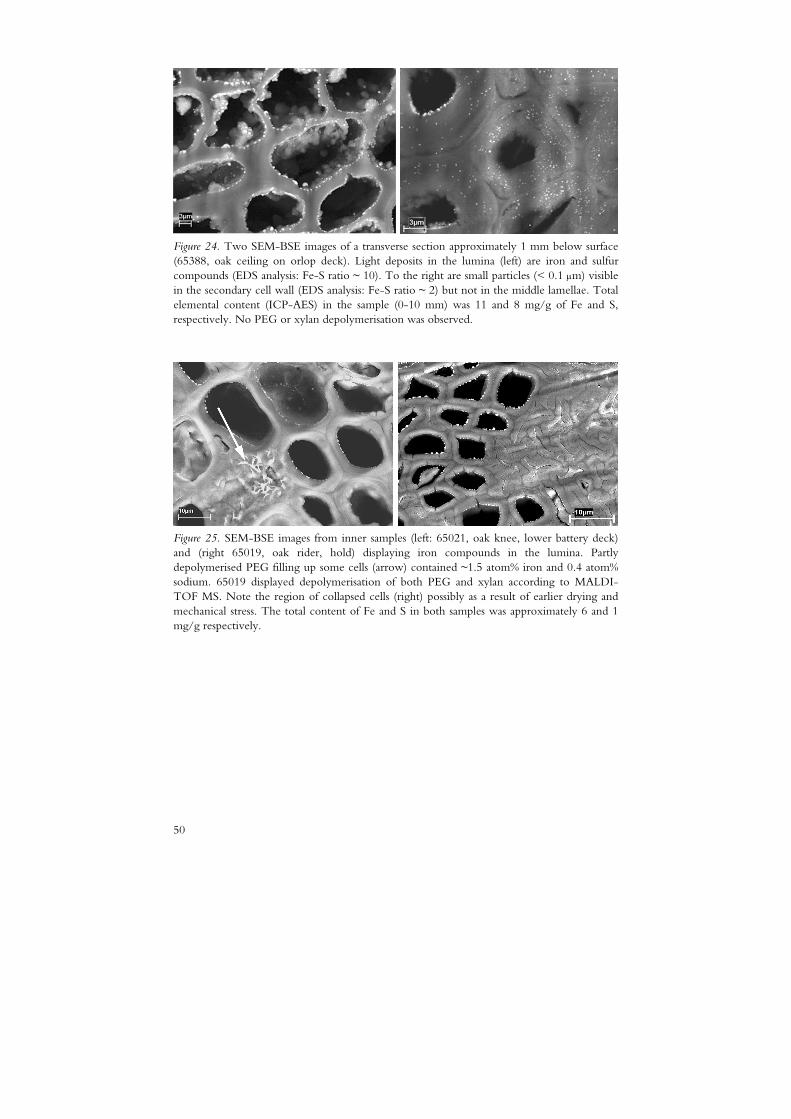
50
Figure 24. Two SEM-BSE images of a transverse section approximately 1 mm below surface (65388, oak ceiling on orlop deck). Light deposits in the lumina (left) are iron and sulfur compounds (EDS analysis: Fe-S ratio ~ 10). To the right are small particles (< 0.1 μm) visible in the secondary cell wall (EDS analysis: Fe-S ratio ~ 2) but not in the middle lamellae. Total elemental content (ICP-AES) in the sample (0-10 mm) was 11 and 8 mg/g of Fe and S, respectively. No PEG or xylan depolymerisation was observed.
Figure 25. SEM-BSE images from inner samples (left: 65021, oak knee, lower battery deck) and (right 65019, oak rider, hold) displaying iron compounds in the lumina. Partly depolymerised PEG filling up some cells (arrow) contained ~1.5 atom% iron and 0.4 atom% sodium. 65019 displayed depolymerisation of both PEG and xylan according to MALDI-TOF MS. Note the region of collapsed cells (right) possibly as a result of earlier drying and mechanical stress. The total content of Fe and S in both samples was approximately 6 and 1 mg/g respectively.
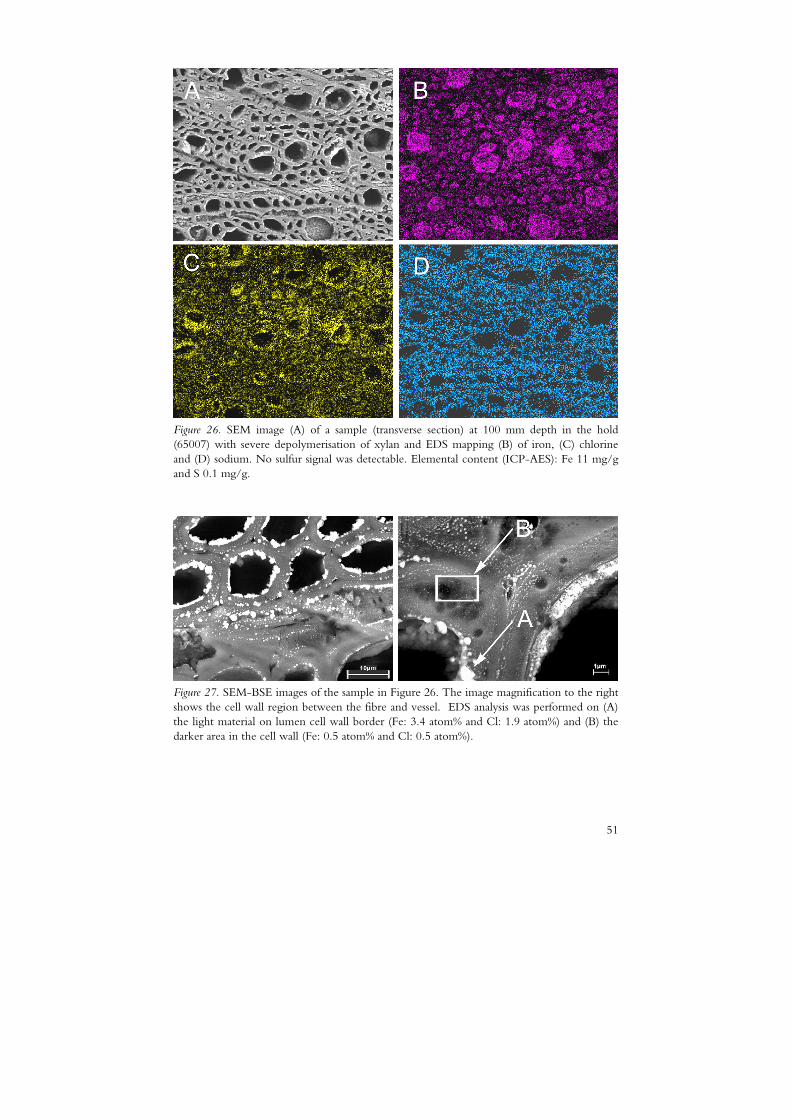
51
Figure 26. SEM image (A) of a sample (transverse section) at 100 mm depth in the hold (65007) with severe depolymerisation of xylan and EDS mapping (B) of iron, (C) chlorine and (D) sodium. No sulfur signal was detectable. Elemental content (ICP-AES): Fe 11 mg/g and S 0.1 mg/g.
Figure 27. SEM-BSE images of the sample in Figure 26. The image magnification to the right shows the cell wall region between the fibre and vessel. EDS analysis was performed on (A) the light material on lumen cell wall border (Fe: 3.4 atom% and Cl: 1.9 atom%) and (B) the darker area in the cell wall (Fe: 0.5 atom% and Cl: 0.5 atom%).
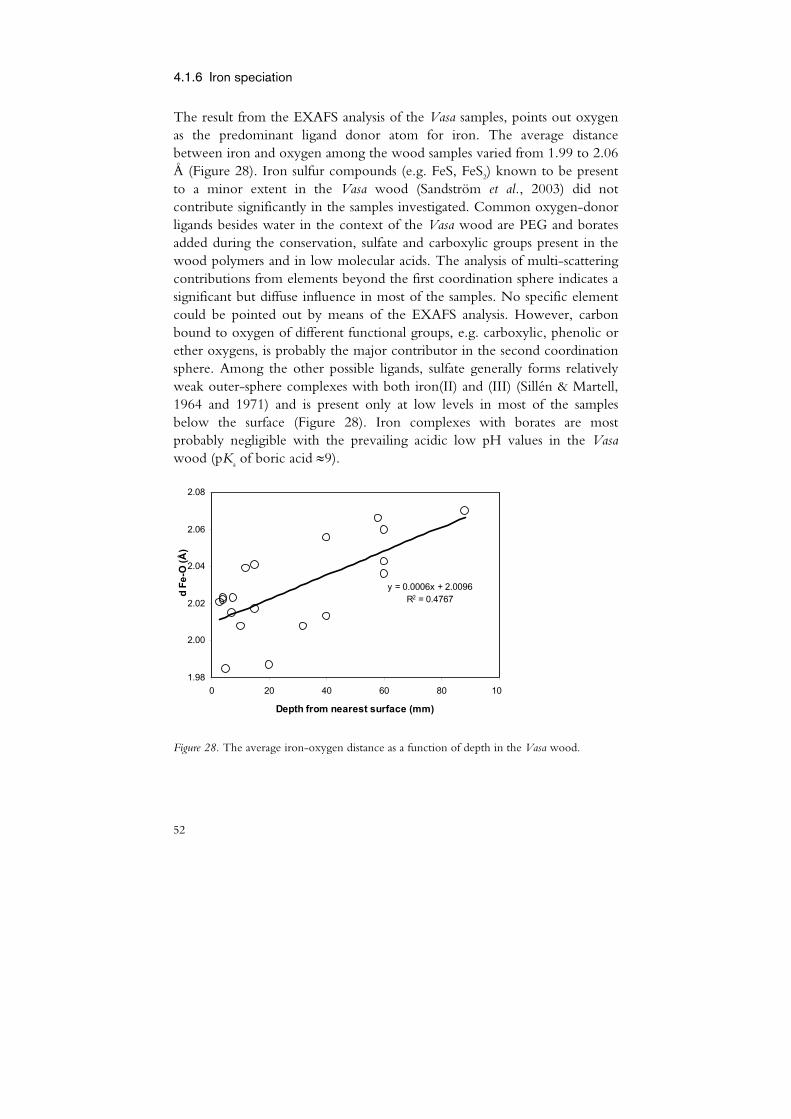
52
4.1.6 Iron speciation
The result from the EXAFS analysis of the Vasa samples, points out oxygen as the predominant ligand donor atom for iron. The average distance between iron and oxygen among the wood samples varied from 1.99 to 2.06 Å (Figure 28). Iron sulfur compounds (e.g. FeS, FeS2) known to be present to a minor extent in the Vasa wood (Sandström et al., 2003) did not contribute significantly in the samples investigated. Common oxygen-donor ligands besides water in the context of the Vasa wood are PEG and borates added during the conservation, sulfate and carboxylic groups present in the wood polymers and in low molecular acids. The analysis of multi-scattering contributions from elements beyond the first coordination sphere indicates a significant but diffuse influence in most of the samples. No specific element could be pointed out by means of the EXAFS analysis. However, carbon bound to oxygen of different functional groups, e.g. carboxylic, phenolic or ether oxygens, is probably the major contributor in the second coordination sphere. Among the other possible ligands, sulfate generally forms relatively weak outer-sphere complexes with both iron(II) and (III) (Sillén & Martell, 1964 and 1971) and is present only at low levels in most of the samples below the surface (Figure 28). Iron complexes with borates are most probably negligible with the prevailing acidic low pH values in the Vasa wood (pKa of boric acid ≈9).
y = 0.0006x + 2.0096R2 = 0.4767
1.98
2.00
2.02
2.04
2.06
2.08
0 20 40 60 80 10
Depth from nearest surface (mm)
d Fe
-O (Å
)
Figure 28. The average iron-oxygen distance as a function of depth in the Vasa wood.
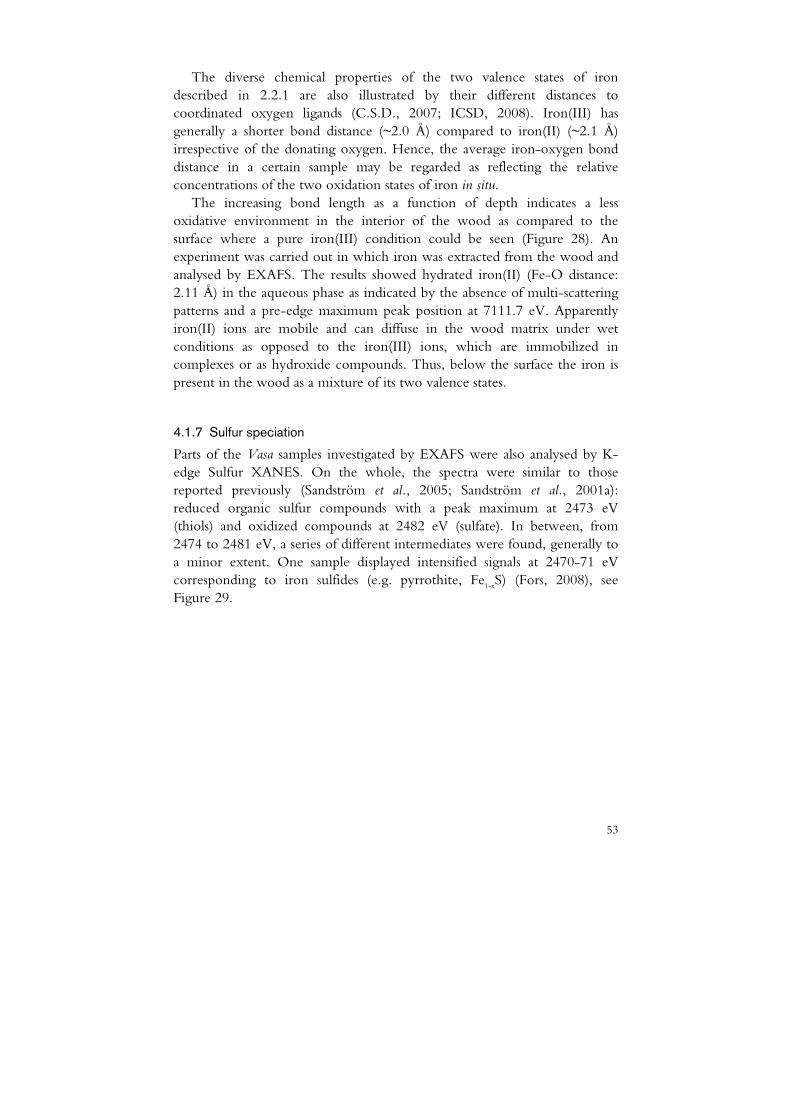
53
The diverse chemical properties of the two valence states of iron described in 2.2.1 are also illustrated by their different distances to coordinated oxygen ligands (C.S.D., 2007; ICSD, 2008). Iron(III) has generally a shorter bond distance (~2.0 Å) compared to iron(II) (~2.1 Å) irrespective of the donating oxygen. Hence, the average iron-oxygen bond distance in a certain sample may be regarded as reflecting the relative concentrations of the two oxidation states of iron in situ.
The increasing bond length as a function of depth indicates a less oxidative environment in the interior of the wood as compared to the surface where a pure iron(III) condition could be seen (Figure 28). An experiment was carried out in which iron was extracted from the wood and analysed by EXAFS. The results showed hydrated iron(II) (Fe-O distance: 2.11 Å) in the aqueous phase as indicated by the absence of multi-scattering patterns and a pre-edge maximum peak position at 7111.7 eV. Apparently iron(II) ions are mobile and can diffuse in the wood matrix under wet conditions as opposed to the iron(III) ions, which are immobilized in complexes or as hydroxide compounds. Thus, below the surface the iron is present in the wood as a mixture of its two valence states.
4.1.7 Sulfur speciation
Parts of the Vasa samples investigated by EXAFS were also analysed by K-edge Sulfur XANES. On the whole, the spectra were similar to those reported previously (Sandström et al., 2005; Sandström et al., 2001a): reduced organic sulfur compounds with a peak maximum at 2473 eV (thiols) and oxidized compounds at 2482 eV (sulfate). In between, from 2474 to 2481 eV, a series of different intermediates were found, generally to a minor extent. One sample displayed intensified signals at 2470-71 eV corresponding to iron sulfides (e.g. pyrrothite, Fe1-xS) (Fors, 2008), see Figure 29.
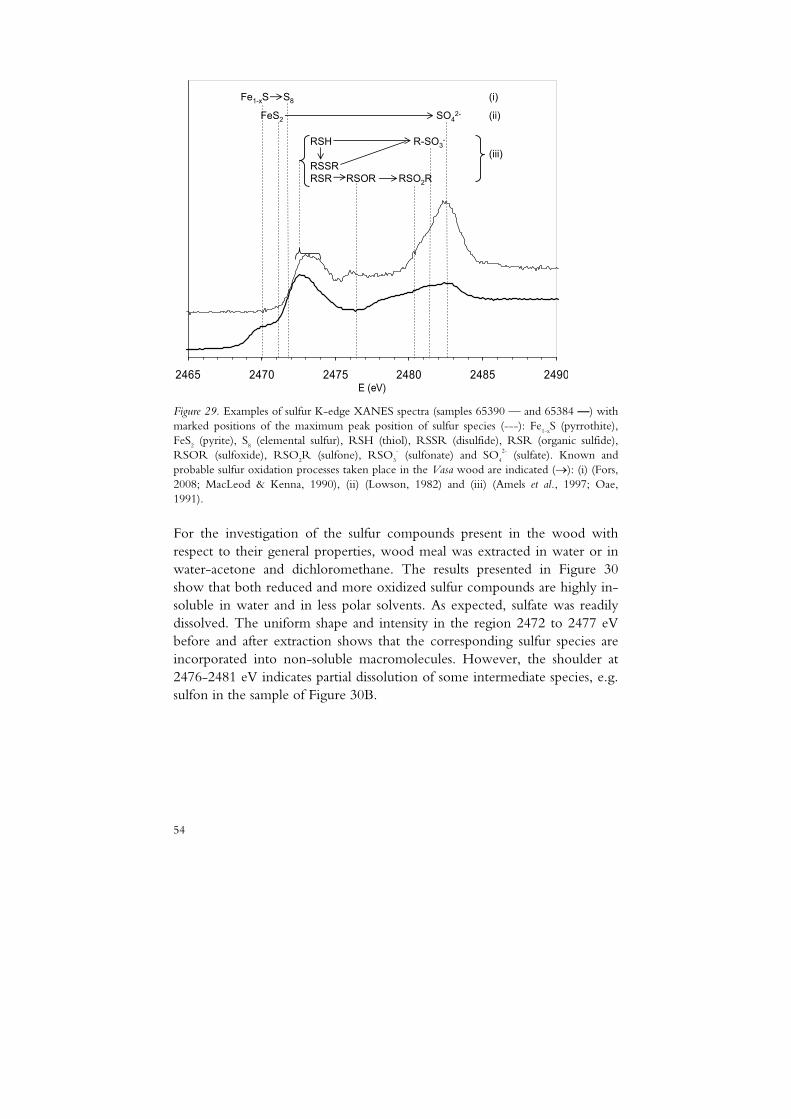
54
2465 2470 2475 2480 2485 2490E (eV)
Fe1-xS S8 (i)
FeS2 SO42- (ii)
RSH R-SO3-
(iii)RSSRRSR RSOR RSO2R
Figure 29. Examples of sulfur K-edge XANES spectra (samples 65390 — and 65384 —) with marked positions of the maximum peak position of sulfur species (---): Fe1-xS (pyrrothite), FeS2 (pyrite), S8 (elemental sulfur), RSH (thiol), RSSR (disulfide), RSR (organic sulfide), RSOR (sulfoxide), RSO2R (sulfone), RSO3
- (sulfonate) and SO4
2- (sulfate). Known and probable sulfur oxidation processes taken place in the Vasa wood are indicated (→): (i) (Fors, 2008; MacLeod & Kenna, 1990), (ii) (Lowson, 1982) and (iii) (Amels et al., 1997; Oae, 1991).
For the investigation of the sulfur compounds present in the wood with respect to their general properties, wood meal was extracted in water or in water-acetone and dichloromethane. The results presented in Figure 30 show that both reduced and more oxidized sulfur compounds are highly in-soluble in water and in less polar solvents. As expected, sulfate was readily dissolved. The uniform shape and intensity in the region 2472 to 2477 eV before and after extraction shows that the corresponding sulfur species are incorporated into non-soluble macromolecules. However, the shoulder at 2476-2481 eV indicates partial dissolution of some intermediate species, e.g. sulfon in the sample of Figure 30B.
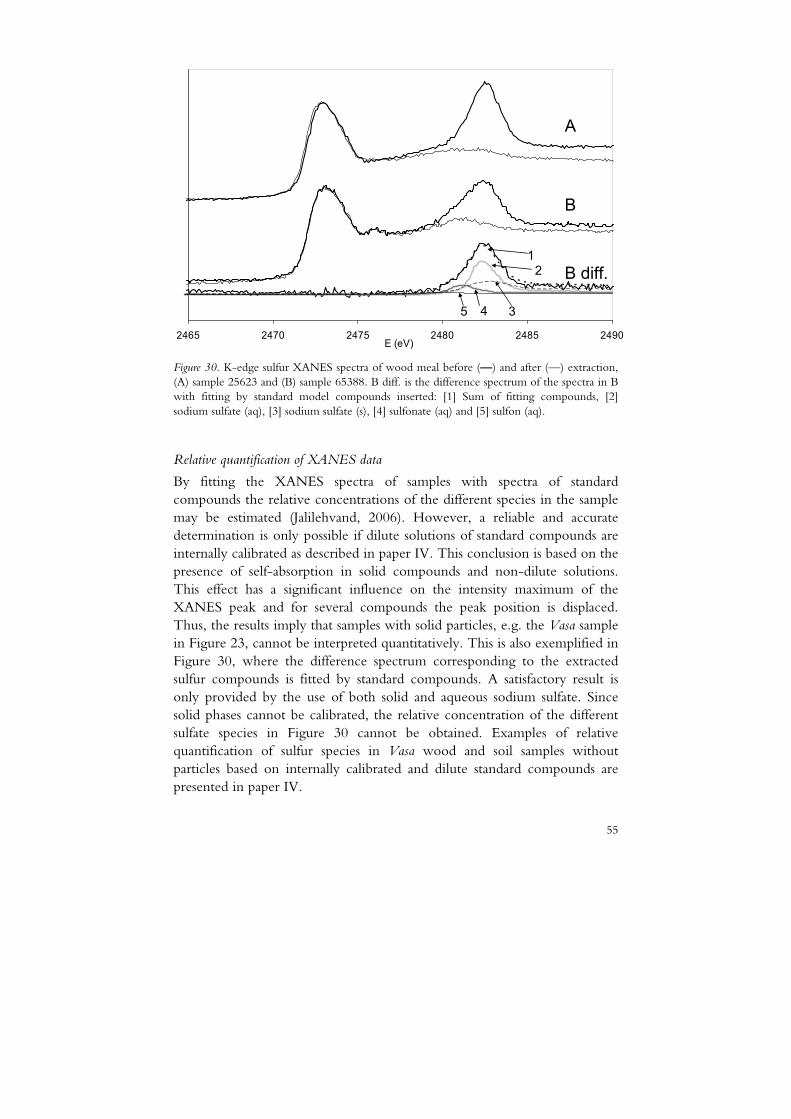
55
2465 2470 2475 2480 2485 2490E (eV)
A
B
B diff.1
2
345
Figure 30. K-edge sulfur XANES spectra of wood meal before (—) and after (—) extraction, (A) sample 25623 and (B) sample 65388. B diff. is the difference spectrum of the spectra in B with fitting by standard model compounds inserted: [1] Sum of fitting compounds, [2] sodium sulfate (aq), [3] sodium sulfate (s), [4] sulfonate (aq) and [5] sulfon (aq).
Relative quantification of XANES data
By fitting the XANES spectra of samples with spectra of standard compounds the relative concentrations of the different species in the sample may be estimated (Jalilehvand, 2006). However, a reliable and accurate determination is only possible if dilute solutions of standard compounds are internally calibrated as described in paper IV. This conclusion is based on the presence of self-absorption in solid compounds and non-dilute solutions. This effect has a significant influence on the intensity maximum of the XANES peak and for several compounds the peak position is displaced. Thus, the results imply that samples with solid particles, e.g. the Vasa sample in Figure 23, cannot be interpreted quantitatively. This is also exemplified in Figure 30, where the difference spectrum corresponding to the extracted sulfur compounds is fitted by standard compounds. A satisfactory result is only provided by the use of both solid and aqueous sodium sulfate. Since solid phases cannot be calibrated, the relative concentration of the different sulfate species in Figure 30 cannot be obtained. Examples of relative quantification of sulfur species in Vasa wood and soil samples without particles based on internally calibrated and dilute standard compounds are presented in paper IV.
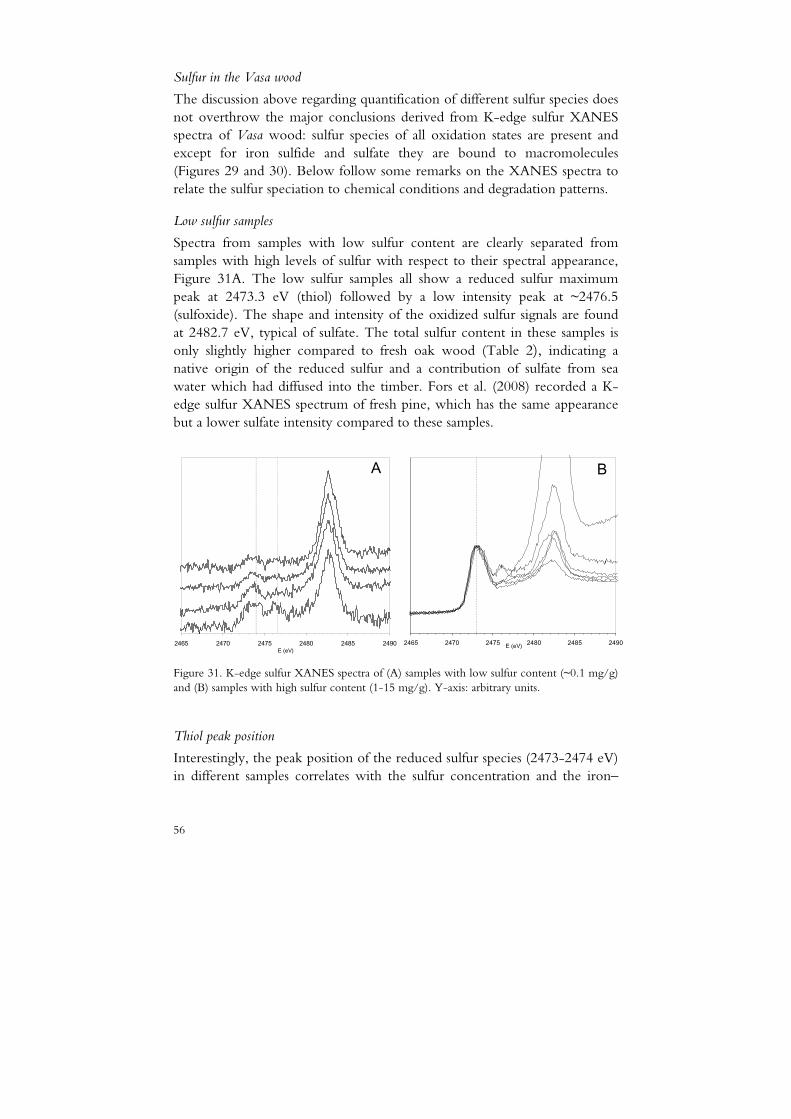
56
Sulfur in the Vasa wood
The discussion above regarding quantification of different sulfur species does not overthrow the major conclusions derived from K-edge sulfur XANES spectra of Vasa wood: sulfur species of all oxidation states are present and except for iron sulfide and sulfate they are bound to macromolecules (Figures 29 and 30). Below follow some remarks on the XANES spectra to relate the sulfur speciation to chemical conditions and degradation patterns.
Low sulfur samples
Spectra from samples with low sulfur content are clearly separated from samples with high levels of sulfur with respect to their spectral appearance, Figure 31A. The low sulfur samples all show a reduced sulfur maximum peak at 2473.3 eV (thiol) followed by a low intensity peak at ~2476.5 (sulfoxide). The shape and intensity of the oxidized sulfur signals are found at 2482.7 eV, typical of sulfate. The total sulfur content in these samples is only slightly higher compared to fresh oak wood (Table 2), indicating a native origin of the reduced sulfur and a contribution of sulfate from sea water which had diffused into the timber. Fors et al. (2008) recorded a K-edge sulfur XANES spectrum of fresh pine, which has the same appearance but a lower sulfate intensity compared to these samples.
2465 2470 2475 2480 2485 2490E (eV)
2465 2470 2475 2480 2485 2490E (eV)
A B
Figure 31. K-edge sulfur XANES spectra of (A) samples with low sulfur content (~0.1 mg/g) and (B) samples with high sulfur content (1-15 mg/g). Y-axis: arbitrary units.
Thiol peak position
Interestingly, the peak position of the reduced sulfur species (2473-2474 eV) in different samples correlates with the sulfur concentration and the iron–
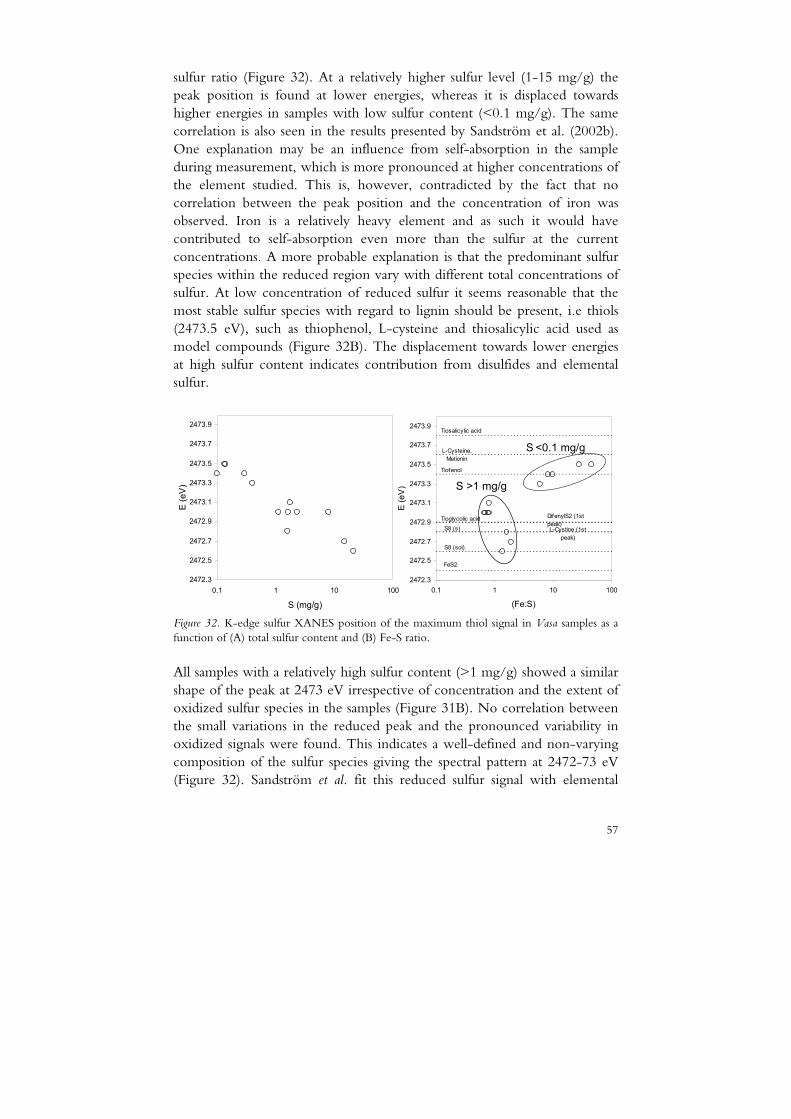
57
sulfur ratio (Figure 32). At a relatively higher sulfur level (1-15 mg/g) the peak position is found at lower energies, whereas it is displaced towards higher energies in samples with low sulfur content (<0.1 mg/g). The same correlation is also seen in the results presented by Sandström et al. (2002b). One explanation may be an influence from self-absorption in the sample during measurement, which is more pronounced at higher concentrations of the element studied. This is, however, contradicted by the fact that no correlation between the peak position and the concentration of iron was observed. Iron is a relatively heavy element and as such it would have contributed to self-absorption even more than the sulfur at the current concentrations. A more probable explanation is that the predominant sulfur species within the reduced region vary with different total concentrations of sulfur. At low concentration of reduced sulfur it seems reasonable that the most stable sulfur species with regard to lignin should be present, i.e thiols (2473.5 eV), such as thiophenol, L-cysteine and thiosalicylic acid used as model compounds (Figure 32B). The displacement towards lower energies at high sulfur content indicates contribution from disulfides and elemental sulfur.
Tiofenol
L-Cysteine, Metionin
FeS2
S8 (s)
S8 (sol)
Tioglycolic acid
L-Cystine (1st peak)
DifenylS2 (1st peak)
Tiosalicylic acid
2472.3
2472.5
2472.7
2472.9
2473.1
2473.3
2473.5
2473.7
2473.9
0.1 1 10 100
(Fe:S)
E (e
V)
S <0.1 mg/g
S >1 mg/g
2472.3
2472.5
2472.7
2472.9
2473.1
2473.3
2473.5
2473.7
2473.9
0.1 1 10 100
S (mg/g)
E (e
V)
Figure 32. K-edge sulfur XANES position of the maximum thiol signal in Vasa samples as a function of (A) total sulfur content and (B) Fe-S ratio.
All samples with a relatively high sulfur content (>1 mg/g) showed a similar shape of the peak at 2473 eV irrespective of concentration and the extent of oxidized sulfur species in the samples (Figure 31B). No correlation between the small variations in the reduced peak and the pronounced variability in oxidized signals were found. This indicates a well-defined and non-varying composition of the sulfur species giving the spectral pattern at 2472-73 eV (Figure 32). Sandström et al. fit this reduced sulfur signal with elemental
58
sulfur, L-cysteine and L-cystein. It does not seem reasonable that these com-pounds should have the same susceptibility to oxidation. Thus, if significant oxidation had taken place a more differentiated pattern of the reduced sulfur would have appeared compared to what is observed in Figure 32. However, considering the effects of self-absorption and the very close spectral patterns of the reduced organic sulfur compounds, additional experiments and methods should be applied to resolve the chemistry of these species in the Vasa wood.
Incorporation of sulfur
The accumulation of sulfur compounds in Vasa wood may be regarded as a result of both microbial activity in situ and diffusion of sulfate and hydrogen sulfide into the wood. The present high sulfur levels (>10 mg/g) - found in microbially degraded parts of the wood – is most probably a result of bacterial activity in the wood matrix (Fors, 2008). In addition, abiotic formation of elemental sulfur described by Steudel (1996) may have proceeded by hydrophobic interaction to form sulfur particles in the surface region (Eq. 3). These processes may have occurred preferably in the relatively hydrophobic lignin structure of the wood matrix, explaining the high intensities observed in the middle lamellae by x-ray microspectroscopic analysis (Fors & Sandström, 2006).
Sulfur at intermediate concentration (1-3 mg/g) was found in several segments below the surface at depths (5-20 mm) exceeding the general depth of microbial degradation (0-5 mm) (Björdal & Nilsson, 2007). This indicates that hydrogen sulfide had diffused and accumulated in a direct reaction with the wood constituents. However, hydrogen sulfide and its anion are not very reactive with respect to aromatic and aliphatic compounds with hydroxyl groups. The non-aromatic part of lignin, mainly short aliphatic chains containing ether and hydroxyl groups, is not unique with respect to the other wood polymers. The native lignin monomers, phenyl propenyl monolignols with conjugated double bonds, would have been excellent sulfide scavengers. However, the double bonds only prevail to a minor extent after lignin condensation processes during the cell wall formation (Nimz, 1974). Maybe, a reaction with iron(III) ions (Eq. 1 and 2) enhanced the formation of elemental sulfur (Yao & Millero, 1996) and the incorporation into the lignin via formation of the more reactive hydrogen sulfide radical.
59
4.2 Degradation in the Vasa wood
4.2.1 Degradation before the salvage
It is evident that chemical changes have occurred in the Vasa wood since the salvage. However, there are indications that some changes took place already during the time on the bottom (besides the microbial degradation and the incorporation of iron and sulfur). The decreased xylan content (Figure 18A) can hardly be explained by the depolymerisation observed in modern time. A general weight loss of Vasa wood as compared to recent oak was actually observed after the salvage. A density of 0.46-0.48 g·cm-3 was noticed as compared to recent oak (~0.65 g·cm-3) performed on objects with negligible microbial degradation (Håfors, B. personal communication).
4.2.2 Are Fenton-type reactions active in situ?
The results presented above concerning increased acidity and degradation of polymers in the ferriferous wood imply oxidative reactions enhanced by iron compounds. The close similarity between the MWD of PEG in situ and statistical simulations (Figures 20 and 21) indicates a random cleavage of the polymer, which is typical of reactions by the hydroxyl radical formed in Fenton-type reactions. The same hypothesis was put forward by Lindfors et al. (2008) concerning holocellulose from the Vasa oak based on the observations of the affected molecular weight distribution of the polysaccharides in the ferriferous wood. The changes in MWD are similar to those found in oxidative processes in pulping and theoretical model simulations of random chain scission reactions (Berggren, 2003).
In order to test this hypothesis PEG and oak holocellulose were treated with hydroxyl radicals induced by Fenton’s reagent (Paper III) and evaluated with the same methods used on the Vasa samples. The change in MWD of the PEG was analysed by means of MALDI-TOF MS and NMR, whereas the holocellulose was evaluated by SEC. The results were essentially the same: an extensive depolymerisation of both PEG and holocellulose with the same patterns that were observed in the Vasa wood. Moreover, the oxidation of PEG led to the formation of formic acid in accordance with earlier studies (Kerem et al., 1998). The experiment also revealed that formic and glycolic acid are formed when acetic acid is oxidized by Fenton’s reagent. Schmidt et al (1981) observed oxalic acid when exposing cotton cellulose to Fenton’s reagent.
From the results of the Fenton model experiment it can be concluded that oxidation of PEG and holocellulose has led to simultaneous acidification and depolymerisation, and that the outcome of these processes resembles the
60
changes taken place in the Vasa wood. However, the experiments on pure compounds under controlled conditions are certainly much less complicated than the situation in the wood. For example, lignin which has not been studied so far, is most probably also exposed to oxidation contributing to the low-molecular acids.
There are some aspects of the importance of oxalic acid in Fenton-type reactions. Considerable amounts of oxalic acid were found in the Vasa wood, which could be a result of radical oxidation as mentioned above. It has also been suggested that the necessary hydrogen peroxide may be produced via autooxidation of iron(II) oxalate at low pH (Hyde & Wood, 1997), a conceivable environment in the Vasa wood. Thus a step-by-step reaction may be in visualised. In the first step iron(II) oxalate undergoes oxidation to iron(III) oxalate forming a superoxide radical (Eq. 8) and in a second step under acidic conditions this radical can be further reduced to hydrogen peroxide (Eq. 9) – the precursor of the Fenton process.
Fe2++O2 → Fe3+ +•O2
- [8] Fe2++ •O2
- +2H+ → Fe3+ + H2O2 [9] Regarding hemicelluloses, the depolymerisation of xylan may be interpreted as a result of both oxidation and hydrolytic processes. The analysis of Fenton-treated holocellulose did not yield any signals of xylan oligomers as observed in the Vasa wood extract by MALDI-TOF MS (Figure 19). One possible explanation is that only a very small part of the xylan was degraded to detectable water-soluble species. Compared to the cellulose in holocellu-lose, the hemicellulose fraction is much less likely (<1/100) to undergo a random chain scission, assuming this process is proportional to the polymer length. However, a radical oxidation of the polysaccharides would give more diverse products with respect to the end groups (Uchiyama et al., 1990), not ending up in pure pentose oligomers with reducing ends. Thus, the presence of (glucurono)xylan oligomers in the Vasa extracts indicates that hydrolysis of the hemicelluloses has taken place, which is also supported by the fact that the observations coincide with the lowest pH values in the wood extracts. The affected MWD in holocellulose reported by Lindfors et al. (2008) was mostly a result of cellulose depolymerisation and the hemi-cellulose was less influenced. However, the preparation of holocellulose prior to the SEC analysis, which includes several treatment steps in aqueous solutions, is likely to remove low molecular oligomers of xylan. Hence, they were not detected in the SEC analysis in contrast to the analysis of wood extracts by NMR and MALDI-TOF MS.
61
Still the distinction between oxidative and hydrolytic degradation remains unanswered. Maybe, the hemicelluloses are less susceptible to oxida-tive degradation compared to cellulose since they are partly embedded in lignin whereas cellulose is organised in microfibrils. Thus, the surrounding lignin may work as a radical scavenger with respect to hemicelluloses decreasing the oxidative effects. In contrast, the cellulose may undergo degradation from radicals that may propagate to wide-spread depolymeris-ation. In a second step the hemicelluloses would be hydrolysed as a result of an overall increased acidity due to the oxidative reactions in the wood.
4.2.3 Antioxidative effects
It can be concluded that the effects of degradation processes are strongly correlated with the presence of iron. These effects also correlate with the depth and they are less pronounced in the surface layers of the wood. In the results presented above there are four major parameters that correlate with this divergence between the surface and deeper regions:
• sulfur content, or iron–sulfur ratio (Figure 22) • degree of oxidized iron indicated by the average iron-oxygen
distance (Figure 28) • PEG content (Table 2) • pH (Figure 22)
Firstly, it is obvious that reduced sulfur compounds may act as radical scavengers, i.e. antioxidants, inhibiting the effects of any radicals formed in processes initiated by iron. The result from SEM-EDS analyses shows that these sulfur compounds are present everywhere in the wood matrix in the surface region, at considerable concentrations. Secondly, an active Fenton-type reaction requires free iron ions to initiate the process. Under more oxidized conditions in the surface region the iron is present in its trivalent state to a higher extent. Iron(III) ions form strong complexes and non-soluble hydroxides. Thus, the initiator of the radical process is inhibited. However, the iron in the surface regions seems to have been oxidized without forming radicals in Fenton-type reactions. This may be explained by the conservation treatment, which introduced PEG in combination with a neutral buffer system. PEG in itself has ion-conducting properties which may enhance diffusion on the wood ultrastructure. In this phase the iron(II) ions were more susceptible to oxidation and formed insoluble hydroxides without formation of radicals. Very high levels of iron compounds were observed in the PEG-filled lumina in the surface region of the wood (see Figure 23). The fact that no depolymerisation of PEG has been observed in the surface region strengthens this hypothesis. However, since the pH values
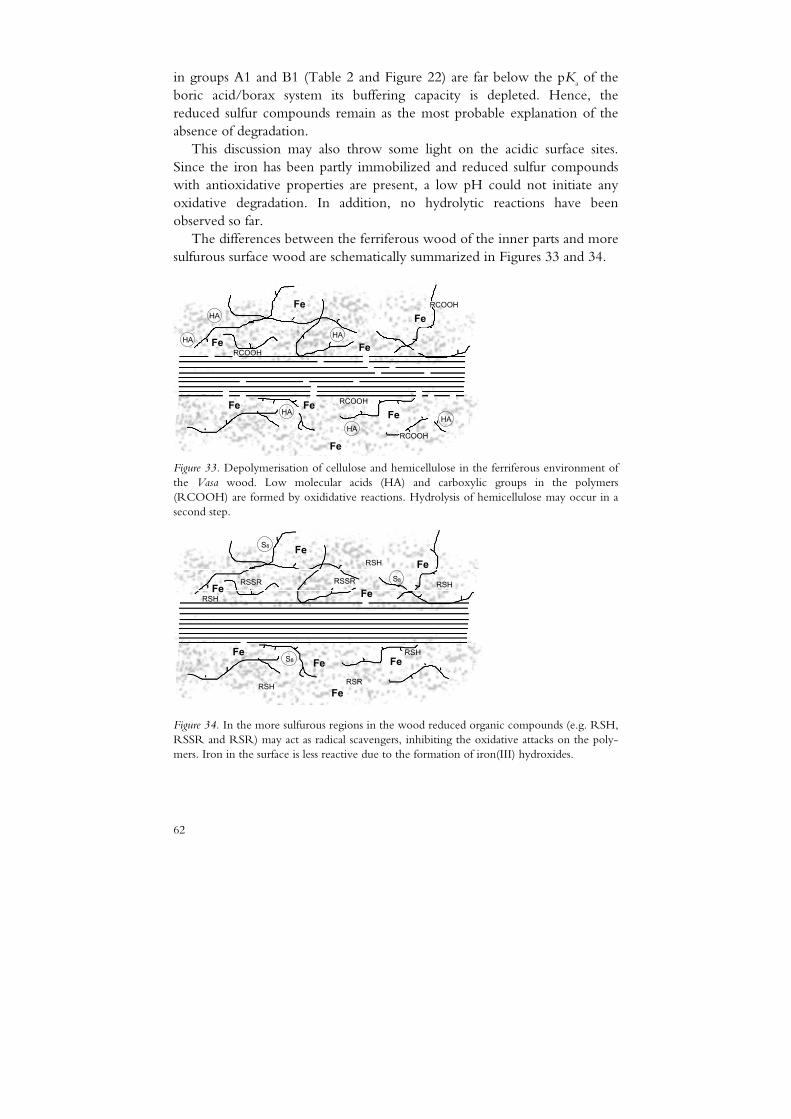
62
in groups A1 and B1 (Table 2 and Figure 22) are far below the pKa of the boric acid/borax system its buffering capacity is depleted. Hence, the reduced sulfur compounds remain as the most probable explanation of the absence of degradation.
This discussion may also throw some light on the acidic surface sites. Since the iron has been partly immobilized and reduced sulfur compounds with antioxidative properties are present, a low pH could not initiate any oxidative degradation. In addition, no hydrolytic reactions have been observed so far.
The differences between the ferriferous wood of the inner parts and more sulfurous surface wood are schematically summarized in Figures 33 and 34.
.
.
.
.
.
.
.
.
.
.
Fe
Fe
Fe
Fe Fe
Fe
Fe
Fe
HA
RCOOHHA
HAHA
HA
HA
RCOOH
RCOOH
RCOOH
Figure 33. Depolymerisation of cellulose and hemicellulose in the ferriferous environment of the Vasa wood. Low molecular acids (HA) and carboxylic groups in the polymers (RCOOH) are formed by oxididative reactions. Hydrolysis of hemicellulose may occur in a second step.
Figure 34. In the more sulfurous regions in the wood reduced organic compounds (e.g. RSH, RSSR and RSR) may act as radical scavengers, inhibiting the oxidative attacks on the poly-mers. Iron in the surface is less reactive due to the formation of iron(III) hydroxides.
.
Fe
Fe
Fe
FeFe
Fe
Fe
Fe
S8
RSH
RSSR
RSH
RSSR RSH
S8
S8
RSR
RSH
RSH
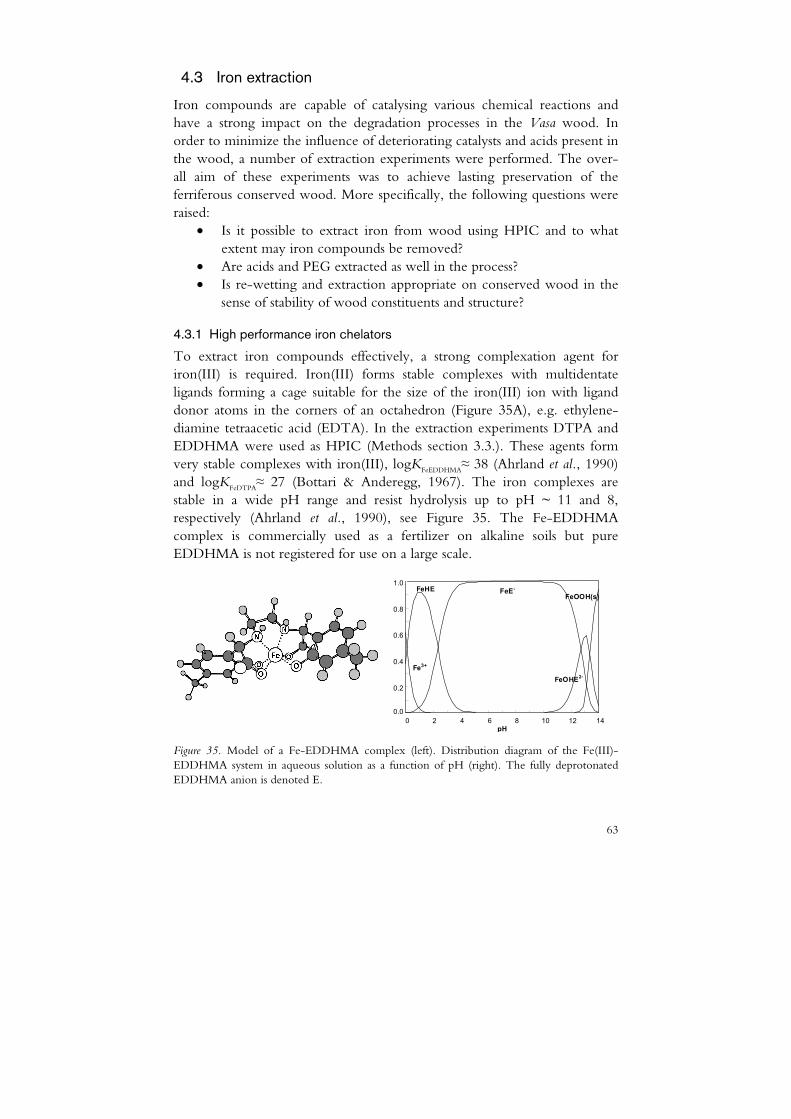
63
4.3 Iron extraction
Iron compounds are capable of catalysing various chemical reactions and have a strong impact on the degradation processes in the Vasa wood. In order to minimize the influence of deteriorating catalysts and acids present in the wood, a number of extraction experiments were performed. The over-all aim of these experiments was to achieve lasting preservation of the ferriferous conserved wood. More specifically, the following questions were raised:
• Is it possible to extract iron from wood using HPIC and to what extent may iron compounds be removed?
• Are acids and PEG extracted as well in the process? • Is re-wetting and extraction appropriate on conserved wood in the
sense of stability of wood constituents and structure?
4.3.1 High performance iron chelators
To extract iron compounds effectively, a strong complexation agent for iron(III) is required. Iron(III) forms stable complexes with multidentate ligands forming a cage suitable for the size of the iron(III) ion with ligand donor atoms in the corners of an octahedron (Figure 35A), e.g. ethylene-diamine tetraacetic acid (EDTA). In the extraction experiments DTPA and EDDHMA were used as HPIC (Methods section 3.3.). These agents form very stable complexes with iron(III), logKFeEDDHMA≈ 38 (Ahrland et al., 1990) and logKFeDTPA≈ 27 (Bottari & Anderegg, 1967). The iron complexes are stable in a wide pH range and resist hydrolysis up to pH ~ 11 and 8, respectively (Ahrland et al., 1990), see Figure 35. The Fe-EDDHMA
complex is commercially used as a fertilizer on alkaline soils but pure EDDHMA is not registered for use on a large scale.
0 2 4 6 8 10 12 14 0.0
0.2
0.4
0.6
0.8
1.0
pH
Fe3+
FeE-
FeOHE2-
FeHEFeOOH(s)
Figure 35. Model of a Fe-EDDHMA complex (left). Distribution diagram of the Fe(III)-EDDHMA system in aqueous solution as a function of pH (right). The fully deprotonated EDDHMA anion is denoted E.
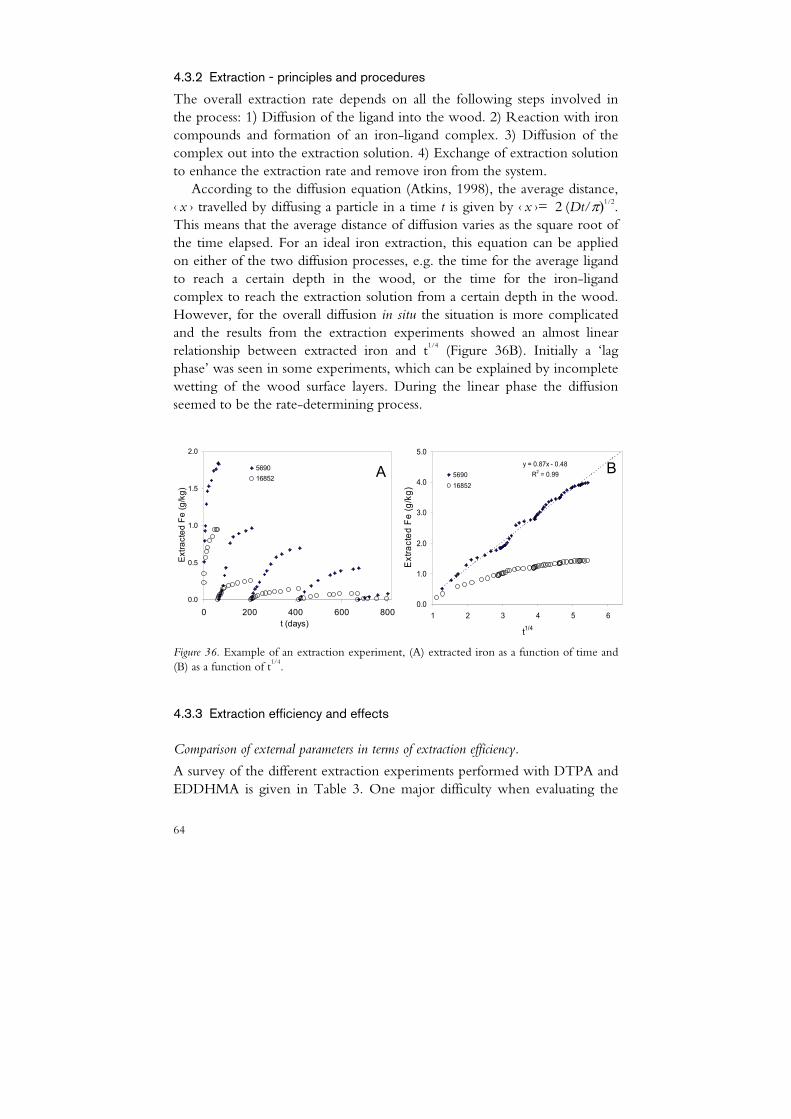
64
4.3.2 Extraction - principles and procedures
The overall extraction rate depends on all the following steps involved in the process: 1) Diffusion of the ligand into the wood. 2) Reaction with iron compounds and formation of an iron-ligand complex. 3) Diffusion of the complex out into the extraction solution. 4) Exchange of extraction solution to enhance the extraction rate and remove iron from the system.
According to the diffusion equation (Atkins, 1998), the average distance, ‹ x › travelled by diffusing a particle in a time t is given by ‹ x ›= 2 (Dt/π)1/2. This means that the average distance of diffusion varies as the square root of the time elapsed. For an ideal iron extraction, this equation can be applied on either of the two diffusion processes, e.g. the time for the average ligand to reach a certain depth in the wood, or the time for the iron-ligand complex to reach the extraction solution from a certain depth in the wood. However, for the overall diffusion in situ the situation is more complicated and the results from the extraction experiments showed an almost linear relationship between extracted iron and t1/4 (Figure 36B). Initially a ‘lag phase’ was seen in some experiments, which can be explained by incomplete wetting of the wood surface layers. During the linear phase the diffusion seemed to be the rate-determining process.
y = 0.87x - 0.48R2 = 0.99
0.0
1.0
2.0
3.0
4.0
5.0
1 2 3 4 5 6
t1/4
Ext
ract
ed F
e (g
/kg)
569016852
0.0
0.5
1.0
1.5
2.0
0 200 400 600 800t (days)
Ext
ract
ed F
e (g
/kg)
569016852 A B
Figure 36. Example of an extraction experiment, (A) extracted iron as a function of time and (B) as a function of t1/4.
4.3.3 Extraction efficiency and effects
Comparison of external parameters in terms of extraction efficiency.
A survey of the different extraction experiments performed with DTPA and EDDHMA is given in Table 3. One major difficulty when evaluating the
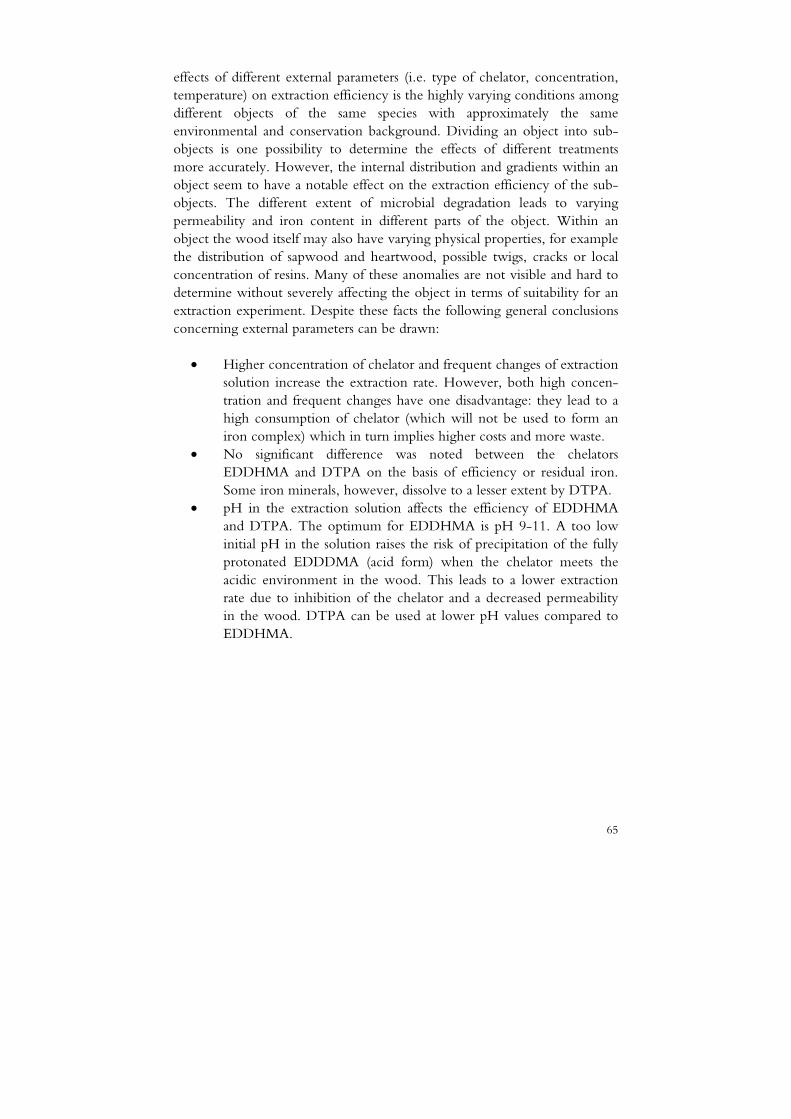
65
effects of different external parameters (i.e. type of chelator, concentration, temperature) on extraction efficiency is the highly varying conditions among different objects of the same species with approximately the same environmental and conservation background. Dividing an object into sub-objects is one possibility to determine the effects of different treatments more accurately. However, the internal distribution and gradients within an object seem to have a notable effect on the extraction efficiency of the sub-objects. The different extent of microbial degradation leads to varying permeability and iron content in different parts of the object. Within an object the wood itself may also have varying physical properties, for example the distribution of sapwood and heartwood, possible twigs, cracks or local concentration of resins. Many of these anomalies are not visible and hard to determine without severely affecting the object in terms of suitability for an extraction experiment. Despite these facts the following general conclusions concerning external parameters can be drawn:
• Higher concentration of chelator and frequent changes of extraction
solution increase the extraction rate. However, both high concen-tration and frequent changes have one disadvantage: they lead to a high consumption of chelator (which will not be used to form an iron complex) which in turn implies higher costs and more waste.
• No significant difference was noted between the chelators EDDHMA and DTPA on the basis of efficiency or residual iron. Some iron minerals, however, dissolve to a lesser extent by DTPA.
• pH in the extraction solution affects the efficiency of EDDHMA and DTPA. The optimum for EDDHMA is pH 9-11. A too low initial pH in the solution raises the risk of precipitation of the fully protonated EDDDMA (acid form) when the chelator meets the acidic environment in the wood. This leads to a lower extraction rate due to inhibition of the chelator and a decreased permeability in the wood. DTPA can be used at lower pH values compared to EDDHMA.
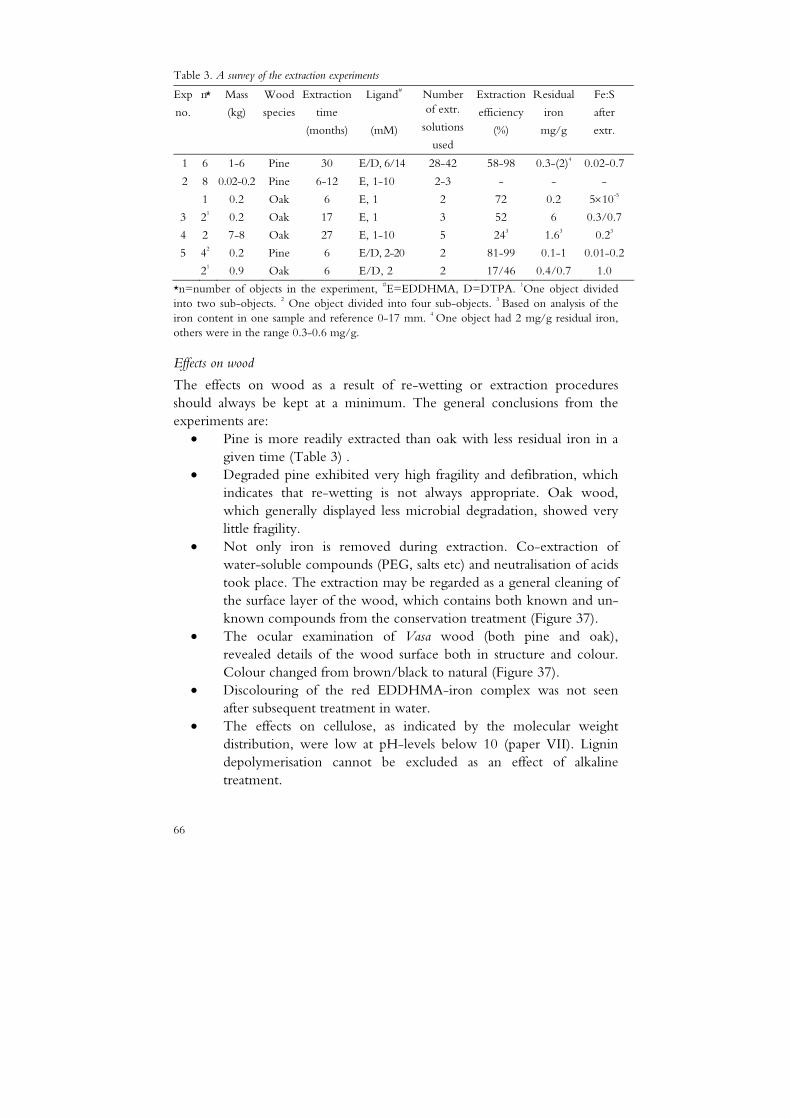
66
Table 3. A survey of the extraction experiments
Exp
no.
n* Mass
(kg)
Wood
species
Extraction
time
(months)
Ligand#
(mM)
Number of extr.
solutions
used
Extraction
efficiency
(%)
Residual
iron
mg/g
Fe:S
after
extr.
1 6 1-6 Pine 30 E/D, 6/14 28-42 58-98 0.3-(2)4 0.02-0.7
2 8
1
0.02-0.2
0.2
Pine
Oak
6-12
6
E, 1-10
E, 1
2-3
2
-
72
-
0.2
-
5×10⁻⁵
3 21 0.2 Oak 17 E, 1 3 52 6 0.3/0.7
4 2 7-8 Oak 27 E, 1-10 5 243 1.63 0.23
5 42
21
0.2
0.9
Pine
Oak
6
6
E/D, 2-20
E/D, 2
2
2
81-99
17/46
0.1-1
0.4/0.7
0.01-0.2
1.0
*n=number of objects in the experiment, #E=EDDHMA, D=DTPA. 1One object divided into two sub-objects. 2 One object divided into four sub-objects. 3 Based on analysis of the iron content in one sample and reference 0-17 mm. 4 One object had 2 mg/g residual iron, others were in the range 0.3-0.6 mg/g.
Effects on wood
The effects on wood as a result of re-wetting or extraction procedures should always be kept at a minimum. The general conclusions from the experiments are:
• Pine is more readily extracted than oak with less residual iron in a given time (Table 3) .
• Degraded pine exhibited very high fragility and defibration, which indicates that re-wetting is not always appropriate. Oak wood, which generally displayed less microbial degradation, showed very little fragility.
• Not only iron is removed during extraction. Co-extraction of water-soluble compounds (PEG, salts etc) and neutralisation of acids took place. The extraction may be regarded as a general cleaning of the surface layer of the wood, which contains both known and un-known compounds from the conservation treatment (Figure 37).
• The ocular examination of Vasa wood (both pine and oak), revealed details of the wood surface both in structure and colour. Colour changed from brown/black to natural (Figure 37).
• Discolouring of the red EDDHMA-iron complex was not seen after subsequent treatment in water.
• The effects on cellulose, as indicated by the molecular weight distribution, were low at pH-levels below 10 (paper VII). Lignin depolymerisation cannot be excluded as an effect of alkaline treatment.
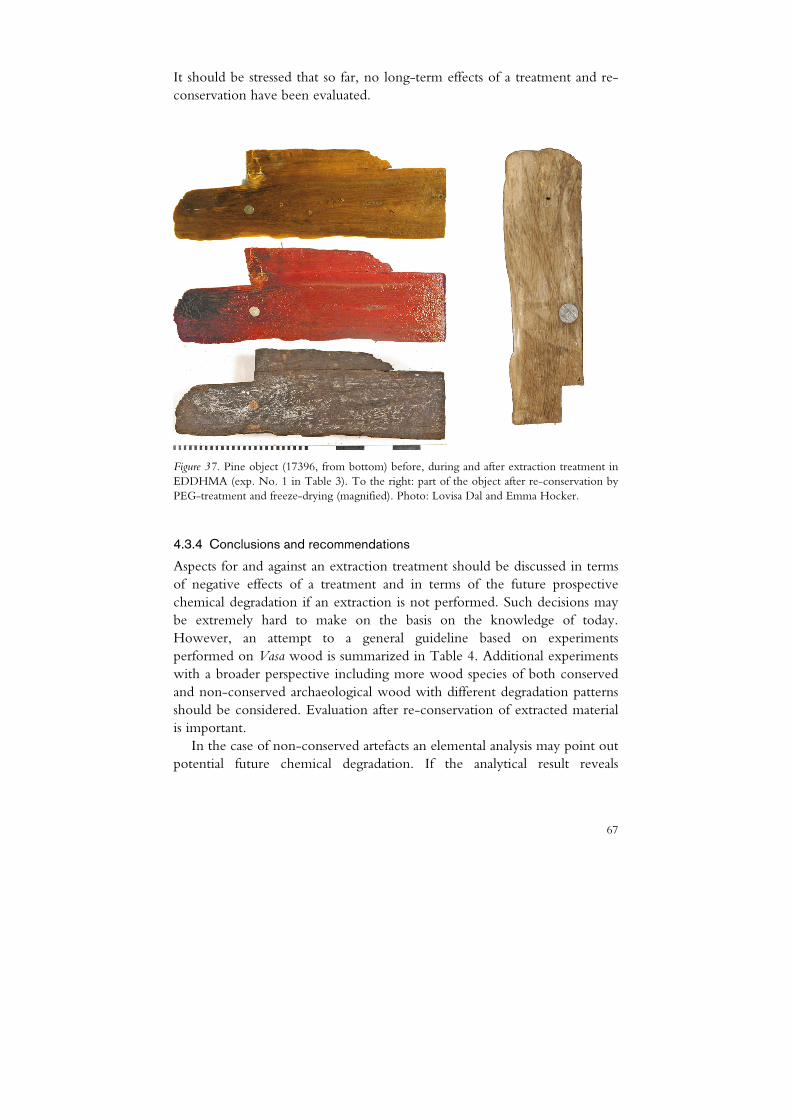
67
It should be stressed that so far, no long-term effects of a treatment and re-conservation have been evaluated.
Figure 37. Pine object (17396, from bottom) before, during and after extraction treatment in EDDHMA (exp. No. 1 in Table 3). To the right: part of the object after re-conservation by PEG-treatment and freeze-drying (magnified). Photo: Lovisa Dal and Emma Hocker.
4.3.4 Conclusions and recommendations
Aspects for and against an extraction treatment should be discussed in terms of negative effects of a treatment and in terms of the future prospective chemical degradation if an extraction is not performed. Such decisions may be extremely hard to make on the basis on the knowledge of today. However, an attempt to a general guideline based on experiments performed on Vasa wood is summarized in Table 4. Additional experiments with a broader perspective including more wood species of both conserved and non-conserved archaeological wood with different degradation patterns should be considered. Evaluation after re-conservation of extracted material is important.
In the case of non-conserved artefacts an elemental analysis may point out potential future chemical degradation. If the analytical result reveals
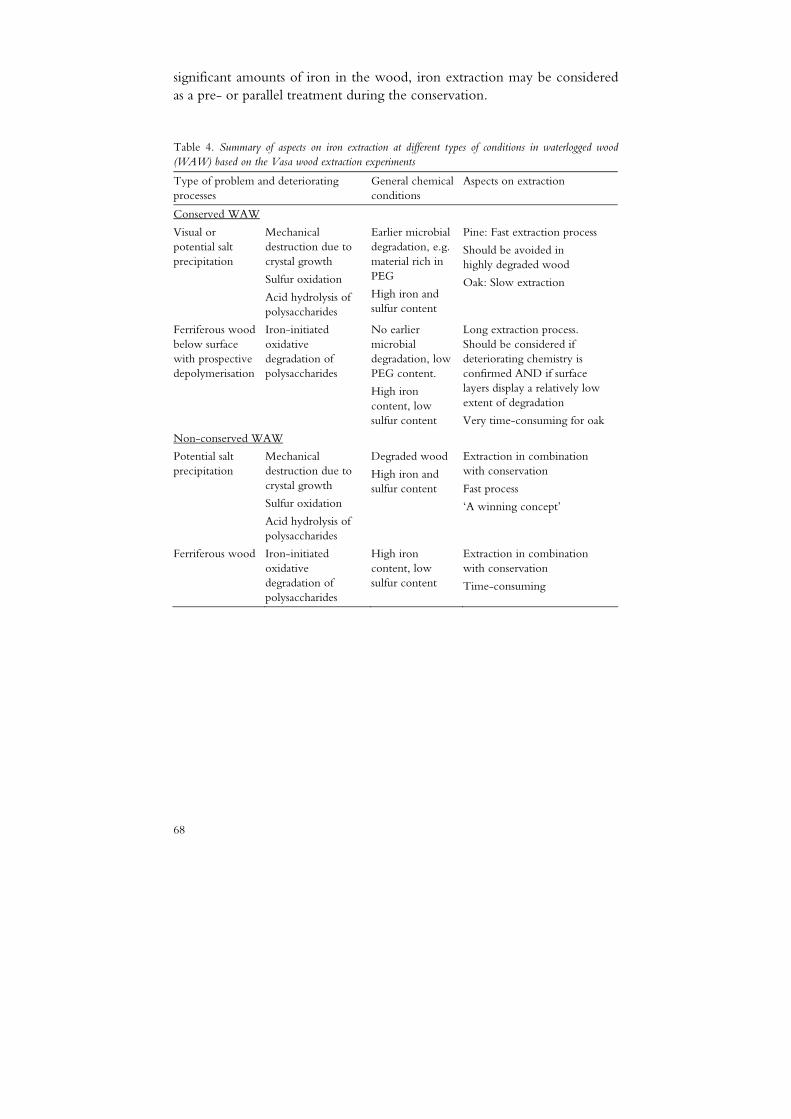
68
significant amounts of iron in the wood, iron extraction may be considered as a pre- or parallel treatment during the conservation.
Table 4. Summary of aspects on iron extraction at different types of conditions in waterlogged wood (WAW) based on the Vasa wood extraction experiments
Type of problem and deteriorating processes
General chemical conditions
Aspects on extraction
Conserved WAW
Visual or potential salt precipitation
Mechanical destruction due to crystal growth
Sulfur oxidation
Acid hydrolysis of polysaccharides
Earlier microbial degradation, e.g. material rich in PEG
High iron and sulfur content
Pine: Fast extraction process
Should be avoided in highly degraded wood
Oak: Slow extraction
Ferriferous wood below surface with prospective depolymerisation
Iron-initiated oxidative degradation of polysaccharides
No earlier microbial degradation, low PEG content.
High iron content, low sulfur content
Long extraction process. Should be considered if deteriorating chemistry is confirmed AND if surface layers display a relatively low extent of degradation
Very time-consuming for oak
Non-conserved WAW
Potential salt precipitation
Mechanical destruction due to crystal growth
Sulfur oxidation
Acid hydrolysis of polysaccharides
Degraded wood
High iron and sulfur content
Extraction in combination with conservation
Fast process
‘A winning concept’
Ferriferous wood Iron-initiated oxidative degradation of polysaccharides
High iron content, low sulfur content
Extraction in combination with conservation
Time-consuming
69
5 Future perspectives
5.1 Degradation in a historical perspective
This study and the analytical work performed by other scientists have established the fact that chemical degradation of Vasa wood has taken place at several sites and that the presence of iron compounds promotes oxidative processes. However, we can only speculate on the current rates of the processes. Thus, there is still need for more research.
One way to illustrate the chemistry of the Vasa wood is to place the different conditions from a historical perspective into a generalized oxygen-water diagram (Figure 38). Water and atmospheric oxygen constitute the two most important external factors in the long-term preservation, which are possible to handle. They both act as chemical reactants. In addition, water is a carrier of chemical reactants and products in the wood matrix, and oxygen is the driving force in the current processes initiated by the iron compounds. Thus, Figure 38 may serve as a reference for connecting the processes described in chapters 2 and 4 with the historical context.
The future direction of the climate – indicated with question marks - can be seen as a contribution to the discussion concerning the future preserva-tion of the ship. There are several aspects of these questions depending on the time-perspective. As long as the humidity is kept at levels that ensure a negligible microbial activity, the aspects are mostly a matter of chemical and mechanical stability. The mechanical stability as a function of the water content with the implications on shrinkage and development of cracks in archaeological wood are fairly well-known (Schniewind, 1990) and experi-ments have been performed on the Vasa wood (Ljungdahl & Berglund, 2007). In contrast, very little is known what impact the chemical degradation of the wood polymers and PEG have on the mechanical
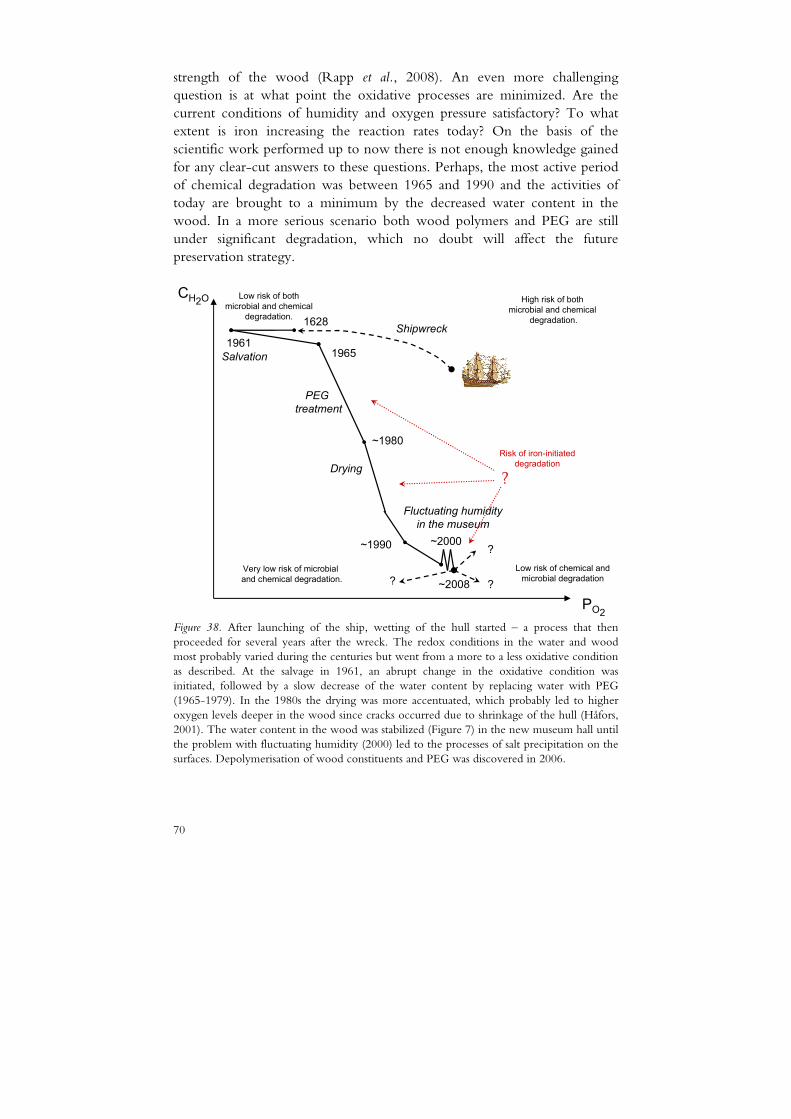
70
strength of the wood (Rapp et al., 2008). An even more challenging question is at what point the oxidative processes are minimized. Are the current conditions of humidity and oxygen pressure satisfactory? To what extent is iron increasing the reaction rates today? On the basis of the scientific work performed up to now there is not enough knowledge gained for any clear-cut answers to these questions. Perhaps, the most active period of chemical degradation was between 1965 and 1990 and the activities of today are brought to a minimum by the decreased water content in the wood. In a more serious scenario both wood polymers and PEG are still under significant degradation, which no doubt will affect the future preservation strategy.
CH2O
PO2
PEG treatment
Drying
Fluctuating humidityin the museum
?
?
?
1628
19611965
~1980
~1990
~2008
~2000
Salvation
High risk of both microbial and chemical
degradation.
Very low risk of microbialand chemical degradation.
Low risk of chemical andmicrobial degradation
Low risk of bothmicrobial and chemical
degradation.Shipwreck
Risk of iron-initiated degradation
?
Figure 38. After launching of the ship, wetting of the hull started – a process that then proceeded for several years after the wreck. The redox conditions in the water and wood most probably varied during the centuries but went from a more to a less oxidative condition as described. At the salvage in 1961, an abrupt change in the oxidative condition was initiated, followed by a slow decrease of the water content by replacing water with PEG (1965-1979). In the 1980s the drying was more accentuated, which probably led to higher oxygen levels deeper in the wood since cracks occurred due to shrinkage of the hull (Håfors, 2001). The water content in the wood was stabilized (Figure 7) in the new museum hall until the problem with fluctuating humidity (2000) led to the processes of salt precipitation on the surfaces. Depolymerisation of wood constituents and PEG was discovered in 2006.
71
5.2 Implications for preservation of waterlogged wood
The analytical results presented in this thesis, which are summarized in Figure 39, emphasize the need for appropriate chemical analysis in addition to traditional analyses when degradation patterns are identified in conserved waterlogged wood. This is also true - and maybe even more important - for waterlogged wood planned to be excavated.
An analytical record of the elemental content of the wood with the focus on iron and sulfur is most important. If the result shows significant amounts of iron in the wood (>1 mg/g), iron extraction with HPIC could be considered. Such a process could be performed as a pre-treatment or simultaneous treatment during the conservation procedures. There is need for more research and tests to develop such methods in the field of conservation.
On conserved wood artefacts, additional analyses are highly informative. Firstly, pH-measurements can be performed on aqueous extracts of wood samples. Low pH values in combination with significant amounts of iron indicate the presence of chemical degradation processes as described in 4.1.4. Secondly, mass spectrometry (MALDI-TOF), NMR or other methods could be employed to evaluate the status of PEG and wood constituents. However, even if these analytical results point out active or potential degradation - as in the case of the Vasa – there are still no absolute solutions to deal with the degradation processes.

72
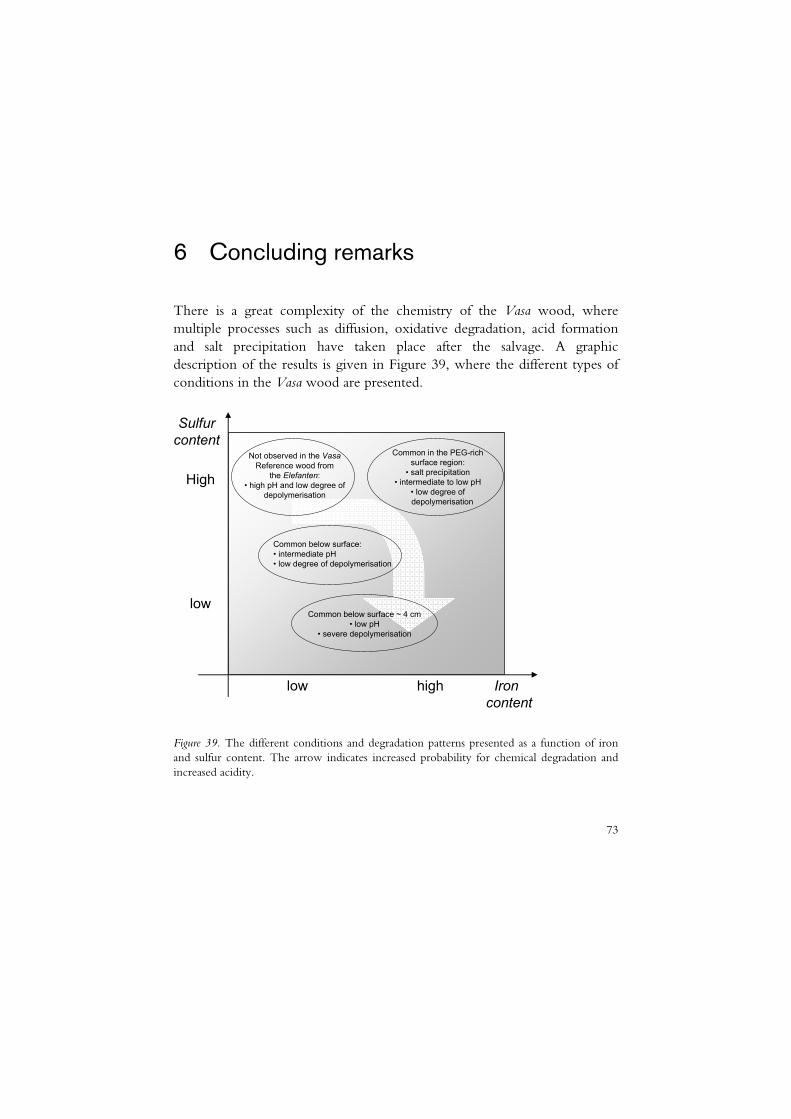
73
6 Concluding remarks
There is a great complexity of the chemistry of the Vasa wood, where multiple processes such as diffusion, oxidative degradation, acid formation and salt precipitation have taken place after the salvage. A graphic description of the results is given in Figure 39, where the different types of conditions in the Vasa wood are presented.
low high Ironcontent
Common in the PEG-rich surface region:
• salt precipitation• intermediate to low pH
• low degree ofdepolymerisation
Sulfurcontent
High
lowCommon below surface ~ 4 cm
• low pH• severe depolymerisation
Common below surface: • intermediate pH• low degree of depolymerisation
Not observed in the VasaReference wood from
the Elefanten: • high pH and low degree of
depolymerisation
Figure 39. The different conditions and degradation patterns presented as a function of iron and sulfur content. The arrow indicates increased probability for chemical degradation and increased acidity.
74
These are the major conclusions reached in this thesis: • The acidity in the Vasa wood is mainly caused by low molecular
acids, i.e. acetic, formic, glycolic and oxalic acid. • The elemental content of iron and sulfur are highest in the surface
region. However, below the surface the iron content is relatively high (1-10 mg/g), while the sulfur levels are close to the natural (~0.1 mg/g).
• The pH in the wood, with the exception of wood close to salt precipitation, correlates with the iron-sulfur ratio.
• Depolymerised PEG and hemicellulose are found in wood samples with a high iron-sulfur ratio and low pH, typically located in the inner parts of the wood.
• The presence of iron(II) ions may initiate Fenton-type reactions leading to oxidative degradation of wood polymers and PEG.
• Reduced sulfur compounds bound to lignin or other wood polymers may act as radical scavengers, i.e. antioxidants.
• The sulfur species formed after oxidation (e.g. sulfoxide, sulfon, sulfonate) remain bound to the wood polymers.
• A number of advanced spectroscopic and analytical methods are required to investigate a complex matrix such as the Vasa wood.
• Extraction with complexing agents can remove substantial parts of the iron compounds in wood artefacts. The extraction process is time-consuming but regenerates the appearance of the wood concerning colour and surface texture. However, the long-term effects of the chemical treatment are not evaluated.
75
7 Sammanfattning
Det kemiska tillståndet i träet i regalskeppet Vasa visar på en komplex miljö, som är kraftigt påverkad av de biologiska och kemiska processer skrovet utsatts för under tiden i vattnet (1628-1961), under konserveringsperioden (1962-1989) och därefter i den moderna museimiljön. Järn- och svavelföreningar (totalt 5-10 ton) har införlivats i träet genom naturliga processer under den tid skeppet låg på bottnen i Stockholms hamn. Vid den efterföljande konserveringen behandlades träet med stora mängder polyetylenglykol (PEG) och fungicider.
Resultaten av de analyser som presenteras i denna avhandling visar att de kemiska nedbrytningsprocesserna har pågått och fortfarande pågår allt sedan Vasa bärgades. Nedbruten (depolymeriserad) hemicellulosa och PEG påvisa-des med NMR-analys och masspektrometri. Förändringarna är korrelerade till förhöjda halter av glykolsyra, myrsyra, oxalsyra och till höga järn-svavelkvoter i träet. De högsta halterna av myrsyra återfanns främst på platser där PEG- nedbrytning observerades.
Statistiska simuleringar av PEG-nedbrytning och modellförsök av PEG och polysackarider gör det troligt att nedbrytningen i träet initieras av reaktiva oxiderande radikaler bildade i så kallade Fenton-reaktioner.
Analyser med elektronmikroskopi visar på stora skillnader mellan träytan och djupare områden. Ytträ i områden med tidigare mikrobiell nedbrytning (ned till 5 mm djup) karakteriseras av många partiklar av olika typer och storlekar (gips, elementärt svavel, järn- och svavelföreningar) i den PEG-rika miljön. Under ytan är träet mer homogent och innehåller färre partiklar och har även en lägre svavelhalt. I träprover som uppvisar kemisk nedbrytning och lågt pH observerades järnrika beläggningar i cellernas lumina och även partiklar (10-100 nm) med högt järninnehåll (1-10 atom%) i cellväggarna.
Röntgenabsorptionsspektroskopi (EXAFS) visar att järnet i träet före-ligger i sina båda oxidationstillstånd, dels som hydratiserade järn(II)joner, dels
76
som mer svårlösliga järn(III)föreningar. Analyser med XANES-metoden på extraherat trämaterial visar att reducerade och intermediärt oxiderade organiska svavelföreningar är bundna till olösliga makromolekyler.
Slutsatsen är att nedbrytningsprocesserna är initierade av reaktioner med järn i de svavelfattiga områdena i det inre träet. Vid relativt höga halter av svavel blir dock nedbrytningen och syrabildningen mindre omfattande. Detta tyder på att de reducerade organiska svavelföreningarna motverkar oxidation och nedbrytning av vedpolymerer och PEG och därmed verkar som antioxidanter.
Fullskaliga extraktionsförsök på konserverat material från Vasa visar att det är möjligt att ta bort järnföreningarna men att detta är tidskrävande. I processen extraheras även andra vattenlösliga föreningar och syror neutraliseras. Metoden kan med framgång användas på mindre föremål och även utvecklas för behandling och konservering av vattendränkt arkeologiskt trä. Effekten av extraktionsbehandlingen på cellulosa undersöktes, men relativt små förändringar av träet kunde observeras.
77
8 Acknowledgements
This work was performed within the National Maritime Museums of Sweden research project “Save the Vasa” sponsored by The Bank of Sweden Tercentenary Foundation, The Swedish National Heritage Board, The Swedish Foundation for Strategic Research (SSF), The Swedish Research Council for Environment, Agricultural Sciences and Spatial Planning (FORMAS), and The Swedish Agency for Innovation Systems (Vinnova). Prof. em. Lars Ivar Elding and doc. Björn Warenius at the National Maritime Museums are acknowledged for coordinating the project.
The main part of the work presented in this thesis has been performed at the Department of Chemistry at SLU. Prof. Lennart Kenne and prof. Ingmar Persson, current and former heads of the department, are acknowledged for putting instruments and other facilities at my disposal. However, essential parts of the work have also been performed at other institutions. Thanks are due to:
Doc. Mikael Lindström and STFI-Packforsk AB, Stockholm, Sweden for welcoming me to his group and to the analysis of holocellulose.
Dr Stefan Gunnarsson at the microscopy unit at Evolutionary Biology Centre, Uppsala University, for introducing me to the world of electron microscopy.
MAX-lab synchrotron radiation source, Lund University, Sweden for allocation of beam-time and Dr Stefan Carlson, manager at beamline I811 for support. Funding for the beamline I811 project was kindly provided by The Swedish Research Council and The Knut och Alice Wallenbergs Stiftelse.
Prof. Thomas Nilsson and Dr Charlotte Björdal, SP-Trätek, Stockholm, Sweden/Department of Forest Products, SLU for cooperation and coordinating the wood project.
78
Stefan Fritjofsson, Rexolin Akzo Nobel AB, Kumla, Sweden is acknowledged for the support by chemicals to the iron extraction project.
A prerequisite for the analytical work and this thesis is all the samples brought to my disposal. Emma Hocker, Ove Olsen, Lovisa Dal, Sofie Nyqvist, Malin Sahlstedt and Ingrid Hall-Roth at the Vasa museum, are all acknowledged for kind cooperation, sampling and keeping order in the records.
Det är nu 18 år sedan jag kom i kontakt med min handledare prof. Ingmar Persson. Jag har sett Ingmar i mina olika roller som student, byråkrat och doktorand, och ända från första stund har jag varit fascinerad över hans stora energi, kunskap och uthållighet. Jag är tacksam för hans stöd, allt jag har fått lära mig och den stora frihet jag fått uppleva under min tid med Ingmar.
Tack, alla nuvarande och för detta kollegor vid institutionen! Ni har
bidragit till min avhandling genom det goda arbetsklimatet, trevliga fikastunder, vetenskapliga idéer och tuffa innebandymatcher. Ni är för många för att kunna nämnas vid namn och jag skulle helt säkert glömma någon. Ett särskilt tack vill jag dock rikta till:
• Min biträdande handledare Anders Broberg för all hjälp. • Jan Eriksson, Susanna Broberg och Suresh Gohil som introducerade
mig i masspektrometrins teori och praktik. • Rolf Andersson och Corine Sandström, för all hjälp med NMR-
experiment och svar på alla “dumma” frågor. Ni har varit ovärderliga!
• Lena Johansson och Bernt Andersson för trevnad, administration och gott samarbete på kurslab.
• Mina rumskamrater: Daniel, Gerald, Anton, Natallia, Johann och Kaj. • Lennart Kenne för många diskussioner och för att jag fick ett rum
för mig själv den sista tiden. Jag tackar Lars Ivar Elding, Thomas Nilsson, Jan Eriksson och Tommy Iversen för synpunkter på avhandlingen. Ett särskilt tack till Kerstin Almkvist för en engagerad och noggrann språkgranskning.
Jag vill också tacka: Birgitta Håfors för hjälp med analysprotokoll från arkiven och till Per Almkvist för mödosamt sammanställande av uppgifterna. Karin Hellbom, Anders Uhlin, Gunilla Hallberg för analytiska insatser. Andrey Pranovich för generositet och engagemang under mitt COST-
79
besök, Вы - аккуратный ученый! Magnus Sandström för att jag fick uppleva ESRF och Grenoble. EvaLisa Lindfors, för intensiva och lärorika dagar och för dina visdomsord ”att doktorera är att administrera sin doktorandtid” – det ligger mycket i det. Kollegorna vid mikrobiologen (Maria, Åsa, Mikael m.fl.) under vår tid på GC. Thomas, Lotte, Emma, Yvonne, Emiliana, Mikael, Magnus, Finn och många andra som har bidragit till trevligt sällskap i samband med konferenser och möten.
Mina föräldrar och svärföräldrar har ställt upp i vått och torrt. Ett stort
tack till Berit och Birgitta, för praktisk hjälp med barnen, utan er hade det varit svårt att ro detta i land!
Mina älskade flickor Hulda och Brita, tack för all glädje ni ger mig - det har aldrig varit svårt att prioritera mellan er och arbetet, inte förrän de sista månaderna. Slutligen, Margareta, tack för din kärlek och för ditt intensiva stöd speciellt under slutfasen. Du har under hela resan stått vid min sida och gett mig uppmuntran och goda råd i stort och smått.

80
81
9 References
Ahrland, S., Dahlgren, Å. & Persson, I. (1990). Stabilities and hydrolysis of some iron(III) and manganese(III) complexes with chelating ligands. Acta Agriculturae Scandinavica 40(2), 101-111.
Amels, P., Elias, H. & Wannowius, K.J. (1997). Kinetics and mechanism of the oxidation of dimethyl sulfide by hydroperoxides in aqueous medium study on the potential contribution of liquid-phase oxidation of dimethyl sulfide in the atmosphere. Journal of the Chemical Society, Faraday Transactions 93(15), 2537-2544.
Ander, P. & Daniel, G. (2004). Effects of HCl, cellulase and sulphuric acid on dislocation in wood and wood fibres. 2nd Int. Symp. Wood Machining. Vienna.
Atkins, P.W. (1998). Physical chemistry. 6th edition. New York: W.H. Freeman & Company. Barry, J.P., Carton, W.J., Pesci, K.M., Anselmo, R.T., Radtke, D.R. & Evans, J.V. (1997).
Derivatization of low molecular weight polymers for characterization by matrix-assisted laser desorption/ionization time-of-flight mass spectrometry. Rapid Communications in Mass Spectrometry 11(5), 437-442.
Bednar, H. & Fengel, D. (1974). Physical, chemical, and structural properties of recent and subfossil oak wood. Holz Als Roh-Und Werkstoff 32, 99-107.
Berggren, R. (2003). Cellulose degradation in pulp fibers studied as changes in molar mass distributions. Diss. Royal Institute of Technology. Stockholm, Sweden.
Berggren, R., Berthold, F., Sjöholm, E. & Lindström, M. (2003). Improved methods for evaluating the molar mass distributions of cellulose in Kraft pulp. Journal of Applied Polymer Science 88(5), 1170-1179.
Bertaud, F., Sundberg, A. & Holmbom, B. (2002). Evaluation of acid methanolysis for analysis of wood hemicelluloses and pectins. Carbohydrate Polymers 48(3), 319-324.
Björdal, C. (2000). Waterlogged archaeological wood, biodegradation and its implications for conservation. Diss. Swedish University of Agricultural Sciences. Uppsala, Sweden.
Björdal, C.G., Daniel, G. & Nilsson, T. (2000). Depth of burial, an important factor in controlling bacterial decay of waterlogged archaeological poles. International Biodeterioration & Biodegradation 45(1-2), 15-26.
Björdal, C.G. & Nilsson, T. (2007). Outline and results from the "Vasa Wood Project" with emphasis on the microscopic investigations. In: Hoffmann, P. (Ed.) Proceedings of the 10th ICOM Group on Wet Organic Archaeological Materials Conference, Amsterdam 2007. In press.
82
Borgin, K., Parameswaran, N. & Liese, W. (1975). The effects of aging on the ultrastructure of wood. Wood Sciencea and Technology 9, 87-98.
Bottari, E. & Anderegg, G. (1967). Complexones 42. study of 1-1 complexes of some trivalent and tetravalent metal Ions with polyaminocarboxylates using redox measurements. Helvetica Chimica Acta 50(8), 2349-2356.
Bruce, P.G. & Vincent, C.A. (1993). Polymer electrolytes. Journal of the Chemical Society, Faraday Transactions 89(17), 3187-3203.
C.S.D. (2007). Cambridge Structural Database, http://www.ccdc.cam.ac.uk/products/csd/. Cambridge Crystallographic Data Centre, Cambridge, UK.
Doussot, F., De Jeso, B., Quideau, S. & Pardon, P. (2002). Extractives content in cooperage oak wood during natural seasoning and toasting; Influence of tree species, geographic location, and single-tree effects. Journal of Agricultural and food chemistry 50(21), 5955-5961.
Dunford, H.B. (2002). Oxidations of iron(II)/(III) by hydrogen peroxide: from aquo to enzyme. Coordination Chemistry Reviews 233-234, 311-318.
Eaton, R.A. & Hale, M.D.C. (1993). Wood: decay, pests, and protection. London: Chapman & Hall.
Fengel, D. (1991). Aging and fossilization of wood and its components. Wood Science and Technology 25(3), 153-177.
Fengel, D. & Wegener, G. (1984). Wood: chemistry, ultrastructure, reactions. Berlin: Walter de Gruyter.
Fenton, H.J.H. (1894). LXXIII.—Oxidation of tartaric acid in presence of iron. Journal of the Chemical Society, Transactions 65, 899-910.
Fors, Y. (2008). Sulfur-related conservation concerns for maine archaelogical wood. The origin, speciation and distribution of accumulated sulfur with some remedies for the Vasa. Diss. Department of Physical, Inorganic and Structrural Chemistry, Stockholm University, Sweden.
Fors, Y., Nilsson, T., Damian Risberg, E., Sandström, M. & Torssander, P. (2008). Sulfur Accumulation in Pine Wood (Pinus sylvestris) Induced by Bacteria in Simulated Seabed Environment: Implications for Marine Archaeological Wood and Fossil Fuels. International Biodeterioration & Biodegradation, in press.
Fors, Y. & Sandström, M. (2006). Sulfur and iron in shipwrecks cause conservation concerns. Chemical Society Reviews 35(5), 399-415.
Hanton, S.D. (2001). Mass spectrometry of polymers and polymer surfaces. Chemical Reviews 101(2), 527-569.
Hyde, S.M. & Wood, P.M. (1997). A mechanism for production of hydroxyl radicals by the brown-rot fungus Coniophora puteana: Fe(III) reduction by cellobiose dehydrogenase and Fe(II) oxidation at a distance from the hyphae. Microbiology-UK 143, 259-266.
Håfors, B. (1990). The role of the Wasa in the development of the polyethylene glycol preservation method. In: Rowell, R.M., et al. (Eds.) Archaeological wood: properties, chemistry, and preservation Washington, D.C.: American chemical society, Ser. no. 225. p. 195-216.
Håfors, B. (2001). Conservation of the swedish warship Vasa from 1628. Stockholm: The Vasa Museum. (Vasastudier 18).
83
ICSD (2008). Inorganic Crystal Structure Data Base; http://icsdweb.fiz-karlsruhe.de/. National Institute of Standards and Technology, Fachinformationszentrum, Karlsruhe.
Iiyama, K. & Wallis, A.F.A. (1989). Studies of degradation in ancient woods - ultra mild acid-hydrolysis of wood polysaccharides. Cellulose Chemistry And Technology 23(5), 513-521.
Jalilehvand, F. (2000). Structure of hydrated ions and cyano complexes by x-ray absorption spectroscopy. Diss. Royal Institute of Technology, Stockholm, Sweden.
Jalilehvand, F. (2006). Sulfur: not a "silent" element any more. Chemical Society Reviews 35(12), 1256-1268.
Johansson, E.E. & Lind, J. (2005). Free radical mediated cellulose degradation during high consistency ozonation. Journal of Wood Chemistry and Technology 25(3), 171-186.
Jung, B. & Roffael, E. (2002). On the acidity of wood from indigenous trees. Holz Als Roh-Und Werkstoff 60(2), 154-154.
Kawai, F. (2002). Microbial degradation of polyethers. Applied Microbiology and Biotechnology 58(1), 30-38.
Kerem, Z., Bao, W.L. & Hammel, K.E. (1998). Rapid polyether cleavage via extracellular one-electron oxidation by a brown-rot basidioemycete. Proceedings of the national academy of sciences of the united states of America 95(18), 10373-10377.
Kerem, Z., Jensen, K.A. & Hammel, K.E. (1999). Biodegradative mechanism of the brown rot basidiomycete Gloeophyllum trabeum: evidence for an extracellular hydroquinone-driven fenton reaction. FEBS Letters 446(1), 49-54.
Koenigs, J.W. (1974). Hydrogen peroxide and iron: a proposed system for decomposition of wood by brown-rot basidiomycetes. Wood Fiber Science 6, 66–80.
Kohdzuma, Y., Minato, K., Katayama, Y. & Okamura, K. (1991). Preparation of artificial waterlogged wood II. Comparison of some characteristics of wood degraded by Fenton's reagent with those of waterlogged wood. Mokuzai Gakkaishi 37(5), 473-480.
Lathe, G.H. & Ruthven, C.R.J. (1956). Separation of substances and estimation of their relative molecular sizes by the use of columns of starch in water. Biochemical Journal 62(4), 665-674.
Lindfors, E.-L., Iversen, T. & Lindström, M. (2008). Polysaccharide degradation in water-logged oak wood from the ancient warship Vasa. Holzforschung 62(1), 57-63.
Ljungdahl, J. & Berglund, L.A. (2007). Transverse mechanical behaviour and moisture absorption of waterlogged archaeological wood from the Vasa ship. Holzforschung 61(3), 279-284.
Lowson, R.T. (1982). Aqueous oxidation of pyrite by molecular oxygen. Chemical Reviews 82(5), 461-497.
Luetzow, A.E. & Theander, O. (1974). 6-Aldehydocelluloses - thermal instability, beta-elimination and acid-hydrolysis. Svensk Papperstidning-Nordisk Cellulosa 77(9), 312-318.
Lundberg, W.O. (1961). Autoxidation and antioxidants. New York; London: Interscience Publishers.
MacLeod, I.D. & Kenna, C. (1990). Degradation of archaeological timbers by pyrite: oxidation of iron and sulphur species. In: Hoffmann, P. (Ed.) Proceedings of the 4th ICOM Group on Wet Organic Archaeological Materials Conference p. 133-142.
84
Mkhatresh, O.A. & Heatley, F. (2004). A study of the products and mechanism of the thermal oxidative degradation of poly(ethylene oxide) using H-1 and C-13 1-D and 2-D NMR. Polymer International 53(9), 1336-1342.
Montaudo, G., Montaudo, M.S., Puglisi, C. & Samperi, F. (1995). Characterization of polymers by natrix-assisted laser-desorption ionization time-of-flight mass-spectrometry - molecular-weight estimates in samples of varying polydispersity. Rapid Communications in Mass Spectrometry 9(5), 453-460.
Morlat, S. & Gardette, J.L. (2003). Phototransformation of water-soluble polymers. Part II: photooxidation of poly (ethylene oxide) in aqueous solution. Polymer 44(26), 7891-7897.
Nimz, H. (1974). Beech Lignin - Proposal of a Constitutional Scheme. Angewandte Chemie International Edition in English 13(5), 313-321.
Oae, S. (1991). Organic Sulfur Chemistry: Structure and Mechanism. Boca Raton: CRC Press. Pang, K.-L., Eaton, R.A. & Mitchell, J. (2004). 2nd Interim Report within 'Save the Vasa'-
project: Molecular identification of bacteria and moisture content determination in the wood of the Vasa. School of Biological Sciences, University of Portsmouth, UK.
Parees, D.M., Hanton, S.D., Clark, P.A.C. & Willcox, D.A. (1998). Comparison of mass spectrometric techniques for generating molecular weight information on a class of ethoxylated oligomers. Journal of the American Society for Mass Spectrometry 9(4), 282-291.
Pauli, G.F., Jaki, B.U. & Lankin, D.C. (2005). Quantitative H-1 NMR: Development and potential of a method for natural products analysis. Journal of Natural Products 68(1), 133-149.
Potthast, A., Rosenau, T. & Kosma, P. (2006). Analysis of oxidized functionalities in cellulose. In: Polysaccharides II. (Advances in Polymer Science 205). p. 1-48.
Rapp, A.O., Brischke, C., Welzbacher, C.R., Nilsson, T. & Björdal, C. (2008). Mechanical strength of wood from the Vasa shipwreck. 39th annual meeting. Istanbul, Turkey: The International Research Group on Wood Protection. Document No. IRG/WP/08-20381.
Sandström, M., Fors, Y. & Persson, I. (2003). The Vasa’s New Battle – Sulphur, Acid and Iron. Stockholm Vasamuseet (Vasastudier 19).
Sandström, M., Jalilehvand, F., Damian, E., Fors, Y., Gelius, U., Jones, M. & Salome, M. (2005). Sulfur accumulation in the timbers of King Henry VIII's warship Mary Rose: A pathway in the sulfur cycle of conservation concern. Proceedings of the National Academy of Sciences of the United States of America 102(40), 14165-14170.
Sandström, M., Jalilehvand, F., Persson, I., Gelius, U. & Frank, P. (2001a). Acidity and Salt Precipitations on the Vasa; the sulfur problem. In: Hoffmann, P., et al. (Eds.) Proceedings of 8th ICOM-WOAM Conference, Stockholm p. 67-89.
Sandström, M., Jalilehvand, F., Persson, I., Gelius, U., Frank, P. & Hall-Roth, I. (2002a). Deterioration of the seventeenth-century warship Vasa by internal formation of sulphuric acid. Nature 415(6874), 893-897.
Sandström, M., Persson, I., Jalilehvand, F., Fors, Y., Damian, E., Gelius, U., Hall-Roth, I., Richards, V.L. & Godfrey, I. (2002b). The sulphur threat to marine-archaeological artefacts: acid and iron removal from the Vasa In: Townsend, J.H., et al. (Eds.) Proceedings of Conservation Science p. 79-87.
85
Sandström, T.P.A., Hall-Roth, I. & Karlsson, A. (2001b). Salt Precipitations on the Vasa Timbers; an Introduction to a Problem. In: Hoffmann, P., et al. (Eds.) Proceedings of 8th ICOM-WOAM Conference, Stockholm p. 55-66.
Schmidt, C.J., Whitten, B.K. & Nicholas, D.D. (1981). A proposed role for oxalic acid in non-enzymatic wood decay by brown-rot fungi. Proceedings of the Annual Meeting - American Wood-Preservers' Association 77, 157-164.
Schniewind, A.P. (1990). Physical and mechanical properties of archaeological wood. In: Rowell, R.M., et al. (Eds.) Archaeological wood: properties, chemistry, and preservation Washington, D.C. : American Chemical Society, Ser. no. 225. p. 87-109.
Schriemer, D.C. & Li, L. (1996). Detection of high molecular weight narrow polydisperse polymers up to 1.5 million Daltons by MALDI mass spectrometry. Analytical Chemistry 68(17), 2721-2725.
Schwarzenbach, G. & Flaschka, H. (1965). Die Komplexometrische Titration. Stuttgart: Ferdinand Enke Verlag.
Shafizadeh, F. (1963). Acidic hydrolysis of glucosidic bonds. Tappi Journal 46(6), 381–383. Sillén, L.G. & Martell, A.E. (1964 and 1971). Stability Constants of Metal-Ion Complexes,
Special Publ. The Chemical Society. Nos. 17 and 25, London, UK. Springer, E.L. (1985). Prehydrolysis of Hardwood with Dilute Sulfuric Acid. Industrial &
Engineering Chemistry Product Research and Development 25(4), 614-623. Stehr, M., Seltman, J. & Johansson, I. (1998). UV laser ablation - An improved method of
sample preparation for microscopy. Holzforschung 52(1), 1-6. Steudel, R. (1996). Mechanism for the formation of elemental sulfur from aqueous sulfide in
chemical and microbiological desulfurization processes. Industrial & Engineering Chemistry Research 35(4), 1417-1423.
Teleman, A., Tenkanen, M., Jacobs, A. & Dahlman, O. (2002). Characterization of O-acetyl-(4-O-methylglucurono)xylan isolated from birch and beech. Carbohydrate Research 337(4), 373-377.
Teo, B.K. (1986). EXAFS: Basic Principles and Data Analysis. New York: Springer-Verlag. Uchiyama, H., Dobashi, Y., Ohkouchi, K. & Nagasawa, K. (1990). Chemical-change
involved in the oxidative reductive depolymerization of hyaluronic-acid. Journal of Biological Chemistry 265(14), 7753-7759.
Vairavamurthy, M.A., Maletic, D., Wang, S.K., Manowitz, B., Eglinton, T. & Lyons, T. (1997). Characterization of sulfur-containing functional groups in sedimentary humic substances by X-ray absorption near-edge structure spectroscopy. Energy & Fuels 11(3), 546-553.
Wang, X.-H. (1996). Interfacial electrochemistry of pyrite oxidation and flotation. I: Effect of borate on pyrite surface oxidation. Journal of colloid and interface science 178, 628-637.
Westre, T.E., Kennepohl, P., DeWitt, J.G., Hedman, B., Hodgson, K.O. & Solomon, E.I. (1997). A multiplet analysis of Fe K-edge 1s→3d pre-edge features of iron complexes. Journal of the American Chemical Society 119(27), 6297-6314.
Willför, S., Sundberg, A., Pranovich, A. & Holmbom, B. (2005). Polysaccharides in some industrially important hardwood species. Wood Science and Technology 39(8), 601-617.

86
Yao, W. & Millero, F.J. (1996). Oxidation of hydrogen sulfide by hydrous Fe(III) oxides in seawater. Marine Chemistry 52(1), 1-16.
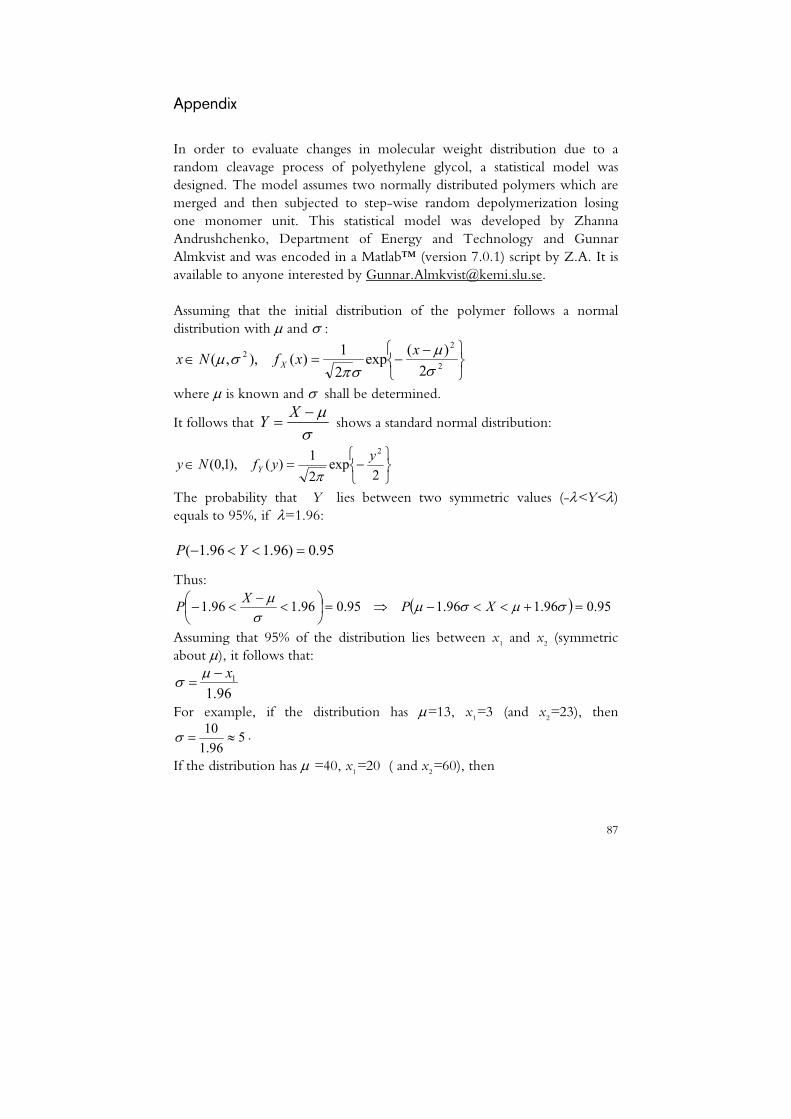
87
Appendix
In order to evaluate changes in molecular weight distribution due to a random cleavage process of polyethylene glycol, a statistical model was designed. The model assumes two normally distributed polymers which are merged and then subjected to step-wise random depolymerization losing one monomer unit. This statistical model was developed by Zhanna Andrushchenko, Department of Energy and Technology and Gunnar Almkvist and was encoded in a Matlab™ (version 7.0.1) script by Z.A. It is available to anyone interested by [email protected]. Assuming that the initial distribution of the polymer follows a normal distribution with μ and σ :
⎭⎬⎫
⎩⎨⎧ −−=∈ 2
22
2)(exp
21)(),,(
σμ
σπσμ xxfNx X
where μ is known and σ shall be determined.
It follows that σμ−
=XY shows a standard normal distribution:
⎭⎬⎫
⎩⎨⎧−=∈
2exp
21)(),1,0(
2yyfNy Y π
The probability that Y lies between two symmetric values (-λ<Y<λ) equals to 95%, if λ=1.96:
95.0)96.196.1( =<<− YP
Thus:
( ) 95.096.196.195.096.196.1 =+<<−⇒=⎟⎠⎞
⎜⎝⎛ <
−<− σμσμ
σμ XPXP
Assuming that 95% of the distribution lies between x1 and x2 (symmetric about μ), it follows that:
96.11x−=
μσ
For example, if the distribution has μ=13, x1=3 (and x2=23), then
596.1
10≈=σ .
If the distribution has μ =40, x1=20 ( and x2=60), then
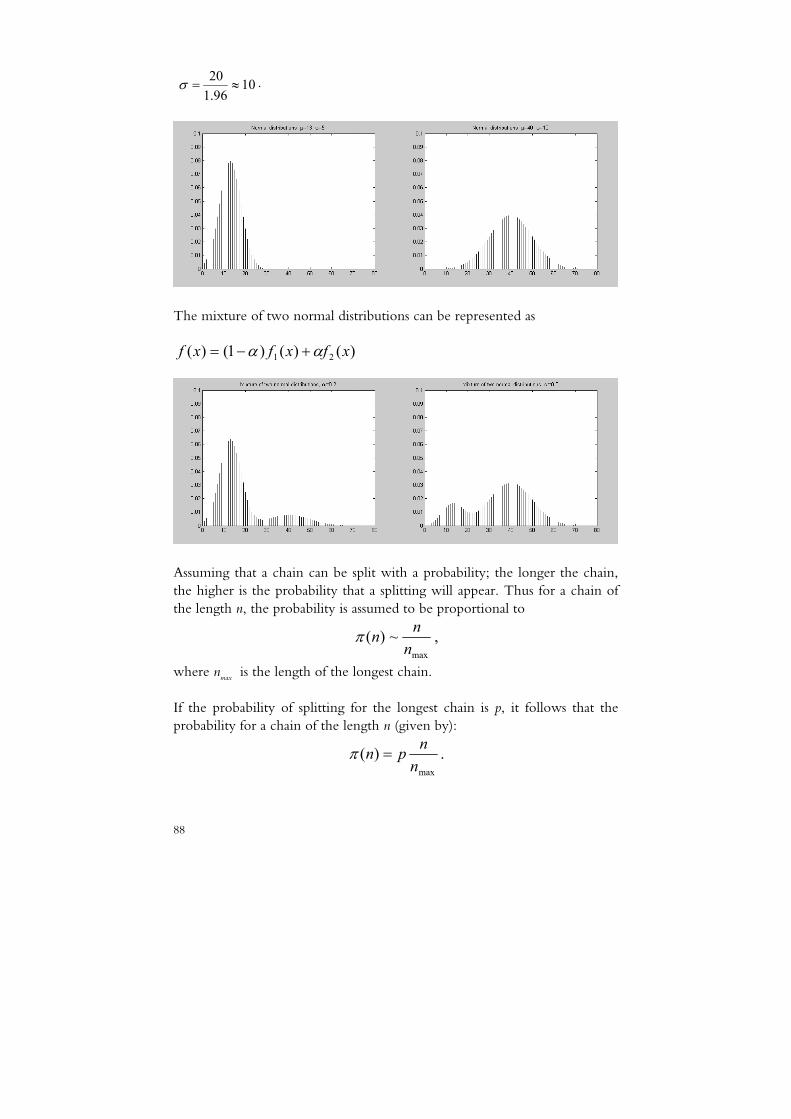
88
1096.1
20≈=σ .
The mixture of two normal distributions can be represented as
)()()1()( 21 xfxfxf αα +−=
Assuming that a chain can be split with a probability; the longer the chain, the higher is the probability that a splitting will appear. Thus for a chain of the length n, the probability is assumed to be proportional to
max
~)(nnnπ ,
where nmax is the length of the longest chain. If the probability of splitting for the longest chain is p, it follows that the probability for a chain of the length n (given by):
max
)(nnpn =π .
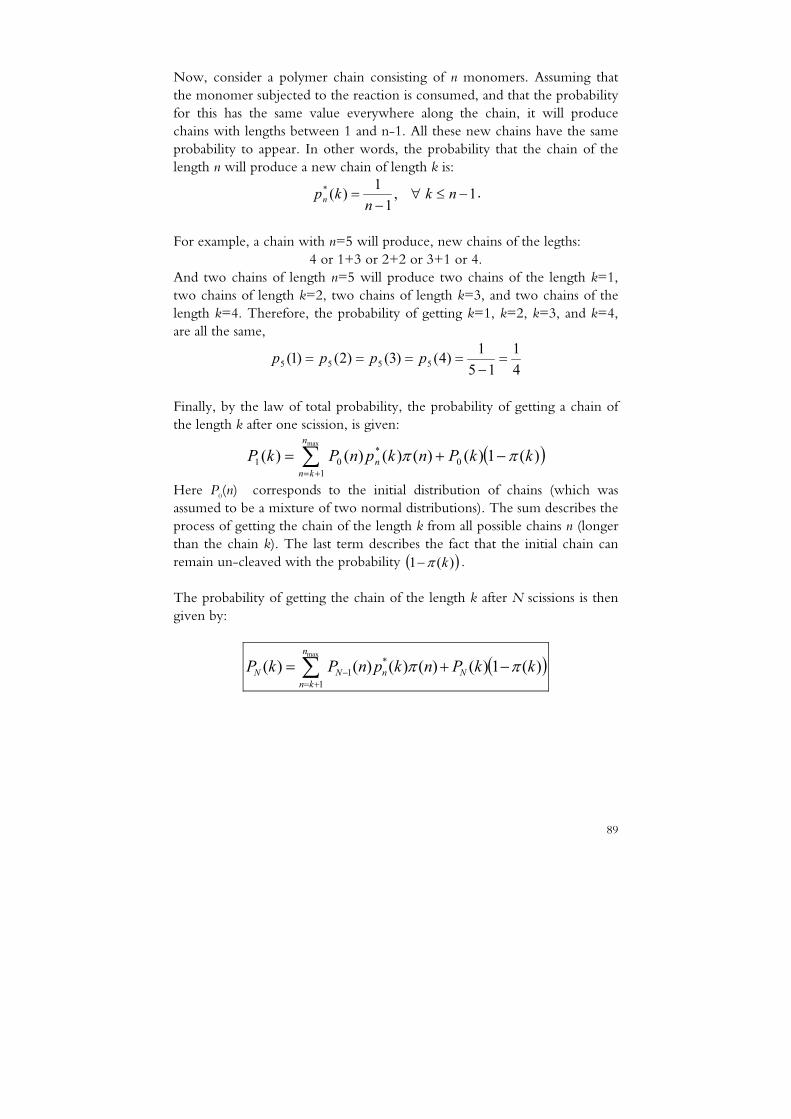
89
Now, consider a polymer chain consisting of n monomers. Assuming that the monomer subjected to the reaction is consumed, and that the probability for this has the same value everywhere along the chain, it will produce chains with lengths between 1 and n-1. All these new chains have the same probability to appear. In other words, the probability that the chain of the length n will produce a new chain of length k is:
1,1
1)(* −≤∀−
= nkn
kpn .
For example, a chain with n=5 will produce, new chains of the legths:
4 or 1+3 or 2+2 or 3+1 or 4. And two chains of length n=5 will produce two chains of the length k=1, two chains of length k=2, two chains of length k=3, and two chains of the length k=4. Therefore, the probability of getting k=1, k=2, k=3, and k=4, are all the same,
41
151)4()3()2()1( 5555 =−
==== pppp
Finally, by the law of total probability, the probability of getting a chain of the length k after one scission, is given:
( ))(1)()()()()( 0*
01
1
max
kkPnkpnPkP n
n
knππ −+= ∑
+=
Here P0(n) corresponds to the initial distribution of chains (which was assumed to be a mixture of two normal distributions). The sum describes the process of getting the chain of the length k from all possible chains n (longer than the chain k). The last term describes the fact that the initial chain can remain un-cleaved with the probability ( ))(1 kπ− .
The probability of getting the chain of the length k after N scissions is then given by:
( ))(1)()()()()( *1
1
max
kkPnkpnPkP NnN
n
knN ππ −+= −
+=∑