Embed Size (px)
Citation preview
1
2012 Northwest Cider & Perry Seminar
The Cider Market & IndustryClass Leader: Peter Mitchell, Director Mitchell F&D Limited
History of Cider Production• In 6500 BC apples first cultivated in the Tien Shan (“Mountains of Heaven”) ‐modern‐
day Kazakhstan in Central Asia.
• When the Romans invaded England (55 BC – 43 AD), native Britons in Kent were found to be making cider.
• From the 8th C, adoption of apple milling & pressing technology & establishment of cider & perry production ‐ spreading north from Spain to France and into England.
• From 13th C, cider became valued as a safer drink than water and became used as a means of paying farm workers.
• 17th & 18th C, the “heyday”. Key technological developments e.g. in‐bottle fermentation. Taken to the “colonies”.
• Popularity and quality declined at the end of the 19th C.
• Formation of Long Ashton in 1903. Much R&D work was undertaken here until 1985.
• Substantial growth in cider consumption and production occurred between 1970 to the mid 1990s.
• After a short period of Industry “troubles” and a decline in cider value in the late 1990s, new quality products were introduced to make cider & perry fashionable again in the 21st century.
2
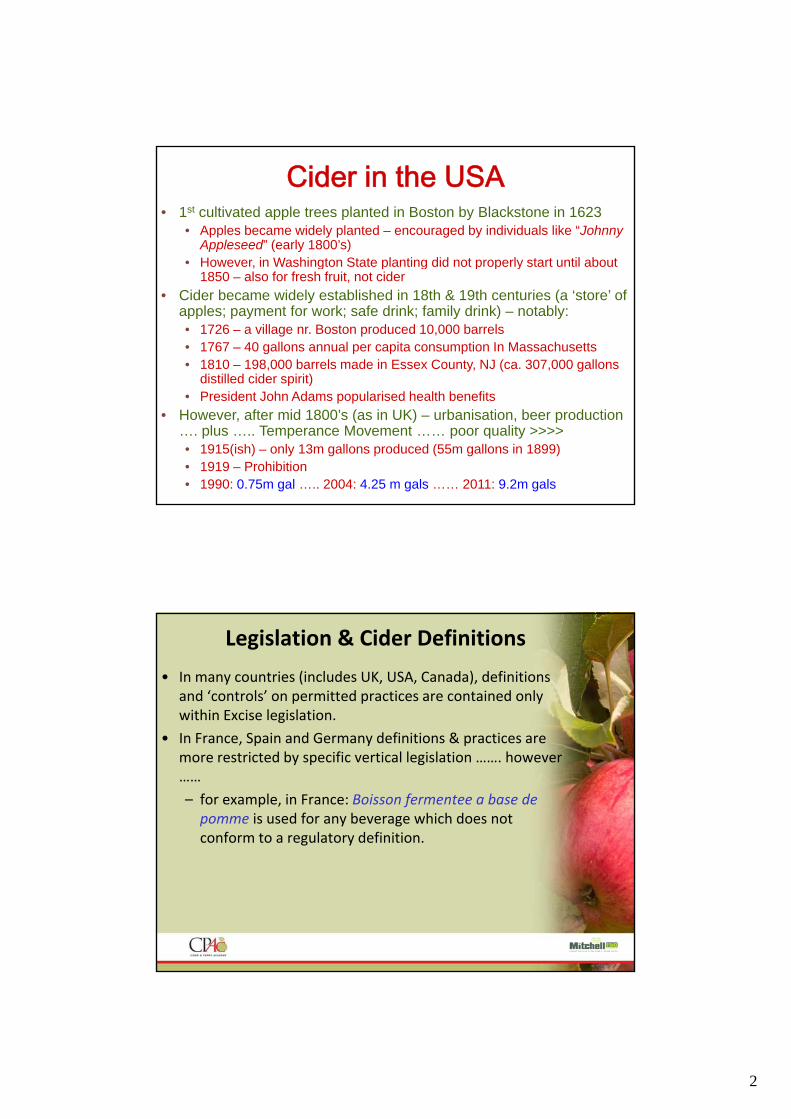
• 1st cultivated apple trees planted in Boston by Blackstone in 1623• Apples became widely planted – encouraged by individuals like “Johnny
Appleseed” (early 1800’s)• However, in Washington State planting did not properly start until about
Cider in the USA
However, in Washington State planting did not properly start until about 1850 – also for fresh fruit, not cider
• Cider became widely established in 18th & 19th centuries (a ‘store’ of apples; payment for work; safe drink; family drink) – notably:• 1726 – a village nr. Boston produced 10,000 barrels• 1767 – 40 gallons annual per capita consumption In Massachusetts• 1810 – 198,000 barrels made in Essex County, NJ (ca. 307,000 gallons
distilled cider spirit)p )• President John Adams popularised health benefits
• However, after mid 1800’s (as in UK) – urbanisation, beer production …. plus ….. Temperance Movement …… poor quality >>>>• 1915(ish) – only 13m gallons produced (55m gallons in 1899)• 1919 – Prohibition• 1990: 0.75m gal ….. 2004: 4.25 m gals …… 2011: 9.2m gals
Legislation & Cider Definitions
• In many countries (includes UK, USA, Canada), definitions and ‘controls’ on permitted practices are contained only within Excise legislation.
d d f• In France, Spain and Germany definitions & practices are more restricted by specific vertical legislation ……. however ……
– for example, in France: Boisson fermentee a base de pomme is used for any beverage which does not conform to a regulatory definition.
3
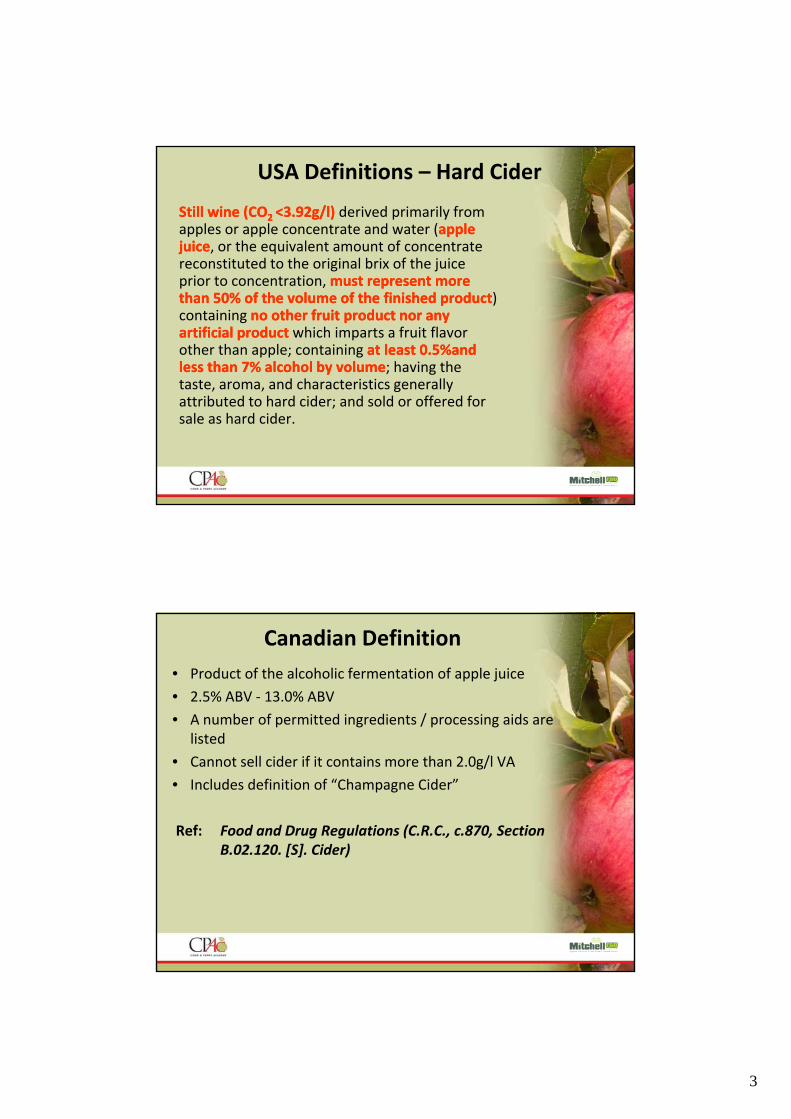
USA Definitions – Hard Cider
Still wine (COStill wine (CO2 2 <3.92g/l)<3.92g/l) derived primarily from apples or apple concentrate and water (apple apple juicejuice, or the equivalent amount of concentrate reconstituted to the original brix of the juicereconstituted to the original brix of the juice prior to concentration, must represent more must represent more than 50% of the volume of the finished productthan 50% of the volume of the finished product) containing no other fruit product nor any no other fruit product nor any artificial product artificial product which imparts a fruit flavor other than apple; containing at least 0.5%and at least 0.5%and less than 7% alcohol by volumeless than 7% alcohol by volume; having the taste aroma and characteristics generallytaste, aroma, and characteristics generally attributed to hard cider; and sold or offered for sale as hard cider.
Canadian Definition
• Product of the alcoholic fermentation of apple juice
• 2.5% ABV ‐ 13.0% ABV
• A number of permitted ingredients / processing aids are listed
• Cannot sell cider if it contains more than 2.0g/l VA
• Includes definition of “Champagne Cider”
Ref: Food and Drug Regulations (C.R.C., c.870, Section B 02 120 [S] Cider)B.02.120. [S]. Cider)
4
USA Definitions – Other Categories
Broadly, cider is classified as a wine and thus permitted practices and allowable ingredients are generally the same as for a wine. For full details, see The Electronic The Electronic Code of Federal Regulations, Title 27: Alcohol, Tobacco & Firearms, Part 24 Code of Federal Regulations, Title 27: Alcohol, Tobacco & Firearms, Part 24 –– WineWine.The following excise tax categories apply to cider:
Wine 0.5% to 14% ABV: $1.07/galWine 14.1% to 20.9% ABV: $1.57/galWine 21.0% to 24% ABV: $3.15/galCarbonated Wine (CO2 > 3.92 gl
‐1 ): $3.30/galSparkling Wine (CO2 > 3.92 gl
‐1 ): $3.40/galHard Cider (as previous): $0.226/gal$0.226/gal
In addition, there is a “Fruit Wine “category, a “Farm Cider” category ‐ which is exempt from a tax class subject to certain provisions (FR: 27.24.76) ‐ and reduced levels of tax for small producerssmall producers (150,000 gal/yr) e.g. $0.056 credit on 1st 100,000 gals of hard cider.
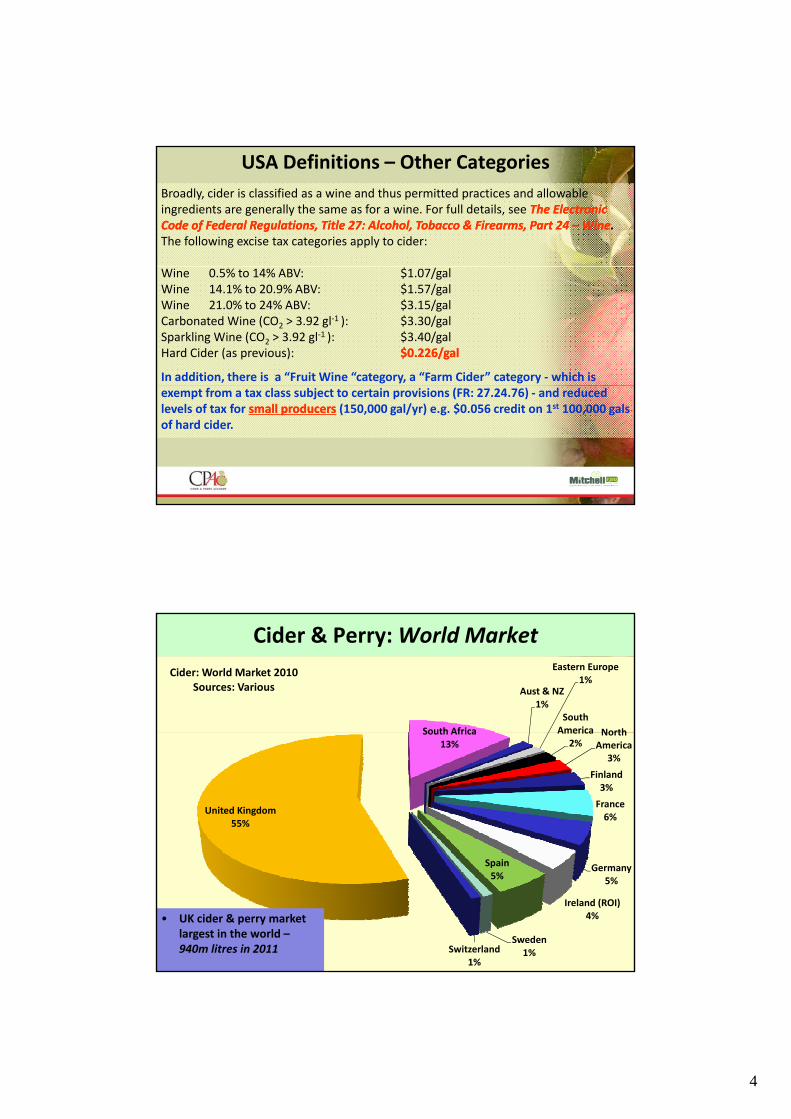
Cider & Perry: World Market
South Africa
Aust & NZ1%
Eastern Europe1%
South America North
Cider: World Market 2010Sources: Various
South Africa13%
America2%
North America
3%
Finland3%
France6%
United Kingdom55%
Germany5%
Ireland (ROI)4%
Spain5%
Sweden1%Switzerland
1%
• UK cider & perry market largest in the world –940m litres in 2011
5
Cider & Perry: Growth in World Market
140.0
160.0
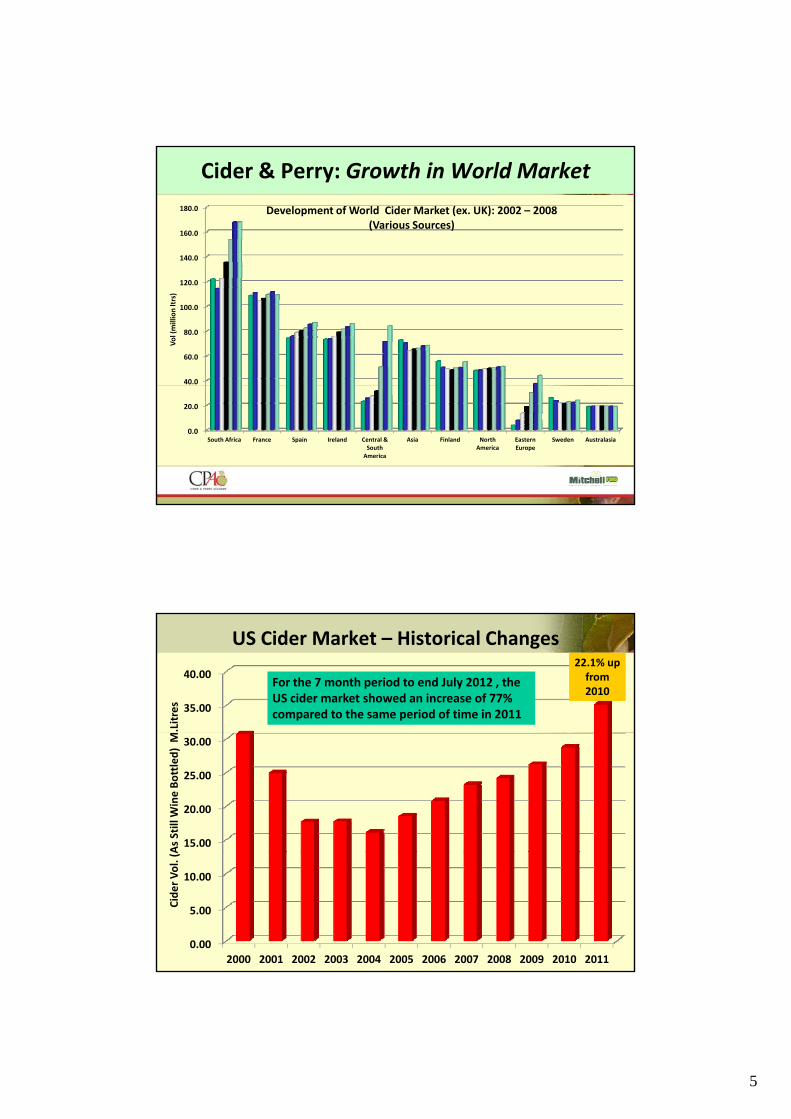
180.0 Development of World Cider Market (ex. UK): 2002 – 2008(Various Sources)
40.0
60.0
80.0
100.0
120.0
Vol (million ltrs)
0.0
20.0
South Africa France Spain Ireland Central & South America
Asia Finland North America
Eastern Europe
Sweden Australasia
US Cider Market – Historical Changes
35.00
40.00
.Litres
For the 7 month period to end July 2012 , the US cider market showed an increase of 77% compared to the same period of time in 2011
22.1% up from 2010
15.00
20.00
25.00
30.00
As Still W
ine Bottled) M
0.00
5.00
10.00
2000 2001 2002 2003 2004 2005 2006 2007 2008 2009 2010 2011
Cider Vol. (A
6
Cider: US Production / Releases
FLGA WA
2%
TX1%
OH1%
Il1%
KS1%
OR1%
Other2%
VT
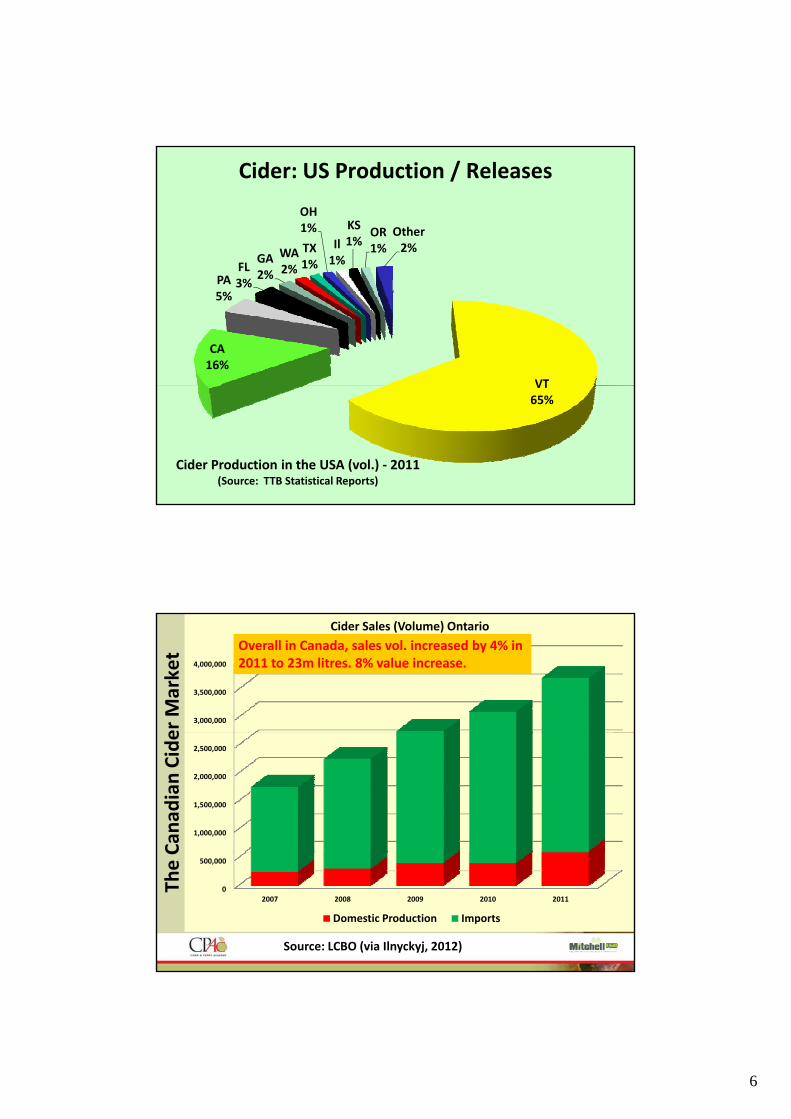
CA16%
PA5%
FL3%
2% 2% 1%
VT65%
Cider Production in the USA (vol.) ‐ 2011(Source: TTB Statistical Reports)
er Market
3,000,000
3,500,000
4,000,000
Cider Sales (Volume) Ontario
Overall in Canada, sales vol. increased by 4% in 2011 to 23m litres. 8% value increase.
Can
adian Cide
1,000,000
1,500,000
2,000,000
2,500,000
The C
0
500,000
2007 2008 2009 2010 2011
Domestic Production Imports
Source: LCBO (via Ilnyckyj, 2012)
7
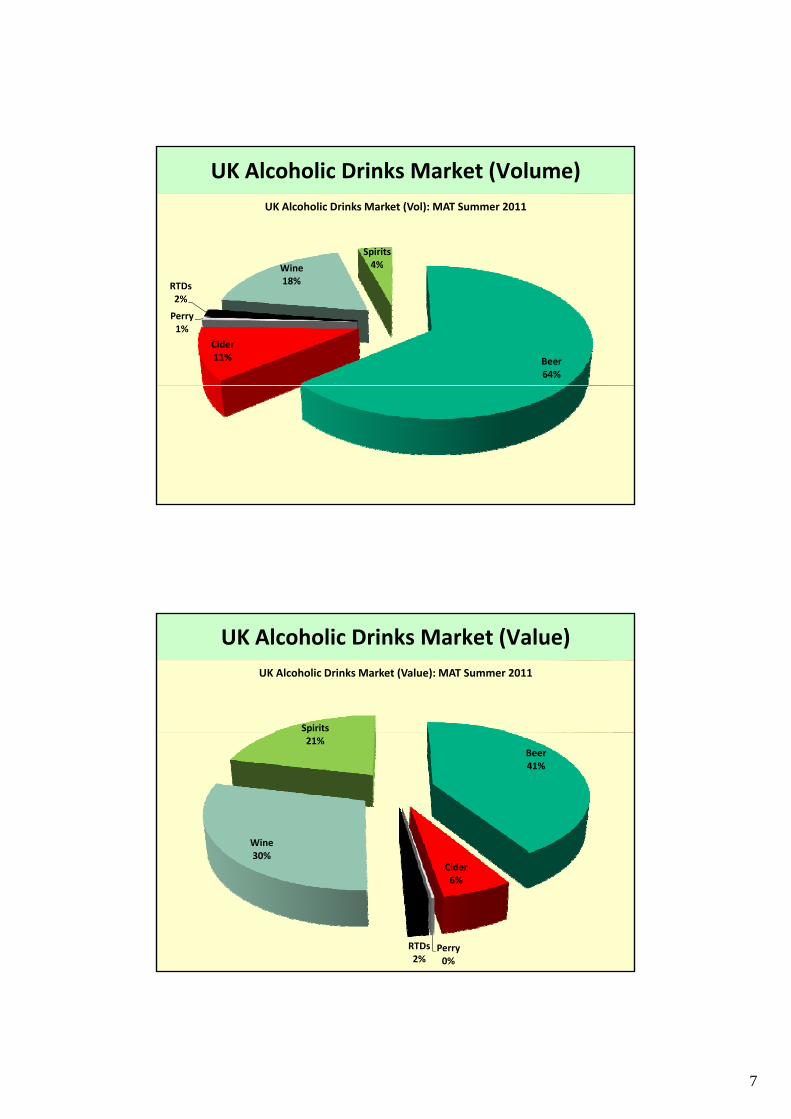
UK Alcoholic Drinks Market (Volume)
Wi
Spirits4%
UK Alcoholic Drinks Market (Vol): MAT Summer 2011
Beer64%
Cider11%
Perry1%
RTDs2%
Wine18%
4%
UK Alcoholic Drinks Market (Value)
Spirits
UK Alcoholic Drinks Market (Value): MAT Summer 2011
Beer41%
Wine
p21%
Cider6%
Perry0%
RTDs2%
30%
8
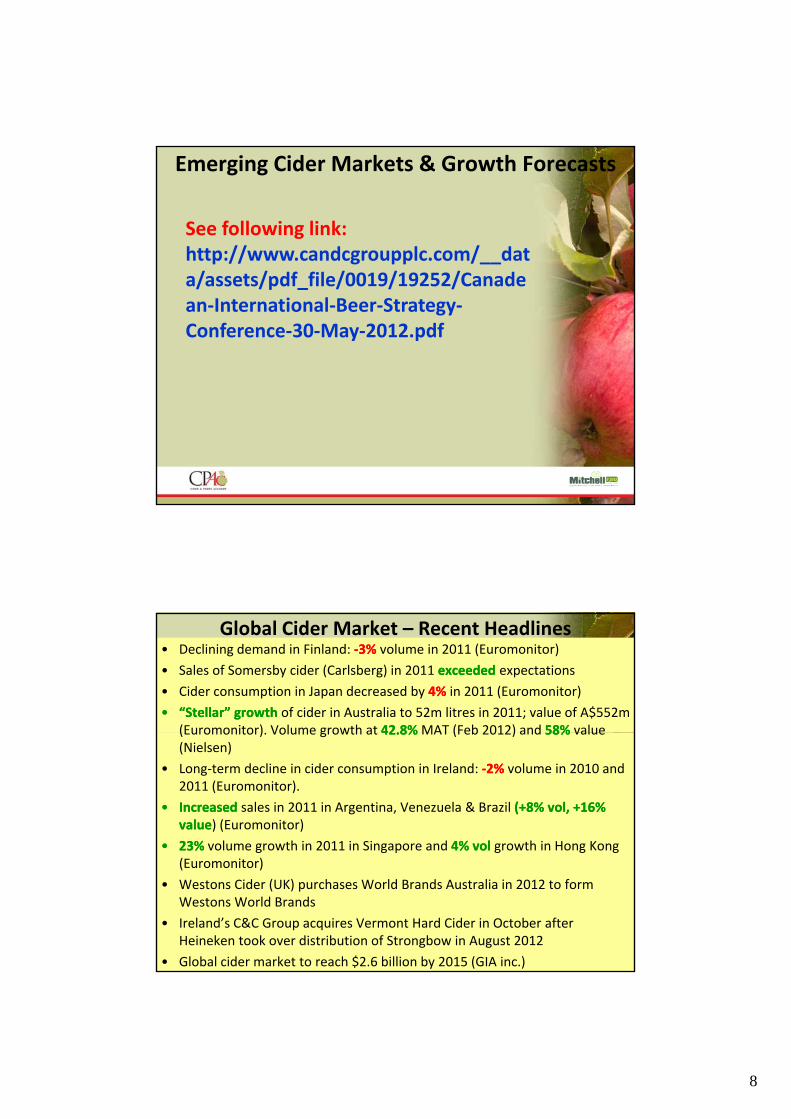
Emerging Cider Markets & Growth Forecasts
See following link: http://www.candcgroupplc.com/__data/assets/pdf_file/0019/19252/Canadean‐International‐Beer‐Strategy‐Conference‐30‐May‐2012.pdf
Global Cider Market – Recent Headlines• Declining demand in Finland: ‐‐3% 3% volume in 2011 (Euromonitor)
• Sales of Somersby cider (Carlsberg) in 2011 exceededexceeded expectations
• Cider consumption in Japan decreased by 4%4% in 2011 (Euromonitor)
•• “Stellar” growth “Stellar” growth of cider in Australia to 52m litres in 2011; value of A$552m (Euromonitor) Volume growth at 42 8%42 8%MAT (Feb 2012) and 58%58% value(Euromonitor). Volume growth at 42.8%42.8%MAT (Feb 2012) and 58%58% value (Nielsen)
• Long‐term decline in cider consumption in Ireland: ‐‐2%2% volume in 2010 and 2011 (Euromonitor).
•• Increased Increased sales in 2011 in Argentina, Venezuela & Brazil (+8% (+8% volvol, +16% , +16% valuevalue) (Euromonitor)
•• 23%23% volume growth in 2011 in Singapore and 4% 4% volvol growth in Hong Kong g g p g g g(Euromonitor)
• Westons Cider (UK) purchases World Brands Australia in 2012 to form Westons World Brands
• Ireland’s C&C Group acquires Vermont Hard Cider in October after Heineken took over distribution of Strongbow in August 2012
• Global cider market to reach $2.6 billion by 2015 (GIA inc.)
9
Sales Trends
In the 20th & 21st century, the key factors that have affected (will affect?) consumption include:
• Advertising
• Weather
• Taxation• Taxation
• Widening product range – in draught & packaged formats
• Distribution & supply (of product & raw materials)
• Packaging & product innovations
• Regional preferences
• Gender and age
• Changes in PDIg
• Pricing, product quality and value
• Image
• Provenance & eco/health‐credentials
• Events & occasions
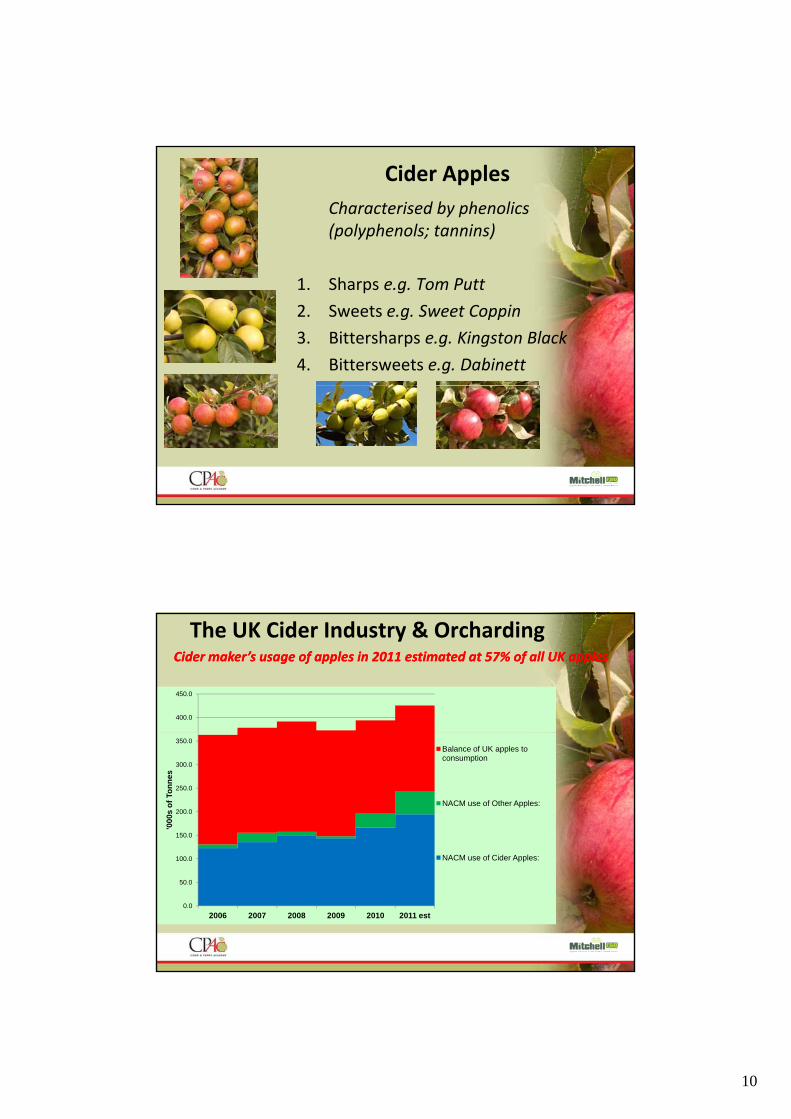
The Raw Materials – Apples & Pears
Apples
1. Dessert
2 C li2. Culinary
3. Cider
4. (Crab)
Pears
1. Dessert
2. Perry
10
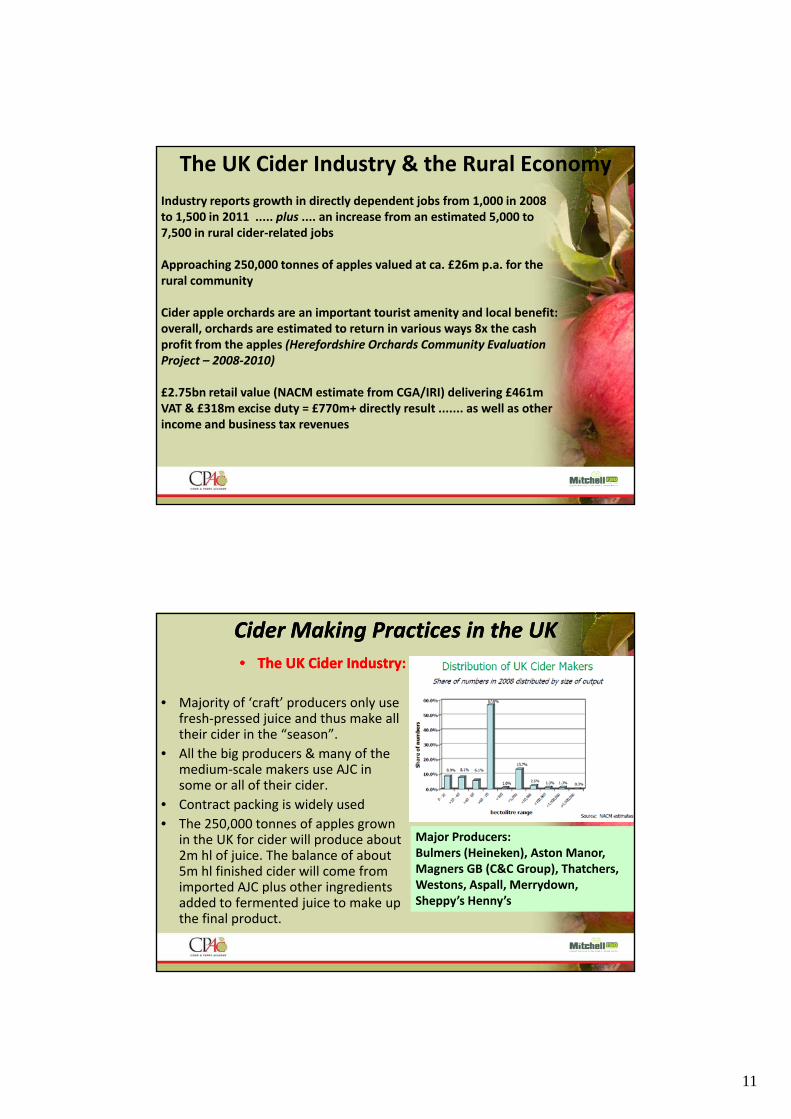
Cider Apples
Characterised by phenolics(polyphenols; tannins)
1. Sharps e.g. Tom Putt
2. Sweets e.g. Sweet Coppin
3. Bittersharps e.g. Kingston Black
4. Bittersweets e.g. Dabinett
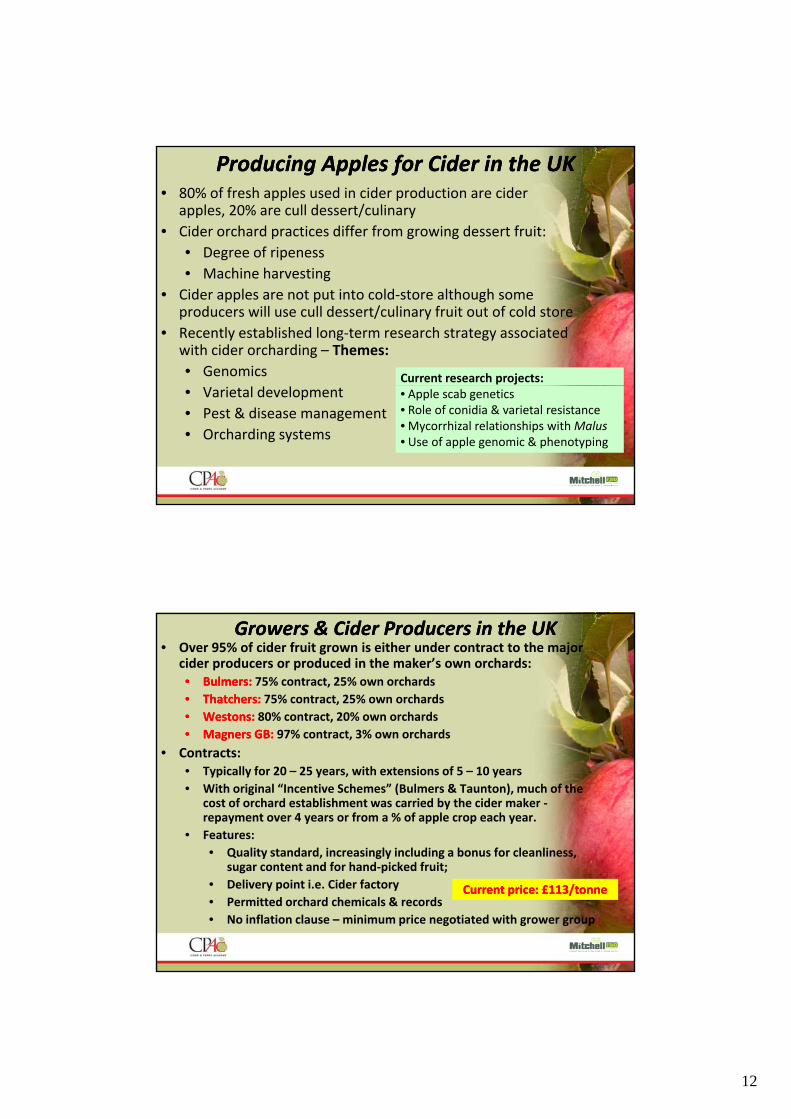
The UK Cider Industry & Orcharding
400.0
450.0
Cider maker’s usage of apples in 2011 estimated at 57% of all UK applesCider maker’s usage of apples in 2011 estimated at 57% of all UK apples
150.0
200.0
250.0
300.0
350.0
'000
s o
f To
nn
es
Balance of UK apples to consumption
NACM use of Other Apples:
0.0
50.0
100.0
2006 2007 2008 2009 2010 2011 est
NACM use of Cider Apples:
11
The UK Cider Industry & the Rural Economy
Industry reports growth in directly dependent jobs from 1,000 in 2008 to 1,500 in 2011 ..... plus .... an increase from an estimated 5,000 to 7,500 in rural cider‐related jobs
Approaching 250 000 tonnes of apples valued at ca £26m p a for theApproaching 250,000 tonnes of apples valued at ca. £26m p.a. for the rural community
Cider apple orchards are an important tourist amenity and local benefit: overall, orchards are estimated to return in various ways 8x the cash profit from the apples (Herefordshire Orchards Community Evaluation Project – 2008‐2010)
£2.75bn retail value (NACM estimate from CGA/IRI) delivering £461m VAT & £318m excise duty = £770m+ directly result ....... as well as other income and business tax revenues
Cider Making Practices in the UKCider Making Practices in the UK
•• The UK Cider Industry:The UK Cider Industry:
• Majority of ‘craft’ producers only use fresh‐pressed juice and thus make all their cider in the “season”their cider in the “season”.
• All the big producers & many of the medium‐scale makers use AJC in some or all of their cider.
• Contract packing is widely used
• The 250,000 tonnes of apples grown in the UK for cider will produce about 2 hl f j i Th b l f b t
Major Producers:Bulmers (Heineken) Aston Manor2m hl of juice. The balance of about
5m hl finished cider will come from imported AJC plus other ingredients added to fermented juice to make up the final product.
Bulmers (Heineken), Aston Manor, Magners GB (C&C Group), Thatchers, Westons, Aspall, Merrydown, Sheppy’s Henny’s
12
Producing Apples for Cider in the UKProducing Apples for Cider in the UK• 80% of fresh apples used in cider production are cider
apples, 20% are cull dessert/culinary
• Cider orchard practices differ from growing dessert fruit:
• Degree of ripeness
• Machine harvesting
• Cider apples are not put into cold‐store although some producers will use cull dessert/culinary fruit out of cold store
• Recently established long‐term research strategy associated with cider orcharding – Themes:
• Genomics Current research projects:• Varietal development
• Pest & disease management
• Orcharding systems
• Apple scab genetics• Role of conidia & varietal resistance• Mycorrhizal relationships with Malus• Use of apple genomic & phenotyping
Growers & Cider Producers in the UKGrowers & Cider Producers in the UK• Over 95% of cider fruit grown is either under contract to the major
cider producers or produced in the maker’s own orchards:•• BulmersBulmers:: 75% contract, 25% own orchards
•• ThatchersThatchers:: 75% contract, 25% own orchards
•• WestonsWestons: : 80% contract, 20% own orchards
•• MagnersMagners GB:GB: 97% contract 3% own orchards•• MagnersMagners GB: GB: 97% contract, 3% own orchards
• Contracts:• Typically for 20 – 25 years, with extensions of 5 – 10 years
• With original “Incentive Schemes” (Bulmers & Taunton), much of the cost of orchard establishment was carried by the cider maker ‐repayment over 4 years or from a % of apple crop each year.
• Features:
• Quality standard increasingly including a bonus for cleanliness• Quality standard, increasingly including a bonus for cleanliness, sugar content and for hand‐picked fruit;
• Delivery point i.e. Cider factory
• Permitted orchard chemicals & records
• No inflation clause – minimum price negotiated with grower group
Current price: £113/tonneCurrent price: £113/tonne
13
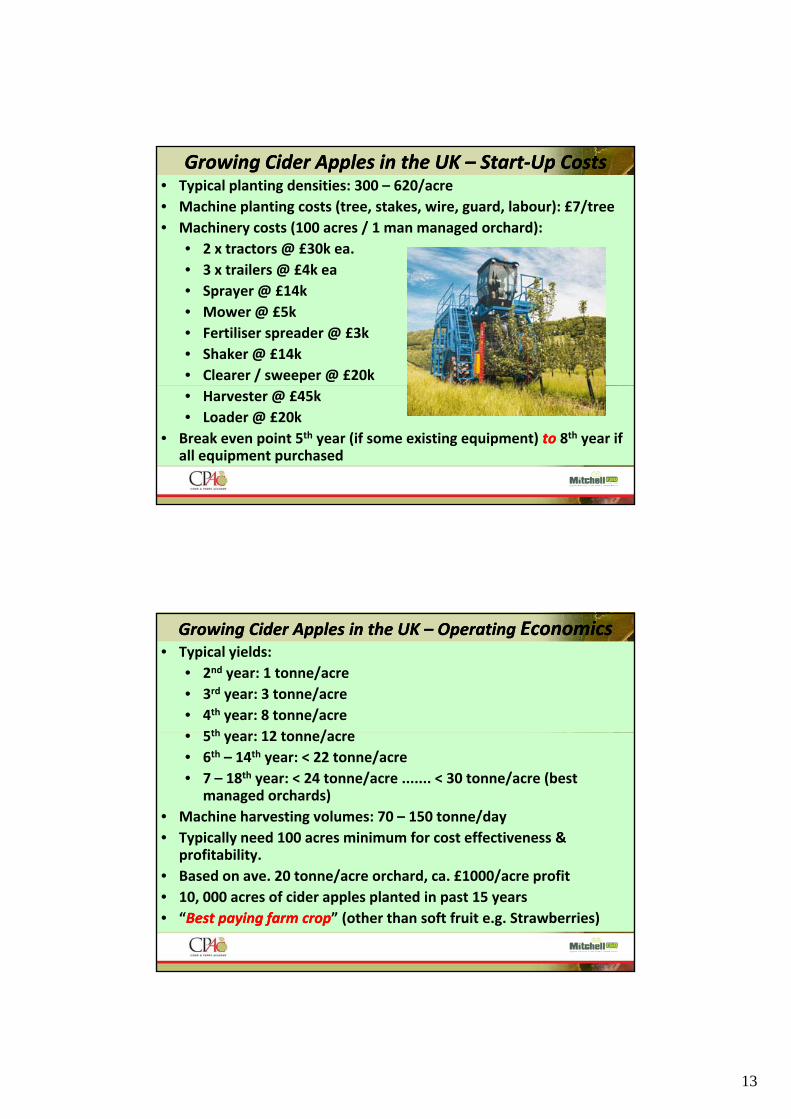
Growing Cider Apples in the UK Growing Cider Apples in the UK –– StartStart‐‐Up CostsUp Costs• Typical planting densities: 300 – 620/acre
• Machine planting costs (tree, stakes, wire, guard, labour): £7/tree
• Machinery costs (100 acres / 1 man managed orchard):
• 2 x tractors @ £30k ea.
3 t il @ £4k• 3 x trailers @ £4k ea
• Sprayer @ £14k
• Mower @ £5k
• Fertiliser spreader @ £3k
• Shaker @ £14k
• Clearer / sweeper @ £20k
• Harvester @ £45k
• Loader @ £20k
• Break even point 5th year (if some existing equipment) toto 8th year if all equipment purchased
Growing Cider Apples in the UK Growing Cider Apples in the UK –– Operating Operating EconomicsEconomics• Typical yields:
• 2nd year: 1 tonne/acre
• 3rd year: 3 tonne/acre
• 4th year: 8 tonne/acre
5th 12 t /• 5th year: 12 tonne/acre
• 6th – 14th year: < 22 tonne/acre
• 7 – 18th year: < 24 tonne/acre ....... < 30 tonne/acre (best managed orchards)
• Machine harvesting volumes: 70 – 150 tonne/day
• Typically need 100 acres minimum for cost effectiveness & fit bilitprofitability.
• Based on ave. 20 tonne/acre orchard, ca. £1000/acre profit
• 10, 000 acres of cider apples planted in past 15 years
• “Best paying farm cropBest paying farm crop” (other than soft fruit e.g. Strawberries)