Embed Size (px)
Citation preview
International Ophthalmology 15: 175-183, 1991. �9 1991 Kluwer Academic Publishers. Printed in the Netherlands.
The cost effectiveness of strategies to reduce barriers to cataract surgery
Leon B. Ellwein 1, James M. Lepkowski 2, R.D. Thulasiraj 3, Girija E. Brilliant 4 & The Operations Research Group 5 1 University of Nebraska Medical Center, Omaha, Nebraska, USA; 2 Institute for Social Research, the University of Michigan, Ann Arbor, Michigan, USA; 3 Aravind Eye Hospital, Madurai, Tamil Nadu, bzdia; 4 Seva Foundation, San Anselmo, California, USA; 5At the Aravind Eye Hospital, Dr. G. Venkataswamy and Dr. C.A.K. Shamtgham; at the University of Michigan, Dr. Robert L. Tilden and Dr. Beatriz Zurita; and at the National Eye Institute, Dr. Richard L. Mowery
Key words: cost-effectiveness, cataract blindness, vision screening, health education interventions
Abstract
The cost and effectiveness of eight approaches to reducing barriers to cataract surgery were evaluated in a rural area of South India during 1987-1989. The approaches were based on four intervention alternatives - aphakic motivator (AM), basic eye health worker (BW), screening van (SV), and mass media (MM). Each intervention was offered at two levels of economic incentive: partial, which provides free surgery and hospital stay, and full, which also provides transport from the recipient's village to the hospital and free food during the hospital stay. Evaluations took place in a probability selection of 90 villages, including ten control villages not subjected to either of the interventions. Only costs unique to patients from the intervention villages were considered: Health education and screening costs were included, surgery costs were not. Percentage reductions in the cataract blind backlog and increases in surgical coverage were used as effectiveness measures. Analyses suggest that the SV and AM interventions, both with full economic incentive, offer the greatest advantage. The AM intervention is the more effective of the two, but also the more costly.
Introduction
Cataract blindness is a significant world-wide prob- lem, particularly in Third World countries. Glob- ally there are an estimated 14 million cataract blind, and it is estimated that in India alone there are six million cases [1]. Eradication of the backlog is frustrated by difficulties in reaching the blind and providing curative services. The blind individual must be first identified (perhaps by self-identifica- tion), and then he must be examined to determine if blindness is due to cataract and, thus, curable by surgery. Further, the curable cataract blind must recognize the need for treatment, must acknowl- edge that surgery can cure the blindness, and must
present themselves for treatment. Finally, the treatment must result in an acceptable level of sight restoration [2, 3].
Numerous barriers stand in the way as the cat- aract blind progress through this decision/treat- ment process. Some barriers have been addressed through technological or logistical innovations in surgery provision, such as by providing surgery on an outpatient basis [4]. However, many significant programmatic and resource barriers must be over- come if the surgical backlog is to be eliminated with resources presently available for primary eye care. In addition, behavioral factors related to the eco- nomic, psycho-social and educational character- istics of the cataract patient, have been identified as
176 L.B. Ellwein et al.
substantial barriers to acceptance of cataract sur- gery [5].
The subject of this paper is an operations re- search project implemented by the Aravind Eye Hospital in rural Southern India to compare the costs and effectiveness of eight different barrier- reduction intervention strategies. The cost-effec- tiveness analysis follows traditional lines. Cost is expressed in monetary terms, and intervention ef- fectiveness (benefit) is quantified in terms of back- log reduction and surgical coverage rates. This pa- per focuses on the determination of intervention costs and analysis of the relationship between cost and intervention effectiveness; a more detailed treatment of evaluation methods and effectiveness findings is found in reference 6.
Methods
The eight strategies consist of four interventions, each implemented at two levels of economic in- centive. The four interventions are labeled aphakic motivator (AM), basic eye health worker (BW), screening van (SV), and mass media (MM). The partial economic incentive (P) provided free sur- gery and hospital care, while the full incentive (F) added transportation to the hospital and free food during the hospital stay. The full economic incen- tive was implemented with each intervention op- tion to test the importance of reducing patient- borne costs to an absolute minimum compared to the partial incentive, which is routinely provided to Aravind charity patients. Each strategy was as- signed to a probability sample of ten villages. Ten additional villages were selected as control villages. The entire study area contained 1,589 villages rang- ing in estimated population from approximately 250 to 10,000.
The AM and BW interventions used a door-to- door screening approach to find cataract cases. In the AM intervention, a trained aphakic (i.e., an individual previously operated for cataract) from the same or nearby village went door-to-door in the intervention village to identify the blind among those aged 40 or above. Those identified as cataract blind were implored to accept surgery. The BW
intervention canvasser was not an aphakic, but a more extensively trained eye health worker from outside the village who had received a six-week training program regarding ophthalmic conditions and their treatment. In villages where transporta- tion was provided, an Aravind vehicle transported patients on two pre-scheduled dates, immediately following the conclusion of screening activities and again approximately one week later when the first cases were returned after hospitalization.
The remaining two interventions utilized large- scale centralized screening operations to find cat- aract patients. The SV intervention used a mobile, ophthalmologist-led team to screen villagers ap- pearing at a central village site in response to ad- vance publicity within the community. The MM intervention took place during four consecutive weekly market days in a central marketplace gener- ally serving eight to ten surrounding villages. Five marketplaces were used for each of the two MM strategies; within each market service area, two villages were randomly selected for evaluation. Audio-visual materials including music, a video- taped puppet show, and posters were used to edu- cate those visiting the media booth about the cur- ability of cataract blindness. In full-incentive villag- es or markets, Aravind vehicles provided trans- portation following the conclusion of screening ac- tivities.
Cost determination
Emphasis was on the differential cost of imple- menting the alternative interventions. Differential costs are the added ones associated with the various intervention options, beyond those customarily in- curred in the treatment of cataract blindness. Simi- larly, the fact that transportation and food are pro- vided in some villages and not in others is of no differential cost relevance. Since these costs are generally the same across intervention (and con- trol) villages, except that in one-half of the villages the costs are borne by the program instead of the patient, this distinction is important only to the extent that it influences acceptance of cataract sur- gery. (An obvious disadvantage of differential cost
accounting is that it doesn't provide a basis for estimating the total cost of intervention).
Costs attributable directly to implementation of intervention alternatives were accounted for, in- cluding costs of dedicated or shared equipment, personnel, transport, and materials. These costs included more than simply out-of-pocket expendi- tures, particularly where equipment and facilities are involved. Capital equipment costs were allocat- ed to interventions on the basis of prorated usage. Vehicle costs were reflected in a mileage charge. Field facilities provided free of charge by the com- munity have an opportunity cost, which is based on the fair market value of the project use. The eco- nomic value of other nonmarket items, such as community volunteer services, could be reflected in a similar fashion. In reality, however, the oppor- tunity costs of these items may be negligible, as we have assumed: Volunteers give up only leisure time and community buildings are used only when otherwise vacant.
The previously mentioned cost items are all tan- gible. Intangible costs, such as fear and anxiety suffered by the subject, are difficult, if not impos- sible, to quantify. These intangible costs are ig- nored in this study, perhaps reasonably so, since they should be comparable across interventions and similar to that experienced by patients from the control villages.
Finally, it is recognized that a cost incurred in the future is generally preferable to the same cost being incurred in the present. Differential timing of costs is important if the timing of outlays varies consid- erably between interventions. Since all relevant costs took place within a one-year period, discount- ing costs over time would have a negligible effect.
Cost-effectiveness estimation
The effectiveness of each intervention was assessed in a randomly selected geographic segment of each of the 80 intervention and ten control villages. Six to eight months after an intervention was complet- ed in a village, a specially trained team led by an ophthalmologist from the Aravind Eye Hospital visited the evaluation segment. Residents in the
The cost effectiveness 177
segment aged 30 years and older were enumerated, and those over 40 were asked to come to a central site for an eye examination. Approximately one- third of the enumerated persons came to the cen- tral site and were examined by the ophthalmol- ogist. Teams of ophthalmic assistants were sent door-to-door to examine the remaining unexam- ined in their homes. Over 90% of this adult pop- ulation in each segment was successfully evaluated.
The examination included assessment of the vi- sual acuity and an inspection of the anterior seg- ment of the eye to determine whether cataract was the cause of visual impairment. A person was clas- sifted blind if vision was less than 3/60 in the better eye. Cataract was diagnosed if any lenticular opac- ities were observed upon inspection of the lens using a focussed light source in a darkened room. Aphakia was recorded if the lens was absent from the visual axis. Ophthalmologic diagnosis was stan- dardized by training at the Aravind Hospital. Oph- thalmic-assistant diagnosis was standardized through a rigorous training program at the hospital and assessed by an observer reliability study. Oph- thalmic-assistant diagnoses of cataract, cataract blindness, and aphakia were in close agreement with ophthalmologist diagnoses.
Intervention and control villages from within the study area were chosen using probabilities propor- tional to estimated village population. As a result, the set of villages actually selected had, on average, a larger population than the average village within the study area. To compensate for this, the eval- uation segment of each village was identified using probabilities inversely proportional to size, result- ing in evaluation segments of approximately equal population size. With this two-stage sampling scheme, segment effectiveness data can be com- bined across villages for statistical inference pur- poses without any need for weighting to compen- sate for the unequal probabilities of village selec- tion.
Cost data do not lend themselves to this same rigor in statistical inference. Costs reflect efforts in serving the entire population subjected to the in- tervention and not just the particular segment cho- sen for evaluation. Although the intervention pop- ulation always included the evaluation segment, it
178 L.B. Ellwein et al.
did not always include the entire village in the AM and BW interventions. For logistical and economic reasons, these interventions did not attempt to cov- er every household in larger villages. Table 1 pre- sents the village, intervention and evaluation pop- ulations. Even if the intervention population coin- cides with a statistically drawn population, as it does when it includes the total village population, inferences to the entire study area (i.e., the pop- ulation in all, 1,589 villages) would be frustrated by economies of scale in scaling up to a much larger population base. Some costs (e.g., variable costs) would scale up proportionately, but others (fixed costs) would not. A similar difficulty exists in any attempt to scale down costs, for example, to the evaluation population. Cost data were not collect- ed in a manner that allows for separation of varia- ble and fixed components.
Cost-effectiveness comparisons require that cost and effectiveness data be combined and that they are reflective of the same population. Effectiveness data were collected from village subpopulation seg- ments that do not coincide exactly with the in- tervention target area used in obtaining cost data. Thus, the effectiveness data are only broadly repre- sentative of the intervention areas. The range of confidence of this representativeness is quantified through calculation of 95% confidence intervals. For comparisons of groups, standard two-sample t tests for proportions are used.
Table 1. Population aged 40 years and above in villages, in- tervention areas and evaluation segments.
Intervention Intervention Intervention Evaluation strategy villages target area segment
AM-P 12,651 5,615 2,224 AM-F 8,969 3,791 1,814 BW-P 10,938 6,399 2,223 BW-F 10,861 5,726 2,133 SV-P 9,743 9,743 1,686 SV-F 11,488 11,488 2,242 MM-P 55,209 55,209 1,947 MM-F 32,579 32,579 1,972 Control - - 2,100
Results
Differential costs associated with each of the four intervention and the two economic incentive op- tions are shown in Table 2 (reported in Rs, Indian rupees). Of the 184,866Rs in personnel costs, 108,910 Rs (59%) was incurred because of salaries for Aravind project management personnel and others not working specifically within a single in- tervention. These general personnel costs were al- located in direct proportion to intervention-specif- ic personnel costs. Intervention-specific personnel costs were primarily per diem and travel expenses of field workers and field supervisors. All such payments to individuals were reported as person- nel costs.
A large portion of the supply costs were associ- ated with the printing of forms, handbills, posters, medical supplies (SV), and video materials (MM). A total of 4,209 Rs of the 18,088 Rs supply costs was allocated proportionately. The only capital equipment costs were those for ophthalmic equip- ment used for the SV intervention and audio-video equipment for the MM intervention. These costs were allocated equally to each intervention site. Transportation costs reflect the use of Aravind Hospital vehicles. These costs were based on mile- age records. As noted previously, reimbursed field worker travel costs were reported within the per- sonnel category.
The two BW intervention strategies were the most costly. Although they were similar to AM in terms of method, they resulted in almost twice the differential cost. Two factors explain most of this cost increase. First, the BW intervention results in higher field worker travel expenses and allowanc- es. A common core of basic eye health workers traveled from village to village. Aphakic motiva- tors canvassed only the village in which they resid- ed plus, at most, one of two neighboring villages, thus reducing travel expenses. Secondly, as can be seen from Table 1, the population covered by the BW interventions is about 20% larger than that covered by the AM intervention.
Total differential SV intervention costs were the lowest. In part, this reflects the extensive experi- ence of the Aravind Eye Hospital in conducting
screening van operations. SV methods are well developed and streamlined for maximum efficien- cy. As expected, the transport vehicle costs for this intervention and MM were relatively large, the latter involving four visits for mass media presenta- tions in each market.
Intervention effectiveness as measured in the village evaluation segments is shown in Table 3. Shown are the number of individuals who were operated at least 12 months prior to the evaluation survey (aphakics), the number accepting surgery within the immediate 12 month period preceding the evaluation (acceptors) and the number still blind with cataract (refusers). Determination of the time of surgery was based on patient recall. By using 12 months as the time point to separate the previously aphakic from the intervention accept- ors, instead of the six to eight months of time separating the intervention implementation from the evaluation survey, difficulty in recall favored the acceptor category.
To be categorized as blind, visual acuity had to be less than 3/60. The number of people considered blind is obviously dependent on whether blindness is defined as bilateral blindness. The unilateral/ bilateral blindness definition has other, less obvi- ous, ramifications in the categorization of cases. For example, an individual who is blind due to cataract in one eye and is aphakic with spectacles or with intraocular lens implant in the other eye is categorized as 'previously aphakic' if blindness is
The cost effectiveness 179
defined bilaterally. However, this individual is cat- egorized as a 'refuser' if the unilateral blindness definition is followed. Further, if the non-aphakic eye is not blind, the individual would be categor- ized as 'aphakic' using the unilateral definition but would not appear in any of the three categories under the bilateral definition.
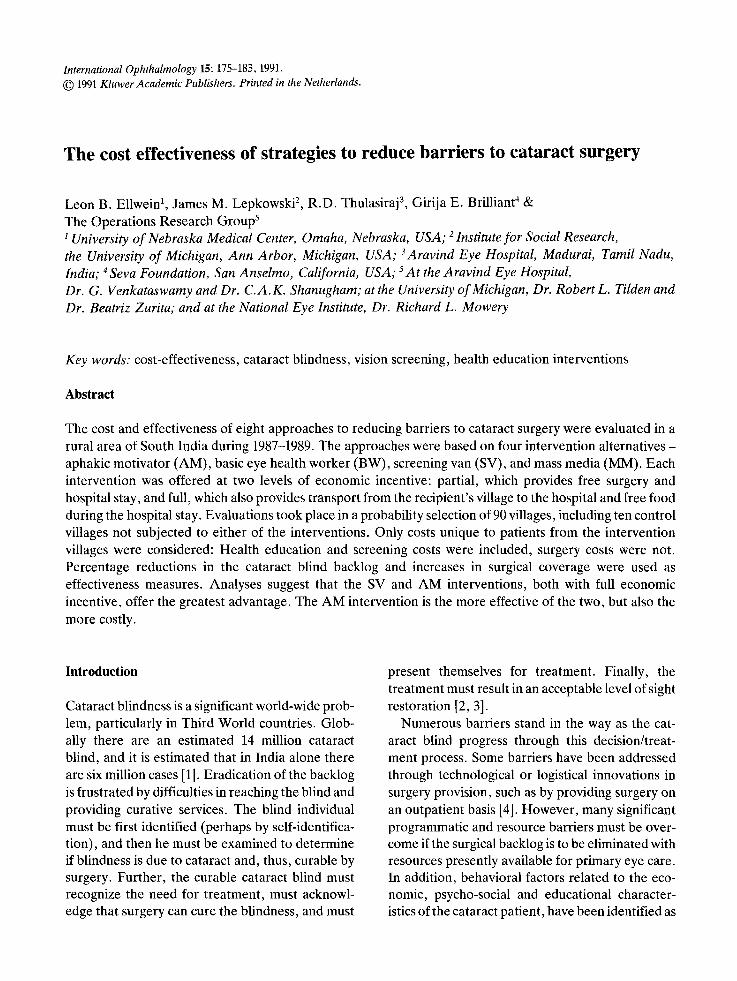
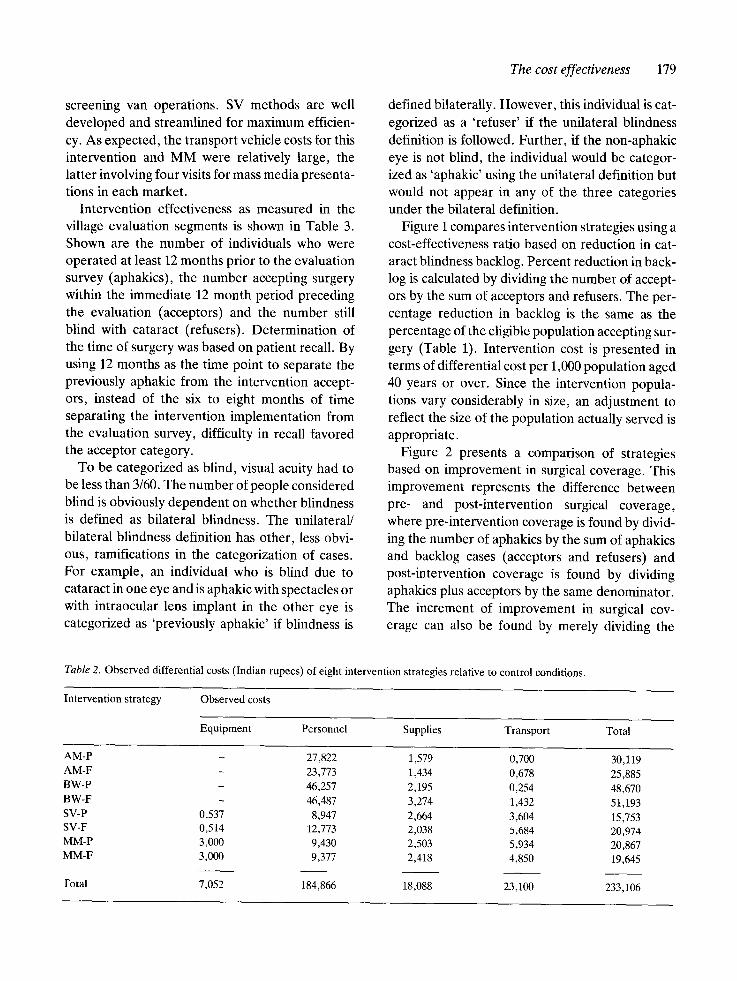
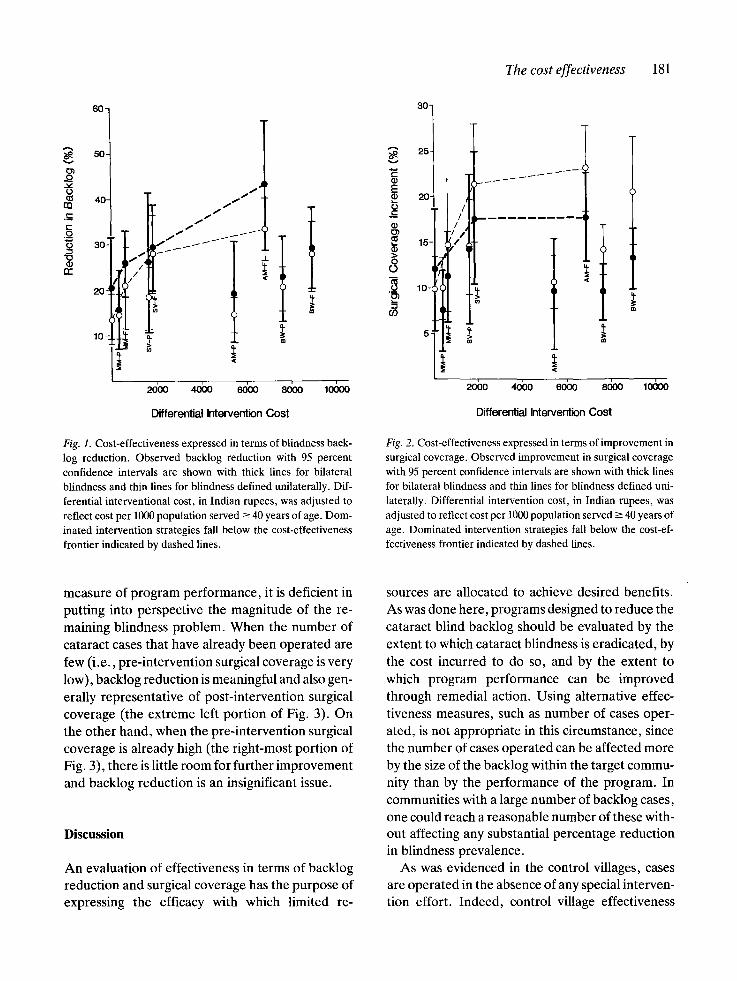
Figure 1 compares intervention strategies using a cost-effectiveness ratio based on reduction in cat- aract blindness backlog. Percent reduction in back- log is calculated by dividing the number of accept- ors by the sum of acceptors and refusers. The per- centage reduction in backlog is the same as the percentage of the eligible population accepting sur- gery (Table 1). Intervention cost is presented in terms of differential cost per 1,000 population aged 40 years or over. Since the intervention popula- tions vary considerably in size, an adjustment to reflect the size of the population actually served is appropriate.
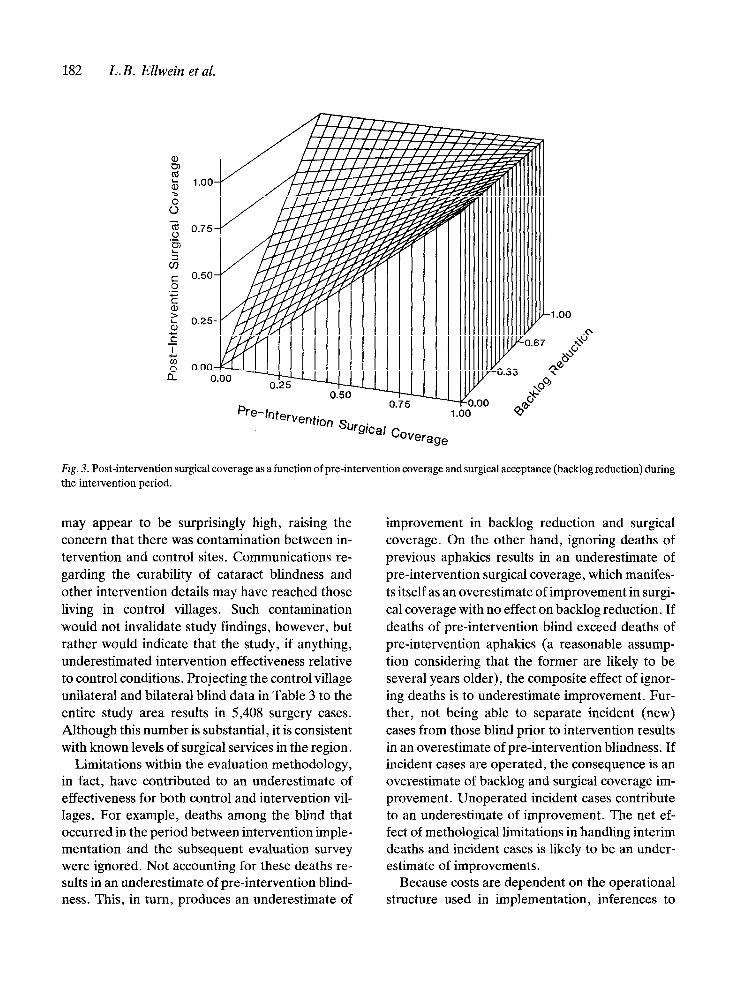
Figure 2 presents a comparison of strategies based on improvement in surgical coverage. This improvement represents the difference between pre- and post-intervention surgical coverage, where pre-intervention coverage is found by divid- ing the number of aphakics by the sum of aphakics and backlog cases (acceptors and refusers) and post-intervention coverage is found by dividing aphakics plus acceptors by the same denominator. The increment of improvement in surgical cov- erage can also be found by merely dividing the
Table 2. Observed differential costs (Indian rupees) of eight intervention strategies relative to control conditions.
Intervention strategy Observed costs
Equipment Personnel Supplies Transport Total
AM-P - 27,822 1,579 0,700 30,119 AM-F - 23,773 1,434 0,678 25,885 B W-P - 46,257 2,195 0,254 48,670 BW-F - 46,487 3,274 1,432 51,193 SV-P 0,537 8,947 2,664 3,604 15,753 SV-F 0,514 12,773 2,038 5,684 20,974 MM-P 3,000 9,430 2,503 5,934 20,867 MM-F 3,000 9,377 2,418 4,850 19,645
Total 7,052 184,866 18,088 23,100 233,106
180 L.B. Ellwein et al.
number of acceptors by the sum of aphakics, ac- ceptors and refusers (Table 1).
Whether either cost-effectiveness ratio is used, it appears that SV-F and AM-F strategies have an advantage over the others. Under the unilateral definition of blindness, both of these strategies are at a statistically significant (p < 0.05) greater level of effectiveness in comparison to the control level. Under the bilateral definition, only the AM-F strategy is significant. Even though the effective- ness level differs little from that seen in control villages, the MM-F strategy appears on the cost- effectiveness frontier because of its low popula- tion-adjusted cost. In spite of relatively high expen- ditures, the BW strategies and the AM-P strategy are not effective. These strategies, along with the SV-P and MM-P strategies, are completely dom- inated by the SV-F and AM-F strategies.
In general, the full economic incentive strategies dominate the corresponding partial ones because of differences in effectiveness, not cost. This il- lustrates that not just total expenditure levels, but also 'who pays', can be pivotal in affecting the effectiveness of a program. The issue of 'who pays'
- the individual or the program - is, of course, also important in program budgeting.
In comparing the two most attractive strategies, it can be noted that the cost per effectiveness unit is lower with the SV-F strategy than it is with AM-F. This should not be taken, however, to reflect supe-
riority, particularly if the objective is to maximize backlog reduction or surgical coverage, and if re- sources are available to implement this more costly strategy. On the other hand, if minimizing cost is the objective, then not SV-F, but doing nothing (the control option) would be preferred. Obvious- ly, the strategy lowest in differential cost per effec- tiveness unit may not produce an acceptable degree of effectiveness achievement.
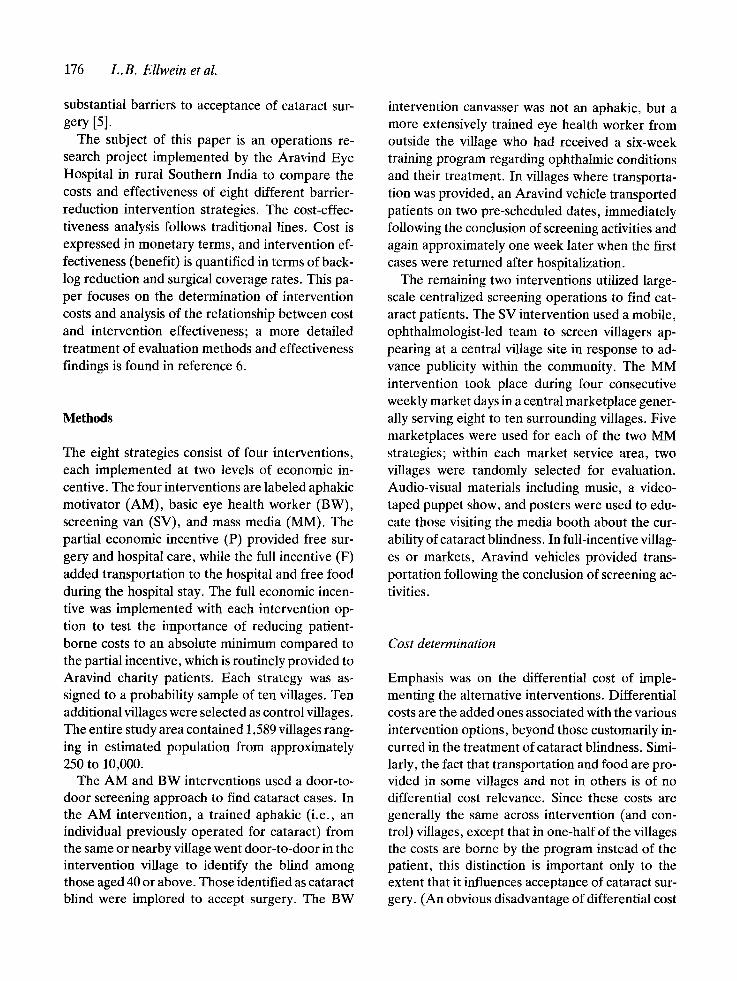
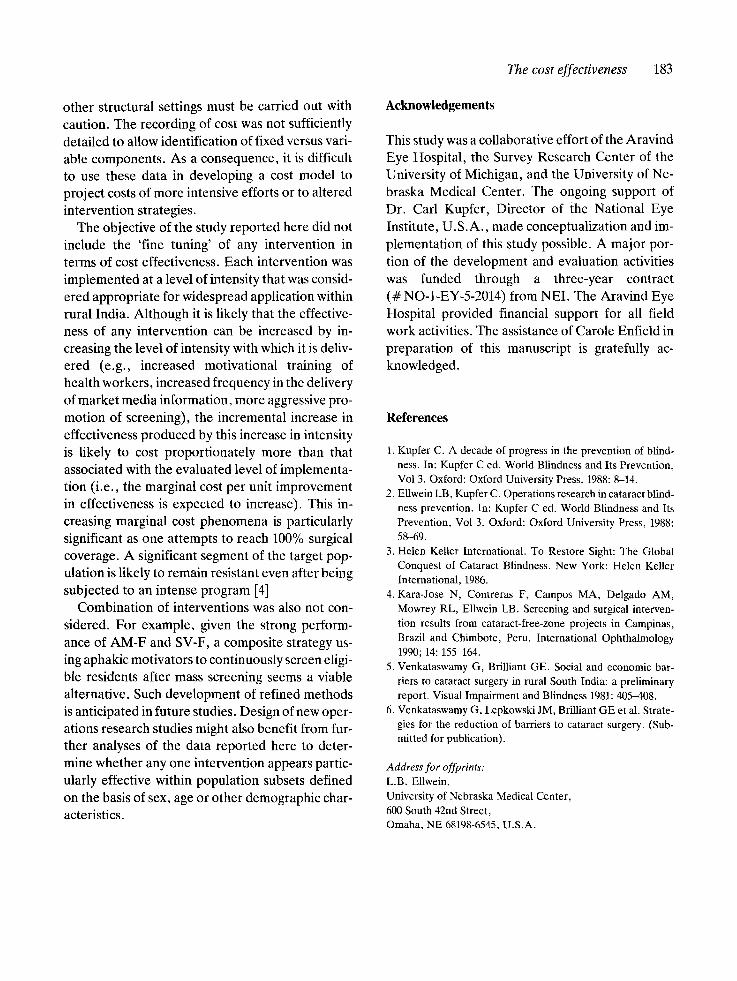
In comparing Figs 1 and 2, it can be seen that backlog reduction (surgical acceptance) is greater among the bilaterally blind than for the unilateral and bilateral blind combined; yet, the improve- ment in surgical coverage is less for the bilaterally blind. This seemingly inconsistent result occurs be- cause pre-intervention surgical coverage for the bilaterally blind is already high compared to that for the unilateral blind; thus, the greatest potential for surgical coverage improvement lies with the unilateral blind, where a sizeable improvement can be effected even with the more modest surgical acceptance rate. When the pre-intervention surgi- cal coverage is near 100%, the margin for improve- ment in coverage, even with a very high acceptance rate among the few still blind, is obviously very limited.
This relationship between pre-intervention cov- erage, backlog reduction and post-intervention coverage is illustrated in Fig. 3. Although backlog reduction, or surgical acceptance, is an appealing
Table 3. Observed intervent ion effectiveness in village evaluation segments .
Bilaterally blind Unilateral or bilateral blind
Previously Cases Cases Surgical Surgical Previously Cases Cases Surgical Surgical
aphakic accepting refusing acceptance coverage aphakic accepting refusing acceptance coverage
cases surgery surgery rate* increment* cases surgery surgery rate* increment*
AM-P 79 14 58 19 .4+ 5.6 9 . 3 + 3.1 AM-F 59 18 24 42.9 + 7.3 17.8 + 2.5 BW-P 66 11 38 22.4 + 4.7 9.6 + 1.6 BW-F 74 18 44 29.0 + 4.6 13.2 + 1.7
SV-P 38 12 34 2 6 . 1 + 7.8 14 .3+ 4.2 SV-F 49 22 53 29.3 + 4.8 17.7 + 3.7
MM-P 56 8 43 15.7__+ 4.4 7.5 + 2.3 MM-F 71 14 40 25.9 + 3.7 11.2 + 2.5 Control 52 15 58 20.5 __+ 5.7 12.0 + 3.4
67 28 166 14.4 + 2.0 65 49 98 33.3 + 3.5 68 31 120 20.5 + 2.7 67 54 140 27.8 + 4.1 34 23 103 18.2 _+ 3.5
55 51 131 28.0 + 4.3 64 21 126 14.3 _+ 2.5 67 34 130 20.7 _+ 4.6 63 23 146 13.6 + 2.8
10.7 __+ 1.5 23.1 + 2.4 14.2 ___ 1.4 21.7 __+ 3.0 14.4 + 2.6
21.5 + 3.3 10.0 __+ 1.7 14.7 + 3.7 9.9 + 1.8
* % ___ s tandard error.
The cost effectiveness 181
v ,
e -
60"
50.
40-
3o"
20~
10-
30-1 ' 1 /.~. t~' ~ 20
/ f m
, ~ . ~ t ~ ~
2obo ,.Jbo lo oo 2obo
m
40'00 60~:) 8()00 10000
Differential Intervention Cost Differential Intervention Cost
Fig. 1. Cost-effectiveness expressed in terms of blindness back- log reduction. Observed backlog reduction with 95 percent confidence intervals are shown with thick lines for bilateral blindness and thin lines for blindness defined unilaterally. Dif- ferential interventional cost, in Indian rupees, was adjusted to reflect cost per 1000 population served -> 40 years of age. Dom- inated intervention strategies fall below the cost-effectiveness frontier indicated by dashed lines.
Fig. 2. Cost-effectiveness expressed in terms of improvement in surgical coverage. Observed improvement in surgical coverage with 95 percent confidence intervals are shown with thick lines for bilateral blindness and thin lines for blindness defined uni- laterally. Differential intervention cost, in Indian rupees, was adjusted to reflect cost per 1000 population served --- 40 years of age. Dominated intervention strategies fall below the cost-ef- fectiveness frontier indicated by dashed lines.
measure of program performance, it is deficient in putting into perspective the magnitude of the re- maining blindness problem. When the number of cataract cases that have already been operated are few (i.e., pre-intervention surgical coverage is very low), backlog reduction is meaningful and also gen- erally representative of post-intervention surgical coverage (the extreme left portion of Fig. 3). On the other hand, when the pre-intervention surgical coverage is already high (the right-most portion of Fig. 3), there is little room for further improvement and backlog reduction is an insignificant issue.
Discussion
An evaluation of effectiveness in terms of backlog reduction and surgical coverage has the purpose of expressing the efficacy with which limited re-
sources are allocated to achieve desired benefits. As was done here, programs designed to reduce the cataract blind backlog should be evaluated by the extent to which cataract blindness is eradicated, by the cost incurred to do so, and by the extent to which program performance can be improved through remedial action. Using alternative effec- tiveness measures, such as number of cases oper- ated, is not appropriate in this circumstance, since the number of cases operated can be affected more by the size of the backlog within the target commu- nity than by the performance of the program. In communities with a large number of backlog cases, one could reach a reasonable number of these with- out affecting any substantial percentage reduction in blindness prevalence.
As was evidenced in the control villages, cases are operated in the absence of any special interven- tion effort. Indeed, control village effectiveness
182 L. B. Ellwein et al.
Pre-lntervemion surgical Coverage
Fig. 3. Post-intervention surgical coverage as a function of pre-intervention coverage and surgical acceptance (backlog reduction) during the intervention period.
may appear to be surprisingly high, raising the concern that there was contamination between in- tervention and control sites. Communications re- garding the curability of cataract blindness and other intervention details may have reached those living in control villages. Such contamination would not invalidate study findings, however, but rather would indicate that the study, if anything, underestimated intervention effectiveness relative to control conditions. Projecting the control village unilateral and bilateral blind data in Table 3 to the entire study area results in 5,408 surgery cases. Although this number is substantial, it is consistent with known levels of surgical services in the region.
Limitations within the evaluation methodology, in fact, have contributed to an underestimate of effectiveness for both control and intervention vil- lages. For example, deaths among the blind that occurred in the period between intervention imple- mentation and the subsequent evaluation survey were ignored. Not accounting for these deaths re- sults in an underestimate of pre-intervention blind- ness. This, in turn, produces an underestimate of
improvement in backlog reduction and surgical coverage. On the other hand, ignoring deaths of previous aphakics results in an underestimate of pre-intervention surgical coverage, which manifes- ts itself as an overestimate of improvement in surgi- cal coverage with no effect on backlog reduction. If deaths of pre-intervention blind exceed deaths of pre-intervention aphakics (a reasonable assump- tion considering that the former are likely to be several years older), the composite effect of ignor- ing deaths is to underestimate improvement. Fur- ther, not being able to separate incident (new) cases from those blind prior to intervention results in an overestimate of pre-intervention blindness. If incident cases are operated, the consequence is an overestimate of backlog and surgical coverage im- provement. Unoperated incident cases contribute to an underestimate of improvement. The net ef- fect of methological limitations in handling interim deaths and incident cases is likely to be an under- estimate of improvements.
Because costs are dependent on the operational structure used in implementation, inferences to
other structural settings must be carried out with caution. The recording of cost was not sufficiently detailed to allow identification of fixed versus vari- able components. As a consequence, it is difficult to use these data in developing a cost model to project costs of more intensive efforts or to altered intervention strategies.
The objective of the study reported here did not include the 'fine tuning' of any intervention in terms of cost effectiveness. Each intervention was implemented at a level of intensity that was consid- ered appropriate for widespread application within rural India. Although it is likely that the effective- ness of any intervention can be increased by in- creasing the level of intensity with which it is deliv- ered (e.g., increased motivational training of health workers, increased frequency in the delivery of market media information, more aggressive pro- motion of screening), the incremental increase in effectiveness produced by this increase in intensity is likely to cost proportionately more than that associated with the evaluated level of implementa- tion (i.e., the marginal cost per unit improvement in effectiveness is expected to increase). This in- creasing marginal cost phenomena is particularly significant as one attempts to reach 100% surgical coverage. A significant segment of the target pop- ulation is likely to remain resistant even after being subjected to an intense program [4]
Combination of interventions was also not con- sidered. For example, given the strong perform- ance of AM-F and SV-F, a composite strategy us- ing aphakic motivators to continuously screen eligi- ble residents after mass screening seems a viable alternative. Such development of refined methods is anticipated in future studies. Design of new oper- ations research studies might also benefit from fur- ther analyses of the data reported here to deter- mine whether any one intervention appears partic- ularly effective within population subsets defined on the basis of sex, age or other demographic char- acteristics.
The cost effectiveness 183
Acknowledgements
This study was a collaborative effort of the Aravind Eye Hospital, the Survey Research Center of the University of Michigan, and the University of Ne- braska Medical Center. The ongoing support of Dr. Carl Kupfer, Director of the National Eye Institute, U.S.A., made conceptualization and im- plementation of this study possible. A major por- tion of the development and evaluation activities was funded through a three-year contract (# NO-1-EY-5-2014) from NEI. The Aravind Eye Hospital provided financial support for all field work activities. The assistance of Carole Enfield in preparation of this manuscript is gratefully ac- knowledged.
References
1. Kupfer C. A decade of progress in the prevention of blind- ness. In: Kupfer C ed. World Blindness and Its Prevention, Vol 3. Oxford: Oxford University Press, 1988: 8-14.
2. Ellwein LB, Kupfer C. Operations research in cataract blind- ness prevention. In: Kupfer C ed. World Blindness and Its Prevention, Vol 3. Oxford: Oxford University Press, 1988: 58--69.
3. Helen Keller International. To Restore Sight: The Global Conquest of Cataract Blindness. New York: Helen Keller International, 1986.
4. Kara-Jose N, Contreras F, Campos MA, Delgado AM, Mowrey RL, Ellwein LB. Screening and surgical interven- tion results from cataract-free-zone projects in Campinas, Brazil and Chimbote, Peru. International Ophthalmology 1990; 14: 155-164.
5. Venkataswamy G, Brilliant GE. Social and economic bar- riers to cataract surgery in rural South India: a preliminary report. Visual Impairment and Blindness 1981: 405-408.
6. Venkataswamy G, Lepkowski JM, Brilliant GE et al. Strate- gies for the reduction of barriers to cataract surgery. (Sub- mitted for publication).
Address for offprints: L.B. Ellwein, University of Nebraska Medical Center, 600 South 42nd Street, Omaha, NE 68198-6545, U.S.A.


![Overview of Congenital, Senile and Metabolic Cataractrelated cataract [7] and metabolic cataract [8]. Congenital & Senile Cataract Cataract is a clouding of the eye’s natural lens](https://img.pdfslide.net/doc/110x75/5f361b7a353bcc123d74d127/overview-of-congenital-senile-and-metabolic-cataract-related-cataract-7-and-metabolic.jpg)