Embed Size (px)
Citation preview
The Current Status ofThe Current Status of Capital Markets of Sri Lanka
Ravi Abeysuriya, CFADirector / CEOCandor Group
Page 1
CONFIDENTIAL AND PROPRIETARYAny use of this material without specific permission of Candor is strictly prohibited
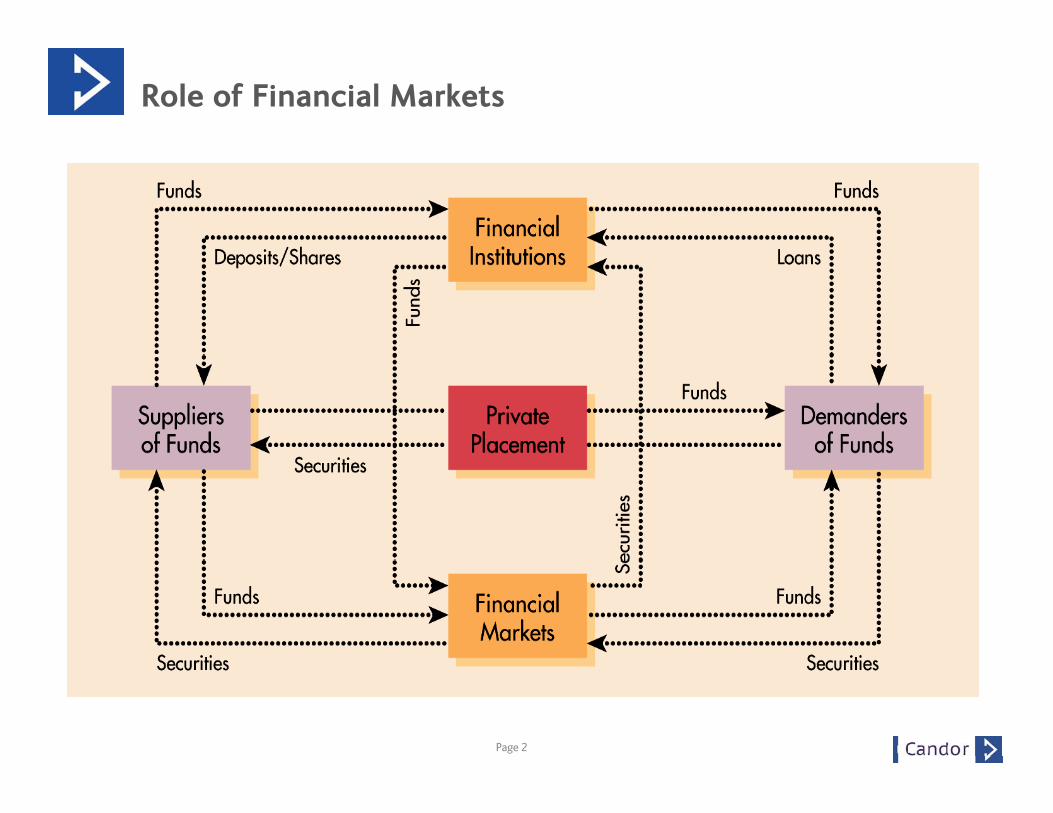
Role of Financial Markets
Page 2
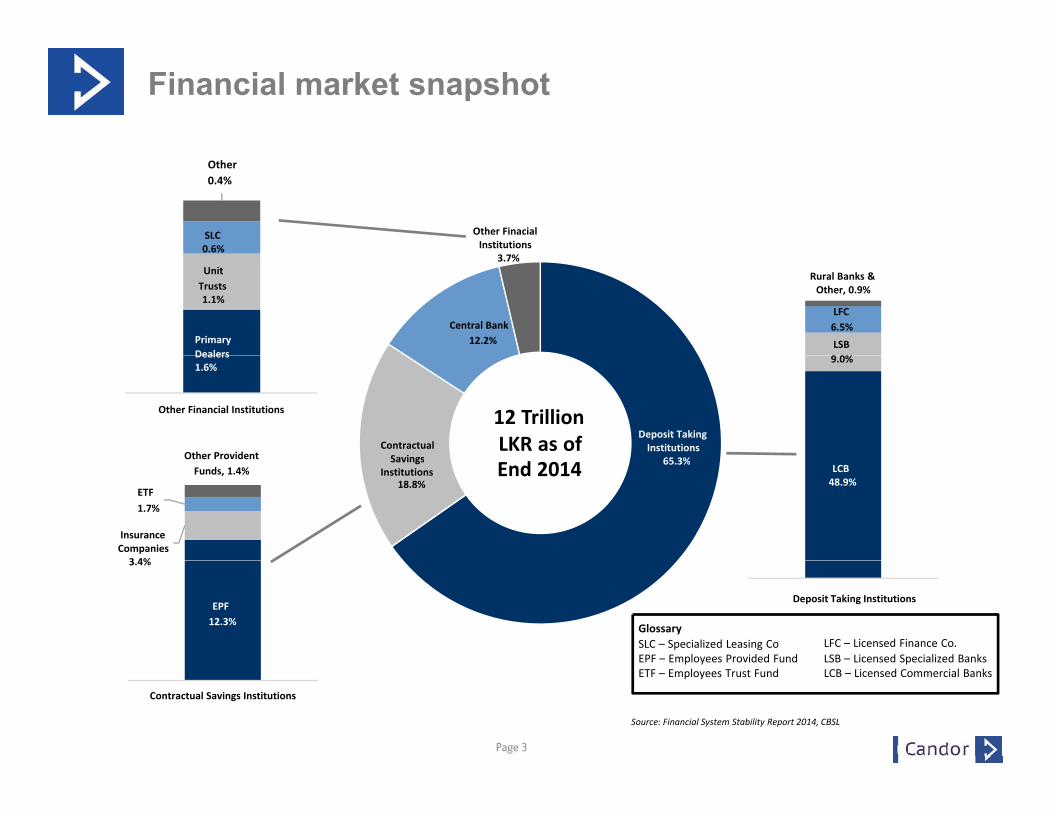
Financial market snapshot
Other FinacialInstitutions
SLC0.6%
Other0.4%
3.7%
Central Bank12.2%
Rural Banks &Other, 0.9%
LFC6.5%LSB9 0%
UnitTrusts1.1%
PrimaryDealers
Deposit TakingInstitutions
65 3%ContractualSavings
9.0%Dealers1.6%
Other Financial Institutions
Other Provident
12 TrillionLKR as of
65.3%SavingsInstitutions
18.8%LCB48.9%
InsuranceCompanies
3 4%
Other ProvidentFunds, 1.4%
ETF1.7%
End 2014
3.4%
EPF12.3% Glossary
SLC – Specialized Leasing CoEPF – Employees Provided Fund
LFC – Licensed Finance Co.LSB – Licensed Specialized Banks
Deposit Taking Institutions
Page 3
Contractual Savings Institutions
p yETF – Employees Trust Fund
pLCB – Licensed Commercial Banks
Source: Financial System Stability Report 2014, CBSL
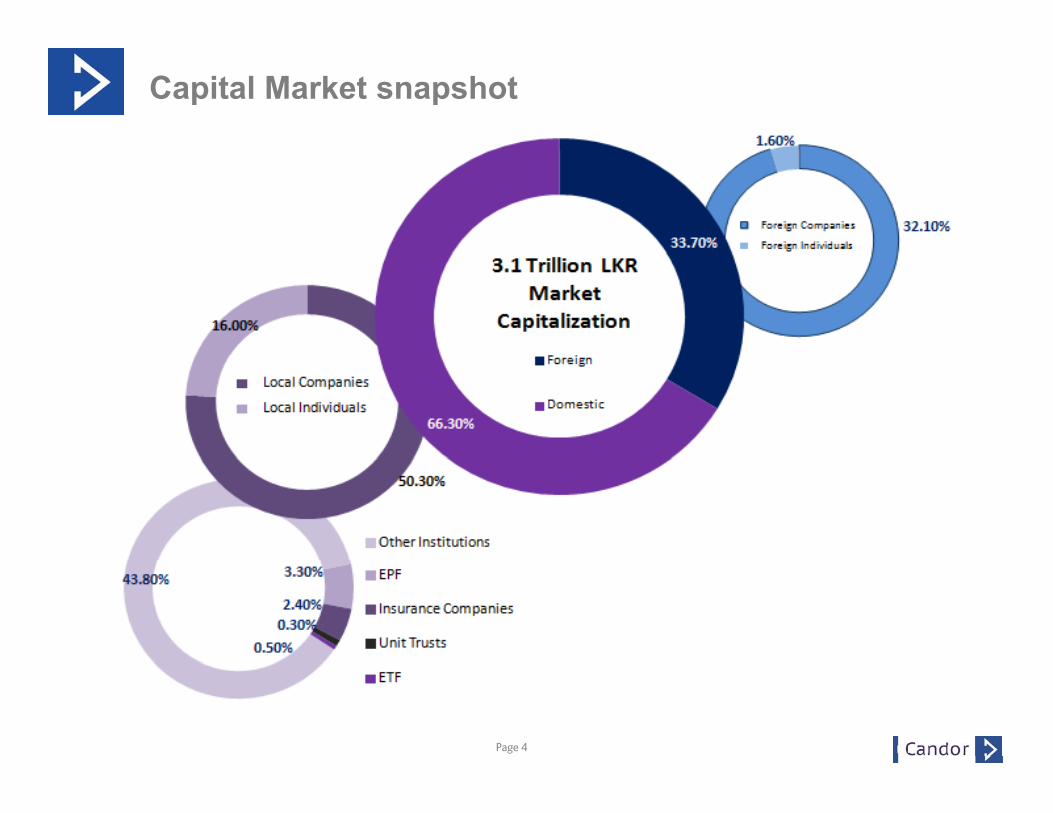
Capital Market snapshot
Page 4
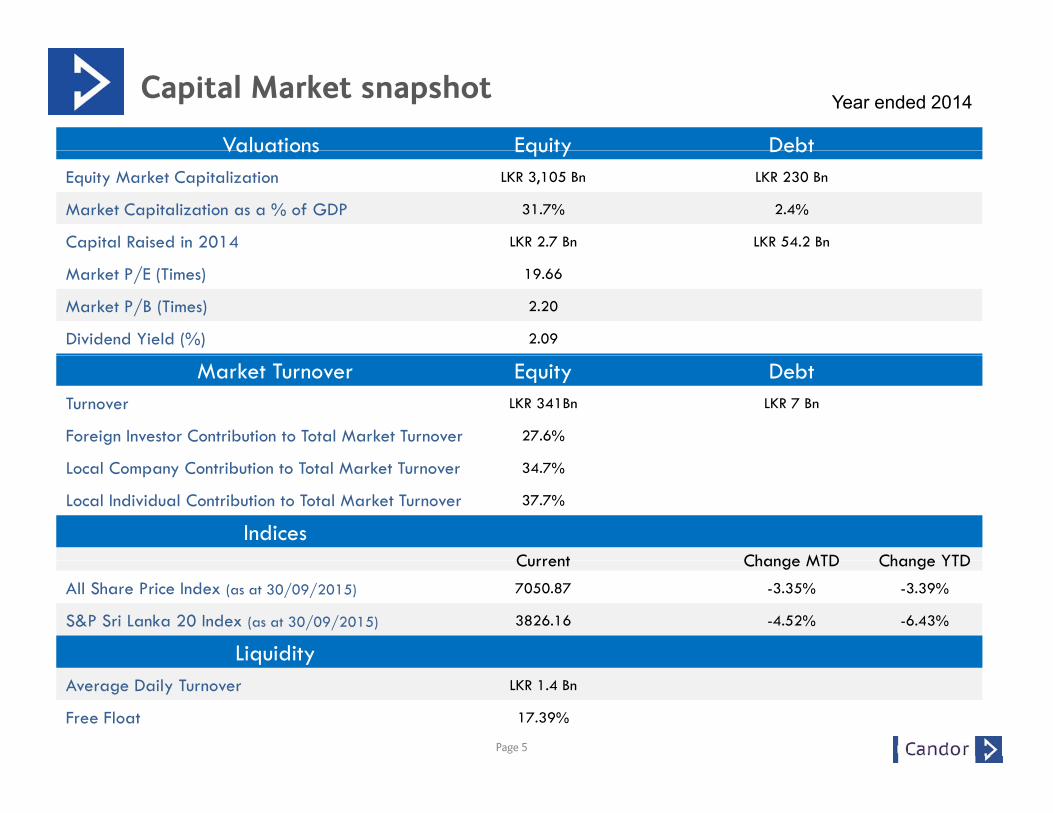
Capital Market snapshot
Valuations Equity Debt
Year ended 2014
Valuations Equity DebtEquity Market Capitalization LKR 3,105 Bn LKR 230 Bn
Market Capitalization as a % of GDP 31.7% 2.4%
Capital Raised in 2014 LKR 2.7 Bn LKR 54.2 Bn
Market P/E (Times) 19.66
Market P/B (Times) 2.20
Dividend Yield (%) 2.09
Market Turnover Equity DebtTurnover LKR 341Bn LKR 7 Bn
Foreign Investor Contribution to Total Market Turnover 27.6%
Local Company Contribution to Total Market Turnover 34.7%
Local Individual Contribution to Total Market Turnover 37.7%
IndicesCurrent Change MTD Change YTDCurrent Change MTD Change YTD
All Share Price Index (as at 30/09/2015) 7050.87 -3.35% -3.39%
S&P Sri Lanka 20 Index (as at 30/09/2015) 3826.16 -4.52% -6.43%
Liquidity
Page 5
q yAverage Daily Turnover LKR 1.4 Bn
Free Float 17.39%
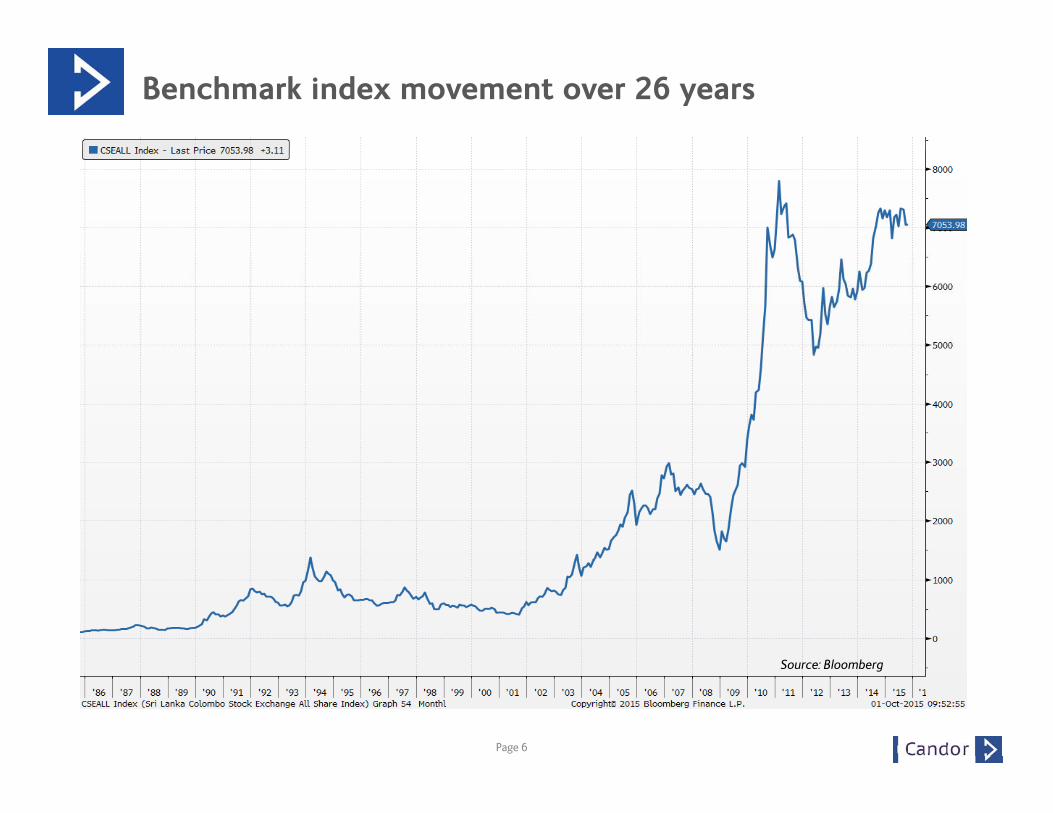
Benchmark index movement over 26 years
Source: Bloomberg
Page 6
Source: Bloomberg
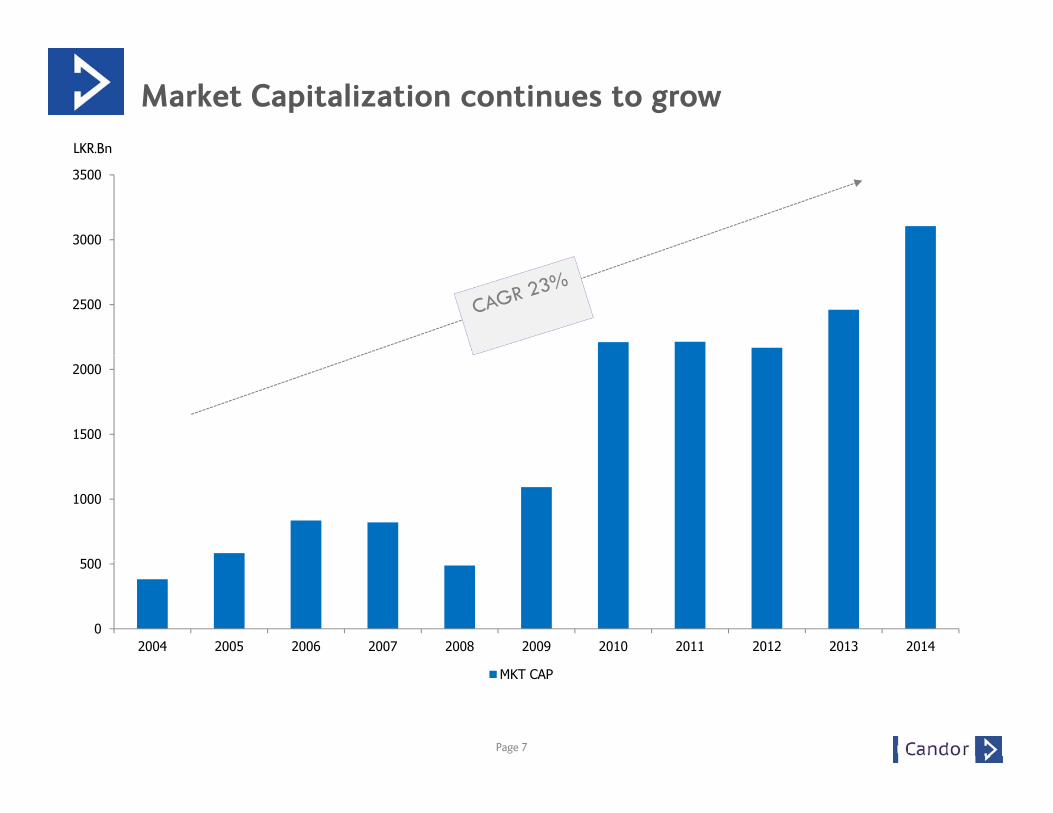
Market Capitalization continues to growLKR Bn
3000
3500
LKR.Bn
2500
1500
2000
500
1000
0
500
2004 2005 2006 2007 2008 2009 2010 2011 2012 2013 2014
Page 7
MKT CAP
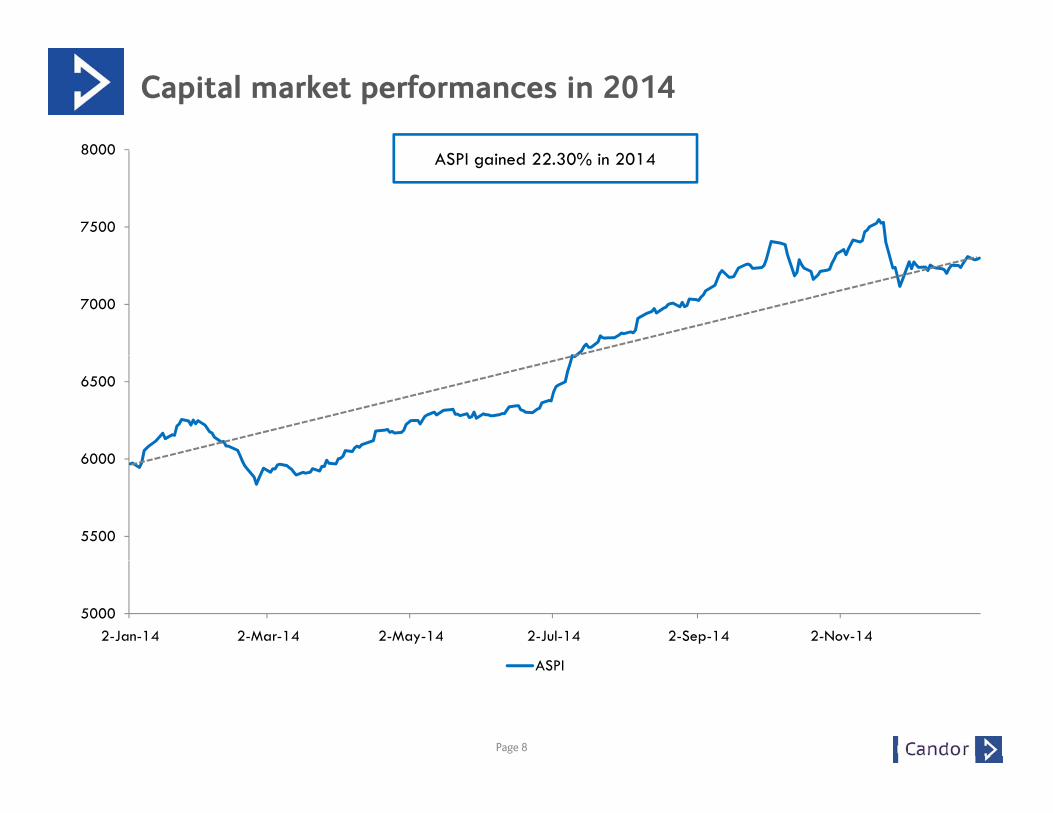
Capital market performances in 2014
8000
7500
8000 ASPI gained 22.30% in 2014
7000
6000
6500
5500
6000
50002-Jan-14 2-Mar-14 2-May-14 2-Jul-14 2-Sep-14 2-Nov-14
ASPI
Page 8
ASPI
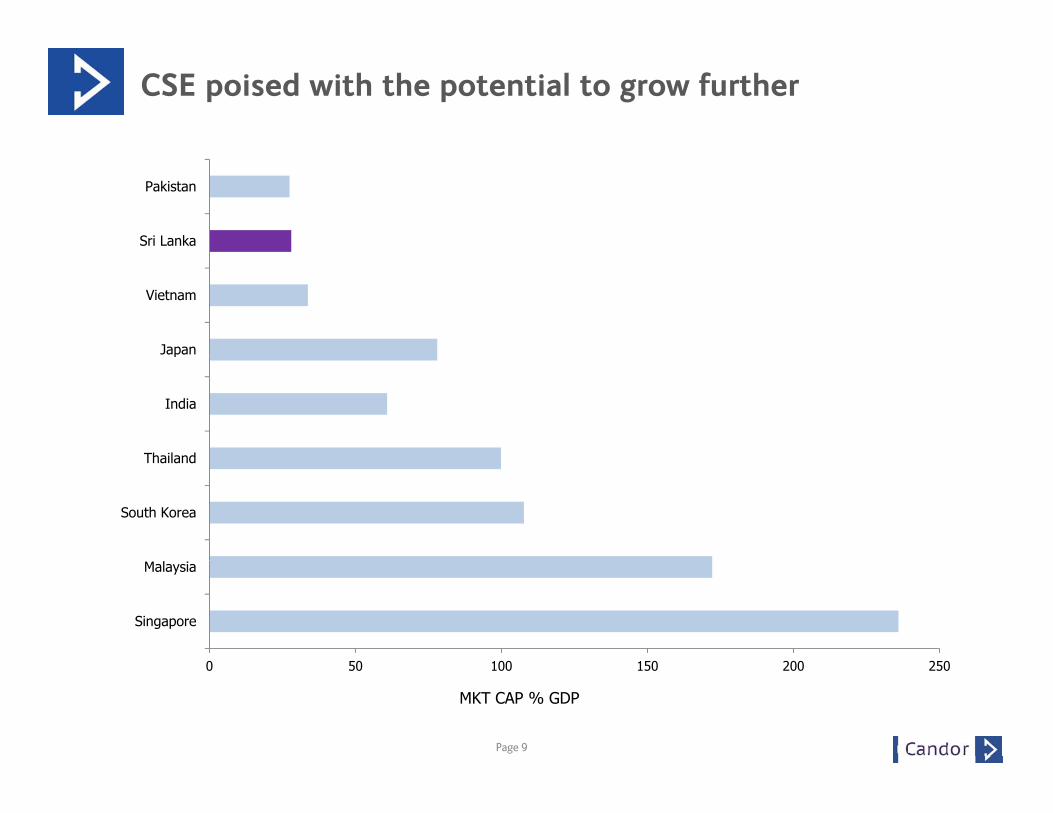
CSE poised with the potential to grow further
Sri Lanka
Pakistan
Japan
Vietnam
Thailand
India
p
South Korea
Thailand
0 50 100 150 200 250
Singapore
Malaysia
Page 9
0 50 100 150 200 250
MKT CAP % GDP
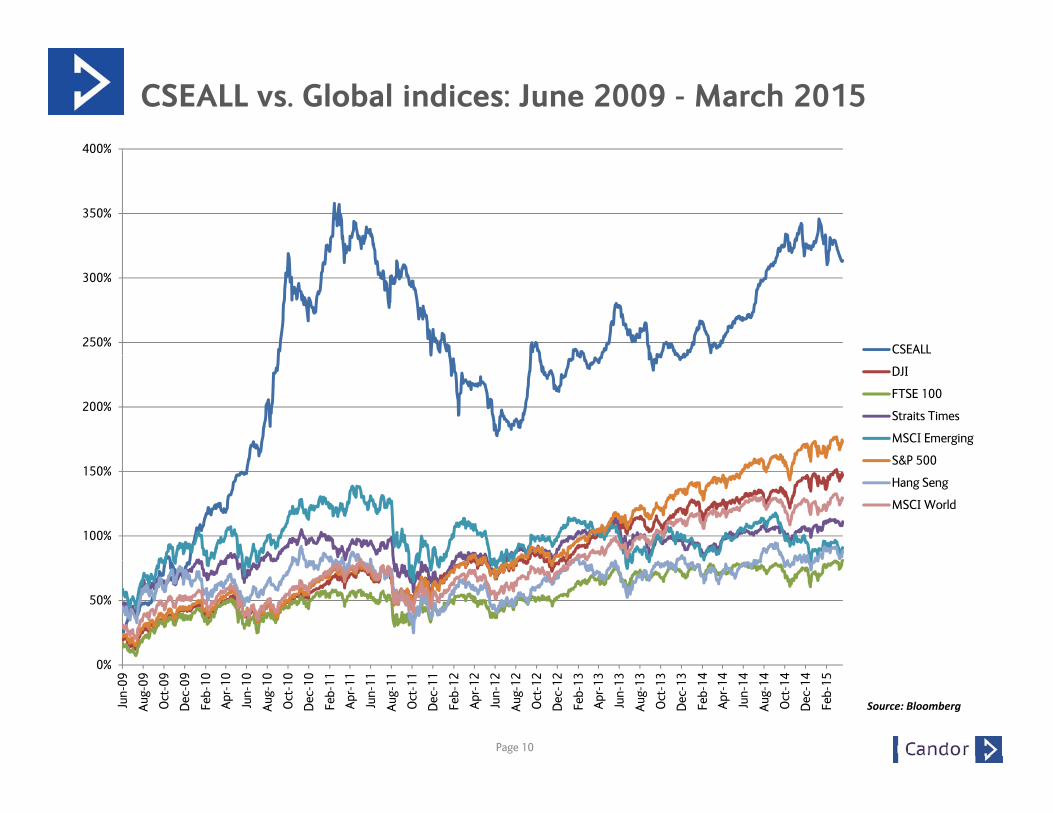
CSEALL vs. Global indices: June 2009 - March 2015400%
350%
400%
250%
300%
CSEALL
200%
DJI
FTSE 100
Straits Times
MSCI Emerging
S&P 500
100%
150%S&P 500
Hang Seng
MSCI World
0%
50%
Page 10
0%
Jun-
09
Aug-
09
Oct
-09
Dec
-09
Feb-
10Ap
r-10
Jun-
10
Aug-
10
Oct
-10
Dec
-10
Feb-
11Ap
r-11
Jun-
11
Aug-
11
Oct
-11
Dec
-11
Feb-
12Ap
r-12
Jun-
12
Aug-
12
Oct
-12
Dec
-12
Feb-
13Ap
r-13
Jun-
13
Aug-
13
Oct
-13
Dec
-13
Feb-
14Ap
r-14
Jun-
14
Aug-
14
Oct
-14
Dec
-14
Feb-
15
Source: Bloomberg
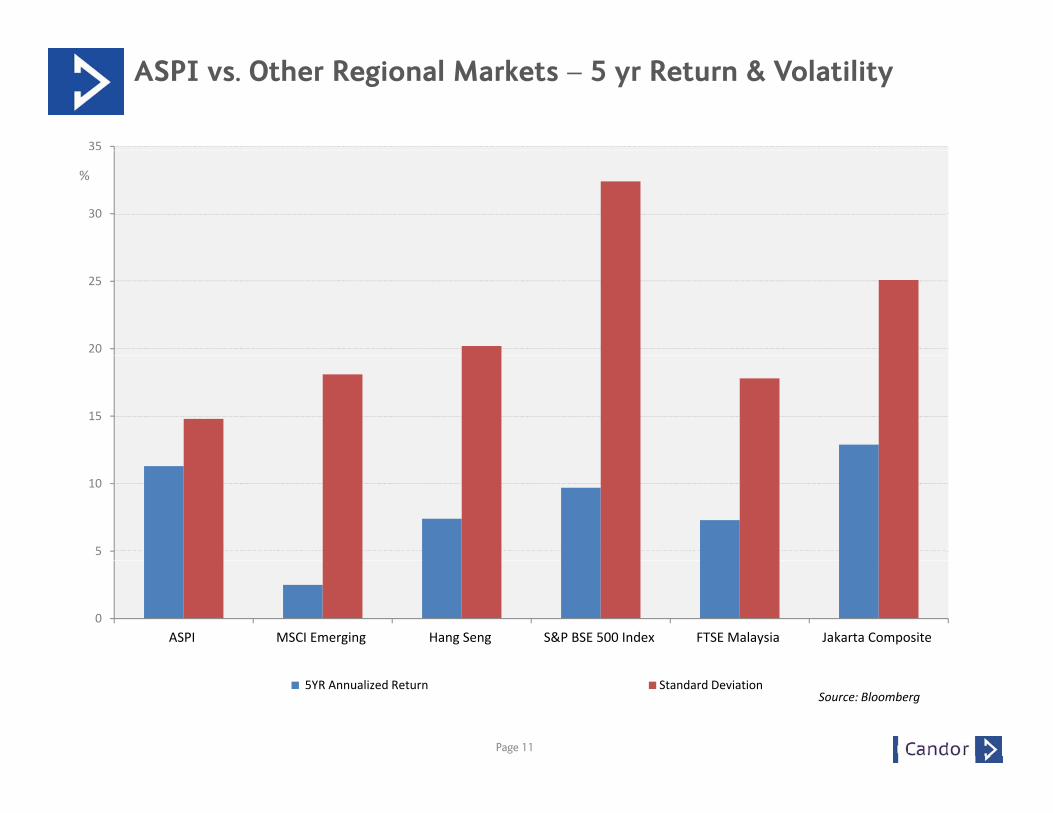
ASPI vs. Other Regional Markets – 5 yr Return & Volatility
35
30
%
20
25
15
5
10
0ASPI MSCI Emerging Hang Seng S&P BSE 500 Index FTSE Malaysia Jakarta Composite
Page 11
5YR Annualized Return Standard DeviationSource: Bloomberg
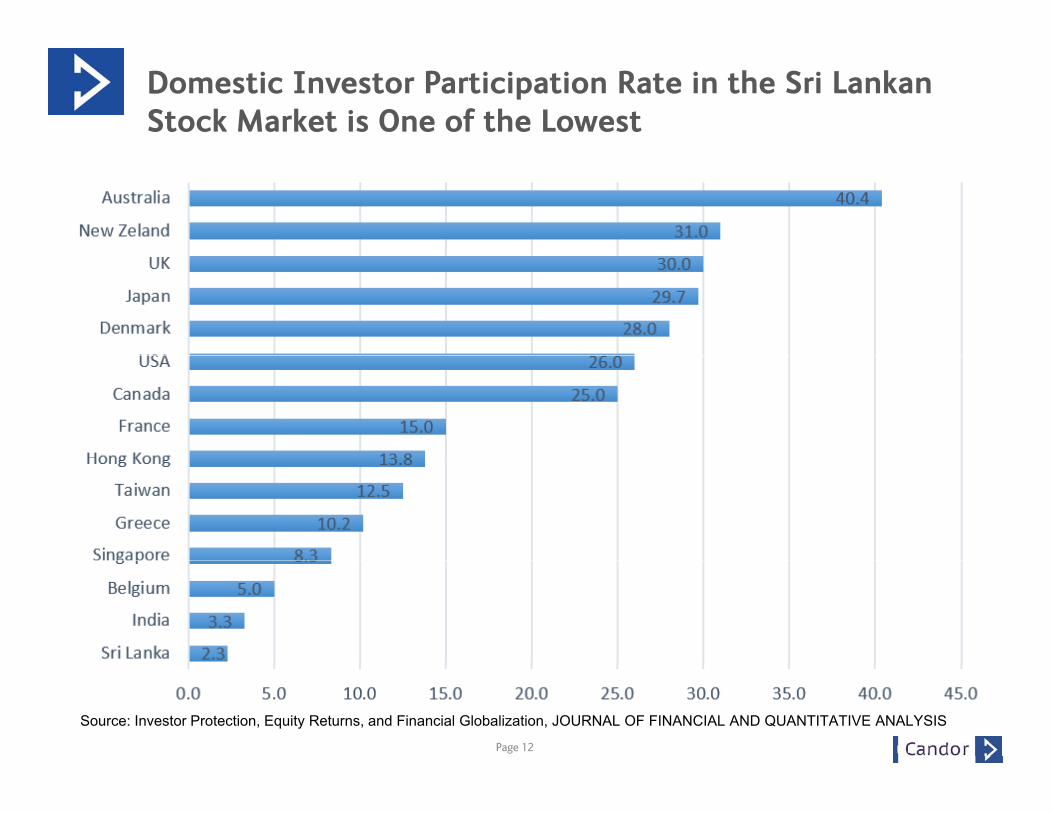
Domestic Investor Participation Rate in the Sri Lankan Stock Market is One of the Lowest
Page 12
Source: Investor Protection, Equity Returns, and Financial Globalization, JOURNAL OF FINANCIAL AND QUANTITATIVE ANALYSIS
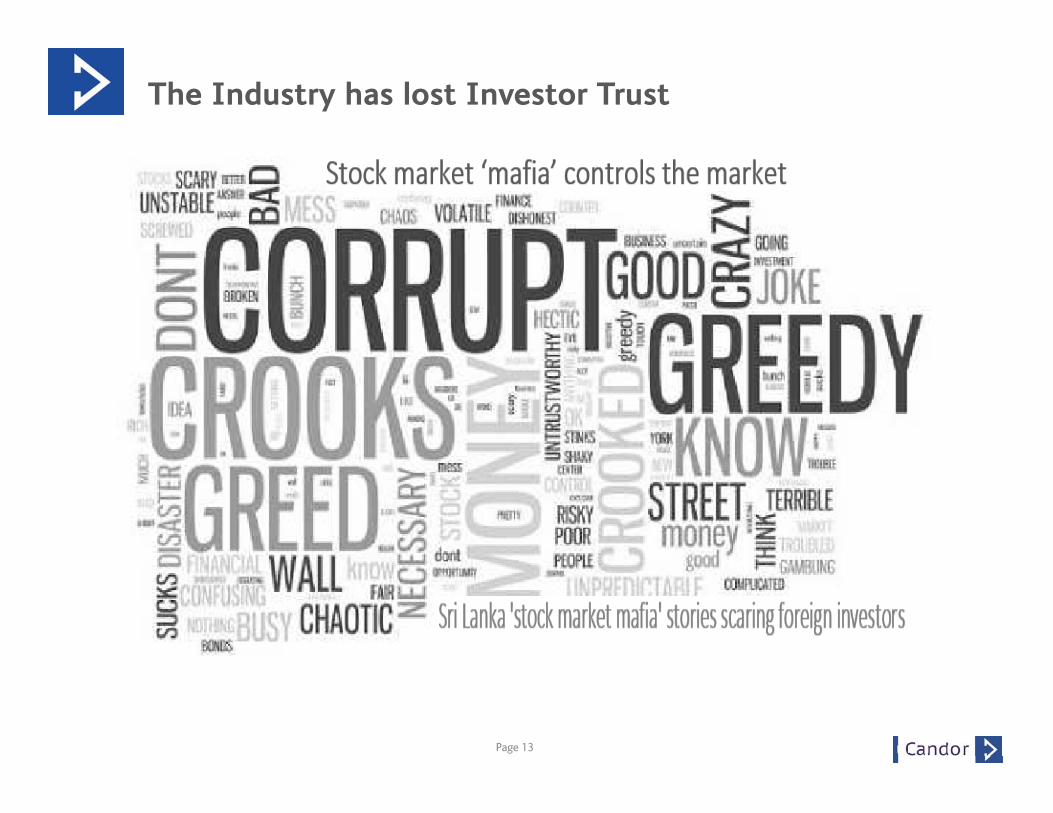
The Industry has lost Investor Trust
Page 13
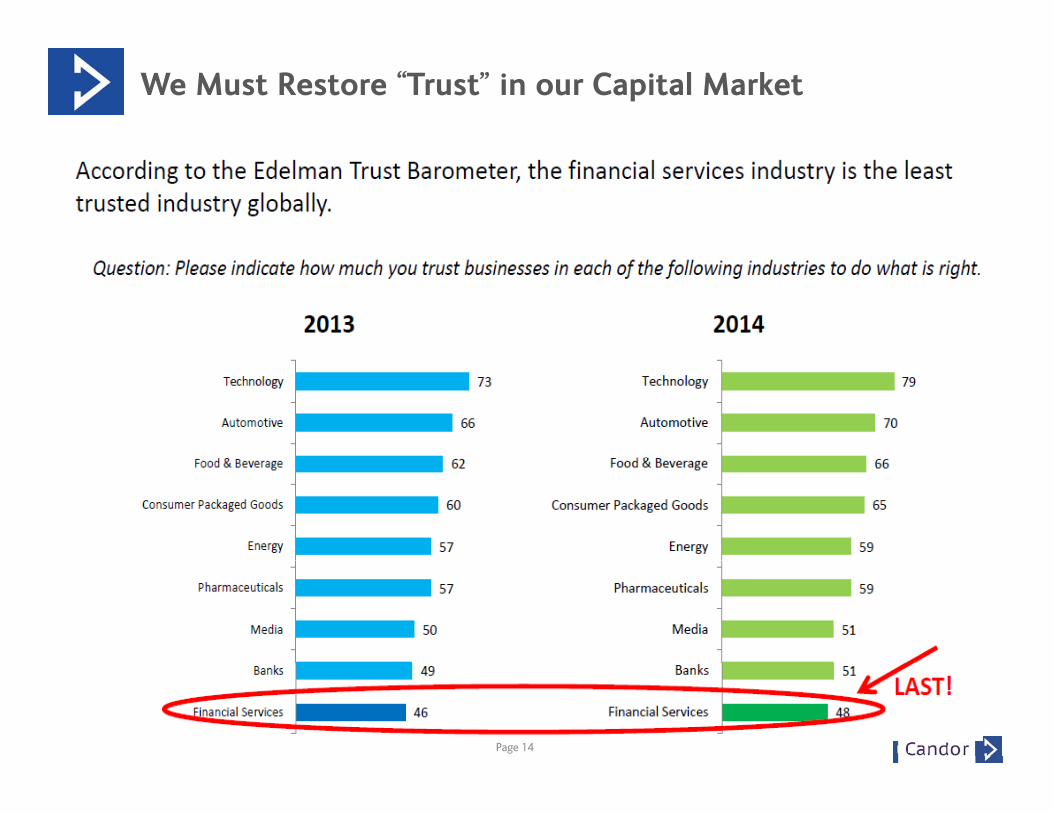
We Must Restore “Trust” in our Capital Market
Page 14
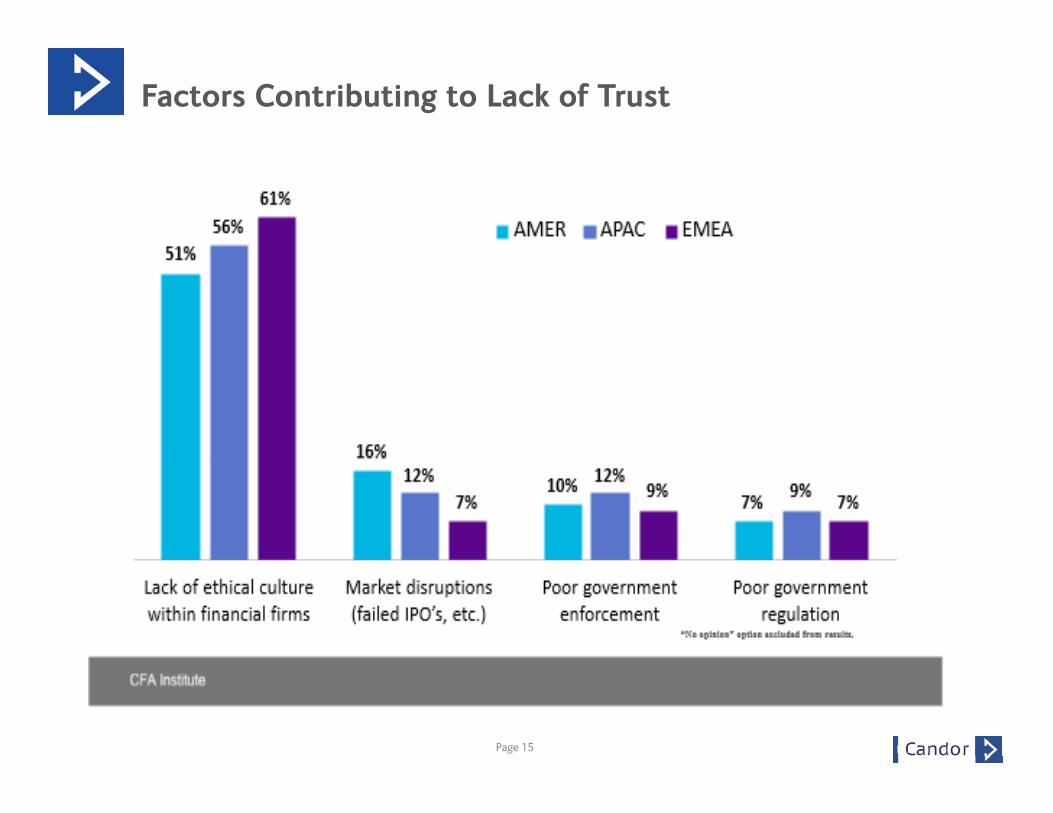
Factors Contributing to Lack of Trust
Page 15
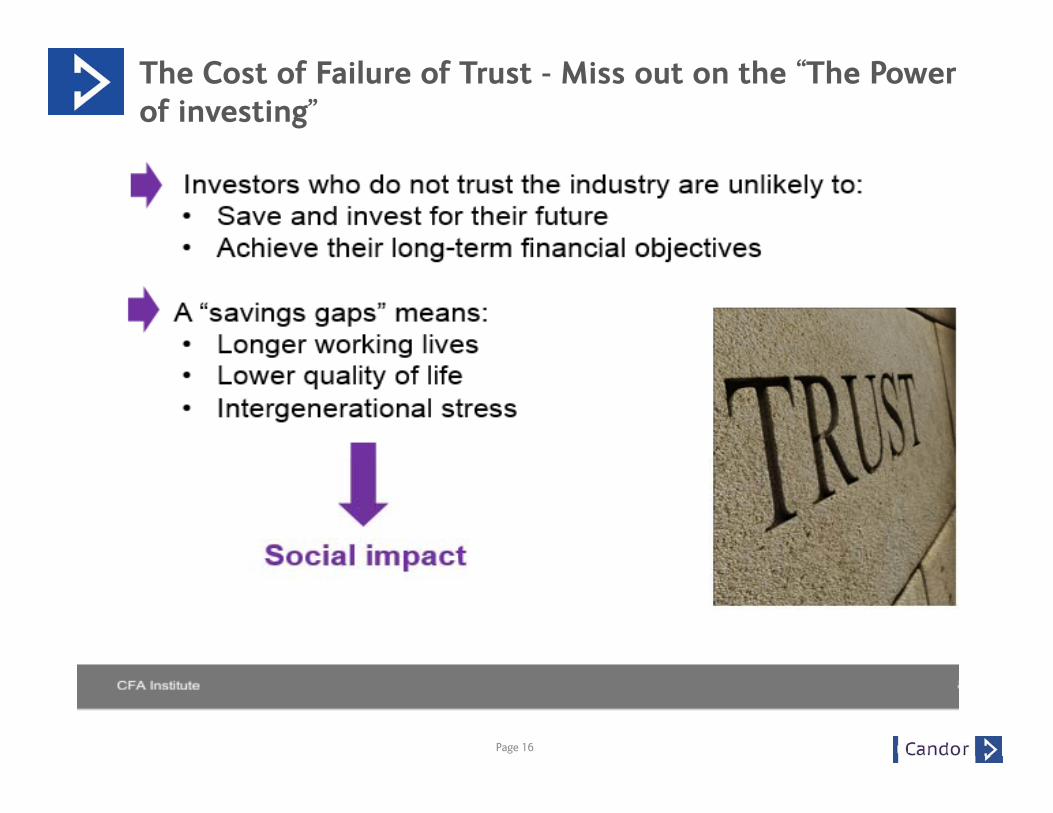
The Cost of Failure of Trust - Miss out on the “The Power of investing”
Page 16
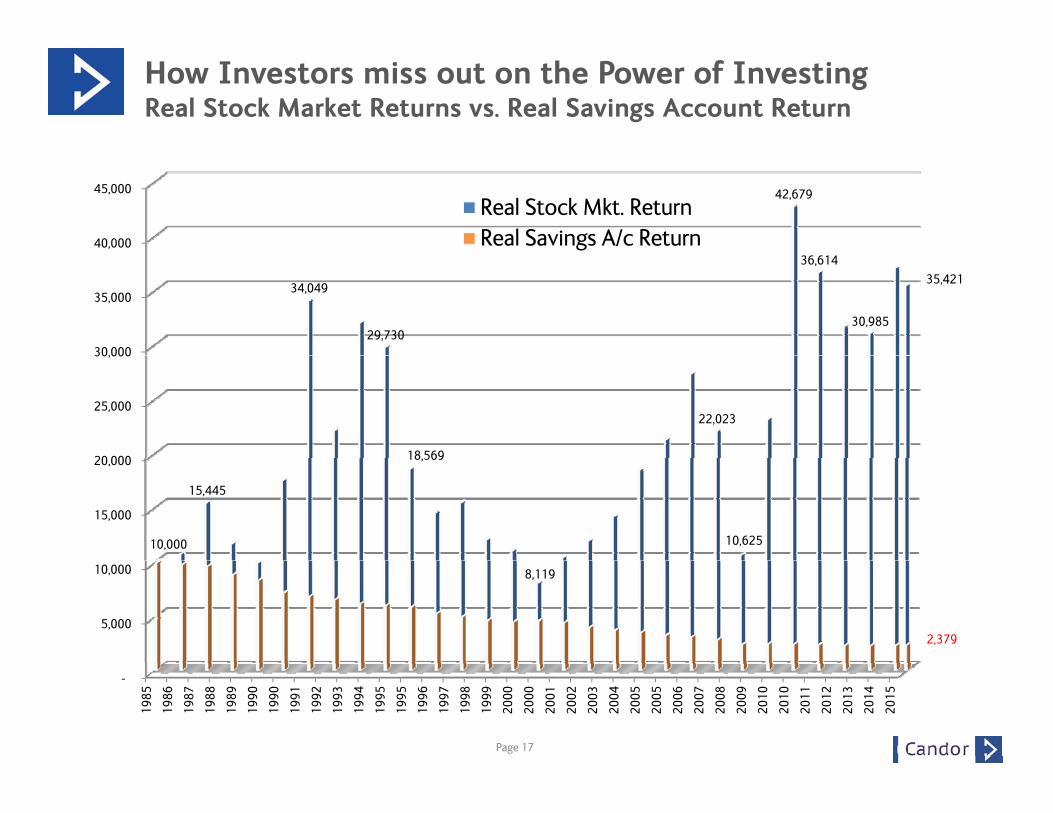
How Investors miss out on the Power of InvestingReal Stock Market Returns vs. Real Savings Account Return
40,000
45,000 42,679 Real Stock Mkt. ReturnReal Savings A/c Return
30,000
35,000 34,049
29,730
36,614
30,985
35,421
20 000
25,000
30,000
18 569
22,023
15,000
20,000
10,000
15,445
18,569
10,625
5,000
10,000 8,119
2,379
Page 17
-
1985
1986
1987
1988
1989
1990
1990
1991
1992
1993
1994
1995
1995
1996
1997
1998
1999
2000
2000
2001
2002
2003
2004
2005
2005
2006
2007
2008
2009
2010
2010
2011
2012
2013
2014
2015
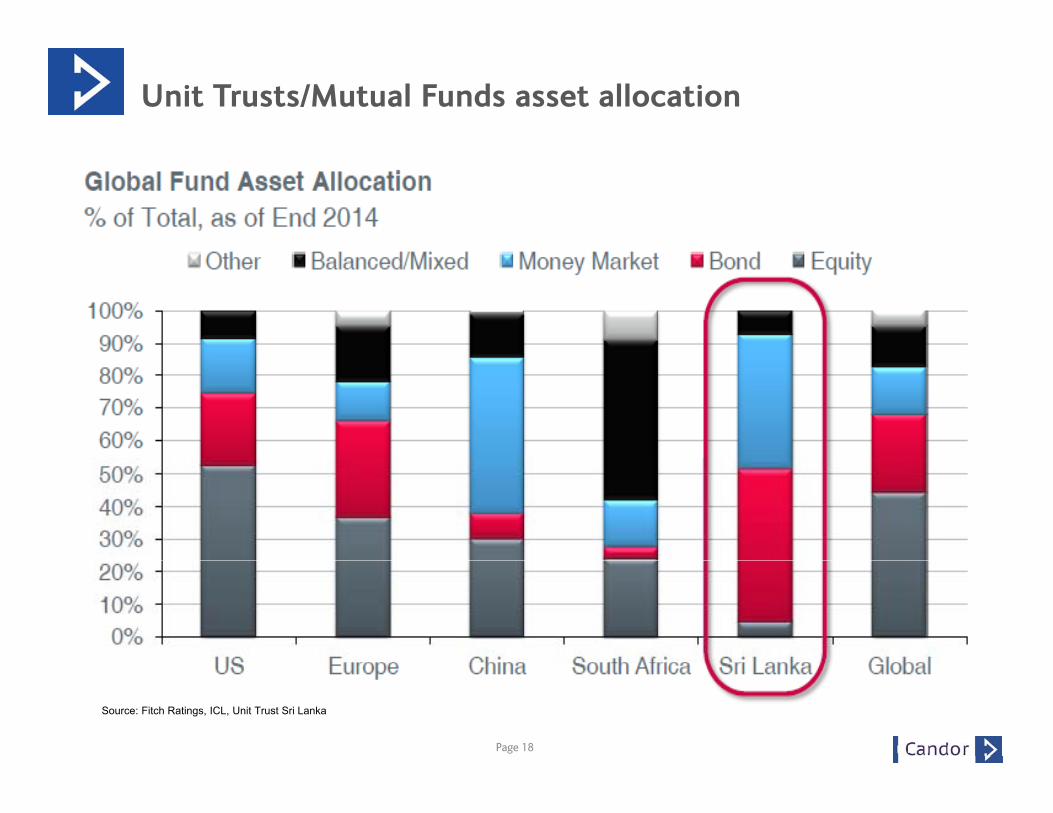
Unit Trusts/Mutual Funds asset allocation
Page 18
Source: Fitch Ratings, ICL, Unit Trust Sri Lanka
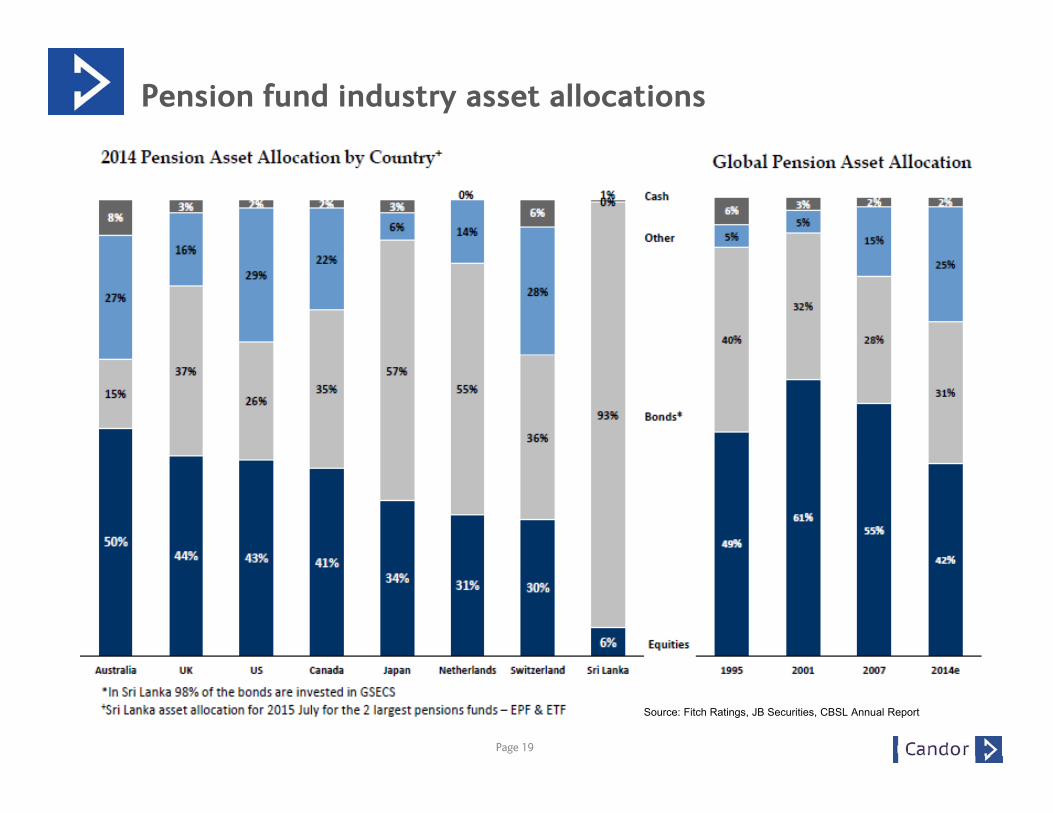
Pension fund industry asset allocations
Page 19
Source: Fitch Ratings, JB Securities, CBSL Annual Report
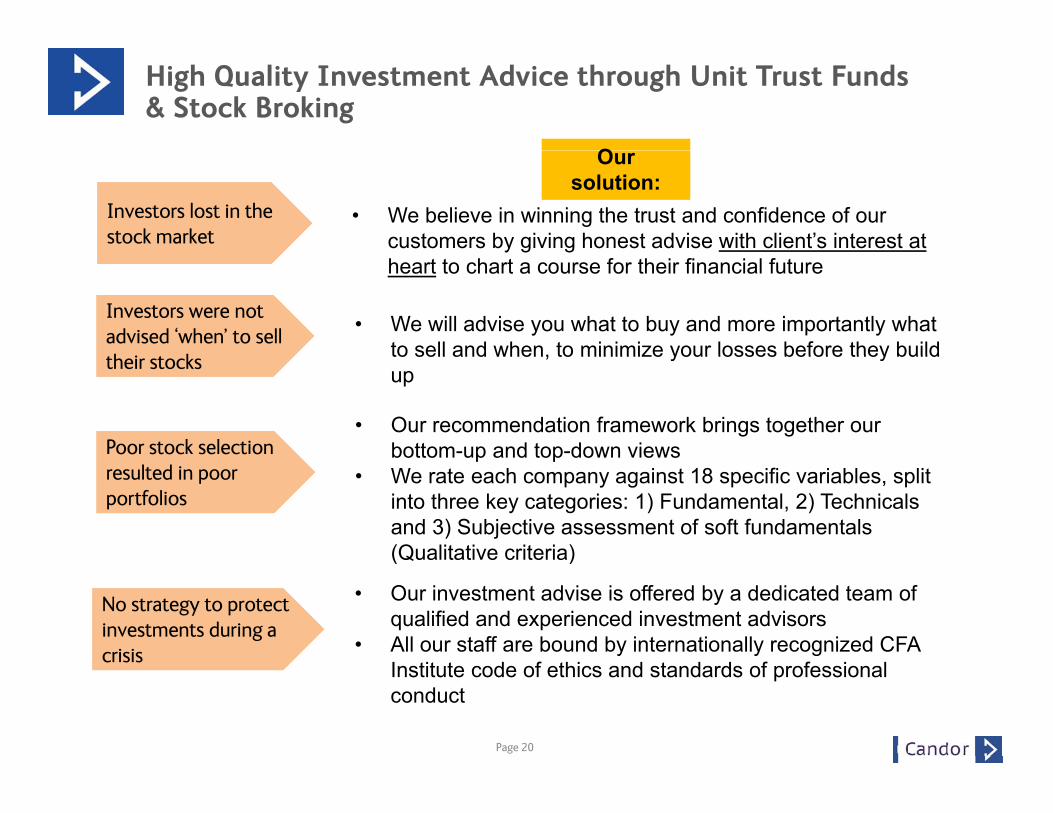
High Quality Investment Advice through Unit Trust Funds & Stock Broking
O
Investors lost in the stock marketInvestors lost in the stock market
• We believe in winning the trust and confidence of our customers by giving honest advise with client’s interest at
Oursolution:
heart to chart a course for their financial future
Investors were not advised ‘when’ to sell h i k
Investors were not advised ‘when’ to sell h i k
• We will advise you what to buy and more importantly what to sell and when, to minimize your losses before they buildtheir stockstheir stocks
Poor stock selection Poor stock selection
to sell and when, to minimize your losses before they build up
• Our recommendation framework brings together our bottom-up and top-down views
resulted in poor portfoliosresulted in poor portfolios
p p• We rate each company against 18 specific variables, split
into three key categories: 1) Fundamental, 2) Technicals and 3) Subjective assessment of soft fundamentals (Qualitative criteria)(Q )
No strategy to protect investments during a crisis
No strategy to protect investments during a crisis
• Our investment advise is offered by a dedicated team of qualified and experienced investment advisors
• All our staff are bound by internationally recognized CFA I tit t d f thi d t d d f f i l
Page 20
Institute code of ethics and standards of professional conduct
Why we should invest in yEquities ?
Pasindu PereraHead of ResearchCandor Equities
Page 21
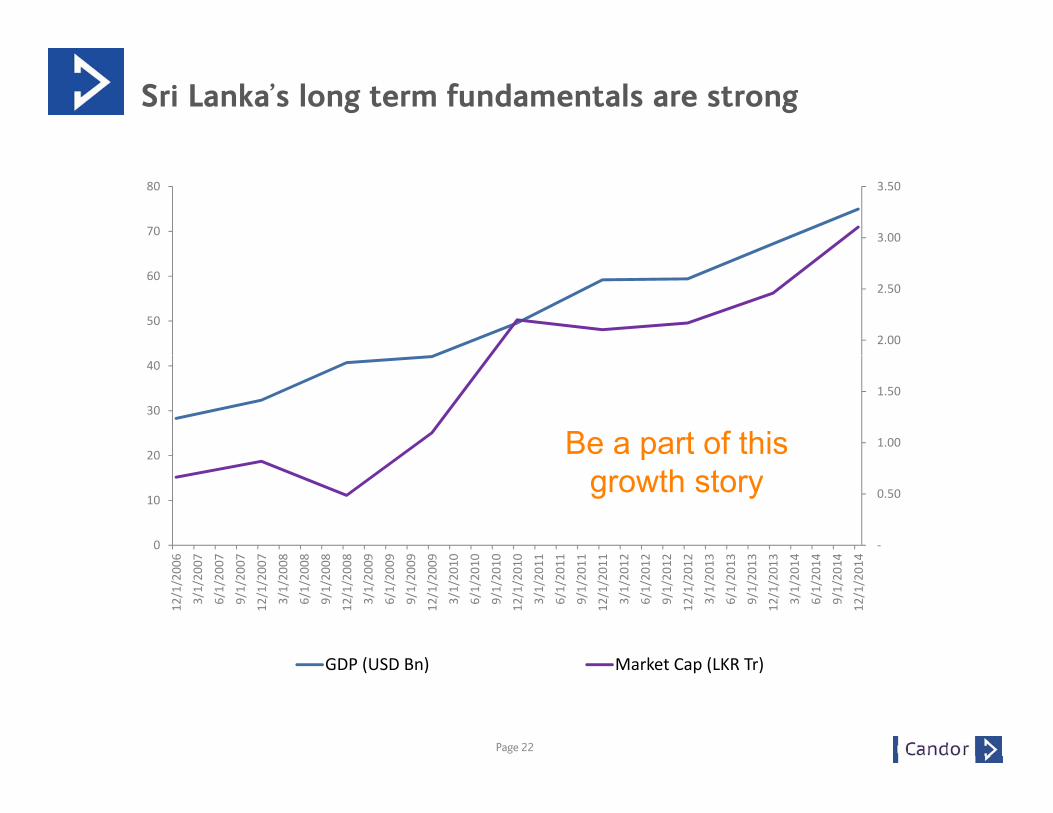
Sri Lanka’s long term fundamentals are strong
3.00
3.50
70
80
2.00
2.50
50
60
1.00
1.50
20
30
40
Be a part of this
‐
0.50
0
10
20
6 7 7 7 7 8 8 8 8 9 9 9 9 0 0 0 0 1 1 1 1 2 2 2 2 3 3 3 3 4 4 4 4
pgrowth story
12/1/200
3/1/20
0
6/1/20
0
9/1/20
0
12/1/200
3/1/20
0
6/1/20
0
9/1/20
0
12/1/200
3/1/20
0
6/1/20
0
9/1/20
0
12/1/200
3/1/20
1
6/1/20
1
9/1/20
1
12/1/201
3/1/20
1
6/1/20
1
9/1/20
1
12/1/201
3/1/20
1
6/1/20
1
9/1/20
1
12/1/201
3/1/20
1
6/1/20
1
9/1/20
1
12/1/201
3/1/20
1
6/1/20
1
9/1/20
1
12/1/201
GDP (USD Bn) Market Cap (LKR Tr)
Page 22
GDP (USD Bn) Market Cap (LKR Tr)
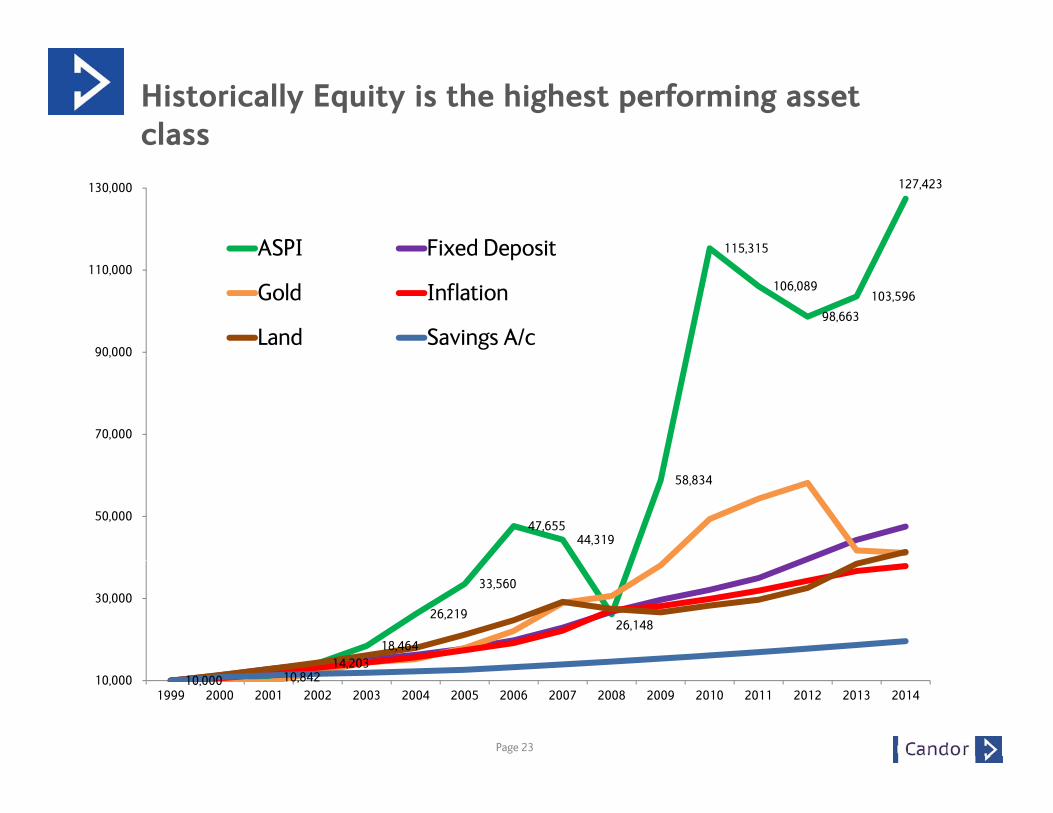
Historically Equity is the highest performing asset class
115,315
127,423 130,000
ASPI Fixed Deposit ,
106,089
98,663 103,596
90,000
110,000 ASPI Fixed Deposit
Gold Inflation
Land Savings A/c
70,000
90,000
47,655 44,319
58,834
50,000
14 20318,464
26,219
33,560
26,148
30,000
Page 23
10,000 10,842 14,203
10,000 1999 2000 2001 2002 2003 2004 2005 2006 2007 2008 2009 2010 2011 2012 2013 2014
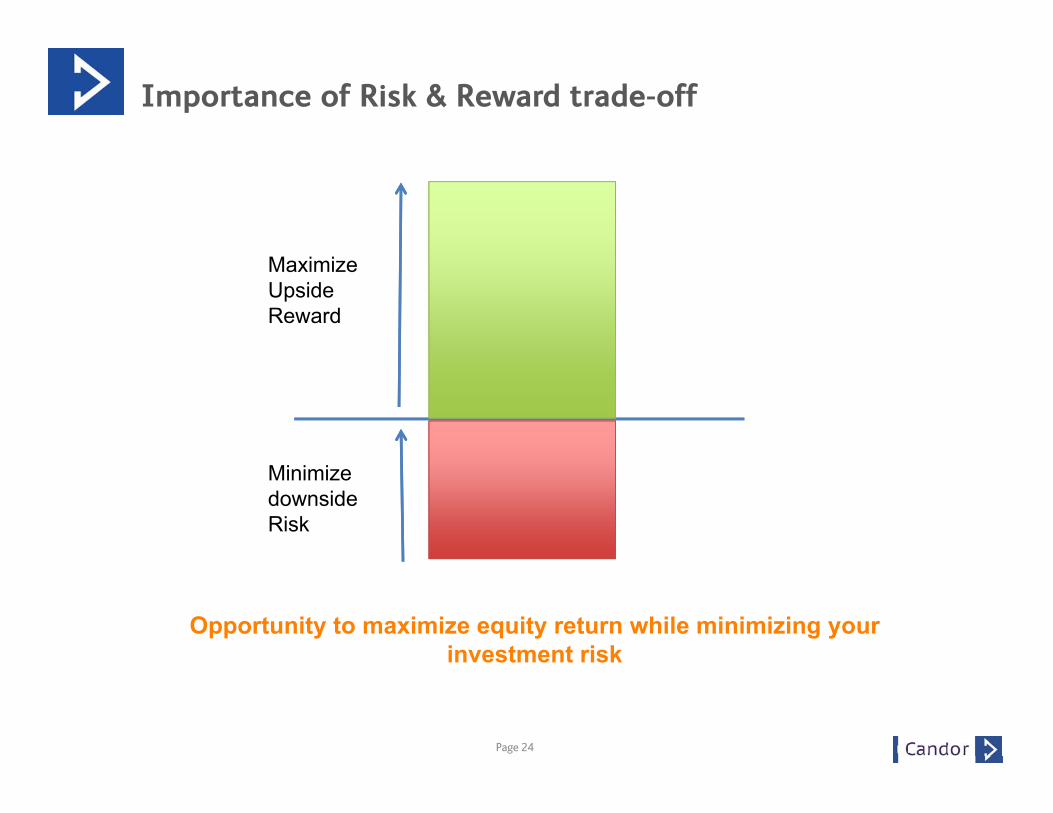
Importance of Risk & Reward trade-off
Maximize Upside Reward
Minimize downside Risk
Opportunity to maximize equity return while minimizing your investment risk
Page 24
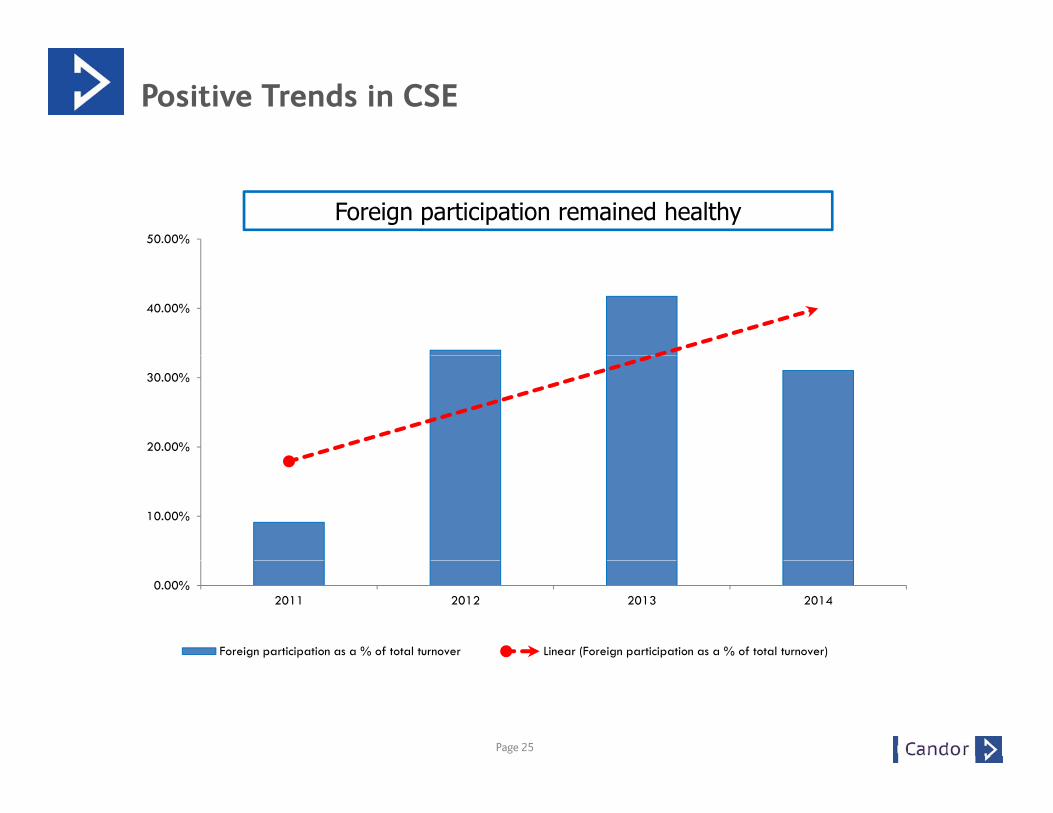
Positive Trends in CSE
50.00%
Foreign participation remained healthy
40.00%
20.00%
30.00%
10.00%
0.00%2011 2012 2013 2014
Foreign participation as a % of total turnover Linear (Foreign participation as a % of total turnover)
Page 25
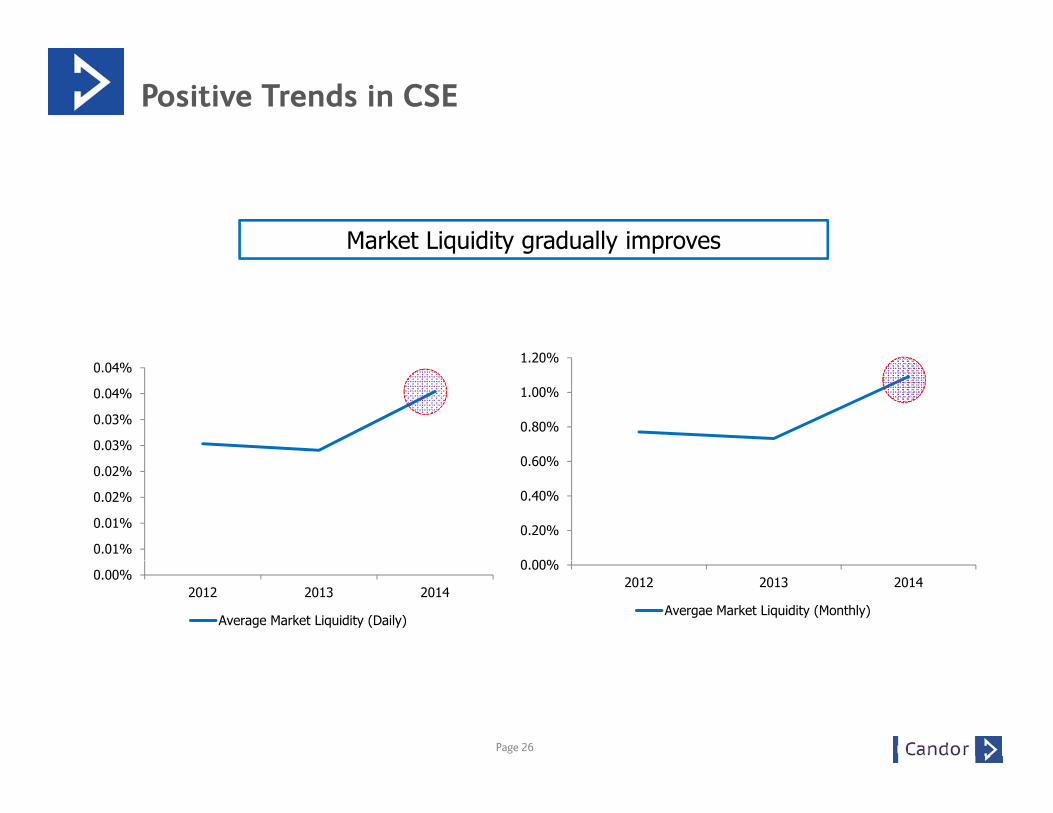
Positive Trends in CSE
Market Liquidity gradually improves
1 20%
q y g y p
0.03%
0.03%
0.04%
0.04%
0 60%
0.80%
1.00%
1.20%
0.01%
0.01%
0.02%
0.02%
0 00%
0.20%
0.40%
0.60%
0.00%2012 2013 2014
Average Market Liquidity (Daily)
0.00%2012 2013 2014
Avergae Market Liquidity (Monthly)
Page 26
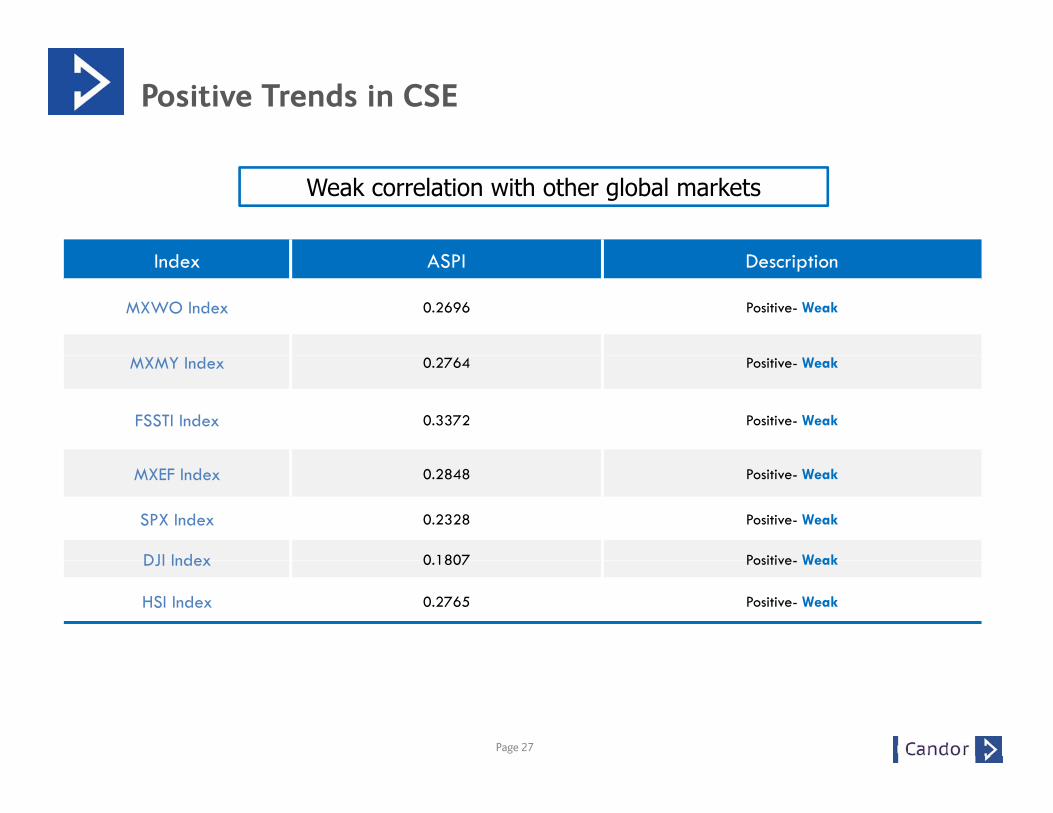
Positive Trends in CSE
Weak correlation with other global markets
Index ASPI Description
MXWO Index 0.2696 Positive- Weak
MXMY Index 0.2764 Positive- Weak
FSSTI Index 0.3372 Positive- Weak
MXEF Index 0.2848 Positive- Weak
SPX Index 0.2328 Positive- Weak
DJI Index 0 1807 Positive WeakDJI Index 0.1807 Positive- Weak
HSI Index 0.2765 Positive- Weak
Page 27
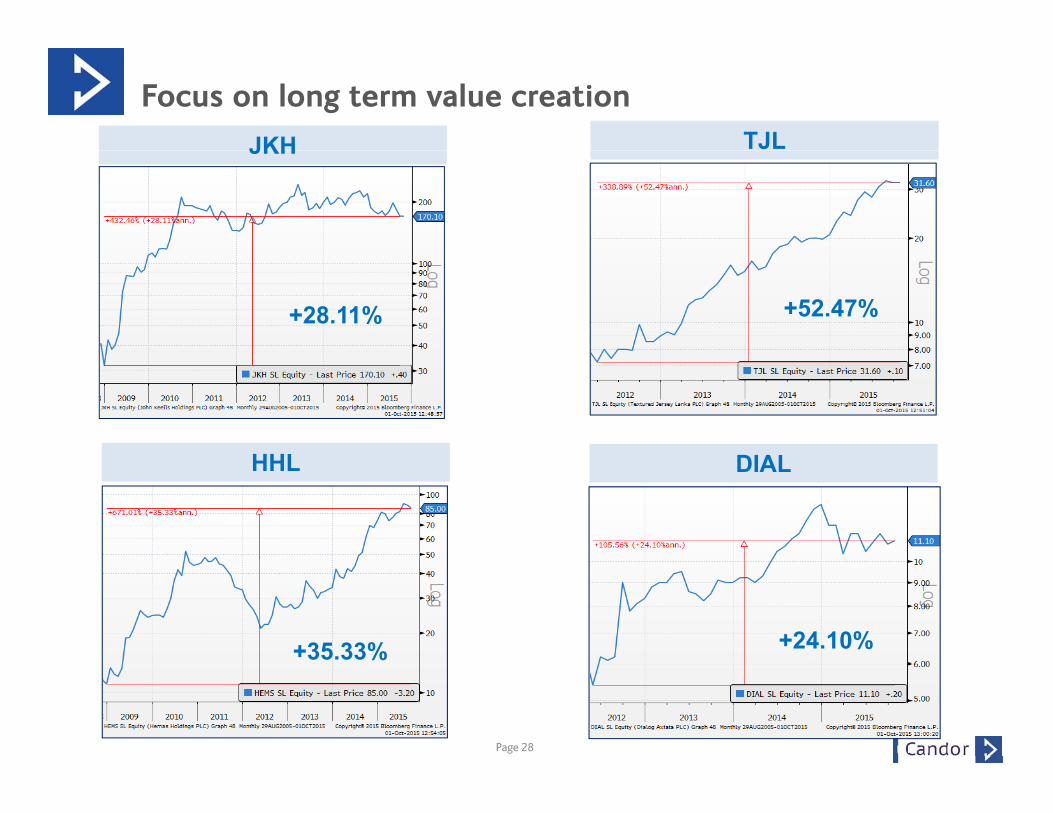
Focus on long term value creationJKH TJLJKH
+28.11% +52.47%
HHL DIALHHL DIAL
+35.33% +24.10%
Page 28
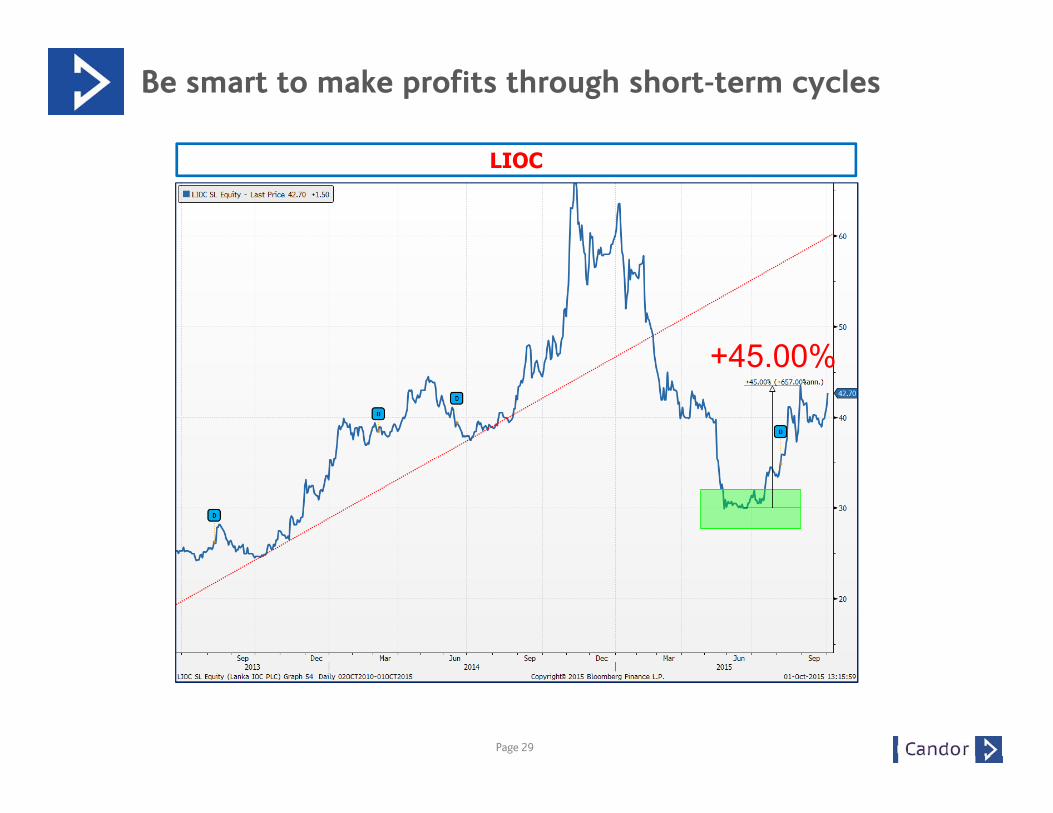
Be smart to make profits through short-term cycles
LIOC
+45 00%+45.00%
Page 29
What is the most important element to identify these market trends?
• Timely
• Quality
• Reliable
O OINFORMATION
Page 30
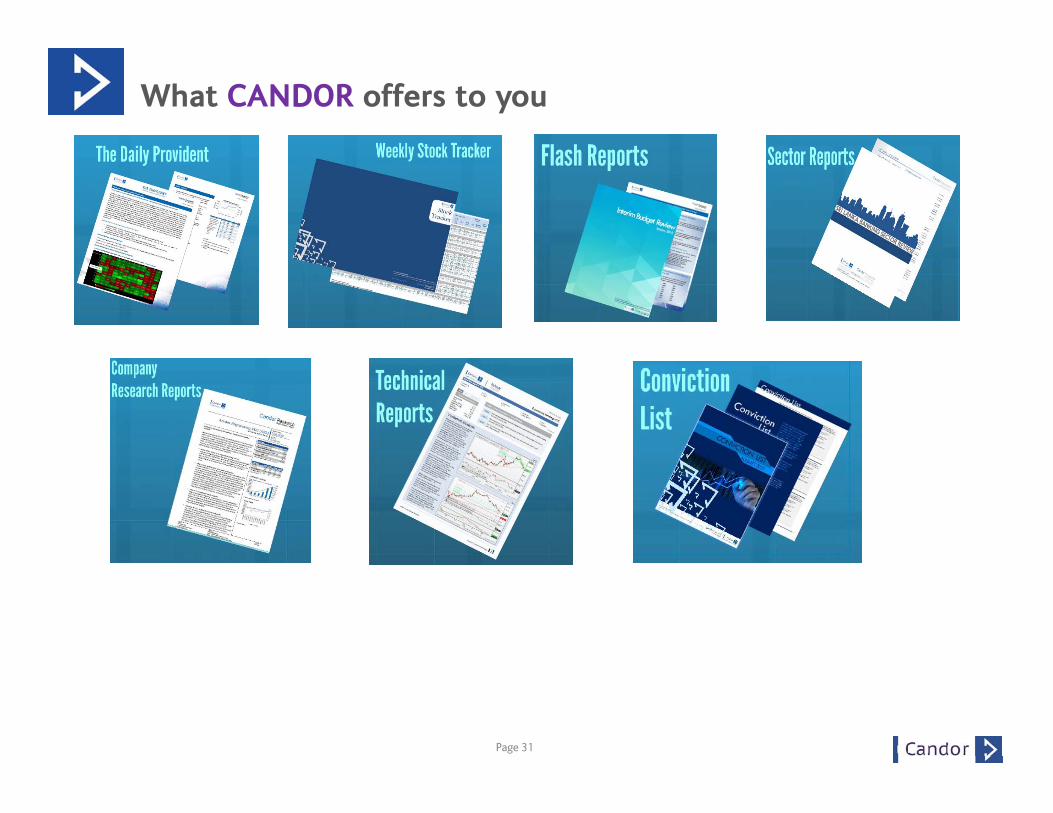
What CANDOR offers to you
Page 31
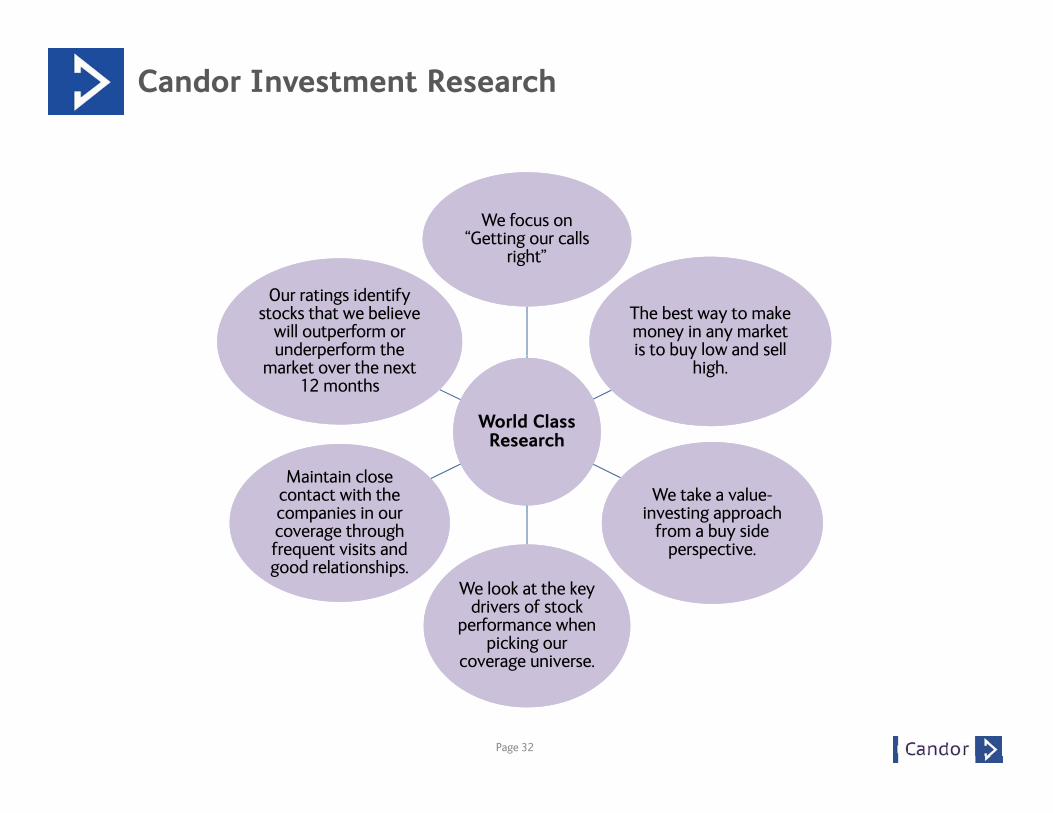
Candor Investment Research
We focus on “Getting our calls
ight”
We focus on “Getting our calls
ight”right”right”
The best way to make money in any market is to buy low and sell
The best way to make money in any market is to buy low and sell
Our ratings identify stocks that we believe
will outperform or underperform the
Our ratings identify stocks that we believe
will outperform or underperform the
World Class Research
World Class Research
s to buy o a d sehigh.
s to buy o a d sehigh.
u de pe o t emarket over the next
12 months
u de pe o t emarket over the next
12 months
We take a value-investing approach
from a buy side perspective.
We take a value-investing approach
from a buy side perspective.
Maintain close contact with the companies in our coverage through frequent visits and
d l h
Maintain close contact with the companies in our coverage through frequent visits and
d l hWe look at the key
drivers of stock performance when
picking our coverage universe
We look at the key drivers of stock
performance when picking our
coverage universe
good relationships.good relationships.
Page 32
coverage universe.coverage universe.

Famous Quotes
"K h t d k h "Know what you own, and know why you own it."
Peter Lynch
Page 33
Famous Quotes
“ I Buy Shares with the assumption that the Market will close next day for five years”Market will close next day for five years
Warren Buffet
Page 34
Famous Quotes
“If a Business does well, the stock eventually follows” y
Warren Buffet
Page 35
Famous Quotes
“Price is what you pay, Value is what you get ” y g
Warren Buffet
Page 36
Contact Us
Candor Equities LTDLevel 08, South Wing Millennium House46/58, Nawam Mawatha,Colombo 02
T : +94 11 2359 100F : +94 11 2305 522F : +94 11 2305 522
www.candor-holding.com
Page 37