Embed Size (px)
Citation preview
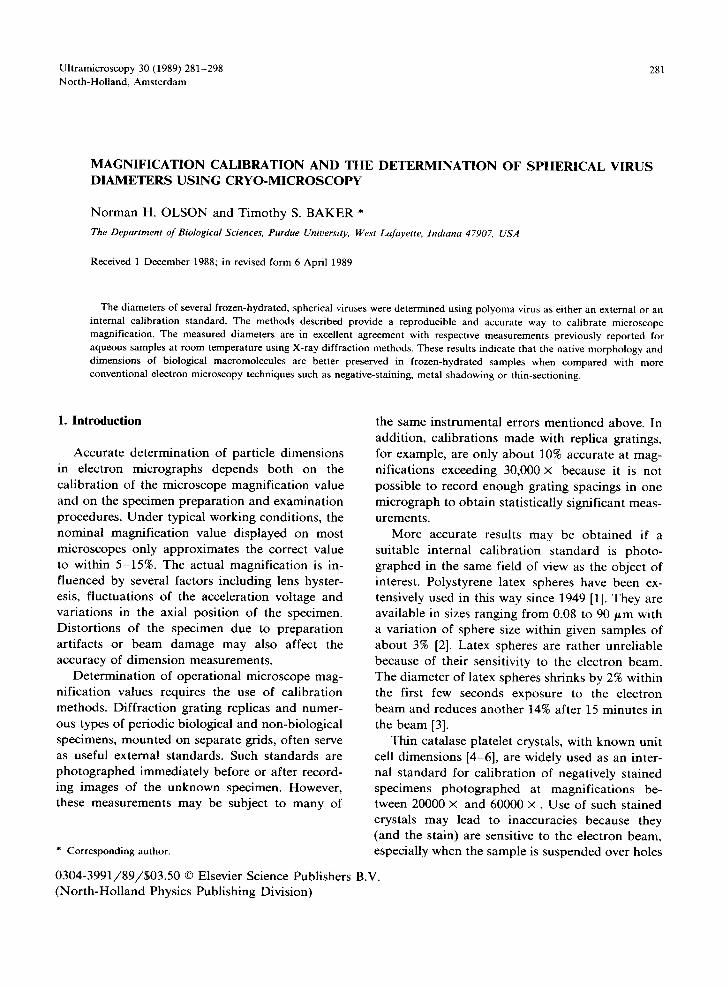
Ultramicroscopy 30 (1989) 281-298 281 North-Holland, Amsterdam
M A G N I F I C A T I O N C A L I B R A T I O N A N D T H E D E T E R M I N A T I O N O F S P H E R I C A L V I R U S D I A M E T E R S U S I N G C R Y O - M I C R O S C O P Y
N o r m a n H. O L S O N and T imothy S. B A K E R *
The Department of Biological Sciences, Purdue University, West Lafayette, Indiana 47907, USA
Received 1 December 1988; in revised form 6 April 1989
The diameters of several frozen-hydrated, spherical viruses were determined using polyoma virus as either an external or an internal calibration standard. The methods described provide a reproducible and accurate way to calibrate microscope magnification. The measured diameters are in excellent agreement with respective measurements previously reported for aqueous samples at room temperature using X-ray diffraction methods. These results indicate that the native morphology and dimensions of biological macromolecules are better preserved in frozen-hydrated samples when compared with more conventional electron microscopy techniques such as negative-staining, metal shadowing or thin-sectioning.
1. Introduct ion
Accura te de t e rmina t ion of par t ic le d imens ions in electron micrographs depends bo th on the ca l ib ra t ion of the microscope magni f ica t ion value and on the specimen p repa ra t ion and examina t ion procedures . U n d e r typical work ing condi t ions , the nomina l magni f ica t ion value d i sp layed on most microscopes only approx ima tes the correct value to within 5-15%. The actual magni f ica t ion is in- f luenced by several factors inc luding lens hyster- esis, f luctuat ions of the accelera t ion vol tage and var ia t ions in the axial pos i t ion of the specimen. Dis to r t ions of the spec imen due to p r epa ra t i on ar t i facts or beam damage may also affect the accuracy of d imens ion measurements .
De te rmina t ion of opera t iona l microscope mag- n i f ica t ion values requires the use of ca l ibra t ion methods . Di f f rac t ion gra t ing replicas and numer - ous types of per iod ic biological and non-b io logica l specimens, m o u n t e d on separa te grids, of ten serve as useful external s tandards . Such s t andards are p h o t o g r a p h e d immedia t e ly before or af ter record- ing images of the unknown specimen. However , these measurements may be subject to many of
* Corresponding author.
the same ins t rumenta l errors men t ioned above. In addi t ion , ca l ib ra t ions made with repl ica gratings, for example , are on ly abou t 10% accura te at mag- ni f ica t ions exceeding 30,000 x because it is not poss ib le to record enough gra t ing spacings in one mic rograph to ob ta in s ta t is t ical ly s ignif icant meas- urements .
More accura te results may be ob t a ined if a sui table in ternal ca l ib ra t ion s t a n d a r d is pho to - g raphed in the same field of view as the objec t of interest . Polys tyrene latex spheres have been ex- tensively used in this way since 1949 [1]. They are avai lable in sizes ranging f rom 0.08 to 90 ffm with a var ia t ion of sphere size within given samples of abou t 3% [2]. Latex spheres are ra ther unre l iab le because of their sensi t ivi ty to the e lec t ron beam. The d iamete r of latex spheres shr inks by 2% within the first few seconds exposure to the e lec t ron beam and reduces ano ther 14% after 15 minu tes in the beam [3].
Thin ca ta lase p la te le t crystals , with known unit cell d imens ions [4-6], are widely used as an inter- nal s t anda rd for ca l ib ra t ion of negat ive ly s ta ined specimens p h o t o g r a p h e d at magni f ica t ions be- tween 20000 X and 60000 x . Use of such s ta ined crystals may lead to inaccuracies because they (and the stain) are sensi t ive to the e lec t ron beam, especial ly when the sample is suspended over holes
0304-3991 /89 /$03 .50 © Elsevier Science Publ ishers B.V. ( N o r t h - H o l l a n d Physics Publ ishing Divis ion)
282 N.tt. OL~on, T.S. Baker / Spherical t~irus diameter determination
in a c a r b o n s u p p o r t f i lm [7]: crys ta ls t end to
shr ink in u n s u p p o r t e d areas. Crys ta ls , a t t a c h e d to
and fully s u p p o r t e d by the c a r b o n fi lm, an iso-
t rop ica l ly shr ink w h e n dr ied . S p e c i m e n d e h y d r a -
t ion reduces the axial c rys ta l d i m e n s i o n to a b o u t
70% of the ful ly h y d r a t e d d i m e n s i o n even b e f o r e
the s p e c i m e n is sub jec t ed to the v a c u u m of the
m i c r o s c o p e . I r r a d i a t i o n for p r o l o n g e d pe r iods fur-
ther r educes the crys ta l th ickness to a b o u t 40% of
its ini t ial va lue and this is o f t en a c c o m p a n i e d by
c o n c o m i t a n t , bu t smal le r , n o n - u n i f o r m changes in
the cell d i m e n s i o n s wi th in the p la te le t s [7].
T h e s a m p l e o f in te res t and the m a g n i f i c a t i o n
s t a n d a r d are b o t h sub jec t to the s a m e ar t i fac ts of
d r y i n g and r a d i a t i o n - i n d u c e d changes . T h e re-
p o r t e d d i a m e t e r s o f spher ica l v i ruses e m b e d d e d in
va r i ous th icknesses o f nega t i ve s ta in are o f t en
m u c h lower than m e a s u r e m e n t s m a d e of h y d r a t e d
samples us ing X- ray d i f f r ac t i on t e chn iques pre-
s u m a b l y due to m a s k i n g of su r face fea tures in
th ick layers o f s ta in a n d / o r i so t rop ic sh r inkage of
pa r t i c les in the d r i ed layer of s ta in ( tab le 1). Th i s is espec ia l ly p r e v a l e n t w h e n vi rus par t i c les a re
s u s p e n d e d ove r holes in the c a r b o n s u p p o r t f i lm.
Par t ic les a t t a c h e d to the s u p p o r t f i lm m a y be
larger than e x p e c t e d as a c o n s e q u e n c e of f la t ten-
ing i n d u c e d by the su r f ace t en s ion forces p r e sen t
d u r i n g d e h y d r a t i o n . S o m e samp le s a p p a r e n t l y re-
sist such f l a t t en ing by b e c o m i n g "' w r a p p e d " in the
s u p p o r t f i lm [25]. Th i s e f fec t m a y poss ib ly a c c o u n t
for o b s e r v e d va r i a t i ons in the a m o u n t of s ta in
r e t a ined by samples . N e g a t i v e s ta ins are also
k n o w n to be sens i t ive to e l ec t ron i r r a d i a t i o n s ince
they t end to m ig ra t e o v e r the access ib le su r face of
the s p e c i m e n d u r i n g the ini t ial s tages of e x p o s u r e
[26,27]. This , in turn, a f fec t s the a c c u r a c y of iden-
t i fy ing s t a i n - exc lud ing b o u n d a r i e s . T h e a r t i f ac t s
m e n t i o n e d a b o v e c o n f o u n d a t t e m p t s to a c c u r a t e l y
m e a s u r e d i m e n s i o n s w i th in spec imens .
C r y o - m i c r o s c o p y of b io log ica l s p e c i m e n s has
e m e r g e d as o n e t e c h n i q u e c a p a b l e o f m i n i m i z i n g
o r e l i m i n a t i n g m a n y of the p r o b l e m s a n d a r t i fac t s
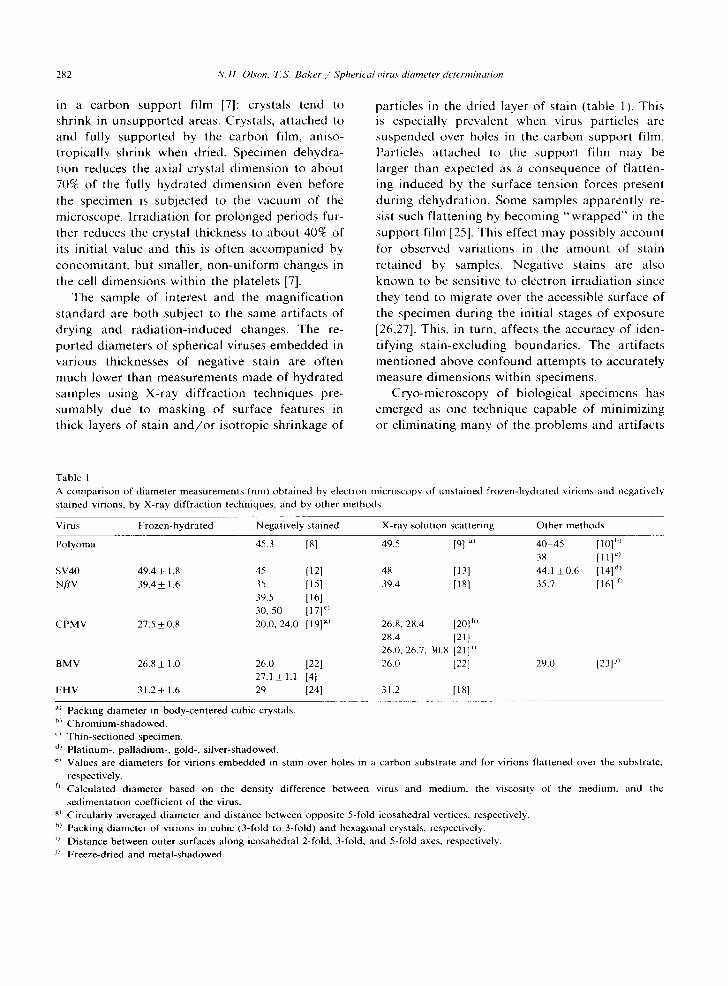
Table 1 A comparison of diameter measurements (nm) obtained by electron microscopy of unstained frozen-hydrated virions and negatively stained virions, by X-ray diffraction techniques, and by other methods
Virus Frozen-hydrated Negatively stained X-ray solution scattering Other methods
Polyoma 45.3 [8] 49.5 [91 al 40-45 [ 10] bl 38 [111"
SV40 49.4_+ 1.8 45 [12] 48 [13] 44.1 +0.6 [14] '4) NflV 39.4+ 1.6 35 [15] 39.4 [18] 35.7 [16] f~
39.5 [161 30, 50 [17] ~)
CPMV 27.5 +0.8 20.0, 24.0 [19] g~ 26.8, 28.4 [20] h) 28.4 [21] 26.0, 26.7, 30.8 [21] 0 26.0 [22] BMV 26.8 + 1.0 26.0 [221
27.1+ 1.1 [41 FHV 31.2 + 1.6 29 [24] 31.2 [181
29.0 [23p )
") Packing diameter in body-centered cubic crystals. b) Chromium-shadowed. o Thin-sectioned specimen. d) Platinum-, palladium-, gold-, silver-shadowed. ~ Values are diameters for virions embedded in stain over holes in a carbon substrate and for virions flattened over the substrate,
respectively. r) Calculated diameter based on the density difference between virus and medium, the viscosity of the medium, and the
sedimentation coefficient of the virus. g) Circularly averaged diameter and distance between opposite 5-fold icosahedral vertices, respectively. h~ Packing diameter of virions in cubic (3-fold to 3-fold) and hexagonal crystals, respectively. i~ Distance between outer surfaces along icosahedral 2-fold, 3-fold, and 5-fold axes, respectively. J) Freeze-dried and metal-shadowed.
N.H. Olson, TS. Baker / Spherical virus diameter determination 283
associated with negative-staining and other con- ventional electron microscopy preparative proce- dures [28-32]. The crystalline structure of a variety of frozen-hydrated biological specimens is pre- served to near atomic resolution. Examples in- clude: purple membrane [33,34], catalase [35], crotoxin [36,37], rabbit immunoglobulin FC frag- ment [38], and T4 D N A helix destabilizing protein [39]. Preparation procedures involving vitrification of the sample also appear to protect non-crystal- line biological specimens against the distorting forces of dehydration and ice crystal formation [31]. The spherical virus particle samples used in our experiments are easily frozen in a thin layer of vitrified water, supported over holes in a carbon film, and subsequent images recorded with minimal irradiation techniques [31,32].
In this report, polyoma, a spherical animal virus whose diameter is accurately known from X-ray diffraction measurements [9], has been used as both an internal and external standard for calibrating the diameter of a variety of other spherical viruses examined in the frozen-hydrated state. This allows accurate determination of the instrument magnification and has also made it possible to calibrate previously recorded micro- graphs of simian virus 40 (SV40)* [40]. Our re- sults clearly demonstrate that the gross mor- phology of biological specimens is well preserved in the frozen-hydrated state since the dimensions of the spherical virus particles studied are, within experimental error, identical to measurements made by X-ray diffraction of aqueous samples at room temperature.
2. Materials and methods
2.1. Sample preparation and electron microscopy
Purified virus samples, stored in various buffer solutions at concentrations between 2 and 10 m g / m l , were kindly provided by colleagues (see
* Abbreviations used: simian virus 40, SV40; Nudaurelia capensis beta virus, NflV; cowpea mosaic virus, CPMV, bromegrass mosaic virus, BMV; Flock House virus, FHV; tobacco mosaic virus, TMV.
acknowledgements). Virus isolates were mixed with the polyoma sample, and when necessary, diluted with distilled water to provide a final concentra- tion of about 0.5-1.0 m g / m l . Small aliquots (2-5 /~1) of sample were applied by adhesion to copper microscope grids covered with perforated carbon films made hydrophilic by glow discharge. Most of the sample was removed by pressing a piece of filter paper directly against the entire grid surface, wicking jt nearly dry, before rapidly plunging it into liquid ethane kept slightly above its freezing point ( > - 1 8 3 ° C ) [32]. The grids were then quickly transferred into liquid nitrogen where they could be stored or subsequently transferred into a specimen holder (Gatan Inc., Warrendale, PA) which maintains the specimen temperature at about - 1 6 0 ° C in the microscope. Areas with frozen sample suspended over holes in the carbon substrate, and in which the thickness of the vitri- fied water layer was judged to be sufficient to support a monodisperse distribution of virus par- ticles, were located by scanning grids at very low magnification (1000-2000 x ) with an electron dose rate below 10 e - / n m 2. s. Micrographs of the frozen-hydrated samples were recorded at nominal magnifications of 36,000 x and 49,000 x on Kodak SO-163 film using minimal dose tech- niques (900-1200 e - /nm2) , on a Philips EM420 electron microscope operated at 80 kV. Lens cur- rents were fully excited and returned to preset levels before each exposure by the use of the lens normalization operation on the microscope. Ex- posed micrographs were developed for 12 min in full-strength Kodak D-19 developer at 2 0 ° C to maximize the sensitivity of the photographic emul- sion.
2.2. Micrograph selection and digitization
The selection of micrographs for digital proces- sing was based on several criteria. Images judged to be free of the effects of residual objective lens astigmatism and specimen drift and recorded at an opt imum defocus level (1-2 jam underfocus) were identified. Regions in those images in which the sample consisted of a fairly uniform, monodis- perse distribution of virus particles were digitized at 25 ~tm intervals. The raster step size of the
284 N.H. Olson. T.S. Baker / Spherical z~irus diameter determination
rotat ing drum microdensi tometer (Optronics (7- 4100, Optronics Inc., Chelmsford, MA) was care- fully determined to minimize systematic errors in the calibration measurements. A contact photo- graph of a microscope eyepiece reticule, calibrated with a microcompara tor (Nikon Profile Projector model 6C, Nippon Kogaku, K.K., Japan), was digitized and its Fourier t ransform was computed. The distance between prominent peaks in the Fourier transform, resulting from the periodically spaced lines in the reticule grating image, enabled an accurate measure of the raster step size to be calculated.
The emulsion side of the selected micrograph was securely taped to an opening ( - 3.2 × 2.6 cm) cut in a thin sheet-metal mask, curved to fit the cylindrical microdensi tometer drum. The micro- graph was carefully mounted to the mask to insure that the entire scanned area of the emulsion coin- cided with the focal surface of the scanner optics, thereby avoiding addit ional sources of error in the magnificat ion calibration. Digitized images were stored on magnetic tape and transferred to disk storage on a V A X / V M S 11 /750 or 8550 mini- computer (Digital Equipment Corporat ion, May- nard, MA) for further analysis using interactive F O R T R A N routines with various data displayed on a 1280 by 1024, 8-bit per pixel, color raster graphics device (Lexidata 3400, Adage Inc., Bi- llerica, MA).
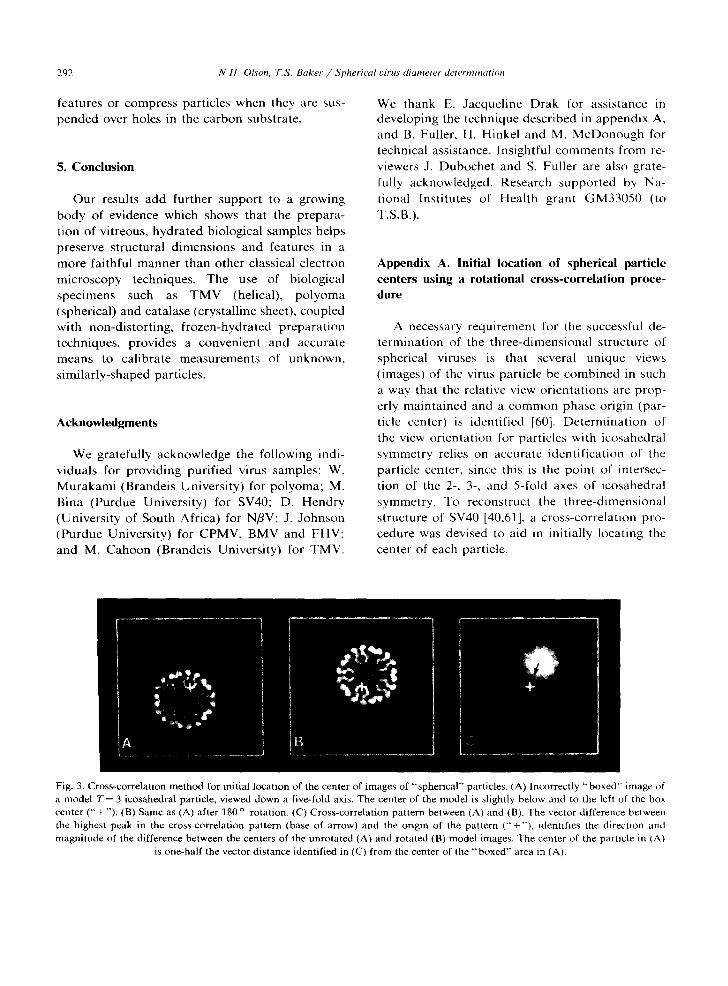
every pixel within the circular boundary . The processing system is designed to detect and ignore density values from neighboring particles that oc- casionally happen to overlap the chosen circular boundary from which the average float value is obtained.
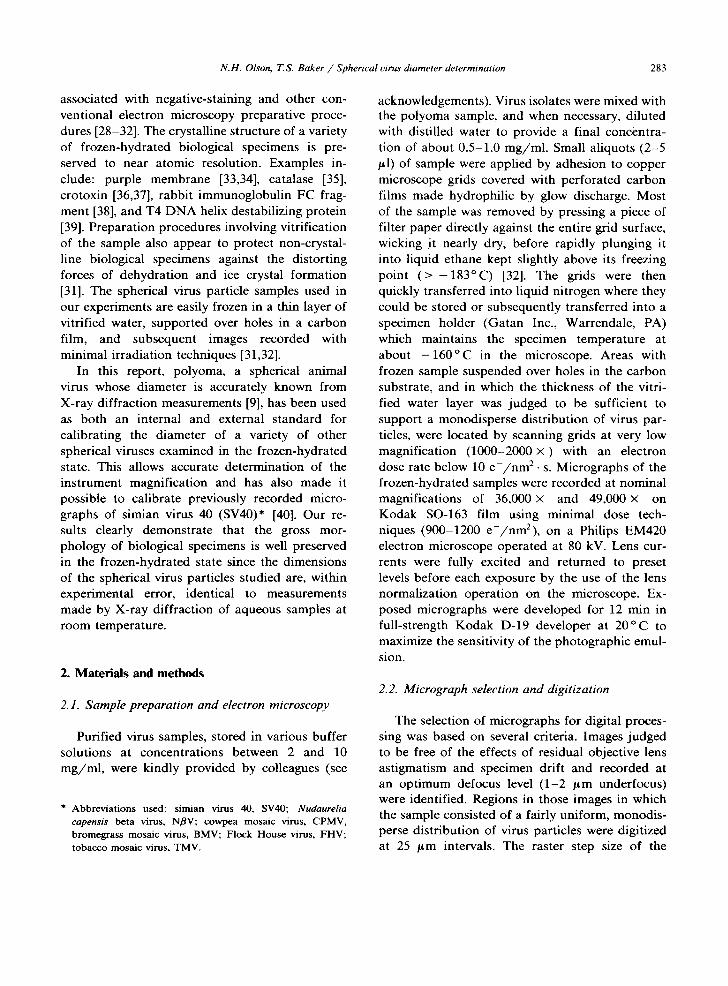
The position corresponding to the center of each particle was determined using a cross-corre- lation procedure (appendix A). In some instances a different cross-correlation procedure was used to select and average particle images (appendix B). Individual particle images or particle averages were circularly averaged about their respective centers (figs. 1A and 1B) and mean particle diameters were measured by locating the "edges" of the circularly averaged particles (fig. 1C). For the spherical viruses studied, location of the mean particle boundary was usually straightforward since the boundary between particle and sur- rounding vitrified water manifests an abrupt change in density (hence contrast) which is rela- tively easy to identify. All images of a part icular virus were analyzed in a similar fashion and the results averaged to determine a mean and stan- dard deviation (in pixels) for the diameter. These measurements were then calibrated against similar measurements made on the po lyoma standard, using the 49.5 nm diameter determined by X-ray diffraction measurements [9]. An average data set consisted of 28 particle images (range: 18-44).
2.3. Virion particle image selection and diameter
determination
Individual virion images were selected for anal- ysis if the particle appeared to be intact and not distorted in any obvious fashion, and also not in contact with or superimposed upon the edge of a carbon hole or any other virions. Each virion image was boxed and " f loa ted" [41] by selecting a circular area, centered about the particle and just large enough to encompass the entire particle without including extraneous sample (e.g. sur- rounding vitrified water and neighboring particles). To float each " b o x e d " particle image, the average intensity value at the periphery of the circular area (corresponding to the projected density of the surrounding vitrified water) was subtracted from
2.4. Calibration of the polvoma standard
Electron diffraction patterns of frozen-hy- drated samples of tobacco mosaic virus (TMV) were recorded to test the assumption that the diameter of the po lyoma s tandard in vitrified water is identical to the X-ray measured value. TMV was chosen because it is a universally accepted biological s tandard which produces a strong, char- acteristic fiber diffraction pat tern [42]. Further- more, the TMV diffraction pat tern can be easily calibrated by simultaneously recording the diffrac- tion "powde r pat tern" from cubic ice crystals allowed to condense on the f rozen-hydrated sam- ple.
TMV samples (15 m g / m l ) were prepared for cryo-microscopy as described in section 2.1. The
N.H. Olson, 72S. Baker / Spherical virus diameter determination 285
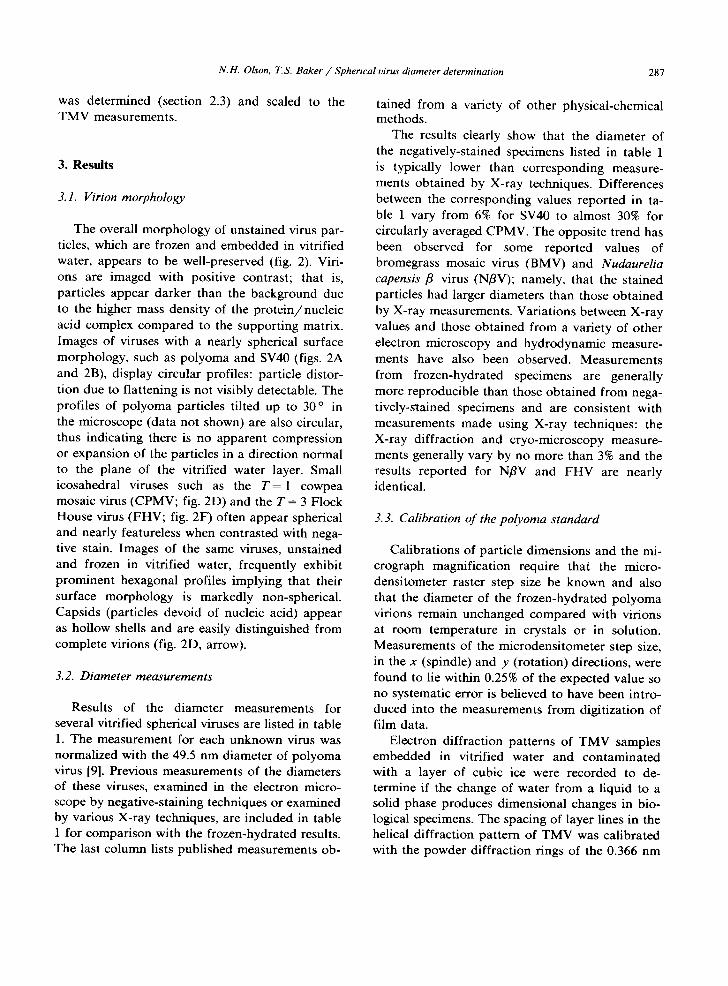
m e.
Q
c
+
C R a d i u s ( n m ) Fig. 1. Determination of virion image radius. (A) Digital image of an unfiltered, floated, circularly boxed polyoma virion. The virion image is displayed with enhanced positive contrast. The higher density of the virus compared to the surrounding vitrified water makes it appear darker. The center and edge of the particle are identified respectively by the base and tip of the arrow (same for B). (B) Image shown in (A) circularly averaged about the particle center. The particle edge is easier to identify compared to (A) due to the abrupt change in the averaged density. (C) Radial density plot corresponding to the intensities along the arrow in (B). The arrow identifies the location of the particle boundary. Since the position of the abscissa axis is established by the floating procedure, there is some uncertainty in identifying the exact position of the particle boundary, although the uncertainty is small since the abrupt change
in contrast is confined to a narrow range of radii.
high particle concentration favors the alignment of the particles into near-parallel arrays. Once in the microscope, the anticontamination shield on the specimen cold holder was retracted and the specimen left exposed to the microscope vacuum for a period of time ( - 1 h) to allow water mole- cules in the column to condense on the specimen in the form of cubic ice [29]. Electron diffraction patterns were obtained with the first condenser lens fully excited, with a 12.5 /~m second con- denser lens aperture in place, and with the objec- tive lens aperture removed. The grid was scanned for suitable specimen areas in defocussed diffrac- tion mode and focussed diffraction patterns were recorded on Kodak SO-163 film with a 90 s e x -
posure. The film was developed in Kodak D-19 (1 : 2) for 4 min.
Diffraction pattern films were digitized as de- scribed in section 2.2 at two raster settings (25/~m and 100 /~m) to allow accurate measurement of both the strong 1.15 nm 6th layer line of TMV and the [111] 0.366 nm diffraction ring of cubic ice [43].
Mixtures of TMV and polyoma were imaged (section 2.1) to calibrate the diameter of polyoma against the TMV standard. Fourier transforms of individual, boxed TMV particles were computed, and the 2.3 nm 3rd layer line reflection was used to calibrate the image pixel size. The average diameter of the polyoma particle images (in pixels)
286 N.H. Olson, T.S. Baker / Spherical virus diameter determination
C
O~ e
0 e 0
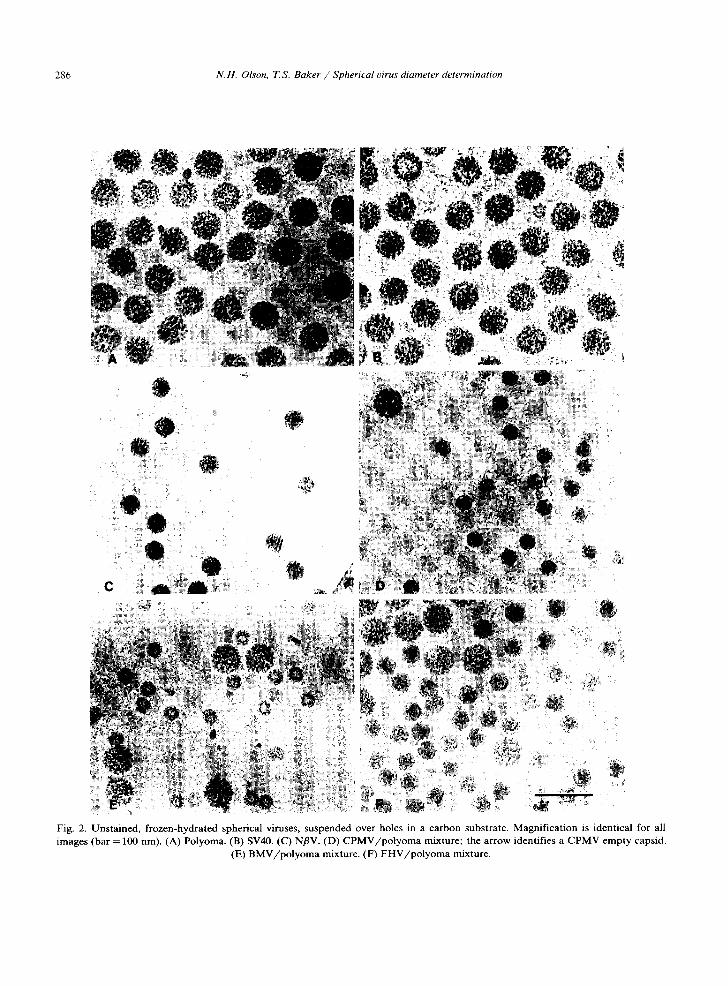
Fig. 2. Unstained, frozen-hydrated spherical viruses, suspended over holes in a carbon substrate. Magnification is identical for all images (bar = 100 nm). (A) Polyoma. (B) SV40. (C) NflV. (D) CPMV/polyoma mixture; the arrow identifies a CPMV empty capsid.
(E) BMV/polyoma mixture. (F) FHV/polyoma mixture.
N.H. O/son, T.S. Baker / Spherical virus diameter determination 287
was determined (section 2.3) and scaled to the TMV measurements.
3. Results
3.1. Virion morphology
The overall morphology of unstained virus par- ticles, which are frozen and embedded in vitrified water, appears to be well-preserved (fig. 2). Viri- ons are imaged with positive contrast; that is, particles appear darker than the background due to the higher mass density of the prote in/nucle ic acid complex compared to the supporting matrix. Images of viruses with a nearly spherical surface morphology, such as polyoma and SV40 (figs. 2A and 2B), display circular profiles: particle distor- tion due to flattening is not visibly detectable. The profiles of polyoma particles tilted up to 30 ° in the microscope (data not shown) are also circular, thus indicating there is no apparent compression or expansion of the particles in a direction normal to the plane of the vitrified water layer. Small icosahedral viruses such as the T = 1 cowpea mosaic virus (CPMV; fig. 2D) and the T = 3 Flock House virus (FHV; fig. 2F) often appear spherical and nearly featureless when contrasted with nega- tive stain. Images of the same viruses, unstained and frozen in vitrified water, frequently exhibit prominent hexagonal profiles implying that their surface morphology is markedly non-spherical. Capsids (particles devoid of nucleic acid) appear as hollow shells and are easily distinguished from complete virions (fig. 2D, arrow).
3.2. Diameter measurements
Results of the diameter measurements for several vitrified spherical viruses are listed in table 1. The measurement for each unknown virus was normalized with the 49.5 nm diameter of polyoma virus [9]. Previous measurements of the diameters of these viruses, examined in the electron micro- scope by negative-staining techniques or examined by various X-ray techniques, are included in table 1 for comparison with the frozen-hydrated results. The last column lists published measurements ob-
tained from a variety of other physical-chemical methods.
The results clearly show that the diameter of the negatively-stained specimens listed in table 1 is typically lower than corresponding measure- ments obtained by X-ray techniques. Differences between the corresponding values reported in ta- ble 1 vary from 6% for SV40 to almost 30% for circularly averaged CPMV. The opposite trend has been observed for some reported values of bromegrass mosaic virus (BMV) and Nudaurelia capensis fl virus (NflV); namely, that the stained particles had larger diameters than those obtained by X-ray measurements. Variations between X-ray values and those obtained from a variety of other electron microscopy and hydrodynamic measure- ments have also been observed. Measurements from frozen-hydrated specimens are generally more reproducible than those obtained from nega- tively-s'tained specimens and are consistent with measurements made using X-ray techniques: the X-ray diffraction and cryo-microscopy measure- ments generally vary by no more than 3% and the results reported for NflV and FHV are nearly identical.
3.3. Calibration of the polyoma standard
Calibrations of particle dimensions and the mi- crograph magnification require that the micro- densitometer raster step size be known and also that the diameter of the frozen-hydrated polyoma virions remain unchanged compared with virions at room temperature in crystals or in solution. Measurements of the microdensitometer step size, in the x (spindle) and y (rotation) directions, were found to lie within 0.25% of the expected value so no systematic error is believed to have been intro- duced into the measurements from digitization of film data.
Electron diffraction patterns of TMV samples embedded in vitrified water and contaminated with a layer of cubic ice were recorded to de- termine if the change of water from a liquid to a solid phase produces dimensional changes in bio- logical specimens. The spacing of layer lines in the helical diffraction pattern of TMV was calibrated with the powder diffraction rings of the 0.366 nm
288 N.H. Olson, T.S. Baker / Spherical virus diameter determination
[111] Bragg reflection of cubic ice [43]. The aver- age pitch of the 1-start helix of TMV (obtained from three different diffraction patterns) was de- termined to be 2.28 nm. This is equivalent, within the errors of measurement, to the universally accepted standard value of 2.3 nm [44]. If the electron diffraction calibration of TMV is correct, and the measured polyoma diameters are scaled accordingly, the diameters of the other viruses listed in table 1 would systematically drop by slightly less than 2%. Some particle diameters (e.g. CPMV) would deviate marginally from the X-ray values, whereas other particles (e.g. BMV) would have dimensions which more closely match the X-ray results. Since our measurement of TMV differs insignificantly from the established stan- dard, we assume that the TMV dimensions are not detectably changed in vitrified water. Thus, in this study, we accepted the X-ray value [9] for the diameter of polyoma as the standard for calibra- tions of the other virus particles.
3.4. Reproducibility of diameter measurement
The reproducibility of measurements using frozen-hydrated polyoma virus as a calibration standard was tested in several ways. Diameter measurements were obtained from images of five distinct icosahedral viruses (from plant, insect and animal hosts) suspended in different aqueous buffers. The microscopy was performed with a range of different operating conditions.
ferences in the diameter measurements at the 95% level using the Student's t test. The value listed for CPMV (table 1) is an average of the external and internal standard measurements.
3. 4.2. Effect of specimen location N/~V diameter measurements were made on
specimens imaged in different areas of the same grid and also on different grids: the differences observed were statistically insignificant. Thus, re- producibility of the measurements is not notice- ably affected by location of the sample on the grid or placement of the grid in a given specimen holder under reasonably controlled experimental conditions (i.e. the specimen height in the micro- scope is reproducibly maintained using flat, securely held grids).
3. 4.3. Effect of de]ocus A focal series of SV40 was recorded (data not
shown) to determine if the accuracy of the diame- ter measurements could be influenced by strong Fresnel fringes that appear at the periphery of the virus particle images due to phase contrast pro- duced at different levels of defocus. Micrographs at 1.0, 1.5, and 2.0 ktm underfocus were recorded in quick succession from the same specimen area with a total electron dose of < 2000 e - / n m 2. The diameters of identical sets of SV40 particle images varied by less than 1% indicating that the exact focal setting was not a significant factor in the diameter measurements reported in table 1.
3.4.1. Internal versus external standard calibrations Reproducibility of the measurements was excel-
lent when polyoma was used as either an internal or external standard (table 1). Diameters of SV40 (fig. 2B) and N/3V (fig. 2C) were determined using polyoma as an external standard. The similarities in size and morphology between polyoma and SV40 precluded mixing them together (figs. 2A and 2B). Polyoma was used as an internal stan- dard to measure the diameters of BMV (fig. 2E) and FHV (fig. 2F). CPMV virions were measured both with (fig. 2D) and without (data not shown) polyoma virus in the sample. Statistical compari- sons of the two types of CPMV samples, recorded on consecutive days, showed no significant dif-
3.4.4. Particle concentration Ideally, the frozen-hydrated sample consists of
a monodisperse distribution of virus particles such that the concentration of particles is high enough to allow a statistically significant number of mea- surements to be made from a single micrograph. In such micrographs (e.g., figs. 2A-2E), individual particle images were circularly averaged to im- prove the accuracy of the diameter measurements (section 2). Mean diameters were then computed from each set of particle measurements. In micro- graphs where the concentration of particles was too high to allow accurate boxing of individual particles (e.g., figs. 2F and 5A), an alternate pro- cedure, in which particle averages are obtained by
N.H. Olson, T.S. Baker / Spherical virus diameter determination 289
cross-correlation methods, was used to measure diameters (appendix B). A micrograph of FHV was analyzed by both procedures to test the self- consistency of the two methods. The results varied by less than 2% which is within the range of variation observed for each of the separate meth- ods. The diameter for FHV reported in table 1 is the average of the two measurements obtained from the same set of particle images and is not significantly different from the X-ray solution scattering measurements.
4. Discussion
4.1. Preservation of biological samples in the frozen- hydrated state
The use of frozen-hydrated spherical viruses as a magnification standard is especially suitable for two primary reasons: (i) quick freezing of par- ticulate biological samples in a thin layer of vitri- fied water provides an excellent way to preserve the samples without introducing many of the artifacts associated with other preparative proce- dures and (ii) measurements obtained using a frozen-hydrated calibration standard are more reproducible than those obtained using other available standards.
Viruses, as well as a variety of other biological macromolecules, have been shown to be well pre- served in vitrified water. Diameter measurements for adenovirus, ~, bacteriophage, and the isometric head of T4 bacteriophage [45] all show close agreement with respective low-angle X-ray diffrac- tion measurements [31]. Three-dimensional recon- structions have been calculated from images of frozen-hydrated virions of Semliki Forest [46], Sinbis [47], SV40 [40], Rotavirus [48] and N/3V [49]. The overall morphology of all of these viruses is well preserved in vitrified water, suggesting that particle flattening and other gross deformations do not occur. Calculation of scattering curves from the three-dimensional maps of Sinbis virus [47] and NflV [50] agree quite closely with X-ray solution scattering experiments. In addition, even though the virus reconstructions have been com- puted with 10-fold averaging (522 symmetry), they
still possess near perfect 532 symmetry as would be expected for particles with icosahedral symme- try. Negatively stained La Crosse virus [51] and Influenza virus [52] often exhibit a pleomorphic appearance or are otherwise flattened, whereas frozen-hydrated preparations of both these viruses show spherical particles which exhibit many fea- tures not apparent in negative stain. Virions in the present study maintained a symmetrical profile when in the frozen-hydrated state. No detectable flattening of polyoma virions was observed even in tilted samples.
Preservation of biological structure in vitrified water has also been reported for a variety of non-virus samples. Measurement of the lattice constants of frozen-hydrated catalase platelet crystals were within 1% of those obtained by X-ray diffraction [31], and electron diffraction patterns have been recorded which demonstrate structural preservation of features as small as 3.4
in catalase crystals [53]. Unstained, frozen-hy- drated microtubules [54] have a uniform mean diameter which corresponds closely to X-ray fiber diffraction data. Diffraction intensities along F- actin filament [55] and gap junction membrane [56] layer lines also closely agree with those from X-ray diffraction. The remarkable agreement be- tween dimensions of aqueous samples measured by X-ray diffraction and frozen-hydrated speci- mens measured by electron microscopy is some- what surprising since water expands 2-3% upon freezing to the vitreous state. One might expect such expansion to create forces which would act to compress the biological sample [43]. Apparent re- sistance of the sample to structural change caused by vitrification could indicate that water redistrib- utes during freezing or that differences exist be- tween the density of vitreous water in the free solvent compared with the hydration shell sur- rounding the biological molecule [29].
4. 2. Reproducibility of measurements
The reproducibility of measurements made with vitrified samples indicates that these samples make more attractive calibration standards compared to conventional ones. Replica gratings and poly- styrene spheres are generally unsuitable at the
290 N.H. Olson, 7qS. Baker / Spherical uirus diameter determmatton
magnificat ions typically required in virus imaging. Replica gratings are also difficult to use as inter- nal standards. The smallest commercial ly availa- ble polystyrene spheres are about ten times larger than many viruses. Also, the hydrophobic nature of polystyrene spheres tends to force them out of solution onto the surface of the wa te r -hydro - phylic support film interface as the aqueous sam- ple evaporates and thins just before freezing [31]. M a n y viruses have hydrophil ic surfaces and thus tend to diffuse into thicker regions of the aqueous sample as it dries. Catalase platelet crystals are more suitable than the s tandards mentioned above. However, they are somewhat impractical to use as an internal s tandard due to the difficulty of re- cording, in the same micrograph, sufficient num- bers of virus particles together with a crystal.
Polyoma was chosen as a calibration s tandard because it has a predominant ly spherical external morphology and a diameter accurately known from X-ray crystal lography [9]. Furthermore, po lyoma maintains its spherical shape and is randomly oriented when quickly frozen. The average stan- dard deviation in measurements of the po lyoma diameter is about 2% of the mean. The diameters of other viruses standardized against po lyoma closely match the corresponding values obtained by X-ray diffraction methods (table 1). This is true despite the variety of condit ions employed while making measurements: use of po lyoma as an in- ternal or external standard, placement of the grid in the microscope holder, the level of defocus of the image, and the choice of method used to measure the particle diameters (appendices A and B).
4. 3. Limi tat ions affecting accuracy and reliability o f measurements
Vitrification of virus particles does not appear to cause significant changes or distortions of the particle dimensions. Electron diffraction measure- ments of the TMV helix pitch (6.84 nm) closely agree both with original measurements (6.78 nm [57,58]) and subsequent remeasurements (6.9 nm [44]) of fibers examined at r o o m temperature by X-ray diffraction. If accurate, our measurements of TMV dimensions indicate that the helical par-
ticle distorts less than 1% in the axial direction (changes in particle diameter were not measured). Since this difference is statistically within the level of error in the measurements~ more extensive, controlled experiments would be necessary to de- tect if compression or expansion of TMV occurs. In the absence of these measurements, we assume there is no detectable distortion of the TMV par- ticles.
When calibrated against TMV, the mean di- ameter of po lyoma is about 48.6 nm. This implies that polyoma is compressed by less than 2%. Dis- crepancy between this value and that determined by X-ray diffraction might arise from systematic errors such as those which would occur if mea- surements were made from TMV particles whose axes are tilted away from a direction perpendicu- lar to the electron beam (i.e. the long axis of the TMV particles might be slightly tilted within the plane of support ing layer or the region of the EM grid examined may not be perpendicular to the electron beam). Other systematic errors might re- sult from differential distortion in differently shaped particles or particles with anisometric shapes (e.g. from differences in the packing den- sity of subunits in axial and equatorial directions).
The reliability of the particle measurements might also be influenced by the choice of averag- ing method. These methods produce a measure of mean particle diameters which must represent an under-estimate of the m a x i m u m particle diameter. In this study, the mean diameter for po lyoma is taken as the interparticle packing distance in crystals studied by X-ray crystal lography [9]. This distance is equal to the contact distance between particles, measured along the body diagonal of the 57.2 nm cubic unit cell, which coincides with the 3-fold icosahedral particle axis. The particle diam- eter is slightly larger when measured between 5- fold vertices since the pentavalent capsomeres ex- tend radially 0.2 0.3 nm further than the hexava- lent capsomeres [9]. The mean diameter measure- ment is also affected by the presence of deep, solvent-filled channels in the capsid surface, re- sulting from the large gaps between neighboring, radially projecting capsomeres. The presence of vitrified water in these gaps would act to lower the average electron density in spherically averaged
N.H. Olson, T.S. Baker / Spherical virus diameter determination 291
data, thus causing the mean diameter to lie some- where between high and low extremes of the capsid surface topography (i.e. the tips of the pentavalent capsomeres to the surface connecting the base of neighboring capsomeres). The measured diameter of the markedly non-spherical CPMV is another example of a virus whose mean value lies some- where between the minimum and maximum radial limits of the surface.
Clearly, the choice of standard and methods of measurement are critical factors which may intro- duce systematic errors into the calibration mea- surements. Nevertheless, the techniques presented here provide strong support for the notion that values obtained from frozen-hydrated specimens are more consistent with values obtained from X-ray diffraction compared to those obtained by conventional microscopy techniques.
4.4. Advantages of cryo-microscopy over other pre- parative techniques
Quick freezing of biological samples in a thin layer of vitrified water circumvents several artifacts encountered with negative staining and other com- monly used preparative techniques. Dehydration- induced distortion (e.g. particle flattening) is one of the major problems associated with electron microscopy of biological specimens. This phe- nomenon significantly affects the reliability of di- ameter measurements made from viruses prepared with conventional techniques. Earnshaw et al. [59] compared the diameter values of a number of viruses prepared by a variety of electron mi- croscopy techniques with corresponding values obtained from X-ray diffraction. Values obtained from positively stained or thin-sectioned virions varied as much as 31% from the X-ray-derived values. Measurements of negatively stained virions showed the closest agreement with the X-ray measurements but still deviated from the latter values by as much as 10% in some instances. The diameter of negatively stained polyoma, 45.3 nm [8], although smaller than the correct value, is still significantly larger than that determined from par- ticles in thin-sectioned material (38 nm [11]). An extreme example of preparation-induced artifact was obtained for chromium-shadowed polyoma
virus where particles with elliptical outlines of dimensions 24 x 59 nm were observed [10].
NBV diameter measurements vary over a wide range (30-50 nm), presumably due to artifacts induced by preparation conditions which cannot be carefully controlled. For example, negatively stained particles imaged in a single micrograph were quite small (30 nm) where the particles were embedded in stain suspended over holes in the carbon substrate and quite large (50 nm) in areas where the particles were in contact with the sup- port film [17]. These differences are likely to re- flect the presence of differential compression forces caused by contraction of stain in the holes [26] and flattening caused by surface tension forces present during drying of particles attached to the carbon substrate. In addition, the masking of surface features by dense layers of stain could also contribute to wide variation in diameter measure- ments of negatively stained particles. The diame- ter measurements of Juckes [16] seem somewhat surprising since his negative stain value (39.4 nm) is consistent with the X-ray solution scattering value (39.4 nm [18]) whereas hydrodynamic mea- surements [16] indicated a smaller diameter (35.7 rim).
The average diameter of CPMV determined by X-ray solution scattering is 28.4 nm [20,21]. The outer dimensions of CPMV vary significantly since the surface morphology is markedly non-spherical. The smallest dimension, between opposite surfaces along icosahedral 2-fold axes, is 26.0 nm. The distance between opposed 5-fold vertices (30.8 nm) [21] represents the maximum diameter of CPMV. Measurements from a three-dimensional reconstruction of negatively stained CPMV par- ticles indicated a spherical average and maximum diameter of 20.0 and 24.0 nm respectively [19]. The mean diameter of frozen-hydrated virions (27.5 nm) is in excellent agreement with the X-ray solution scattering value (table 1).
In almost all the examples reported in table 1, with the exception of some NflV and BMV values, the reported diameters of negatively stained viri- ons were significantly smaller than the corre- sponding values determined by X-ray diffraction or cryo-microscopy. These differences may reflect a general tendency for stains to mask surface
292 N.H. Olson. 12 S. Baker / Spherical virus diameter determination
features or compress particles when they are sus- pended over holes in the carbon substrate.
5. Conclusion
Our results add further support to a growing body of evidence which shows that the prepara- tion of vitreous, hydrated biological samples helps preserve structural d imensions and features in a
more faithful m a n n e r than other classical electron microscopy techniques. The use of biological specimens such as TMV (helical), po lyoma (spherical) and catalase (crystalline sheet), coupled with non-dis tor t ing, frozen-hydrated prepara t ion techniques, provides a convenient and accurate means to calibrate measurements of unknown,
s imilarly-shaped particles.
Acknowledgments
We gratefully acknowledge the following indi- viduals for providing purified virus samples: W. Murakami (Brandeis Universi ty) for polyoma; M. Bina (Purdue Universi ty) for SV40; D. Hendry (Univers i ty of South Africa) for N/3V; J. Johnson (Purdue Universi ty) for CPMV, BMV and FHV, and M. Cahoon (Brandeis Universi ty) for TMV.
We thank E. Jacqueline Drak for assistance in developing the technique described in appendix A. and B. Fuller, H. Hinkel and M. Mc D onough for technical assistance. Insightful comments from re- viewers J. Dubochet and S. Fuller are also grate-
fully acknowledged. Research supported by Na- tional Inst i tutes of Health grant QM33050 (to
T.S.B.).
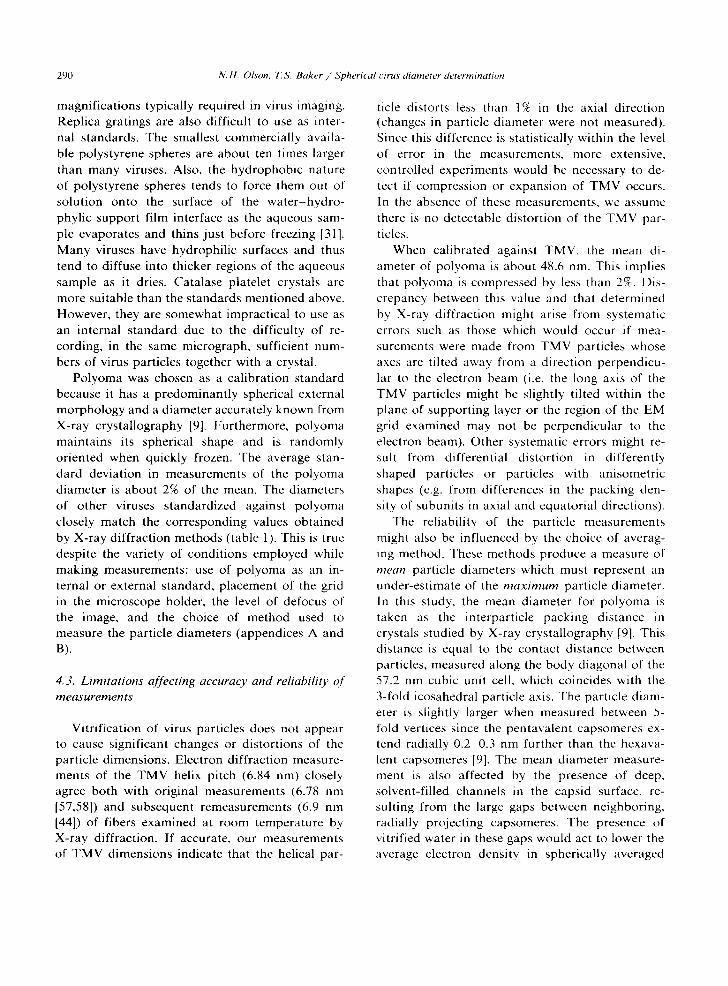
Appendix A. Initial location of spherical particle centers using a rotational cross-correlation proce- dure
A necessary requirement for the successful de- te rminat ion of the three-dimensional s tructure of spherical viruses is that several unique views (images) of the virus particle be combined in such a way that the relative view or ienta t ions are prop- erly main ta ined and a c o m m o n phase origin (par- ticle center) is identified [60]. De te rmina t ion of
the view or ienta t ion for particles with icosahedral symmetry relies on accurate ident i f icat ion of the particle center, since this is the point of intersec- tion of the 2-, 3-, and 5-fold axes of icosahedral symmetry. To reconstruct the three-dimensional structure of SV40 [40,61], a cross-correlat ion pro- cedure was devised to aid in init ially locating the center of each particle.
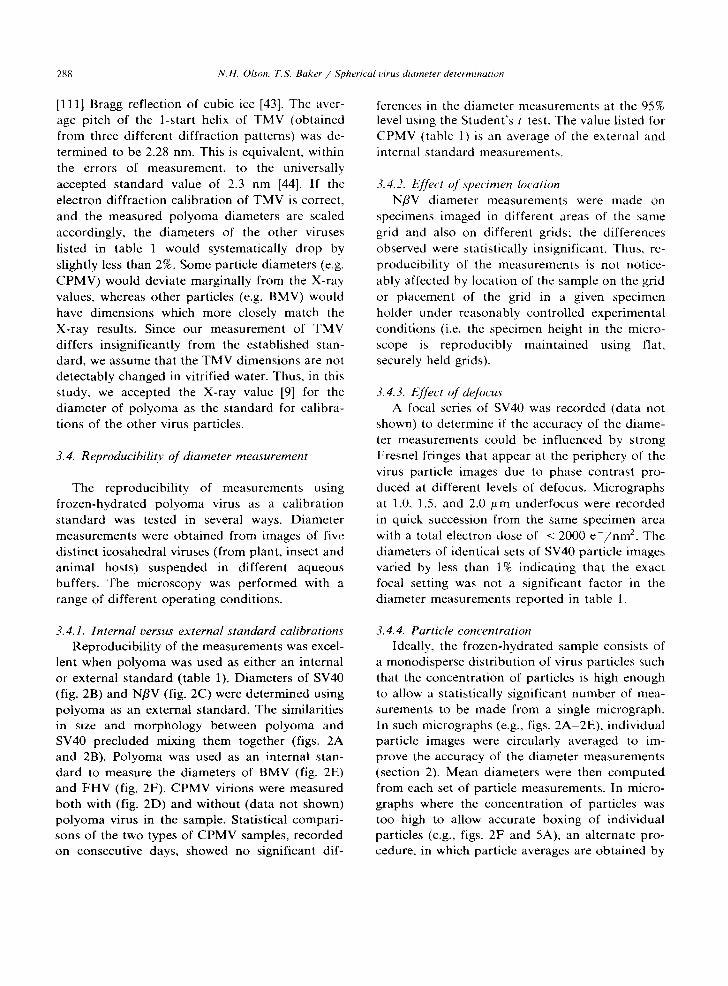
Fig. 3. Cross-correlation method for initial location of the center of images of "spherical" particles. (A) Incorrectly "boxed" image of a model T = 3 icosahedral particle, viewed down a five-fold axis. The center of the model is slightly below and to the left of the box center ("+"). (B) Same as (A) after 180 o rotation. (C) Cross-correlation pattern between (A) and (B). The vector difference between the highest peak in the cross-correlation pattern (base of arrow) and the origin of the pattern ("+"), identifies the direction and magnitude of the difference between the centers of the unrotated (A) and rotated (B) model images. The center of the particle in (A)
is one-half the vector distance identified in (C) from the center of the "boxed" area in (A).
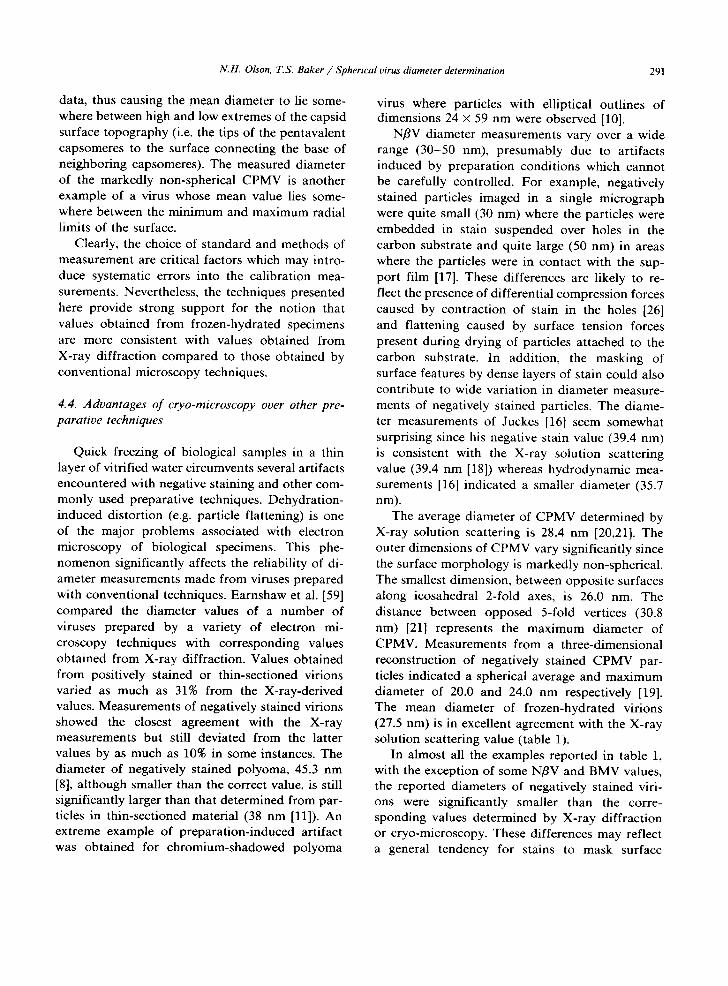
N.H. Olson, T.S. Baker / Spherical virus diameter determination 293
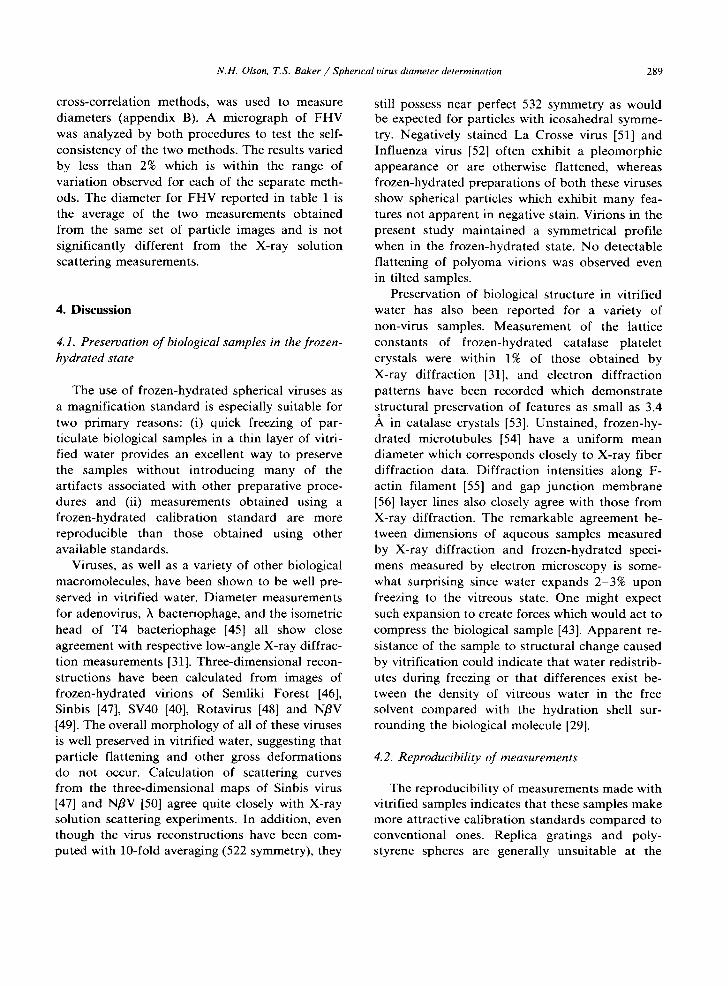
Fig. 4. Pattern produced by cross-correlating a polyoma virion image with the same image rotated by 180 o. The inset at the upper right is a magnified contour display of the center of the pattern. This facilitates the location of the peak position in the cross-correlation pattern using an interactive graphics cursor
C x").
A projected image of the top half of a com- puter-generated, T = 3 icosahedral model, viewed along a five-fold axis (fig. 3A), illustrates the procedure. The model image was generated so the center of the boxed area ( " + " symbol) and the center of the particle did not coincide. A second image (fig. 3B) was produced by rotating the first image (fig. 3A) 180 o about an axis perpendicular to and coincident with the center of the box. The cross-correlation function [62] was computed be- tween the original and rotated images (fig. 3C). The position of the highest peak in the correlation pattern (base of arrow) relative to the origin of the pattern ( " + " ) identifies the vector difference be- tween the centers of the particles in the original and rotated images. The center of the unrotated particle relative to the center of the box it lies within (fig. 3A) is one-half of this vector distance, measured from the box center in the same direc- tion as the arrow in fig. 3C. The position of the correlation peak (fig. 3C) is accurately identified using interactive graphics software as depicted in fig. 4.
As noted by Frank [62], the procedure de- scribed above locates the centrosymmetric origin (2-fold axis) of the boxed image. Thus, one possi- ble pitfall of this technique is that the particle center and "bes t" two-fold axis may not coincide, as might be true for some noisy, low-irradiation micrographs of unstained biological specimens. To reduce the possibility of mis-identifying the true particle center, the cross-correlation procedure is normally performed on images prefiltered to re- move high resolution features (usually finer 2.5 nm resolution). Despite these precautions, the lo- cation of a few particle centers still remain equiv- ocal. For example, multiple peaks sometimes ap- pear in the cross-correlation pattern which make it difficult to objectively choose the "correct" center.
Another method (not illustrated), which over- comes some of the artifacts possible in the above procedure, is to circularly average an average image using the technique described in appendix B and then compute a cross-correlation function between each individual image and the circular average. The peak in each of these correlation patterns then identifies the vector difference between the image pairs and fixes the center of each individual particle. The advantage of this procedure is that the circular average has a well-defined center so the corresponding correlation patterns have clearer and sharper peaks compared to patterns calcu- lated according to the first method described.
Appendix B. A cross-correlation procedure for selection and averaging of spherical virus images
An alternative approach, independently de- veloped but following similar strategies to those described by Frank and Wagenknecht [63], is sometimes useful for measuring particle diameters, especially in samples with mixtures of virions of distinguishable size or shape or when the distribu- tion of virions in the frozen-hydrated sample is unfavorable (e.g. highly concentrated). In this method, selection and averaging of individual par- ticle images are automated with cross-correlation procedures [64,65].
A single particle image representing each type of virion appearing in the micrograph is selected
0 O 0
D
D
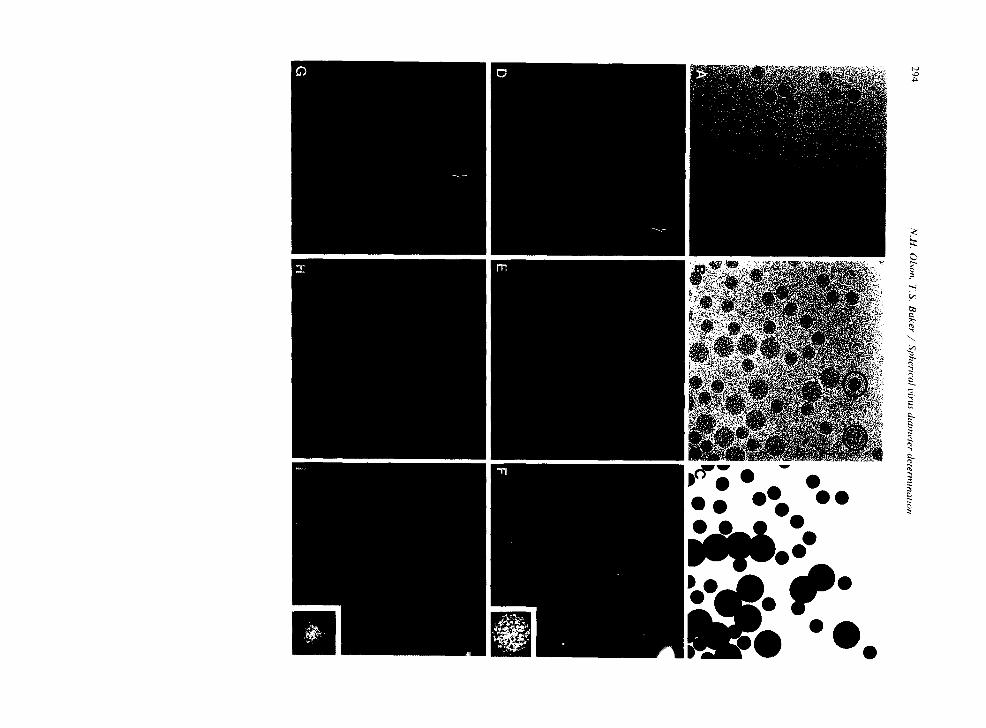
N.H. Olson, T.S. Baker / Spherical virus diameter determination 295
and b o x e d f r o m the s c a n n e d m i c r o g r a p h (figs. 5A
a n d 5B) *. Each r e fe rence i m a g e is c ross -cor re -
l a ted wi th the en t i r e s canned a rea ( m a i n image)
a n d peaks in the r e su l t an t p a t t e r n (figs. 5E and
5H) iden t i fy the l o c a t i o n s o f r eg ions in the m a i n
i m a g e m o s t s imi la r to the re ference . T h e peaks ,
so r t ed a c c o r d i n g to the i r m a g n i t u d e , r a n k - o r d e r
the c o r r e s p o n d i n g set o f i n d i v i d u a l pa r t i c le images :
h igh va lues c o r r e s p o n d to par t i c les m o s t s imi la r to
the r e fe rence and low va lues c o r r e s p o n d to par -
t icles mos t d i s s imi l a r to the re ference . T h o s e par -
t icles wh ich co r r e l a t e m o s t s t rong ly wi th the refer-
e n c e are ave raged by s u m m i n g the i nd iv idua l pa r -
t ic le images l oca t ed in the o r ig ina l m i c r o g r a p h
(figs. 5A a n d 5B) at pos i t i ons iden t i f i ed by the
peaks in the c o r r e l a t i o n p a t t e r n (e.g., figs. 5E and
5H) . Th is ave rage is used as a r e fe rence image in a
s e c o n d cycle of c ro s s - co r r e l a t i on wi th the m a i n
i m a g e (figs. 5F a n d 51). A n y bias i n t r o d u c e d by
the p a r t i c u l a r cho ice of the in i t ia l r e fe rence used
in the first cyc le is r e d u c e d d u r i n g this r e f i n e m e n t
cycle. T h e d i a m e t e r o f the ave raged pa r t i c l e image
( insets to figs. 5 F a n d 51) is m e a s u r e d as desc r ibed
in the text, ( sec t ion 2) for all v i rus types.
T h e two m a j o r d i s a d v a n t a g e s to this p r o c e d u r e are (i) it is ve ry d i f f i cu l t to d i s t i ngu i sh d i f f e r e n t
pa r t i c les tha t a re s imi la r in size a n d m o r p h o l o g y
(e.g. p o l y o m a a n d SV40) a n d (ii) the p r o c e d u r e is
e x t r e m e l y sens i t ive to l o n g - r a n g e ( low re so lu t ion )
va r i a t ions such as d i f f e r ences in the th i ckness o f
v i t r i f ied w a t e r across a ho le in the c a r b o n sub-
s t ra te (figs. 5A, 5 D a n d 5G). T h e s e c o n d p r o b l e m
is m i n i m i z e d by p re f i l t e r ing (in F o u r i e r space) the
en t i re s c a n n e d i m a g e to r e m o v e l o w - f r e q u e n c y
f l uc tua t i ons (genera l ly coa r s e r t h a n 100 n m res-
o lu t ion ) a n d c o m p u t e the c r o s s - c o r r e l a t i o n aver -
ages wi th a m a i n i m a g e w i t h a u n i f o r m b a c k -
g r o u n d (figs. 5B, 5E a n d 5H). Th i s p r o c e d u r e does
n o t c o m p l e t e l y e l i m i n a t e v a r i a t i o n s ar is ing, for
example , f r o m a p p r o x i m a t e l y l i nea r c h a n g e s in
s a m p l e th ickness across the f ie ld o f v iew. L i n e a r
g r ad i en t s can be r e m o v e d by e s t ab l i shed p r o c e -
du res [67] a f te r wh ich s u b s e q u e n t p r o c e s s i n g can be appl ied .
References
* In mixed samples where the different virions can be dis- tinguished by size, the different reference particles (fig. 5B, circled virions) are boxed within circular boundaries of identical size to help minimize the generation of "false" correlation peaks. That is, the surrounding background den- sity (vitrified water) in the boxed image of the smaller of the two reference particles serves as an additional constraint in guiding the correlation procedure to discriminate between different size particles (i.e those which do versus those which do not fill the entire circular boundary).
[1] R.C. Backus and R.C. Williams, J. Appl. Phys. 20 (1949) 224.
[2] F.S. Sjostrand, Electron Microscopy of Cells and Tissues, Vol. 1 (Academic Press, New York, 1967) p. 365.
[3] M. Cermola and W.-H. Schreil, J. Electron Microsc. Tech. 5 (1987) 171.
[4] R. Luftig, J. Uhrastruct. Res. 20 (1967) 91. [5] N.G. Wrigley, J. Ultrastruct. Res. 24 (1968) 454. [6] P.N.T. Unwin, J. Mol. Biol. 98 (1975) 235.
Fig. 5. Cross-correlation procedure to select and average virion images. (A) Image of a frozen-hydrated mixture of polyoma (larger particles) and FHV. The increase in average background density from left to right is due to an increase in vitrified water thickness over the hole in the carbon substrate. (B) Fourier-space "prefiltered" image of (A) obtained by Fourier reconstruction methods [66] which remove low frequency fluctuations ( > - 100 nm) mainly contributed by the variation in the thickness of the vitrified water. The circled FHV (left) and the polyoma (right) images were used a reference images for the cross-correlation procedure. Both reference particles were boxed with identical size circular boundaries to minimize ambiguities in discriminating correlation peaks for the two different virions (see footnote in appendix B). (C) Schematic representation of (B), identifying the approximate location of the FHV and polyoma particles. (D) Cross-correlation pattern between the polyoma reference (circled in (B)) and image (A). Areas of high correlation are represented by brighter colors. The arrow identifies the strongest correlation peak, locating the polyoma reference. (E) Cross-correlation pattern between the polyoma reference circled in (B)) with image (B). The removal of low-frequency features enhances the ability to clearly identify all the polyoma positions. Virion images in (B), identified by the peaks, were averaged, and this average was used as the reference in a subsequent cycle of cross-correlation averaging. (F) Cross-correlation pattern between the reference average image and (B). The peaks identifying the positions of the polyoma particles are much sharper and clearer than those in (E). The inset shows the averaged polyoma image obtained by combining those particles identified by the peaks in the last correlation pattern computed. (G) Same as (D) with the exception that the FHV image circled in (B) was used as the reference. The arrow locates the position of the FHV reference. (H) Same as (E) using the FHV reference (circled in (B)). (I) Same as (F) using an averaged FHV image. The inset shows the averaged FHV image obtained after the second cycle of correlation averaging.
296 N.H. Olson, T S. Baker / Spherical oirus diameter determination
[7] J. Berriman and K.R. Leonard, Ultramicroscopy 19 (1986) 349.
[8] P. Wildy, M.G.P. Stoker, I.A. Macpherson and R.W. Horne, Virology 11 (1960) 444.
[9] I. Rayment, T.S. Baker, D . L D . Caspar and W.T. Murakami, Nature (London) 295 (1982) 110.
[10] H. Kahler, W.P. Rowe, B.J. Lloyd and J.W. Hartley, J. Natl. Cancer Inst. 22 (1959) 647.
[11] A.F. Howatson and J.D. Almeida, J. Biophys. Biochem. Cytol. 8 (1960) 828.
[12] H.D. Mayor, R.M. Jamison and L.E. Jordan, Virology 19 (1963) 359.
[13] E.E. Lattman, Science 208 (1980) 1048. [14] M.A. Koch, H.J. Eggers, F.A. Anderer, H.D. Schlum-
berger and H. Frank, Virology 32 (1967) 503. [15] D.A. Hendry, M.F. Bekker and M.H.V. van Regenmortel,
South African Med. J. 42 (1968) 117. [16] I.R.M. Juckes, J. Gen. Virol. 42 (1979) 89. [17] J.T. Finch, R.A. Crowther, D.A. Hendry and J.K.
Struthers, J. Gen. Virol. 24 (1974) 191. [18] J.E. Johnson, personal communication. [19] R.A. Crowther, J .LM.C. Geelen and J.E. Mellema, Virol-
ogy 57 (1974) 20. [20] J.M. White and J.E. Johnson, Virology 101 (1980) 319. [21] C.V. Stauffacher, R. Usha, M. Harrington, T. Schmidt,
M.V. Hosur and J.E. Johnson, in: Crystallography in Molecular Biology, Eds. D. Moras, J. Drenth, B. Strand- berg, D. Suck and K. Wilson (Plenum, New York, 1987) p. 293.
[22] J.W. Anderegg, M. Wright and P. Kaesberg, Biophys. J. 3 (1963) 175.
[23] P. Kaesberg, in: Proc. 1st Natl. Biophysics Conf., Cam- bridge, MA, 1957, Ed. R.B. Roberts (Yale University Press, New Haven, CT, 1959) p. 244.
[24] S.C. Dearing, P.D. Scotti, P.J. Wigley and S.D. Dhana, New Zealand J. Zool. 7 (1980) 267.
[25] E. Kellenberger, M. H~ner and M. Wurtz, Ultrami- croscopy 9 (1982) 139.
[26] P.N.T. Unwin, J. Mol. Biol. 87 (1974) 657. [27] T.S. Baker, in: Proc. 9th Intern. Congr. on Electron
Microscopy, Toronto, 1978, Ed. J.M. Sturgess (Micro- scopical Society of Canada, Toronto, 1978) p. 2.
[28] W. Chiu, Ann. Rev. Biophys. Chem. 15 (1986) 237. [29] J. Dubochet, M. Adrian, J.-J. Chang, J.-C. Homo, J.
Lepault, A.W. McDowall and P. Schultz, Quart. Rev. Biophys. 21 (1988) 129.
[30] M. Stewart and G. Vigers, Nature (London) 319 (1986) 631.
[31] M. Adrian, J. Dubochet, J. Lepault and A.W. McDowall, Nature (London) 308 (1984) 32.
[32] R.A. Milligan, A. Brisson and P.N.T. Unwin, Ultrami- croscopy 13 (1984) 1.
[33] R. Henderson, J.M. Baldwin, K.H. Downing, J. Lepault and F. Zemlin, Ultramicroscopy 19 (1986) 147.
[34] J.S. Jaffe and R.M. Glaeser, Ultramicroscopy 23 (1987) 17.
[35] K.A. Taylor and R.M. Glaeser, J. Ultrastruct. Res. 55 (1976) 448.
[36] T.W. Jeng and W. Chiu, in: Proc. 41st Annual EMSA Meeting, Phoenix, AZ, 1983, Ed. G.W. Bailey (San Fran- cisco Press, San Francisco, CA, 1983) p. 430.
[37] EL. Deng, in: Proc. 45th Annual EMSA Meeting, Bal- timore, MD, 1987, Ed. G.W. Bailey (San Francisco Press, San Francisco, CA, 1987) p. 646.
[38] R.A. Grant, L.L. Degn, W. Chiu and J. Robinson, in: Proc. 41s t -Annual EMSA Meeting, Phoenix, AZ, 1983. Ed. G.W. Bailey (San Francisco Press, San Francisco, CA, 1983) p. 730.
[39] R.A. Grant , M.F. Schmid, W. Chiu, J.F. Deatherage and J. Hosoda, Biophys. J. 49 (1986) 251.
[40] T.S. Baker, J. Drak and M. Bina, Proc. Natl. Acad. Sci. USA 85 (1988) 422.
[41] D.J. DeRosier and P.B. Moore, J. Mol. Biol. 52 (1970) 355.
[42] K.C. Holmes, in: Biological Macromolecules and Assem- blies, Vol. 1: Virus Structures, Eds. F.A. Jurnak and A. McPherson (Wiley, New York, 1984) p. 121.
[43] J. Dubochet, J. Lepault, R. Freeman, J.A. Berriman and J.-C. Homo, J. Microscopy 128 (1982) 219.
[44] D .ED. Caspar, personal communication. [45] W. Baschong, U. Aebi, C. Baschong-Prescianotto, J.
Dubochet, L. Landmann, E. Kellenberger and M. Wurtz, J. Ultrastruct. Mol. Struct. Res. 99 (1988) 189.
[46] R.H. Vogel, S.W. Provencher, C.-H. yon Bonsdorff, M. Adrian and J. Dubochet, Nature (London) 320 (1986) 533.
[47] S.D. Fuller, Cell 48 (1987) 923. [48] B.V.V. Prasad, G.J. Wang, J.P.M. Clerx and W. Chiu, J.
Mol. Biol. 199 (1988) 269. [49] N.H. Olson, T.S. Baker, W. Bomu, J.E. Johnson and D.A.
Hendry, in: Proc. 45th Annual EMSA Meeting, Bal- timore, MD, 1987, Ed. G.W. Bailey (San Francisco Press, San Francisco, CA, 1987) p. 650.
[50] N.H. Olson, T.S. Baker, W. Bomu and J.E. Johnson, manuscript in preparation.
[51] Y. Talmon, B.V.V. Prasad, J.P.M. Clerx, G.-J. Wang, W. Chiu and M.J. Hewlett, J. Virol. 61 (1987) 2319.
[52] F.P. Booy, R.W.H. Ruigrok and E.F.J. van Bruggen, J. Mol. Biol. 184 (1985) 667.
[53] K.A. Taylor and R.M. Glaeser, Science 186 (1974) 1036. [54] E.-M. Mandelkow, R. Rapp and E. Mandelkow, J. Mi-
croscopy 141 (1986) 361. [55] J. Trinick, J. Cooper, J. Seymour and E.H. Egelman, J.
Microscopy 141 (1986) 349. [56] P.N.T. Unwin and P.D. Ennis, Nature (London) 307
(1984) 609. [57] J.D. Bernal and I. Fankuchen, J. Gen. Physiol. 25 (1941)
111. [58] J.D. Watson, Biochim. Biophys. Acta 13 (1954) 10. [59] W.C. Earnshaw, J. King and F.A. Eiserling, J. Mol. Biol.
122 (1978) 247. [60] R.A. Crowther, Phil. Trans. Roy. Soc. London B261 (1971)
221.
N.H. Olson, T.S. Baker / Spherical virus diameter determination 297
[61] T.S. Baker, J. Drak and M. Bina, Biophys. J. 55 (1989) 243.
[62] J. Frank, Topics Current Phys. 13 (1980) 187. [63] J. Frank and T. Wagenknecht, Ultramicroscopy 12 (1984)
169. [64] W.O. Saxton, in: Electron Microscopy in Molecular Di-
mensions, Eds. W. Baumeister and W. Vogell (Springer, Berlin, 1980) p. 245.
[65] J. Frank and W. Goldfarb, in: Electron Microscopy in Molecular Dimensions, Eds. W. Baumeister and W. Vogell (Springer, Berlin, 1980) p. 261.
[66] T.S. Baker, Image processing of biological specimens: A bibliography, in: Electron Microscopy in Biology, Vol. 1, Ed. J.D. Griffith (Wiley, New York, 1981) p. 189.
[67] U. Aebi, PhD Thesis, University of Basel (1977).