Embed Size (px)
Citation preview
International Journal of Scientific and Management Research Volume 1 Issue 2 (September-October) 2018
ISSN:2581-6888 Page: 1-15
The Determinants of FDI Inflows in China—Evidence from DCs
and LDCs
Sihong Wu
PhD candidate in Murdoch University, School of Business and Governance
Mailing address: 90 South street, Murdoch, Western Australia, 6150.
Received: September 9, 2018; Accepted: September 17, 2018; Published: September 19, 2018
Abstract
This paper uses the data of China's foreign direct investment (FDI) inflows from 1997 to 2016 to
analyze the determinants of China's attraction of FDI from developed countries (DCs) and less-
developed countries (LDCs). By constructing a complete information game model, this paper first
deduces that China's attraction of FDI will help to improve its technical level. After empirical
analysis, the following conclusions have been drawn: (1) In general, the main factor affecting
China's attraction of FDI is the R&D level. (2) The number of FDI inflows in China from DCs has
a positive relationship with the number of China's labor force, and has a negative relationship with
its salary level. (3) LDCs’ FDI in China will decrease with the increase in China’s R&D level and
social insurance costs, and will increase as China’s salary expenditure increases. This paper has
contributed to the literature on the determinants of Chinese FDI inflows by DCs and LDCs.
Keywords: MNEs; FDI inflows; DCs; LDCs.
JEL Codes: L25; M21; O53; P27
1. Introduction
China has always been the top recipient of foreign investments among all the less-developed
countries (LDCs) since 1990 (Wang et al., 2013). In recent years, there were a large number of
foreign companies came to China for investments. According to the data provided by Chinese
Ministry of Commerce about the FDI inflows in the first two months of 2018, there were 8848
new invested multinational enterprises (MNEs) which has increased 129.12% compared with past
months. China absorbed foreign investments of 136.3 billion U.S. dollars in 2017, ranking the
second in the world, and hitting a record high in 2017. With the rapid development of China's
economy and the continuous relaxation of China's foreign trade policies, the number of foreign
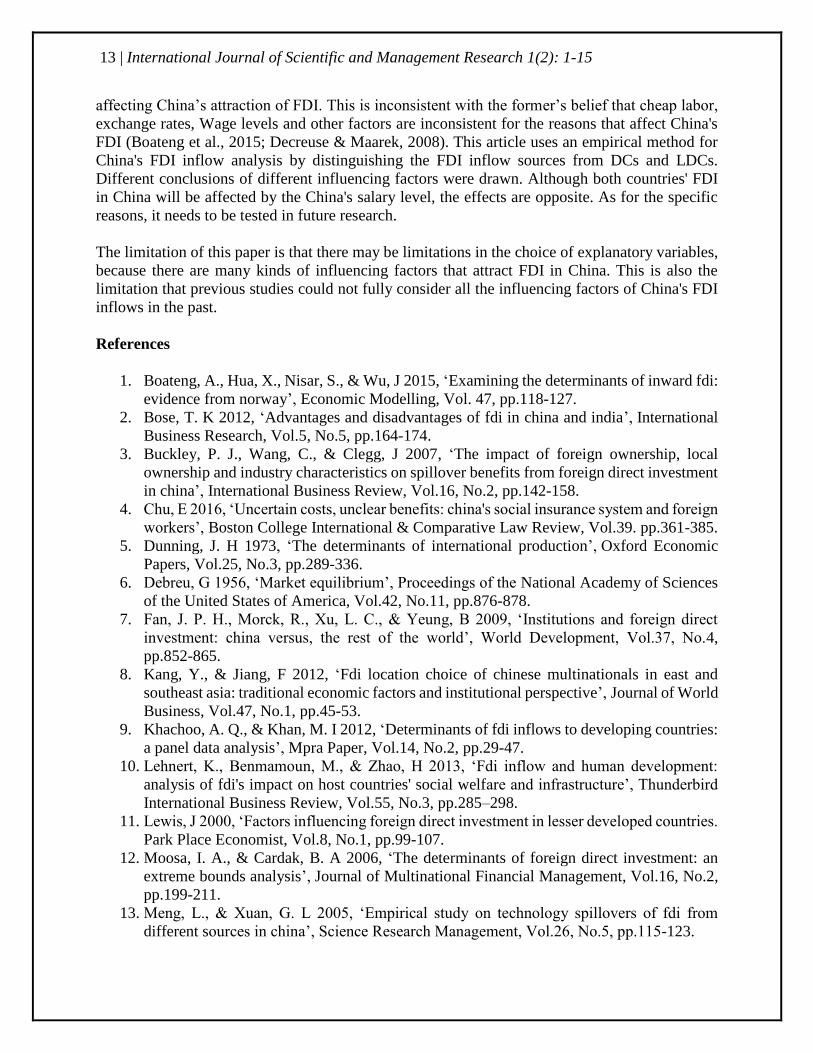
investment projects in China has also continued to increase (see Appendix 1).
Previous studies focus on analyzing China's outward foreign direct investment (OFDI) and have
examined a series of issues regarding China's OFDI, such as the driving forces, the location choice,
the determinants, the impacts and motivations (Kang & Jiang, 2012). Some researchers believe
that the economic conditions of a country or region are important factor in attracting foreign capital
2 | International Journal of Scientific and Management Research 1(2): 1-15
inflows. The larger the market size, the more likely it is that MNEs will enter into these countries
(Kang & Jiang, 2012; Boateng et al..2015). There are some studies believe that labor factors (such
as economic population, wage level, unemployment rate, etc.) are important factors affecting the
flow of FDI into a region (Lewis, 2000; Sandhu, Fredericks & Programme, 2005). Other
researchers, from the macro-environmental point of view, believe that a country's currency,
exchange rate, inflation rate, and other factors may affect China's FDI inflows (Kang & Jiang,
2012; Boateng et al., 2015). However, there is no consensus result has emerged and no widely
accepted determinants of FDI inflows (Moosa & Cardak, 2006). Moreover, previous research
results may not be able to apply to MNEs from LDCs (Narayanan & Bhat, 2011). The amount of
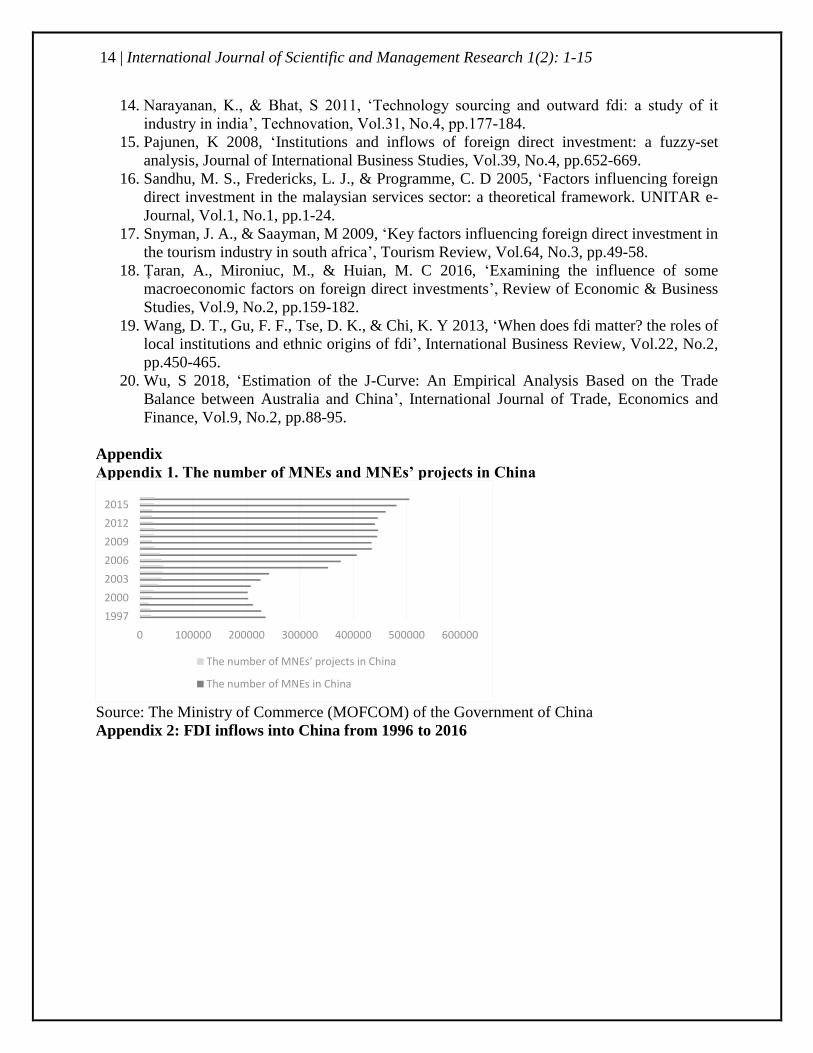
investment of developed countries (DCs) in China is always larger than that of less-developed
countries (LDCs), and it is more concentrated (See Appendix 2). And MNEs from LDCs may not
have the advantages of high-tech and efficient management systems.
This paper is attempted to contribute to the literature about the determinants of China’s FDI
inflows in three ways. First, supplement literature of the main determinants of FDI inflows to
China through theoretical analysis. Second, through empirical analysis, find out the main purposes
and differences of FDI in China between DCs and LDCs. Third, this paper aims to enrich the
existing research on China’s FDI inflows and find the difference between the determinants of
MNEs entering China’s investment in DCs and LDCs. By analyzing the influencing factors of
MNEs' inflow into China, it will help us to further analyze the impact of MNEs on China's
economy from the source and provide better basis for formulating a better foreign capital
introduction system for China. By analyzing the influencing factors of MNEs inflows into China,
we can further analyze the impact of MNCs on China’s economy and provide better evidence for
developing better policies for attracting foreign investment in LDCs.
The rest of the paper is organized as follows: the next section reviews the relevant theoretical
literature and develops hypothesis in the determinants of FDI inflows into China from DCs and
LDCs. Section 3 outlines the empirical methodology. Section 4 provides a complete information
game model and the empirical analysis of the regression results of the four models. The final
section summarizes this article, including empirical findings, major contributions, and limitations.
2. Literature Review
2.1 Impacts of FDI inflows in China economy
Foreign direct investment plays an important role in the international business since it has impacts
on both host country and receiving countries (Țaran et al., 2016). China's natural resources and
human resources are the key factors in attracting FDI from foreign countries (Bose, 2012). MNEs
invest in China can get some benefits such as business growth, availability of cheap materials and
labour and risk minimization (Bose, 2012). However, there are also some risks facing by MNEs if
they decide to move abroad, including the additional transportation costs, tax barriers and culture
difference. FDI can enhance a host country's economic development level, technological
innovation and labour productivity. It can also cause an increase in unemployment rate and
environmental pollution in the host country (Wang et al., 2013). Therefore, the relationship
between FDI and economic performance are still conflicting (Snyman &Saayman, 2009). Dunning
(1996) pointed out that the choice of FDI mainly depends on three factors: ownership advantages,
location advantages and internalization advantages (OLI). Dunning's theory can be used to explain
3 | International Journal of Scientific and Management Research 1(2): 1-15
the gradual expansion theory, suggesting that once the MNEs have gained experience of overseas
expansion and established good reputation, they will start to expand abroad through FDI (Sandhu,
Fredericks & Programme, 2005). Because there is difference between foreign trade conditions and
foreign relations between DCs and LDCs, Dunning's theory may not be able to apply in different
countries.
FDI inflows will affect China's technological level. Lehnert, Benmamoun & Zhao (2013) believe
that FDI, whether from DCs or LDCs, can help the host country improve the construction of
welfare and knowledge infrastructure, which can help the region to improve knowledge and
innovation capabilities. However, Meng & Xuan (2015) conducted empirical research using data
from various provinces in China and found that not all FDI will bring technology spillovers to
Chinese companies. The technical impact of FDI inflows in China depends on which countries is
the source of these investments. Only when those MNEs are from advanced regions can increase
China’s technological level through FDI inflows in China (Meng & Xuan, 2015). Therefore, not
all FDI inflows can improve China’s technological level. Based on the above analysis, this paper
proposes the following assumptions:
Hypothesis 1: FDI inflows to China are not necessarily beneficial to China's technological
improvement.
2.2 Factors Affecting China's Attraction of FDI inflows
In analyzing the FDI inflows of China, some studies suggest that the cost of labour is one of the
most important factor. However, some argued that for those highly technological and capital
intensive industries, the cheap labour cost is not that important (Sandhu, Fredericks & Programme,
2005). China's labour costs are at a low level in the world, especially for the manufacturing sector
(Sandhu, Fredericks & Programme, 2005). Although the labour compensation in China has
continued to increase in recent years, labour cost advantage still exists, which is an important
reason for attracting foreign capital inflows.
A higher level of GDP implies better market opportunities in the host country (Boateng et al.,
2015). Kang & Jiang (2012) suggest that there is a positive relationship between market size and
FDI inflows, which means the larger the market, the more the FDI flows. A large market size
allows investors to realize economies of scale and to reduce transaction costs. A fast growing
market can also provide investors with more profit-making opportunities than those slowly
growing market (Kang & Jiang, 2012). Thus, the higher the economic growth rates, the more FDI
that is attracted to the host country. Most of them suggest a positive relationship between GDP and
FDI inflow. This is because as the size of market increase, there will be higher demand and less
supply, which is an important factor in attracting FDI inflow. Boateng et al (2015) suggest that a
country’s iinflation level will increase the prices of products, which will weaken its export
advantages. When China's export advantage is reduced, the desire of MNEs to invest in China will
also decrease. The inflation rate of a country is assumed to reflect the level of economic stability,
the economic tension and the ability of the government to balance its budgets (Boateng et al.,
2015). Based on the above analysis, the following assumption is proposed:
4 | International Journal of Scientific and Management Research 1(2): 1-15
Hypothesis 2: China's efforts to attract FDI inflows are affected by a number of factors including
labour force, market size, salary costs and other production costs, etc.
2.3 FDI inflows from DCs and LDCs
Most of the literature agrees that institution factors will affect FDI inflows in a country. Pajunen
(2008) conducted an empirical analysis to confirm that the institution factor in host countries have
strong impacts on FDI inflows. If the host country has friendly regulative institutions, it is more
likely to attract FDI from MNEs. The behavior of the FDI from developed countries and less
developed countries is different. Buckley et al. (2007) suggest that MNEs from MNEs are the late
comers and they are more likely to seek for resources and learning opportunities via OFDI since
they are based in less developing regions. They also point out that the state ownership will
moderate the effect of MNEs' FDI gains. Khachoo & Khan (2012) conducted an empirical analysis
based on 32 DCs and found that the FDI inflows are affected by the host country's market size and
labour costs. However, some studies believe that the main reason for China’s attraction of FDI
inflows should be in China itself and not in the country of origin of FDI (Fan et al., 2009). China's
main factors in attracting foreign investment and entering MNEs are cheap labor and cheap
resources. (Boateng et al., 2015). From the above analysis, it can be seen that scholars' research
focus on the determinants of FDI inflows in China is not consistent. In order to verify whether FDI
from different countries and regions will have a different impact on China's economy, this paper
proposes the following hypothesis:
Hypothesis 3: Cheap resources are the main factor for China to attract foreign investment, which
is consistent for both DCs and LDCs.
3. The Methodology and Model
This paper firstly confirms the effect of MNEs entering China's technology transfer to China by
constructing a complete information game model. Then, by constructing a regression model, the
selected variables are subjected to regression analysis using the fixed effect model and the random
effects model, and relevant conclusions are obtained.
3.1 The Data
DCs and LDCs would have different performances when accepting FDI inflows. From the data
collected from the China Bureau of Statistics, as of 2016, there is 148 countries have directly
invested in China. Among the 148 countries, 24 of them are developed countries. After removing
countries with missing variables, the remaining studies included 22 DCs and 38 LDCs.
This paper selects data on FDI inflows in China from the period of 1997 to 2016. The research
period covers the process of foreign trade after China's reform in 1978, which is helpful for us to
analysis the China's FDI inflows changes since opening up. This paper uses the current value of
the variable minus the value of the previous period and then divides the value of the previous
period to obtain the variables' rate of change. The data comes from the Ministry of Commerce of
the People's Republic of China, the National Bureau of Statistics of China, China State Intellectual
Property Office and China Ministry of Human Resources and Social Security.
5 | International Journal of Scientific and Management Research 1(2): 1-15
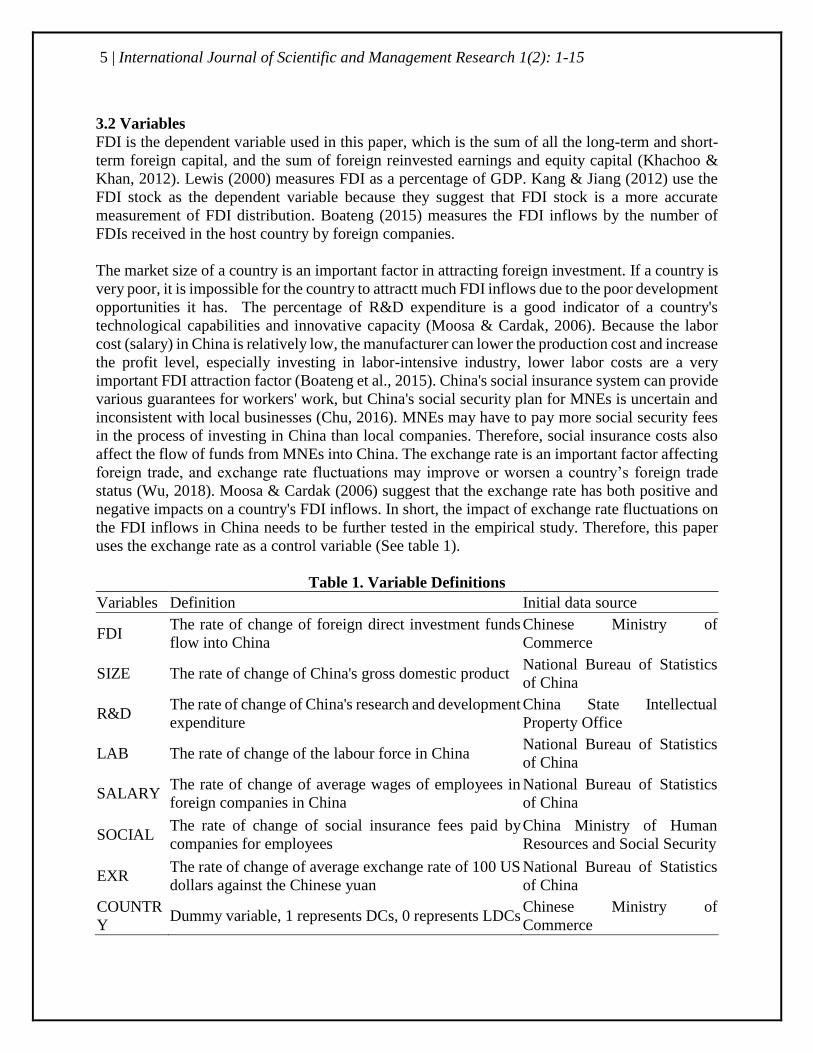
3.2 Variables
FDI is the dependent variable used in this paper, which is the sum of all the long-term and short-
term foreign capital, and the sum of foreign reinvested earnings and equity capital (Khachoo &
Khan, 2012). Lewis (2000) measures FDI as a percentage of GDP. Kang & Jiang (2012) use the
FDI stock as the dependent variable because they suggest that FDI stock is a more accurate
measurement of FDI distribution. Boateng (2015) measures the FDI inflows by the number of
FDIs received in the host country by foreign companies.
The market size of a country is an important factor in attracting foreign investment. If a country is
very poor, it is impossible for the country to attractt much FDI inflows due to the poor development
opportunities it has. The percentage of R&D expenditure is a good indicator of a country's
technological capabilities and innovative capacity (Moosa & Cardak, 2006). Because the labor
cost (salary) in China is relatively low, the manufacturer can lower the production cost and increase
the profit level, especially investing in labor-intensive industry, lower labor costs are a very
important FDI attraction factor (Boateng et al., 2015). China's social insurance system can provide
various guarantees for workers' work, but China's social security plan for MNEs is uncertain and
inconsistent with local businesses (Chu, 2016). MNEs may have to pay more social security fees
in the process of investing in China than local companies. Therefore, social insurance costs also
affect the flow of funds from MNEs into China. The exchange rate is an important factor affecting
foreign trade, and exchange rate fluctuations may improve or worsen a country’s foreign trade
status (Wu, 2018). Moosa & Cardak (2006) suggest that the exchange rate has both positive and
negative impacts on a country's FDI inflows. In short, the impact of exchange rate fluctuations on
the FDI inflows in China needs to be further tested in the empirical study. Therefore, this paper
uses the exchange rate as a control variable (See table 1).
Table 1. Variable Definitions
Variables Definition Initial data source
FDI The rate of change of foreign direct investment funds
flow into China
Chinese Ministry of
Commerce
SIZE The rate of change of China's gross domestic product National Bureau of Statistics
of China
R&D The rate of change of China's research and development
expenditure
China State Intellectual
Property Office
LAB The rate of change of the labour force in China National Bureau of Statistics
of China
SALARY The rate of change of average wages of employees in
foreign companies in China
National Bureau of Statistics
of China
SOCIAL The rate of change of social insurance fees paid by
companies for employees
China Ministry of Human
Resources and Social Security
EXR The rate of change of average exchange rate of 100 US
dollars against the Chinese yuan
National Bureau of Statistics
of China
COUNTR
Y Dummy variable, 1 represents DCs, 0 represents LDCs
Chinese Ministry of
Commerce
6 | International Journal of Scientific and Management Research 1(2): 1-15
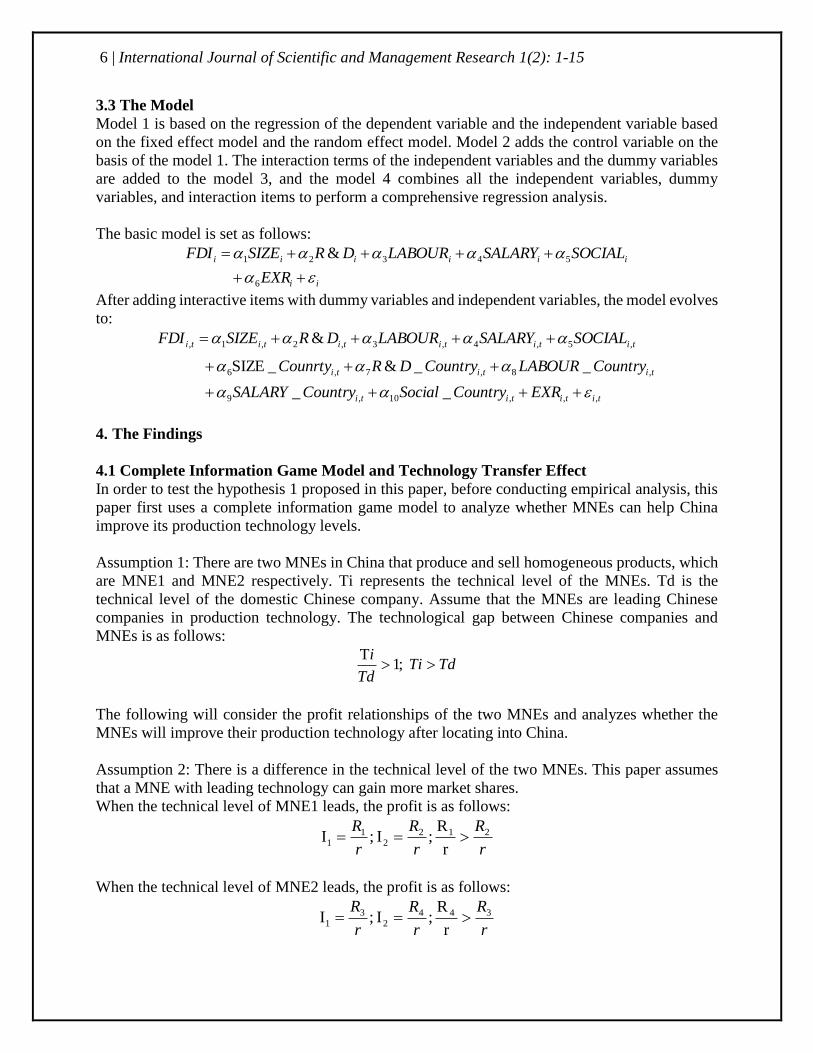
3.3 The Model
Model 1 is based on the regression of the dependent variable and the independent variable based
on the fixed effect model and the random effect model. Model 2 adds the control variable on the
basis of the model 1. The interaction terms of the independent variables and the dummy variables
are added to the model 3, and the model 4 combines all the independent variables, dummy
variables, and interaction items to perform a comprehensive regression analysis.
The basic model is set as follows:
ii
iiiiii
EXR
SOCIALSALARYLABOURDRSIZEFDI
++
++++=
6
54321
&
After adding interactive items with dummy variables and independent variables, the model evolves
to:
titititi
tititi
titititititi
EXRCountrySocialCountrySALARY
CountryLABOURCountryDRCounrty
SOCIALSALARYLABOURDRSIZEFDI
,,,10,9
,8,7,6
,5,4,3,2,1,
__
__&_SIZE
&
++++
+++
++++=
4. The Findings
4.1 Complete Information Game Model and Technology Transfer Effect
In order to test the hypothesis 1 proposed in this paper, before conducting empirical analysis, this
paper first uses a complete information game model to analyze whether MNEs can help China
improve its production technology levels.
Assumption 1: There are two MNEs in China that produce and sell homogeneous products, which
are MNE1 and MNE2 respectively. Ti represents the technical level of the MNEs. Td is the
technical level of the domestic Chinese company. Assume that the MNEs are leading Chinese
companies in production technology. The technological gap between Chinese companies and
MNEs is as follows:
TdTiTd
i ;1
T
The following will consider the profit relationships of the two MNEs and analyzes whether the
MNEs will improve their production technology after locating into China.
Assumption 2: There is a difference in the technical level of the two MNEs. This paper assumes
that a MNE with leading technology can gain more market shares.
When the technical level of MNE1 leads, the profit is as follows:
r
R
r
R
r
R 2122
11
r
R ;I ;I ==
When the technical level of MNE2 leads, the profit is as follows:
r
R
r
R
r
R 3442
31
r
R ;I ;I ==
7 | International Journal of Scientific and Management Research 1(2): 1-15
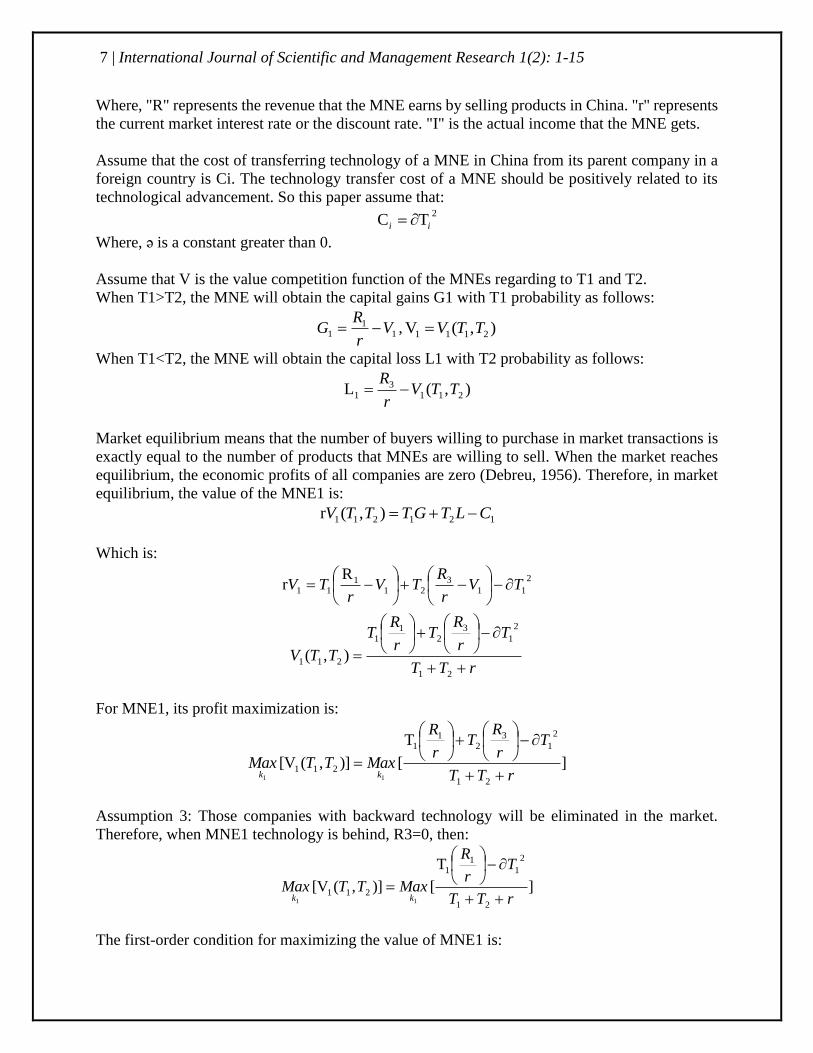
Where, "R" represents the revenue that the MNE earns by selling products in China. "r" represents
the current market interest rate or the discount rate. "I" is the actual income that the MNE gets.
Assume that the cost of transferring technology of a MNE in China from its parent company in a
foreign country is Ci. The technology transfer cost of a MNE should be positively related to its
technological advancement. So this paper assume that: 2
TC ii =
Where, ə is a constant greater than 0.
Assume that V is the value competition function of the MNEs regarding to T1 and T2.
When T1>T2, the MNE will obtain the capital gains G1 with T1 probability as follows:
11
1 Vr
RG −= , ),(V 2111 TTV=
When T1<T2, the MNE will obtain the capital loss L1 with T2 probability as follows:
),(L 2113
1 TTVr
R−=
Market equilibrium means that the number of buyers willing to purchase in market transactions is
exactly equal to the number of products that MNEs are willing to sell. When the market reaches
equilibrium, the economic profits of all companies are zero (Debreu, 1956). Therefore, in market
equilibrium, the value of the MNE1 is:
121211 ),(r CLTGTTTV −+=
Which is:
2
11
3
211
11
Rr TV
r
RTV
rTV −
−+
−=
rTT
Tr
RT
r
RT
TTV++
−
+
=21
2
1
3
21
1
211 ),(
For MNE1, its profit maximization is:
]
T
[ )],([V 21
2
1
3
21
1
21111 rTT
Tr
RT
r
R
MaxTTMaxkk ++
−
+
=
Assumption 3: Those companies with backward technology will be eliminated in the market.
Therefore, when MNE1 technology is behind, R3=0, then:
]
T
[ )],([V 21
2
11
1
21111 rTT
Tr
R
MaxTTMaxkk ++
−
=
The first-order condition for maximizing the value of MNE1 is:

8 | International Journal of Scientific and Management Research 1(2): 1-15
0)(
)2),(V
2
21
2
11
1
21
21
1
211 =++
−
−++
−
=
rTT
Tr
RT
rTT
Tr
R
T
TT
2
1211 ))(2( TrTT
r
R=+−
The full differential of both sides of the equation is as follows:
( )21 1
121 2)(22 TT dT
r
RdrTT
−=++
0)(2
T2d
21
11
2
1 ++
−
=rTT
r
R
dT
T
From the derivation of the complete information game model, we can see that through the FDI
inflows, the technological competition between MNEs will enable China to achieve technological
progress. Therefore, the hypothesis 1 is rejected. China's attraction of FDI inflows is conducive to
the transformation and upgrading of its technology.
4.2 Statistic analysis
Table 2 presents the mean value, the standard deviation and the degree of correlation between all
the variables. The average rate of change in the labor force and the exchange rate of the Chinese
Yuan during the period of 1997-2016 were relatively low, while the growth rate of salary and
social insurance fees were both increased at a rate greater than zero. In the study of the correlation
of variables, it can be seen from Table 1 that there is a high degree of correlation between variables.
Multiple collinearity problems may occur between variables, so the next step is to perform a
Multicollinearity test on the data.
Table 2. Mean, Standard Deviation and Pearson's Correlation
Mean Std. Dev. FDI SIZE R&D LABOU
R
SALAR
Y SOCIAL EXR
FDI 1.428 15.38 1
SIZE 0.125 0.048 -0.031 1
R&D 0.819 0.801 -0.045 -
0.231***
1
LABOU
R 0.007 0.005
0.053* -
0.282***
-
0.328***
1
SALAR
Y 0.111 0.029
0.007 0.132*** 0.103*** -0.069** 1
SOCIAL 0.208 0.062 -0.035 0.239*** -
0.279***
-
0.195***
0.209*** 1
EXR -0.011 0.028 0.025 -
0.613***
0.210*** 0.231*** -
0.557***
-
0.379***
1
9 | International Journal of Scientific and Management Research 1(2): 1-15
*, **, *** indicate statistical significance at 10%, 5% and 1% level, respectively.
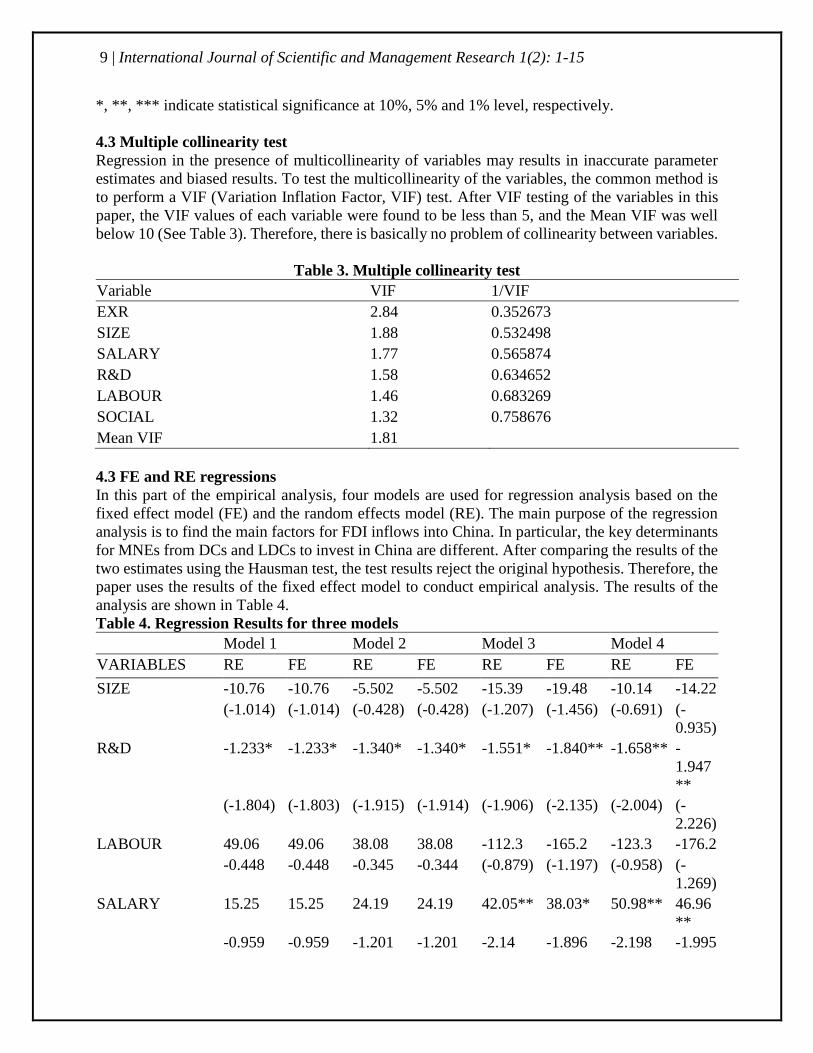
4.3 Multiple collinearity test
Regression in the presence of multicollinearity of variables may results in inaccurate parameter
estimates and biased results. To test the multicollinearity of the variables, the common method is
to perform a VIF (Variation Inflation Factor, VIF) test. After VIF testing of the variables in this
paper, the VIF values of each variable were found to be less than 5, and the Mean VIF was well
below 10 (See Table 3). Therefore, there is basically no problem of collinearity between variables.
Table 3. Multiple collinearity test
Variable VIF 1/VIF
EXR 2.84 0.352673
SIZE 1.88 0.532498
SALARY 1.77 0.565874
R&D 1.58 0.634652
LABOUR 1.46 0.683269
SOCIAL 1.32 0.758676
Mean VIF 1.81
4.3 FE and RE regressions
In this part of the empirical analysis, four models are used for regression analysis based on the
fixed effect model (FE) and the random effects model (RE). The main purpose of the regression
analysis is to find the main factors for FDI inflows into China. In particular, the key determinants
for MNEs from DCs and LDCs to invest in China are different. After comparing the results of the
two estimates using the Hausman test, the test results reject the original hypothesis. Therefore, the
paper uses the results of the fixed effect model to conduct empirical analysis. The results of the
analysis are shown in Table 4.
Table 4. Regression Results for three models
Model 1 Model 2 Model 3 Model 4
VARIABLES RE FE RE FE RE FE RE FE
SIZE -10.76 -10.76 -5.502 -5.502 -15.39 -19.48 -10.14 -14.22
(-1.014) (-1.014) (-0.428) (-0.428) (-1.207) (-1.456) (-0.691) (-
0.935)
R&D -1.233* -1.233* -1.340* -1.340* -1.551* -1.840** -1.658** -
1.947
**
(-1.804) (-1.803) (-1.915) (-1.914) (-1.906) (-2.135) (-2.004) (-
2.226)
LABOUR 49.06 49.06 38.08 38.08 -112.3 -165.2 -123.3 -176.2
-0.448 -0.448 -0.345 -0.344 (-0.879) (-1.197) (-0.958) (-
1.269)
SALARY 15.25 15.25 24.19 24.19 42.05** 38.03* 50.98** 46.96
**
-0.959 -0.959 -1.201 -1.201 -2.14 -1.896 -2.198 -1.995
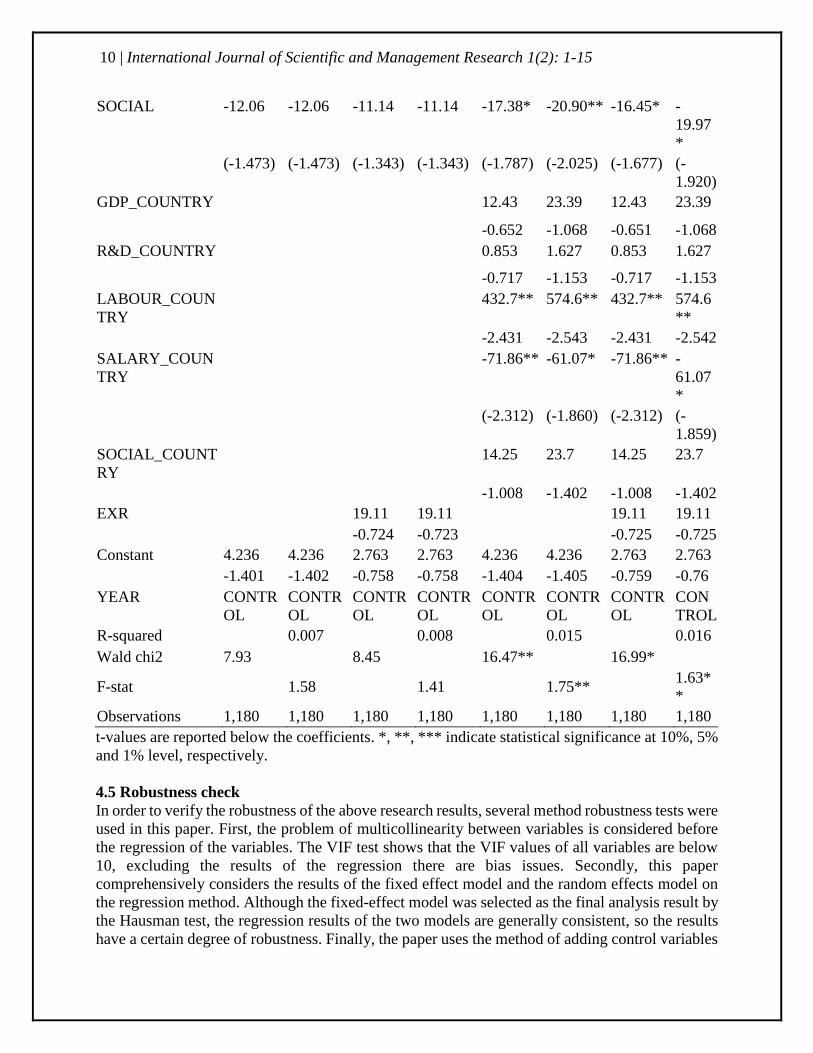
10 | International Journal of Scientific and Management Research 1(2): 1-15
SOCIAL -12.06 -12.06 -11.14 -11.14 -17.38* -20.90** -16.45* -
19.97
*
(-1.473) (-1.473) (-1.343) (-1.343) (-1.787) (-2.025) (-1.677) (-
1.920)
GDP_COUNTRY 12.43 23.39 12.43 23.39
-0.652 -1.068 -0.651 -1.068
R&D_COUNTRY 0.853 1.627 0.853 1.627
-0.717 -1.153 -0.717 -1.153
LABOUR_COUN
TRY
432.7** 574.6** 432.7** 574.6
**
-2.431 -2.543 -2.431 -2.542
SALARY_COUN
TRY
-71.86** -61.07* -71.86** -
61.07
*
(-2.312) (-1.860) (-2.312) (-
1.859)
SOCIAL_COUNT
RY
14.25 23.7 14.25 23.7
-1.008 -1.402 -1.008 -1.402
EXR 19.11 19.11 19.11 19.11
-0.724 -0.723 -0.725 -0.725
Constant 4.236 4.236 2.763 2.763 4.236 4.236 2.763 2.763
-1.401 -1.402 -0.758 -0.758 -1.404 -1.405 -0.759 -0.76
YEAR CONTR
OL
CONTR
OL
CONTR
OL
CONTR
OL
CONTR
OL
CONTR
OL
CONTR
OL
CON
TROL
R-squared 0.007 0.008 0.015 0.016
Wald chi2 7.93 8.45 16.47** 16.99*
F-stat 1.58 1.41 1.75** 1.63*
*
Observations 1,180 1,180 1,180 1,180 1,180 1,180 1,180 1,180
t-values are reported below the coefficients. *, **, *** indicate statistical significance at 10%, 5%
and 1% level, respectively.
4.5 Robustness check
In order to verify the robustness of the above research results, several method robustness tests were
used in this paper. First, the problem of multicollinearity between variables is considered before
the regression of the variables. The VIF test shows that the VIF values of all variables are below
10, excluding the results of the regression there are bias issues. Secondly, this paper
comprehensively considers the results of the fixed effect model and the random effects model on
the regression method. Although the fixed-effect model was selected as the final analysis result by
the Hausman test, the regression results of the two models are generally consistent, so the results
have a certain degree of robustness. Finally, the paper uses the method of adding control variables
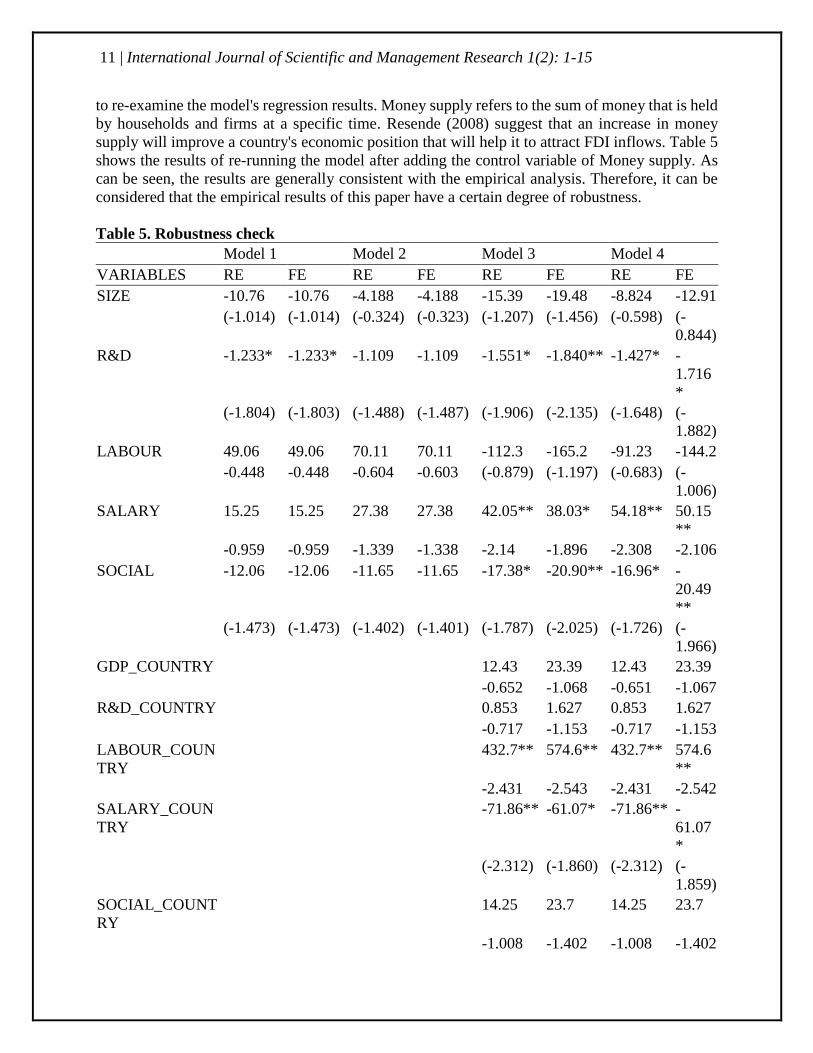
11 | International Journal of Scientific and Management Research 1(2): 1-15
to re-examine the model's regression results. Money supply refers to the sum of money that is held
by households and firms at a specific time. Resende (2008) suggest that an increase in money
supply will improve a country's economic position that will help it to attract FDI inflows. Table 5
shows the results of re-running the model after adding the control variable of Money supply. As
can be seen, the results are generally consistent with the empirical analysis. Therefore, it can be
considered that the empirical results of this paper have a certain degree of robustness.
Table 5. Robustness check
Model 1 Model 2 Model 3 Model 4
VARIABLES RE FE RE FE RE FE RE FE
SIZE -10.76 -10.76 -4.188 -4.188 -15.39 -19.48 -8.824 -12.91
(-1.014) (-1.014) (-0.324) (-0.323) (-1.207) (-1.456) (-0.598) (-
0.844)
R&D -1.233* -1.233* -1.109 -1.109 -1.551* -1.840** -1.427* -
1.716
*
(-1.804) (-1.803) (-1.488) (-1.487) (-1.906) (-2.135) (-1.648) (-
1.882)
LABOUR 49.06 49.06 70.11 70.11 -112.3 -165.2 -91.23 -144.2
-0.448 -0.448 -0.604 -0.603 (-0.879) (-1.197) (-0.683) (-
1.006)
SALARY 15.25 15.25 27.38 27.38 42.05** 38.03* 54.18** 50.15
**
-0.959 -0.959 -1.339 -1.338 -2.14 -1.896 -2.308 -2.106
SOCIAL -12.06 -12.06 -11.65 -11.65 -17.38* -20.90** -16.96* -
20.49
**
(-1.473) (-1.473) (-1.402) (-1.401) (-1.787) (-2.025) (-1.726) (-
1.966)
GDP_COUNTRY 12.43 23.39 12.43 23.39
-0.652 -1.068 -0.651 -1.067
R&D_COUNTRY 0.853 1.627 0.853 1.627
-0.717 -1.153 -0.717 -1.153
LABOUR_COUN
TRY
432.7** 574.6** 432.7** 574.6
**
-2.431 -2.543 -2.431 -2.542
SALARY_COUN
TRY
-71.86** -61.07* -71.86** -
61.07
*
(-2.312) (-1.860) (-2.312) (-
1.859)
SOCIAL_COUNT
RY
14.25 23.7 14.25 23.7
-1.008 -1.402 -1.008 -1.402
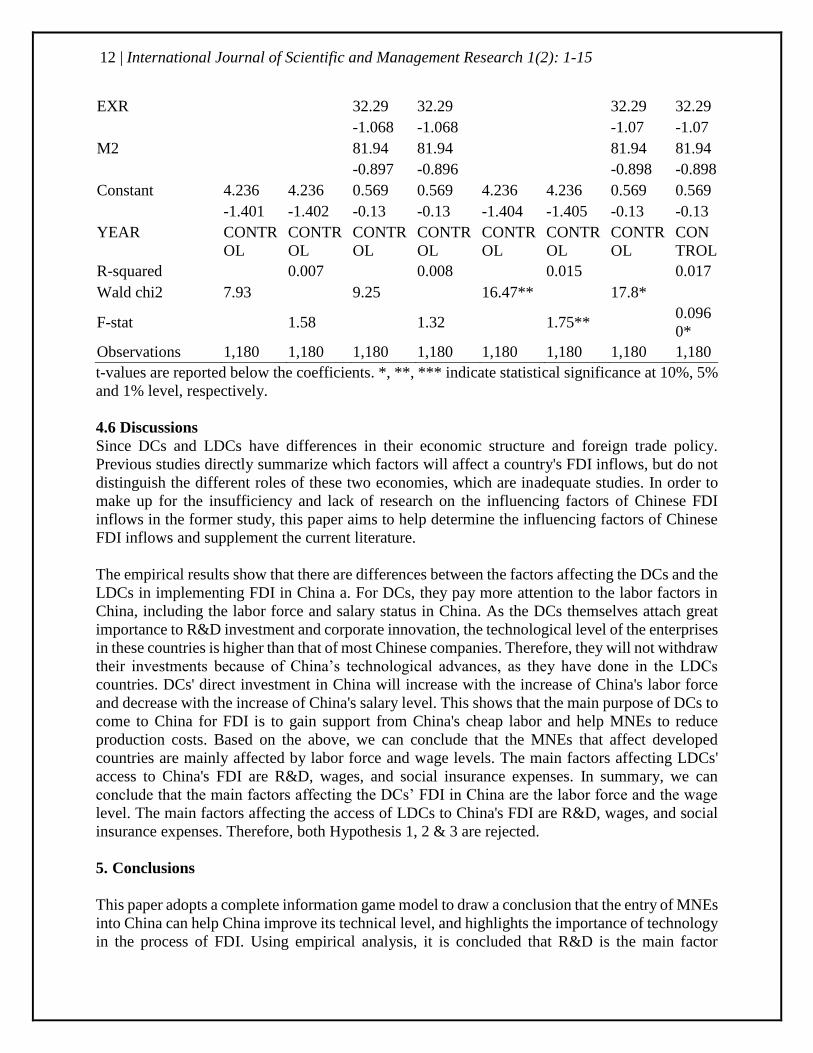
12 | International Journal of Scientific and Management Research 1(2): 1-15
EXR 32.29 32.29 32.29 32.29
-1.068 -1.068 -1.07 -1.07
M2 81.94 81.94 81.94 81.94
-0.897 -0.896 -0.898 -0.898
Constant 4.236 4.236 0.569 0.569 4.236 4.236 0.569 0.569
-1.401 -1.402 -0.13 -0.13 -1.404 -1.405 -0.13 -0.13
YEAR CONTR
OL
CONTR
OL
CONTR
OL
CONTR
OL
CONTR
OL
CONTR
OL
CONTR
OL
CON
TROL
R-squared 0.007 0.008 0.015 0.017
Wald chi2 7.93 9.25 16.47** 17.8*
F-stat 1.58 1.32 1.75** 0.096
0*
Observations 1,180 1,180 1,180 1,180 1,180 1,180 1,180 1,180
t-values are reported below the coefficients. *, **, *** indicate statistical significance at 10%, 5%
and 1% level, respectively.
4.6 Discussions
Since DCs and LDCs have differences in their economic structure and foreign trade policy.
Previous studies directly summarize which factors will affect a country's FDI inflows, but do not
distinguish the different roles of these two economies, which are inadequate studies. In order to
make up for the insufficiency and lack of research on the influencing factors of Chinese FDI
inflows in the former study, this paper aims to help determine the influencing factors of Chinese
FDI inflows and supplement the current literature.
The empirical results show that there are differences between the factors affecting the DCs and the
LDCs in implementing FDI in China a. For DCs, they pay more attention to the labor factors in
China, including the labor force and salary status in China. As the DCs themselves attach great
importance to R&D investment and corporate innovation, the technological level of the enterprises
in these countries is higher than that of most Chinese companies. Therefore, they will not withdraw
their investments because of China’s technological advances, as they have done in the LDCs
countries. DCs' direct investment in China will increase with the increase of China's labor force
and decrease with the increase of China's salary level. This shows that the main purpose of DCs to
come to China for FDI is to gain support from China's cheap labor and help MNEs to reduce
production costs. Based on the above, we can conclude that the MNEs that affect developed
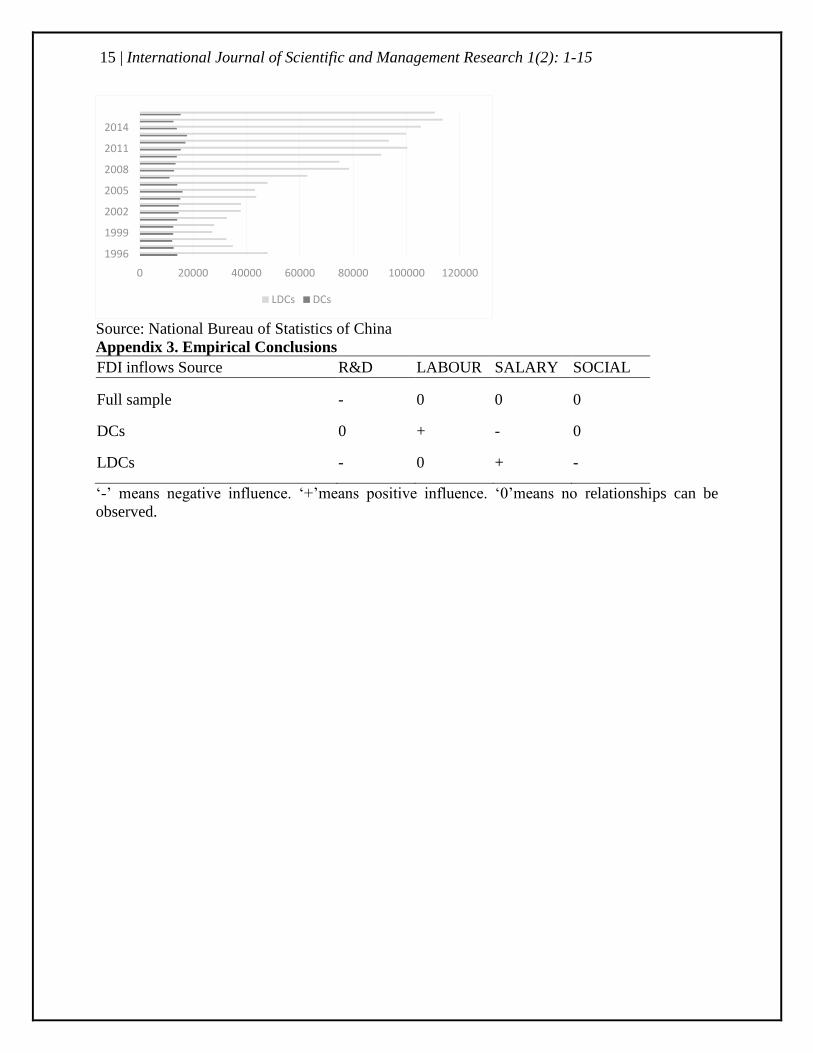
countries are mainly affected by labor force and wage levels. The main factors affecting LDCs'
access to China's FDI are R&D, wages, and social insurance expenses. In summary, we can
conclude that the main factors affecting the DCs’ FDI in China are the labor force and the wage
level. The main factors affecting the access of LDCs to China's FDI are R&D, wages, and social
insurance expenses. Therefore, both Hypothesis 1, 2 & 3 are rejected.
5. Conclusions
This paper adopts a complete information game model to draw a conclusion that the entry of MNEs
into China can help China improve its technical level, and highlights the importance of technology
in the process of FDI. Using empirical analysis, it is concluded that R&D is the main factor
13 | International Journal of Scientific and Management Research 1(2): 1-15
affecting China’s attraction of FDI. This is inconsistent with the former’s belief that cheap labor,
exchange rates, Wage levels and other factors are inconsistent for the reasons that affect China's
FDI (Boateng et al., 2015; Decreuse & Maarek, 2008). This article uses an empirical method for
China's FDI inflow analysis by distinguishing the FDI inflow sources from DCs and LDCs.
Different conclusions of different influencing factors were drawn. Although both countries' FDI
in China will be affected by the China's salary level, the effects are opposite. As for the specific
reasons, it needs to be tested in future research.
The limitation of this paper is that there may be limitations in the choice of explanatory variables,
because there are many kinds of influencing factors that attract FDI in China. This is also the
limitation that previous studies could not fully consider all the influencing factors of China's FDI
inflows in the past.
References
1. Boateng, A., Hua, X., Nisar, S., & Wu, J 2015, ‘Examining the determinants of inward fdi:
evidence from norway’, Economic Modelling, Vol. 47, pp.118-127.
2. Bose, T. K 2012, ‘Advantages and disadvantages of fdi in china and india’, International
Business Research, Vol.5, No.5, pp.164-174.
3. Buckley, P. J., Wang, C., & Clegg, J 2007, ‘The impact of foreign ownership, local
ownership and industry characteristics on spillover benefits from foreign direct investment
in china’, International Business Review, Vol.16, No.2, pp.142-158.
4. Chu, E 2016, ‘Uncertain costs, unclear benefits: china's social insurance system and foreign
workers’, Boston College International & Comparative Law Review, Vol.39. pp.361-385.
5. Dunning, J. H 1973, ‘The determinants of international production’, Oxford Economic
Papers, Vol.25, No.3, pp.289-336.
6. Debreu, G 1956, ‘Market equilibrium’, Proceedings of the National Academy of Sciences
of the United States of America, Vol.42, No.11, pp.876-878.
7. Fan, J. P. H., Morck, R., Xu, L. C., & Yeung, B 2009, ‘Institutions and foreign direct
investment: china versus, the rest of the world’, World Development, Vol.37, No.4,
pp.852-865.
8. Kang, Y., & Jiang, F 2012, ‘Fdi location choice of chinese multinationals in east and
southeast asia: traditional economic factors and institutional perspective’, Journal of World
Business, Vol.47, No.1, pp.45-53.
9. Khachoo, A. Q., & Khan, M. I 2012, ‘Determinants of fdi inflows to developing countries:
a panel data analysis’, Mpra Paper, Vol.14, No.2, pp.29-47.
10. Lehnert, K., Benmamoun, M., & Zhao, H 2013, ‘Fdi inflow and human development:
analysis of fdi's impact on host countries' social welfare and infrastructure’, Thunderbird
International Business Review, Vol.55, No.3, pp.285–298.
11. Lewis, J 2000, ‘Factors influencing foreign direct investment in lesser developed countries.
Park Place Economist, Vol.8, No.1, pp.99-107.
12. Moosa, I. A., & Cardak, B. A 2006, ‘The determinants of foreign direct investment: an
extreme bounds analysis’, Journal of Multinational Financial Management, Vol.16, No.2,
pp.199-211.
13. Meng, L., & Xuan, G. L 2005, ‘Empirical study on technology spillovers of fdi from
different sources in china’, Science Research Management, Vol.26, No.5, pp.115-123.
14 | International Journal of Scientific and Management Research 1(2): 1-15
14. Narayanan, K., & Bhat, S 2011, ‘Technology sourcing and outward fdi: a study of it
industry in india’, Technovation, Vol.31, No.4, pp.177-184.
15. Pajunen, K 2008, ‘Institutions and inflows of foreign direct investment: a fuzzy-set
analysis, Journal of International Business Studies, Vol.39, No.4, pp.652-669.
16. Sandhu, M. S., Fredericks, L. J., & Programme, C. D 2005, ‘Factors influencing foreign
direct investment in the malaysian services sector: a theoretical framework. UNITAR e-
Journal, Vol.1, No.1, pp.1-24.
17. Snyman, J. A., & Saayman, M 2009, ‘Key factors influencing foreign direct investment in
the tourism industry in south africa’, Tourism Review, Vol.64, No.3, pp.49-58.
18. Țaran, A., Mironiuc, M., & Huian, M. C 2016, ‘Examining the influence of some
macroeconomic factors on foreign direct investments’, Review of Economic & Business
Studies, Vol.9, No.2, pp.159-182.
19. Wang, D. T., Gu, F. F., Tse, D. K., & Chi, K. Y 2013, ‘When does fdi matter? the roles of
local institutions and ethnic origins of fdi’, International Business Review, Vol.22, No.2,
pp.450-465.
20. Wu, S 2018, ‘Estimation of the J-Curve: An Empirical Analysis Based on the Trade
Balance between Australia and China’, International Journal of Trade, Economics and
Finance, Vol.9, No.2, pp.88-95.
Appendix
Appendix 1. The number of MNEs and MNEs’ projects in China
Source: The Ministry of Commerce (MOFCOM) of the Government of China
Appendix 2: FDI inflows into China from 1996 to 2016
0 100000 200000 300000 400000 500000 600000
1997
2000
2003
2006
2009
2012
2015
The number of MNEs' projects in China
The number of MNEs in China
15 | International Journal of Scientific and Management Research 1(2): 1-15
Source: National Bureau of Statistics of China
Appendix 3. Empirical Conclusions
FDI inflows Source R&D LABOUR SALARY SOCIAL
Full sample - 0 0 0
DCs 0 + - 0
LDCs - 0 + -
‘-’ means negative influence. ‘+’means positive influence. ‘0’means no relationships can be
observed.
0 20000 40000 60000 80000 100000 120000
1996
1999
2002
2005
2008
2011
2014
LDCs DCs