Embed Size (px)
Citation preview
THE DETERMINANTS OF THE WEALTH EFFECTS
OF BANKS’ EXPANDED SECURITIES POWERS
David P. ElyProfessor of Finance
San Diego State University
and
Kenneth J. RobinsonSenior Economist and Policy AdvisorFinancial Industry Studies Department
Federal Reserve Bank of Dallas
Abstract: After several unsuccessful attempts by Congress to repeal Glass-Steagallrestrictions on banks, the Federal Reserve more than doubled the revenue thatcommercial banking organizations’ securities subsidiaries may earn from certainsecurities activities. The wealth effects associated with this event for a sample ofpublicly traded banking organizations are examined. We find evidence thatindicates the revenue limit resulted in a less-than-optimal mix of activities forsecurities subsidiaries. However, subsequent merger activity that could have beengenerated by the revenue increase was not viewed favorably by investors.
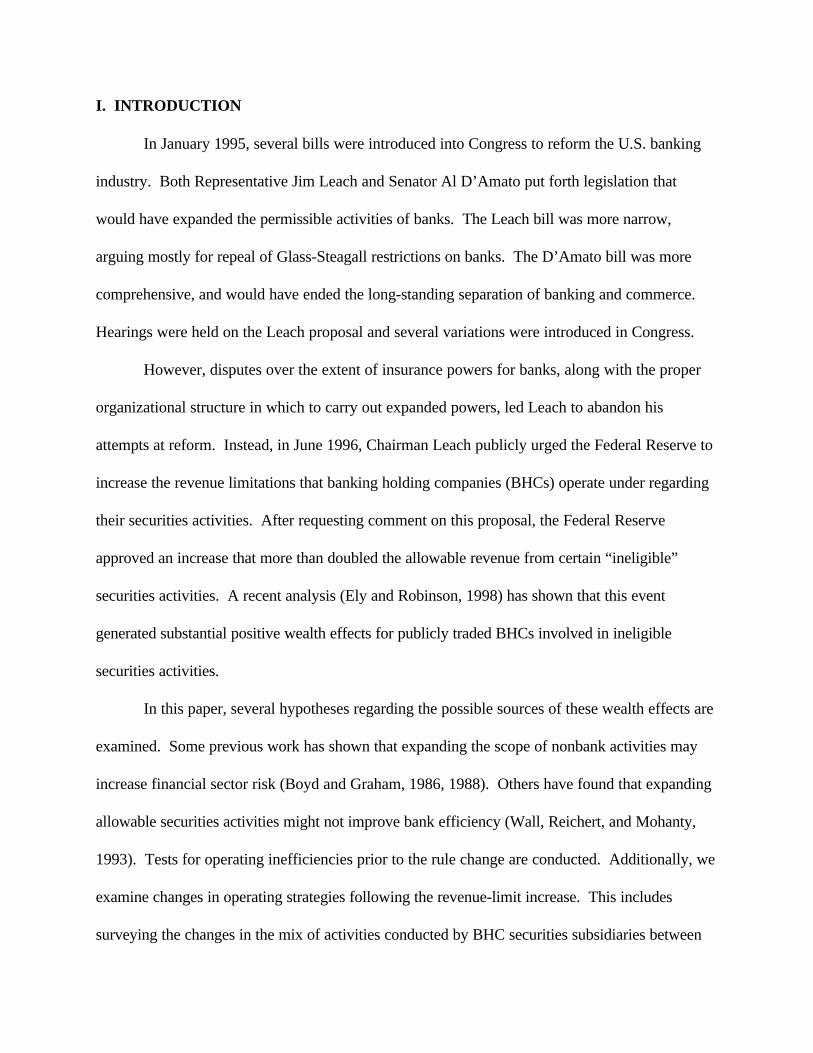
I. INTRODUCTION
In January 1995, several bills were introduced into Congress to reform the U.S. banking
industry. Both Representative Jim Leach and Senator Al D’Amato put forth legislation that
would have expanded the permissible activities of banks. The Leach bill was more narrow,
arguing mostly for repeal of Glass-Steagall restrictions on banks. The D’Amato bill was more
comprehensive, and would have ended the long-standing separation of banking and commerce.
Hearings were held on the Leach proposal and several variations were introduced in Congress.
However, disputes over the extent of insurance powers for banks, along with the proper
organizational structure in which to carry out expanded powers, led Leach to abandon his
attempts at reform. Instead, in June 1996, Chairman Leach publicly urged the Federal Reserve to
increase the revenue limitations that banking holding companies (BHCs) operate under regarding
their securities activities. After requesting comment on this proposal, the Federal Reserve
approved an increase that more than doubled the allowable revenue from certain “ineligible”
securities activities. A recent analysis (Ely and Robinson, 1998) has shown that this event
generated substantial positive wealth effects for publicly traded BHCs involved in ineligible
securities activities.
In this paper, several hypotheses regarding the possible sources of these wealth effects are
examined. Some previous work has shown that expanding the scope of nonbank activities may
increase financial sector risk (Boyd and Graham, 1986, 1988). Others have found that expanding
allowable securities activities might not improve bank efficiency (Wall, Reichert, and Mohanty,
1993). Tests for operating inefficiencies prior to the rule change are conducted. Additionally, we
examine changes in operating strategies following the revenue-limit increase. This includes
surveying the changes in the mix of activities conducted by BHC securities subsidiaries between
-2-
September 1996 and December 1998 and analyzing merger activity between commercial banks
and securities companies during 1997.
Raising the revenue limit on securities activities might enable banking institutions to
improve performance in at least two ways. First, a change in the mix of activities might lead to
greater profitability for the security subsidiary. Since the revenue cap expresses the allowable
amount of ineligible revenue that can be earned as a percentage of gross revenue, the subsidiary
can expand its activity in ineligible securities by simultaneously generating a higher level of eligible
revenue. However, this arrangement would have forced a subsidiary already operating close to
the existing limit to expand both types of revenue even if the expanded activity in eligible
securities was economically unprofitable. The Federal Reserve Board recognized that activity in
eligible securities had become less profitable by noting that, "...increased competition in brokerage
services has diminished revenue as a function of activity. Lower commissions have required
companies to increase volume in order to maintain a given level of eligible revenue" (Federal
Register, 1996, p. 68753).
The cap might also affect the choice between Tier I and Tier II ineligible securities. Tier I
authority allows BHC securities subsidiaries to engage in the underwriting and trading of certain
municipal revenue bonds, mortgage-related securities, commercial paper, and asset-back
securities. Subsidiaries with Tier II authority may also underwrite and deal in corporate debt and
equities. The revenue cap would lead to a sub-optimal mix of activities if an institution replaces
trading and underwriting in Tier II securities with less profitable Tier I securities to avoid
exceeding the cap. The Federal Reserve Board also noted this potential outcome when it
announced its order to raise the cap . "Underwriting fees for tier-two securities are significantly
-3-
1 Some industry analysts argued that the change in the revenue cap would lead to arestructuring of balance sheets. See Taylor and Frank (1996) and Dutta (1997). Charles Gabrielof Prudential Securities is quoted by The Wall Street Journal as stating: “Their [BHCs withsecurities subsidiaries] first response to having these thresholds raised is going to be to ease off alittle bit, sell off Treasuries and increase their return on equity” (Taylor and Frank, 1996). Howard Curlett of First Union Capital Markets when asked what impact the changes to therevenue cap had on operations is quoted in American Banker as stating: “The biggest change inour business is that we’ve been able to decrease the size of our matchbook because we no longerhave the need to generate eligible income from sources which are not strictly part of our day-to-day business” (Dutta, 1997).
2 See for example, Rea, Spiro and Galuszka (1996).
larger than fees for tier-one securities, particularly with respect to equity securities and non-
investment-grade debt securities. Similarly, bid/offer spreads on many corporate bonds and other
tier-two securities are significantly wider than the spreads on tier-one securities." (Federal
Register, 1996, p. 68753).1
A second way in which the rule change might generate wealth effects for BHCs is by
providing greater freedom to pursue acquisitions of securities companies. Indeed, speculations of
acquisitions were common in the business press by late 1996.2 The Federal Reserve Board also
reported that they had approved an increased number of proposals by banking organizations to
acquire securities companies in 1997 (Board of Governors of the Federal Reserve System, 1997,
pp 237-238).
We find some evidence consistent with the hypothesis that the positive wealth effects from
increasing the revenue limit are associated with the mix of activities pursued by BHCs. Prior to
the revenue-limit increase, profitability might have been adversely affected by possible attempts to
expand the amount of less profitable eligible securities activities to avoid violating the revenue
limit. We also note that in the aftermath of the revenue-limit increase, banking organizations
-4-
3 The Glass-Steagall Act is actually four sections (16, 20, 21, and 32) of the Banking Actof 1933. Section 16 prohibits national banks from underwriting corporate securities. Section 21forbids any person or organization engaged in the activities defined in section 20 to engage in thebusiness of deposit banking. Section 32 prohibits officer, director, or employee interlocksbetween member banks and entitles “primarily engaged” in activities described in section 20. SeeKelly (1985).
significantly increased their Tier II assets. We find no evidence, however, that acquisitions
announced in 1997 were rewarded by shareholders.
We proceed as follows. In the next section we offer some background on the nature of
banks’ securities activities. Next, we examine the excess returns generated by the expansion in
BHCs allowable securities activities. Our empirical model is then presented, followed by an
analysis of our results. The final section offers some conclusions.
II. BACKGROUND
Current restrictions on U.S. banks’ securities activities date to the Glass-Steagall Act of
1933. Section 20 of the Glass-Steagall act prohibits Federal Reserve member banks from being
affiliated with any entity “engaged principally” in issuing, underwriting, selling or distributing
stocks or bonds.3 This act was passed as the result of a series of Congressional investigations in
the aftermath of the stock market crash. Of particular concern was the possibility that banks’
securities affiliates were involved in speculative and fraudulent activities at the expense of
depositors or shareholders, and that banks’ securities activities threatened financial safety and
soundness (Kelly, 1985). While isolated instances of fraud and abuse were discovered, recent
evidence does not support this view of commercial banks’ involvement in securities (Ang and
-5-
4 These ineligible securities include municipal revenue bonds, one-to-four-familymortgage-related securities, securities related to consumer receivables, certain types ofcommercial paper, and debt securities.
5 In 1989 the Board also authorized underwriting and dealing in all types of corporate debtand equity securities. The Board also included several firewalls to prevent the transfer of riskfrom section 20 affiliates to the insured commercial bank. See Mester (1996, 17-18).
Richardson, (1994), Kroszner and Rajan (1994), White (1986), Benston (1990, 1996) and Puri
(1994, 1996).
By the 1980s, commercial banks faced increasing competitive pressures from less
regulated players in financial markets. As a result, they began to pursue more active involvement
in the securities business. While they were able to underwrite and deal in U.S. government
securities and municipal general obligation bonds, and to engage in private placements, banking
organizations increasingly sought the ability to extend these operations. Beginning in 1987 the
Federal Reserve Board issued a series of orders authorizing individual bank holding companies,
on a case-by-case basis, to establish “section 20 subsidiaries,” named after section 20 of the Glass-
Steagall Act. These subsidiaries would be able to pursue an expanded array of securities
operations that were previously denied banking organizations.
In order to meet the “engaged principally” language of Glass-Steagall, the Board
established a revenue test. In its 1987 order the Federal Reserve Board decided that no more than
five percent of the gross revenue of the section 20 subsidiary could be earned from ineligible
securities activities, or securities that member banks could not underwrite or deal in.4 In 1989,
the Board approved an increase in the revenue limit to 10 percent.5 Finally, at the urging of
-6-
6 Chairman Leach’s request to the Federal Reserve reflected frustrations at the lack ofpassage of financial reform legislation.
7 Bhargava and Fraser consider only the July 31, 1996 request for comment by the FederalReserve as an event date. Ely and Robinson also consider as event dates when the FederalReserve was urged by Chairman Leach to raise the revenue limit (June 11), and the date of theannouncement of the approval of the revenue limit increase (December 20). This latter event isassociated with significant wealth effects for banking organizations with section 20 subsidiaries.
Chairman Jim Leach of the House Banking Committee, the Federal Reserve approved an increase
in the revenue limit to 25 percent, effective March 1997.6
Several studies have examined the stock market response to the Federal Reserve’s
approval of the various revenue-limit increases. Bhargava and Fraser (1998) investigate the
wealth effects of the initial order approving section 20 subsidiaries, as well as the subsequent
revenue-limit increases. These authors find a significant positive stock market response for
banking organizations granted a section 20 subsidiary in 1987. However, when the Federal
Reserve increased the revenue limit in 1989, these authors find negative wealth effects for banking
organizations with section 20 subsidiaries and for a sample of investment banks. Bhargava and
Fraser find no significant wealth effects associated with the proposal to increase the revenue limit
to 25 percent for banking organizations with and without section 20 subsidiaries, and for a sample
of investment banks.
Using a different event date, however, Ely and Robinson (1998) do find statistically
significant and fairly large wealth effects for banking organizations with section 20 subsidiaries
associated with the increase in the revenue limit to 25 percent.7 Moreover, when analyzing
individual firm-level responses, there is some evidence of statistically significant wealth effects for
investment banks and for bank holding companies that might be expected to petition for a
-7-
8 See Ely and Robinson (1998) for evidence that other events associated with the revenuelimit increase did not generate significant wealth effects. Also, Ely and Robinson provide
securities subsidiary. The next section identifies the excess returns generated by the recent
revenue-limit increase for banking organizations with securities operations. The data that are
available to investigate what factors might be important in explaining the observed pattern of
these excess returns are also identified.
III. WEALTH EFFECTS FROM EXPANDED SECURITIES ACTIVITIES
III.A. PRELIMINARY ANALYSIS
To investigate the general economic impact of the rule change on banking organizations,
the following empirical model is estimated:
(1)Rsec20, t'"sec20%$sec20(Rmt%jK
k'1
(sec20,k(Dk,t%gsec20, t
where Rsec20,t is the return on an equally weighted portfolio of banking companies with section 20
subsidiaries on day t, Rmt is the equally weighted return on a market wide index of stocks, the Dk
variables represent individual dummy variables that equal one during the event-window period
and zero otherwise, and K equals the number of days in the event windows. This methodology is
similar to that employed by Schipper and Thompson (1985), Binder (1985), Smith Bradley, and
Jarrell (1986), and Millon-Cornett and Tehranian (1989, 1990). Our event date of interest is
December 20, 1996, when the Federal Reserve announced its approval of the revenue limit
increase to 25 percent.8 The portfolio is constructed using data for 26 banking organizations that
-8-
evidence that this event was unanticipated by financial market participants.
were publicly traded and filed the FR Y-20 (Financial Statements for a Bank Holding Company
Subsidiary Engaged in Bank-Ineligible Securities Underwriting and Dealing) in the third quarter
of 1996. We use daily return data from the Center for Research in Security Prices (CRSP). The
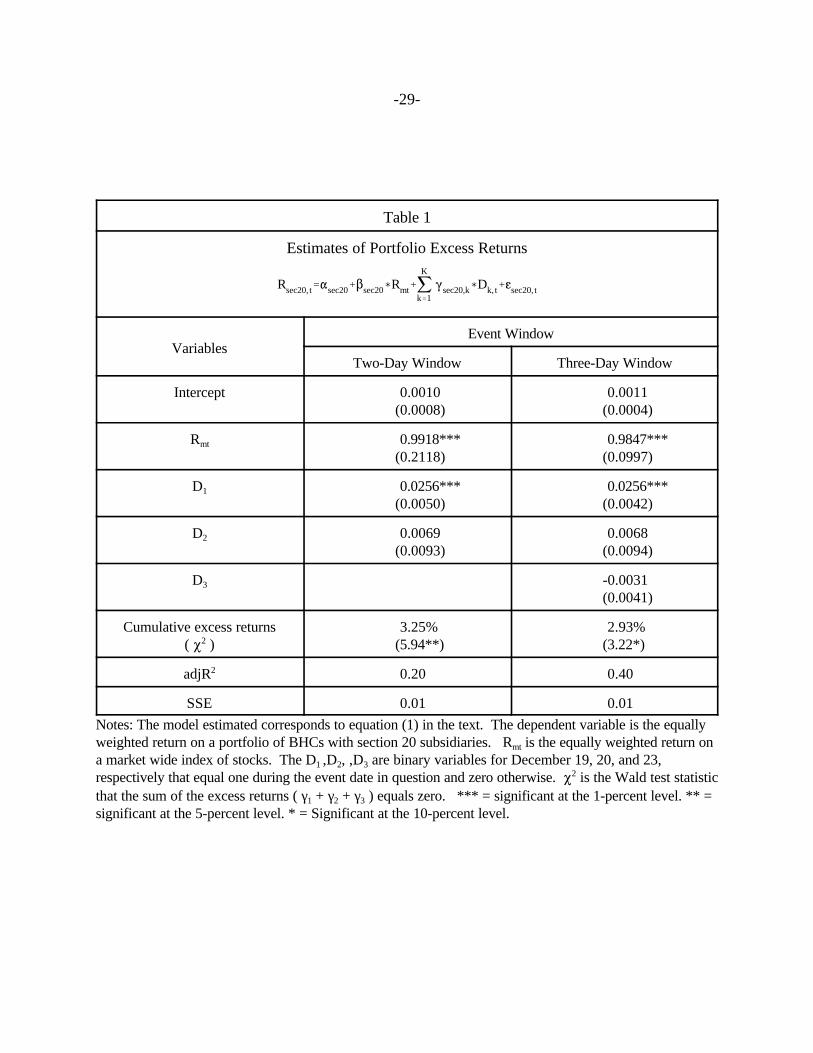
estimation period included -61 days to the event date +61 days. Table 1 reports the results of
estimating this equation using both a two-day (t-1, t) and three-day (t-1, t, t+1) event window.
The results in Table 1 indicate that using either event window produces statistically significant
excess returns, as indicated by the Wald statistic employed to test that the sum of the excess
returns across the event windows equals zero. For the two-day window, cumulative excess
returns for the portfolio of banking organizations equal 3.25 percent and for the three-day
window the returns equal 2.93 percent.
III.B. THE DETERMINANTS OF EXCESS RETURNS: ACTIVITIES AND ACQUISITIONS
We assume that the significant and positive excess returns around December 20 are
associated with BHCs’ greater ability to expand into ineligible securities. Our analysis focuses on
whether the source of the excess returns can be attributed to a reduction in current operating
inefficiencies and/or expected future inefficiencies.
Following the relaxation in the revenue ceiling, banks might have chosen to change their
mix of activities by increasing the amount of ineligible securities and, perhaps also, by lowering
their activity in eligible securities. These steps would have lead to a change in the mix of activities
and would have been expected for BHCs that had been under pressure to generate a sufficient
level of eligible revenue in order to remain within the cap.
-9-
Not all subsidiaries’ were equally successful in attracting ineligible underwriting and
trading activity and in generating a steady stream of eligible revenue that consequently raised the
level of allowable ineligible revenue. All banking organizations with securities subsidiaries were
therefore not equally constrained by the revenue cap and thus the BHCs that stood to gain the
most were those that were struggling to generate an adequate stream of eligible revenue to match
their target level of ineligible securities activity. A BHC facing a potential shortfall in eligible
revenue may have chosen to shift activity away from ineligible activity and toward eligible
activity, to replace Tier II activity with less-profitable Tier I activity, or perhaps to reduce the
level of ineligible activity altogether. This type of substitution, if it did exist, became less
necessary after the revenue cap was raised. We refer to the notion that the change in the revenue
cap generated wealth effects for BHCs because they could shift toward a more optimal mix of
activities as the activity mix hypothesis.
Under the activity-mix hypothesis, securities affiliates constrained by the revenue cap
should exhibit weaker performances than those that were relatively unconstrained. We employ
several approaches to testing if BHCs’ excess returns on the announcement of the increase in the
revenue cap are related to performance measures of their section 20 subsidiaries. These include
variables based on the closeness to the revenue limit, and overall profitability. We also use
measures based on the subsidiaries’ efficiency in producing ineligible and eligible revenue and the
costs of producing these revenues. Under the activity-mix hypothesis, securities affiliates
constrained by the cap should be characterized by lower profitability, lower asset utilization,
and/or higher costs relative to their less constrained competitors.
-10-
9 See Hays and Wilke (1996), Dunaief (1996), and Ring (1997).
10 Dave Johnson of BankAmerica Corp was quoted in The Wall Street Journal as stating:“We foresee it [the revenue ceiling] will be a problem within a year or so, though it isn’t rightnow” (Hays and Wilke, 1996). Robert Cline of PNC Capital Markets told The Bond Buyer that PNC was close, but had not yet hit the ceiling in December 1996, and that the higher ceilingwould give them “greater latitude” in the future (Ring, 1997).
An outcome contrary to the activity-mix hypothesis is that the revenue cap was not a
binding constraint and so the stock price reactions were unrelated to any inefficiencies arising
from operating under the constraint. The cap would not be binding if BHCs’ profitable
opportunities in ineligible securities activities were fully exploited before the cap was reached or if
the cap could be costlessly circumvented by generating additional eligible revenue. One
alternative hypothesis is that banks generally were not yet up against the revenue cap in December
1996, but were expected to be limited by the constraint in the near future. BHCs are not required
to publicly disclose the amount of revenue generated from ineligible activities so it was not known
which, if any, institutions were close to the cap. While rumors existed that some banks were up
against the limit, executives at these institutions generally claimed that the revenue constraint was
not yet binding at their institution.9 However, executives also expressed concern that the revenue
limit could curb growth in the near future.10 In this situation, those institutions which would
benefit most from the higher cap would have been those with the greatest potential to enhance
profitability from ineligible activities — or those institutions with a strong track record. In this
case, excess returns would be positively related to measures of profitability and asset utilization
and negatively related to measures of costs. We refer to this as the opportunity hypothesis.
Banking organizations might also be expected to benefit from the higher revenue ceiling
by expanding their scale of operations. In this case, those institutions with the highest excess
-11-
11 The Federal Reserve regards the individual data in the FR Y-20 as confidential. However, there is nothing forbidding an individual firm from releasing these data to itsshareholders. Therefore, we assume that this information is available to market participants.
returns would include those banking organizations who were viewed by investors as the most
likely to acquire securities companies in the near future. The belief that the wealth effects
associated with the revenue-limit increase are primarily due to an ability to acquire relatively large
securities companies is referred to as the acquisition hypothesis.
To examine what factors might lie behind the stock market’s response to the recent
revenue limit increase, we make use of data from the FR Y-20 obtained from the Board of
Governors.11 The FR Y-20 contains balance sheet and income statement data for section 20
subsidiaries. In our attempts to explain the pattern of excess returns exhibited, we make use of
third-quarter 1996 data, which are the closest available to our event date. To judge the
robustness of the results, we use excess returns generated from several different empirical
specifications regarding the size of the event window.
III.B.1. Data and Testing Procedure
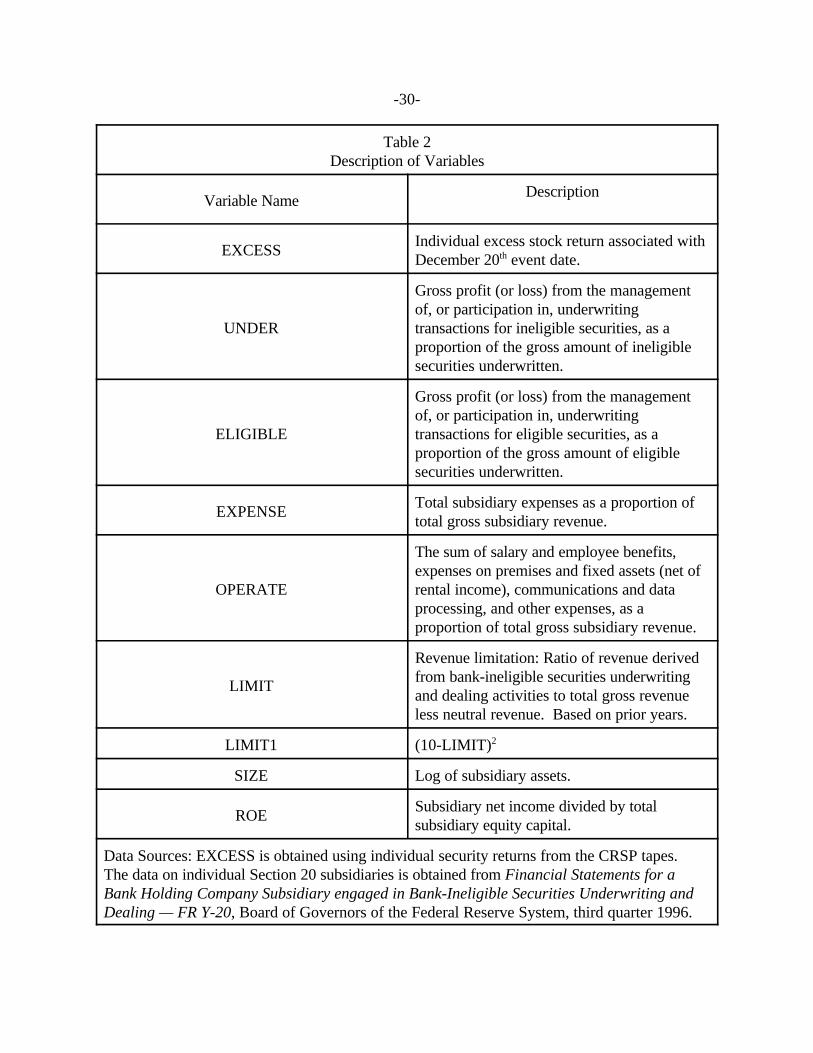
Table 2 describes the data that we use to characterize these firms’ securities activities.
Our tests begin with an investigation of the relationship between excess returns and financial data
that might reflect inefficiencies arising from a less-than-optimal mix of activities. The first
variable we consider is overall profitability or ROE, which is defined as subsidiary net income
divided by total subsidiary equity capital. If the revenue cap resulted in a sub-optimal mix of
activities, then we would expect a negative sign on ROE. Those BHCs that recorded lower
profitability might stand to gain the most from an easing of the revenue constraint, and would
therefore record higher wealth effects. This result would support the activity-mix hypothesis.
-12-
The opportunity hypothesis would be supported if the higher wealth effects are positively
associated with ROE. Those with a demonstrated track record of high performance can best
exploit the new opportunities.
UNDER is gross revenue from ineligible securities underwriting relative to the gross
amount of ineligible securities underwritten, and, as such is a productivity or an asset utilization
measure. Under the activity mix hypothesis, we expect the sign on this variable to be negative.
Those BHCs with lower asset utilization from ineligible underwriting might be expected to benefit
the most from an increase in the revenue limit for ineligible activities.
ELIGIBLE measures the gross revenue from eligible underwriting relative to the gross
amount of eligible securities underwritten. We expect a negative sign for this variable as well for
the same reasons that apply to UNDER. Some firms could have been attempting to increase
eligible activity as a way to circumvent the revenue cap. As stated above, this could have led to a
less-than-optimal mix of activities. If so, then those firms with lower asset productivity as
measured by ELIGIBLE could be expected to exhibit greater excess returns under the activity mix
hypothesis because of the expanded opportunities available due to the higher revenue limit.
Under the opportunity hypothesis, UNDER and ELIGIBLE are expected to be positively
related to excess returns. This is because those institutions capable of generating relatively larger
levels of revenue with a given stock of assets should be the most successful in expanding under
the more liberal guidelines.
These asset utilization measures alone, however, would not be sufficient to provide
evidence for the activity mix hypothesis. These measures could be high because either the gross
revenue generated from the particular activity is relatively high, or because the level of
-13-
underwriting is relatively low. We also need to examine the cost structure of these BHCs. Under
the activity mix hypothesis the revenue cap could have resulted in a more costly mix of activities.
Therefore, we also consider EXPENSE and OPERATE in our empirical analysis. EXPENSE
measures total expenses relative to total revenue for BHCs’ securities subsidiaries, while
OPERATE attempts to capture operating expenses relative to total revenue. A positive sign on
these cost variables would be consistent with the activity mix hypothesis. Those BHCs with
higher costs, possibly brought about by attempts to circumvent the revenue cap, would be
expected to gain the most from an increase in the cap.
Those institutions which have been the most successful in controlling costs should be
better able to expand and exploit the higher revenue cap. Thus, under the opportunity hypothesis,
measures of costs are negatively related to excess returns.
We also employ several control variables. The revenue cap is more likely to be a binding
constraint for those firms closest to the revenue limit. Thus, under the activities-mix hypothesis a
BHC’s excess returns should be positively related to the reported proportion of revenue from
ineligible securities for its section 20 subsidiary, which we designate as LIMIT. An alternative
measure, LIMIT1, attempts to capture the importance of how far away from the ten percent limit
an individual firm might be. If the revenue limitation was constraining BHCs then we expect the
sign on this variable to be negative, indicating that those firms farther away from the existing ten
percent limit might not exhibit very strong excess returns to an announcement that raises the limit.
Finally, we include SIZE, or the log of subsidiary assets.
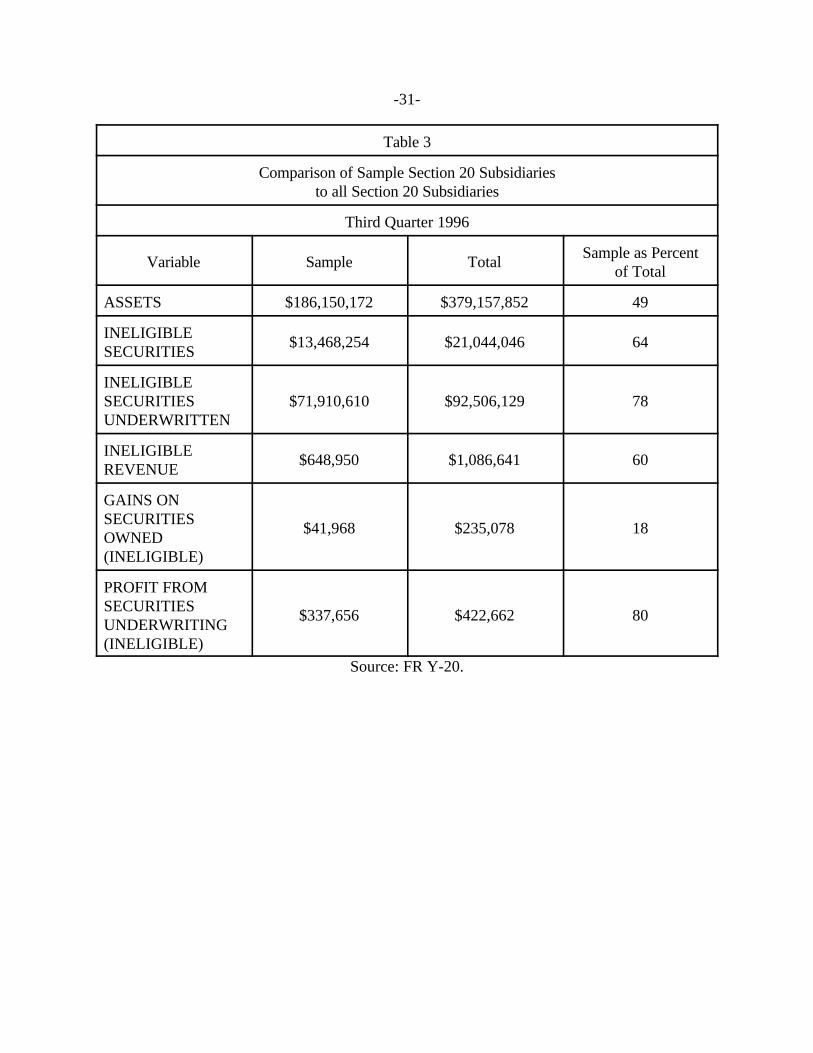
Table 3 presents comparisons of our sample of 26 publicly traded banking organizations to
the total of 39 organizations that filed the FR Y-20 as of the third quarter of 1996. Our sample of

-14-
12 The system of 26 equations was estimated using Zellner’s seemingly-unrelated-regression technique.
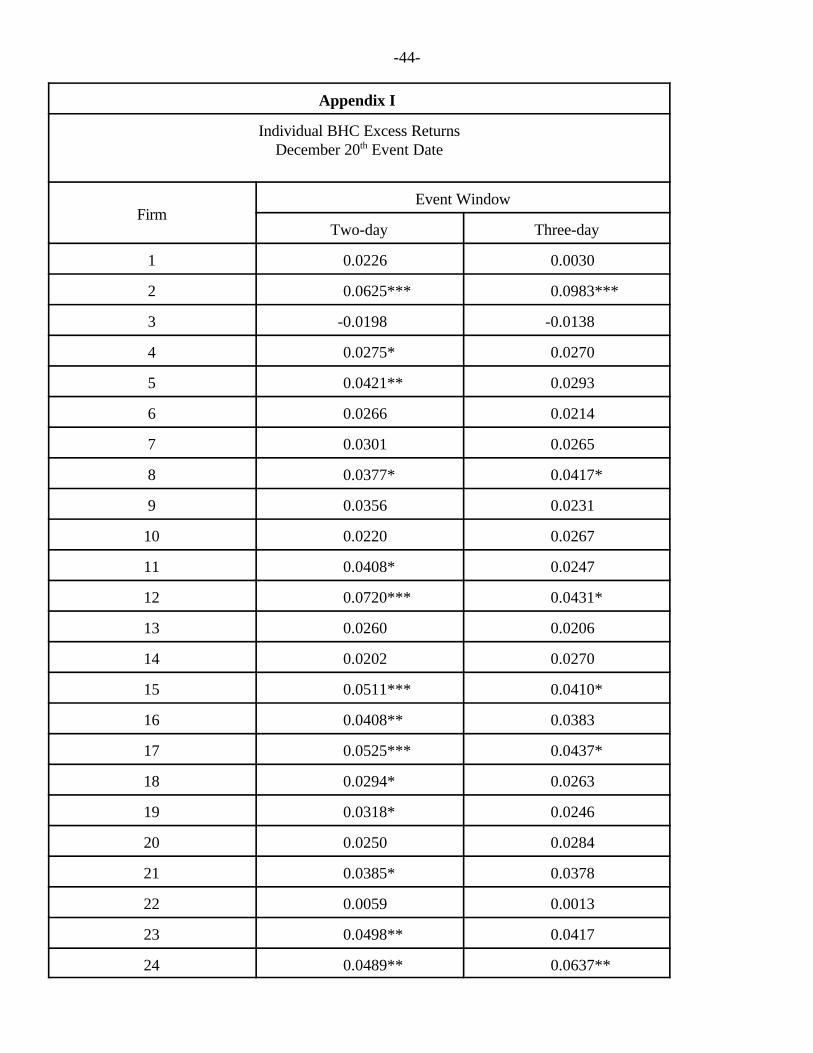
13 The individual BHC excess returns are reported in Appendix I.
banking organizations accounts for just about half of the total assets of section 20 subsidiaries,
almost two-thirds of the ineligible securities held for trading and investment, and more than three-
fourths of the gross amount of ineligible securities underwritten by section 20 subsidiaries. Gains
on ineligible securities owned for our sample of firms does not capture much of the total, while
profit from underwriting for the firms in our sample make up most of these profits earned by all
section 20 subsidiaries.
III.B.2. EXCESS RETURNS BY FIRM
To investigate the pattern of excess returns across banking organizations, the following
empirical model is estimated:
(2)Rn, t'"n%$n(Rmt%jK
k'1
(n,k(Dk,t%gn, t
where Rn,t is the stock return for individual company “n” on day “t” and the other variables are the
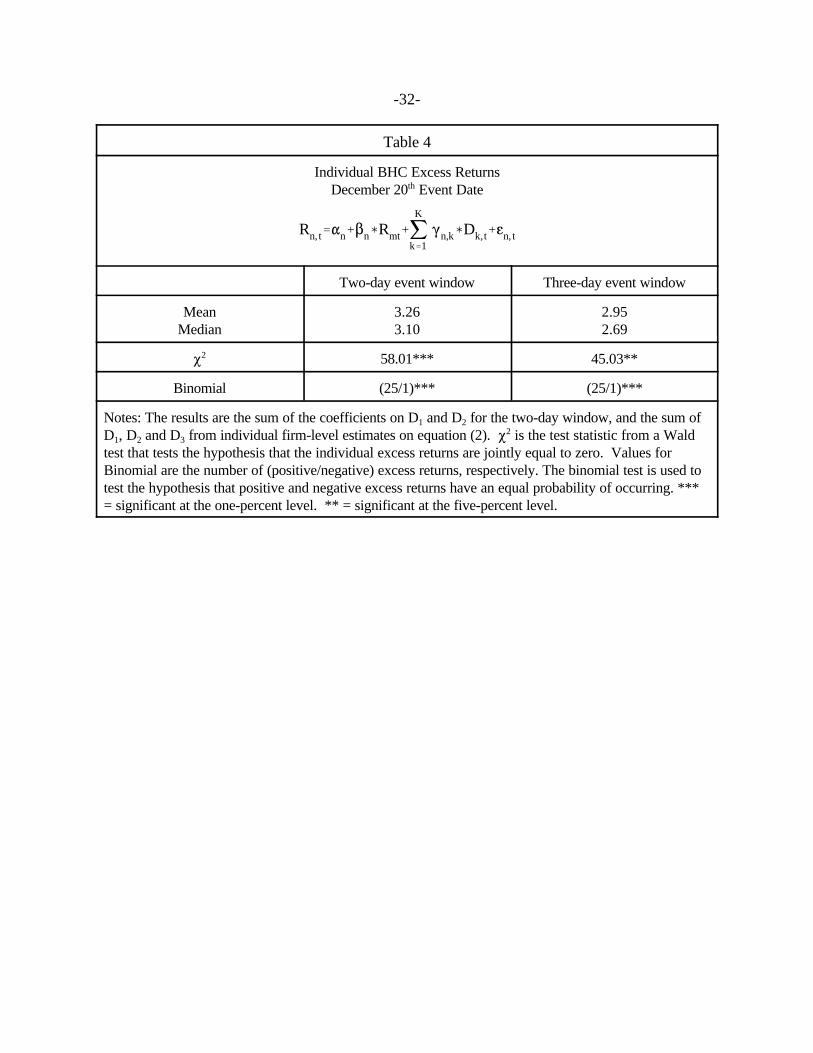
same as those employed in equation (1)12. Table 4 reports summary statistics on the individual
excess returns from estimating equation (2) along with test statistics that indicate that these excess
returns are, as a group, statistically different from zero.13 Median excess returns are 3.10 and
2.69 percent for the 2-day and the 3-day window, respectively. Both Wald tests that the excess
returns are jointly equal to zero, and the binomial test that positive and negative excess returns
have an equal probability of occurring, are rejected. We now use these excess returns as
-15-
14 These regressions employ a heteroscedasticity correction using a procedure described inSefick and Thompson (1986) and Karafiath, Mynatt, and Smith (1991, Appendix A).
dependent variables, along with the data described in Table 2 as independent variables, in
regressions that attempt to identify the possible factors behind these wealth effects generated by
expanded securities activities.
III.B.3. DETERMINANTS OF WEALTH EFFECTS
We regress the individual excess returns on our different measures of subsidiary securities
activity.14 A number of specifications are estimated to judge the robustness of the results.
Estimates using excess returns generated from both a two-day and a three-day event window are
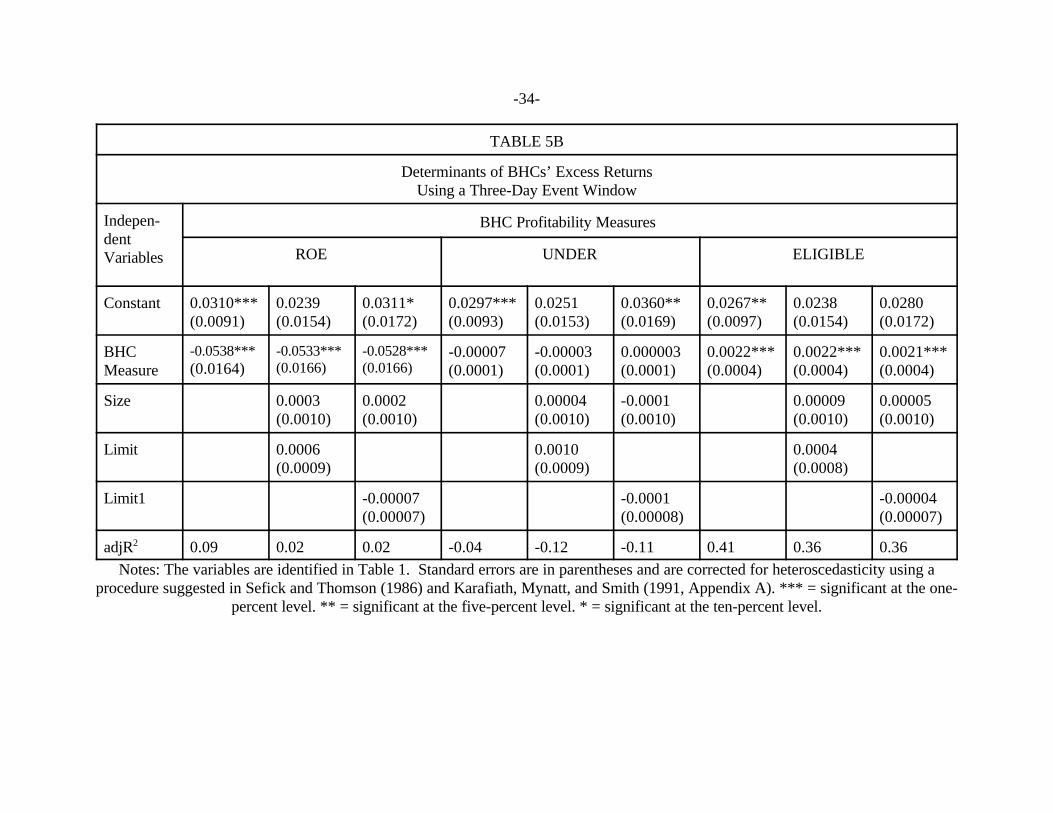
reported in Tables 5 and 6.
Tables 5A and 5B show the results using measures of gross revenue as independent
variables. ROE possesses a negative and significant sign in all of the models estimated. This
result is consistent with the activity mix hypothesis and inconsistent with the opportunity
hypothesis. Those BHCs with lower overall profitability are associated with higher excess
returns, possibly reflecting a sub-optimal mix of current activities before the revenue-limit
increase. The control variables SIZE, LIMIT, and LIMIT1 are are insignificant in all of the
models that were estimated.
UNDER is statistically insignificant in the models estimated. ELIGIBLE, however, is
positive and significant in all specifications, as hypothesized under the opportunity hypothesis.
Greater excess returns are associated with those BHCs that recorded greater revenue generation
per unit of eligible securities underwritten. Stock market participants could have viewed a greater
-16-
15 We also estimated models that contain both the expense variables and the grossprofitability variables. Using excess returns generated with the two-day window, the expensevariables and ELIGIBLE are statistically significant when they both appear in the equation. Usinga three-day window, however, only ELIGIBLE is significant when either expense variable isincluded in the estimating equation.
amount of revenue from eligible underwriting as reflecting greater potential to expand once the
cap was raised leading to significant wealth effects when the revenue limit was increased.
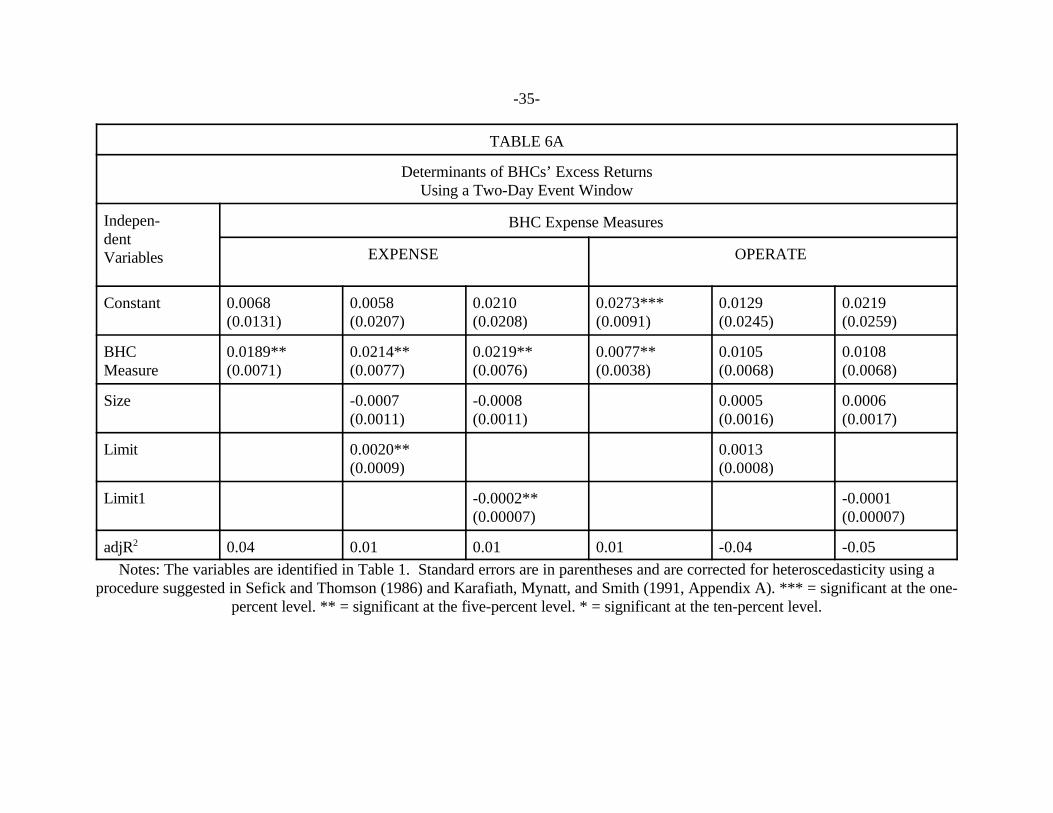
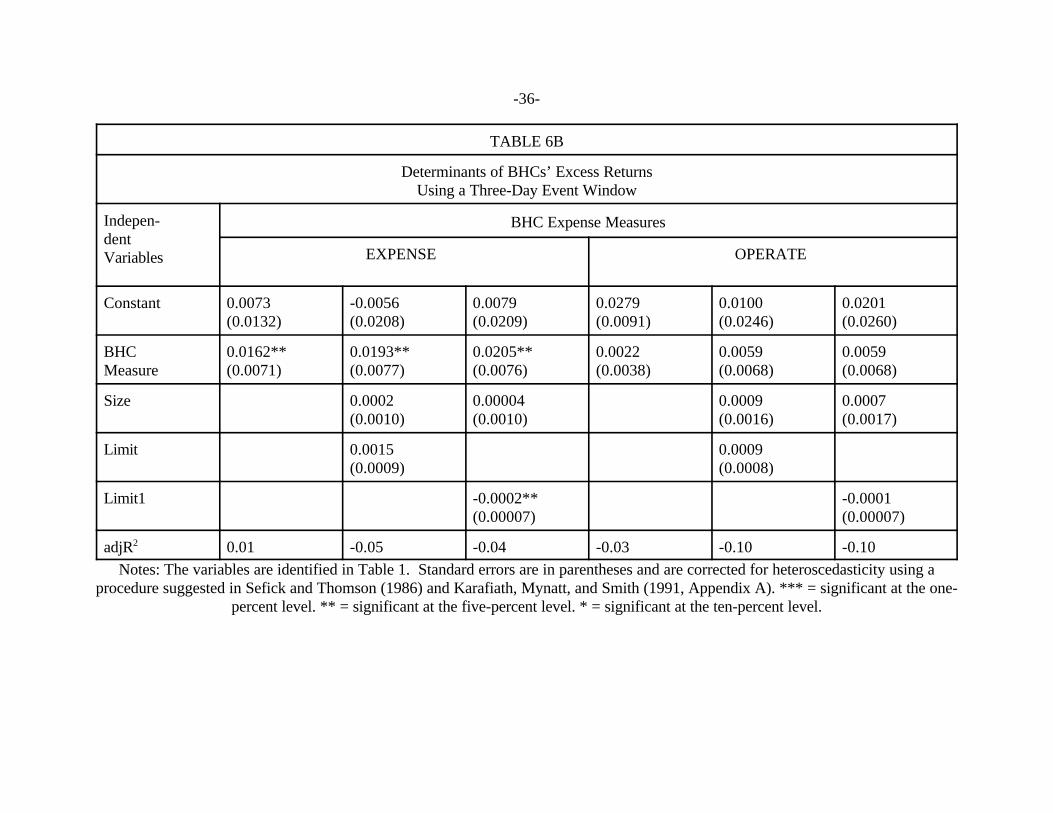
Tables 6A and 6B consider the role of costs in affecting excess returns. EXPENSE is
positive and significant in all of the models estimated. Those BHCs with relatively higher total
expenses are associated with greater excess returns, which is consistent with the activity mix
hypothesis and inconsistent with the opportunity hypothesis. Operating expenses, though, are
statistically significant in explaining the pattern of BHCs excess returns in only one of the
specifications estimated.
Overall, our results from both measures of profitability and costs tend to support the
activity mix hypothesis. The pattern of excess returns exhibited by individual banking
organizations in response to the revenue-limit increase is consistent with the possibility for a
reallocation of securities activities toward a more optimal mix of operations.15 Our results also
provide limited support for the opportunity hypothesis. Excess returns are greatest for those
institutions demonstrating the best ability to generate eligible revenue, as evidenced by the
positive sign on ELIGIBLE. This is consistent with the notion that investors expect these firms to
be more capable at exploiting the new opportunities that arise from the higher revenue cap.
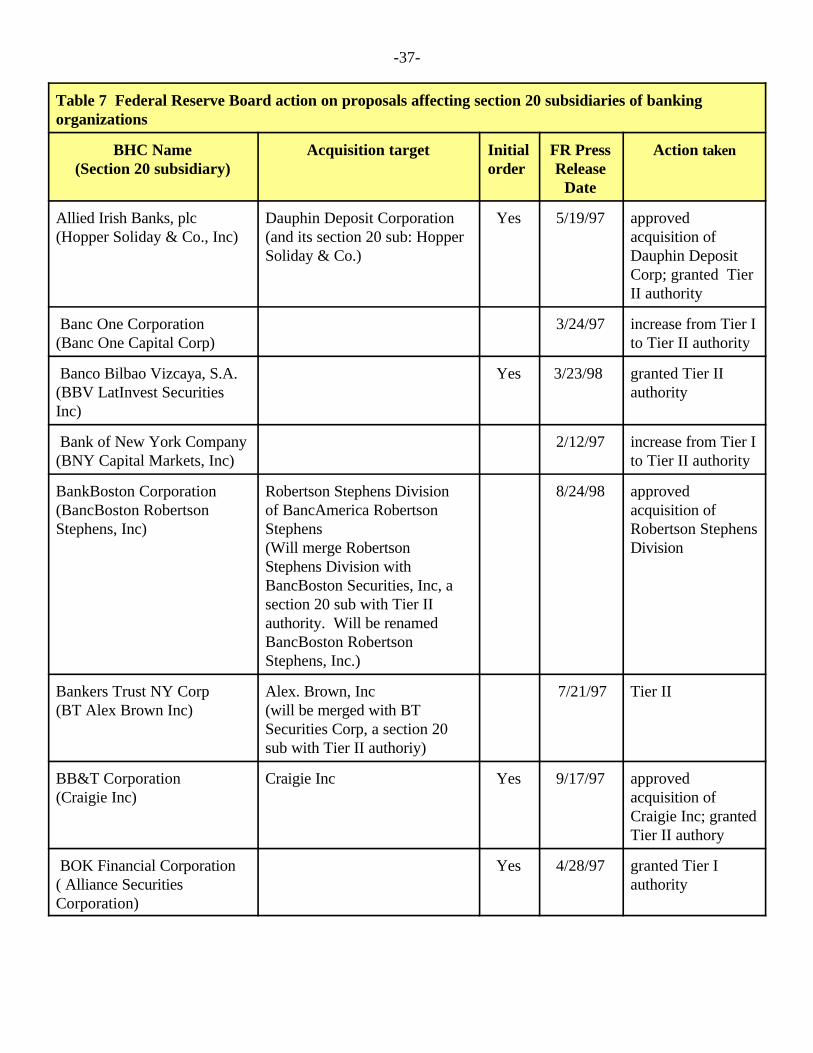
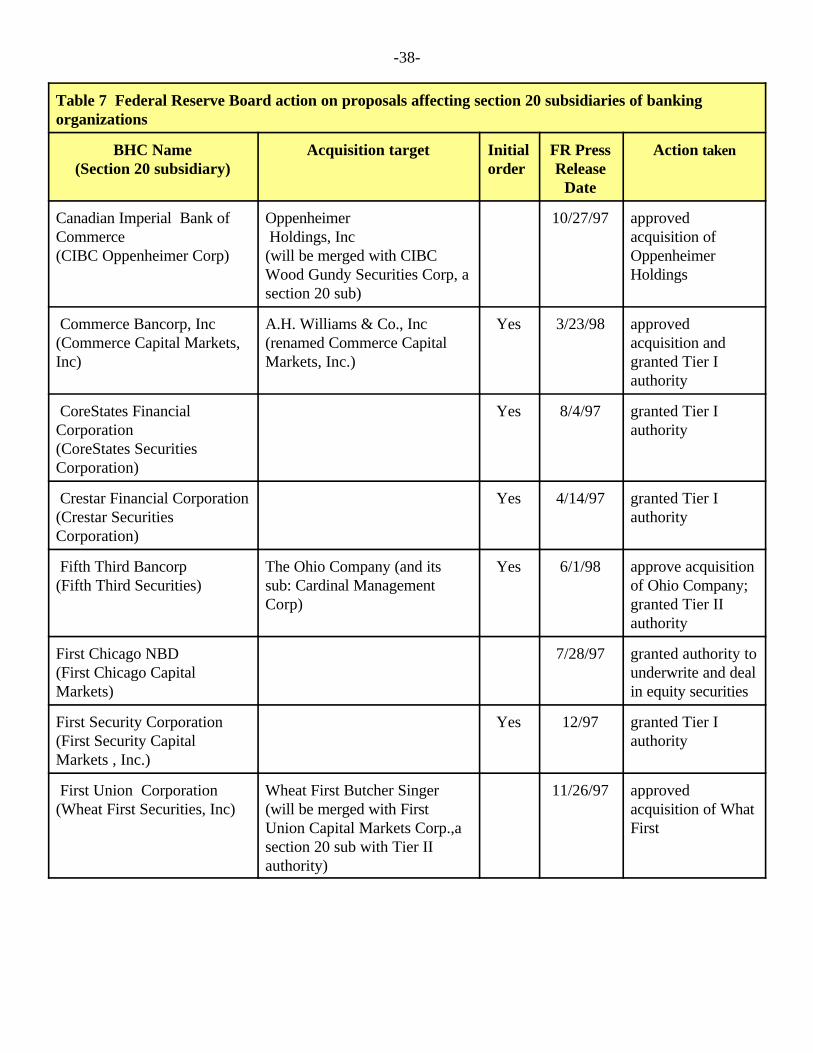
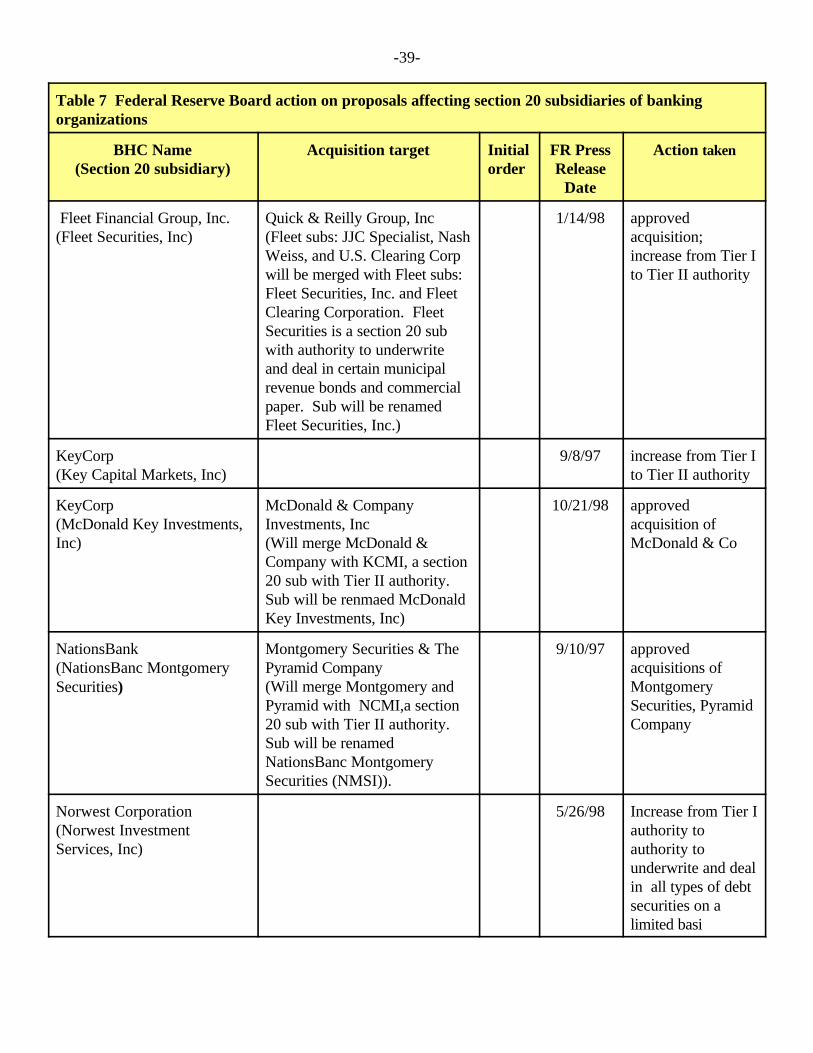
III.C. POST-ORDER EXPANSION ACTIVITY BY BANKING ORGANIZATION
Another explanation for the wealth effects generated by raising the revenue limit might be
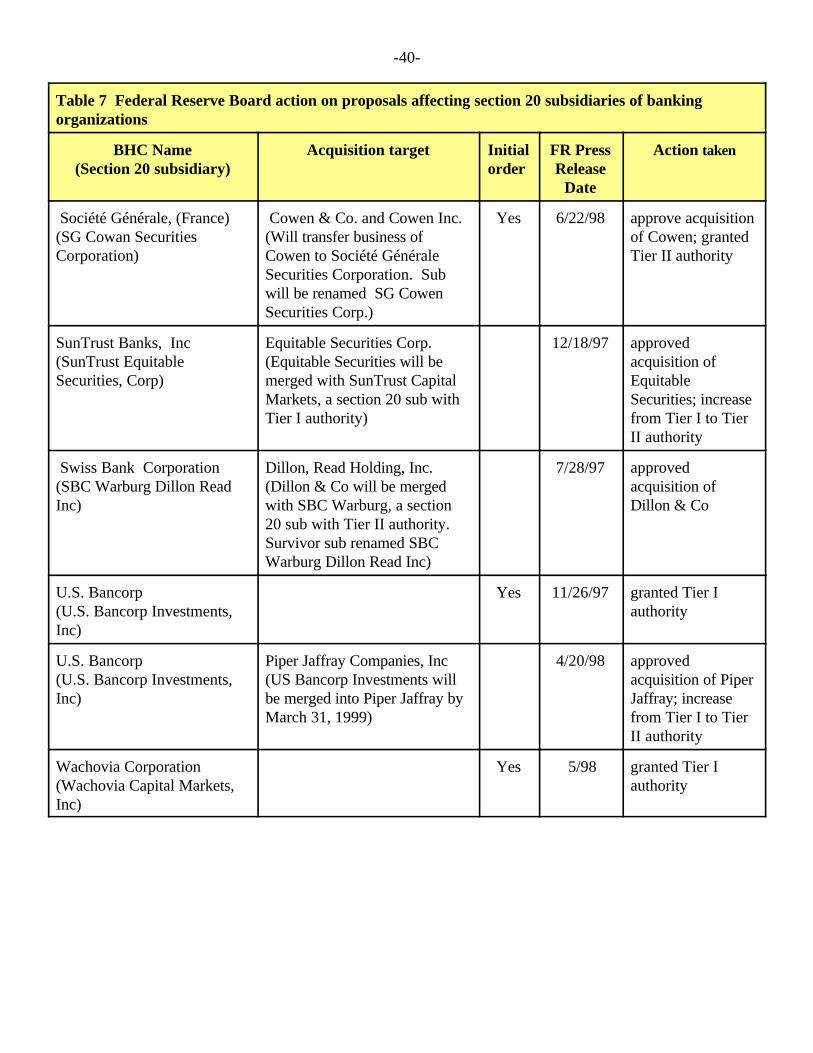
the greater opportunities to pursue acquisitions of securities firms. Table 7 lists recent expansion
-17-
activity by banking organizations into securities activities. This information was obtained from
Federal Reserve Board press releases. From January 1997 through October 1998, 15 banking
organizations acquired securities companies. These include major acquisitions such as
BankBoston Corp.’s acquisition of the Robertson Stephens Division from BancAmerica, Bankers
Trust’s acquisition of Alex. Brown, Fleet Financial Group’s acquisition of Quick and Reilly
Group, KeyCorp’s acquisition of McDonald & Company, and U.S. Bancorp’s acquisition of Piper
Jaffray. Five of these acquisitions were the means used by the banks to establish a section 20
subsidiary. The other 10 acquisitions represent steps taken by banks to expand securities
activities. Over this time period, 12 institutions, including 3 foreign institutions, were granted
approval to operate a section 20 subsidiary. Finally, 7 proposals to expand from Tier I to Tier II
authority were approved.
III.C.1 Acquisition Activity
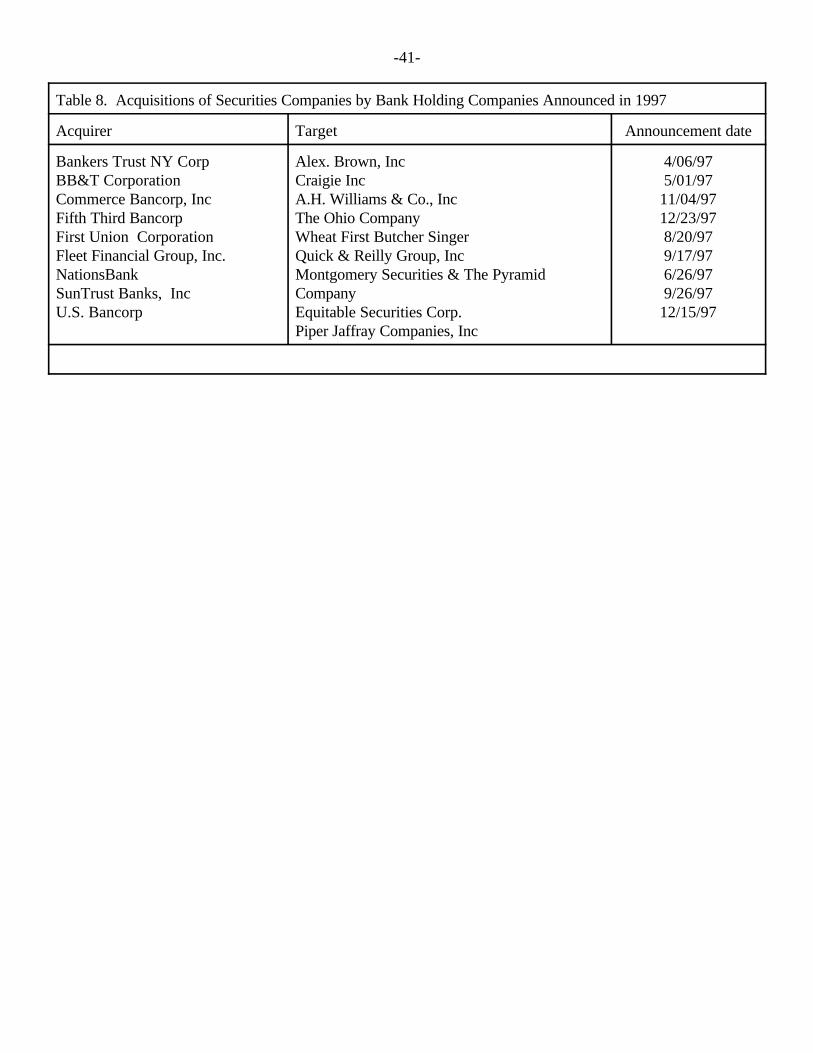
If the acquisition of securities companies creates economic benefits to the acquiring
banking organizations, then such value might be estimated by stock price reactions at the time the
bank publically announces its expansion plans. We obtained CRSP stock price data for nine
domestic banking organizations that announced the acquisition of securities companies in 1997.
These organizations are listed in Table 8. Announcement dates were obtained through searches
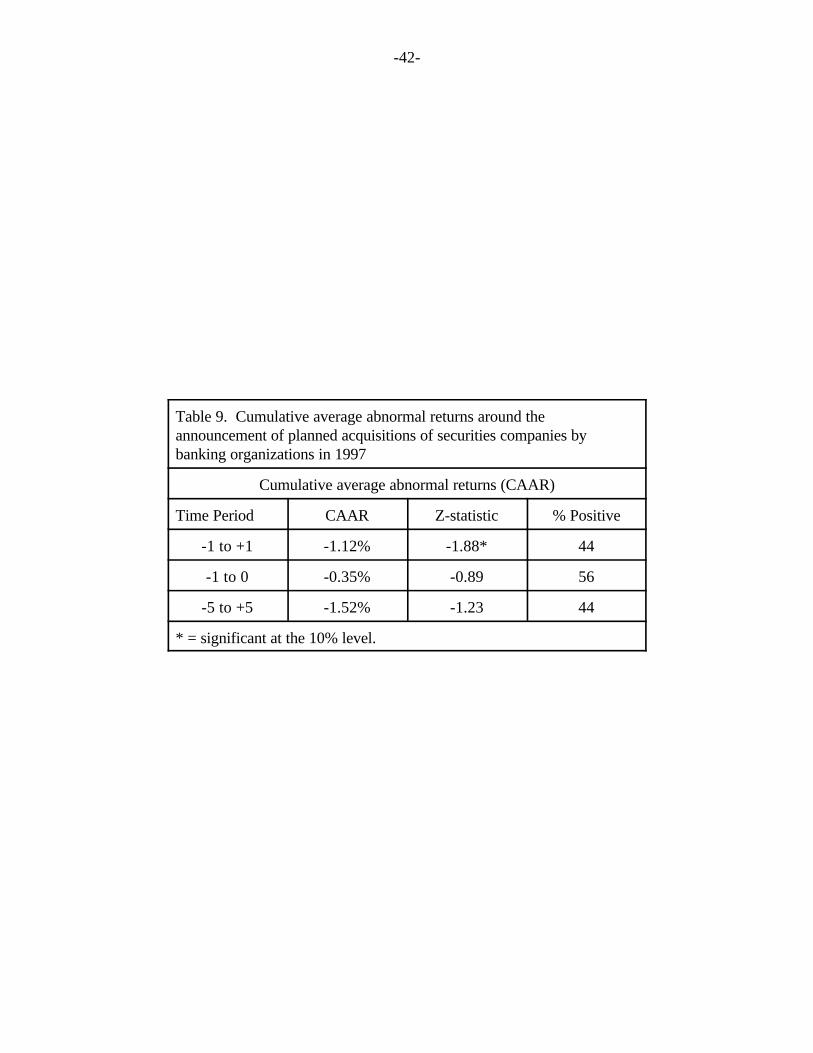
of the Dow Jones News Service. Cumulative average abnormal returns (CAAR) calculated
around the initial announcement of the acquisition are presented in Table 9. Abnormal returns are
defined as the difference between actual returns and predicted returns. Predicted returns are
generated using a market model in which returns on the CRSP value-weighted index with
dividends serves as the market index. Day 0 denotes the day the acquisition announcement was
-18-
16 Our Tier II measure was derived by summing the amount of non-asset-backed corporatedebt securities, debt securities convertible into equity securities, and securities issued by a trust orother vehicle secured or representing interests in debt obligations, plus the amount of common
reported in the Dow Jones News Service. The parameters of the model were estimated using
ordinary least squares over the time period day -200 to day -60. The test statistics are based on
the procedures described in Dodd and Warner (1983).
CAAR are calculated for windows (-1, +1), (-1, 0), and (-5, +5). Only CAAR(-1, +1) is
significant, and then, only at the 10% level. The results, however, show average negative returns
of 1.12% over day -1 to day +1. Supporting this is the finding that only about one half of the
banks have positive cumulative abnormal returns over the event windows. These results therefore
fail to support the acquisition hypothesis that a source of value arising from the revision in the
revenue cap on section 20 subsidiaries was a greater ability to pursue acquisitions of securities
companies.
III.D. TIER I AND TIER II ACTIVITIES AND ELIGIBLE AND INELIGIBLE REVENUE
The revenue limit may also have affected the asset mix of BHCs between Tier I and Tier II
activities. As the Board of Governors pointed out, the revenue potential for Tier II activity
exceeds that of Tier I activity (Federal Register, 1996, p. 68753). And, as stated earlier, the
revenue limit may also have constrained BHCs’ activity by forcing them to pursue more eligible
revenue to remain under the cap (Federal Register, 1996, p. 68753). Therefore, the increase in
the revenue limit, along with the increase in the number of BHCs granted Tier II authority, may
result in a larger amount of Tier II activity relative to Tier I. The data from the FR Y-20 do not
allow us to obtain definitive breakdowns of Tier I and Tier II activity. However, we can develop
proxy measures that approximate the amount of each type of activity.16 We calculated the
-19-
stock, preferred stock, and other direct or indirect equity ownership interests in corporations andother entities. It is possible that this measure includes some bank-eligible activity. Our Tier Imeasure was obtained by subtracting our Tier II measure from the total amount of bank-ineligiblesecurities.
17 For comparison, growth in the assets of our sample of Section 20 subsidiaries was 21.7percent over this time period.
18 We also re-estimated the empirical models found in Tables 5 and 6 including a dummyvariable to account for differences across banks in Tier I versus Tier II activity. This variable wasnot statistically significant in most of the models estimated.
percentage increases in our proxies for Tier I and Tier II activity over the period from the third
quarter of 1996 until the end of 1997. Tier I activity for the banks in our sample increased 57
percent, while Tier II activity increased by 70 percent.17 The differences in the growth of the two
types of revenue were even more substantial. Eligible revenue grew 63 percent, while ineligible
revenue 202 percent over this period. From these calculations, BHCs increased both Type I and
Type II securities activity by substantial amounts after the revenue-limit increase was approved.
However, the banks in our sample appeared to pursue Tier II activity at a significantly greater
pace, possible reflecting the constraints that existed under the previous revenue limit. And,
growth in ineligible revenue was considerably greater than growth in eligible revenue, providing
some support for the possibility that the previous revenue cap might have distorted BHC activity
decisions. 18
III.E ROBUSTNESS TESTS
During 1996 and 1997, the Federal Reserve proposed and eventually adopted changes in
the firewalls between commercial banks and their section 20 affiliates. On July 31, 1996, in
addition to requesting comments on raising the section 20 revenue limit, the Federal Reserve
-20-
19 See Federal Register, 1996, pp. 57679-57683.
20 See Federal Register, 1997, pp. 45295-45307.
Board formally requested comments on amending or eliminating three firewalls on the operations
of section 20 subsidiaries. On October 30, 1996, the Federal Reserve acted on these proposals by
announcing it would adopt changes to ease or eliminate restrictions on director, officer and
employee interlocks, cross-marketing activities, and the purchase and sale of financial assets
between a section 20 subsidiary and an affiliated bank. These changes became effective January
7, 1997.19 Further steps were taken on January 8, 1997, when the Federal Reserve proposed to
rescind many of the firewalls and to consolidate the remainder in a series of operating standards.
Some of the more notable proposed changes concerned the funding of a section 20 subsidiary by
an affiliated bank, credit enhancements provided by a bank to issuers of securities underwritten by
a section 20 affiliate, and loans provided by a bank to customers purchasing products of a section
20 affiliate.20 On August 22, 1997, the Federal Reserve acted on these proposals by adopting
many of the contemplated changes. The changes became effective October 31, 1997.
These changes might have motivated some of the merger activity and BHCs’ requests for
additional securities powers during 1997 and 1998. If so, then we should not attribute the actions
by BHCs solely to the higher revenue cap. To explore this possibility, we estimate models over a
longer time period and with additional binary variables to test for excess returns around a broad
range of dates when the Federal Reserve proposed or approved these regulatory structural
changes. To allow for a richer set of tests, the impact on banking organizations with no section
20 subsidiary is also considered. If these changes lead to greater operating efficiencies, then
BHCs with the potential to form section 20 subsidiaries should benefit as well as those firms
-21-
21 See Seiberg (1997).
already operating such affiliates. The two-equation system shown in equation (3) is employed for
this analysis.
(3)Rj, t ' "j % $jRm,t % *j)it % j16
k'1(j,kDk, t % gj, t for j ' sec20, non20
Rsec20,t (Rnon20,t) is the return on an equally weighted portfolio of banking companies with
(without) a section 20 subsidiary on day t, Rmt is the equally weighted return on a market wide
index of stocks, the Dk variables represent individual dummy variables that equal one during the
event of interest and zero otherwise. Dummy variables on and around July 31, 1996, October 30,
1996, December 20, 1996, January 8, 1997, and August 22, 1997 are incorporated into the
model. We generally use 3-day event windows centered around the announcement date of a
proposal or adoption of a policy change. An exception is around the January 1997 event. The
American Banker reported that the Federal Reserve was planning to propose changes to the
section 20 firewalls two days prior to the official announcement.21 Thus, we use a 4-day window
to capture this impact. Data over May 3, 1996 to November 18, 1997 are used to estimate the
parameters in the model. This represents an estimation period that begins 60 days before the first
event and 60 days after the last event. The change in the interest rate, )it is added to this model
since interest rates varied from 5.84 percent to 7.06 percent over the estimation period.
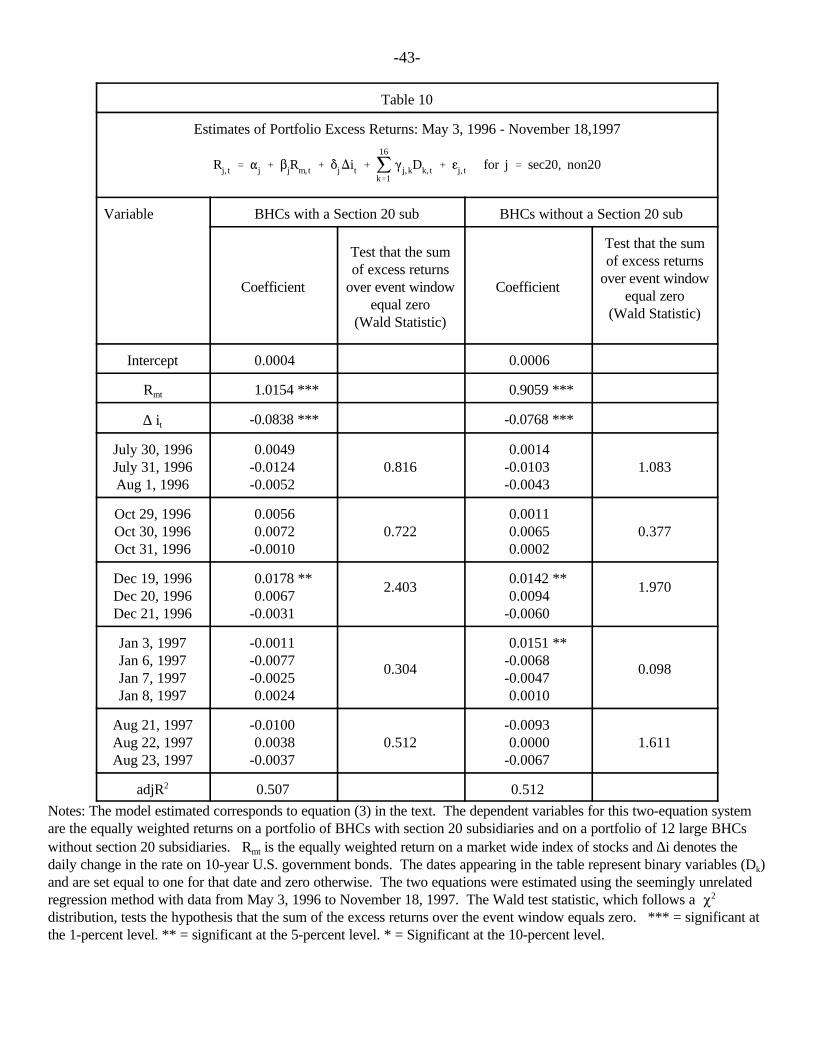
Table 10 presents results for this model. The equation for BHCs with no section 20
subsidiary was estimated using an equally-weighted portfolio of those BHCs with $20 billion in
-22-
assets, as of end-of-year 1996, that had not established a section 20 subsidiary. Twelve BHCs
with stock return data available on the CRSP data files meet these criteria.
There is little evidence that BHCs experienced excess returns other than around December
20, 1996. BHCs with and without section 20 subsidiaries show positive excess returns on or
around the announcement that the revenue cap would be lifted to 25 percent. Based on the t-
statistics, excess returns for both portfolios on December 19 are statistically significant. Wald
tests were also conducted to test the hypothesis that the sum of daily excess returns over each of
the event windows equals zero. Excess returns over the 3-day windows are not statistically
significant for any of the events. However, the sum of excess returns over December 19th and 20th
(not shown in Table 10) is significant for both portfolios. The Wald statistic is 4.71 (significant at
the 5 percent level) for BHCs with section 20 subsidiaries and 5.303 (significant at the 5 percent
level) for BHCs without section 20 subsidiaries). We also find that excess returns for the non-
section 20 BHCs were positive and significant on January 3, 1997.
This analysis was also conducted using a system of individual firm-level equations rather
than the portfolios. A system of 26 equations was estimated for the group of BHCs with a
section 20 subsidiary and a 12-equation system was estimated for the group of large BHCs that
have no section 20 subsidiary. Wald tests were then conducted to test the hypothesis that
aggregate excess returns over an event window equaled zero for all firms in the system. These
results (not reported) support the conclusions reached using portfolios. We find that both groups
experienced excess returns around December 20, 1996. Also, the hypothesis of zero excess
returns in early January 1997, can be rejected for the BHCs with no section 20 subsidiary.
However, this latter result appears to be driven by large excess returns from just two firms.
-23-
Median excess returns for the group equals -0.42 percent and eight of the twelve firms have
negative estimated excess returns. In sum, the change in the revenue limit, rather than the
elimination of any firewalls, appears to have had the most important impact on BHCs operating
section 20 subsidiaries.
V. CONCLUSIONS
A recent decision by the Federal Reserve to expand the securities activities of U.S.
banking organizations was greeted favorably by the stock market. Large, statistically significant
excess returns were estimated when considering the date this approval was announced. We find
some evidence that the previous revenue limit resulted in a less-than-optimal mix of activities for
our sample of BHCs. The positive wealth effects likely reflected the possibility that the easing of
the revenue limitation presented an improved range of opportunities for BHC security
subsidiaries. Shareholders, however, did not seem to value the acquisitions that the increase in
the revenue limit may have generated.
-24-
REFERENCES
Ang, James S., and Terry Richardson (1994), “The Underwriting Experience of Commercial Bank
Affiliates Prior to the Glass-Steagall Act: A Re-examination of Evidence for Passage of
the Act,” Journal of Banking and Finance 18 (January): 351-95.
Benston, George J. (1990), The Separation of Commercial and Investment Banking: The Glass-
Steagall Act Revisited and Reconsidered (New York: Oxford University Press).
Benston, George J. (1996), “The Origins of and Justification for the Glass-Steagall Act,” in
Universal Banking: Financial System Design Reconsidered, eds. Anthony Saunders and
Ingo Walter (Chicago: Irwin Professional Publishing), 31-69.
Bhargava, Rahul, and Donald R. Fraser (1998), “On the Wealth and Risk Effects of Commercial
Bank Expansion into Securities Underwriting: An Analysis of Section 20 Subsidiaries,”
Journal of Banking and Finance 22: 447-65.
Binder, John J. (1985), “Measuring the Effects of Regulation with Stock Price Data,” Rand
Journal of Economics 16: 167-83.
Board of Governors of the Federal Reserve System (1997). Annual Report of the Board of
Governors of the Federal Reserve System, 1997 (Washington, D.C.).
-25-
Boyd, John H. and Stanley L. Graham (1986), “Risk, Regulation, and Bank Holding Company
Expansion into Nonbanking,” Federal Reserve Bank of Minneapolis Quarterly Review,
10, No. 2 (Spring): 2-17.
Boyd, John H. and Stanley L. Graham (1988), “The Profitability and Risk Effects of Allowing
Bank Holding Companies to Merge With Other Financial Firms: A Simulation Study,”
Federal Reserve Bank of Minneapolis Quarterly Review 12, No. 2, (Spring): 3-20.
Dodd, Peter and Jerold B. Warner (1983). “On Corporate Governance: A Study of Proxy
Contests,” Journal of Financial Economics 11(April): 401-438.
Dunaief, Daniel (1996). “Investment Banking Profits Seen near Glass-Steagall Cap,” American
Banker (July 31).
Dutta, Mahua (1997). “With Rules Eased, Banks Flock to Securities Underwriting,” American
Banker (August 18).
Ely, David P. and Kenneth J. Robinson (1998), “How Might Financial Institutions React to Glass-
Steagall Repeal? Evidence from the Stock Market,” Federal Reserve Bank of Dallas
Financial Industry Studies (September): 1-11.
-26-
Hays, Laurie and John R. Wilke (1996). “Banks Bump Against Cap on Dealing,” The Wall Street
Journal (March 29).
Karafiath, Imre, Ross Mynatt, and Kenneth L. Smith (1991), “The Brazilian Default
Announcement and the Contagion Effect Hypothesis,” Journal of Banking and Finance
15, no. 3 (July): 699-716.
Kelly, Edward J. III (1985), “Legislative History of the Glass-Steagall Act,” in Deregulating Wall
Street: Commercial Bank Penetration of the Corporate Securities Market, ed. Ingo
Walter (New York: John Wiley & Sons), 67-87.
Kroszner, Randall S., and Raghuram G. Rajan (1994), “Is the Glass-Steagall Act Justified? A
Study of the U.S. Experience with Universal Banking Before 1933,” American Economic
Review 84 (September): 810-32.
Mester, Loretta J. (1996), “Repealing Glass-Steagall: The Past Points the Way to the Future,”
Federal Reserve Bank of Philadelphia Business Review, (July/August), 3-18.
Millon-Cornett, Marcia, and Hassan Tehranian (1989), “Stock Market Reactions to the
Depository Institutions Deregulation and Monetary Control Act of 1980,” Journal of
Banking and Finance 13 (March): 81-100.
-27-
Millon-Cornett, Marcia, and Hassan Tehranian (1990), “An Examination of the Impact of the
Garn-St.Germain Depository Institutions Act of 1982 on Commercial Banks and Savings
and Loans,” Journal of Finance 45 (March): 95-111.
Puri, Manju (1994), “The Long-Term Default Performance of Bank Underwritten Security
Issues,” Journal of Banking and Finance 18 (January): 397-418.
Puri, Manju (1996), “Commercial Banks in Investment Banking: Conflict of Interest or
Certification Role?” Journal of Financial Economics 40 (March): 373-402.
Rea, Alison, Leah Nathans Spiro, and Peter Galuszka (1996), “Bankers Get Set to Go For
Brokers,” Business Week (December 2): 92.
Ring, Niamh (1997). “Firms Take Fed’s Easing of Section 20 Restrictions in Stride,” The Bond
Buyer (February 27).
Schipper, Katherine, and Rex Thompson (1983), “The Impact of Merger-Related Regulations on
the Shareholders of Acquiring Firms,” Journal of Accounting Research 21, no. 1,
(Spring): 184-221.
-28-
Sefick, Stephan E. and Rex Thompson (1986), “An Approach to Statistical Inference in Cross-
Sectional Models with Security Abnormal Returns as Dependent Variable,” Journal of
Accounting Research 24, no. 2, (Autumn): 316-334.
Seiberg, Jaret (1997). “Fed Proposal Would Eliminate Some Firewalls in Underwriting,”
American Banker, January 6.
Smith, Rodney T., Michael Bradley, and Greg Jarrell (1986), “Studying Firm-Specific effects of
Regulation with Stock Market Data: An Application to Oil price Regulation,” Rand
Journal of Economics 17, no. 4 (Winter): 467-489.
Taylor, Jeffrey and Stephen E. Frank (1996). “Fed Set to Ease Bank Underwriting Curbs,” The
Wall Street Journal (August 1): A2.
Wall, Larry D., Alan K. Reichert, and Sunil Mohanty (1993), “Deregulation and the Opportunities
for Commercial Bank Diversification,” Federal Reserve Bank of Atlanta Economic
Review 78, No. 5 (September/October): 1-25.
White, Eugene N. (1986), “Before the Glass-Steagall Act: An Analysis of the Investment
Banking Activities of National Banks,” Explorations in Economic History 23: 33-55.
-29-
Table 1
Estimates of Portfolio Excess Returns
Rsec20, t'"sec20%$sec20(Rmt%jK
k'1(sec20,k(Dk, t%gsec20, t
VariablesEvent Window
Two-Day Window Three-Day Window
Intercept 0.0010(0.0008)
0.0011(0.0004)
Rmt 0.9918***(0.2118)
0.9847***(0.0997)
D1 0.0256***(0.0050)
0.0256***(0.0042)
D2 0.0069(0.0093)
0.0068(0.0094)
D3 -0.0031(0.0041)
Cumulative excess returns( P2 )
3.25%(5.94**)
2.93%(3.22*)
adjR2 0.20 0.40
SSE 0.01 0.01
Notes: The model estimated corresponds to equation (1) in the text. The dependent variable is the equallyweighted return on a portfolio of BHCs with section 20 subsidiaries. Rmt is the equally weighted return ona market wide index of stocks. The D1 ,D2, ,D3 are binary variables for December 19, 20, and 23,respectively that equal one during the event date in question and zero otherwise. P2 is the Wald test statisticthat the sum of the excess returns ( γ1 + γ2 + γ3 ) equals zero. *** = significant at the 1-percent level. ** =significant at the 5-percent level. * = Significant at the 10-percent level.
-30-
Table 2Description of Variables
Variable NameDescription
EXCESSIndividual excess stock return associated withDecember 20th event date.
UNDER
Gross profit (or loss) from the managementof, or participation in, underwritingtransactions for ineligible securities, as aproportion of the gross amount of ineligiblesecurities underwritten.
ELIGIBLE
Gross profit (or loss) from the managementof, or participation in, underwritingtransactions for eligible securities, as aproportion of the gross amount of eligiblesecurities underwritten.
EXPENSETotal subsidiary expenses as a proportion oftotal gross subsidiary revenue.
OPERATE
The sum of salary and employee benefits,expenses on premises and fixed assets (net ofrental income), communications and dataprocessing, and other expenses, as aproportion of total gross subsidiary revenue.
LIMIT
Revenue limitation: Ratio of revenue derivedfrom bank-ineligible securities underwritingand dealing activities to total gross revenueless neutral revenue. Based on prior years.
LIMIT1 (10-LIMIT)2
SIZE Log of subsidiary assets.
ROESubsidiary net income divided by totalsubsidiary equity capital.
Data Sources: EXCESS is obtained using individual security returns from the CRSP tapes. The data on individual Section 20 subsidiaries is obtained from Financial Statements for aBank Holding Company Subsidiary engaged in Bank-Ineligible Securities Underwriting andDealing — FR Y-20, Board of Governors of the Federal Reserve System, third quarter 1996.
-31-
Table 3
Comparison of Sample Section 20 Subsidiariesto all Section 20 Subsidiaries
Third Quarter 1996
Variable Sample TotalSample as Percent
of Total
ASSETS $186,150,172 $379,157,852 49
INELIGIBLESECURITIES
$13,468,254 $21,044,046 64
INELIGIBLESECURITIESUNDERWRITTEN
$71,910,610 $92,506,129 78
INELIGIBLEREVENUE
$648,950 $1,086,641 60
GAINS ONSECURITIESOWNED(INELIGIBLE)
$41,968 $235,078 18
PROFIT FROMSECURITIESUNDERWRITING(INELIGIBLE)
$337,656 $422,662 80
Source: FR Y-20.
-32-
Table 4
Individual BHC Excess ReturnsDecember 20th Event Date
Rn, t'"n%$n(Rmt%jK
k'1
(n,k(Dk,t%gn, t
Two-day event window Three-day event window
MeanMedian
3.263.10
2.952.69
P2 58.01*** 45.03**
Binomial (25/1)*** (25/1)***
Notes: The results are the sum of the coefficients on D1 and D2 for the two-day window, and the sum ofD1, D2 and D3 from individual firm-level estimates on equation (2). P2 is the test statistic from a Waldtest that tests the hypothesis that the individual excess returns are jointly equal to zero. Values forBinomial are the number of (positive/negative) excess returns, respectively. The binomial test is used totest the hypothesis that positive and negative excess returns have an equal probability of occurring. ***= significant at the one-percent level. ** = significant at the five-percent level.

-33-
TABLE 5A
Determinants of BHCs’ Excess ReturnsUsing a Two-Day Event Window
Indepen-dentVariables
BHC Profitability Measures
ROE UNDER ELIGIBLE
Constant 0.0335***(0.0090)
0.0392***(0.0154)
0.0482**(0.0172)
0.0326***(0.0093)
0.0401**(0.0153)
0.0529**(0.0169)
0.0314***(0.0096)
0.0394**(0.0154)
0.0476**(0.0172)
BHCMeasure
-0.0333**(0.0165)
-0.0304*(0.0166)
-0.0306*(0.0166)
-0.00001(0.0001)
0.00008(0.0001)
0.00009(0.0001)
0.0009**(0.0004)
0.0009**(0.0004)
0.0009**(0.0004)
Size -0.0008(0.0010)
-0.0008(0.0011)
-0.0010(0.0010)
-0.0011(0.0011)
-0.0009(0.0010)
-0.0009(0.0010)
Limit 0.0013(0.0008)
0.0017(0.0010)
0.0013(0.0008)
Limit1 -0.00009(0.00007)
-0.0001(0.00008)
-0.00008(0.00007)
adjR2 0.02 -0.04 -0.04 -0.04 -0.09 -0.09 0.07 0.01 0.01
Notes: The variables are identified in Table 1. Standard errors are in parentheses and are corrected for heteroscedasticity using aprocedure suggested in Sefick and Thomson (1986) and Karafiath, Mynatt, and Smith (1991, Appendix A). *** = significant at the one-
percent level. ** = significant at the five-percent level. * = significant at the ten-percent level.
-34-
TABLE 5B
Determinants of BHCs’ Excess ReturnsUsing a Three-Day Event Window
Indepen-dentVariables
BHC Profitability Measures
ROE UNDER ELIGIBLE
Constant 0.0310***(0.0091)
0.0239(0.0154)
0.0311*(0.0172)
0.0297***(0.0093)
0.0251(0.0153)
0.0360**(0.0169)
0.0267**(0.0097)
0.0238(0.0154)
0.0280(0.0172)
BHCMeasure
-0.0538***(0.0164)
-0.0533***(0.0166)
-0.0528***(0.0166)
-0.00007(0.0001)
-0.00003(0.0001)
0.000003(0.0001)
0.0022***(0.0004)
0.0022***(0.0004)
0.0021***(0.0004)
Size 0.0003(0.0010)
0.0002(0.0010)
0.00004(0.0010)
-0.0001(0.0010)
0.00009(0.0010)
0.00005(0.0010)
Limit 0.0006(0.0009)
0.0010(0.0009)
0.0004(0.0008)
Limit1 -0.00007(0.00007)
-0.0001(0.00008)
-0.00004(0.00007)
adjR2 0.09 0.02 0.02 -0.04 -0.12 -0.11 0.41 0.36 0.36
Notes: The variables are identified in Table 1. Standard errors are in parentheses and are corrected for heteroscedasticity using aprocedure suggested in Sefick and Thomson (1986) and Karafiath, Mynatt, and Smith (1991, Appendix A). *** = significant at the one-
percent level. ** = significant at the five-percent level. * = significant at the ten-percent level.
-35-
TABLE 6A
Determinants of BHCs’ Excess ReturnsUsing a Two-Day Event Window
Indepen-dentVariables
BHC Expense Measures
EXPENSE OPERATE
Constant 0.0068(0.0131)
0.0058(0.0207)
0.0210(0.0208)
0.0273***(0.0091)
0.0129(0.0245)
0.0219(0.0259)
BHCMeasure
0.0189**(0.0071)
0.0214**(0.0077)
0.0219**(0.0076)
0.0077**(0.0038)
0.0105(0.0068)
0.0108(0.0068)
Size -0.0007(0.0011)
-0.0008(0.0011)
0.0005(0.0016)
0.0006(0.0017)
Limit 0.0020**(0.0009)
0.0013(0.0008)
Limit1 -0.0002**(0.00007)
-0.0001(0.00007)
adjR2 0.04 0.01 0.01 0.01 -0.04 -0.05
Notes: The variables are identified in Table 1. Standard errors are in parentheses and are corrected for heteroscedasticity using aprocedure suggested in Sefick and Thomson (1986) and Karafiath, Mynatt, and Smith (1991, Appendix A). *** = significant at the one-
percent level. ** = significant at the five-percent level. * = significant at the ten-percent level.
-36-
TABLE 6B
Determinants of BHCs’ Excess ReturnsUsing a Three-Day Event Window
Indepen-dentVariables
BHC Expense Measures
EXPENSE OPERATE
Constant 0.0073(0.0132)
-0.0056(0.0208)
0.0079(0.0209)
0.0279(0.0091)
0.0100(0.0246)
0.0201(0.0260)
BHCMeasure
0.0162**(0.0071)
0.0193**(0.0077)
0.0205**(0.0076)
0.0022(0.0038)
0.0059(0.0068)
0.0059(0.0068)
Size 0.0002(0.0010)
0.00004(0.0010)
0.0009(0.0016)
0.0007(0.0017)
Limit 0.0015(0.0009)
0.0009(0.0008)
Limit1 -0.0002**(0.00007)
-0.0001(0.00007)
adjR2 0.01 -0.05 -0.04 -0.03 -0.10 -0.10
Notes: The variables are identified in Table 1. Standard errors are in parentheses and are corrected for heteroscedasticity using aprocedure suggested in Sefick and Thomson (1986) and Karafiath, Mynatt, and Smith (1991, Appendix A). *** = significant at the one-
percent level. ** = significant at the five-percent level. * = significant at the ten-percent level.
-37-
Table 7 Federal Reserve Board action on proposals affecting section 20 subsidiaries of bankingorganizations
BHC Name(Section 20 subsidiary)
Acquisition target Initialorder
FR PressRelease
Date
Action taken
Allied Irish Banks, plc(Hopper Soliday & Co., Inc)
Dauphin Deposit Corporation(and its section 20 sub: HopperSoliday & Co.)
Yes 5/19/97 approvedacquisition ofDauphin DepositCorp; granted TierII authority
Banc One Corporation (Banc One Capital Corp)
3/24/97 increase from Tier Ito Tier II authority
Banco Bilbao Vizcaya, S.A. (BBV LatInvest SecuritiesInc)
Yes 3/23/98 granted Tier IIauthority
Bank of New York Company(BNY Capital Markets, Inc)
2/12/97 increase from Tier Ito Tier II authority
BankBoston Corporation(BancBoston RobertsonStephens, Inc)
Robertson Stephens Divisionof BancAmerica RobertsonStephens(Will merge RobertsonStephens Division withBancBoston Securities, Inc, asection 20 sub with Tier IIauthority. Will be renamedBancBoston RobertsonStephens, Inc.)
8/24/98 approvedacquisition ofRobertson StephensDivision
Bankers Trust NY Corp(BT Alex Brown Inc)
Alex. Brown, Inc(will be merged with BTSecurities Corp, a section 20sub with Tier II authoriy)
7/21/97 Tier II
BB&T Corporation(Craigie Inc)
Craigie Inc Yes 9/17/97 approvedacquisition ofCraigie Inc; grantedTier II authory
BOK Financial Corporation( Alliance SecuritiesCorporation)
Yes 4/28/97 granted Tier Iauthority
-38-
Table 7 Federal Reserve Board action on proposals affecting section 20 subsidiaries of bankingorganizations
BHC Name(Section 20 subsidiary)
Acquisition target Initialorder
FR PressRelease
Date
Action taken
Canadian Imperial Bank ofCommerce (CIBC Oppenheimer Corp)
Oppenheimer Holdings, Inc(will be merged with CIBCWood Gundy Securities Corp, asection 20 sub)
10/27/97 approvedacquisition ofOppenheimerHoldings
Commerce Bancorp, Inc(Commerce Capital Markets,Inc)
A.H. Williams & Co., Inc(renamed Commerce CapitalMarkets, Inc.)
Yes 3/23/98 approvedacquisition andgranted Tier Iauthority
CoreStates FinancialCorporation(CoreStates SecuritiesCorporation)
Yes 8/4/97 granted Tier Iauthority
Crestar Financial Corporation (Crestar SecuritiesCorporation)
Yes 4/14/97 granted Tier Iauthority
Fifth Third Bancorp(Fifth Third Securities)
The Ohio Company (and itssub: Cardinal ManagementCorp)
Yes 6/1/98 approve acquisitionof Ohio Company;granted Tier IIauthority
First Chicago NBD(First Chicago CapitalMarkets)
7/28/97 granted authority tounderwrite and dealin equity securities
First Security Corporation(First Security CapitalMarkets , Inc.)
Yes 12/97 granted Tier Iauthority
First Union Corporation(Wheat First Securities, Inc)
Wheat First Butcher Singer(will be merged with FirstUnion Capital Markets Corp.,asection 20 sub with Tier IIauthority)
11/26/97 approvedacquisition of WhatFirst
-39-
Table 7 Federal Reserve Board action on proposals affecting section 20 subsidiaries of bankingorganizations
BHC Name(Section 20 subsidiary)
Acquisition target Initialorder
FR PressRelease
Date
Action taken
Fleet Financial Group, Inc.(Fleet Securities, Inc)
Quick & Reilly Group, Inc(Fleet subs: JJC Specialist, NashWeiss, and U.S. Clearing Corpwill be merged with Fleet subs:Fleet Securities, Inc. and FleetClearing Corporation. FleetSecurities is a section 20 subwith authority to underwriteand deal in certain municipalrevenue bonds and commercialpaper. Sub will be renamedFleet Securities, Inc.)
1/14/98 approvedacquisition; increase from Tier Ito Tier II authority
KeyCorp(Key Capital Markets, Inc)
9/8/97 increase from Tier Ito Tier II authority
KeyCorp(McDonald Key Investments,Inc)
McDonald & CompanyInvestments, Inc(Will merge McDonald &Company with KCMI, a section20 sub with Tier II authority.Sub will be renmaed McDonaldKey Investments, Inc)
10/21/98 approvedacquisition ofMcDonald & Co
NationsBank(NationsBanc MontgomerySecurities)
Montgomery Securities & ThePyramid Company(Will merge Montgomery andPyramid with NCMI,a section20 sub with Tier II authority. Sub will be renamedNationsBanc MontgomerySecurities (NMSI)).
9/10/97 approvedacquisitions ofMontgomerySecurities, PyramidCompany
Norwest Corporation(Norwest InvestmentServices, Inc)
5/26/98 Increase from Tier Iauthority toauthority tounderwrite and dealin all types of debtsecurities on alimited basi
-40-
Table 7 Federal Reserve Board action on proposals affecting section 20 subsidiaries of bankingorganizations
BHC Name(Section 20 subsidiary)
Acquisition target Initialorder
FR PressRelease
Date
Action taken
Société Générale, (France)(SG Cowan SecuritiesCorporation)
Cowen & Co. and Cowen Inc.(Will transfer business ofCowen to Société GénéraleSecurities Corporation. Subwill be renamed SG CowenSecurities Corp.)
Yes 6/22/98 approve acquisitionof Cowen; grantedTier II authority
SunTrust Banks, Inc(SunTrust EquitableSecurities, Corp)
Equitable Securities Corp.(Equitable Securities will bemerged with SunTrust CapitalMarkets, a section 20 sub withTier I authority)
12/18/97 approvedacquisition ofEquitableSecurities; increasefrom Tier I to TierII authority
Swiss Bank Corporation(SBC Warburg Dillon ReadInc)
Dillon, Read Holding, Inc.(Dillon & Co will be mergedwith SBC Warburg, a section20 sub with Tier II authority. Survivor sub renamed SBCWarburg Dillon Read Inc)
7/28/97 approvedacquisition ofDillon & Co
U.S. Bancorp(U.S. Bancorp Investments,Inc)
Yes 11/26/97 granted Tier Iauthority
U.S. Bancorp(U.S. Bancorp Investments,Inc)
Piper Jaffray Companies, Inc(US Bancorp Investments willbe merged into Piper Jaffray byMarch 31, 1999)
4/20/98 approvedacquisition of PiperJaffray; increasefrom Tier I to TierII authority
Wachovia Corporation(Wachovia Capital Markets,Inc)
Yes 5/98 granted Tier Iauthority
-41-
Table 8. Acquisitions of Securities Companies by Bank Holding Companies Announced in 1997
Acquirer Target Announcement date
Bankers Trust NY CorpBB&T CorporationCommerce Bancorp, IncFifth Third BancorpFirst Union CorporationFleet Financial Group, Inc.NationsBankSunTrust Banks, IncU.S. Bancorp
Alex. Brown, IncCraigie IncA.H. Williams & Co., IncThe Ohio CompanyWheat First Butcher SingerQuick & Reilly Group, IncMontgomery Securities & The PyramidCompanyEquitable Securities Corp.Piper Jaffray Companies, Inc
4/06/975/01/97
11/04/9712/23/978/20/979/17/976/26/979/26/97
12/15/97
-42-
Table 9. Cumulative average abnormal returns around theannouncement of planned acquisitions of securities companies bybanking organizations in 1997
Cumulative average abnormal returns (CAAR)
Time Period CAAR Z-statistic % Positive
-1 to +1 -1.12% -1.88* 44
-1 to 0 -0.35% -0.89 56
-5 to +5 -1.52% -1.23 44
* = significant at the 10% level.
-43-
Table 10
Estimates of Portfolio Excess Returns: May 3, 1996 - November 18,1997
Rj, t ' "j % $jRm,t % *j)it % j16
k'1(j,kDk, t % gj, t for j ' sec20, non20
Variable BHCs with a Section 20 sub BHCs without a Section 20 sub
Coefficient
Test that the sumof excess returns
over event windowequal zero
(Wald Statistic)
Coefficient
Test that the sumof excess returns
over event windowequal zero
(Wald Statistic)
Intercept 0.0004 0.0006
Rmt 1.0154 *** 0.9059 ***
∆ it -0.0838 *** -0.0768 ***
July 30, 1996July 31, 1996Aug 1, 1996
0.0049 -0.0124 -0.0052
0.8160.0014
-0.0103 -0.0043
1.083
Oct 29, 1996Oct 30, 1996Oct 31, 1996
0.0056 0.0072 -0.0010
0.7220.0011 0.0065 0.0002
0.377
Dec 19, 1996Dec 20, 1996Dec 21, 1996
0.0178 ** 0.0067 -0.0031
2.4030.0142 **0.0094
-0.0060
1.970
Jan 3, 1997Jan 6, 1997Jan 7, 1997Jan 8, 1997
-0.0011 -0.0077 -0.0025 0.0024
0.304
0.0151 **-0.0068 -0.0047 0.0010
0.098
Aug 21, 1997Aug 22, 1997Aug 23, 1997
-0.0100 0.0038 -0.0037
0.512-0.0093 0.0000
-0.0067 1.611
adjR2 0.507 0.512
Notes: The model estimated corresponds to equation (3) in the text. The dependent variables for this two-equation systemare the equally weighted returns on a portfolio of BHCs with section 20 subsidiaries and on a portfolio of 12 large BHCswithout section 20 subsidiaries. Rmt is the equally weighted return on a market wide index of stocks and ∆i denotes thedaily change in the rate on 10-year U.S. government bonds. The dates appearing in the table represent binary variables (Dk)and are set equal to one for that date and zero otherwise. The two equations were estimated using the seemingly unrelatedregression method with data from May 3, 1996 to November 18, 1997. The Wald test statistic, which follows a P2
distribution, tests the hypothesis that the sum of the excess returns over the event window equals zero. *** = significant atthe 1-percent level. ** = significant at the 5-percent level. * = Significant at the 10-percent level.
-44-
Appendix I
Individual BHC Excess ReturnsDecember 20th Event Date
FirmEvent Window
Two-day Three-day
1 0.0226 0.0030
2 0.0625*** 0.0983***
3 -0.0198 -0.0138
4 0.0275* 0.0270
5 0.0421** 0.0293
6 0.0266 0.0214
7 0.0301 0.0265
8 0.0377* 0.0417*
9 0.0356 0.0231
10 0.0220 0.0267
11 0.0408* 0.0247
12 0.0720*** 0.0431*
13 0.0260 0.0206
14 0.0202 0.0270
15 0.0511*** 0.0410*
16 0.0408** 0.0383
17 0.0525*** 0.0437*
18 0.0294* 0.0263
19 0.0318* 0.0246
20 0.0250 0.0284
21 0.0385* 0.0378
22 0.0059 0.0013
23 0.0498** 0.0417
24 0.0489** 0.0637**
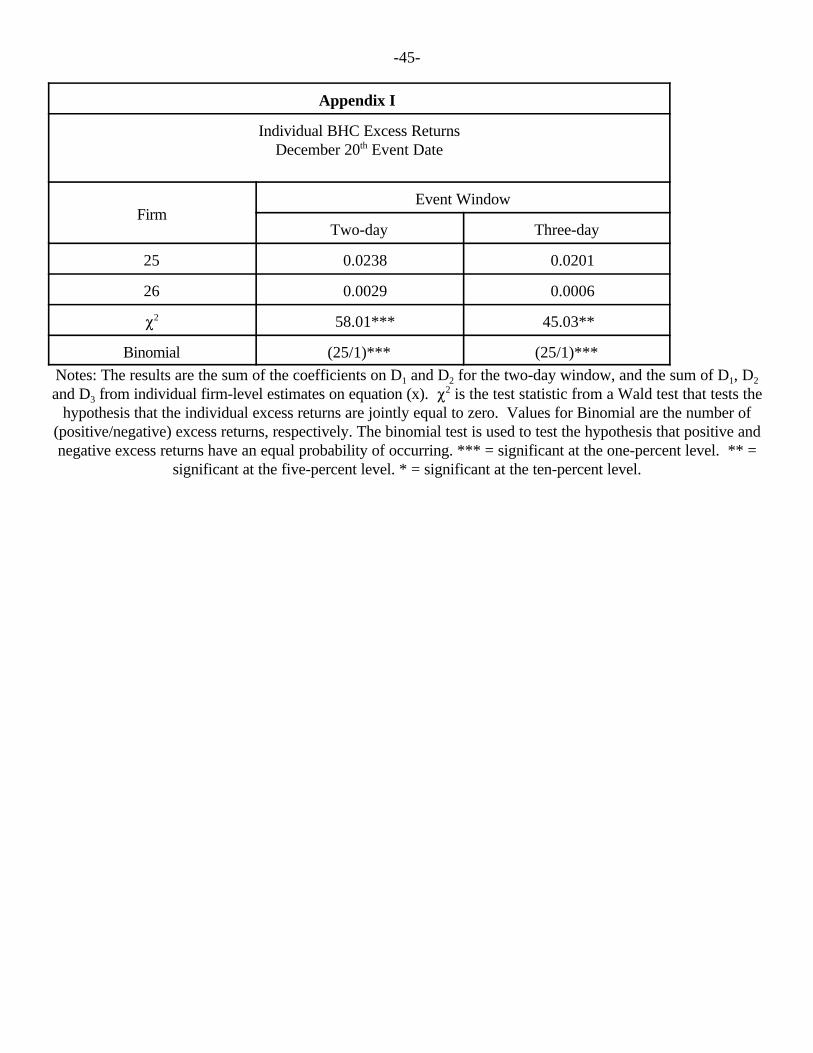
-45-
Appendix I
Individual BHC Excess ReturnsDecember 20th Event Date
FirmEvent Window
Two-day Three-day
25 0.0238 0.0201
26 0.0029 0.0006
P2 58.01*** 45.03**
Binomial (25/1)*** (25/1)***
Notes: The results are the sum of the coefficients on D1 and D2 for the two-day window, and the sum of D1, D2
and D3 from individual firm-level estimates on equation (x). P2 is the test statistic from a Wald test that tests thehypothesis that the individual excess returns are jointly equal to zero. Values for Binomial are the number of
(positive/negative) excess returns, respectively. The binomial test is used to test the hypothesis that positive andnegative excess returns have an equal probability of occurring. *** = significant at the one-percent level. ** =
significant at the five-percent level. * = significant at the ten-percent level.