Embed Size (px)
Citation preview
PRELIMINARY: NOT FOR QUOTATION OR CITATION
THE DISTRIBUTION AND DETERMINANTS OF JOB VACANCIES:
EVIDENCE FROM THE 2001 EMPLOYERS SKILL SURVEY
Andy Dickerson
Second Draft: January 2003
Abstract Despite their obvious importance for employment determination and the operation of labour markets, little is known about the distribution, nature or determinants of job vacancies. This paper describes and analyses the results of a large-scale establishment-level survey for England conducted in Spring 2001. It documents the distribution of unfilled jobs and investigates the factors which influence firms’ recruitment practices and difficulties in a period of strong labour demand. While there is considerable heterogeneity in the stock of vacancies, it is possible to identify a downward sloping UV relationship between vacancies and the local unemployment rate.
JEL Classification: J2, J6. Keywords: job vacancies, skill-shortages, labour demand, local unemployment, UV curves. Acknowledgements: The 2001 Employers Skill Survey was commissioned by the Department for Education and Skills and I would like to thank them for allowing me to use these data. However, they bear no responsibility for the analyses or interpretations presented in this paper. Address for Correspondence: Andy Dickerson, Institute for Employment Research, University of Warwick, Coventry CV4 7AL. tel: +44 24 765 22672; fax: +44 24 765 24241; email: [email protected]
Executive Summary
• In contrast to the considerable microeconomic and macroeconomic literature on unemployment, surprisingly little is known regarding job vacancies. This paper uses data from a representative survey in Spring 2001 of over 27,000 establishments in England to investigate the distribution and determinants of job vacancies, with a particular focus on the impact and importance of local labour market conditions.
• At the time of the survey, 14.5% of establishments had at least one vacancy,
with 2.7% of jobs unfilled, as compared to the unemployment rate of 4.9%. Due to the tendency for larger establishments to be more likely to have vacancies, 44.2% of workers were employed in establishments that had at least one unfilled job.
• The survey enables general vacancies to be distinguished from those that are
hard-to-fill and also those that are unfilled due to skill-shortages amongst the applicants. Approximately 4% of establishments had skill-shortage vacancies, and around 20% of jobs available remained unfilled due to skill-shortages.
• The variation in vacancies between regions is much smaller than the variation
within regions. In part, this is a result of such a large proportion of establishments having a vacancy rate of zero irrespective of region. However, even considering only those establishments with some vacancies, (conditional) vacancy rates vary much more within than between regions. The same conclusion holds for within-and-between comparisons for industries and sectors.
• A model is specified for the joint determination of any vacancies (vacancy
incidence) and the conditional vacancy rate (vacancy propensity). Firm, establishment, industrial and local labour market characteristics are all found to be significantly related to the vacancy incidence and the vacancy propensity. Differences in vacancy incidence and vacancy rates by establishment size are particularly notable. However, there still remains considerable variance in vacancies that cannot be accounted for by the observable and measurable differences between establishments. This is perhaps unsurprising given that, in aggregate, the stock of vacancies is of the same order of magnitude as the inflow and outflow of vacancies – there is considerable turnover in the labour market.
• Despite the wide variance in vacancy rates, a statistically significant negatively
sloped relationship between total vacancies and local unemployment can be identified at the establishment level. While still significantly negatively, this relationship is weaker for hard-to-fill and skill-shortage vacancies in particular. This finding accords with expectations since these are exactly the vacancies that the unemployed are least likely to be qualified for. The negatively sloped UV relationship is strongest and steepest for non-skill shortage vacancies, which comprise the majority of all vacancies as noted above.
The Distribution and Determinants of Job Vacancies: Evidence from ESS2001
1
THE DISTRIBUTION AND DETERMINANTS OF JOB VACANCIES:
EVIDENCE FROM THE 2001 EMPLOYERS SKILL SURVEY 1. Introduction and Background In contrast to the considerable microeconomic and macroeconomic literature on
unemployment, surprisingly little is known about the distribution and determinants of
job vacancies1. Yet the supply of job opportunities is clearly crucially important to the
understanding why some individuals are unable to secure employment. Moreover,
the distribution and character of vacancies provide important indicators of the
operation of labour markets. If vacancies are prevalent despite a supply of
unemployed individuals, this may be interpreted as evidence of mismatch especially
with regard to the skills and competencies of the unemployed and the technical
requirements of the unfilled jobs. Alternatively, it could indicate problems with the
operation of the local labour market in terms of allocating workers to jobs and jobs to
workers – such as poor individual job search effectiveness and/or failures in the
recruitment strategies of companies. Other explanations for the coexistence of
vacancies and unemployment include: temporal misallocations arising through
sluggish adjustment and change especially in periods of rapid workplace
developments, which may be exacerbated by more macro-based persistence effects
in unemployment; occupational or geographical immobility - perhaps related to local
costs, relative wages and rigidities associated with housing ownership and prices;
high reservation wages amongst the unemployed relative to the employment
opportunities available; and functional differences in the geographical identification of
‘local’ labour markets (particularly for vacancies) especially in regions with high levels
of commuting. Of course, these various explanations may be complementary rather
than competing hypotheses for the coexistence of ‘jobs without workers’ and ‘workers
without jobs’. Thus the distribution and determinants of vacancies, and their
relationship with unemployment can reveal much about the operation of the labour
market, particularly perhaps at the local level.
1 A recent notable exception which examines the propensity for establishments to have skill-shortage and hard-to-fill vacancies, as well as recruitment difficulties, is Haskel and Martin (2001).
The Distribution and Determinants of Job Vacancies: Evidence from ESS2001
2
At the macroeconomic level, until very recently, the aggregate number of vacancies
in the UK was derived from the number of vacancies which had been notified to the
Employment Service (ES) by employers who contacted Jobcentres. Occasional
surveys have indicated that approximately one-third of all vacancies nationally are
thus recorded (and around one quarter of all engagements are made from
Jobcentres) 2. Figure 1 graphs the monthly stock of vacancies series from January
1990 to April 2001. Vacancies are roughly pro-cyclical and are clearly negatively
related to the stock of unemployment as can be seen. This aggregate relationship
underpins the literature on Beveridge or UV curves. Vacancy inflows and outflows
during this period are relatively stable, however, and display little evidence of
cyclicality. They both average around 200,000 per month, and thus are of the same
order of magnitude as the average stock of vacancies over the period. Since April
2001, publication of the vacancy series has been suspended due to wide-scale
administrative changes in the way in which ES records vacancies3.
This paper utilises data from a representative survey of over 27,000 establishments
in England undertaken in Spring 2001 to investigate the distribution and determinants
of job vacancies at the microeconomic (establishment) level, with a particular focus
on the impact of local labour market factors. The survey has two major advantages
over the aggregate vacancy series. First, it provides a more detailed and
disaggregate picture of vacancies which is representative of all job openings rather
than just those which are notified to Jobcentres. As Birtwhistle (2001) notes,
Jobcentre vacancies are skewed towards the lower end of the market with greater
2 Similarly, both the US and Canada publish a ‘help-wanted index’ which records the volume of jobs that are advertised. These aggregate series are clearly useful in the analysis of trends in vacancies and vacancy rates in the absence of any structural changes in the way in which employers’ recruitment strategies are operated. However, this may be a fairly bold assumption since recent years have seen a number of significant changes in the recruitment strategies of both large and small firms. For example, the use of the internet for advertising vacancies, and the increasing usage of recruitment agencies will undoubtedly had an impact on the ways in which companies report vacancies. In any event, the aggregate series are clearly a very imperfect measure of the actual number of vacancies. 3 The introduction of Employer Direct, which involves transferring the vacancy recording process from local Jobcentres to regional Customer Service Centres, has led to a discontinuity in the series. Moreover, figures for Northern Ireland had been unavailable since March 1999 due to problems which arose with the introduction of a new system for processing vacancies there (Birtwhistle, 2001). Finally, ONS has very recently commenced a new quarterly survey of employers to directly measure vacancies in the whole economy (Machin and Christian, 2002).

The Distribution and Determinants of Job Vacancies: Evidence from ESS2001
3
turnover and are not typical of all jobs (or vacancies) in the whole economy4.
Secondly, the survey enables general vacancies to be distinguished from those that
are hard-to-fill and also those that are unfilled due to skill-shortages amongst the
applicants5. Clearly, the nature of the jobs available will be an important factor in
determining the efficacy and efficiency with which the labour market can fill
vacancies.
The first task of the paper is to describe the distribution and type of vacancies that
exist as revealed by the 2001 Employers Skill Survey (ESS2001). Establishment
level vacancy incidence and vacancy rates are presented, disaggregated across a
number of dimensions such as region and industry. The second task is to investigate
the determinants of vacancies, and in particular the UV relationship at the local level,
while taking account of the characteristics of the establishment and the local labour
market which may impinge upon this relationship. It is clear that workforce and
workplace factors as well as the nature of the local labour market can all potentially
affect the relationship between vacancies and unemployment as depicted in the local
UV curve6.
Thus, as well as documenting the distribution of vacancies, the paper estimates a
model for the joint determination of any vacancies (vacancy incidence) and the
conditional vacancy rate (vacancy propensity). Firm, establishment, industrial and
local labour market characteristics are all found to be significantly related to the
4 For example, around one third of all vacancies notified to Jobcentres in the year to October 2000 were in the distribution, hotels and restaurant industry. 5 Skill-shortage vacancies are defined as those that the respondents’ state are hard-to-fill because of low numbers of applicants with the required skills, work experience or qualifications that the company demands. For consistency, this is the definition of skill-shortage vacancies used in all previous analyses using the Employers Skill Surveys (see, Hogarth et al, 2001, Bosworth et al, 2000a, 2000b, inter alia). 6 Conventionally, Beveridge curves are specified with unemployment being a function of the vacancy rate (and other variables) – so that the causality implicitly runs from higher (lower) vacancies leading to lower (higher) unemployment. However, it has been recognised that the causality could be reversed – that where unemployment is low, vacancies may be high because of a shortage of workers, or that vacancies and unemployment may be simultaneously determined. Nevertheless, certainly at the aggregate level, recent research indicates that the potential simultaneity between unemployment and vacancies does not appear to seriously bias the coefficients of the estimated UV relationship (Nickell et al, 2002). Moreover, given that the analysis in this paper is at the micro-level, the local area unemployment rate can be reasonably taken as given rather than jointly determined with the level of vacancies at the establishment.
The Distribution and Determinants of Job Vacancies: Evidence from ESS2001
4
vacancy incidence and the vacancy propensity. Differences in vacancy incidence and
vacancy rates by establishment size are particularly notable. However, despite
having a large number of explanatory variables, there still remains considerable
variance in vacancies that cannot be accounted for by the observable and
measurable differences between establishments. This is perhaps unsurprising given
that, in aggregate, the stock of vacancies is of the same order of magnitude as the
inflow and outflow of vacancies.
Despite the heterogeneity in vacancies, a statistically significant negatively sloped
local UV curve can be identified at the establishment level. This relationship is robust,
although it is weaker for hard-to-fill and skill-shortage vacancies. This finding accords
with our expectations since these are the vacancies that the unemployed are least
likely to be qualified for. The negatively sloped UV relationship is strongest and
steepest for non-skill shortage vacancies, which comprise the majority of vacancies,
and perhaps more closely represent normal labour turnover. One implication of this
finding is that even at a time of tight labour markets as in Spring 2001 (or even
arguably at full-employment and an excess demand for labour), local labour markets
appear to operate in fairly conventional ways as far as the supply of workers and the
supply of jobs is concerned.
The remainder of the paper is organised as follows. Section 2 briefly reviews the
theoretical and empirical literature on vacancies and the relationship between
vacancies and unemployment. Section 3 documents the distribution of vacancies
across regions, industry, sector etc before describing the empirical modelling strategy
that this distribution suggests. Section 4 discusses the determinants of vacancies
and presents the empirical estimates of the joint determination of vacancy incidence
and vacancy propensity at the establishment level. Finally section 5 concludes.
2. Some Theory and Previous Evidence on Vacancies and Unemployment Modern theories of the relationship between unemployment and vacancies are
mainly derived from the notion of a matching function. Petrongolo and Pissarides
(2001) present a recent and comprehensive survey of the theoretical and empirical
The Distribution and Determinants of Job Vacancies: Evidence from ESS2001
5
literature. A matching function, M, is a relationship between the number of job
matches or hires (denoted M), the number of vacancies currently available (denoted
V), the number of unemployed workers looking for jobs (denoted U), and perhaps
some other factors (X say), which impact upon the matching process and influence
the degree of ‘mismatch’ between the unemployed and the stock of vacancies. These
additional factors may include search intensity, geographic mobility, measures of
skills and skill requirements etc. The matching function can thus be written as:
M = M(V, U, X),
with MV > 0 and MU > 0, so that the greater the number of vacancies, or number of
unemployed workers, the higher the expected number of matches/hires in any time
period. M is typically specified to be Cobb-Douglas in form and the rate of job
matching can therefore be expressed in terms of a log-linear function of the
unemployment and vacancy rates. In steady-state equilibrium, the number of
matches is equal to the number of job separations (the number of quits plus fires)
which is usually assumed to be some constant proportion of employment reflecting
an exogenous quit rate. Thus, given X and a fixed job separation rate, this yields an
inverse relationship between the vacancy rate and the unemployment rate which is
usually termed the Beveridge or UV curve. The X factors then serve to locate the
curve in unemployment-vacancy space.
Two empirical estimation strategies have been employed in the literature on
matching functions. First, there are a large number of direct estimates of matching
functions utilising data on hiring rates, vacancies and unemployment. The empirical
evidence from aggregate and disaggregated time-series studies tends to suggest
that matching functions exhibit constant returns7. Estimates for local labour markets
in Britain include Coles and Smith (1996) who estimate using cross-section data
across travel-to-work areas (TTWAs) and Bennet and Pinto (1994) who utilise time-
series data for the former Training and Enterprise Councils (TECs) areas. Both
studies find evidence in favour of a constant returns matching function with a
negative relationship between unemployment and vacancies at the local labour
market area level.
7 See, for example, Pissarides (1986), Blanchard and Diamond (1989) and Coles and Smith (1996), and, in particular, the survey of evidence presented by Petrongolo and Pissarides (2001).
The Distribution and Determinants of Job Vacancies: Evidence from ESS2001
6
Second, in the absence of data on hiring rates, there are also some estimates of the
UV relationship assuming steady-state equilibrium in the labour market and thus
constant hiring and separation rates. Wall and Zoega (2002) impose the steady-state
assumption and constant returns to estimate UV curves for the 10 standard regions
and for Britain as a whole. Using time-series and cross-section county-level data,
their main interest is in shifts in Beveridge curves, and in particular, whether these
are due to structural changes as the theoretical literature presumes8, or whether they
may also shift over the business cycle9. In aggregate, they find a statistically
significant negative relationship between unemployment and vacancies. However, for
the 10 regions separately, six display a positive UV relationship, and only four
negative. None are significantly different from zero. In summary, the extant empirical
evidence on the relationship between vacancies and local unemployment is not
conclusive.
There has been very little previous research which focuses on the determinants of
vacancies. In part, this is undoubtedly due to the paucity of data on vacancies and
vacancy rates. The matching function literature and estimates of the Beveridge curve
typically take the number of vacancies, or the vacancy rate, as given. In this paper,
an important objective is to investigate the determinants of vacancies at the
establishment level. Previous studies include Haskel and Martin (2001) (UK), Holzer
(1994) (US), and Morissette and Zhang (2001) (Canada). The analysis in the
following sections is most closely related to that of Holzer (1994) in that the concern
here is with both vacancy incidence and vacancy rates. However, in distinguishing
between the various types of vacancies (hard-to-fill and skill-shortage vacancies in
particular), there are clearly parallels with the recent work of Haskel and Martin
(2001) who utilise 1991 Employee Manpower and Skills Practices Survey (EMSPS)
8 For example, hysteresis-type effects may shift the Beveridge curve due to the adverse effect on the search effectiveness of the unemployed because of long and/or multiple spells of unemployment. These denude their work skills and their attractiveness to employers, which thereby affects the matching rate between the unemployed stock and the vacancies available. 9 In particular if vacancies adjust more quickly than unemployment or if on-the-job search has a cyclical component, then the matching function (and hence the Beveridge curve) may shift with the cycle. Their main conclusion is that there has indeed been considerable movement in the Beveridge curve over the business cycle in Britain over the last 25 years, which has important implications for the understanding of the persistence of unemployment.
The Distribution and Determinants of Job Vacancies: Evidence from ESS2001
7
together with the 1990 Workplace Employee Relations Survey (WERS). However,
comparisons are difficult because the definitions of hard-to-fill and skill-shortage
vacancies are rather different between the EMSPS and the ESS2001 data used in
this paper.
3. Data, Definitions and Modelling Strategy In this paper, the primary dataset used is the 2001 Employers Skill Survey
(ESS2001) – see Hogarth et al (2001) for further details. This is a telephone survey
of approximately 27,000 establishments in England conducted mainly during Spring
200110. The overall response rate from employers was 53%. Variable sampling
fractions across regions, industrial sector and establishment size were used and, on
the basis of the achieved sample, appropriate weights were subsequently
constructed so that the achieved sample can be grossed-up to be representative of
the population of just over 2 million establishments in England. The grossed-up
distribution of establishments and employment by establishment size bands is
presented in Table 1 together with the number of sample observations in each size
band. While establishments employing fewer than five workers comprise 72% of all
establishments, they only account for around 11% of employment. At the other end of
the scale, only 0.14% of establishments employ 500 or more workers, but more than
15% of employment is located in these establishments. As shown in the final column
of Table 1, and as in common in establishment surveys, larger establishments were
‘over-sampled’ relative to their distribution in the population in order to more
accurately capture the establishment characteristics of the relatively large proportion
of employment that is located in these few establishments.
In the analysis that follows, establishment-weighted and employment-weighted
statistics are carefully distinguished. In this paper, primary interest is in the
determinants of vacancies at the establishment level and hence establishment-
weighted estimates are the main focus. However, in this section, which comprises
mainly descriptive analysis, both employment-weighted and establishment-weighted
10 ESS2001 was commissioned by Department for Education and Skills, designed and coordinated by the Institute for Employment Research (IER), University of Warwick, and conducted on their behalf by IFF Research Ltd.
The Distribution and Determinants of Job Vacancies: Evidence from ESS2001
8
statistics are presented for comparative purposes. The choice between the two units
of analysis – whether establishment-based or employment-based – is important and
is related to the issue of weighting. The difference between these two alternatives is
perhaps best understood with an example. The average vacancy rate can be
measured in two ways. If workers selected at random from the workforce are asked
how many vacancies there are at their workplaces, and how many employees, then
the ratios of the two will yield the employment-weighted average vacancy rate.
However, if only randomly selected establishment managers are asked how many
vacancies there are their workplaces and how many employees, then the ratio of
these will provide the establishment-weighted average vacancy rate. The difference
is that in the first case, larger establishments are more likely to be sampled since
they have more employees, whereas in the second case, all establishments have an
equal change of being sampled. The choice between the different weighting
strategies - employment or establishment - depends on the questions being asked11.
If the analysis is primarily concerned with documenting how many vacancies there
are, then the appropriate weighting is by employment. However, if the analysis is
concerned with the circumstances under which vacancies are generated and/or filled
(or remain unfilled), then an establishment-based approach is arguably of greater
interest since this is the relevant unit of analysis (eg for HRM policies and practices)
at which any mismatch between the skills of the applicants and the requirements of
the jobs would be identified. The establishment (or firm) is also the level at which at
which vacancies are initially identified, notified/advertised and filled, and hence any
analysis of the determinants of vacancies is most usefully conducted at the
establishment level. In contrast, the employment-level analysis is more useful for
describing the aggregate and disaggregate statistics on the distribution of vacancies
and the average vacancy rate within the workforce.
11 Note that this weighting ensures that the ESS2001 sample distribution is the same as the population (England) from which it was drawn despite the quota-based sampling strategy used to compile the ESS2001 (see Hogarth et al, 2001 for further details). That is, in both employment-weighted and establishment-weighed reweighting schemes, the resulting estimates will be representative of the population – of the employed and of all establishments respectively – in England as a whole.
The Distribution and Determinants of Job Vacancies: Evidence from ESS2001
9
3.1 Vacancies and Vacancy Rates: Definitions The initial task in this paper is to examine the distribution of vacancies of varying
types as identified by the respondents in the ESS2001. First, for total vacancies, the
question asked in the ESS2001 survey was (question D2):
“How many vacancies, if any, do you currently have at this establishment?”
Note that the question does not distinguish between internal or external vacancies,
nor is it prefaced or followed by questions which determine whether these ‘vacancies’
have actually been advertised (either internally or externally), and/or whether the
establishment/firm has actively engaged in any recruiting activity to fill the vacancies.
Vacancies are therefore less well-defined in ESS2001 when compared to some other
surveys which have been rather more explicit in their definition and identification of
vacancies. For example, the recent (1999) Canadian Workplace and Employee
Survey (WES) - as discussed by Morissette and Zhang (2001) - asked respondents
first whether vacancies were usually staffed from within or outside the workplace, and
then whether there were any vacancies “that the workplace was currently trying to
fill”, and if so, how many. Similarly, the UK’s National Survey of Engagements and
Vacancies (1977) defined a vacancy as a job which “is currently vacant, available
immediately and for which the firm has taken some specific recruiting action during
the last four weeks” (reported in Jackman et al, 1989). The Canadian Job Vacancy
Survey 1971-78 took a similar definition (although, in contrast, the more recent WES
explicitly does not since its responses include vacancies that are only available to
applicants from within the workplace/firm). Finally, the new ONS Vacancy Survey
(VS) (Machin and Christian, 2002) defines a vacancy as a position which is available
to suitable candidates from outside the business or organisation concerned, and for
which the employer has taken ‘active steps’ (such as advertising, notifying a
Jobcentre or private employment agency etc) to fill.
Hillage et al (2002) document a qualitative investigation of respondents’ interpretation
of ‘vacancies’ (and some other terms and definitions) in the 2002 Employers Skill
Survey which asked identical questions with regard to vacancies to those in
ESS2001. A small number of follow-up interviews were undertaken with survey
respondents in an attempt to investigate the validity and reliability of the data series.
The evidence from these follow-up interviews is encouraging in that a relatively
unambiguous view emerged and, in particular, the interviewees had a fairly clear idea
The Distribution and Determinants of Job Vacancies: Evidence from ESS2001
10
of what constituted a vacancy12. This focus on the definition of a vacancy is important
since the economic concept of a vacancy is that of a job which is unfilled and
available to external applicants. Clearly, perhaps especially in larger establishments
and firms, some vacancies may be effectively reserved for incumbents and thus the
ESS2001 may overstate the number of jobs available to unemployed workers. On the
other hand, as noted by Ostry and Sunter (1970), requiring employers to be engaged
in some recruiting activity may exclude some genuine vacancies since some
employers will have stopped looking because of their previous lack of success in
trying to recruit – a similar concept to the discouraged worker effect when recording
unemployment under the standard ILO definition. Moreover, in multi-establishment
firms/organisations, the establishment respondent may be unaware of the
recruitment strategies conducted by their ‘head-office’. Finally, at the establishment
level, the locus of responsibility may be such that while the respondent considers
there to be a need for more staff, those ultimately in charge of recruitment may not
be similarly inclined. Thus the ESS2001 will record these vacancies while other
surveys would fail to do so. These ambiguities in the measurement of vacancies in
ESS2001 need to be considered when assessing the conclusions and implications of
the analysis presented below. However, clearly the findings presented by Hillage et
al (2002) lend greater confidence to the interpretation and analysis of the ESS2001
vacancy data.
In order to directly assess and to validate the measures of vacancies analysed in this
paper, it is useful to compare the number of vacancies in ESS2001 with the
aggregate series previously available from the ES. As noted in the introduction, this
latter series has now been discontinued, but the latest figure published for April 2001
coincides roughly with the date that ESS2001 was being completed13. At that time,
the stock of vacancies notified to Jobcentres for the UK was recorded as 387,800.
The ES estimates that approximately one third of all vacancies are notified to
Jobcentres, so this yields an estimated 1.16 million vacancies for the UK.
Approximately 85% of the UK economically active population is resident in England 12 Generally, there was a degree of formality attached to it: there was a specific slot to fill, which may have required approval, especially where there was a defined staffing level or establishment. A vacancy referred to a permanent position and involved active recruitment, rather than taking people ‘on spec’. 13 The ESS2001 fieldwork was conducted from November 2000 to April 2001.

The Distribution and Determinants of Job Vacancies: Evidence from ESS2001
11
according to the LFS. Applying this proportion, the estimated stock of vacancies in
Spring 2001 in England is approximately 1 million. The grossed-up estimate for
England from ESS2001 is 0.77 million vacancies, which, while of the same order of
magnitude, is somewhat lower14. This divergence may reflect the particular nature of
vacancies typically notified to Jobcentres as noted above, with the implication that
grossing-up the ES figures in the manner described above will overestimate the total
stock of vacancies in the whole economy.
An explicit comparison of the vacancy statistics in ESS2001 and in the new ONS VS
is presented in Machin and Christian (2002). The VS figures refer to the period April
to June 2001 and so again are roughly comparable in terms of the timing of the two
surveys. Once adjustments for the different regional and sectoral compositions of the
two surveys have been made, the total number of vacancies reported in ESS2001
appears to be roughly 40% above the comparable figure from the ONS VS. Machin
and Christian (2002) conclude that this is probably mainly due to the lack of a formal
definition of a vacancy in ESS2001. However, as they show, the distribution of
vacancies by industry in the two surveys is remarkably similar.
Two sub-categories of total vacancies are also separately identified in ESS2001 –
namely hard-to-fill vacancies and of these, those that are hard-to-fill because of skill-
shortages. Similar problems to those noted above for total vacancies arise with the
definition of hard-to-fill vacancies. The relevant question in ESS2001 is (question
D6):
“Are any of the vacancies you currently have for (occupation) proving hard-to-fill?”
Again, there is no clear definition provided of ‘hard-to-fill’ and clearly this is open to
interpretation by the respondents15. Those vacancies that are not hard-to-fill are
14 However, a more recent estimate of the proportion of vacancies notified to Jobcentres by Machin and Christian (2002) for May 2002 using the new ONS VS is 44%. Applying this figure to the ES Jobcentre total would yield 0.88 million vacancies for the UK, and hence an estimate of 0.75 million vacancies for England - remarkably close to the 0.77 million vacancies recorded in ESS2001. 15 However, subsequent to ascertaining how many hard-to-fill vacancies there are for each occupational category, respondents were asked how long the vacancies had lasted. This information could be used to more clearly identify the concept of a hard-to-fill vacancy and to provide consistent and comparable definitions between respondents. Nevertheless, to facilitate comparisons with previous analyses of ESS2001 (especially Green and Owen, 2002), and with the analyses of the previous Employers Skill Survey (ESS1999 – see
The Distribution and Determinants of Job Vacancies: Evidence from ESS2001
12
denoted non-hard-to-fill vacancies. Finally, skill-shortage vacancies are defined as
hard-to-fill vacancies which are skill related in that at least one of the following
causes were cited by the respondent (question D12): low number of applicants with
required skills; lack of work experience the company demands; lack of qualifications
the company demands. The complementary set of vacancies are denoted non-skill-
shortage vacancies.
While there are inherent weakness in the data due to the interpretations that
individual respondents may have given to the questions regarding vacancies and
their nature, an important advantage of the ESS2001 is that the questions were
asked of a large number of establishments across spatial and industrial groups and
different establishment sizes. Moreover, the ESS2001 sample is representative of all
establishments and employment in England at the survey date. Hence, the findings
reported below are unlikely to be adversely affected by any particular systematic bias
for certain types of establishments to over or under-report the number of ‘vacancies’
actually available to unemployed individuals, or to utilise systematic differences in
their classification of ‘hard-to-fill’ vacancies etc. Thus we can be reasonably confident
in the distribution of vacancies that the data reveal.
The establishment-level vacancy rate is defined as the fraction of unfilled jobs (i.e.
vacancies) out of the total number of jobs at the establishment, where the latter is the
sum of current employment and vacancies. That is, the vacancy rate, v, is defined as
v = V/(E+V) where V is the number of vacancies and E is current employment16.
Bosworth et al, 2000a; 2000b), throughout this paper the simple response to question D6 is used despite the potential differences in interpretation between respondents. 16 Holzer (1994), Statistics Canada (reported in Morisette and Zhang, 2001, p.2, fn.4) and Morissette and Zhang (2001) all utilise this definition of the vacancy rate: “Vacancy rates are thus defined as the fraction of vacancies out of total jobs in the firm, where the latter is the sum of current employment and vacancies” (Holzer, 1994, p.21); “The vacancy rate - the number of job vacancies divided by the number of jobs (where the latter is the sum of the level of employment and the number of vacancies) …”, (Morissette and Zhang, 2001, p.2, fn.4). However, Green and Owen (2002), use vacancy density, defined as V/E, as their measure in order to maintain comparability with previous analyses of the ESS1999 data. Clearly, at the margin, for large establishments, whether vacancy rates or densities are used makes little difference to the calculated vacancy intensity. However, for small establishments (which dominate the population of establishments as seen in Table 1), large differences in the reported vacancy rates are produced if the alternative vacancy density measure is used. For example, suppose that an establishment has four jobs, one of which is currently vacant.
The Distribution and Determinants of Job Vacancies: Evidence from ESS2001
13
Separate vacancy rates are calculated for all vacancies, and the two complementary
paired sub-categories of hard-to-fill and non-hard-to-fill vacancies, and skill-shortage
and non-skill-shortage vacancies. Clearly the distribution of these sub-sets of
vacancies and their determinants may be rather different from that for vacancies as a
whole, and hence these different categories of vacancies are also investigated
separately in the following analysis.
3.2 Vacancy Incidence and Vacancy Rates: Descriptive Statistics 3.2.1 Vacancy Incidence Panel A of Table 2A reports the proportion of establishments in England reporting
any vacancies, any hard-to-fill vacancies, any non-hard-to-fill vacancies, any skill-
shortage vacancies and any non-skill-shortage vacancies. Panel A of Table 2B
reports the same vacancy incidence statistics but expressed as a proportion of total
employment in England. Thus Table 2A, column 1 reveals that 14.5% of
establishments reported that they had some vacancies, and these establishments
comprised 44.2% of employment as shown in Table 2B, column 1 (and thus 44.2% of
workers were working in an establishment with at least one vacancy). The remaining
columns show that 7.5% of establishments covering 22.1% of all workers had some
vacancies that were deemed by the respondents as being hard-to-fill, while 8.3% of
establishments covering 32.5% of employment had vacancies which were non-hard-
to-fill17. Similarly, 3.7% of establishments covering 10.7% of employment had some
vacancies which were hard-to-fill because of skill-shortages while 11.9% of
establishments employing 39.3% of all workers had some vacancies which were not
due to skill-shortages. As noted in Hogarth et al (2001), the statistics for hard-to-fill
and skill-shortage vacancies are slightly lower than the proportion of establishments
reporting such vacancies in ESS1999 once the smaller (less than 5 employees)
establishments which were not surveyed in 1999 are excluded. This fall in vacancy
incidence has occurred despite the fact that recorded unemployment in England fell
between the two survey dates.
Then the vacancy rate as used in this paper is 25%, while using density V/E as the measure yields 33%, a substantial over-estimate of the actual vacancy rate. 17 Note that these do not add to give the total in column 1 since several establishments have both hard-to-fill and non-hard-to-fill vacancies.

The Distribution and Determinants of Job Vacancies: Evidence from ESS2001
14
In order to assess the regional, sectoral and size composition of vacancy incidence,
the remaining four panels of Table 2A and Table 2B report the same measures of
vacancy incidence disaggregated by region (Panel B), main business activity (Panel
C), broad sector (Panel D) and establishment size (Panel E). The proportion of
establishments and of employment with some vacancies is marginally higher in the
south and east than in the north and west, with the West Midlands belonging to the
former cluster and the East Midlands with the latter. This weak regional pattern is
also broadly apparent in the distribution of the four sub-categories of vacancies – the
different measures are all positively correlated with each other and with the incidence
of any vacancies. This regional disparity would appear to be inversely related to the
regional unemployment rate (and non-employment rate), and this consistent with
what might be expected from a matching model/Beveridge curve explanation for the
relationship between vacancies and unemployment. The exceptions are London and
West Midlands which record both relatively high unemployment and non-employment
rates and a high propensity for establishments to report vacancies.
There is considerably more variation in the propensity of establishments to report
vacancies, and the type of vacancies they report, by business type than by region.
Around one quarter of education, health and social work, and public administration
establishments report that they have some vacancies, with a consequence that
between 50% and 60% of workers in those sectors are working in establishments
which are at less than full employment. Outside these public-sector establishments,
those in electricity and water supply and finance also have a high propensity to report
that they have some vacancies. In contrast, very few establishments in mining and
quarrying, agriculture and construction report that they have any vacancies.
The establishments in education and health and social work report that they have
vacancies that are particularly hard-to-fill – the probability of having such vacancies is
more than twice the national average in education. While there is no further
information to help identify these establishments, a strong possibility is that these
hard-to-fill vacancies are in schools (and colleges) and hospitals and reflect the
widespread and frequent reports of problems in recruiting teachers and nurses. While
these represent only a small proportion (2.28 + 4.37 = 6.6%) of all establishments,
they comprise a rather larger proportion of employment (7.33 + 10.34 = 17.7%) due
The Distribution and Determinants of Job Vacancies: Evidence from ESS2001
15
to their size. In the electricity and water supply industry, (0.075/0.215 =) 35% of
establishments which report that they have some vacancies record that some of
these vacancies are hard-to-fill due to skill shortages. However, this is a very small
sector both in terms of the number of establishments and the numbers employed in
those establishments. All three of these sectors also report that they have non-hard-
to-fill and non-skill-shortage vacancies at well above the average national rates.
Clearly, these sectors can be characterised as having recruitment difficulties.
This distribution in responses by business type is reflected in the sectoral propensity
to report vacancies as shown in the Panel D Table 2A and Table 2B. Almost one fifth
of establishments in the public sector have vacancies of some kind - this is a higher
proportion than even in the voluntary sector. Both sectors, but particularly the public
sector, would appear to have high turnover and/or recruitment difficulties relative to
the private sector – they both tend to have high levels of both hard-to-fill and non-
hard-to-fill vacancies, with those in the voluntary sector particularly hard-to-fill, mainly
due to skill-shortages amongst the applicants.
The final panel of Tables 2A and 2B decomposes vacancy incidence by
establishment size. Here the differences between the categories are considerable,
with smaller establishments having significantly lower incidence rates by
establishment and by employment as would expected. This is due at least in part to
the indivisibility of a ‘vacancy’18. The incident rates for all categories of vacancies
increase monotonically with establishment size. However, the relative increase in the
incidence of hard-to-fill and skill-shortage vacancies is rather less than their
complements of non-hard-to-fill and non-skill shortage vacancies respectively.
3.2.2 Vacancy Rates Tables 3A and 3B reports vacancy rates measured as a proportion of jobs in the
establishment as discussed above by establishment and by employment
respectively. Once again, the aggregate statistics are supplemented by a
decomposition by vacancy types and by region, business type, sector and
establishment size as above. Panel A records that the average establishment has a 18 That is, in a two-person establishment, the vacancy rate needs to be 50% before there is a vacancy available, whereas in a 100-person establishment, it only needs to be 1%.
The Distribution and Determinants of Job Vacancies: Evidence from ESS2001
16
vacancy rate of 4.2%, half of which are hard-to-fill vacancies, and just under half of
these are due to skill-shortages19. Thus, on average, approximately three-quarters of
vacancies at an establishment are not vacant due to skill deficiencies amongst the
applicants, but perhaps reflect underlying turnover and adjustment in the workforce.
In terms of aggregate employment however, the vacancy rate is rather lower at 2.7%.
This therefore implies lower vacancy rates at larger establishments in general. Over
80% of all vacancies are not related to skill-shortages.
As shown in Panel B of Tables 3A and 3B, average establishment-level vacancy
rates range from 2.3% in Yorkshire and Humberside to 5.7% in London, although as
a proportion of total employment, the range is rather narrower. Finance and business
service establishments have relatively high average vacancy rates, while primary
sector industries (agriculture, mining, electricity and water) have relatively low
average vacancy rates (Panel C of Table 3A). In terms of employment, however, it is
the hotels and restaurants sector which posts the highest vacancy rate: 4.1% of jobs
in that sector were unfilled at the time of the survey, most of which are unskilled
(Panel C of Table 3B). This may be a reflection of the high turnover rates
experienced in this industry. Establishments in the voluntary sector have the highest
average vacancy rates and the proportion of vacant positions at 4.1% was almost
double that of the public sector (Panel D of Tables 3A and 3B). Finally, as can be
seen in Panel E of Tables 3A and 3B, aggregate vacancy rates fall with increasing
establishment size as would be expected. However, there are differences between
the subcategories of vacancies; non-hard-to-fill and non-skill-shortage vacancy rates
are fairly constant (above the smallest size category), and the fall in aggregate
vacancy rates are thus driven by lower hard-to-fill and skill-shortage vacancy rates
for larger establishment. This may reflect the more extensive recruitment activities in
larger firms, as well as their ability to train existing staff and to move incumbents to
meet skills needs as they arise within their organisations. Smaller establishments are
at a clear disadvantage in all these respects.
There are clear and important differences in the propensity for establishments to
report that they have some vacancies and the vacancy rates they report. This is 19 Here, of course, the statistics do sum across the columns, since the two paired categories are mutually exclusive.
The Distribution and Determinants of Job Vacancies: Evidence from ESS2001
17
perhaps most clearly evident when we compare Panel D of Tables 2A and 2B and
Tables 3A and 3B. While the public sector has the highest proportion of
establishments with some vacancies (19.7%), and the highest proportion of workers
employed in establishments with some vacant positions (54.0%), it also has the
lowest average establishment-level vacancy rate (3.4%) and the lowest proportion of
unfilled jobs (2.2%). These differences are clearly most obviously related to
establishment size differences between sectors, but other factors are likely to be
important too as evidenced by the dissimilarities in the rankings of vacancy
propensities and vacancy rates between regions and business types. These
distinctions between vacancy propensities and vacancy rates in part determine the
modelling strategy utilised in the next section.
Further descriptive evidence on the distribution of the number of vacancies and
vacancy rates by establishment size is presented in Table 4. Vacancy frequencies by
establishment size, as well as the proportion of establishments reporting some
vacancies, the conditional mean number of vacancies and the vacancy rate for
establishments with some vacancies, and the mean vacancy rate across all firms in
each size category are reported. Table 4 reveals several important features. First,
most establishments, and the majority in every size category with less than 100
employees (which account for more than 98% of all establishments – see Table 1)
report no vacancies of any kind. This is illustrated clearly in Figure 2. Where
vacancies exist, they are few in number – typically just one or two jobs are available,
if any. The proportion of establishments with at least one vacancy increases with
establishment size, as does the conditional mean number of vacancies. However, the
number of vacancies available increases less rapidly than firm size with the
consequence that the conditional mean vacancy rate falls monotonically with firm
size. Thus in the smallest size category (1-4 workers), the average vacancy rate for
establishments with at least one vacancy is 48.8%, while for the largest size category
(500 or more workers), the average vacancy rate is only 2.9%. Even the
unconditional vacancy rate shown in the final row of Table 4 falls fairly consistently
with firm size.
These patterns in the probability of establishments having any vacancies, and in the
conditional vacancy rate are replicated a fortiori for hard-to-fill vacancies (illustrated
The Distribution and Determinants of Job Vacancies: Evidence from ESS2001
18
in Figure 3) and for skill-shortage vacancies (illustrated in Figure 4)20. The most
obvious explanation lies in the indivisibility of individual jobs coupled with the low
proportions of establishments with any vacancies. The larger the establishment, the
more likely it is that there is at least one vacant position, but when vacancies do
occur at smaller establishments, they will account for a larger fraction of the jobs than
in larger establishments. However, as noted by Holzer (1994), other factors are also
likely to be important. For example, larger establishments are more likely to have HR
departments and hence able to more clearly identify the existence of vacancies.
Finally, in order to more comprehensively illustrate its variation, the total variance in
the vacancy rate is decomposed into the between- and within- sub-category
proportions by region, business type, sector, establishment size and LLSC area. That
is, the variance in the vacancy rate across all establishments is calculated, and then
the extent to which this variance is a result of variation in establishments’ vacancy
rates within regions, or between regions (or business types, sectors etc) is computed.
Because the variance can be decomposed exactly into its between and within
contributions (see, for example, Cowell, 1995), then the proportions of the total
variation in the vacancy rates which is due to variation in the vacancy rate within
regions and due to the variation in the vacancy rate between regions (or business
types, sectors etc) can be calculated. This decomposition is presented for the overall
vacancy rate, for all establishments (unconditional vacancy rates - Table 5A), and
also for just those establishments with positive vacancy rates (conditional vacancy
rates - Table 5B).
A number of features of the variation in vacancy rates are revealed by this
decomposition. First, when measured across all establishments, almost all of the
variation in the vacancy rate is within- rather than between- sub-categories. This
implies that there is much more vacation in the vacancy rates between
establishments within any region (business type, sector etc), than there is between in
the vacancy rates between regions (business type, sector etc). This is perhaps
unsurprising, but the scale of the magnitude is notable. More than 99% of the
variation in the unconditional overall vacancy rates between establishments are
20 These results are available on request.
The Distribution and Determinants of Job Vacancies: Evidence from ESS2001
19
differences within regions, and less than 1% of the variation is between regions21.
One consequence of this finding is that differences between regions (or regional
effects) would be expected to account for very little of the variation in the vacancy
rate if all establishments are considered together. In part, this finding is a result of
such a large proportion of establishments having a vacancy rate of zero irrespective
of region.
When attention is restricted to those establishments with some vacancies (Table 5B),
a rather different picture is apparent. First, and as previously noted in the discussion
surrounding Table 4, conditional vacancy rates differ considerably between
establishment size groups: over two-thirds of the variance in vacancy rates is
between establishment size groups, and less than one-third is within size groups.
That is, there is considerably more variation in vacancy rates between size groups
than there is within size groups. However for all other sub-categories, the within-
category component still dominates the between-category component. One slight
exception is that, while there is still little variation in vacancy rates between regions,
there is a reasonable proportion between LLSC areas suggesting that the regional
dimension disguises differences in vacancy rates that exist at the sub-regional level.
3.3 Modelling Strategy Given that the vacancy rate can only be non-negative, together with the fact that
most establishments have zero vacancies implies that the estimation procedure
cannot be of the simple linear regression variety. The appropriate specification which
takes account of the clustering of a large proportion of observations at zero, together
with only positive values at the non-zero observations is the Tobit model. However,
the findings reported in Table 4 indicate that the influence of firm size on the
probability of an establishment having non-zero vacancies (vacancy incidence) is
positive, while its influence on the (conditional and unconditional) mean vacancy rate
(vacancy propensity) is negative, and this cannot be accommodated by the simple
Tobit specification which restricts the influence of any variable on both the probability
of a non-zero observation, and on its magnitude if non-zero, to be the same sign.
Clearly, there may be other variables which potentially have differential influences on 21 A similar conclusion holds for the sub-categories of hard-to-fill, non-hard-to-fill, skill-shortage and non-skill-shortage vacancies (results available on request).
The Distribution and Determinants of Job Vacancies: Evidence from ESS2001
20
the vacancy incidence and the conditional vacancy rate. In effect, two sets of
coefficients are required for each independent variable in any model of the
determinants of vacancies while the simple Tobit only yields a single effect.
An appropriate specification which does allow for the kinds of differential effects seen
for firm size is the modification of the Tobit model suggested by Cragg (1971)22. This
is a two equation model, defined as:
i i 1P(v 0) (X )> = Φ β (1)
i i i 2E(v | v 0) X> = β . (2)
where Φ is the CDF (cumulative density function, or distribution function) of the
standard normal distribution. The first equation represents the probability of an
establishment i having positive vacancies (or a positive vacancy rate since V > 0 and
v > 0 are clearly synonymous). Given the nature of the dependent variable (either 1
(=yes or 0 (=no)), we estimate this using a probit model. The second equation
specifies a model for the conditional vacancy rate (i.e. conditional on having some
vacancies, v > 0), and this is estimated using a truncated regression model given that
only positive observations on v are observed. If 1 2β = β , then the model becomes the
simple Tobit model. As seen above, given the differential impact of establishment
size on the vacancy incidence (i.e. probability of having any vacancies) and on the
vacancy propensity (i.e. vacancy rate), this restriction is not expected to hold.
However, this restriction is formally tested in the analysis that follows23.
Since the primary interest is in the relative importance of the determinants of vacancy
incidence and vacancy propensity, the marginal or partial effects for the regressors
are reported. For the probit specification, these are the magnitude of the impact of
the regressor on the probability of an establishment reporting any vacancies. For 22 The classical example in the literature, due to Lin and Schmidt (1984), is the ‘loss due to fire’ as a function of the ‘age of the building’. Newer buildings typically have a lower probability of having fires, but have a greater average loss when a fire does occur. 23 An alternative approach would be to estimate the two equations jointly so that the relationship between their error terms is explicitly modelled rather than ignored as here (see Greene, 2000). The resulting specification would be formally equivalent to the standard Heckman (1976) selection model or a Type-II Tobit model in the Amemiya (1985) classification system. One cost would be the identification restriction required (i.e. specifying variable(s) which determine the vacancy incidence but not the vacancy rate) and none is immediately obvious. However, consideration of this alternative econometric specification is an area for future investigation.
The Distribution and Determinants of Job Vacancies: Evidence from ESS2001
21
binary/dummy variables, since there cannot be a marginal change in, say, being in
the private sector, the change in the probability of having any vacancies for the
discrete change in the dummy variable from 0 to 1 is therefore calculated. In the
truncated regression, the marginal effects represent the impact on the log vacancy
rate and thus record the proportionate impact on the vacancy rate for a unit change
in the independent variable24.
Finally, in order to measure the overall impact of any particular variable X on the
vacancy rate, its impact on vacancy incidence and vacancy propensity need to be
combined. Differentiation yields:
1 1 1 2v (P(v 0) E(v | v 0)) (X ) E(v | v 0) P(v 0)X X
∂ ∂ > × >= = β φ β × > +β × >∂ ∂
(3)
where φ is the standard normal density function. These overall marginal effects are
also reported in the results in the following section.
4. The Determinants of Vacancies There are potentially a large number of variables that may contribute to differences in
the probability that an establishment has vacancies (i.e. vacancy incidence), and to
differences in the vacancy rate at the establishment if there are some vacancies (i.e.
vacancy propensity as measured by the conditional vacancy rate). However, no
attempt is made to hypothesise which factors may influence only the vacancy
incidence from those that may determine the vacancy propensity. Rather, a common
vector of variables is specified for both the probit and the truncated regression part of
the model. Given that in steady state, the vacancy rate is identically equal to the
product of the vacancy inflow rate and the average vacancy duration, factors which
affect either the number of vacancies or the duration of vacancies (or both) will
impact on the measured vacancy rate. A brief description and summary statistics for
the variables used in the empirical analysis is presented in Table A1.
24 The dependent variable in the truncated regression equation (2) is defined as log(1+v) in the empirical estimates presented below. This transformation reduces the skewness in the distribution of positive vacancy rates and ensures the continuity of the underlying latent variable (vacancy propensity) at v = 0.
The Distribution and Determinants of Job Vacancies: Evidence from ESS2001
22
4.1 Establishment and Firm Characteristics The first specification (specification A) simply includes a number of controls for firm
and establishment characteristics. The first group of variables control for differences
in establishment size. Rather than impose linearity or any other functional form on
the relationship between size and vacancy incidence and vacancy propensity, eight
grouped measures of establishment size (denoted esize1 to esize8 and defined as
previously) are included, with esize1 (1-4 employees) as the omitted (base) category.
Given the figures presented in Table 4, the expectation is that vacancy incidence will
increase and conditional vacancy rates will decrease with increasing establishment
size.
Secondly, a measure of the private/public status of the establishment is included.
Clearly, rather different processes (e.g. regarding planning horizons, financial
arrangements and constraints) may determine hiring and firing in the public and
private sector, and thus a dummy variable denoting private sector establishments
(private) will reveal what hiring and firing strategies have on vacancies - perhaps
because of differences in vacancy durations between public and private sectors.
Thirdly, a dummy variable is included for whether the firm is wholly or party foreign
owned (foreign). While this represents a relatively small proportion of establishments
in the population, it seems plausible that recruitment strategies may well differ for
such firms.
Fourth, the variable single controls for whether the firm is a single or multiple
establishment organisation. In multi-establishment organisations, while there may be
a greater probability of having formal HR management arrangements which may
facilitate recruitment, there may be greater coordination problems with constituent
establishments regarding hiring and firing decisions. On similar grounds, a variable
controlling for whether the establishment is the head office of the organisation is
included (head office). Such establishments may have recruitment issues partly or
largely unrelated to the operational side of the enterprise, and thus may demonstrate
rather different patterns in vacancies.
To capture any expansionary or contractionary effects of the organisation on
recruitment and replacement of unfilled positions, the variables increase and

The Distribution and Determinants of Job Vacancies: Evidence from ESS2001
23
decrease control for whether total sales (for private sector enterprises) or budget (for
non-private sector establishments) has increased or decreased ‘a great deal’ in the
past 12 months. Related to this are the controls for the establishments’ underlying
hiring and quit rates (hire rate and quit rate). These are measured as a proportion of
the current workforce at the establishment who have been taken on or left in the
preceding 12 months respectively25.
Finally, measures of the amount of off-the-job training taking place at the
establishment are included. Clearly, one response to vacancies, especially those
which are hard-to-fill, and/or are the result of skills shortages, is for establishments to
train their current workforce to fill these tasks. Their incumbent employees have the
advantage of enterprise-specific knowledge which may make them good candidates
to fill vacant positions. At the same time, establishments will engage in off-the-job-
training for a wide variety of other purposes, including general upskilling of the
workforce to meet increasing technical demands, for staff morale, etc. Three dummy
variables for different proportions of staff which have engaged in off-the-job-training
in the last 12 months are included: 1-20% (train1), 20-80% (train2), and 80-100%
(train3), with the base of no employees having received any off-the-job-training in the
last 12 months.
4.2 Industry and Area Characteristics The second and third specifications (B and C) include a number of industry and area
characteristics that are likely to impinge on the propensity of establishments to have
vacancies, and on their vacancy rates. These are in addition to the firm and
establishment level characteristics described above. The first measure of industrial
structure included captures the potential supply of labour to the establishment in the
local area. This is measured as the proportion of the local labour force (at the LLSC
level) which is currently employed in the industry in which the establishment is
engaged (industry empl.). Clearly, the greater is the local supply of labour with the
appropriate skills, the easier it should be for establishments to fill their current
vacancies, although they will be competing against a greater number of other
25 There are a few implausible extreme observations on these variables (questions B7a and B7b) given the size of the incumbent workforce, and hence these observations are discarded in the empirical estimates.

The Distribution and Determinants of Job Vacancies: Evidence from ESS2001
24
establishments for the same workers and hence the demand for these workers is
also likely to be greater. The net balance of these two opposing effects is an
empirical manner. The share of employment in the local area is obviously only one of
a number of industry characteristics that may be relevant to the vacancy process. In
particular, in growing or declining industries, there may be additional recruitment
issues over and above those at the establishment or local level captured by the other
variables included in the specification. Thus, the impact of also including a set of 14
industry dummies is investigated in specification C.
In addition to the industrial composition of the current local labour force, the
proportionate rate of growth of the locally employed labour force (at the LLSC level)
over the last two years is included (empl. growth). High rates of growth in
employment may mean a relative shortage of excess labour to fill any vacancies.
However, it may also signal to workers currently located outside the local area that it
has good employment prospects, and hence they may be more tempted to migrate to
the area. The net balance of these two effects is thus uncertain a priori. Two
measures of the skills of the local labour force are also included. Low skills is the
proportion of the LLSC labour force which has no qualifications, while high skills is
the proportion which has NVQ level 4 or above.
The next variable capturing the characteristics of the local labour force and their likely
impact on vacancies is a measure of local relative wages (rel. wage). This is
computed from the (1-digit SOC90) relative wages in the LLSC area (relative to the
average for England). A weighted average of these relative wages is computed, with
weights given by the shares of each of the 1-digit occupations in the local labour
force. Thus rather than simply taking the average wage for all workers in the local
area, this measure captures the extent to which the area has high or low wages
relative to its occupational composition. This is important the greater is the
heterogeneity in the occupational distribution of employment at the LLSC level. Of
course, wages may be expected to be endogenously determined with vacancies
(effectively an indicator of excess labour demand) and we consider this potential
problem further below.

The Distribution and Determinants of Job Vacancies: Evidence from ESS2001
25
The final variables controlling for the local labour market conditions are two
measures of New Deal (ND) activity at the LLSC level. The level of participation in
ND activities (ND_partic.) is computed as the number of ND participants in the LLSC
area expressed as a fraction of total unemployment as at December 2000. The
efficacy of the ND activities is captured by the number of unsubsidised jobs gained
as a proportion of ND participants at the LLSC level (ND_efficacy). Clearly, the
greater the participation in ND activities, and the greater the effectiveness of these
activities, the lower should be the rate of unemployment for any given level of
vacancies. Hence these two variables should act to shift the UV curve inwards
towards the origin. However, to the extent that participation in ND activities may be a
signal of poor quality in the stock of the unemployed, there may be more vacancies
unfilled where ND participation is higher.
The final variable is a measure of unemployment. In the results presented in detail in
Table 6, the unemployment measure selected is the LLSC ILO unemployment rate
for all those aged 16 or over (ilo_rate). However, a summary of the results for
alternative measures of unemployment and of surplus labour in the area is also
presented in Table 7.
4.3 Results for Vacancy Incidence and Vacancy Rates The basic results are presented in Table 6. Three empirical specifications (labelled A,
B and C as discussed above) of the model in equations (1) and (2) are presented.
First, there are the estimates of the probit equation (1) for the presence of any
vacancies (Vacancy Incidence). This is followed by the truncated regression results
for equation (2) (Vacancy Propensity) for the vacancy rates conditional on there
being some vacancies. In both cases, the marginal effects are reported. Finally, the
joint marginal effects for changes in the independent variable on the vacancy rate
across all establishments are reported as explained in the discussion surrounding
equation (3). The restriction to the simple Tobit specification discussed in section 3.3
above is rejected in favour of the two equation model as formulated by Cragg (1971)
for all of the three specifications.
Table 6 reveals a number of interesting patterns and findings. First, as had already
been anticipated from the cross-tabulations in Table 4, the incidence of vacancies
The Distribution and Determinants of Job Vacancies: Evidence from ESS2001
26
increases but the vacancy rate decreases with increasing establishment size. The
net impact of increasing size on the overall vacancy rate is positive as can be seen in
the final columns of the table which report the net marginal effects. The magnitudes
of the marginal effects are quite large. For example, for specification C, the impact of
an establishment growing from being of average size (10 employees in the sample
and thus in esize3) to being one standard deviation above the average size (which
would place it in size category esize5) would be to increase the expected vacancy
rate by (0.0480 - 0.0091 =) 0.0389. Given that the average vacancy rate is 0.0423,
this represents an increase of over 90% from the mean, or almost 30% of a standard
deviation in the vacancy rate.
In contrast, the net impact on the vacancy rate of establishments being in the private
sector, foreign or joint foreign/UK owned, or single establishment organisations are
negligible. However, establishments which have increased their scale of operation in
the last 12 months have vacancy rates over (0.0237/0.0423) 56% higher than
establishments which have seen little or no change in turnover or budget.
Establishments that are contracting have slightly lower vacancy rates.
Where hiring rates and quitting rates are higher, vacancies are more prevalent as is
expected. To gauge the magnitude of the impact of differences in these continuous
variables, it is helpful to consider a representative change in the variable. Thus if an
establishment has a hiring rate one standard deviation above the mean hiring rate,
the impact on the expected vacancy rate will be (0.7082×0.0116=) 0.008 which is
small compared to the standard deviation of the vacancy rate (0.1347). Thus while
these variables have their expected signs, their impact on actual vacancy rates would
appear to be negligible.
Establishments which engage in more off-the-job-training of their workers have
higher vacancy rates. There are a number of plausible explanations for this finding.
The organisation may be engaged in activities which are increasingly technologically
advanced and therefore need to recruit more staff with these skills as well as
upgrading the skills of the incumbent workers. Alternatively, anticipating future
demands and scale may induce firms to train their existing workers as well as
attempting to recruit more workers. In any event, those establishments engaged in
The Distribution and Determinants of Job Vacancies: Evidence from ESS2001
27
the most training (80-100% of employees receiving off-the-job-training in the previous
12 months) do not appear to be satisfying their requirements for more workers purely
from within their own organisation since these have significantly higher vacancy
rates.
Turning to the industry and area characteristics, it can be seen that establishments
located in areas of low skills amongst the labour force tend to have significantly more
vacancies, ceteris paribus. However, the size of this effect is again very small. A one
standard deviation increase in the proportion of the working age population with no
qualifications would increase the expected vacancy rate by (0.0377×0.1561=) 0.006,
which is negligible compared to the variation in the vacancy rate. Similarly, while
areas of strong employment growth tend to have more vacancies, consistent with the
pro-cyclicality of vacancies at the aggregate level, the magnitude of the effect is
small.
Higher local relative wages are associated with both higher vacancy incidence and
higher vacancy propensity, contrary to expectations. One possible explanation is that
local wages are also capturing local costs, and this may mean that recruitment is
more difficult. There is also a potential endogeneity issue here. However, given that
rel. wage is computed as a locally weighted average of occupation-specific relative
wages, with wages taken from the NES, individual establishments and firms are
effectively price takers for the relative wage they face in their local labour market.
Moreover, the results presented are almost invariant to the exclusion of this variable
from the specification.
Where there are a large number of ND participants as a share of unemployment,
vacancy incidence and vacancy rates are significantly higher. This may be a
reflection of the characteristics of the stock of unemployed which will be of longer
durations the higher the proportion of New Deal participation, and thus may suffer
disproportionately from scarring effects.
Finally, the coefficient on the (log) ILO unemployment rate is negative and significant
for both the incidence of vacancies and for the vacancy rate. Its net impact on the
overall vacancy rate is thus definitely negative, consistent with the UV or matching
The Distribution and Determinants of Job Vacancies: Evidence from ESS2001
28
models of the relationship between vacancies and unemployment. However, once
again, for reasonable/typical values of differences in the unemployment rate between
LLSCs, differences in the expected vacancy rate are fractional26.
The analysis in Table 6 was repeated for hard-to-fill, non-hard-to-fill, skill-shortage
and non-skill-shortage vacancies (results available on request). Notable differences
from the results in Table 6 include the finding that areas which have experienced
recent employment growth tend to have a lower hard-to-fill vacancy rate and skill-
shortage vacancy rates, despite having higher non-hard-to-fill, and non-skill-shortage
vacancy rates. It could be argued that these establishments seem to benefit from an
expanding local labour force providing suitable workers for hard-to-fill and skill-
shortage vacancies, even though overall vacancy rates are higher, perhaps reflecting
greater job turnover in these areas and continued expansion.
In order to investigate the robustness of this finding of a downward sloping UV curve
at the LLSC level, Table 7 presents a summary of the estimates obtained for different
measures of the ‘unemployment’ rate and also for the different sub-categories of
vacancies. For comparative purposes, the first row of the table reports the results
obtained for each of the five categories of vacancies for the ILO LLSC unemployment
rate (ilo_rate) as used in Table 6. The other measures of local (LLSC) unemployment
are: the claimant count rate (urate); the long-term unemployment rate (claimants who
have been unemployed in excess of 6 months - lturate); and the non-employment
rate (nonempr).
The first row of Table 7 reveals that with the exception of the hard-to-fill vacancy rate,
the incidence and propensity of all four subcategories of vacancies are significantly
negatively related to the local ILO unemployment rate, although the effect is stronger
for the non-hard-to-fill and non-skill-shortage vacancy incidence than for their
complements. This accords with our expectations since hard-to-fill and, especially,
26 Given that the local labour market characteristics are defined at the LLSC level, the standard errors should be adjusted to take into account the correlation between the observations at this level (Moulton, 1986). None of the substantive conclusions are affected by this adjustment – in particular, the impact of local unemployment on the vacancy rate is still negative and significant despite the approximate doubling of its standard error.
The Distribution and Determinants of Job Vacancies: Evidence from ESS2001
29
skill-shortage vacancies are precisely those job openings which have specific
requirements that are less likely to be filled from the general stock of unemployment.
However, as for aggregate vacancies, the marginal effects on the vacancy rate are
rather small.
The remaining rows of Table 7 present the coefficients on the log unemployment
variable for the three alternative measures of the unemployment rate. For all four
‘unemployment’ measures, both the incidence and propensity of total vacancies at
the establishment level are negatively and significantly related to the LLSC
unemployment rate. For hard-to-fill and non-hard-to-fill vacancies, the incidence of
vacancies is consistently significantly related to all four of the unemployment
measures. However, for the vacancy rates, the results are less robust. For skill-
shortage vacancies, the coefficients on the unemployment measures are mainly
negative, but only half are significantly so. Finally, for non-skill-shortage vacancies,
vacancy incidence is strongly negatively related to whatever measure of
unemployment is utilised, while the conditional rate is also significantly negatively
related to the unemployment measures, although the effects are less robust.
However, in general, it is clear that there exists a negatively sloped local UV curve at
the establishment level.
5. Conclusions In contrast to the considerable microeconomic and macroeconomic literature on
unemployment, surprisingly little is known regarding job vacancies. This paper uses
data from a representative survey in Spring 2001 of over 27,000 establishments in
England to investigate the distribution and determinants of job vacancies, with a
particular focus on the impact of local labour market conditions. At the time of the
survey, 14.5% of establishments had at least one vacancy, with 2.7% of jobs unfilled.
The survey enables general vacancies to be distinguished from those that are hard-
to-fill and also those that are unfilled due to skill-shortages amongst the applicants.
Approximately 4% of establishments had at least one skill-shortage vacancy, and
around 20% of the jobs which were unfilled remained so due to skill-shortages.
The Distribution and Determinants of Job Vacancies: Evidence from ESS2001
30
The empirical specification reveals that firm, establishment, industrial and local
labour market characteristics are all systematically related to the vacancy incidence
and the vacancy propensity. Differences in vacancy incidence and vacancy rates by
establishment size are particularly notable. However, there is considerable variation
in the distribution of vacancies, and while a number of firm and establishment
characteristics can be identified which are significantly associated with higher levels
of vacancies, much of the variation in vacancies remains unexplained. One
interpretation is that this is due to unobserved heterogeneity between
establishments. However, a more satisfactory explanation lies in the fact that
aggregate vacancy inflows and outflows are so large relative to the vacancy stock -
that is, there is considerable job turnover in the labour market - and this is reflected in
vacancies at the establishment level. Thus, while it is possible to identify factors
which are correlated with both vacancy incidence and vacancy rates at the
establishment, in general there is considerable variation in the vacancy stock
between establishments which cannot be accounted for. This interpretation is
consistent with the variance decomposition which suggested that most of the
variation in both unconditional and conditional vacancy rates was within rather than
between the categories examined. The conclusions for the establishment-level
analysis are similar. Even controlling for a large number of potential factors which
can plausibly affect the vacancy rate, vacancy rates are still quite dissimilar between
otherwise similar establishments. The factors which are identified as important can
only account for a small proportion of the variation in vacancy rates between
establishments at any point in time.
Despite the wide variance in vacancy rates, a statistically significant negatively
sloped local UV curve can be identified at the establishment level. This relationship
exists for total vacancies, and also for the differing sub-sets of vacancies in general,
although it is weaker for hard-to-fill and skill-shortage vacancies in particular. This
finding accords with expectations since these are the vacancies that the unemployed
are least likely to be qualified for. The negatively sloped UV relationship is strongest
and steepest for non-skill shortage vacancies, which comprise the majority of
vacancies as noted above and perhaps most closely accord with (frictional) labour
turnover. Local labour markets thus seem to work in this sense, even in a period of
(close to) full-employment.
The Distribution and Determinants of Job Vacancies: Evidence from ESS2001
31
REFERENCES Amemiya T (1986), Advanced Econometrics, Basil Blackwell: Oxford. Bennet R and Pinto R (1994), “The Hiring Function in Local Labour Markets in
Britain”, Environment and Planning, 26, pp.1957-1974. Birtwhistle A (2001), “Jobcentre Vacancy Statistics”, Labour Market Trends, March,
pp.159-162. Blanchard O J and Diamond P (1989), “The Beveridge Curve”, Brookings Papers on
Economic Activity, 1, pp.1-60. Bosworth D, Davies R, Hogarth T, Wilson R and Shury J (2000a), Employers Skill
Survey: Statistical Report, DfEE/Skills Task Force, SKT 31. Bosworth D, Wilson R and Davies R (2000b), Employers Skill Survey: Econometric
Report, DfEE. Coles M G and Smith E (1996), “Cross-section Estimation of the Matching Function:
Evidence from England and Wales”, Economica, 63, pp.589-597. Cowell F A (1995), Measuring Inequality 2nd edition, Prentice Hall/Harvester
Wheatsheaf Cragg J (1971), “Some Statistical Models for Limited Dependent Variables with
Application to the Demand for Durable Goods”, Econometrica, 39, pp.829-844. Green A and Owen D (2002), Exploratory Data Analysis at Local Area Level, Skills,
Local Areas and Unemployment: ESS2001 – Final Report, Institute for Employment Research, University of Warwick, August.
Greene W (2000), Econometric Analysis 4th edition, Upper Saddle River, NJ: Prentice-Hall.
Haskel J and Martin C (2001), “Technology, Wages and Skill Shortages: Evidence from UK Micro Data”, Oxford Economic Papers, 53, pp.642-658.
Heckman J (1976), “The Common Structure of Statistical Models of Truncation, Sample Selection, and Limited Dependent Variables and a Simple Estimator for Such Models” Annals of Economic and Social Measurement, 5, pp.475-492.
Hillage J, Regan J, Dickson J, McLoughlin K (2002), Employers Skill Survey 2002, DfES Research Report RR372, September 2002.
Hogarth T, Shury J, Vivian D and Wilson R (2001), Employers Skill Survey 2001: Statistical Report, IFF Research/Institute of Employment Research.
Holzer H J (1994), “Job Vacancy Rates in the Firm: An Empirical Analysis”, Economica, 61, pp.17-36.
Jackman R, Layard, R and Pissarides C (1989), “On Vacancies”, Oxford Bulletin of Economics and Statistics, 51, pp.377-394.
Lin T F and Schmidt P (1984), “A Test of the Tobit Specification against an Alternative Suggested by Cragg”, Review of Economics and Statistics, 66, pp.174-177.
Machin A and Christian V (2002), “A New Survey of Job Vacancies: The First Experimental Results”, Labour Market Trends, October, pp.535-548.
The Distribution and Determinants of Job Vacancies: Evidence from ESS2001
32
Morissette R and Zhang X (2001), “Which Firms have High Job Vacancy Rates in Canada?”, Statistics Canada, DP 176, October.
Moulton B R (1986), “Random Group Effects and the Precision of Regression Estimates”, Journal of Econometrics, 32, pp.385-397.
Nickell S, Nonziata W, Ochel W and Quintini G (2002), “The Beveridge Curve, Unemployment and Wages in the OECD from the 1960s to the 1990s”, CEP, LSE, DP 502, July.
Ostry S and Sunter A (1970), “Definitional and Design Aspects of the Canadian Job Vacancy Survey”, Journal of the American Statistical Association, 65, pp.1059-1070.
Petrongolo B and Pissarides C A (2001), “Looking into the Black Box: A Survey of the Matching Function”, Journal of Economic Perspectives, XXXIX, pp.390-431.
Pissarides C A (1986), “Unemployment and Vacancies in Britain”, Economic Policy, 3, pp.499-559.
Wall H J and Zoega G (2002), “The British Beveridge Curve: A Tale of Ten Regions”, Oxford Bulletin of Economics and Statistics , 64, pp.257-276.
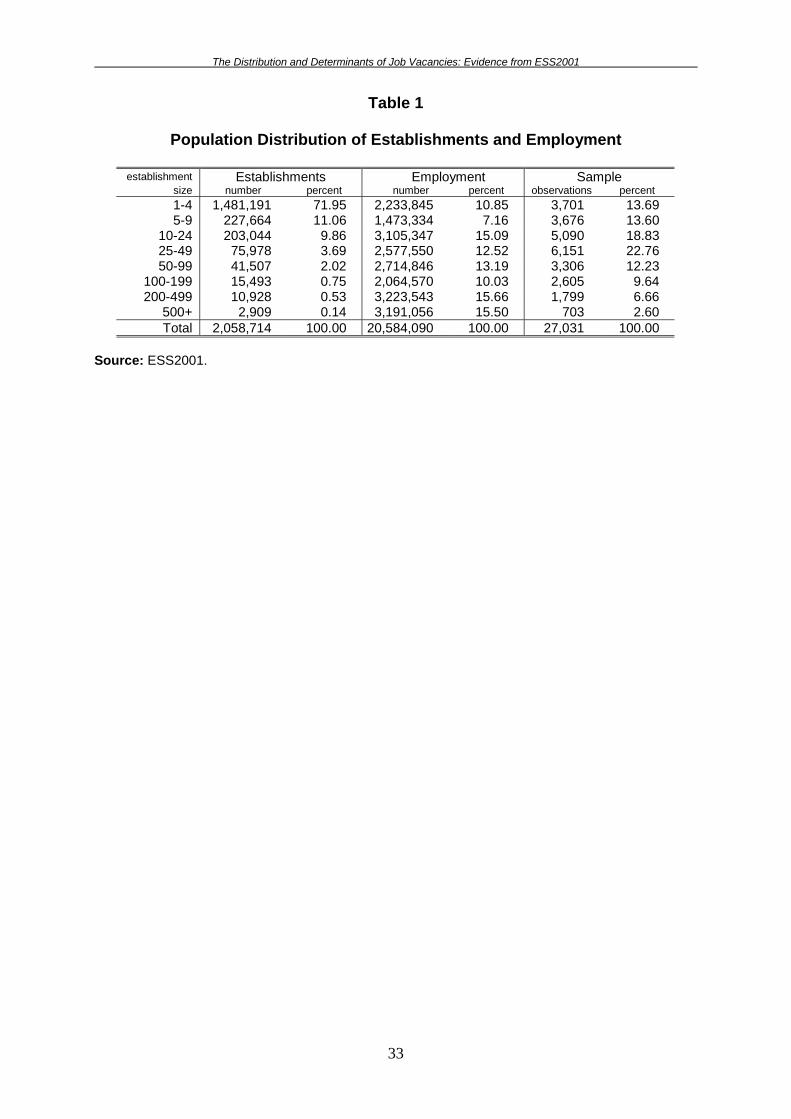
The Distribution and Determinants of Job Vacancies: Evidence from ESS2001
33
Table 1
Population Distribution of Establishments and Employment
establishment Establishments Employment Sample size number percent number percent observations percent 1-4 1,481,191 71.95 2,233,845 10.85 3,701 13.69 5-9 227,664 11.06 1,473,334 7.16 3,676 13.60
10-24 203,044 9.86 3,105,347 15.09 5,090 18.83 25-49 75,978 3.69 2,577,550 12.52 6,151 22.76 50-99 41,507 2.02 2,714,846 13.19 3,306 12.23
100-199 15,493 0.75 2,064,570 10.03 2,605 9.64 200-499 10,928 0.53 3,223,543 15.66 1,799 6.66
500+ 2,909 0.14 3,191,056 15.50 703 2.60 Total 2,058,714 100.00 20,584,090 100.00 27,031 100.00
Source: ESS2001.
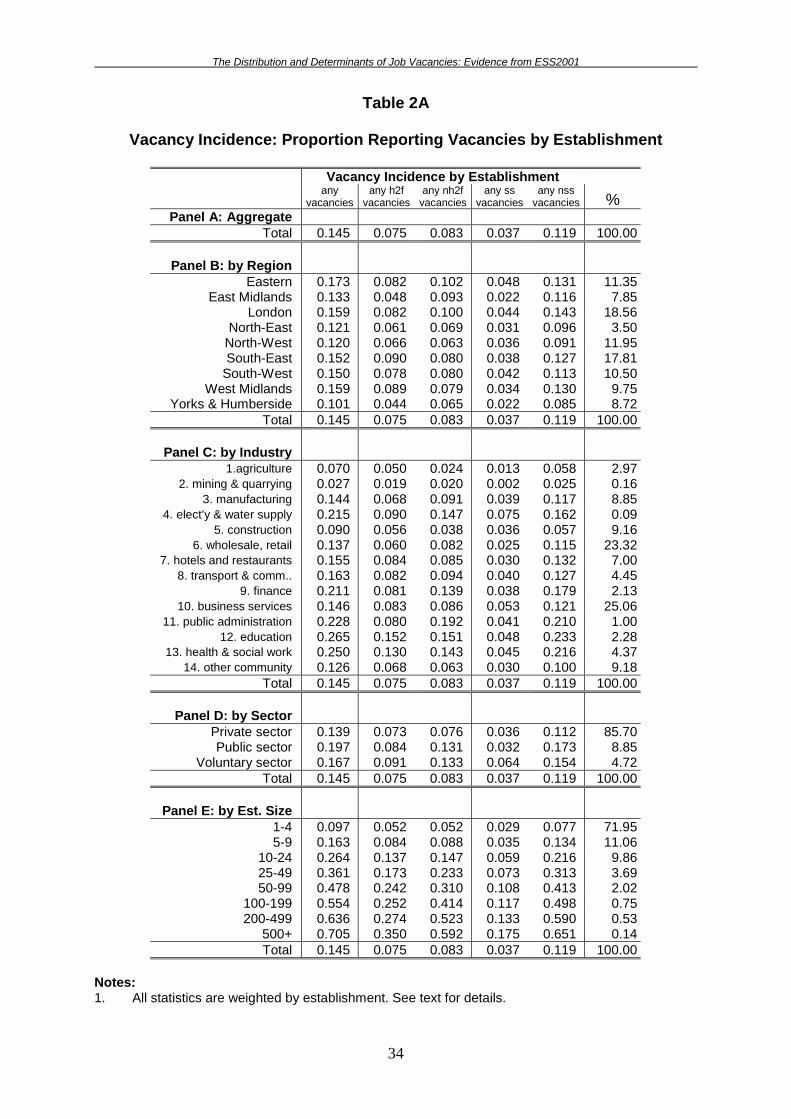
The Distribution and Determinants of Job Vacancies: Evidence from ESS2001
34
Table 2A
Vacancy Incidence: Proportion Reporting Vacancies by Establishment
Vacancy Incidence by Establishment
any
vacancies any h2f
vacancies any nh2f
vacancies any ss
vacancies any nss
vacancies % Panel A: Aggregate
Total 0.145 0.075 0.083 0.037 0.119 100.00
Panel B: by Region Eastern 0.173 0.082 0.102 0.048 0.131 11.35
East Midlands 0.133 0.048 0.093 0.022 0.116 7.85 London 0.159 0.082 0.100 0.044 0.143 18.56
North-East 0.121 0.061 0.069 0.031 0.096 3.50 North-West 0.120 0.066 0.063 0.036 0.091 11.95 South-East 0.152 0.090 0.080 0.038 0.127 17.81
South-West 0.150 0.078 0.080 0.042 0.113 10.50 West Midlands 0.159 0.089 0.079 0.034 0.130 9.75
Yorks & Humberside 0.101 0.044 0.065 0.022 0.085 8.72 Total 0.145 0.075 0.083 0.037 0.119 100.00
Panel C: by Industry
1.agriculture 0.070 0.050 0.024 0.013 0.058 2.97 2. mining & quarrying 0.027 0.019 0.020 0.002 0.025 0.16
3. manufacturing 0.144 0.068 0.091 0.039 0.117 8.85 4. elect’y & water supply 0.215 0.090 0.147 0.075 0.162 0.09
5. construction 0.090 0.056 0.038 0.036 0.057 9.16 6. wholesale, retail 0.137 0.060 0.082 0.025 0.115 23.32
7. hotels and restaurants 0.155 0.084 0.085 0.030 0.132 7.00 8. transport & comm.. 0.163 0.082 0.094 0.040 0.127 4.45
9. finance 0.211 0.081 0.139 0.038 0.179 2.13 10. business services 0.146 0.083 0.086 0.053 0.121 25.06
11. public administration 0.228 0.080 0.192 0.041 0.210 1.00 12. education 0.265 0.152 0.151 0.048 0.233 2.28
13. health & social work 0.250 0.130 0.143 0.045 0.216 4.37 14. other community 0.126 0.068 0.063 0.030 0.100 9.18
Total 0.145 0.075 0.083 0.037 0.119 100.00
Panel D: by Sector Private sector 0.139 0.073 0.076 0.036 0.112 85.70 Public sector 0.197 0.084 0.131 0.032 0.173 8.85
Voluntary sector 0.167 0.091 0.133 0.064 0.154 4.72 Total 0.145 0.075 0.083 0.037 0.119 100.00
Panel E: by Est. Size
1-4 0.097 0.052 0.052 0.029 0.077 71.95 5-9 0.163 0.084 0.088 0.035 0.134 11.06
10-24 0.264 0.137 0.147 0.059 0.216 9.86 25-49 0.361 0.173 0.233 0.073 0.313 3.69 50-99 0.478 0.242 0.310 0.108 0.413 2.02
100-199 0.554 0.252 0.414 0.117 0.498 0.75 200-499 0.636 0.274 0.523 0.133 0.590 0.53
500+ 0.705 0.350 0.592 0.175 0.651 0.14 Total 0.145 0.075 0.083 0.037 0.119 100.00
Notes: 1. All statistics are weighted by establishment. See text for details.
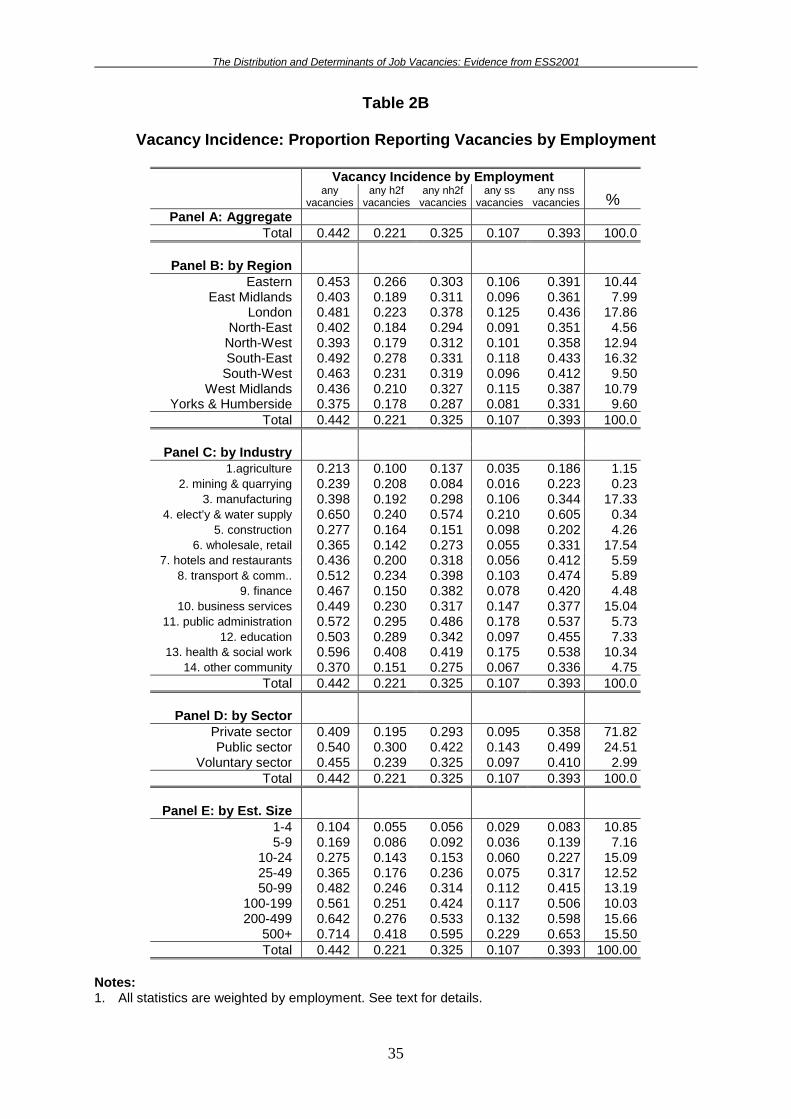
The Distribution and Determinants of Job Vacancies: Evidence from ESS2001
35
Table 2B
Vacancy Incidence: Proportion Reporting Vacancies by Employment
Vacancy Incidence by Employment
any
vacancies any h2f
vacancies any nh2f
vacancies any ss
vacancies any nss
vacancies % Panel A: Aggregate
Total 0.442 0.221 0.325 0.107 0.393 100.0
Panel B: by Region Eastern 0.453 0.266 0.303 0.106 0.391 10.44
East Midlands 0.403 0.189 0.311 0.096 0.361 7.99 London 0.481 0.223 0.378 0.125 0.436 17.86
North-East 0.402 0.184 0.294 0.091 0.351 4.56 North-West 0.393 0.179 0.312 0.101 0.358 12.94 South-East 0.492 0.278 0.331 0.118 0.433 16.32
South-West 0.463 0.231 0.319 0.096 0.412 9.50 West Midlands 0.436 0.210 0.327 0.115 0.387 10.79
Yorks & Humberside 0.375 0.178 0.287 0.081 0.331 9.60 Total 0.442 0.221 0.325 0.107 0.393 100.0
Panel C: by Industry
1.agriculture 0.213 0.100 0.137 0.035 0.186 1.15 2. mining & quarrying 0.239 0.208 0.084 0.016 0.223 0.23
3. manufacturing 0.398 0.192 0.298 0.106 0.344 17.33 4. elect’y & water supply 0.650 0.240 0.574 0.210 0.605 0.34
5. construction 0.277 0.164 0.151 0.098 0.202 4.26 6. wholesale, retail 0.365 0.142 0.273 0.055 0.331 17.54
7. hotels and restaurants 0.436 0.200 0.318 0.056 0.412 5.59 8. transport & comm.. 0.512 0.234 0.398 0.103 0.474 5.89
9. finance 0.467 0.150 0.382 0.078 0.420 4.48 10. business services 0.449 0.230 0.317 0.147 0.377 15.04
11. public administration 0.572 0.295 0.486 0.178 0.537 5.73 12. education 0.503 0.289 0.342 0.097 0.455 7.33
13. health & social work 0.596 0.408 0.419 0.175 0.538 10.34 14. other community 0.370 0.151 0.275 0.067 0.336 4.75
Total 0.442 0.221 0.325 0.107 0.393 100.0
Panel D: by Sector Private sector 0.409 0.195 0.293 0.095 0.358 71.82 Public sector 0.540 0.300 0.422 0.143 0.499 24.51
Voluntary sector 0.455 0.239 0.325 0.097 0.410 2.99 Total 0.442 0.221 0.325 0.107 0.393 100.0
Panel E: by Est. Size
1-4 0.104 0.055 0.056 0.029 0.083 10.85 5-9 0.169 0.086 0.092 0.036 0.139 7.16
10-24 0.275 0.143 0.153 0.060 0.227 15.09 25-49 0.365 0.176 0.236 0.075 0.317 12.52 50-99 0.482 0.246 0.314 0.112 0.415 13.19
100-199 0.561 0.251 0.424 0.117 0.506 10.03 200-499 0.642 0.276 0.533 0.132 0.598 15.66
500+ 0.714 0.418 0.595 0.229 0.653 15.50 Total 0.442 0.221 0.325 0.107 0.393 100.00
Notes: 1. All statistics are weighted by employment. See text for details.
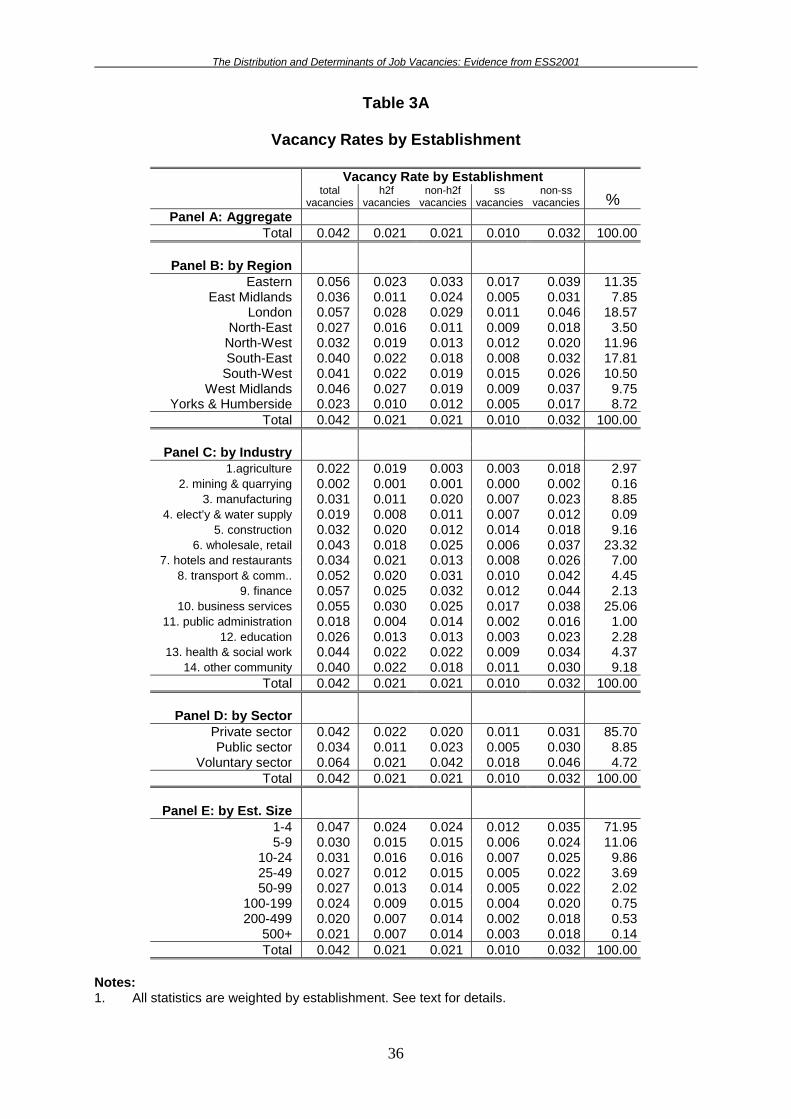
The Distribution and Determinants of Job Vacancies: Evidence from ESS2001
36
Table 3A
Vacancy Rates by Establishment
Vacancy Rate by Establishment
total
vacancies h2f
vacancies non-h2f
vacancies ss
vacancies non-ss
vacancies % Panel A: Aggregate
Total 0.042 0.021 0.021 0.010 0.032 100.00
Panel B: by Region Eastern 0.056 0.023 0.033 0.017 0.039 11.35
East Midlands 0.036 0.011 0.024 0.005 0.031 7.85 London 0.057 0.028 0.029 0.011 0.046 18.57
North-East 0.027 0.016 0.011 0.009 0.018 3.50 North-West 0.032 0.019 0.013 0.012 0.020 11.96 South-East 0.040 0.022 0.018 0.008 0.032 17.81
South-West 0.041 0.022 0.019 0.015 0.026 10.50 West Midlands 0.046 0.027 0.019 0.009 0.037 9.75
Yorks & Humberside 0.023 0.010 0.012 0.005 0.017 8.72 Total 0.042 0.021 0.021 0.010 0.032 100.00
Panel C: by Industry
1.agriculture 0.022 0.019 0.003 0.003 0.018 2.97 2. mining & quarrying 0.002 0.001 0.001 0.000 0.002 0.16
3. manufacturing 0.031 0.011 0.020 0.007 0.023 8.85 4. elect’y & water supply 0.019 0.008 0.011 0.007 0.012 0.09
5. construction 0.032 0.020 0.012 0.014 0.018 9.16 6. wholesale, retail 0.043 0.018 0.025 0.006 0.037 23.32
7. hotels and restaurants 0.034 0.021 0.013 0.008 0.026 7.00 8. transport & comm.. 0.052 0.020 0.031 0.010 0.042 4.45
9. finance 0.057 0.025 0.032 0.012 0.044 2.13 10. business services 0.055 0.030 0.025 0.017 0.038 25.06
11. public administration 0.018 0.004 0.014 0.002 0.016 1.00 12. education 0.026 0.013 0.013 0.003 0.023 2.28
13. health & social work 0.044 0.022 0.022 0.009 0.034 4.37 14. other community 0.040 0.022 0.018 0.011 0.030 9.18
Total 0.042 0.021 0.021 0.010 0.032 100.00
Panel D: by Sector Private sector 0.042 0.022 0.020 0.011 0.031 85.70 Public sector 0.034 0.011 0.023 0.005 0.030 8.85
Voluntary sector 0.064 0.021 0.042 0.018 0.046 4.72 Total 0.042 0.021 0.021 0.010 0.032 100.00
Panel E: by Est. Size
1-4 0.047 0.024 0.024 0.012 0.035 71.95 5-9 0.030 0.015 0.015 0.006 0.024 11.06
10-24 0.031 0.016 0.016 0.007 0.025 9.86 25-49 0.027 0.012 0.015 0.005 0.022 3.69 50-99 0.027 0.013 0.014 0.005 0.022 2.02
100-199 0.024 0.009 0.015 0.004 0.020 0.75 200-499 0.020 0.007 0.014 0.002 0.018 0.53
500+ 0.021 0.007 0.014 0.003 0.018 0.14 Total 0.042 0.021 0.021 0.010 0.032 100.00
Notes: 1. All statistics are weighted by establishment. See text for details.
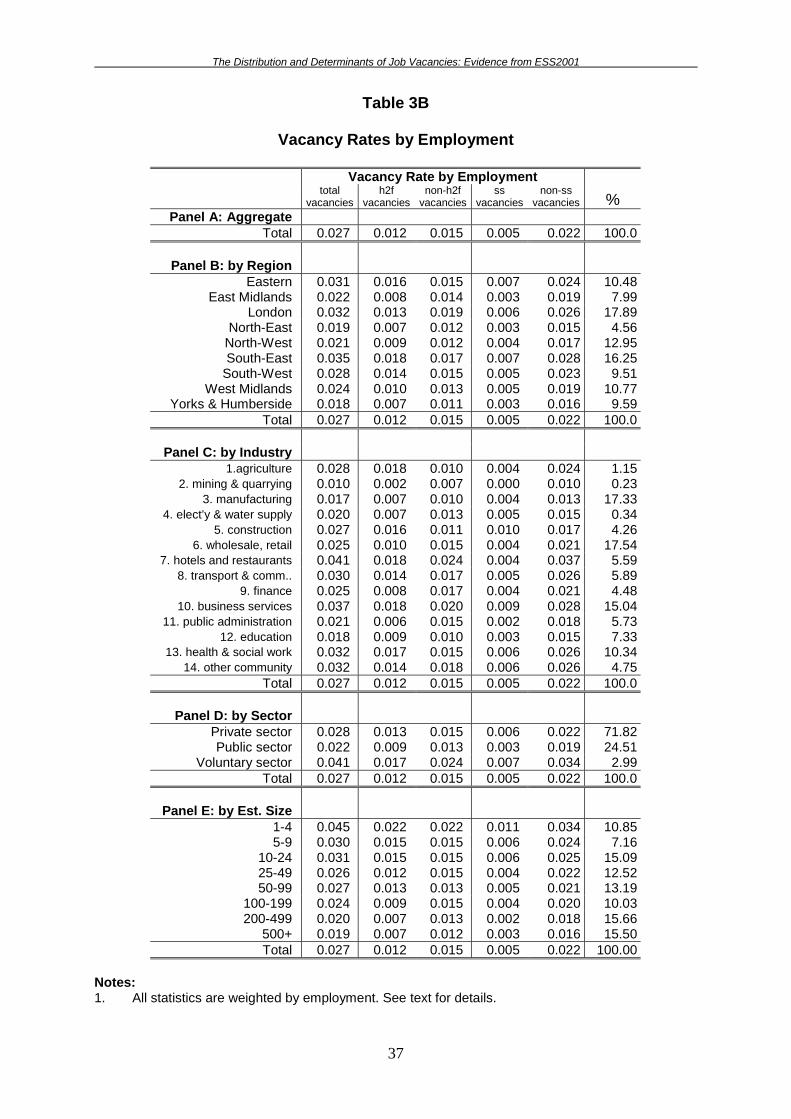
The Distribution and Determinants of Job Vacancies: Evidence from ESS2001
37
Table 3B
Vacancy Rates by Employment
Vacancy Rate by Employment
total
vacancies h2f
vacancies non-h2f
vacancies ss
vacancies non-ss
vacancies % Panel A: Aggregate
Total 0.027 0.012 0.015 0.005 0.022 100.0
Panel B: by Region Eastern 0.031 0.016 0.015 0.007 0.024 10.48
East Midlands 0.022 0.008 0.014 0.003 0.019 7.99 London 0.032 0.013 0.019 0.006 0.026 17.89
North-East 0.019 0.007 0.012 0.003 0.015 4.56 North-West 0.021 0.009 0.012 0.004 0.017 12.95 South-East 0.035 0.018 0.017 0.007 0.028 16.25
South-West 0.028 0.014 0.015 0.005 0.023 9.51 West Midlands 0.024 0.010 0.013 0.005 0.019 10.77
Yorks & Humberside 0.018 0.007 0.011 0.003 0.016 9.59 Total 0.027 0.012 0.015 0.005 0.022 100.0
Panel C: by Industry
1.agriculture 0.028 0.018 0.010 0.004 0.024 1.15 2. mining & quarrying 0.010 0.002 0.007 0.000 0.010 0.23
3. manufacturing 0.017 0.007 0.010 0.004 0.013 17.33 4. elect’y & water supply 0.020 0.007 0.013 0.005 0.015 0.34
5. construction 0.027 0.016 0.011 0.010 0.017 4.26 6. wholesale, retail 0.025 0.010 0.015 0.004 0.021 17.54
7. hotels and restaurants 0.041 0.018 0.024 0.004 0.037 5.59 8. transport & comm.. 0.030 0.014 0.017 0.005 0.026 5.89
9. finance 0.025 0.008 0.017 0.004 0.021 4.48 10. business services 0.037 0.018 0.020 0.009 0.028 15.04
11. public administration 0.021 0.006 0.015 0.002 0.018 5.73 12. education 0.018 0.009 0.010 0.003 0.015 7.33
13. health & social work 0.032 0.017 0.015 0.006 0.026 10.34 14. other community 0.032 0.014 0.018 0.006 0.026 4.75
Total 0.027 0.012 0.015 0.005 0.022 100.0
Panel D: by Sector Private sector 0.028 0.013 0.015 0.006 0.022 71.82 Public sector 0.022 0.009 0.013 0.003 0.019 24.51
Voluntary sector 0.041 0.017 0.024 0.007 0.034 2.99 Total 0.027 0.012 0.015 0.005 0.022 100.0
Panel E: by Est. Size
1-4 0.045 0.022 0.022 0.011 0.034 10.85 5-9 0.030 0.015 0.015 0.006 0.024 7.16
10-24 0.031 0.015 0.015 0.006 0.025 15.09 25-49 0.026 0.012 0.015 0.004 0.022 12.52 50-99 0.027 0.013 0.013 0.005 0.021 13.19
100-199 0.024 0.009 0.015 0.004 0.020 10.03 200-499 0.020 0.007 0.013 0.002 0.018 15.66
500+ 0.019 0.007 0.012 0.003 0.016 15.50 Total 0.027 0.012 0.015 0.005 0.022 100.00
Notes: 1. All statistics are weighted by employment. See text for details.
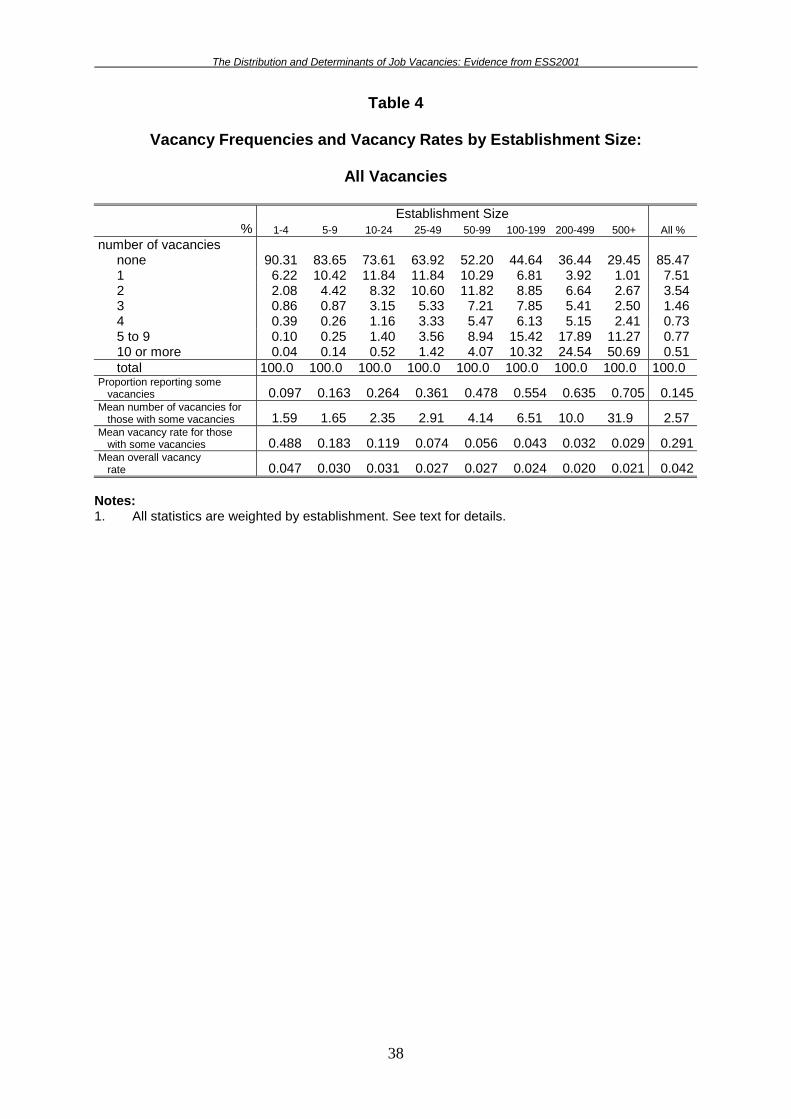
The Distribution and Determinants of Job Vacancies: Evidence from ESS2001
38
Table 4
Vacancy Frequencies and Vacancy Rates by Establishment Size:
All Vacancies
Establishment Size % 1-4 5-9 10-24 25-49 50-99 100-199 200-499 500+ All %
number of vacancies none 90.31 83.65 73.61 63.92 52.20 44.64 36.44 29.45 85.47 1 6.22 10.42 11.84 11.84 10.29 6.81 3.92 1.01 7.51 2 2.08 4.42 8.32 10.60 11.82 8.85 6.64 2.67 3.54 3 0.86 0.87 3.15 5.33 7.21 7.85 5.41 2.50 1.46 4 0.39 0.26 1.16 3.33 5.47 6.13 5.15 2.41 0.73 5 to 9 0.10 0.25 1.40 3.56 8.94 15.42 17.89 11.27 0.77 10 or more 0.04 0.14 0.52 1.42 4.07 10.32 24.54 50.69 0.51 total 100.0 100.0 100.0 100.0 100.0 100.0 100.0 100.0 100.0
Proportion reporting some vacancies 0.097 0.163 0.264 0.361 0.478 0.554 0.635 0.705 0.145
Mean number of vacancies for those with some vacancies 1.59 1.65 2.35 2.91 4.14 6.51 10.0 31.9 2.57
Mean vacancy rate for those with some vacancies 0.488 0.183 0.119 0.074 0.056 0.043 0.032 0.029 0.291
Mean overall vacancy rate 0.047 0.030 0.031 0.027 0.027 0.024 0.020 0.021 0.042 Notes: 1. All statistics are weighted by establishment. See text for details.
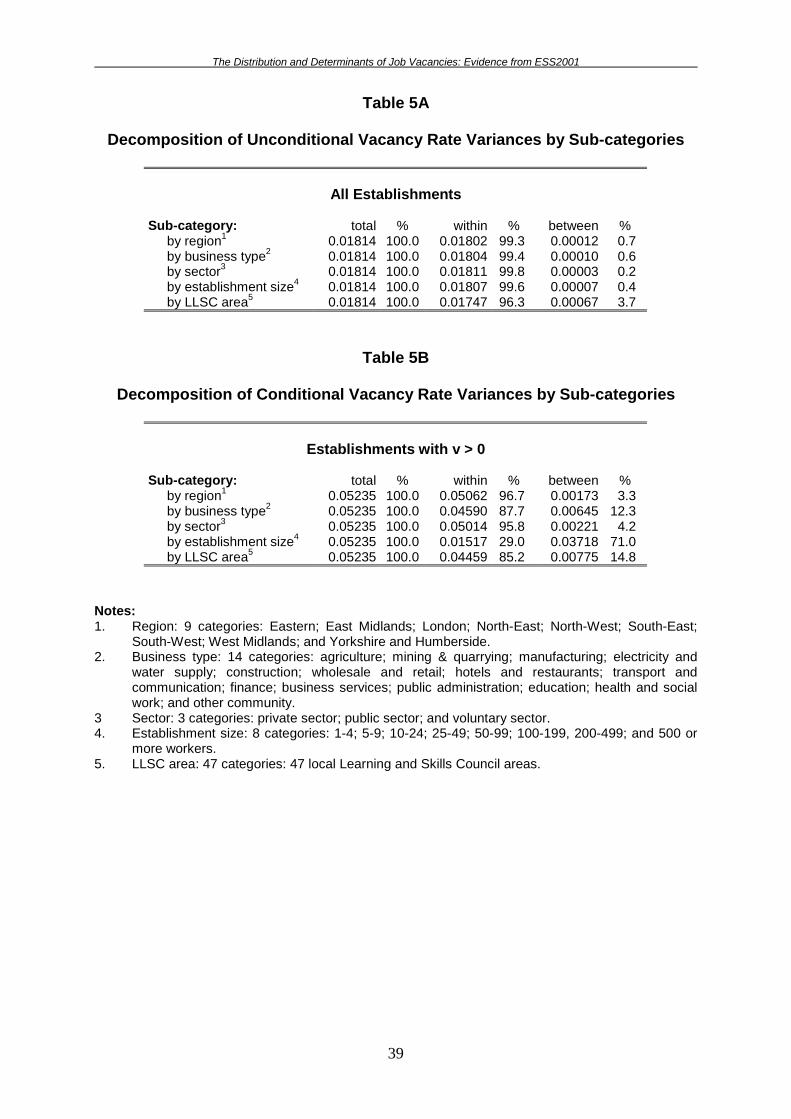
The Distribution and Determinants of Job Vacancies: Evidence from ESS2001
39
Table 5A
Decomposition of Unconditional Vacancy Rate Variances by Sub-categories
All Establishments Sub-category: total % within % between % by region1 0.01814 100.0 0.01802 99.3 0.00012 0.7 by business type2 0.01814 100.0 0.01804 99.4 0.00010 0.6 by sector3 0.01814 100.0 0.01811 99.8 0.00003 0.2 by establishment size4 0.01814 100.0 0.01807 99.6 0.00007 0.4 by LLSC area5 0.01814 100.0 0.01747 96.3 0.00067 3.7
Table 5B
Decomposition of Conditional Vacancy Rate Variances by Sub-categories
Establishments with v > 0 Sub-category: total % within % between % by region1 0.05235 100.0 0.05062 96.7 0.00173 3.3 by business type2 0.05235 100.0 0.04590 87.7 0.00645 12.3 by sector3 0.05235 100.0 0.05014 95.8 0.00221 4.2 by establishment size4 0.05235 100.0 0.01517 29.0 0.03718 71.0 by LLSC area5 0.05235 100.0 0.04459 85.2 0.00775 14.8
Notes: 1. Region: 9 categories: Eastern; East Midlands; London; North-East; North-West; South-East;
South-West; West Midlands; and Yorkshire and Humberside. 2. Business type: 14 categories: agriculture; mining & quarrying; manufacturing; electricity and
water supply; construction; wholesale and retail; hotels and restaurants; transport and communication; finance; business services; public administration; education; health and social work; and other community.
3 Sector: 3 categories: private sector; public sector; and voluntary sector. 4. Establishment size: 8 categories: 1-4; 5-9; 10-24; 25-49; 50-99; 100-199, 200-499; and 500 or
more workers. 5. LLSC area: 47 categories: 47 local Learning and Skills Council areas.
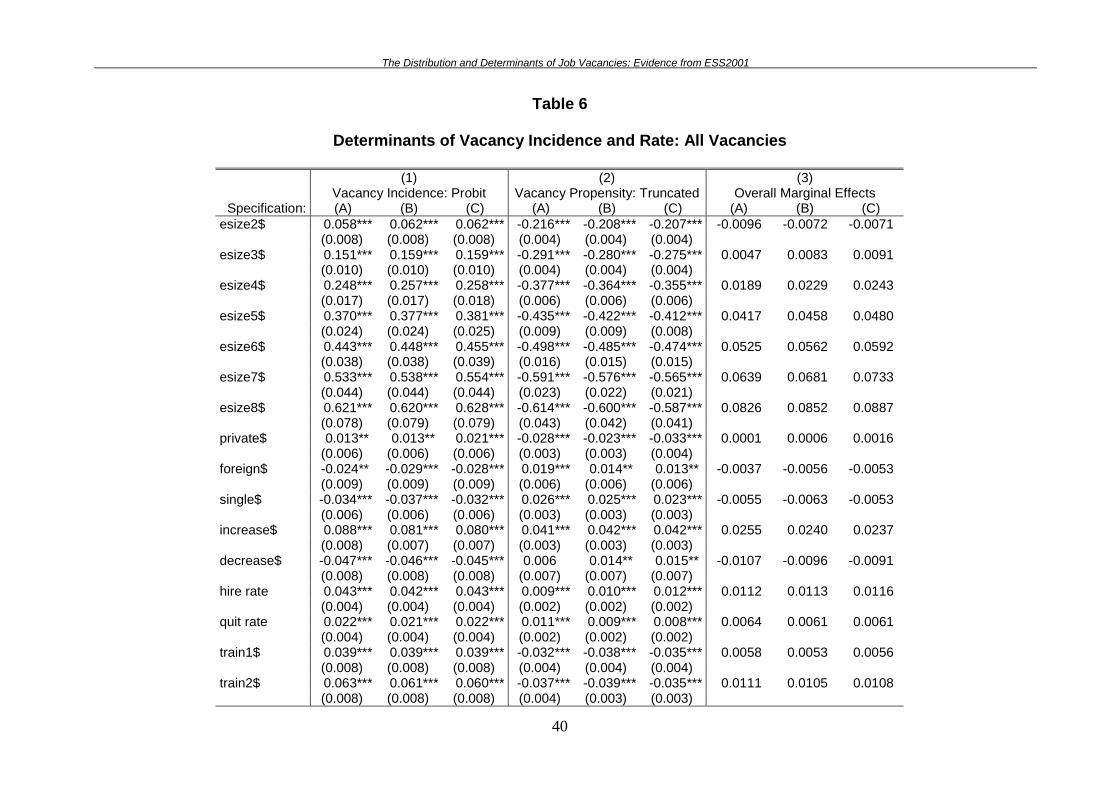
The Distribution and Determinants of Job Vacancies: Evidence from ESS2001
40
Table 6
Determinants of Vacancy Incidence and Rate: All Vacancies
(1) Vacancy Incidence: Probit
(2) Vacancy Propensity: Truncated
(3) Overall Marginal Effects
Specification: (A) (B) (C) (A) (B) (C) (A) (B) (C) esize2$ 0.058*** 0.062*** 0.062*** -0.216*** -0.208*** -0.207*** -0.0096 -0.0072 -0.0071 (0.008) (0.008) (0.008) (0.004) (0.004) (0.004) esize3$ 0.151*** 0.159*** 0.159*** -0.291*** -0.280*** -0.275*** 0.0047 0.0083 0.0091 (0.010) (0.010) (0.010) (0.004) (0.004) (0.004) esize4$ 0.248*** 0.257*** 0.258*** -0.377*** -0.364*** -0.355*** 0.0189 0.0229 0.0243 (0.017) (0.017) (0.018) (0.006) (0.006) (0.006) esize5$ 0.370*** 0.377*** 0.381*** -0.435*** -0.422*** -0.412*** 0.0417 0.0458 0.0480 (0.024) (0.024) (0.025) (0.009) (0.009) (0.008) esize6$ 0.443*** 0.448*** 0.455*** -0.498*** -0.485*** -0.474*** 0.0525 0.0562 0.0592 (0.038) (0.038) (0.039) (0.016) (0.015) (0.015) esize7$ 0.533*** 0.538*** 0.554*** -0.591*** -0.576*** -0.565*** 0.0639 0.0681 0.0733 (0.044) (0.044) (0.044) (0.023) (0.022) (0.021) esize8$ 0.621*** 0.620*** 0.628*** -0.614*** -0.600*** -0.587*** 0.0826 0.0852 0.0887 (0.078) (0.079) (0.079) (0.043) (0.042) (0.041) private$ 0.013** 0.013** 0.021*** -0.028*** -0.023*** -0.033*** 0.0001 0.0006 0.0016 (0.006) (0.006) (0.006) (0.003) (0.003) (0.004) foreign$ -0.024** -0.029*** -0.028*** 0.019*** 0.014** 0.013** -0.0037 -0.0056 -0.0053 (0.009) (0.009) (0.009) (0.006) (0.006) (0.006) single$ -0.034*** -0.037*** -0.032*** 0.026*** 0.025*** 0.023*** -0.0055 -0.0063 -0.0053 (0.006) (0.006) (0.006) (0.003) (0.003) (0.003) increase$ 0.088*** 0.081*** 0.080*** 0.041*** 0.042*** 0.042*** 0.0255 0.0240 0.0237 (0.008) (0.007) (0.007) (0.003) (0.003) (0.003) decrease$ -0.047*** -0.046*** -0.045*** 0.006 0.014** 0.015** -0.0107 -0.0096 -0.0091 (0.008) (0.008) (0.008) (0.007) (0.007) (0.007) hire rate 0.043*** 0.042*** 0.043*** 0.009*** 0.010*** 0.012*** 0.0112 0.0113 0.0116 (0.004) (0.004) (0.004) (0.002) (0.002) (0.002) quit rate 0.022*** 0.021*** 0.022*** 0.011*** 0.009*** 0.008*** 0.0064 0.0061 0.0061 (0.004) (0.004) (0.004) (0.002) (0.002) (0.002) train1$ 0.039*** 0.039*** 0.039*** -0.032*** -0.038*** -0.035*** 0.0058 0.0053 0.0056 (0.008) (0.008) (0.008) (0.004) (0.004) (0.004) train2$ 0.063*** 0.061*** 0.060*** -0.037*** -0.039*** -0.035*** 0.0111 0.0105 0.0108 (0.008) (0.008) (0.008) (0.004) (0.003) (0.003)
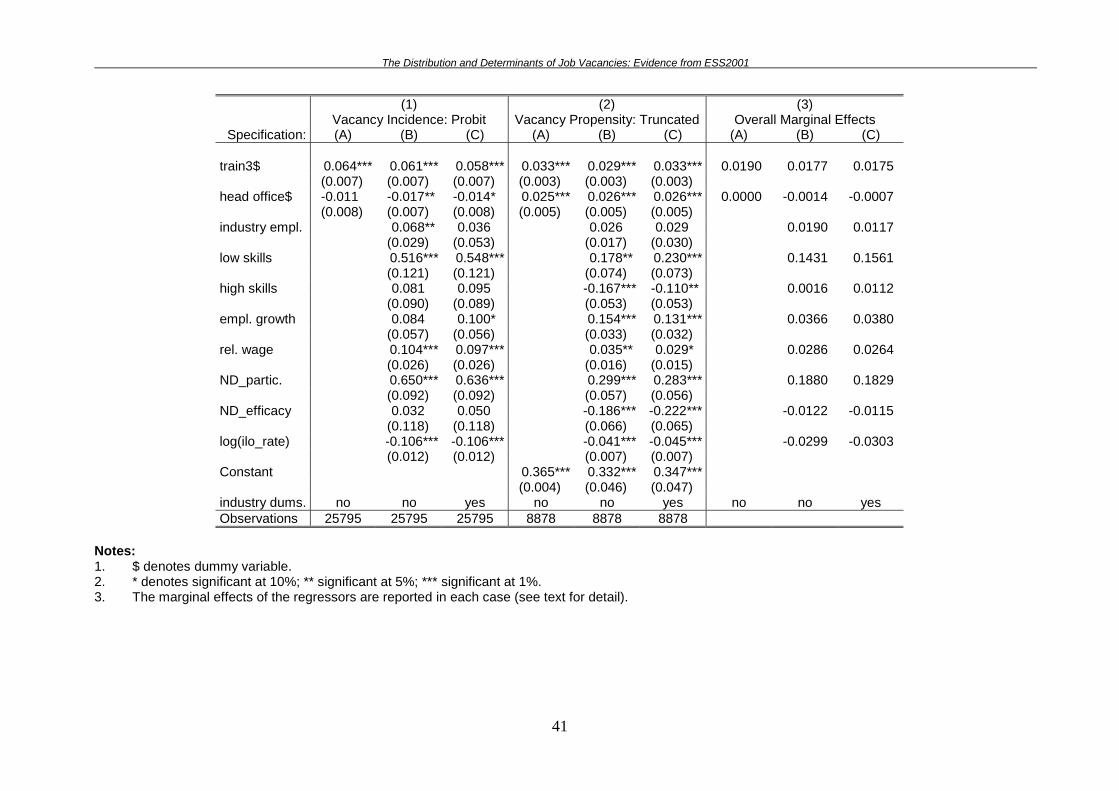
The Distribution and Determinants of Job Vacancies: Evidence from ESS2001
41
(1) Vacancy Incidence: Probit
(2) Vacancy Propensity: Truncated
(3) Overall Marginal Effects
Specification: (A) (B) (C) (A) (B) (C) (A) (B) (C) train3$ 0.064*** 0.061*** 0.058*** 0.033*** 0.029*** 0.033*** 0.0190 0.0177 0.0175 (0.007) (0.007) (0.007) (0.003) (0.003) (0.003) head office$ -0.011 -0.017** -0.014* 0.025*** 0.026*** 0.026*** 0.0000 -0.0014 -0.0007 (0.008) (0.007) (0.008) (0.005) (0.005) (0.005) industry empl. 0.068** 0.036 0.026 0.029 0.0190 0.0117 (0.029) (0.053) (0.017) (0.030) low skills 0.516*** 0.548*** 0.178** 0.230*** 0.1431 0.1561 (0.121) (0.121) (0.074) (0.073) high skills 0.081 0.095 -0.167*** -0.110** 0.0016 0.0112 (0.090) (0.089) (0.053) (0.053) empl. growth 0.084 0.100* 0.154*** 0.131*** 0.0366 0.0380 (0.057) (0.056) (0.033) (0.032) rel. wage 0.104*** 0.097*** 0.035** 0.029* 0.0286 0.0264 (0.026) (0.026) (0.016) (0.015) ND_partic. 0.650*** 0.636*** 0.299*** 0.283*** 0.1880 0.1829 (0.092) (0.092) (0.057) (0.056) ND_efficacy 0.032 0.050 -0.186*** -0.222*** -0.0122 -0.0115 (0.118) (0.118) (0.066) (0.065) log(ilo_rate) -0.106*** -0.106*** -0.041*** -0.045*** -0.0299 -0.0303 (0.012) (0.012) (0.007) (0.007) Constant 0.365*** 0.332*** 0.347*** (0.004) (0.046) (0.047) industry dums. no no yes no no yes no no yes Observations 25795 25795 25795 8878 8878 8878
Notes: 1. $ denotes dummy variable. 2. * denotes significant at 10%; ** significant at 5%; *** significant at 1%. 3. The marginal effects of the regressors are reported in each case (see text for detail).
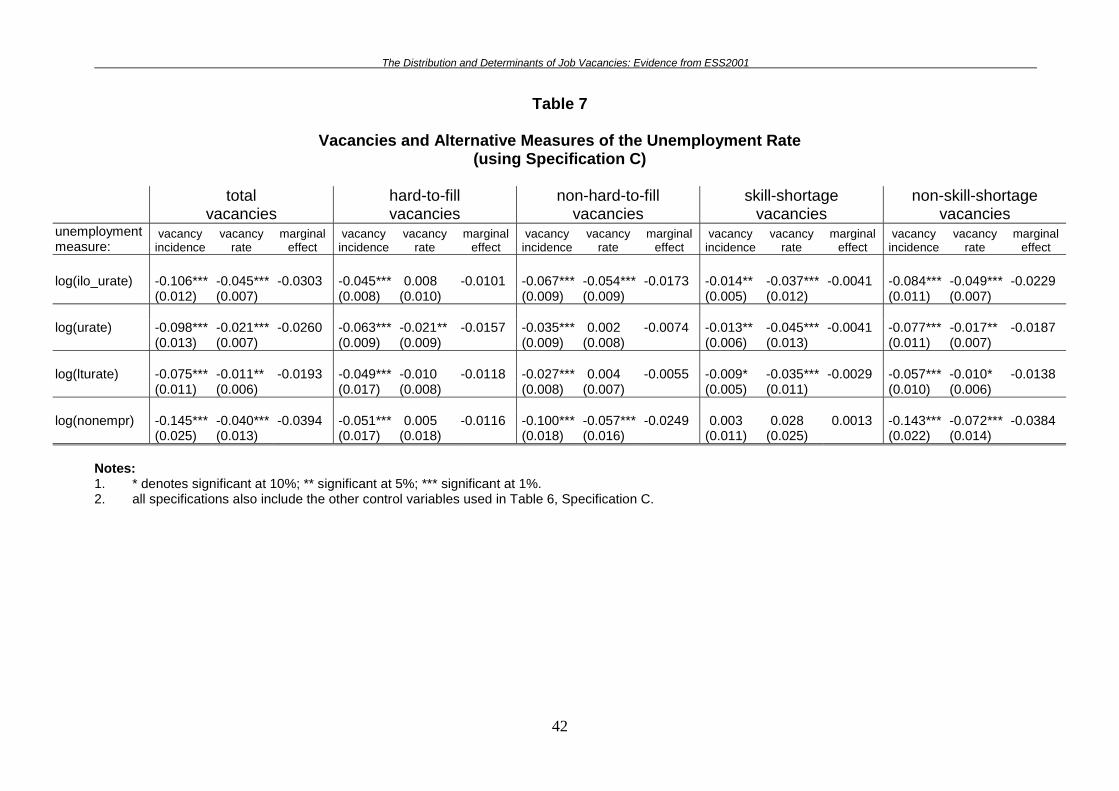
The Distribution and Determinants of Job Vacancies: Evidence from ESS2001
42
Table 7
Vacancies and Alternative Measures of the Unemployment Rate (using Specification C)
total
vacancies hard-to-fill vacancies
non-hard-to-fill vacancies
skill-shortage vacancies
non-skill-shortage vacancies
unemployment measure:
vacancy incidence
vacancy rate
marginal effect
vacancy incidence
vacancy rate
marginal effect
vacancy incidence
vacancy rate
marginal effect
vacancy incidence
vacancy rate
marginal effect
vacancy incidence
vacancy rate
marginal effect
log(ilo_urate) -0.106*** -0.045*** -0.0303 -0.045*** 0.008 -0.0101 -0.067*** -0.054*** -0.0173 -0.014** -0.037*** -0.0041 -0.084*** -0.049*** -0.0229 (0.012) (0.007) (0.008) (0.010) (0.009) (0.009) (0.005) (0.012) (0.011) (0.007) log(urate) -0.098*** -0.021*** -0.0260 -0.063*** -0.021** -0.0157 -0.035*** 0.002 -0.0074 -0.013** -0.045*** -0.0041 -0.077*** -0.017** -0.0187 (0.013) (0.007) (0.009) (0.009) (0.009) (0.008) (0.006) (0.013) (0.011) (0.007) log(lturate) -0.075*** -0.011** -0.0193 -0.049*** -0.010 -0.0118 -0.027*** 0.004 -0.0055 -0.009* -0.035*** -0.0029 -0.057*** -0.010* -0.0138 (0.011) (0.006) (0.017) (0.008) (0.008) (0.007) (0.005) (0.011) (0.010) (0.006) log(nonempr) -0.145*** -0.040*** -0.0394 -0.051*** 0.005 -0.0116 -0.100*** -0.057*** -0.0249 0.003 0.028 0.0013 -0.143*** -0.072*** -0.0384
(0.025) (0.013) (0.017) (0.018) (0.018) (0.016) (0.011) (0.025) (0.022) (0.014) Notes: 1. * denotes significant at 10%; ** significant at 5%; *** significant at 1%. 2. all specifications also include the other control variables used in Table 6, Specification C.
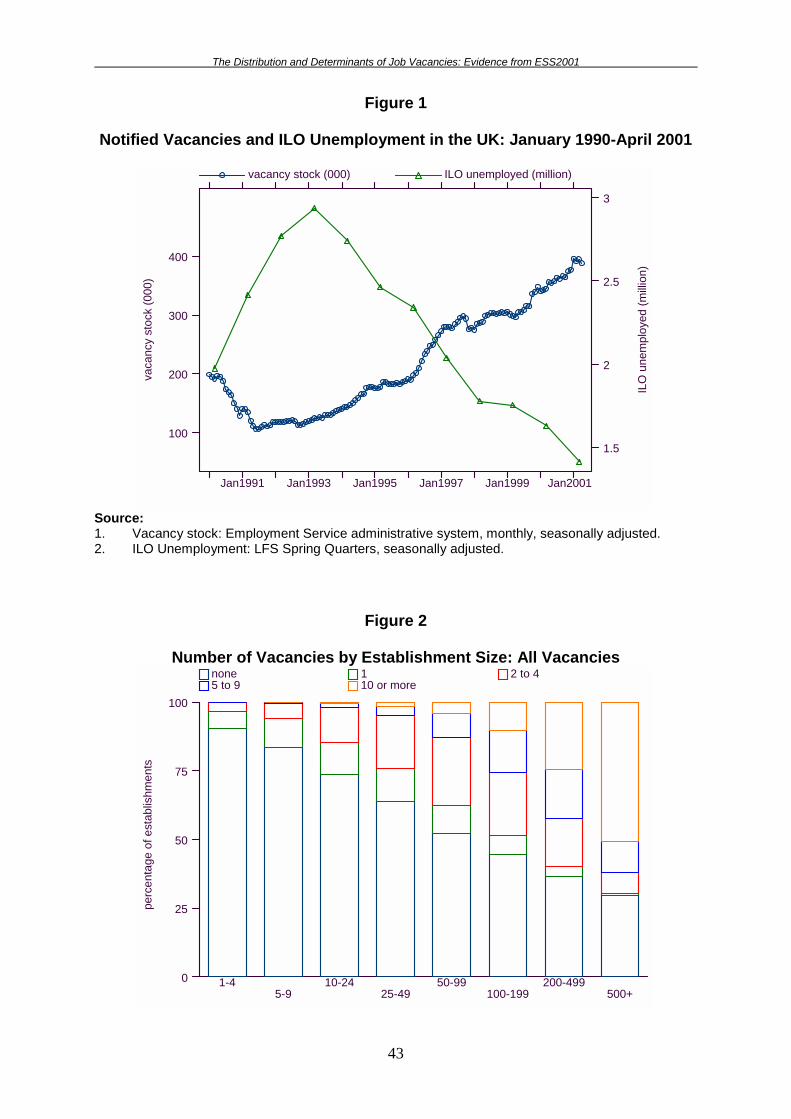
The Distribution and Determinants of Job Vacancies: Evidence from ESS2001
43
Figure 1
Notified Vacancies and ILO Unemployment in the UK: January 1990-April 2001
vaca
ncy
stoc
k (0
00)
ILO
une
mpl
oyed
(milli
on)
vacancy stock (000) ILO unemployed (million)
Jan1991 Jan1993 Jan1995 Jan1997 Jan1999 Jan2001
100
200
300
400
1.5
2
2.5
3
Source: 1. Vacancy stock: Employment Service administrative system, monthly, seasonally adjusted. 2. ILO Unemployment: LFS Spring Quarters, seasonally adjusted.
Figure 2
Number of Vacancies by Establishment Size: All Vacancies
perc
enta
ge o
f est
ablis
hmen
ts
0
25
50
75
100
none 1 2 to 4 5 to 9 10 or more
1-45-9
10-2425-49
50-99100-199
200-499500+
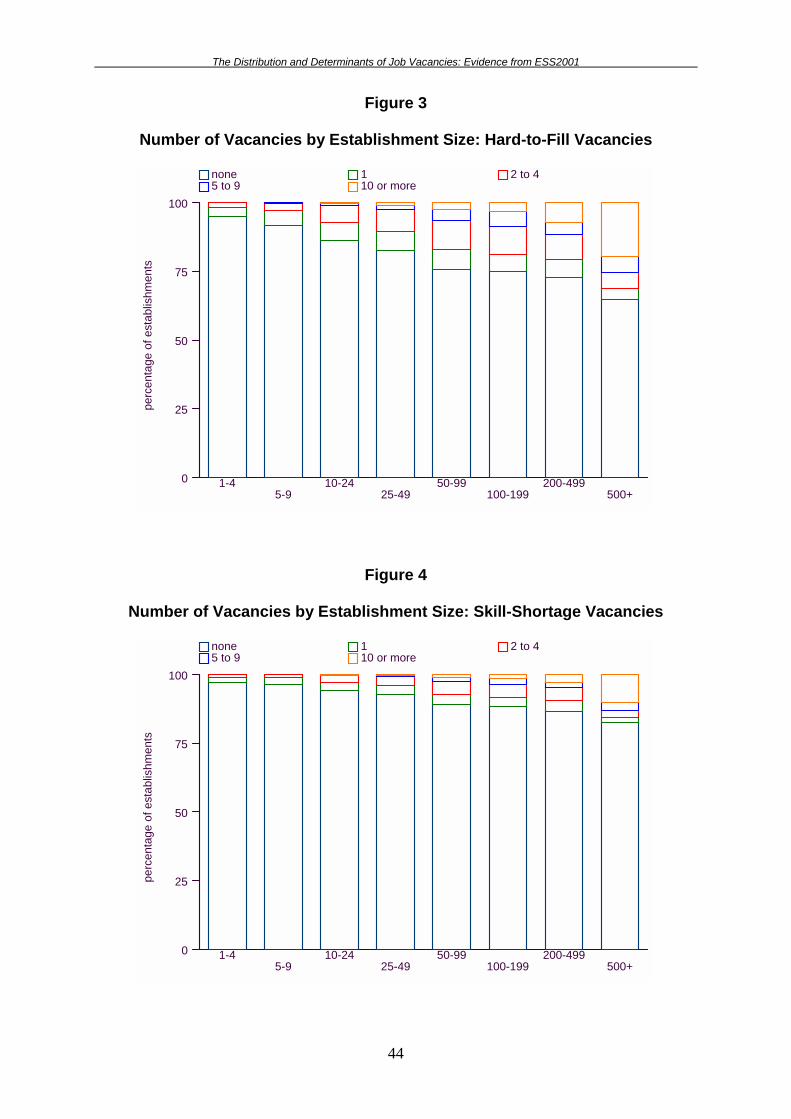
The Distribution and Determinants of Job Vacancies: Evidence from ESS2001
44
Figure 3
Number of Vacancies by Establishment Size: Hard-to-Fill Vacancies
perc
enta
ge o
f est
ablis
hmen
ts
0
25
50
75
100
none 1 2 to 4 5 to 9 10 or more
1-45-9
10-2425-49
50-99100-199
200-499500+
Figure 4
Number of Vacancies by Establishment Size: Skill-Shortage Vacancies
perc
enta
ge o
f est
ablis
hmen
ts
0
25
50
75
100
none 1 2 to 4 5 to 9 10 or more
1-45-9
10-2425-49
50-99100-199
200-499500+
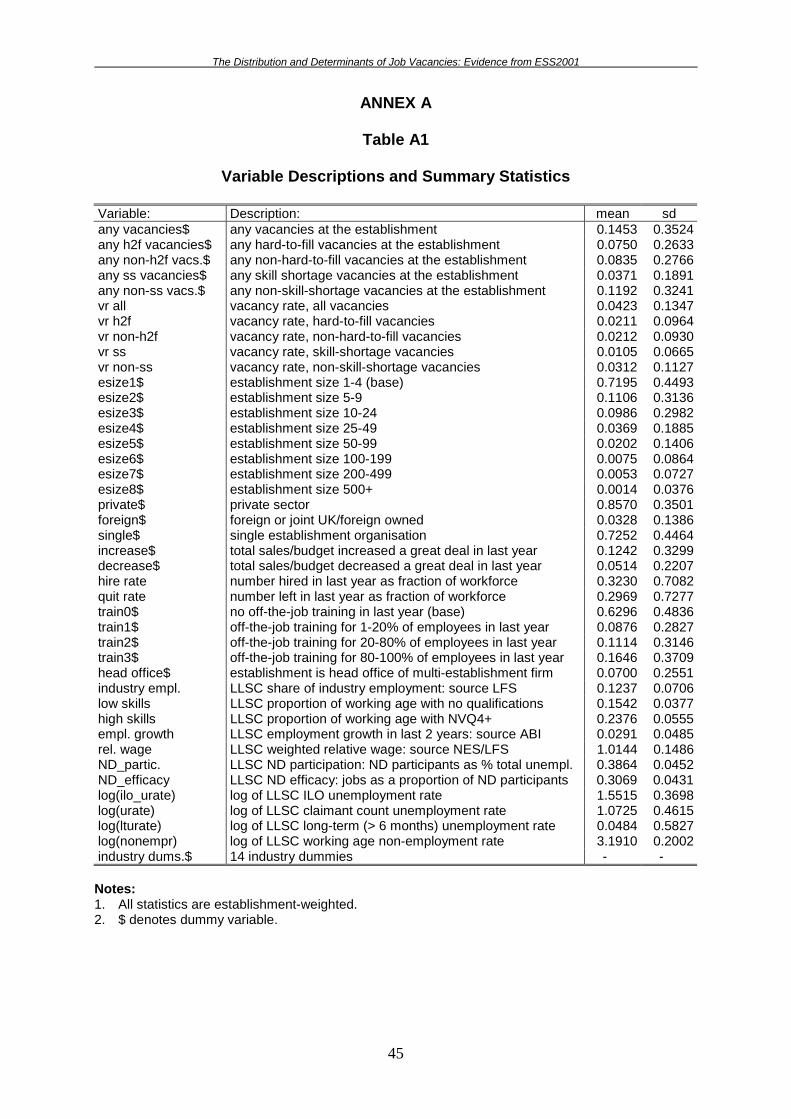
The Distribution and Determinants of Job Vacancies: Evidence from ESS2001
45
ANNEX A
Table A1
Variable Descriptions and Summary Statistics
Variable: Description: mean sd any vacancies$ any vacancies at the establishment 0.1453 0.3524 any h2f vacancies$ any hard-to-fill vacancies at the establishment 0.0750 0.2633 any non-h2f vacs.$ any non-hard-to-fill vacancies at the establishment 0.0835 0.2766 any ss vacancies$ any skill shortage vacancies at the establishment 0.0371 0.1891 any non-ss vacs.$ any non-skill-shortage vacancies at the establishment 0.1192 0.3241 vr all vacancy rate, all vacancies 0.0423 0.1347 vr h2f vacancy rate, hard-to-fill vacancies 0.0211 0.0964 vr non-h2f vacancy rate, non-hard-to-fill vacancies 0.0212 0.0930 vr ss vacancy rate, skill-shortage vacancies 0.0105 0.0665 vr non-ss vacancy rate, non-skill-shortage vacancies 0.0312 0.1127 esize1$ establishment size 1-4 (base) 0.7195 0.4493 esize2$ establishment size 5-9 0.1106 0.3136 esize3$ establishment size 10-24 0.0986 0.2982 esize4$ establishment size 25-49 0.0369 0.1885 esize5$ establishment size 50-99 0.0202 0.1406 esize6$ establishment size 100-199 0.0075 0.0864 esize7$ establishment size 200-499 0.0053 0.0727 esize8$ establishment size 500+ 0.0014 0.0376 private$ private sector 0.8570 0.3501 foreign$ foreign or joint UK/foreign owned 0.0328 0.1386 single$ single establishment organisation 0.7252 0.4464 increase$ total sales/budget increased a great deal in last year 0.1242 0.3299 decrease$ total sales/budget decreased a great deal in last year 0.0514 0.2207 hire rate number hired in last year as fraction of workforce 0.3230 0.7082 quit rate number left in last year as fraction of workforce 0.2969 0.7277 train0$ no off-the-job training in last year (base) 0.6296 0.4836 train1$ off-the-job training for 1-20% of employees in last year 0.0876 0.2827 train2$ off-the-job training for 20-80% of employees in last year 0.1114 0.3146 train3$ off-the-job training for 80-100% of employees in last year 0.1646 0.3709 head office$ establishment is head office of multi-establishment firm 0.0700 0.2551 industry empl. LLSC share of industry employment: source LFS 0.1237 0.0706 low skills LLSC proportion of working age with no qualifications 0.1542 0.0377 high skills LLSC proportion of working age with NVQ4+ 0.2376 0.0555 empl. growth LLSC employment growth in last 2 years: source ABI 0.0291 0.0485 rel. wage LLSC weighted relative wage: source NES/LFS 1.0144 0.1486 ND_partic. LLSC ND participation: ND participants as % total unempl. 0.3864 0.0452 ND_efficacy LLSC ND efficacy: jobs as a proportion of ND participants 0.3069 0.0431 log(ilo_urate) log of LLSC ILO unemployment rate 1.5515 0.3698 log(urate) log of LLSC claimant count unemployment rate 1.0725 0.4615 log(lturate) log of LLSC long-term (> 6 months) unemployment rate 0.0484 0.5827 log(nonempr) log of LLSC working age non-employment rate 3.1910 0.2002 industry dums.$ 14 industry dummies - - Notes: 1. All statistics are establishment-weighted. 2. $ denotes dummy variable.