Embed Size (px)
Citation preview
MOODY’S ANALYTICS CAPITAL MARKETS RESEARCH / WEEKLY MARKET OUTLOOK
1
Moody’s Analytics and Moody’s Investors Service maintain separate and independent economic forecasts. This publication uses the forecasts of Moody’s Analytics. Moody’s Analytics markets and distributes all Moody’s Capital Markets Research materials. Moody’s Analytics does not provide investment advisory services or products. For further detail, please see the last page.
The Dot Plot ThickensThe Federal Reserve on Wednesday didn’t alter its description of U.S. inflation. Policymakers still view the acceleration as transitory, but there was a big shift in the so-called “dot plot” that tracks interest-rate projections by the members of the central bank’s Federal Open Market Committee. Changes to the committee’s post-meeting statement were modest and not substantive, but its updated Summary of Economic Projections and the dot plot caught markets' attention.
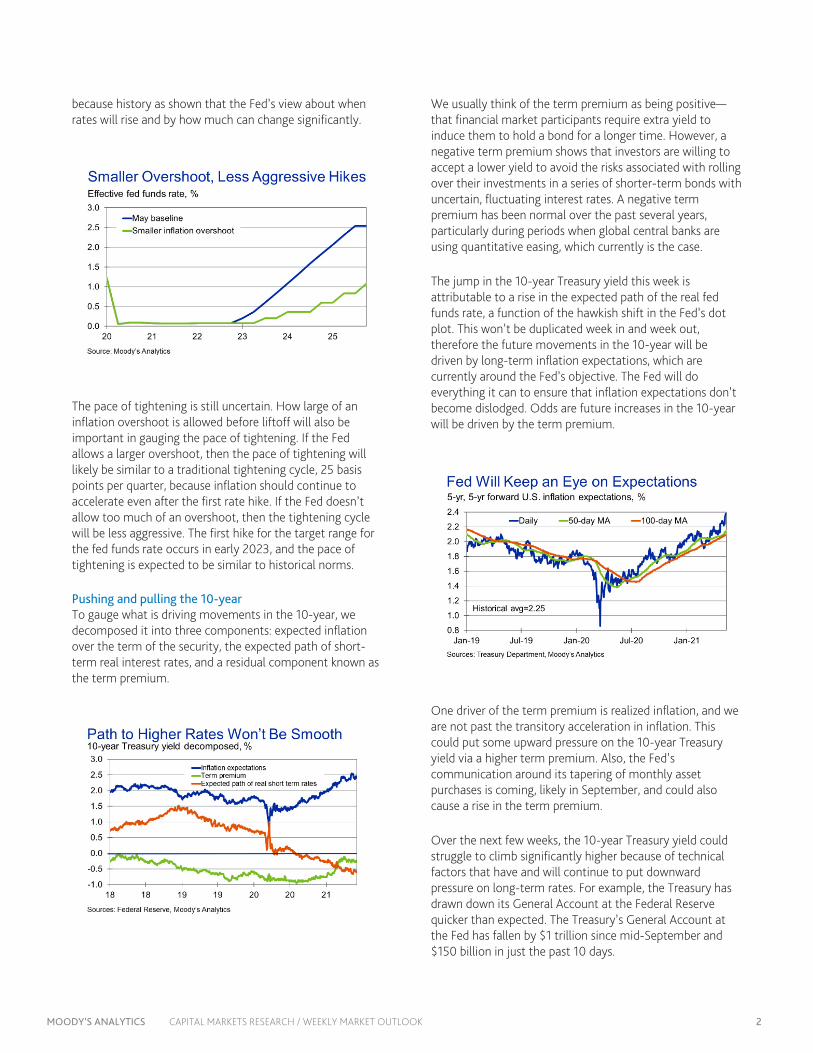
Thirteen of 18 Fed officials see the first-rate hike occurring by the end of 2023, versus seven in March. The dot plot now shows two rate hikes in 2023, but it's hard to glean how aggressive this tightening cycle will be, as it hinges on how much of an inflation overshoot the Fed will stomach.
There were seven officials that expected a rate hike in 2022, up from four in March. If a couple more bring forward their anticipation for hikes to 2022, that will move the median projection. Based on Eurodollars, markets are now pricing in the first rate hike by the end of 2022. Odds are the Fed’s hawks are the anxious ones and they made their voices heard at the June meeting. But the core of the FOMC, including Chairman Jerome Powell, Richard Clarida and Lael Brainard, are still in the dovish camp and likely favor raising rates in 2023. Powell hasn't been a fan of the dot plot, and the shift is going to make it more difficult for him from a communication perspective.
The dot plot now has two rate hikes in 2023, more in line with our baseline forecast, which has the first rate hike occurring in early 2023. Also, the dot plot shows participants assessment of “appropriate monetary policy” and this can change. The dot plot in 2013 and 2014 showed an earlier increase in the target range for the fed funds rate than actually occurred. Even once the Fed began raising rates in late 2015, the dot plot overstated the aggressiveness of the tightening cycle. So, the dot plot isn’t a perfect crystal ball, and some Fed officials, including Powell, have attempted to downplay it. Still, based on the reaction this week, financial markets are very sensitive to shifts in the dots. We normally do not put too much emphasis on the dot plot beyond the current year
WEEKLY MARKET OUTLOOK JUNE 17, 2021
Lead Author Ryan Sweet Senior Director-Economic Research [email protected]
Asia-Pacific Katrina Ell Economist Shahana Mukherjee Economist
Europe Ross Cioffi Economist
U.S. Mark Zandi Chief Economist Michael Ferlez Economist Ryan Kelly Data Specialist
Editor Reid Kanaley
Contact Us Americas +1.212.553.1658 [email protected]
Europe +44.20.7772.5454 [email protected]
Asia (Excluding Japan) +85 2 2916 1121 [email protected]
Japan +81 3 5408 4100 [email protected]
Table of Contents
Top of Mind ...................................... 4
Week Ahead in Global Economy ... 7
Geopolitical Risks ............................ 8
The Long View U.S. ................................................................. 9 Europe .......................................................... 11 Asia-Pacific .................................................. 12
Ratings Roundup ........................... 13
Market Data ................................... 16
CDS Movers .................................... 17
Issuance .......................................... 19
MOODY’S ANALYTICS CAPITAL MARKETS RESEARCH / WEEKLY MARKET OUTLOOK 2
because history as shown that the Fed’s view about when rates will rise and by how much can change significantly.
The pace of tightening is still uncertain. How large of an inflation overshoot is allowed before liftoff will also be important in gauging the pace of tightening. If the Fed allows a larger overshoot, then the pace of tightening will likely be similar to a traditional tightening cycle, 25 basis points per quarter, because inflation should continue to accelerate even after the first rate hike. If the Fed doesn’t allow too much of an overshoot, then the tightening cycle will be less aggressive. The first hike for the target range for the fed funds rate occurs in early 2023, and the pace of tightening is expected to be similar to historical norms.
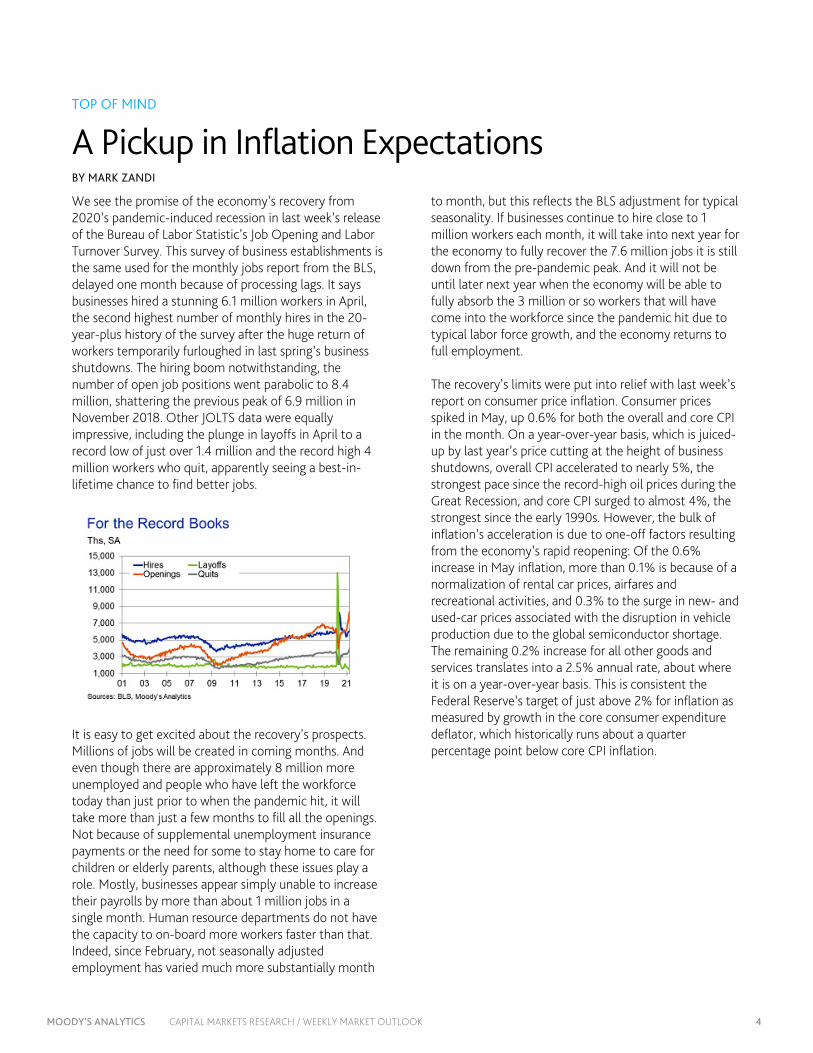
Pushing and pulling the 10-year To gauge what is driving movements in the 10-year, we decomposed it into three components: expected inflation over the term of the security, the expected path of short-term real interest rates, and a residual component known as the term premium.
We usually think of the term premium as being positive—that financial market participants require extra yield to induce them to hold a bond for a longer time. However, a negative term premium shows that investors are willing to accept a lower yield to avoid the risks associated with rolling over their investments in a series of shorter-term bonds with uncertain, fluctuating interest rates. A negative term premium has been normal over the past several years, particularly during periods when global central banks are using quantitative easing, which currently is the case.
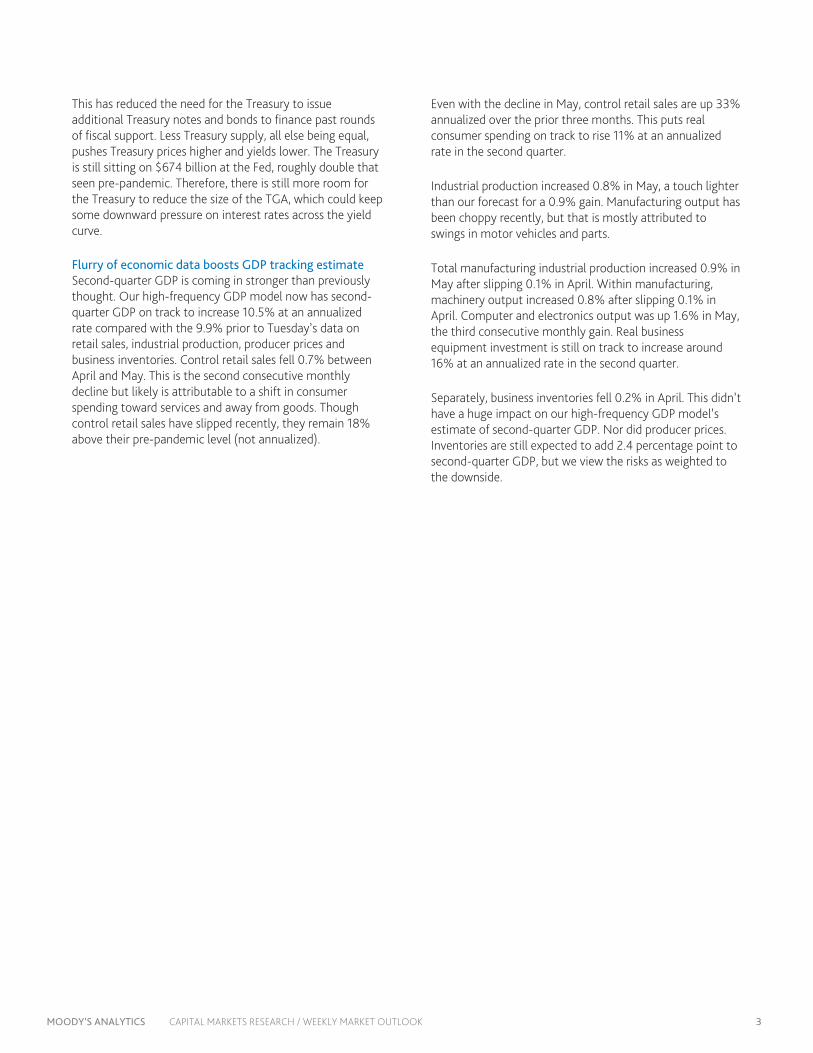
The jump in the 10-year Treasury yield this week is attributable to a rise in the expected path of the real fed funds rate, a function of the hawkish shift in the Fed’s dot plot. This won’t be duplicated week in and week out, therefore the future movements in the 10-year will be driven by long-term inflation expectations, which are currently around the Fed’s objective. The Fed will do everything it can to ensure that inflation expectations don’t become dislodged. Odds are future increases in the 10-year will be driven by the term premium.
One driver of the term premium is realized inflation, and we are not past the transitory acceleration in inflation. This could put some upward pressure on the 10-year Treasury yield via a higher term premium. Also, the Fed’s communication around its tapering of monthly asset purchases is coming, likely in September, and could also cause a rise in the term premium.
Over the next few weeks, the 10-year Treasury yield could struggle to climb significantly higher because of technical factors that have and will continue to put downward pressure on long-term rates. For example, the Treasury has drawn down its General Account at the Federal Reserve quicker than expected. The Treasury’s General Account at the Fed has fallen by $1 trillion since mid-September and $150 billion in just the past 10 days.
MOODY’S ANALYTICS CAPITAL MARKETS RESEARCH / WEEKLY MARKET OUTLOOK 3
This has reduced the need for the Treasury to issue additional Treasury notes and bonds to finance past rounds of fiscal support. Less Treasury supply, all else being equal, pushes Treasury prices higher and yields lower. The Treasury is still sitting on $674 billion at the Fed, roughly double that seen pre-pandemic. Therefore, there is still more room for the Treasury to reduce the size of the TGA, which could keep some downward pressure on interest rates across the yield curve.
Flurry of economic data boosts GDP tracking estimate Second-quarter GDP is coming in stronger than previously thought. Our high-frequency GDP model now has second-quarter GDP on track to increase 10.5% at an annualized rate compared with the 9.9% prior to Tuesday’s data on retail sales, industrial production, producer prices and business inventories. Control retail sales fell 0.7% between April and May. This is the second consecutive monthly decline but likely is attributable to a shift in consumer spending toward services and away from goods. Though control retail sales have slipped recently, they remain 18% above their pre-pandemic level (not annualized).
Even with the decline in May, control retail sales are up 33% annualized over the prior three months. This puts real consumer spending on track to rise 11% at an annualized rate in the second quarter.
Industrial production increased 0.8% in May, a touch lighter than our forecast for a 0.9% gain. Manufacturing output has been choppy recently, but that is mostly attributed to swings in motor vehicles and parts.
Total manufacturing industrial production increased 0.9% in May after slipping 0.1% in April. Within manufacturing, machinery output increased 0.8% after slipping 0.1% in April. Computer and electronics output was up 1.6% in May, the third consecutive monthly gain. Real business equipment investment is still on track to increase around 16% at an annualized rate in the second quarter.
Separately, business inventories fell 0.2% in April. This didn’t have a huge impact on our high-frequency GDP model’s estimate of second-quarter GDP. Nor did producer prices. Inventories are still expected to add 2.4 percentage point to second-quarter GDP, but we view the risks as weighted to the downside.
MOODY’S ANALYTICS CAPITAL MARKETS RESEARCH / WEEKLY MARKET OUTLOOK 4
TOP OF MIND
A Pickup in Inflation Expectations BY MARK ZANDI
We see the promise of the economy’s recovery from 2020’s pandemic-induced recession in last week’s release of the Bureau of Labor Statistic’s Job Opening and Labor Turnover Survey. This survey of business establishments is the same used for the monthly jobs report from the BLS, delayed one month because of processing lags. It says businesses hired a stunning 6.1 million workers in April, the second highest number of monthly hires in the 20-year-plus history of the survey after the huge return of workers temporarily furloughed in last spring’s business shutdowns. The hiring boom notwithstanding, the number of open job positions went parabolic to 8.4 million, shattering the previous peak of 6.9 million in November 2018. Other JOLTS data were equally impressive, including the plunge in layoffs in April to a record low of just over 1.4 million and the record high 4 million workers who quit, apparently seeing a best-in-lifetime chance to find better jobs.
It is easy to get excited about the recovery’s prospects. Millions of jobs will be created in coming months. And even though there are approximately 8 million more unemployed and people who have left the workforce today than just prior to when the pandemic hit, it will take more than just a few months to fill all the openings. Not because of supplemental unemployment insurance payments or the need for some to stay home to care for children or elderly parents, although these issues play a role. Mostly, businesses appear simply unable to increase their payrolls by more than about 1 million jobs in a single month. Human resource departments do not have the capacity to on-board more workers faster than that. Indeed, since February, not seasonally adjusted employment has varied much more substantially month
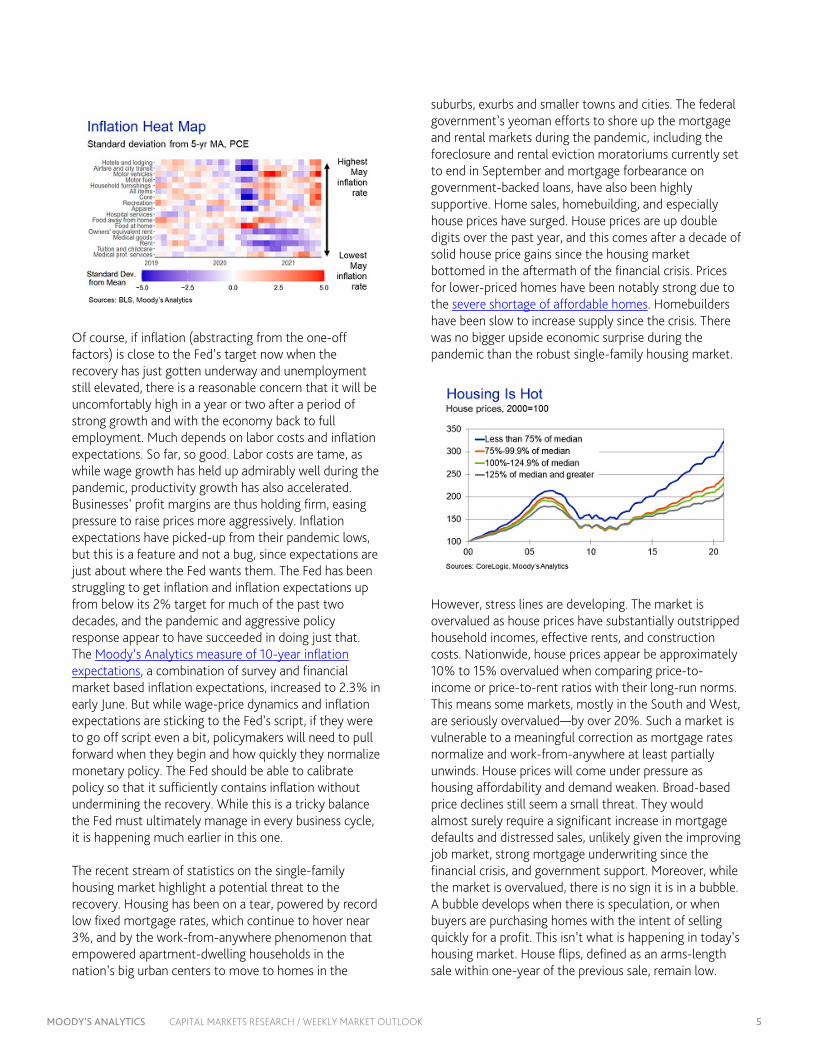
to month, but this reflects the BLS adjustment for typical seasonality. If businesses continue to hire close to 1 million workers each month, it will take into next year for the economy to fully recover the 7.6 million jobs it is still down from the pre-pandemic peak. And it will not be until later next year when the economy will be able to fully absorb the 3 million or so workers that will have come into the workforce since the pandemic hit due to typical labor force growth, and the economy returns to full employment. The recovery’s limits were put into relief with last week’s report on consumer price inflation. Consumer prices spiked in May, up 0.6% for both the overall and core CPI in the month. On a year-over-year basis, which is juiced-up by last year’s price cutting at the height of business shutdowns, overall CPI accelerated to nearly 5%, the strongest pace since the record-high oil prices during the Great Recession, and core CPI surged to almost 4%, the strongest since the early 1990s. However, the bulk of inflation’s acceleration is due to one-off factors resulting from the economy’s rapid reopening: Of the 0.6% increase in May inflation, more than 0.1% is because of a normalization of rental car prices, airfares and recreational activities, and 0.3% to the surge in new- and used-car prices associated with the disruption in vehicle production due to the global semiconductor shortage. The remaining 0.2% increase for all other goods and services translates into a 2.5% annual rate, about where it is on a year-over-year basis. This is consistent the Federal Reserve’s target of just above 2% for inflation as measured by growth in the core consumer expenditure deflator, which historically runs about a quarter percentage point below core CPI inflation.
MOODY’S ANALYTICS CAPITAL MARKETS RESEARCH / WEEKLY MARKET OUTLOOK 5
Of course, if inflation (abstracting from the one-off factors) is close to the Fed’s target now when the recovery has just gotten underway and unemployment still elevated, there is a reasonable concern that it will be uncomfortably high in a year or two after a period of strong growth and with the economy back to full employment. Much depends on labor costs and inflation expectations. So far, so good. Labor costs are tame, as while wage growth has held up admirably well during the pandemic, productivity growth has also accelerated. Businesses’ profit margins are thus holding firm, easing pressure to raise prices more aggressively. Inflation expectations have picked-up from their pandemic lows, but this is a feature and not a bug, since expectations are just about where the Fed wants them. The Fed has been struggling to get inflation and inflation expectations up from below its 2% target for much of the past two decades, and the pandemic and aggressive policy response appear to have succeeded in doing just that. The Moody’s Analytics measure of 10-year inflation expectations, a combination of survey and financial market based inflation expectations, increased to 2.3% in early June. But while wage-price dynamics and inflation expectations are sticking to the Fed’s script, if they were to go off script even a bit, policymakers will need to pull forward when they begin and how quickly they normalize monetary policy. The Fed should be able to calibrate policy so that it sufficiently contains inflation without undermining the recovery. While this is a tricky balance the Fed must ultimately manage in every business cycle, it is happening much earlier in this one. The recent stream of statistics on the single-family housing market highlight a potential threat to the recovery. Housing has been on a tear, powered by record low fixed mortgage rates, which continue to hover near 3%, and by the work-from-anywhere phenomenon that empowered apartment-dwelling households in the nation’s big urban centers to move to homes in the
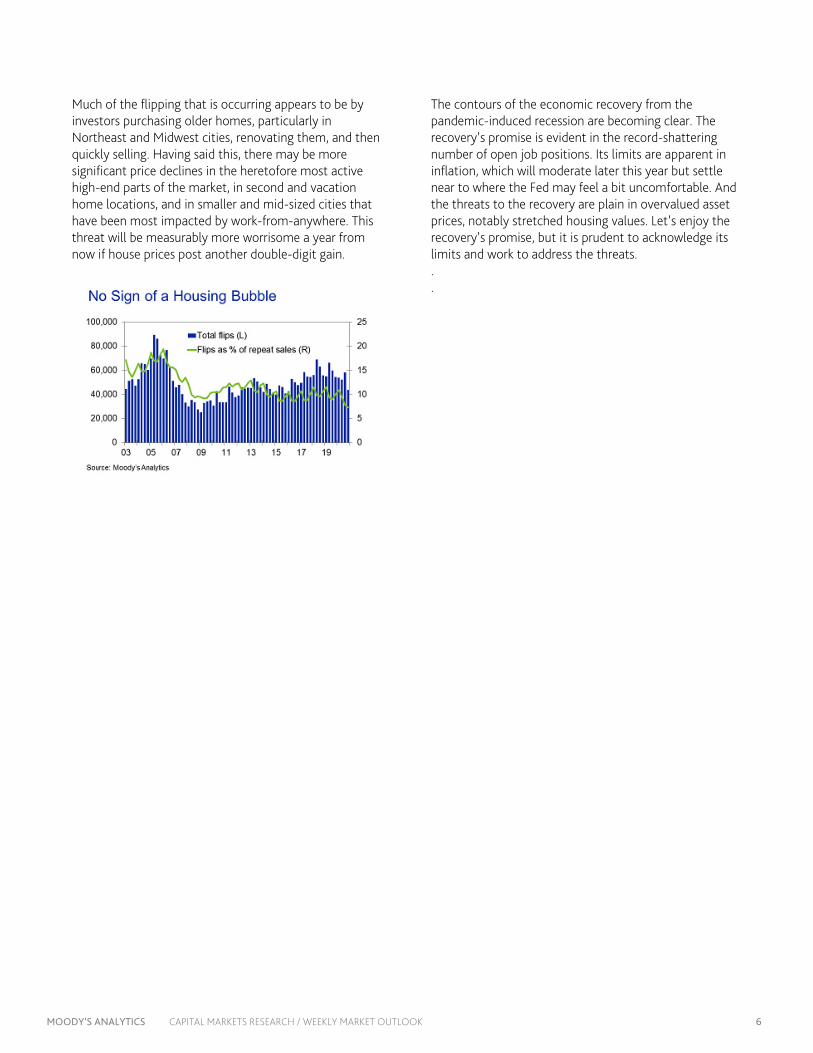
suburbs, exurbs and smaller towns and cities. The federal government’s yeoman efforts to shore up the mortgage and rental markets during the pandemic, including the foreclosure and rental eviction moratoriums currently set to end in September and mortgage forbearance on government-backed loans, have also been highly supportive. Home sales, homebuilding, and especially house prices have surged. House prices are up double digits over the past year, and this comes after a decade of solid house price gains since the housing market bottomed in the aftermath of the financial crisis. Prices for lower-priced homes have been notably strong due to the severe shortage of affordable homes. Homebuilders have been slow to increase supply since the crisis. There was no bigger upside economic surprise during the pandemic than the robust single-family housing market.
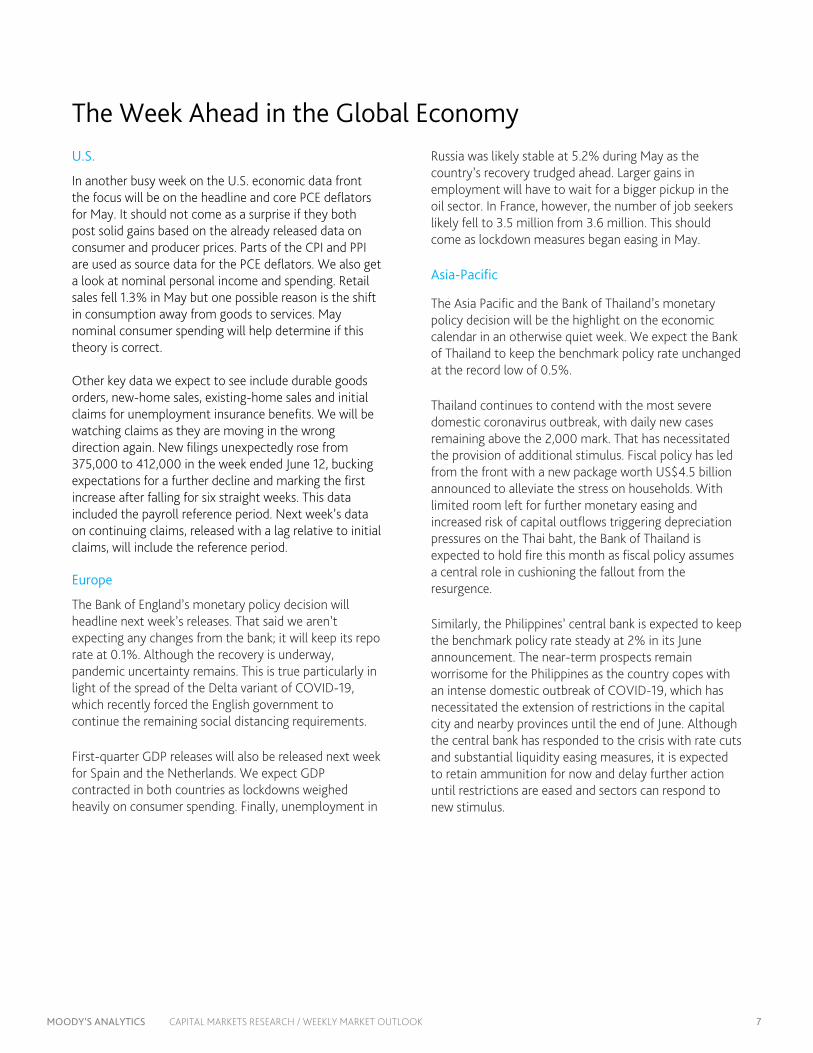
However, stress lines are developing. The market is overvalued as house prices have substantially outstripped household incomes, effective rents, and construction costs. Nationwide, house prices appear be approximately 10% to 15% overvalued when comparing price-to-income or price-to-rent ratios with their long-run norms. This means some markets, mostly in the South and West, are seriously overvalued—by over 20%. Such a market is vulnerable to a meaningful correction as mortgage rates normalize and work-from-anywhere at least partially unwinds. House prices will come under pressure as housing affordability and demand weaken. Broad-based price declines still seem a small threat. They would almost surely require a significant increase in mortgage defaults and distressed sales, unlikely given the improving job market, strong mortgage underwriting since the financial crisis, and government support. Moreover, while the market is overvalued, there is no sign it is in a bubble. A bubble develops when there is speculation, or when buyers are purchasing homes with the intent of selling quickly for a profit. This isn’t what is happening in today’s housing market. House flips, defined as an arms-length sale within one-year of the previous sale, remain low.
MOODY’S ANALYTICS CAPITAL MARKETS RESEARCH / WEEKLY MARKET OUTLOOK 6
Much of the flipping that is occurring appears to be by investors purchasing older homes, particularly in Northeast and Midwest cities, renovating them, and then quickly selling. Having said this, there may be more significant price declines in the heretofore most active high-end parts of the market, in second and vacation home locations, and in smaller and mid-sized cities that have been most impacted by work-from-anywhere. This threat will be measurably more worrisome a year from now if house prices post another double-digit gain.
The contours of the economic recovery from the pandemic-induced recession are becoming clear. The recovery’s promise is evident in the record-shattering number of open job positions. Its limits are apparent in inflation, which will moderate later this year but settle near to where the Fed may feel a bit uncomfortable. And the threats to the recovery are plain in overvalued asset prices, notably stretched housing values. Let’s enjoy the recovery’s promise, but it is prudent to acknowledge its limits and work to address the threats. . .
MOODY’S ANALYTICS CAPITAL MARKETS RESEARCH / WEEKLY MARKET OUTLOOK 7
The Week Ahead in the Global Economy
U.S.
In another busy week on the U.S. economic data front the focus will be on the headline and core PCE deflators for May. It should not come as a surprise if they both post solid gains based on the already released data on consumer and producer prices. Parts of the CPI and PPI are used as source data for the PCE deflators. We also get a look at nominal personal income and spending. Retail sales fell 1.3% in May but one possible reason is the shift in consumption away from goods to services. May nominal consumer spending will help determine if this theory is correct. Other key data we expect to see include durable goods orders, new-home sales, existing-home sales and initial claims for unemployment insurance benefits. We will be watching claims as they are moving in the wrong direction again. New filings unexpectedly rose from 375,000 to 412,000 in the week ended June 12, bucking expectations for a further decline and marking the first increase after falling for six straight weeks. This data included the payroll reference period. Next week’s data on continuing claims, released with a lag relative to initial claims, will include the reference period. Europe
The Bank of England’s monetary policy decision will headline next week’s releases. That said we aren’t expecting any changes from the bank; it will keep its repo rate at 0.1%. Although the recovery is underway, pandemic uncertainty remains. This is true particularly in light of the spread of the Delta variant of COVID-19, which recently forced the English government to continue the remaining social distancing requirements.
First-quarter GDP releases will also be released next week for Spain and the Netherlands. We expect GDP contracted in both countries as lockdowns weighed heavily on consumer spending. Finally, unemployment in
Russia was likely stable at 5.2% during May as the country’s recovery trudged ahead. Larger gains in employment will have to wait for a bigger pickup in the oil sector. In France, however, the number of job seekers likely fell to 3.5 million from 3.6 million. This should come as lockdown measures began easing in May.
Asia-Pacific
The Asia Pacific and the Bank of Thailand’s monetary policy decision will be the highlight on the economic calendar in an otherwise quiet week. We expect the Bank of Thailand to keep the benchmark policy rate unchanged at the record low of 0.5%.
Thailand continues to contend with the most severe domestic coronavirus outbreak, with daily new cases remaining above the 2,000 mark. That has necessitated the provision of additional stimulus. Fiscal policy has led from the front with a new package worth US$4.5 billion announced to alleviate the stress on households. With limited room left for further monetary easing and increased risk of capital outflows triggering depreciation pressures on the Thai baht, the Bank of Thailand is expected to hold fire this month as fiscal policy assumes a central role in cushioning the fallout from the resurgence.
Similarly, the Philippines’ central bank is expected to keep the benchmark policy rate steady at 2% in its June announcement. The near-term prospects remain worrisome for the Philippines as the country copes with an intense domestic outbreak of COVID-19, which has necessitated the extension of restrictions in the capital city and nearby provinces until the end of June. Although the central bank has responded to the crisis with rate cuts and substantial liquidity easing measures, it is expected to retain ammunition for now and delay further action until restrictions are eased and sectors can respond to new stimulus.
MOODY’S ANALYTICS CAPITAL MARKETS RESEARCH / WEEKLY MARKET OUTLOOK 8
Geopolitical Calendar
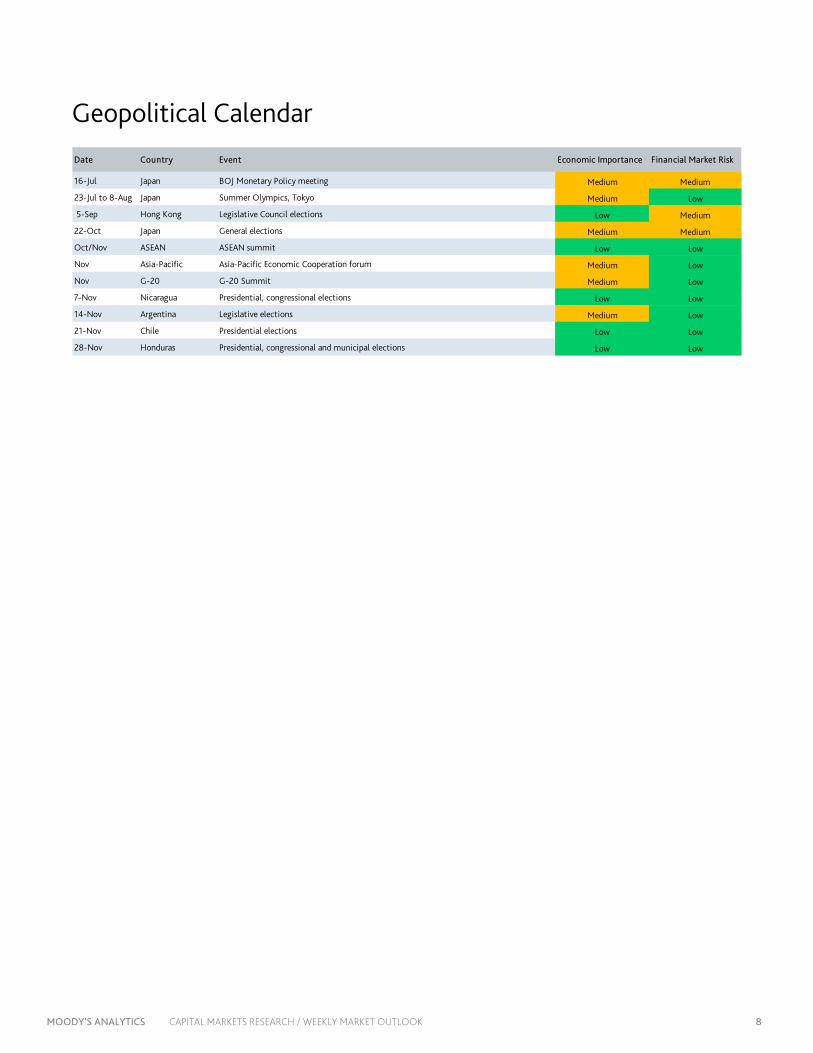
Date Country Event Economic Importance Financial Market Risk
16-Jul Japan BOJ Monetary Policy meeting Medium Medium
23-Jul to 8-Aug Japan Summer Olympics, Tokyo Medium Low
5-Sep Hong Kong Legislative Council elections Low Medium
22-Oct Japan General elections Medium Medium
Oct/Nov ASEAN ASEAN summit Low Low
Nov Asia-Pacific Asia-Pacific Economic Cooperation forum Medium Low
Nov G-20 G-20 Summit Medium Low
7-Nov Nicaragua Presidential, congressional elections Low Low
14-Nov Argentina Legislative elections Medium Low
21-Nov Chile Presidential elections Low Low
28-Nov Honduras Presidential, congressional and municipal elections Low Low
MOODY’S ANALYTICS CAPITAL MARKETS RESEARCH / WEEKLY MARKET OUTLOOK 9
THE LONG VIEW: U.S.
The 10-year T-yield could struggle to climb much higher because of technical factors. BY RYAN SWEET
CREDIT SPREADS Moody's long-term average corporate bond yield is 93 basis points, down 3 bp from this time last week. This is below the yield's high over the past 12 months of 139 bp and a new low over the period. This spread may be no wider than 115 bp by year-end 2021.
The long-term investment grade corporate bond yield is 129 bp, down a touch from last week, a new low over the past 12 months, and well below its recent high of 222 basis points.
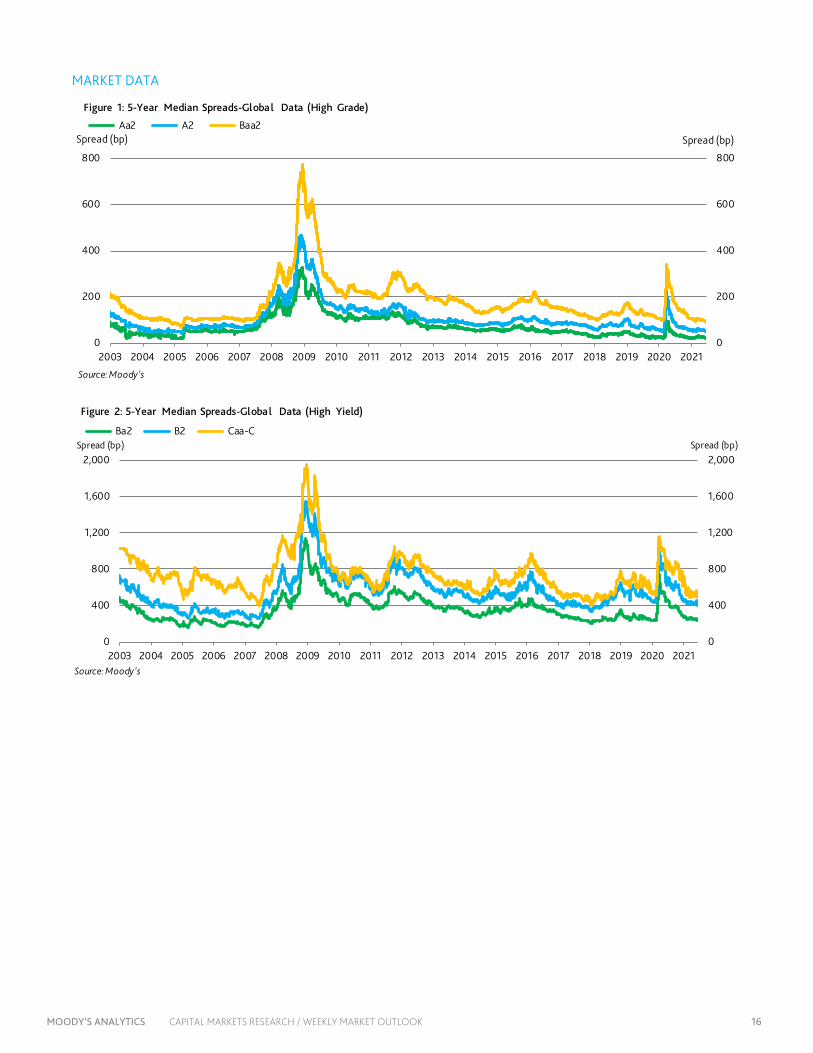
The recent composite high-yield option adjusted bond spread of 317 bp approximates what is suggested by the accompanying long-term Baa industrial company bond yield spread but is narrower than that implied the recent VIX of 18.5.
DEFAULTS The global speculative-grade corporate default rate fell to 4.9% for the trailing 12 months ended in May, returning to where it stood a year earlier and down from 5.6% at the end of April. Among high-yield bond issuers, the U.S. default rate was 2.8% at the end of May when measured on a dollar-volume basis, down from 4.5% at the end of April. The decline reflects the exit of a few large defaults in 2020 from the trailing 12-month window.
According to the Moody’s Credit Transition Model, the trailing 12-month global speculative-grade default rate will fall to 1.8% by the end of the year under the MIS baseline scenario and remain little change through May 2022. To derive default-rate forecasts, Moody's CTM uses inputs, including ratings and rating transitions, as well as assumed future paths of high-yield bond spreads and changes in unemployment rates.
In the Moody’s Investors Service baseline scenario, the speculative-grade default rate will drop to 1.7% at the end of this year before creeping higher in April and May of next year, touching 1.9%. For Europe, the speculative-grade default rate will steadily decline over the next several months and end 2021 at 1.9%.
U.S. CORPORATE BOND ISSUANCE First-quarter 2020’s worldwide offerings of corporate bonds revealed annual advances of 14% for IG and 19%
for high-yield, wherein US$-denominated offerings increased 45% for IG and grew 12% for high yield.
Second-quarter 2020’s worldwide offerings of corporate bonds revealed annual surges of 69% for IG and 32% for high-yield, wherein US$-denominated offerings increased 142% for IG and grew 45% for high yield.
Third-quarter 2020’s worldwide offerings of corporate bonds revealed an annual decline of 6% for IG and an annual advance of 44% for high-yield, wherein US$-denominated offerings increased 12% for IG and soared upward 56% for high yield.
Fourth-quarter 2020’s worldwide offerings of corporate bonds revealed an annual decline of 3% for IG and an annual advance of 8% for high-yield, wherein US$-denominated offerings increased 16% for IG and 11% for high yield.
First-quarter 2021’s worldwide offerings of corporate bonds revealed an annual decline of 4% for IG and an annual advance of 57% for high-yield, wherein US$-denominated offerings sank 9% for IG and advanced 64% for high yield.
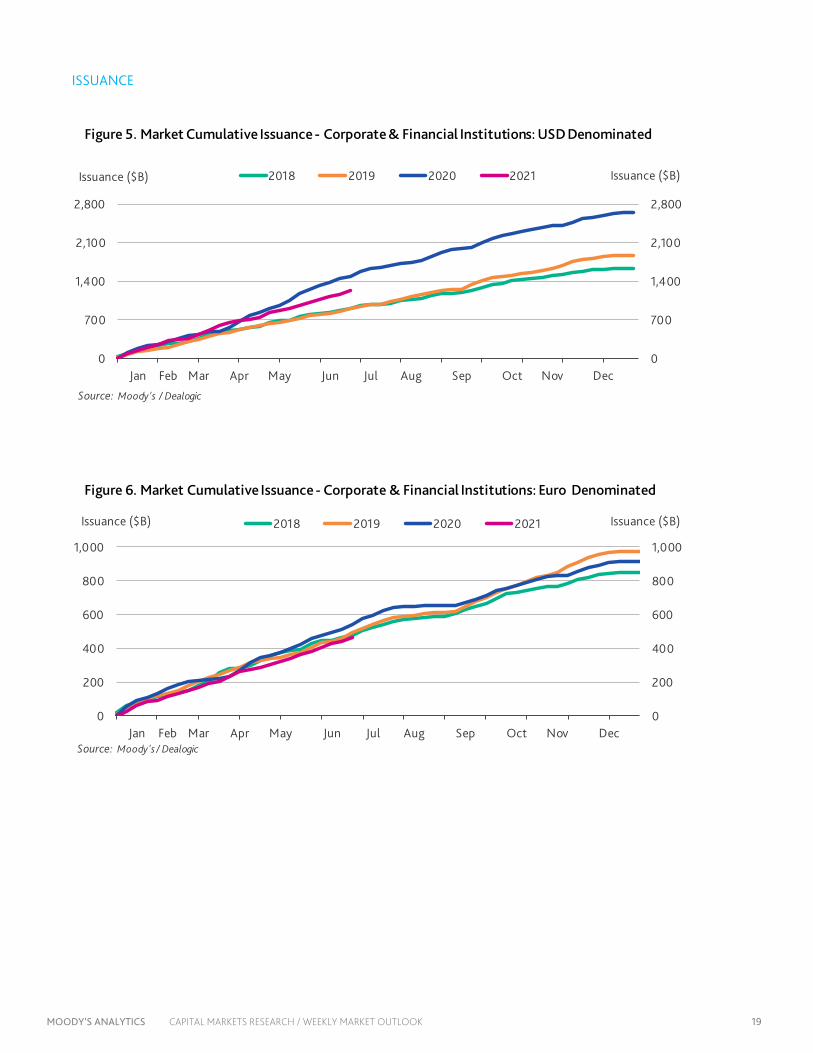
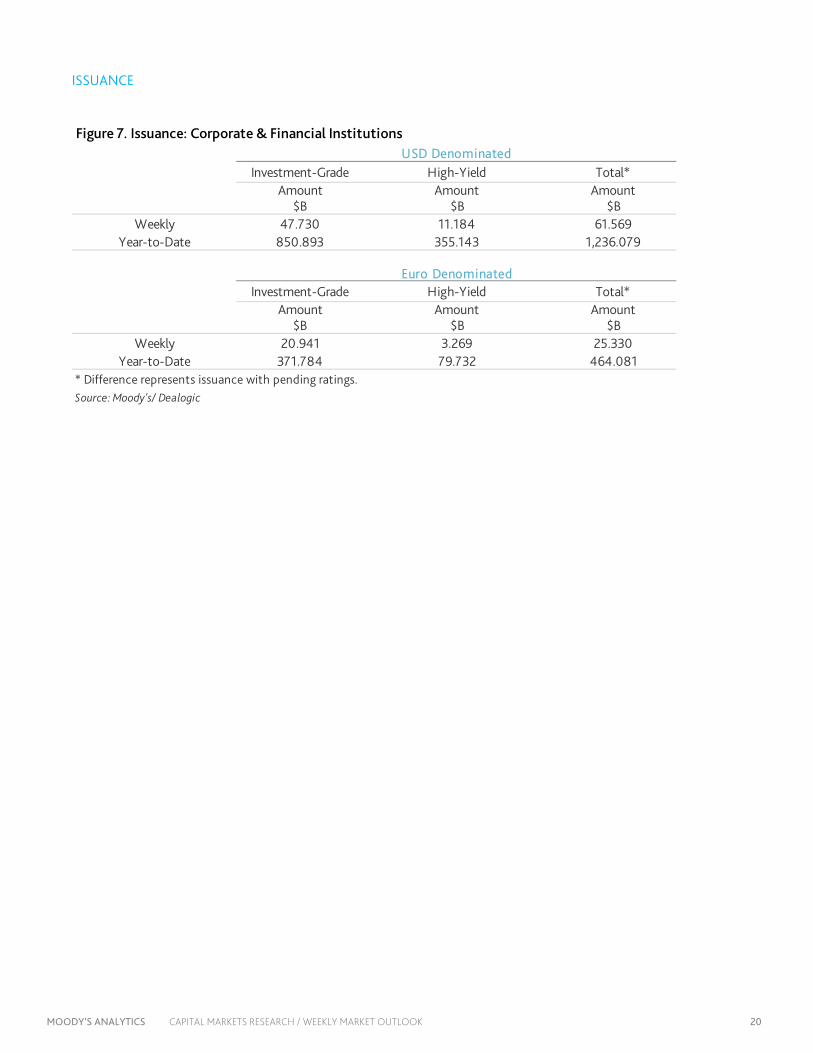
April and May corporate bond issuance came in a little lighter than expected. U.S. dollar-denominated corporate bond issuance has moderated, not surprising as issuance typically is slow this time of year.
In the week ending Wednesday, weekly dollar-denominated investment-grade issuance rose $47.73 billion, bringing the year-to-date total to $850.9 billion. High-yield issuance rose $11.2 billion in the latest week, bringing its year-to-date total to $355.1 billion.
U.S. ECONOMIC OUTLOOK The Moody’s Analytics June baseline now looks for real GDP to rise 6.9% this year, compared with the 6.8% in our May baseline. We have been consistently revising our forecast higher for GDP this year because of changes to our fiscal policy assumptions, but the adjustment in June
MOODY’S ANALYTICS CAPITAL MARKETS RESEARCH / WEEKLY MARKET OUTLOOK 10
is modest compared with prior forecast revisions. The June baseline incorporates the government’s second estimate of first-quarter GDP, but the top-line number was unrevised, still rising 6.4% at an annualized rate.
We raised our forecast for GDP growth in 2022 from 4.8% to 5%. Risks to the forecast are weighted to the upside because of the lack of inventory build this year. The global semiconductor shortage bit into inventories during the first quarter and will likely continue to do so through the remainder of this year. Inventories lend a downside risk to our forecast for GDP this year but are an upside for 2022 and 2023.
There is the potential that supply issues become a big problem, particularly for autos. Auto industrial production is trailing sales. Therefore, inventories could continue to decline. We didn’t alter our forecast for the change in private inventories over the next few years, but this may need to be revisited, since lean inventories need to be replenished, and that could add more to GDP growth next year than we expect.
The June baseline forecast has average monthly job growth this year of 510,000, in line with the May baseline. Similarly, there were no significant revisions to average monthly job growth next year, which will be 327,000.
The unemployment rate is expected to average 4.5% in the fourth quarter of this year, the same as in the May baseline. A 3.5% unemployment rate and an 80% prime-age employment-to-population ratio are consistent with an economy at full employment. We don’t have the
prime-age employment-to-population ratio in our model but we do a back-of-the-envelope estimate based on the other labor market variables we forecast.
There weren't any changes to our assumptions about monetary policy. We still expect the Fed to announce its tapering plans in September and a $15 billion reduction to occur at each Federal Open Market Committee meeting in 2022. The Fed has signaled that it wants tapering to be on autopilot. Once its monthly asset purchases have been reduced from $120 billion to zero, the Fed will reinvest proceeds from maturing assets to ensure its balance sheet doesn’t contract, which would be contractionary monetary policy.
The Fed will aim for inflation to exceed its 2% objective. How large of an overshoot is allowed before a rate liftoff will also be important in gauging the pace of tightening. If the Fed allows a larger overshoot, then the pace of tightening will likely be similar to a traditional tightening cycle, 25 basis points per quarter, because inflation should continue to accelerate even after the first rate hike. If the Fed doesn’t allow too much of an overshoot, then the tightening cycle will be less aggressive. The first hike for the target range for the fed funds rate occurs in early 2023 and the pace of tightening is expected to be similar to historical norms.
There were no significant changes to the forecast for the 10-year U.S. Treasury yield. The forecast is for the 10-year Treasury yield to end this year just north of 2% and near 2.4% next year.
MOODY’S ANALYTICS CAPITAL MARKETS RESEARCH / WEEKLY MARKET OUTLOOK 11
THE LONG VIEW: EUROPE
Inflation Rising BY ROSS CIOFFI
The euro zone’s inflation rate rose to 2% y/y in May, just exceeding the European Central Bank's target rate of below but close to 2%. Once again, energy prices drove the increase in the headline inflation rate, contributing 1.19 percentage points. Core inflation remained soft during the month, at just 1% y/y. This speaks to the fact that in May, COVID-19 lockdowns continued to dominate the euro zone economy.
Energy prices are rising so quickly mostly because of base effects. When compared with the slump in energy prices in the wake of the first wave of COVID-19 a year earlier, growth rates have soared. This explains why the energy index is up 13.1% y/y, the most in nearly a decade. The slump and rebound in oil prices is the main force behind this, but so too are changes in electricity and gas prices that followed a similar price path.
Core price dynamics have been staid during the second quarter. This isn’t too surprising given lockdowns only started to ease considerably later in May. Limitations on activity meant the economy was far from normal. Shop and service reopenings in June, however, will prompt a significant rebound in household consumption, which will galvanize core inflation rates.
At the same time that consumers are returning to shops, shortages of inputs in the production process have caused producer prices to surge in recent months. But with lockdowns blocking consumer demand, firms held off on passing these costs on to consumers. As shops reopen and firms are met with clients eager to vent their pent-up demand, they will be able to raise prices.
We maintain that it would be too early for the ECB to hike interest rates. Base effects remain a key force behind May’s increase. And although this summer’s burst in consumer demand, paired with higher producer costs, will trigger inflation, this too will be temporary due to persisting weakness in labor markets and the cooling effects this will have on spending later in the year. Furthermore, supply bottlenecks will ease as the year progresses and global productive capacity returns. For these reasons, we are
expecting inflation to slow and fall below the ECB’s target next year.
Across the Channel The U.K.’s headline inflation rate also strengthened further in May, rising by 2.1% y/y after a 1.5% y/y increase the previous month. Price gains were buoyed by the lifting of lockdown measures and by base effects. With the exception of food and nonalcoholic beverages, all main CPI categories saw year-on-year price growth in May. The gradual release of pent-up demand after a year of social distancing and three national lockdowns was evidenced by the 0.5% uptick in monthly inflation. Although inflation will remain robust this year, we believe much of the underlying dynamics driving higher price growth are temporary and will not result in premature tightening by the Bank of England.
Although inflation will remain elevated this year, lingering weaknesses in the U.K. economy mean we don’t expect any significant changes to monetary policy until 2022. With the government’s furlough scheme set to expire in September, unemployment will likely edge up later in the autumn, putting downward pressure on prices. Also, the economy isn’t expected to return to precrisis levels of output until 2022. Although the central bank is keeping a keen eye on rising house prices, we don’t believe they will raise interest rates until evidence of a sustained recovery emerges.
EU-U.S. trade relations a little better Trade relations between the EU and the U.S. took a step in the right direction after Tuesday's talks regarding the Airbus-Boeing dispute. The two sides agreed to suspend the use of tariffs, estimated to amount to around $11 billion, for the next five years. In the meantime, measures have been agreed on to limit state financing. There was considerably less progress made on the question of the U.S.’s steel and aluminum tariffs against the EU. The two sides promised to find a solution before the end of the year. These tariffs may be more difficult to unwind before the U.S.’s 2022 mid-term elections, however.

MOODY’S ANALYTICS CAPITAL MARKETS RESEARCH / WEEKLY MARKET OUTLOOK 12
THE LONG VIEW: ASIA-PACIFIC
New Zealand Economy Moves Above Pre-Pandemic Level BY KATRINA ELL
New Zealand's GDP growth surprised on the upside in the March quarter with a blistering 1.6% quarterly expansion following a 1% contraction in the December stanza. This translated to a 2.4% yearly expansion and the economy is now 1% larger than pre-pandemic levels (relative to the December quarter of 2019). The uptick in annual GDP growth was largely due to low base effects. Annual GDP is likely to further accelerate in the June quarter given the substantial fall that occurred in the second quarter of 2020 when the economy entered recession. Importantly, the economy has not completely shaken COVID-19; the economy remains around 2% to 3% smaller had the global pandemic not hit.
Domestic demand propelled the economy in the March quarter with services the key strong point. The gains in services were broad-based, with wholesale, business services and healthcare and social assistance the strong points. Over the quarter, services were up 1.1% q/q, but over the year services were down 3.4%. The strong result in domestic demand was expected given the improvement in monthly indicators showing upbeat employment growth, strong business confidence and credit card spending.
While the aggregate figure is upbeat, there is still weakness under the hood and scars from COVID-19 remain. In particular, headline exports fell 8% over the quarter, driven by a 20.2% fall in service exports, translating to a 48.7% contraction in annual terms. This reflects the deep strain from the country’s borders remaining closed to international arrivals; as the first quarter is typically the peak for holiday and education arrivals. Although New Zealand shares travel arrangements with select countries, including Australia, it is far from pre-COVID-19 levels and unlikely to return to a pre-pandemic state any time soon.
The strength in domestic demand means that the government will continue to withdraw fiscal support and a high likelihood of the Reserve Bank of New Zealand beginning the normalisation process of the official cash rate in 2022. The RBNZ introduced additional measures in June to cool the buoyant housing market, not least over concerns over the rise in household debt, which has increased to 166% of income. When lending rates do start to rise, it will need to be gradual considering the highly leveraged household sector as well as the fact that sectors remain vulnerable to spikes in infection rates, particularly given the slow-paced vaccination program.

MOODY’S ANALYTICS CAPITAL MARKETS RESEARCH / WEEKLY MARKET OUTLOOK 13
RATINGS ROUND-UP
A Broadcom Debt Upgrade BY MICHAEL FERLEZ
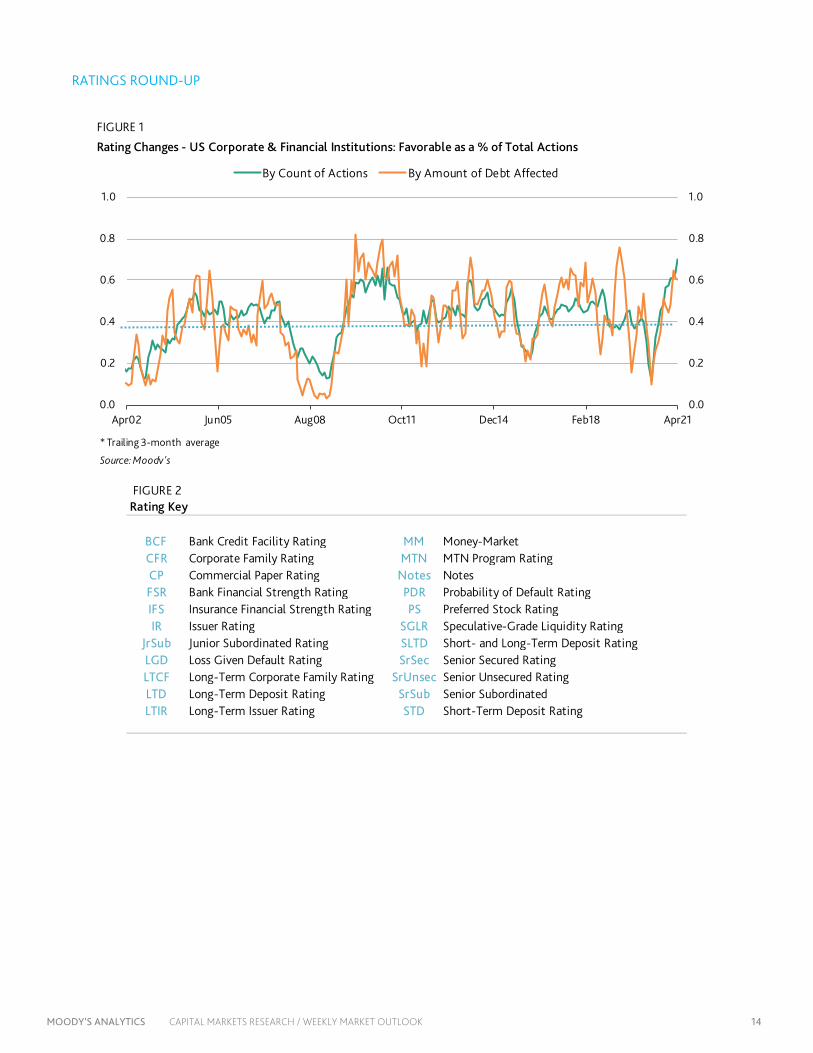
U.S. rating change activity was overwhelmingly positive for the week ended June 15. Upgrades accounted for 75% of total rating changes and nearly all the affected debt. Speculative-grade companies again accounted for the bulk of rating changes, though investment-grade Broadcom Technologies Inc. represented the largest change in terms of affected debt. Moody’s Investors Service upgraded Broadcom’s 2017 Senior Notes to Baa2 from Baa3. In their rating action, Moody’s Investors Service said the upgrade reflected that BTI’s 2017 Senior Notes would have structural seniority relative to the debt issued by BTI’s parent, Broadcom Corp. In total, the upgrade affected $10.4 billion in outstanding debt.
European rating change activity was credit positive in the period with upgrades outnumbering downgrades two to one. Despite representing a smaller share of total changes, downgrades accounted for over 80% of the affected debt for the week. The most notable change in terms of affected debt was HSBC Continental Europe. On June 9, Moody’s Investors Service downgraded several ratings for HSBC Continental Europe, including the firm’s long-term deposit and senior unsecured debt ratings, which were both lowered to A1. In the rating action, Moody’s Investors Service said the downgrade of HBCE’s long-term deposit and senior unsecured debt rating reflected the downgrade of HBCE’s Adjusted Baseline Credit Assessment. In total, the downgrade affected $8.9 billion in debt.
MOODY’S ANALYTICS CAPITAL MARKETS RESEARCH / WEEKLY MARKET OUTLOOK 14
RATINGS ROUND-UP
FIGURE 1
Rating Changes - US Corporate & Financial Institutions: Favorable as a % of Total Actions
0.0
0.2
0.4
0.6
0.8
1.0
0.0
0.2
0.4
0.6
0.8
1.0
Apr02 Jun05 Aug08 Oct11 Dec14 Feb18 Apr21
By Count of Actions By Amount of Debt Affected
* Trailing 3-month average
Source: Moody's
FIGURE 2
BCF Bank Credit Facility Rating MM Money-MarketCFR Corporate Family Rating MTN MTN Program RatingCP Commercial Paper Rating Notes NotesFSR Bank Financial Strength Rating PDR Probability of Default RatingIFS Insurance Financial Strength Rating PS Preferred Stock RatingIR Issuer Rating SGLR Speculative-Grade Liquidity Rating
JrSub Junior Subordinated Rating SLTD Short- and Long-Term Deposit RatingLGD Loss Given Default Rating SrSec Senior Secured Rating LTCF Long-Term Corporate Family Rating SrUnsec Senior Unsecured Rating LTD Long-Term Deposit Rating SrSub Senior SubordinatedLTIR Long-Term Issuer Rating STD Short-Term Deposit Rating
Rating Key

MOODY’S ANALYTICS CAPITAL MARKETS RESEARCH / WEEKLY MARKET OUTLOOK 15
FIGURE 3Rating Changes: Corporate & Financial Institutions - US
Date Company Sector RatingAmount
($ Million)Up/
Down
Old LTD
Rating
New LTD Rating
d
IG/SG
06/09/2021 SM ENERGY COMPANY IndustrialSrSec/SrUnsec/LTCFR/P
DR2882.722 U B2 B1 SG
06/09/2021HUNTINGTON BANCSHARES, INC.-TCF NATIONAL BANK
Financial LTIR/LTD/Sub 735.0 U A2 Aa3 IG
06/09/2021BROADCOM INC.-BROADCOM TECHNOLOGIES INC.
Industrial SrUnsec 10403.632 U Baa3 Baa2 IG
06/09/2021 MOSS CREEK RESOURCES HOLDINGS, INC. Industrial SrUnsec/LTCFR/PDR 1200.0 U Caa2 Caa1 SG
06/10/2021 DTI TOPCO, INC.-DTI HOLDCO, INC. Industrial SrSec/BCF/LTCFR/PDR U Caa2 Caa1 SG
06/14/2021TARGA RESOURCES CORP.-TARGA RESOURCES PARTNERS LP
Industrial SrUnsec 7250.0 U Ba3 Ba2 SG
06/14/2021 LIGHTSTONE GENERATION LLC Industrial SrSec/BCF D B1 B2 SG06/14/2021 TGP HOLDINGS III LLC Industrial LTCFR/PDR U B3 B2 SG06/14/2021 LGI HOMES, INC. Industrial SrUnsec/LTCFR/PDR 300.0 U Ba3 Ba2 SG06/14/2021 HERITAGE POWER, LLC Industrial SrSec/BCF D B1 B2 SG06/14/2021 API GROUP DE, INC. Industrial SrSec/BCF/LTCFR/PDR U Ba3 Ba2 SG06/15/2021 FRANKLIN STREET PROPERTIES CORP. Industrial SrUnsec 284.0 D Baa3 Ba1 SG
Source: Moody's
FIGURE 4Rating Changes: Corporate & Financial Institutions - Europe
Date Company Sector RatingAmount
($ Million)Up/
Down
Old LTD
Rating
New LTD
Rating
IG/SG
Country
06/09/2021HSBC HOLDINGS PLC-HSBC CONTINENTAL EUROPE Financial
SrUnsec/LTIR/LTD/JrSub/MTN 8932.289 D Aa3 A1 IG FRANCE
06/09/2021 ALLIANDER N.V. IndustrialSrUnsec/LTIR/JrSub/MTN 3027.624 D Aa2 Aa3 IG NETHERLANDS
06/10/2021CAMELOT HOLDINGS (JERSEY) LIMITED-CAMELOT FINANCE SA Industrial SrSec/SrSec/BCF 700 U B2 B1 SG LUXEMBOURG
06/10/2021 FLUIDRA S.A. Industrial SrSec/BCF/LTCFR/PDR U Ba3 Ba2 IG SPAIN06/14/2021 GRUPO ANTOLIN-IRAUSA, S.A. Industrial SrSec/LTCFR/PDR 787.1823 U B3 B2 SG SPAIN
06/15/2021 INEOS ENTERPRISES HOLDINGS LIMITED Industrial SrSec/BCF/LTCFR/PDR U B1 Ba3 SGUNITED KINGDOM
Source: Moody's
MOODY’S ANALYTICS CAPITAL MARKETS RESEARCH / WEEKLY MARKET OUTLOOK 16
MARKET DATA
0
200
400
600
800
0
200
400
600
800
2003 2004 2005 2006 2007 2008 2009 2010 2011 2012 2013 2014 2015 2016 2017 2018 2019 2020 2021
Spread (bp) Spread (bp) Aa2 A2 Baa2
Source: Moody's
Figure 1: 5-Year Median Spreads-Global Data (High Grade)
0
400
800
1,200
1,600
2,000
0
400
800
1,200
1,600
2,000
2003 2004 2005 2006 2007 2008 2009 2010 2011 2012 2013 2014 2015 2016 2017 2018 2019 2020 2021
Spread (bp) Spread (bp) Ba2 B2 Caa-C
Source: Moody's
Figure 2: 5-Year Median Spreads-Global Data (High Yield)
MOODY’S ANALYTICS CAPITAL MARKETS RESEARCH / WEEKLY MARKET OUTLOOK 17
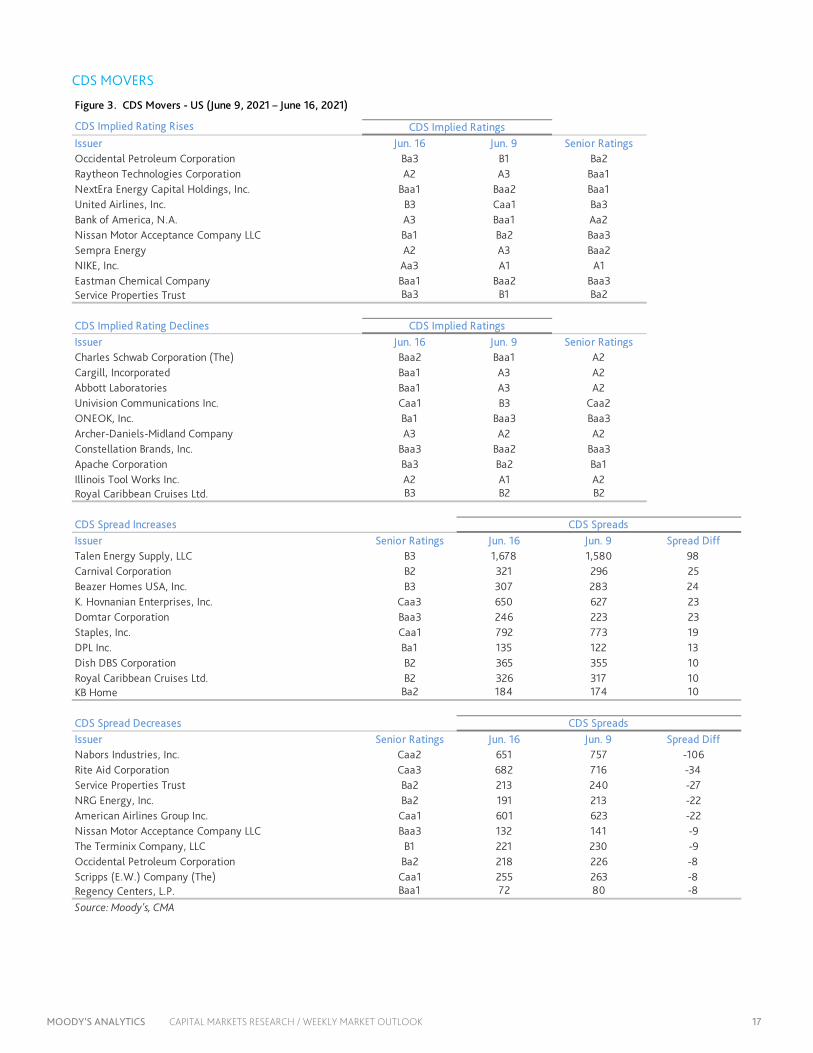
CDS MOVERS
CDS Implied Rating Rises
Issuer Jun. 16 Jun. 9 Senior RatingsOccidental Petroleum Corporation Ba3 B1 Ba2Raytheon Technologies Corporation A2 A3 Baa1NextEra Energy Capital Holdings, Inc. Baa1 Baa2 Baa1United Airlines, Inc. B3 Caa1 Ba3Bank of America, N.A. A3 Baa1 Aa2Nissan Motor Acceptance Company LLC Ba1 Ba2 Baa3Sempra Energy A2 A3 Baa2NIKE, Inc. Aa3 A1 A1Eastman Chemical Company Baa1 Baa2 Baa3Service Properties Trust Ba3 B1 Ba2
CDS Implied Rating DeclinesIssuer Jun. 16 Jun. 9 Senior RatingsCharles Schwab Corporation (The) Baa2 Baa1 A2Cargill, Incorporated Baa1 A3 A2Abbott Laboratories Baa1 A3 A2Univision Communications Inc. Caa1 B3 Caa2ONEOK, Inc. Ba1 Baa3 Baa3Archer-Daniels-Midland Company A3 A2 A2Constellation Brands, Inc. Baa3 Baa2 Baa3Apache Corporation Ba3 Ba2 Ba1Illinois Tool Works Inc. A2 A1 A2Royal Caribbean Cruises Ltd. B3 B2 B2
CDS Spread IncreasesIssuer Senior Ratings Jun. 16 Jun. 9 Spread DiffTalen Energy Supply, LLC B3 1,678 1,580 98Carnival Corporation B2 321 296 25Beazer Homes USA, Inc. B3 307 283 24K. Hovnanian Enterprises, Inc. Caa3 650 627 23Domtar Corporation Baa3 246 223 23Staples, Inc. Caa1 792 773 19DPL Inc. Ba1 135 122 13Dish DBS Corporation B2 365 355 10Royal Caribbean Cruises Ltd. B2 326 317 10KB Home Ba2 184 174 10
CDS Spread DecreasesIssuer Senior Ratings Jun. 16 Jun. 9 Spread DiffNabors Industries, Inc. Caa2 651 757 -106Rite Aid Corporation Caa3 682 716 -34Service Properties Trust Ba2 213 240 -27NRG Energy, Inc. Ba2 191 213 -22American Airlines Group Inc. Caa1 601 623 -22Nissan Motor Acceptance Company LLC Baa3 132 141 -9The Terminix Company, LLC B1 221 230 -9Occidental Petroleum Corporation Ba2 218 226 -8Scripps (E.W.) Company (The) Caa1 255 263 -8Regency Centers, L.P. Baa1 72 80 -8
Source: Moody's, CMA
CDS Spreads
CDS Implied Ratings
CDS Implied Ratings
CDS Spreads
Figure 3. CDS Movers - US (June 9, 2021 – June 16, 2021)
MOODY’S ANALYTICS CAPITAL MARKETS RESEARCH / WEEKLY MARKET OUTLOOK 18
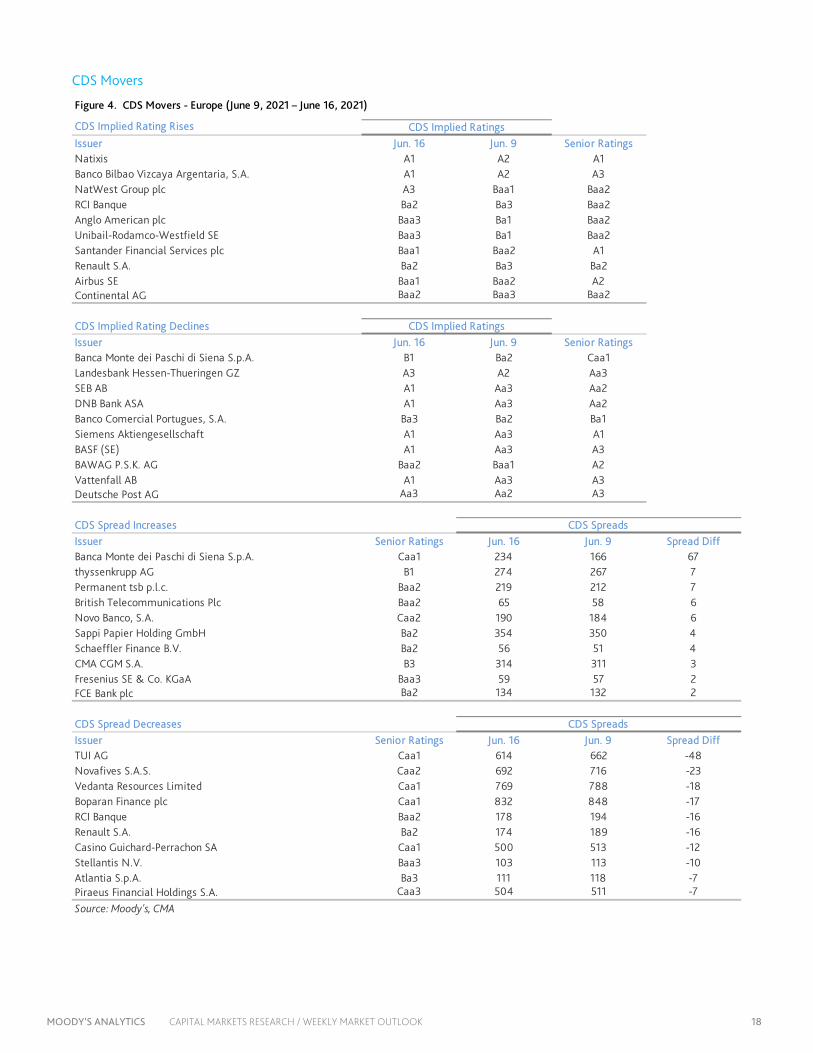
CDS Movers
CDS Implied Rating Rises
Issuer Jun. 16 Jun. 9 Senior RatingsNatixis A1 A2 A1Banco Bilbao Vizcaya Argentaria, S.A. A1 A2 A3NatWest Group plc A3 Baa1 Baa2RCI Banque Ba2 Ba3 Baa2Anglo American plc Baa3 Ba1 Baa2Unibail-Rodamco-Westfield SE Baa3 Ba1 Baa2Santander Financial Services plc Baa1 Baa2 A1Renault S.A. Ba2 Ba3 Ba2Airbus SE Baa1 Baa2 A2Continental AG Baa2 Baa3 Baa2
CDS Implied Rating DeclinesIssuer Jun. 16 Jun. 9 Senior RatingsBanca Monte dei Paschi di Siena S.p.A. B1 Ba2 Caa1Landesbank Hessen-Thueringen GZ A3 A2 Aa3SEB AB A1 Aa3 Aa2DNB Bank ASA A1 Aa3 Aa2Banco Comercial Portugues, S.A. Ba3 Ba2 Ba1Siemens Aktiengesellschaft A1 Aa3 A1BASF (SE) A1 Aa3 A3BAWAG P.S.K. AG Baa2 Baa1 A2Vattenfall AB A1 Aa3 A3Deutsche Post AG Aa3 Aa2 A3
CDS Spread IncreasesIssuer Senior Ratings Jun. 16 Jun. 9 Spread DiffBanca Monte dei Paschi di Siena S.p.A. Caa1 234 166 67thyssenkrupp AG B1 274 267 7Permanent tsb p.l.c. Baa2 219 212 7British Telecommunications Plc Baa2 65 58 6Novo Banco, S.A. Caa2 190 184 6Sappi Papier Holding GmbH Ba2 354 350 4Schaeffler Finance B.V. Ba2 56 51 4CMA CGM S.A. B3 314 311 3Fresenius SE & Co. KGaA Baa3 59 57 2FCE Bank plc Ba2 134 132 2
CDS Spread DecreasesIssuer Senior Ratings Jun. 16 Jun. 9 Spread DiffTUI AG Caa1 614 662 -48Novafives S.A.S. Caa2 692 716 -23Vedanta Resources Limited Caa1 769 788 -18Boparan Finance plc Caa1 832 848 -17RCI Banque Baa2 178 194 -16Renault S.A. Ba2 174 189 -16Casino Guichard-Perrachon SA Caa1 500 513 -12Stellantis N.V. Baa3 103 113 -10Atlantia S.p.A. Ba3 111 118 -7Piraeus Financial Holdings S.A. Caa3 504 511 -7
Source: Moody's, CMA
CDS Spreads
CDS Implied Ratings
CDS Implied Ratings
CDS Spreads
Figure 4. CDS Movers - Europe (June 9, 2021 – June 16, 2021)
MOODY’S ANALYTICS CAPITAL MARKETS RESEARCH / WEEKLY MARKET OUTLOOK 19
ISSUANCE
0
700
1,400
2,100
2,800
0
700
1,400
2,100
2,800
Jan Feb Mar Apr May Jun Jul Aug Sep Oct Nov Dec
Issuance ($B) Issuance ($B)2018 2019 2020 2021
Source: Moody's / Dealogic
Figure 5. Market Cumulative Issuance - Corporate & Financial Institutions: USD Denominated
0
200
400
600
800
1,000
0
200
400
600
800
1,000
Jan Feb Mar Apr May Jun Jul Aug Sep Oct Nov Dec
Issuance ($B) Issuance ($B)2018 2019 2020 2021
Source: Moody's / Dealogic
Figure 6. Market Cumulative Issuance - Corporate & Financial Institutions: Euro Denominated
MOODY’S ANALYTICS CAPITAL MARKETS RESEARCH / WEEKLY MARKET OUTLOOK 20
ISSUANCE
Investment-Grade High-Yield Total*Amount Amount Amount
$B $B $BWeekly 47.730 11.184 61.569
Year-to-Date 850.893 355.143 1,236.079
Investment-Grade High-Yield Total*Amount Amount Amount
$B $B $BWeekly 20.941 3.269 25.330
Year-to-Date 371.784 79.732 464.081* Difference represents issuance with pending ratings.Source: Moody's/ Dealogic
USD Denominated
Euro Denominated
Figure 7. Issuance: Corporate & Financial Institutions

MOODY’S ANALYTICS CAPITAL MARKETS RESEARCH / WEEKLY MARKET OUTLOOK 21
To order reprints of this report (100 copies minimum), please call 212.553.1658.
Report Number: 1292533 Contact Us
Editor Reid Kanaley [email protected]
Americas: 1.212.553.4399
Europe: +44 (0) 20.7772.5588
Asia: 813.5408.4131
MOODY’S ANALYTICS CAPITAL MARKETS RESEARCH / WEEKLY MARKET OUTLOOK 22
© 2021 Moody’s Corporation, Moody’s Investors Service, Inc., Moody’s Analytics, Inc. and/or their licensors and affiliates (collectively, “MOODY’S”). All rights reserved.
CREDIT RATINGS ISSUED BY MOODY'S CREDIT RATINGS AFFILIATES ARE THEIR CURRENT OPINIONS OF THE RELATIVE FUTURE CREDIT RISK OF ENTITIES, CREDIT COMMITMENTS, OR DEBT OR DEBT-LIKE SECURITIES, AND MATERIALS, PRODUCTS, SERVICES AND INFORMATION PUBLISHED BY MOODY’S (COLLECTIVELY, “PUBLICATIONS”) MAY INCLUDE SUCH CURRENT OPINIONS. MOODY’S DEFINES CREDIT RISK AS THE RISK THAT AN ENTITY MAY NOT MEET ITS CONTRACTUAL FINANCIAL OBLIGATIONS AS THEY COME DUE AND ANY ESTIMATED FINANCIAL LOSS IN THE EVENT OF DEFAULT OR IMPAIRMENT. SEE APPLICABLE MOODY’S RATING SYMBOLS AND DEFINITIONS PUBLICATION FOR INFORMATION ON THE TYPES OF CONTRACTUAL FINANCIAL OBLIGATIONS ADDRESSED BY MOODY’S CREDIT RATINGS. CREDIT RATINGS DO NOT ADDRESS ANY OTHER RISK, INCLUDING BUT NOT LIMITED TO: LIQUIDITY RISK, MARKET VALUE RISK, OR PRICE VOLATILITY. CREDIT RATINGS, NON-CREDIT ASSESSMENTS (“ASSESSMENTS”), AND OTHER OPINIONS INCLUDED IN MOODY’S PUBLICATIONS ARE NOT STATEMENTS OF CURRENT OR HISTORICAL FACT. MOODY’S PUBLICATIONS MAY ALSO INCLUDE QUANTITATIVE MODEL-BASED ESTIMATES OF CREDIT RISK AND RELATED OPINIONS OR COMMENTARY PUBLISHED BY MOODY’S ANALYTICS, INC. AND/OR ITS AFFILIATES. MOODY’S CREDIT RATINGS, ASSESSMENTS, OTHER OPINIONS AND PUBLICATIONS DO NOT CONSTITUTE OR PROVIDE INVESTMENT OR FINANCIAL ADVICE, AND MOODY’S CREDIT RATINGS, ASSESSMENTS, OTHER OPINIONS AND PUBLICATIONS ARE NOT AND DO NOT PROVIDE RECOMMENDATIONS TO PURCHASE, SELL, OR HOLD PARTICULAR SECURITIES. MOODY’S CREDIT RATINGS, ASSESSMENTS, OTHER OPINIONS AND PUBLICATIONS DO NOT COMMENT ON THE SUITABILITY OF AN INVESTMENT FOR ANY PARTICULAR INVESTOR. MOODY’S ISSUES ITS CREDIT RATINGS, ASSESSMENTS AND OTHER OPINIONS AND PUBLISHES ITS PUBLICATIONS WITH THE EXPECTATION AND UNDERSTANDING THAT EACH INVESTOR WILL, WITH DUE CARE, MAKE ITS OWN STUDY AND EVALUATION OF EACH SECURITY THAT IS UNDER CONSIDERATION FOR PURCHASE, HOLDING, OR SALE.
MOODY’S CREDIT RATINGS, ASSESSMENTS, OTHER OPINIONS, AND PUBLICATIONS ARE NOT INTENDED FOR USE BY RETAIL INVESTORS AND IT WOULD BE RECKLESS AND INAPPROPRIATE FOR RETAIL INVESTORS TO USE MOODY’S CREDIT RATINGS, ASSESSMENTS, OTHER OPINIONS OR PUBLICATIONS WHEN MAKING AN INVESTMENT DECISION. IF IN DOUBT YOU SHOULD CONTACT YOUR FINANCIAL OR OTHER PROFESSIONAL ADVISER.
ALL INFORMATION CONTAINED HEREIN IS PROTECTED BY LAW, INCLUDING BUT NOT LIMITED TO, COPYRIGHT LAW, AND NONE OF SUCH INFORMATION MAY BE COPIED OR OTHERWISE REPRODUCED, REPACKAGED, FURTHER TRANSMITTED, TRANSFERRED, DISSEMINATED, REDISTRIBUTED OR RESOLD, OR STORED FOR SUBSEQUENT USE FOR ANY SUCH PURPOSE, IN WHOLE OR IN PART, IN ANY FORM OR MANNER OR BY ANY MEANS WHATSOEVER, BY ANY PERSON WITHOUT MOODY’S PRIOR WRITTEN CONSENT.
MOODY’S CREDIT RATINGS, ASSESSMENTS, OTHER OPINIONS AND PUBLICATIONS ARE NOT INTENDED FOR USE BY ANY PERSON AS A BENCHMARK AS THAT TERM IS DEFINED FOR REGULATORY PURPOSES AND MUST NOT BE USED IN ANY WAY THAT COULD RESULT IN THEM BEING CONSIDERED A BENCHMARK.
All information contained herein is obtained by MOODY’S from sources believed by it to be accurate and reliable. Because of the possibility of human or mechanical error as well as other factors, however, all information contained herein is provided “AS IS” without warranty of any kind. MOODY'S adopts all necessary measures so that the information it uses in assigning a credit rating is of sufficient quality and from sources MOODY'S considers to be reliable including, when appropriate, independent third-party sources. However, MOODY’S is not an auditor and cannot in every instance independently verify or validate information received in the rating process or in preparing its Publications.
To the extent permitted by law, MOODY’S and its directors, officers, employees, agents, representatives, licensors and suppliers disclaim liability to any person or entity for any indirect, special, consequential, or incidental losses or damages whatsoever arising from or in connection with the information contained herein or the use of or inability to use any such information, even if MOODY’S or any of its directors, officers, employees, agents, representatives, licensors or suppliers is advised in advance of the possibility of such losses or damages, including but not limited to: (a) any loss of present or prospective profits or (b) any loss or damage arising where the relevant financial instrument is not the subject of a particular credit rating assigned by MOODY’S.
To the extent permitted by law, MOODY’S and its directors, officers, employees, agents, representatives, licensors and suppliers disclaim liability for any direct or compensatory losses or damages caused to any person or entity, including but not limited to by any negligence (but excluding fraud, willful misconduct or any other type of liability that, for the avoidance of doubt, by law cannot be excluded) on the part of, or any contingency within or beyond the control of, MOODY’S or any of its directors, officers, employees, agents, representatives, licensors or suppliers, arising from or in connection with the information contained herein or the use of or inability to use any such information.
NO WARRANTY, EXPRESS OR IMPLIED, AS TO THE ACCURACY, TIMELINESS, COMPLETENESS, MERCHANTABILITY OR FITNESS FOR ANY PARTICULAR PURPOSE OF ANY CREDIT RATING, ASSESSMENT, OTHER OPINION OR INFORMATION IS GIVEN OR MADE BY MOODY’S IN ANY FORM OR MANNER WHATSOEVER.
Moody’s Investors Service, Inc., a wholly-owned credit rating agency subsidiary of Moody’s Corporation (“MCO”), hereby discloses that most issuers of debt securities (including corporate and municipal bonds, debentures, notes and commercial paper) and preferred stock rated by Moody’s Investors Service, Inc. have, prior to assignment of any credit rating, agreed to pay to Moody’s Investors Service, Inc. for credit ratings opinions and services rendered by it fees ranging from $1,000 to approximately $5,000,000. MCO and Moody’s Investors Service also maintain policies and procedures to address the independence of Moody’s Investors Service credit ratings and credit rating processes. Information regarding certain affiliations that may exist between directors of MCO and rated entities, and between entities who hold credit ratings from Moody’s Investors Service and have also publicly reported to the SEC an ownership interest in MCO of more than 5%, is posted annually at www.moodys.com under the heading “Investor Relations — Corporate Governance — Director and Shareholder Affiliation Policy.”
Additional terms for Australia only: Any publication into Australia of this document is pursuant to the Australian Financial Services License of MOODY’S affiliate, Moody’s Investors Service Pty Limited ABN 61 003 399 657AFSL 336969 and/or Moody’s Analytics Australia Pty Ltd ABN 94 105 136 972 AFSL 383569 (as applicable). This document is intended to be provided only to “wholesale clients” within the meaning of section 761G of the Corporations Act 2001. By continuing to access this document from within Australia, you represent to MOODY’S that you are, or are accessing the document as a representative of, a “wholesale client” and that neither you nor the entity you represent will directly or indirectly disseminate this document or its contents to “retail clients” within the meaning of section 761G of the Corporations Act 2001. MOODY’S credit rating is an opinion as to the creditworthiness of a debt obligation of the issuer, not on the equity securities of the issuer or any form of security that is available to retail investors.
Additional terms for Japan only: Moody's Japan K.K. (“MJKK”) is a wholly owned credit rating agency subsidiary of Moody's Group Japan G.K., which is wholly owned by Moody’s Overseas Holdings Inc., a wholly owned subsidiary of MCO. Moody’s SF Japan K.K. (“MSFJ”) is a wholly owned credit rating agency subsidiary of MJKK. MSFJ is not a Nationally Recognized Statistical Rating Organization (“NRSRO”). Therefore, credit ratings assigned by MSFJ are Non-NRSRO Credit Ratings. Non-NRSRO Credit Ratings are assigned by an entity that is not a NRSRO and, consequently, the rated obligation will not qualify for certain types of treatment under U.S. laws. MJKK and MSFJ are credit rating agencies registered with the Japan Financial Services Agency and their registration numbers are FSA Commissioner (Ratings) No. 2 and 3 respectively.
MJKK or MSFJ (as applicable) hereby disclose that most issuers of debt securities (including corporate and municipal bonds, debentures, notes and commercial paper) and preferred stock rated by MJKK or MSFJ (as applicable) have, prior to assignment of any credit rating, agreed to pay to MJKK or MSFJ (as applicable) for credit ratings opinions and services rendered by it fees ranging from JPY125,000 to approximately JPY550,000,000.
MJKK and MSFJ also maintain policies and procedures to address Japanese regulatory requirements.