Embed Size (px)
Citation preview
MORE THAN 100 YEARSOF PRACTICAL GUIDANCE
TO STOCK INVESTORS
A Simplifi ed explanationof the Dow Theory based ona study of the observations ofthe late William Peter Hamilton,long time editor of The Wall StreetJournal, and the late Robert Rhea,noted proponent and practitioner.
THE
DOWTHEORY
More than 100 years of practical guidanceto stock investors
THE DOW THEORY
A simplifi ed explanation of the Dow Theorybased on a study of the observations of the late
William Peter Hamilton, longtime editor ofThe Wall Street Journal, and the late
Robert Rhea, noted proponent and practitioner.
7412 Calumet AvenueHammond, Indiana 46324-2692
www.DowTheory.com
© 2018 Horizon Publishing Company

FOREWORD
While most investors have heard of the Dow Theory, few have more than a nodding acquaintance with it. It is a method of forecasting the future trend of the stock market from the action of the market itself as revealed by the Dow Jones Industrial and Transportation averages.
In this book you will fi nd a discussion of the Dow Theory in layman’s language. If you study it carefully you will learn to look for information in the only spot where all pertinent information is consolidated. While this book will not by itself make you an authority on the Dow Theory, it should help you acquire a working knowledge. With all its limitations, the Theory has proved one of the best methods yet devised for forecasting the future of the stock market.
The market turned Bearish according to the Dow Theory on April 9, 2018.
April 2018Dow Theory Forecasts
Stock Market GuidanceFor The Individual InvestorSince 1946

The Dow Theory 1
INTRODUCTION TO THEDOW THEORY
More than a century of Dow Theory historyestablishes the validity of these claims:
1. If you are in business, an understanding of the Theory will dissolve many doubts and will greatly enhance your chances of success.
2. If you hope to “make money in the market,” your chances are slim indeed without a knowledge of Dow Theory principles.
3. If your problem is one of conserving property already acquired, a working knowledge of the Theory is your safest guard against catastrophe.
The Theory is based on the changes in price of the stocks which are bought and sold every business day. Each share of stock represents ownership of a defi nite fraction of some business enterprise. The owner of each share of stock is virtually a partner in that business. He may sever his connection with the business on a moment’s notice by selling his stock. He does not sell it to the company or to a stock exchange, but to some other individual through a broker on the stock exchange in the perpetual auction which the exchange conducts. Every transaction in this auction consists of a sale and purchase. The price at which every transaction is made is carefully recorded and widely published.
Naturally, the prices at which transactions are made vary from day to day, and thereby hangs our Theory.
2 The Dow Theory
BEGINNING OF THEDOW THEORY
The continuous auction of stocks is conducted every business day on the fl oor of the New York Stock Exchange and other exchanges.
Stocks are “bid up” or “sold down” according to the public’s estimate of the merit of each particular company. If the public’s demand for a certain company’s stock is greater than the supply, the price is bid up until the demand is satisfi ed. Conversely, if more stock is offered than bid for, the price declines until the pressures of supply and demand are again in balance.
Back in the early days of trading in securities it was assumed that the shares of different companies fl uctuated in price independently of each other. Perhaps they did and surely they still do to some extent. However, with the advent of organized stock exchanges, the perfection of instant communication, rapid transportation, and the widespread dissemination of news, a novel element became discernible in price fl uctuations.
It was in the late 1890s that a few market students, led by Charles H. Dow, discovered that the stock market had a “trend,” that the great body of stocks moved more or less in unison, regardless of the price fl uctuations in individual stocks. This “trend” action led to the development of a “trend theory” and ultimately to the Dow Theory.
The Dow Theory 3
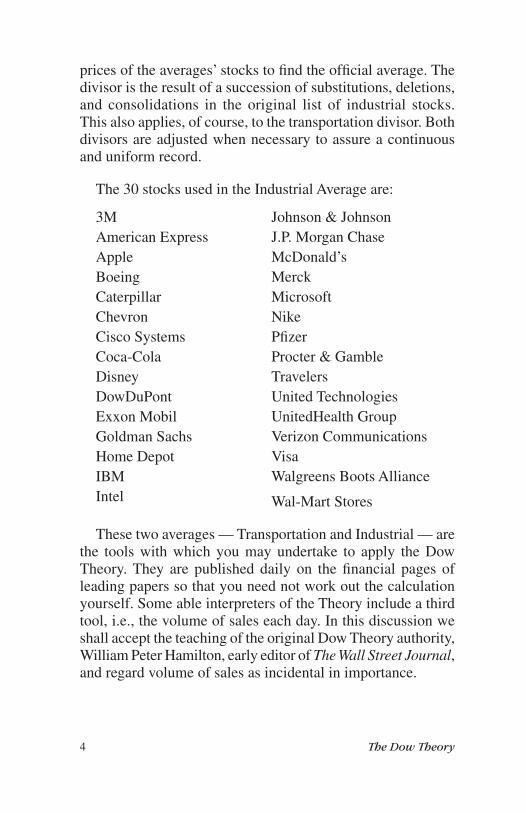
The Industrial Average is made up of a broad group of 30 stocks. Originally it included stocks which are today classed as utilities. (A separate Utility Average was instituted in 1929, but so far has not found a place in the Dow Theory.) As with the Transportation Average, it is necessary to divide the sum of the
THE TOOLS OF THEDOW THEORY
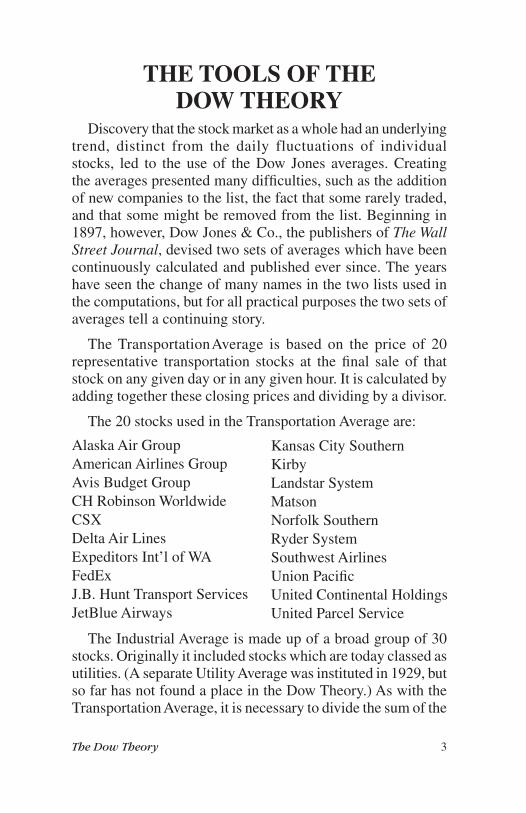
Discovery that the stock market as a whole had an underlying trend, distinct from the daily fluctuations of individual stocks, led to the use of the Dow Jones averages. Creating the averages presented many diffi culties, such as the addition of new companies to the list, the fact that some rarely traded, and that some might be removed from the list. Beginning in 1897, however, Dow Jones & Co., the publishers of The Wall Street Journal, devised two sets of averages which have been continuously calculated and published ever since. The years have seen the change of many names in the two lists used in the computations, but for all practical purposes the two sets of averages tell a continuing story.
The Transportation Average is based on the price of 20 representative transportation stocks at the fi nal sale of that stock on any given day or in any given hour. It is calculated by adding together these closing prices and dividing by a divisor.
The 20 stocks used in the Transportation Average are:
Alaska Air GroupAmerican Airlines GroupAvis Budget GroupCH Robinson WorldwideCSXDelta Air LinesExpeditors Int’l of WAFedExJ.B. Hunt Transport ServicesJetBlue Airways
Kansas City SouthernKirbyLandstar SystemMatsonNorfolk SouthernRyder SystemSouthwest AirlinesUnion Pacifi cUnited Continental HoldingsUnited Parcel Service
4 The Dow Theory
These two averages — Transportation and Industrial — are the tools with which you may undertake to apply the Dow Theory. They are published daily on the fi nancial pages of leading papers so that you need not work out the calculation yourself. Some able interpreters of the Theory include a third tool, i.e., the volume of sales each day. In this discussion we shall accept the teaching of the original Dow Theory authority, William Peter Hamilton, early editor of The Wall Street Journal, and regard volume of sales as incidental in importance.
prices of the averages’ stocks to fi nd the offi cial average. The divisor is the result of a succession of substitutions, deletions, and consolidations in the original list of industrial stocks. This also applies, of course, to the transportation divisor. Both divisors are adjusted when necessary to assure a continuous and uniform record.
The 30 stocks used in the Industrial Average are:
3MAmerican ExpressAppleBoeingCaterpillarChevronCisco SystemsCoca-ColaDisneyDowDuPontExxon MobilGoldman SachsHome DepotIBMIntel
Johnson & JohnsonJ.P. Morgan ChaseMcDonald’sMerckMicrosoftNikePfi zerProcter & GambleTravelersUnited TechnologiesUnitedHealth GroupVerizon CommunicationsVisaWalgreens Boots Alliance
Wal-Mart Stores
The Dow Theory 5
DOW THEORY WORKBENCHThe Dow Theory uses two tools:
1. Daily closing Dow Jones Transportation Average.2. Daily closing Dow Jones Industrial Average.
To use the tools advantageously we need a workbench, or chart. The further the chart reaches back into fi nancial history, the better for our purposes, because we are going to make an effort to recognize, and, fi nally, to anticipate recurring characteristics in the story of the averages.
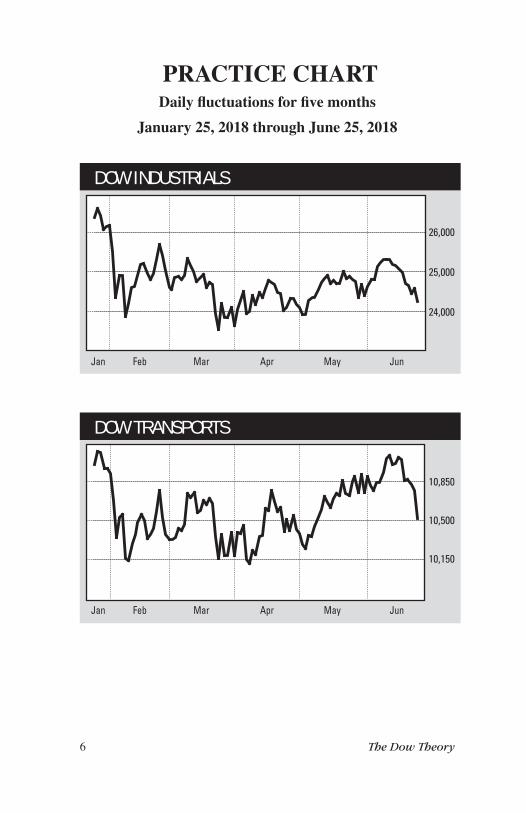
Our chart is divided into intervals of one day and our chart lines run from the closing average one day to the closing average the next day. The following chart shows the Dow Industrials and Dow Transports from January 25, 2018 to June 25, 2018. These charts provide a good picture for viewing market movements as they relate to the Dow Theory.
6 The Dow Theory
PRACTICE CHARTDaily fl uctuations for fi ve months
January 25, 2018 through June 25, 2018
DOW TRANSPORTS
10,850
10,500
10,150
DOW INDUSTRIALS
26,000
25,000
24,000
Jan Feb Mar Apr May Jun
Jan Feb Mar Apr May Jun
The Dow Theory 7
THE THREE MOVEMENTSWe have seen that the market as a whole has a trend and that
this trend is conveniently measured in terms of two sets of Dow Jones averages, Transports and Industrials. We are now going to examine the movement of these averages, confi dent that what is true of them is true of the great body of listed stocks.
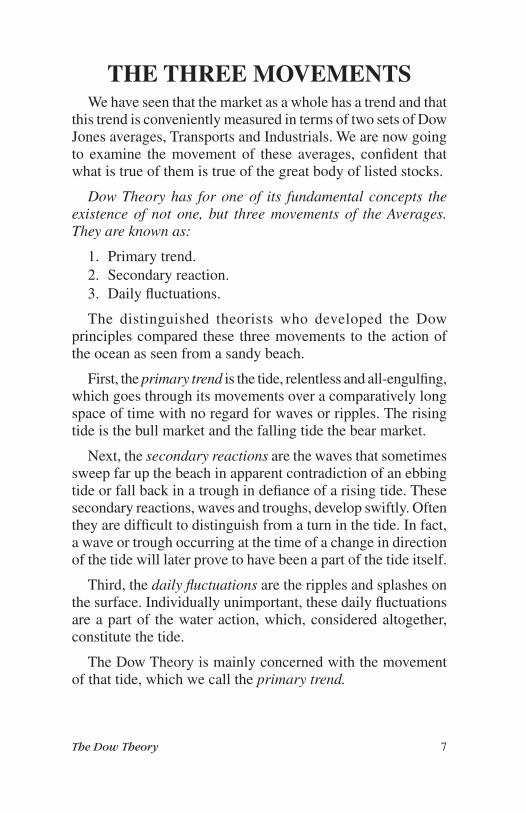
Dow Theory has for one of its fundamental concepts the existence of not one, but three movements of the Averages. They are known as:
1. Primary trend.2. Secondary reaction.3. Daily fl uctuations.
The distinguished theorists who developed the Dow principles compared these three movements to the action of the ocean as seen from a sandy beach.
First, the primary trend is the tide, relentless and all-engulfi ng, which goes through its movements over a comparatively long space of time with no regard for waves or ripples. The rising tide is the bull market and the falling tide the bear market.
Next, the secondary reactions are the waves that sometimes sweep far up the beach in apparent contradiction of an ebbing tide or fall back in a trough in defi ance of a rising tide. These secondary reactions, waves and troughs, develop swiftly. Often they are diffi cult to distinguish from a turn in the tide. In fact, a wave or trough occurring at the time of a change in direction of the tide will later prove to have been a part of the tide itself.
Third, the daily fl uctuations are the ripples and splashes on the surface. Individually unimportant, these daily fl uctuations are a part of the water action, which, considered altogether, constitute the tide.
The Dow Theory is mainly concerned with the movement of that tide, which we call the primary trend.
8 The Dow Theory
DAILY FLUCTUATIONS
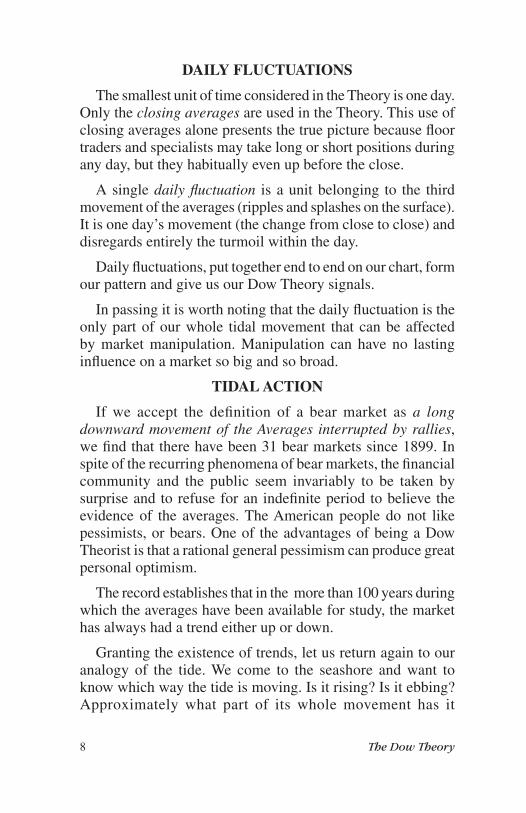
The smallest unit of time considered in the Theory is one day. Only the closing averages are used in the Theory. This use of closing averages alone presents the true picture because fl oor traders and specialists may take long or short positions during any day, but they habitually even up before the close.
A single daily fl uctuation is a unit belonging to the third movement of the averages (ripples and splashes on the surface). It is one day’s movement (the change from close to close) and disregards entirely the turmoil within the day.
Daily fl uctuations, put together end to end on our chart, form our pattern and give us our Dow Theory signals.
In passing it is worth noting that the daily fl uctuation is the only part of our whole tidal movement that can be affected by market manipulation. Manipulation can have no lasting infl uence on a market so big and so broad.
TIDAL ACTION
If we accept the defi nition of a bear market as a long downward movement of the Averages interrupted by rallies, we fi nd that there have been 31 bear markets since 1899. In spite of the recurring phenomena of bear markets, the fi nancial community and the public seem invariably to be taken by surprise and to refuse for an indefi nite period to believe the evidence of the averages. The American people do not like pessimists, or bears. One of the advantages of being a Dow Theorist is that a rational general pessimism can produce great personal optimism.
The record establishes that in the more than 100 years during which the averages have been available for study, the market has always had a trend either up or down.
Granting the existence of trends, let us return again to our analogy of the tide. We come to the seashore and want to know which way the tide is moving. Is it rising? Is it ebbing? Approximately what part of its whole movement has it

The Dow Theory 9
completed? Our market tide, however, has no such regularity of timing as the tide of the sea. The old salts who loiter around this beach are full only of information about the ripples and the spray, and this they would like to sell or even give away.
Let’s drive some stakes in the sand, where the waves slide up the beach, and see for ourselves which way the tide is moving. One or two waves and one or two stakes won’t be enough, so we will have to prepare a chart with all the waves stake-marked for many months or even years.
10 The Dow Theory
THE AVERAGES SPEAK These preparations we make to chart the movement of the
averages enable us to read what these averages are saying. A fundamental Dow principle is that the averages “see all and know all” of fi nancial importance. There is an exception: Averages cannot anticipate events commonly known as “acts of God,” but even such events are quickly appraised and evaluated by the action of the averages.
Refl ect for a moment on the proposition that at any given time the averages represent all that is known and all that can be foreseen by fi nancial and lay minds concerning fi nancial matters. The averages accurately refl ect the tapping of every source of important information that has any market signifi cance. As far as it is humanly possible, they offer a glimpse of the future. Insiders may see an impending turn in the affairs of their companies. They buy or sell. Their friends get the word. They buy or sell. Thousands of bright minds make a business of delving into fi gures, comparisons, patent news, weather reports, potential wars, and every other bit of information of possible market signifi cance. What these bright minds discover results in stock buying or selling long before such knowledge becomes public.
The averages gauge the infl uence of politics on business. For example, a business owner may operate the business as an instrument:
1. To make profi t for the owner.2. To serve the public.3. To give employment.
Meanwhile, whatever administration is in power in Washington may regard the same business as an instrument:
1. To produce tax revenue.2. To give employment.3. To serve the public.4. To profi t the owner.
The averages weigh, appraise and even anticipate the victories and defeats of this confl ict.
The Dow Theory 11
DOW THEORY CONFIRMATIONWe now come to a fundamental tenet of the Dow Theory:
for any signal to be authentic, it must be affi rmed by both the Industrial and Transportation averages. While this concept may seem a little confusing at fi rst, we have only to return to our analogy of the movement of the tide to clear it up. Instead of watching a single beach (or chart), we now must imagine ourselves standing at the mainland end of a narrow peninsula from which we can watch two beaches: Both are parts of the same ocean (market), divided into two parts (Industrial Average and Transportation Average) by the peninsula. While both beaches are subject to the same tidal action they may show varying wave action. The wave action on one beach may often prove highly deceptive as to the course of the tide unless we fi nd the movement confi rmed by similar action on the other beach.
Over the years during which the averages have been observed and recorded, this confi rmation by both averages has established itself as an essential part of the Theory.
The confi rmation that carries authority need not develop in our chart on the same day or even in the same week. It is deemed suffi cient if one average follows the other into new low ground, or new high ground, before the fi rst average retracts its half of the signal. The fi rst average retracts if it makes a new extreme in the opposite direction before confi rmation by the second average.
Remember that the Dow Theory is based primarily on experience, and that experience has demonstrated the necessity for confi rmation. Some chartists attempt to make forecasts from the action of the Industrial Average alone. However, no system of forecasting yet devised has approached the Dow Theory as an aid to successful investment over a period of years.
12 The Dow Theory
BULL MARKETIt is all very well to say that the Dow Theory is no more than
a method of applying common sense to the stock market. But individual investors, engrossed in their own affairs, probably haven't time to study stock-market history and learn what the record has to tell about trends.
Investors may apply common sense to the selection of an investment by examining the statements of a number of reputable companies. They may check their own estimate of values by searching the fi nancial press and making use of one of the established statistical services. And when an investor has done all this, he may make his investment in the best stock in the world just in time to suffer a devastating loss.
In 1929, United States Steel common stock was generally regarded as a safe conservative investment at a price above $260 a share and with a dividend of $8 a year. In less than three years, United States Steel common crashed to a price below $22 a share. No dividends at all were paid for four years.
When considering the purchase of any seasoned common stock, the most important thing to know about it is when to buy it.
No trifl ing matter is this trend or tidal action we are attempting to gauge and understand. The big incoming tide which started in the summer of 1970, with the Industrial Average at 631.16, surged on for almost 31 months and pushed the average to 1051.70. The ensuing bear market ran for almost two years before reaching a low of 577.60.
In the more than 100 years during which the averages have been recorded, there have been 31 clearly defi ned rising tides or bull markets, one of which had just begun at the time of publication. The average length of the 31 completed bull markets was approximately 34 months.
We may defi ne a primary bull market as a long, broad, upward movement of prices, which is interrupted at uncertain intervals by important reactions.
The Dow Theory 13
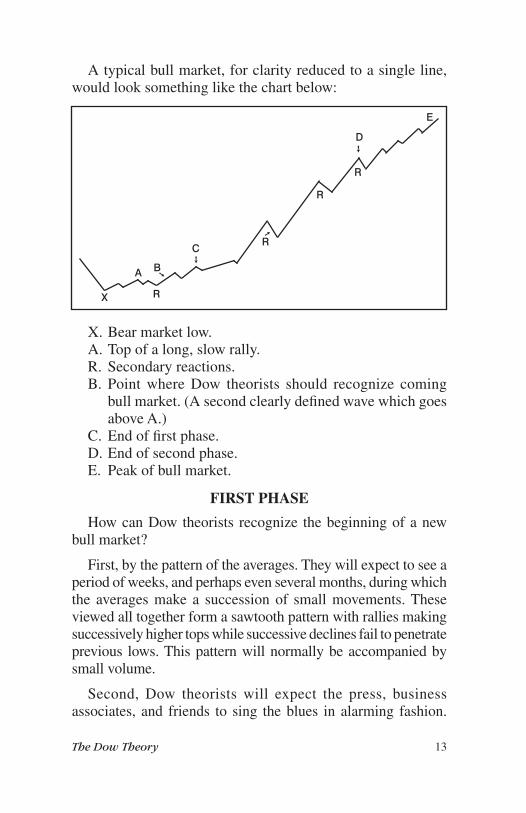
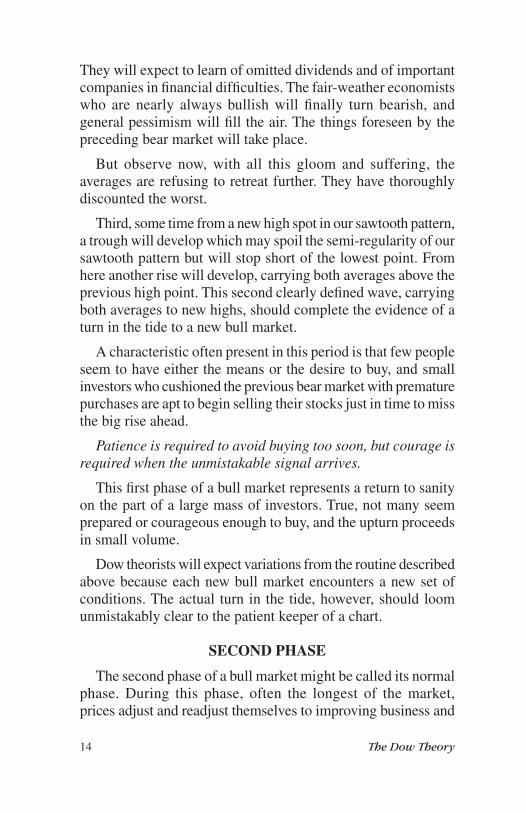
A typical bull market, for clarity reduced to a single line, would look something like the chart below:
X. Bear market low.A. Top of a long, slow rally.R. Secondary reactions.B. Point where Dow theorists should recognize coming
bull market. (A second clearly defi ned wave which goes above A.)
C. End of fi rst phase.D. End of second phase.E. Peak of bull market.
FIRST PHASE
How can Dow theorists recognize the beginning of a new bull market?
First, by the pattern of the averages. They will expect to see a period of weeks, and perhaps even several months, during which the averages make a succession of small movements. These viewed all together form a sawtooth pattern with rallies making successively higher tops while successive declines fail to penetrate previous lows. This pattern will normally be accompanied by small volume.
Second, Dow theorists will expect the press, business associates, and friends to sing the blues in alarming fashion.
A
X R
R
R
E
➘B
➚R
➙
C
D
➙
14 The Dow Theory
They will expect to learn of omitted dividends and of important companies in fi nancial diffi culties. The fair-weather economists who are nearly always bullish will fi nally turn bearish, and general pessimism will fi ll the air. The things foreseen by the preceding bear market will take place.
But observe now, with all this gloom and suffering, the averages are refusing to retreat further. They have thoroughly discounted the worst.
Third, some time from a new high spot in our sawtooth pattern, a trough will develop which may spoil the semi-regularity of our sawtooth pattern but will stop short of the lowest point. From here another rise will develop, carrying both averages above the previous high point. This second clearly defi ned wave, carrying both averages to new highs, should complete the evidence of a turn in the tide to a new bull market.
A characteristic often present in this period is that few people seem to have either the means or the desire to buy, and small investors who cushioned the previous bear market with premature purchases are apt to begin selling their stocks just in time to miss the big rise ahead.
Patience is required to avoid buying too soon, but courage is required when the unmistakable signal arrives.
This fi rst phase of a bull market represents a return to sanity on the part of a large mass of investors. True, not many seem prepared or courageous enough to buy, and the upturn proceeds in small volume.
Dow theorists will expect variations from the routine described above because each new bull market encounters a new set of conditions. The actual turn in the tide, however, should loom unmistakably clear to the patient keeper of a chart.
SECOND PHASE
The second phase of a bull market might be called its normal phase. During this phase, often the longest of the market, prices adjust and readjust themselves to improving business and
The Dow Theory 15
increased earnings. At this time investors can put a knowledge of individual company statistics to important use. Dow theorists, confi dent of the trend, can press home this advantage by judicious selection of individual stocks. They may choose to add to holdings from time to time as the second phase progresses. Of course, even in a primary bull market, not every day is a bull day. However, there will be few surprises for Dow theorists, as they know the nature and characteristics of secondary reactions, which we shall examine a little later.
FINAL PHASEThe third and final phase of a bull market has some
distinguishing characteristics of its own. Dow theorists may be right too soon. They may recognize the third and dangerous phase and, as a consequence of early recognition, too quickly take money off the table.
The third phase may have a long life, punctuated by frequent sharp reversals. The Dow theorist will watch the recovery from each reversal to see if both averages regain the lost ground and confi rm each other at new highs. If they do, the bull market is still on. Successive new highs by both averages, however, must be examined in the light of common sense. These confi rmed new highs have diminishing authority when the bull market is in its fi nal phase.
The time will come when a market shakeout, with the early appearance of an ordinary reversal, will fail to be followed by the expected rebound to new confi rmed highs. Instead, with diminishing volume, one or both averages will fall short of the previous highs.
The conclusive signal that the tide is turning, however, will appear when a fresh correction carries both averages below the lowest point of the preceding shakeout.
Near the climax of a bull market, you may witness extreme optimism on the part of professional statisticians and soothsayers, general bullishness on the part of newspapers and the public. The Dow theorist will remember that bear markets begin in good times, when the far-seeing eyes of the averages detect trouble on the distant horizon.
16 The Dow Theory
REVERSALS“Secondary reaction” is the time-honored Dow Theory
expression for an important decline in a primary bull market or an important rally in a bear market. The word “reversal” is more commonly used.
Reversals have always occurred and should not surprise us. We will examine them in the light of the past and know, more or less, what to expect.
A reversal comes swiftly and without warning out of a clear sky. As Dow theorists, we have no way of knowing when one will strike, but we do know to expect them at irregular intervals. When a reversal comes, it may continue for as short a period as a week or as long as several months. It may retrace percentage-wise perhaps one-third to two-thirds of the movement since the end of the last previous reversal.
Reversals tend to occur at a speed much greater than that of the primary trend. The reversal regularly occupies less time than the preceding primary movement.
The apex of the reversal will probably be accompanied by heavy volume and followed by our familiar sawtooth pattern with diminishing volume on each minor move against the primary trend.
CAUSES OF REVERSALS
A reversal is regularly caused by conditions within the market itself. In a bull market, such conditions might include too much speed in the advance, too many inadequately protected margin accounts, an excessive volume of loans to brokers, and the like. In a bear market, such conditions might be an oversold market or overextended short interest. Any important piece of news may serve as the spark to touch off a reversal.
To complete their diagnosis of a reversal, Dow theorists will remind themselves that fundamental conditions making for a big primary movement do not change overnight. If there has been no fundamental change in general business, then this rapid sell-off
The Dow Theory 17
(or advance), which looks only like a reversal, must be only a reversal and not a turn of the tide.
Distinguishing a reversal from an actual turn of the tide presents a delicate problem. On the chart, as on the beach, no one can know that a new wave will sweep higher or a new trough recede lower. But a clue remains: Once the fi nal phase of either a bull market or a bear market is recognized, then any apparent reversal must be regarded with suspicion, for it may prove to be the actual turn of the tide.
Reversals, properly known to Dow theorists as secondary reactions, can deceive. They have proved the despair of high-priced experts and the ruin of amateur dabblers. If they perplex you, return again to the analogy of the waves on the beach, which may be described and defi ned but seldom accurately anticipated.
No line of demarcation distinguishes a reversal (secondary movement) from the minor trend (daily fl uctuation). A series of daily fl uctuations that retraces as much as a third of the preceding primary movement would constitute a reversal. Authorities differ in defi ning lesser movements as reversals or as parts of the minor trend. Experience will gradually enable the new Dow theorist to ignore meaningless rallies and declines and to recognize the important reversal.
With the whole picture of the tide and the waves and troughs in mind, the Dow theorist will learn to identify each condition. Of course, if this were perfectly easy to do, we’d have so much company in the Theory business that we couldn’t use it at all.
18 The Dow Theory
PENDULUM SWINGSDow theorists should understand a principle sometimes
called “Dow’s Law of Action and Reaction.” A primary movement in the market is often followed by a movement in the opposite direction (reversal) amounting to at least one-third of the primary movement. The principle seems to persist for long, uninterrupted advances or declines no matter how far they may go. It also operates in the shorter swings of the daily fl uctuations.
We have already examined the long primary swings of this pendulum and its corrective backswings or reversals and have likened this action to the movements of the sea. We have passed over and found unimportant a similar pendulum movement in the daily fl uctuations. At the same time we must understand the fact that within the broad action and reaction of the pendulum, the shorter action and reaction of the minor movements continue. Dow thought a safe rule to follow was to expect at least a three-eighths correction of every primary movement.
On our chart, of course, this movement of pendulum within pendulum produces a highly irregular pattern that must not divert us from staking out succeeding new highs and lows and embracing as our working model our original analogy of the tide.
The Dow Theory 19
BEAR MARKETFIRST PHASE
As in bull markets, Dow theorists will often recognize three phases in a bear market. We may defi ne a primary bear market as the long, broad, downward movement of prices interrupted at irregular intervals by important reversals (rallies in this case). The bear market is caused by various disorders in the world that are damaging to business. Strangely enough, a bear market seems to persist until prices discount the very worst that may happen.
Dow theorists, fully aware of the recurrence of bear markets, will look for signs long before the completion of the primary bull market. They will realize that any reversal in the fi nal phase of a bull market may mark the beginning of the long downward movement. They will suspect the bear’s arrival when a seeming reversal in a bull market fails to be followed by a movement into new high ground. They will know the bear market has arrived when a second trough breaks through the low points established by the earlier trough. This fi rst phase represents the surrender of “get-rich-quick” hopes by late participants in the bull market.
SECOND PHASE
The second phase of a bear market often develops into a long, drawn-out affair. It will be punctuated at uncertain intervals by sharp reversals that may last from a week to several months, and which will recover a substantial part of the previous downturn. The record shows a wide range of recoveries, averaging 40%.
This second phase of a bear market often features such phenomena as recessions in most lines of business, decreased earnings of many companies, and assurances by so-called experts that bargain day is at hand.
20 The Dow Theory
THIRD PHASE
Not all bear markets develop a distinct third phase. Nevertheless, the Dow theorist will be prepared for a fi nal, crushing slide and the collapse of prices to a point that seems unbelievable. During this period, people who have seen their regular sources of income diminish to the vanishing point may sell stocks in order to obtain funds for living expenses.
Good stocks shrivel with the bad ones just because they can be sold. Statistical services often ignore this condition in making investment recommendations, but the all-seeing eyes of the averages consider this vital technical detail along with all other pertinent facts.
Dow theorists will not expect to buy into the absolute low of a bear market. In fact, the averages will not reveal to them that the bear market is over until the lows have passed. They will look for signs of the bear market end only after panicky selling has ceased and days of quiet markets ensue. They will not be tempted by sudden upturns to believe that the bear market has changed to a bull market in a day. The maladjustments that produce a bear market will not be cured overnight.
Small volume, the refusal of the averages to retreat in the face of bad news, and an all-pervading pessimism will make the Dow theorist alert for the signal that marks the coming of a new bull market.
The Dow Theory 21
TIME ELEMENTSIN PRIMARY TRENDS
Perhaps the hardest thing for the new Dow theorist will be the exercise of patience. Let him remember that he invests his money in competition with some very smart buyers. Almost every tick on the tape represents someone’s thoughtful decision. If investors pay attention, they can read these composite thoughts in time to gain a share of the profi t. They must not try to gain it all by attempting to buy at the absolute bottom.
Prices do not make their moves in response to the number of people buying or selling, but in response to the weight of dollars on the buying side and the pressure of stocks on the selling side. We watch the averages to discern the majority opinion of money, not people.
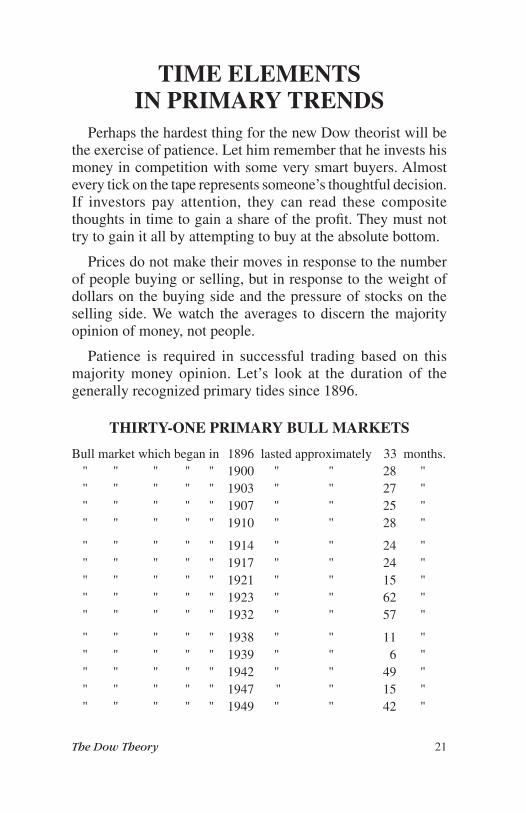
Patience is required in successful trading based on this majority money opinion. Let’s look at the duration of the generally recognized primary tides since 1896.
THIRTY-ONE PRIMARY BULL MARKETS
Bull market which began in 1896 lasted approximately 33 months. " " " " " 1900 " " 28 " " " " " " 1903 " " 27 " " " " " " 1907 " " 25 " " " " " " 1910 " " 28 "
" " " " " 1914 " " 24 " " " " " " 1917 " " 24 " " " " " " 1921 " " 15 " " " " " " 1923 " " 62 " " " " " " 1932 " " 57 "
" " " " " 1938 " " 11 " " " " " " 1939 " " 06 " " " " " " 1942 " " 49 " " " " " " 1947 " " 15 " " " " " " 1949 " " 42 "
22 The Dow Theory
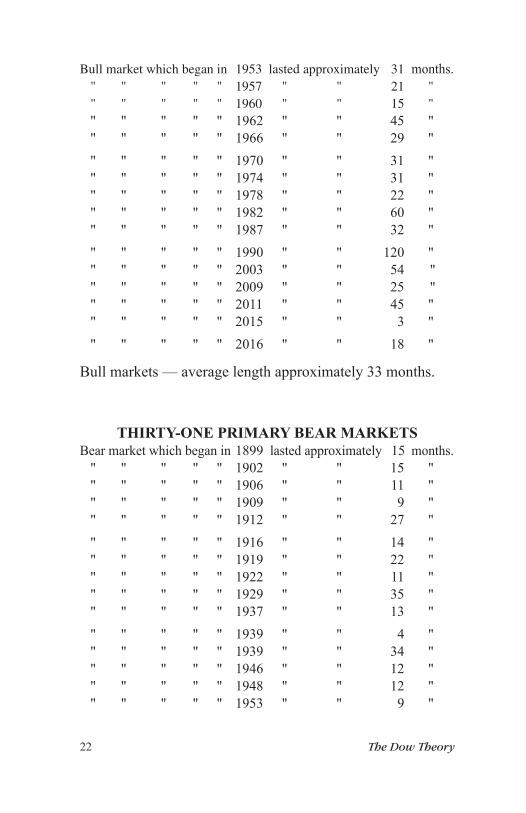
Bull market which began in 1953 lasted approximately 31 months. " " " " " 1957 " " 21 " " " " " " 1960 " " 15 " " " " " " 1962 " " 45 " " " " " " 1966 " " 29 " " " " " " 1970 " " 31 " " " " " " 1974 " " 31 " " " " " " 1978 " " 22 " " " " " " 1982 " " 60 " " " " " " 1987 " " 32 " " " " " " 1990 " " 120 " " " " " " 2003 " " 54 " " " " " " 2009 " " 25 " " " " " " 2011 " " 45 " " " " " " 2015 " " 3 " " " " " " 2016 " " 18 "
Bull markets — average length approximately 33 months.
THIRTY-ONE PRIMARY BEAR MARKETSBear market which began in 1899 lasted approximately 15 months. " " " " " 1902 " " 15 " " " " " " 1906 " " 11 " " " " " " 1909 " " 09 " " " " " " 1912 " " 27 " " " " " " 1916 " " 14 " " " " " " 1919 " " 22 " " " " " " 1922 " " 11 " " " " " " 1929 " " 35 " " " " " " 1937 " " 13 " " " " " " 1939 " " 04 " " " " " " 1939 " " 34 " " " " " " 1946 " " 12 " " " " " " 1948 " " 12 " " " " " " 1953 " " 09 "
The Dow Theory 23
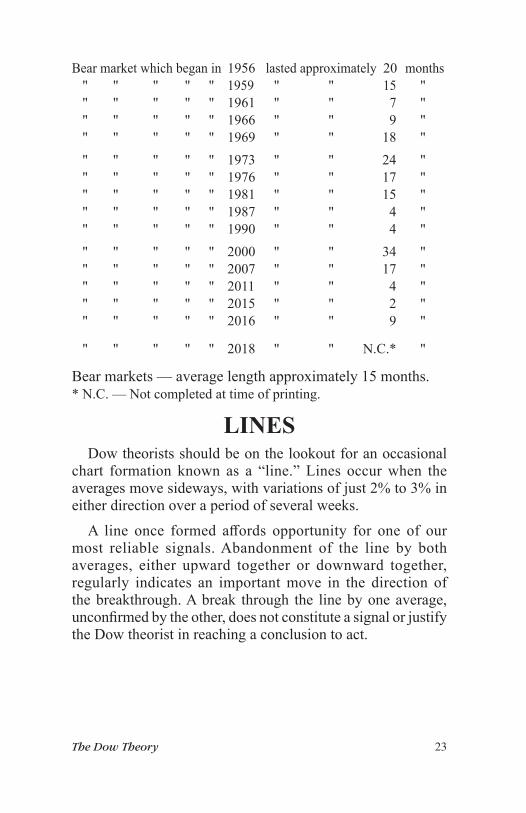
Bear market which began in 1956 lasted approximately 020 months " " " " " 1959 " " 15 " " " " " " 1961 " " 07 " " " " " " 1966 " " 9 " " " " " " 1969 " " 18 " " " " " " 1973 " " 24 " " " " " " 1976 " " 17 " " " " " " 1981 " " 15 " " " " " " 1987 " " 04 " " " " " " 1990 " " 04 " " " " " " 2000 " " 34 " " " " " " 2007 " " 17 " " " " " " 2011 " " 4 " " " " " " 2015 " " 2 " " " " " " 2016 " " 9 "
" " " " " 2018 " " N.C.* "
Bear markets — average length approximately 15 months.* N.C. — Not completed at time of printing.
LINESDow theorists should be on the lookout for an occasional
chart formation known as a “line.” Lines occur when the averages move sideways, with variations of just 2% to 3% in either direction over a period of several weeks.
A line once formed aff ords opportunity for one of our most reliable signals. Abandonment of the line by both averages, either upward together or downward together, regularly indicates an important move in the direction of the breakthrough. A break through the line by one average, unconfi rmed by the other, does not constitute a signal or justify the Dow theorist in reaching a conclusion to act.
24 The Dow Theory
SIGNAL PRACTICEIf you now have a clear conception of the averages and Dow
Theory tidal action, you hold the key to success in your own business and fortune in investing.
The averages don’t talk all the time. But when they do talk, believe them. When they say something, that something stands until they say something else. If, now and then, they seem to lead you astray, the fault probably lies in your understanding, and you must listen again and correct your interpretation.
Remember, the averages are the sum of all information having any market infl uence. They represent the majority money opinion. Over the years Dow theorists have discovered certain recurring characteristics of movement and try to use this experience to reap profi ts.
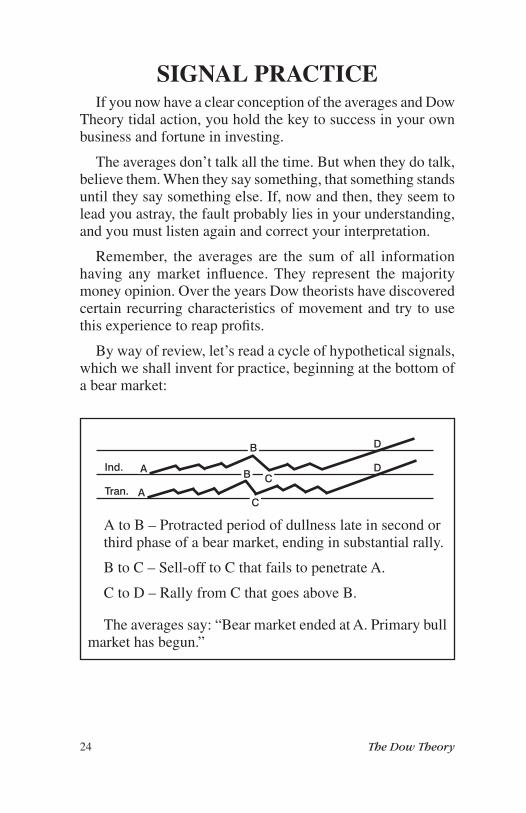
By way of review, let’s read a cycle of hypothetical signals, which we shall invent for practice, beginning at the bottom of a bear market:
A to B – Protracted period of dullness late in second or third phase of a bear market, ending in substantial rally.
B to C – Sell-off to C that fails to penetrate A.
C to D – Rally from C that goes above B.
The averages say: “Bear market ended at A. Primary bull market has begun.”
Ind.
Tran.
B
B
A
AC
C
D
D
The Dow Theory 25
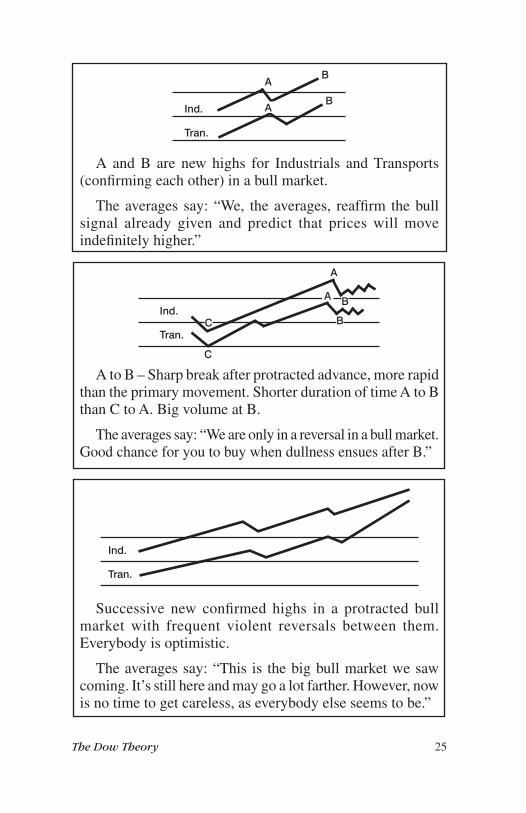
A and B are new highs for Industrials and Transports (confi rming each other) in a bull market.
The averages say: “We, the averages, reaffi rm the bull signal already given and predict that prices will move indefi nitely higher.”
A to B – Sharp break after protracted advance, more rapid than the primary movement. Shorter duration of time A to B than C to A. Big volume at B.
The averages say: “We are only in a reversal in a bull market. Good chance for you to buy when dullness ensues after B.”
Successive new confi rmed highs in a protracted bull market with frequent violent reversals between them. Everybody is optimistic.
The averages say: “This is the big bull market we saw coming. It’s still here and may go a lot farther. However, now is no time to get careless, as everybody else seems to be.”
Ind.
Tran.
Ind.
Tran.
A
A
B
B
Ind.
Tran.
A
A B
BC
C
26 The Dow Theory
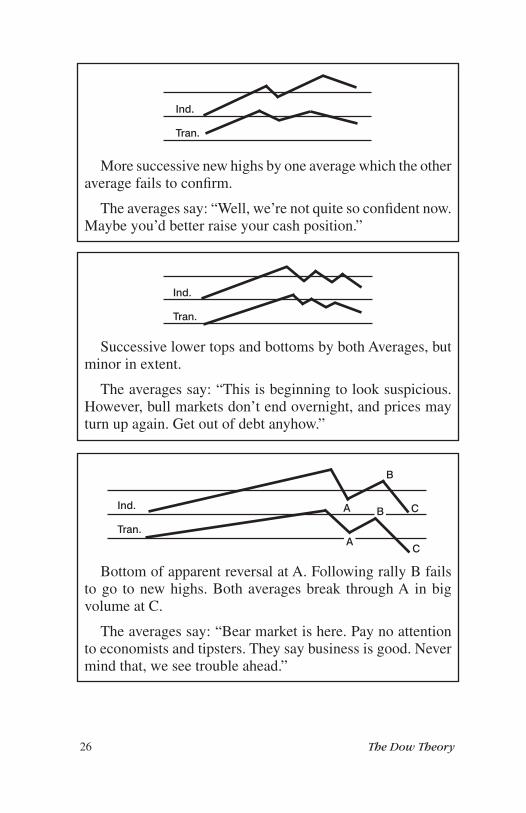
More successive new highs by one average which the other average fails to confi rm.
The averages say: “Well, we’re not quite so confi dent now. Maybe you’d better raise your cash position.”
Successive lower tops and bottoms by both Averages, but minor in extent.
The averages say: “This is beginning to look suspicious. However, bull markets don’t end overnight, and prices may turn up again. Get out of debt anyhow.”
Bottom of apparent reversal at A. Following rally B fails to go to new highs. Both averages break through A in big volume at C.
The averages say: “Bear market is here. Pay no attention to economists and tipsters. They say business is good. Never mind that, we see trouble ahead.”
Ind.
Tran.
Ind.
Tran.
Ind.
Tran.
A
A
B
B C
C
The Dow Theory 27
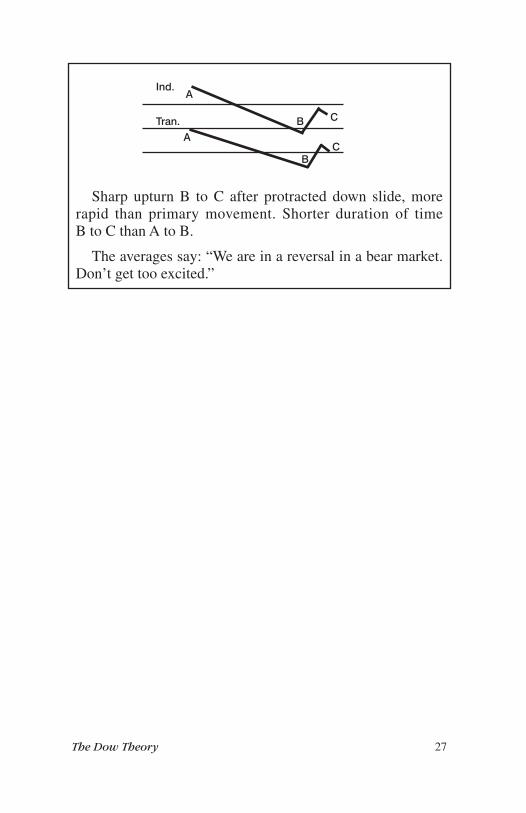
Sharp upturn B to C after protracted down slide, more rapid than primary movement. Shorter duration of timeB to C than A to B.
The averages say: “We are in a reversal in a bear market. Don’t get too excited.”
Ind.
Tran.
A
AB
B
C
C
28 The Dow Theory
CONCLUSIONFew investors are wholehearted, practicing Dow theorists; few
investors base their transactions on the story of the averages alone, regardless of the action of the crowd and the ballyhoo of tipsters.
When a great bear market rolls in periodically, sometimes the injured will complain that the Dow Theory caused it. Somewhere they have heard that the Dow Theory (as usual) has been right and that the selling of Dow theorists has caused the downturn. Don’t be fooled. Even if you consider the casual Dow theorists as well as the purists, these investors don’t control enough of the market’s volume to do more than briefl y infl uence the minor trend of daily fl uctuations.
* * * * * *The knowledge that the Dow Theory works and that it has
demonstrated its usefulness again and again over more than 100 years should warrant your continuing the chart and profi ting from its implications.
You have accomplished something when you have a clear idea of the following points:
1. The averages express the sum of all pertinent information.
2. The market as a whole has a trend.
3. The trend is interrupted by reversals.
4. A signal is made only when one average confi rms the movement of another.
5. A signal, once given, remains in force until a countersignal is given.
6. Signals made in third phases have diminishing authority.
7. Manipulation and short-selling have no lasting infl uence on the trend.
8. Conditions that bring about bull markets and bear markets change slowly.
9. No outside infl uence should interfere with your strict reading of the averages, but you should consider attendant phenomena in context.
6/18

BOOKSBOOKSChuck Carlson’s 60-Second Investor ................. $9.95
Timely tips, tools, & tactics for the time-strapped investor.
The Best Dividend & Income Investments ...... $19.97Loaded with specifi c recommendations on dividend-
paying stocks and income investment strategies.
Best Mutual Funds for Growth & Income ....... $14.95The best tool on the market for smart investing
in mutual funds.
The Little Book of BIG DIVIDENDS .................. $9.95Chuck Carlson’s cutting edge strategy for
fi nding safe and growing dividends.
Dividend Reinvestment Plans Directory ............ $20.95 Comprehensive directory of over 650 dividend reinvestment plans.
Dow Theory Forecasts www.DowTheory.comStock market trends and securities reports since 1946.
Upside www.UpsideStocks.comBest buys in small and midcap stocks.
DRIP Investor www.DRIPInvestor.comYour guide to buying stocks without a broker.
NEWSLETTERSNEWSLETTERS
To purchase any of these Books or Newsletters call or write:
7412 Calumet Avenue ■ Hammond, IN 46324-2692 ■ 1-800-233-5922
HORIZONPUBLISHING COMPANY
www.HorizonPublishing.com