Embed Size (px)
Citation preview
IZA DP No. 1088
The Economic Experiencesof Refugees in Canada
Don DeVoretzSergiy PivnenkoMorton Beiser
DI
SC
US
SI
ON
PA
PE
R S
ER
IE
S
Forschungsinstitutzur Zukunft der ArbeitInstitute for the Studyof Labor
March 2004
The Economic Experiences of
Refugees in Canada
Don DeVoretz IMER, Malmo University,
RIIM, Simon Fraser University and IZA Bonn
Sergiy Pivnenko RIIM, Simon Fraser University
Morton Beiser
CERIS, University of Toronto
Discussion Paper No. 1088 March 2004
IZA
P.O. Box 7240 53072 Bonn
Germany
Phone: +49-228-3894-0 Fax: +49-228-3894-180
Email: [email protected]
Any opinions expressed here are those of the author(s) and not those of the institute. Research disseminated by IZA may include views on policy, but the institute itself takes no institutional policy positions. The Institute for the Study of Labor (IZA) in Bonn is a local and virtual international research center and a place of communication between science, politics and business. IZA is an independent nonprofit company supported by Deutsche Post World Net. The center is associated with the University of Bonn and offers a stimulating research environment through its research networks, research support, and visitors and doctoral programs. IZA engages in (i) original and internationally competitive research in all fields of labor economics, (ii) development of policy concepts, and (iii) dissemination of research results and concepts to the interested public. IZA Discussion Papers often represent preliminary work and are circulated to encourage discussion. Citation of such a paper should account for its provisional character. A revised version may be available on the IZA website (www.iza.org) or directly from the author.
IZA Discussion Paper No. 1088 March 2004
ABSTRACT
The Economic Experiences of Refugees in Canada
Canada admits refugees on the basis of compassion and not economic criteria. It is however, important to document the economic successes or failures among Canada’s refugee population in order to understand how post arrival integration policies affect refugee economic performance. This essay examines a set of economic indicators from Canada’s IMDB database to assess the post 1981 Canadian refugee economic experience. With the aid of a standard human capital model we answer a series of economic questions including the length of time required for refugee economic integration, their use of Canada’s social safety net, refugee poverty levels and refugee economic performance vis-à-vis Canada’s family immigrant class. Our main findings are that employed Canadian refugees earn an amount equal to that earned by their family class reference group circa 1980-2001. However, the incidence of social assistance attachment for refugees is substantial and for those refugees who receive any assistance their total income is at the near destitute level. JEL Classification: J61 Keywords: refugees, immigrant earnings, human capital Corresponding author: Sergiy Pivnenko Centre of Excellence WMX 4647 Simon Fraser University Burnaby, BC, V5A 1S6 Canada Email: [email protected]
I. Introduction
Canada’s immigration and refugee legislation admits permanent residents through a
variety of gateways which all require prior assessment to qualify for admission. This paper
concentrates on the economic performance of refugees. As one of more than 150 signatories
to the UN Convention on refugees, Canada is committed to protecting the persecuted and
stateless. Canada is also one of a much smaller group of Convention signatories who offer
not just temporary protection, but the option of permanent resettlement. Humanitarian
concerns presumably motivate the decision to offer refugees the opportunity for permanent
resettlement, and such concerns probably provide sufficient justification to perpetuate this
policy. Critics, however, suggest that the policy is misguided, because it brings grave
economic consequences in its wake. This paper addresses these concerns by investigating
the question: what are the labour market outcomes for refugees in Canada?
Those refugees who arrive in Canada must meet several criteria. Convention refugees
are people who leave their country because of a well-founded fear that they will be
persecuted due to their religious beliefs, race, nationality, political opinion or membership in
a persecuted group. In addition to Convention refugees, Canada has been admitting
Protected Persons,1 that is, asylum seekers and inhabitants of designated refugee-producing
countries. Asylum seekers are defined as those persons “seriously and personally affected by:
civil war, armed conflict, or massive violations of human rights.” Inhabitants of the
designated countries2 meet the definition of Convention refugees, and can include people
who suffer because their country denies them the rights of freedom of expression, dissent, or
the right to engage in trade union activity. However, unlike Convention refugees or asylum
seekers, the latter group must apply for resettlement from outside Canada. These refugee
applicants are admitted under special rules and are considered either a Convention refugee or
a member of a humanitarian designated class.
The humanitarian designated class was introduced by the federal government in 1997
to provide for the possibility of resettlement to individuals personally or seriously affected by
situations including civil war and armed conflict. Refugees may be selected abroad for
1 Under the 2002 legislation, or the Immigration and Refugee Protection Act this entry group is now referred to as the Humanitarian Designated Classes. 2 List of countries posted on CIC web site at www.cic.gc.ca/english/refugees/resettle-5.html.
2
resettlement in Canada or may apply for and receive Convention refugee status from the
federal Immigration and Refugee Board within Canada. Finally, it is important to note that
Canada’s refugee assessment contains no economic criteria for entry.
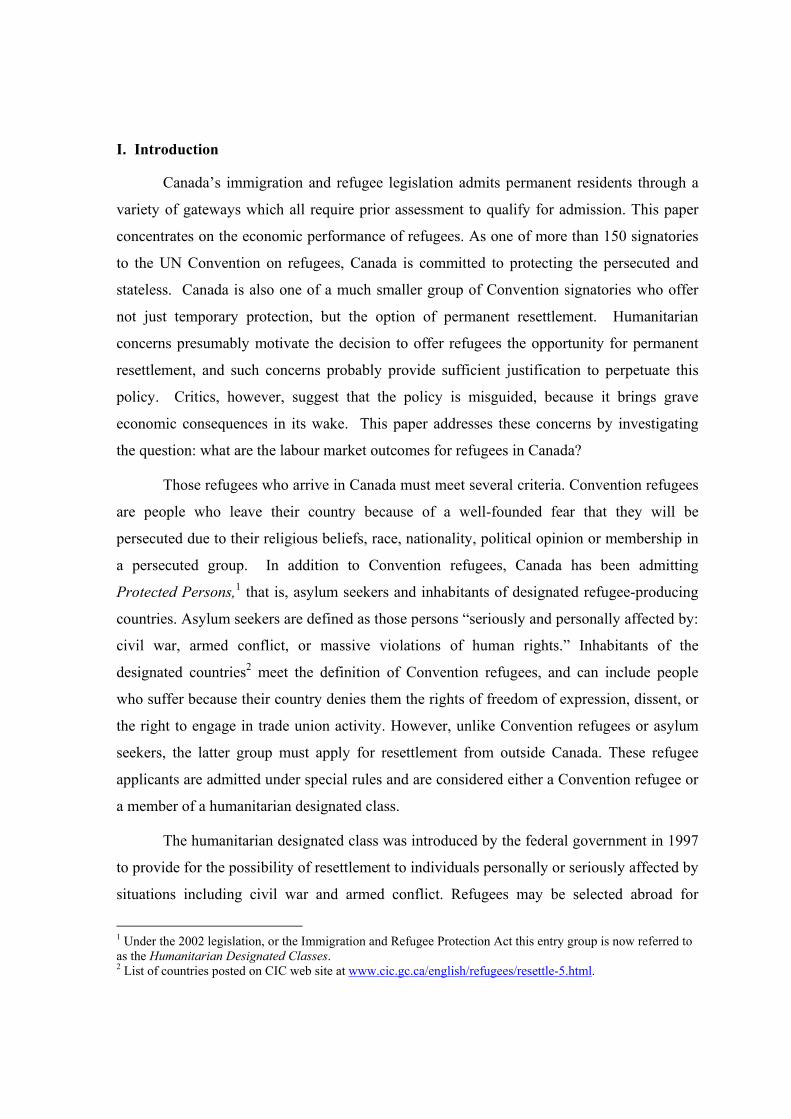
Figure 1: Refugee Arrivals to Canada: 1980-2001
0
5,000
10,000
15,000
20,000
25,000
30,000
35,000
40,000
45,000
1980 1983 1986 1989 1992 1995 1998 2001
CanadaQuebec
Source: Landed Immigrant Data System (LIDS), CIC Canada
Canada total: 535,652
Quebec total: 105,840
Between 1980 and 2001 Canada received a total of 535,131 refugees from a wide
variety of source countries. Figure 1 documents dramatic fluctuations in refugee arrivals
between 1980 and 2001, with numbers ranging from a high of 40,000 in 1980 (corresponding
to the “Boat People” crisis in Southeast Asia which stimulated the largest admission of
refugees in Canada’s history) to a low of 15,000 in 1983. Since Canada does not have an
explicit or implicit refugee quota, the total number of yearly refugee arrivals is a product of
both external events and Canada’s overall yearly immigrant target levels. The fall in refugee
levels in the 1980’s and the rise in the early 1990’s largely mimics the movement of total
announced immigration targets. During the last seven years, the number of refugee arrivals
has become stabilized at fewer than 25,000 per year, roughly ten percent of the immigrant
total.
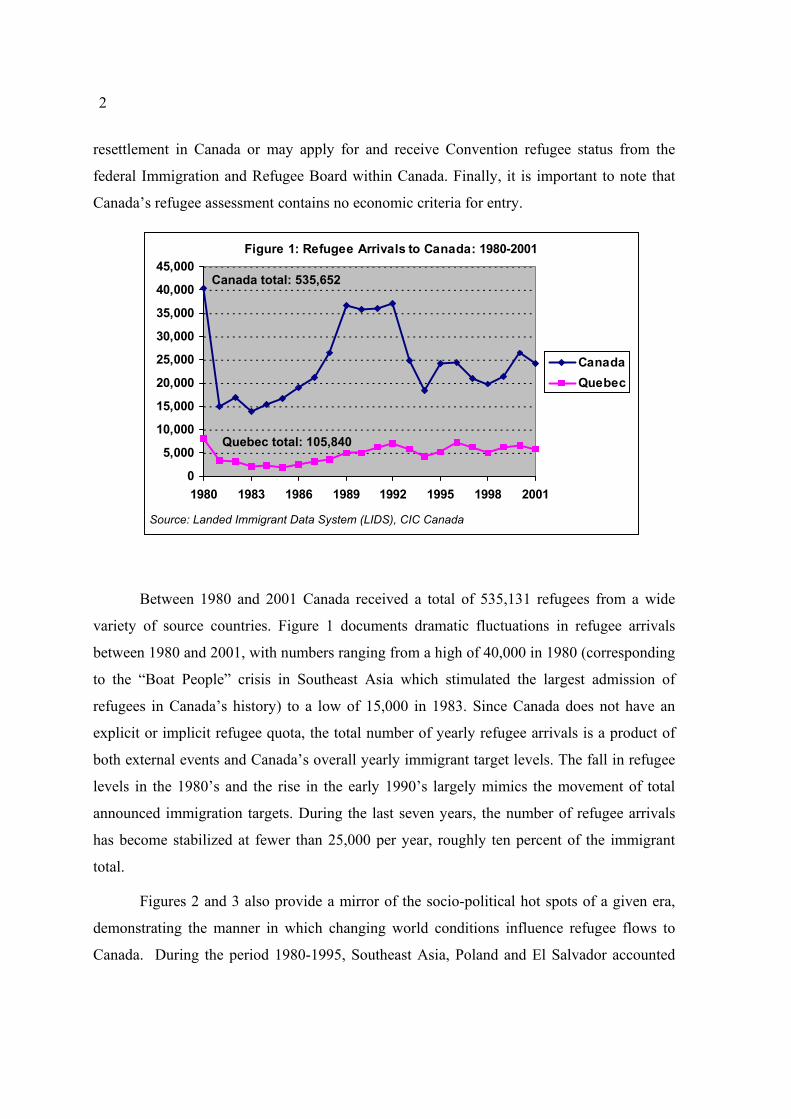
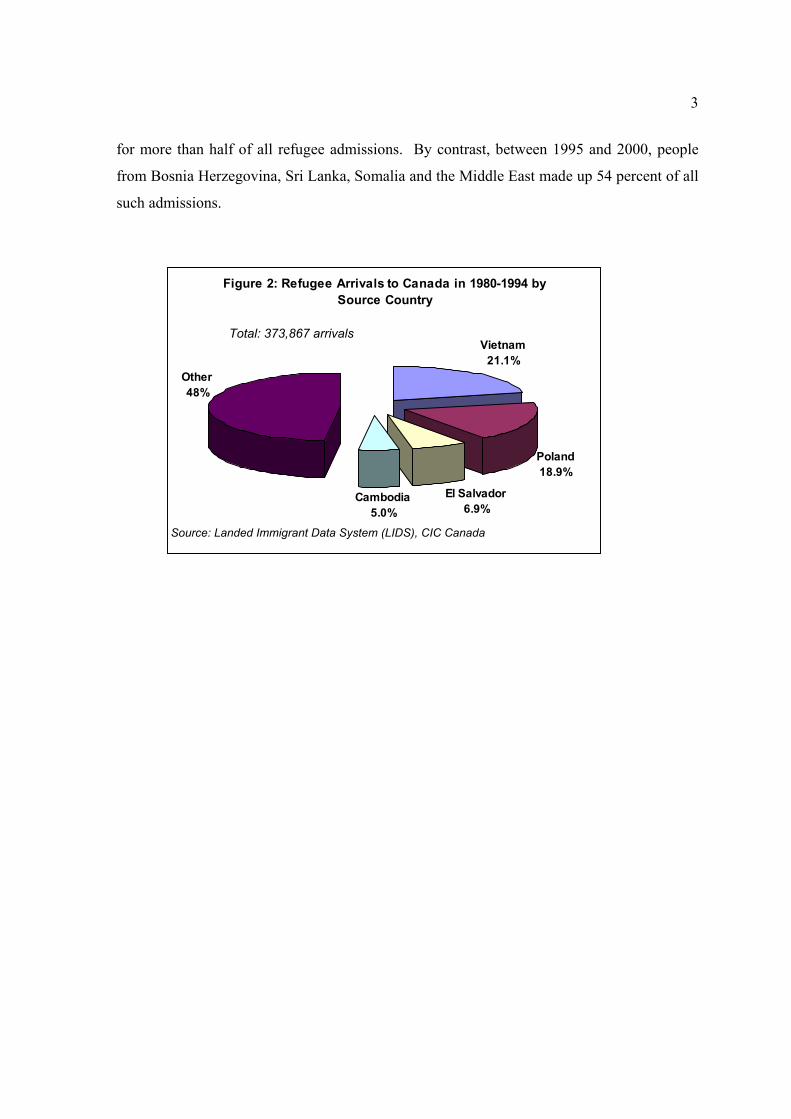
Figures 2 and 3 also provide a mirror of the socio-political hot spots of a given era,
demonstrating the manner in which changing world conditions influence refugee flows to
Canada. During the period 1980-1995, Southeast Asia, Poland and El Salvador accounted
3
for more than half of all refugee admissions. By contrast, between 1995 and 2000, people
from Bosnia Herzegovina, Sri Lanka, Somalia and the Middle East made up 54 percent of all
such admissions.
Figure 2: Refugee Arrivals to Canada in 1980-1994 by Source Country
Other48%
Vietnam21.1%
Cambodia5.0%
Poland18.9%
El Salvador6.9%
Source: Landed Immigrant Data System (LIDS), CIC Canada
Total: 373,867 arrivals
4
Figure 3: Refugee Arrivals to Canada in 1995-2000 by Source Country
Iraq5%
Somalia5%
Other46%
Bosnia Hercegovina
18.8%
Iran6.2%
Sri Lanka12.1%
Afghanistan6.9%
Source: Landed Immigrant Data System (LIDS), CIC Canada
Total: 161,785 arrivals
Given this dramatic and fluctuating number of refugee claimants and their
heterogeneity across source countries it is appropriate to ask how these various refugee
groups fared over time in the Canadian economy. The central goal of this essay is to answer
this question.
This paper proposes to analyze the economic performance of Canadian refugees in
terms of the standard human capital model. This model basically states that individuals prior
to or after arrival in Canada differentially invest in themselves to increase their endowment
of human capital (education and language) depending on their age and ability. In turn,
differential rates of investment by individuals lead to different economic outcomes in the
labor market. In addition to human capital investment, Canadian immigration selection
policy influences the ultimate economic outcome of refugees and immigrants. In the
Canadian context, foreign arrivals can enter across three broad gateways, the independent or
economic class, via a family reunification gateway or by refugee designation.3 From an
3 The economic or independent class is further subdivided into principal applicants and dependents. Only the principal applicants are assessed for their potential economic contribution under Canada’s points system. Thus, they constitute the doubly selected group. The accompanying minors or the spouse of the principal applicant of the spouse are not assessed but can not enter Canada unless the principal applicant passes the second selection
5
economic viewpoint the government’s designation of the assessment gateway influences the
economic outcomes of the foreign born. In fact, most foreign arrivals to Canada, including
refugees, are not economically screened by Canada but are singly selected.4 In short, those
who self-select to leave home, but experience no further economic screening upon arrival to
Canada will be referred to in this paper as singly selected.5 Double selection in the immigrant
literature argues that the immigrant first self-selects by leaving, and then the destination
country will select them again if the immigrant offers himself as an economic or independent
mover.6 This second selection based upon human capital attributes of the Canadian bound
economic immigrants, presumably leads to their speedier integration into the Canadian
economy. In turn, the condition of the Canadian economy at the refugee’s or immigrant’s
time of arrival is often an important influence on their ultimate economic success. 7
Given that refugees are selected under the sole criterion of humanitarian compassion
with presumably little consideration given to their human capital attributes, very few
economists have analyzed Canadian refugee economic performance to date. Several relevant
economic questions arise, which we would like to address. These include:
1. Do refugees experience economic integration after a period of time in Canada?
2. How does the refugee economic experience compare to Canada’s other singly selected
immigrant group or the family class?
3. Does a refugee’s economic performance depend on which particular refugee gate she/he
entered?
4. Does the year of arrival and the associated macro-economic conditions affect the
economic performance of refugees?
procedure. Thus, this paper will treat all members of the independent class, both principal members and their dependents as doubly screened. 4 In fact, only 17% of all arrivals (none refugees) must pass economic criteria to earn 65 plus points on human capital attributes prior to admission. 5 Clearly, Canada attempts in insure that the bone fides exist for self proclaimed refugees, but in terms of their economic outcome there is no explicit selection technique employed by Canada to gain admission. This also holds for the family class of immigrants. 6 The 2002 Immigration and Refugee Protection Act (IRPA) of 2002 made some substantial changes in both economic criteria for entry of the economic class and the adjudication of refugees. However, all the refugee arrivals under study in this paper were admitted under the 1978 Immigration Act. See Yan Shi 2003) for complete details of both the 1978 and 2002 Immigration Acts. 7 This is termed the scarring effect. If the economy is weak upon arrival then many immigrants never experience the economic “catch-up” that immigrants who arrive in economically robust periods experience.
6
5. How many refugees remain below the low-income or poverty line after seven years in
Canada?
6. What is the refugee social assistance and employment insurance experience given the
answer to question 5?
The primary purpose of the remaining portions of this essay is to answer these
questions and arrive at an overall conclusion on Canadian refugee economic integration. To
do this end, we next provide some stylized facts about the human capital characteristics of
refugees. Given this background we then report refugee earnings and their relative rates of
economic integration into the Canadian economy after arrival and their use of Canada’s
social safety net. Finally, we conclude our study by answering the above posed questions and
assess Canadian refugee economic integration in general.
II. Literature Review
The academic literature has primarily focused on legal or political issues of refugee
claimants in Canada. Thus, the economic performance of refugees has received little
attention.
Research with the “Boat People,” Southeast Asian refugees from Vietnam, Laos and
Cambodia (Beiser 1999; Caplan, Whitmore and Choy 1989; Haines 1987; Strand 1989; Fass
1986) who were admitted to the U.S. and Canada suggests that, after an initial decade of
economic struggle, refugee employment rates approximate, and perhaps better those of the
receiving society and that refugee service demands are lower. Because these studies have
focused on a particular group of refugees who arrived in North America during a particular
historical era, the conclusions are necessarily limited.
This lack of a comprehensive studies on the economic status of refugees partially
owes to inadequate census data. Census data in the U.S. or Canada only discloses foreign
birth status and does not reveal entry status (e.g. refugee, family class immigrant, etc.) of an
7
immigrant and thus precludes any detailed economic analysis of the refugee sub-group.
Nonetheless, some imaginative census based work has been reported. 8
A more reliable data source is available to refugee scholars in Canada.
The Longitudinal Immigration Data Base (IMDB) combines information from
landing records compiled by Citizenship and Immigration Canada (CIC) with information
from refugee or immigrant personal income tax returns. If we combine these two data sets we
can track income performance of different immigrant admission categories including
refugees after 1980. However, education, occupation and official language ability are
recorded as “tombstone” information. In other words, the values of these variables are only
known at the time of the refugee’s landing date.9
The IMDB data set allows an economic analysis across entry categories of
immigrants over a sufficiently long enough time period to identify cohort, period and aging
affects on differential refugee economic outcomes.
A CIC (1998) utilizing the IMDB database revealed important differences (and some
similarities) in the labour market behavior of Canada’s major immigrant admission
categories.10 An important example of both differential and then converging behavior is the
finding that although Canadian refugees reported substantially lower employment earnings
than economic applicants, their earnings patterns relative to three other immigrant entry
categories were very similar.11 Moreover, refugees who had been in Canada for twelve or
more years reported average employment earnings at or near the Canadian-born average.
Nonetheless, this study reported that refugees admitted prior to 1990 typically reported the
highest rates of unemployment benefit usage when compared to any other immigrant
category or the Canadian-born population. Also after two years in Canada refugees again
report the highest rates of social assistance usage. 8 For example, in the U.S. Cortez (2001) used the 1980 and 1990 U.S. censuses to generate a synthetic panel of refugee and economic immigrants. Even with these limitations, Cox found that refugees have higher rates of human capital accumulation and thus even though their earnings start below other U.S. immigrants their annual earnings grow faster than these immigrants. This finding reinforces our earlier contention that educational attainment is crucial in determining refugee earnings. 9 Some tombstone data, age at arrival, years in Canada can be extrapolated into the future. 10 These groups included the family class, economic principal applicants, the spouses and dependents of these economic principal applicants, and refugees. 11 These immigrant groups included the family class, and the spouses and dependents of economic principal applicants.
8
Using a very restrictive sample size DeSilva (1997) employed a IMDB sub sample of
male immigrants who landed during the period 1981-1984 to test the commonly held belief
that Canadian refugees perform poorly when compared to Canadian immigrant groups. His
analysis was restricted to four immigrant entry classes: independents, assisted relatives,
Convention refugees, and the designated class, the last two being combined into one group
for the purposes of regression analysis. DeSilva found that although independently selected
immigrants were the highest foreign-born income earners, they experienced the smallest
earnings growth after arrival. In contrast, the designated refugee class reported the most rapid
increase in earnings.
Overall, DeSilva’s study demonstrated a rapid convergence in earnings among
immigrants and refugees over time. Although the refugee and assisted relative classes
initially showed a significant earnings disadvantage compared with the independents, the gap
narrowed over time. Given that refugees had the weakest language ability upon landing, their
economic progress was deemed strong.
DeSilva also employed an Oaxaca decomposition technique, which revealed that
differences between refugee and immigrant human capital endowments at the time of landing
account for only a small portion of the earnings differentials that exist across these groups.
This implies that one has to look at some factors other than educational and demographic
characteristics at arrival to explain the observed earnings differentials.
Finally, DeSilva argues that the economic success of refugees was highly conditioned
on their region of origin. The most successful among them were those from Europe, whereas
many of refugees from Africa and Southeast Asia have performed poorly.
Beiser and Hou (2000), using the data from the Refugee Resettlement Project (RRP),
examined gender differences in the English language acquisition and male-female differences
in the employment consequences of language proficiency of refugees. The results of the
study confirmed that English proficiency was a significant determinant of the likelihood of
unemployment and labour force participation in the long term.
In sum, the extant literature on Canadian refugee economic performance points to the
use of the IMDB as the primary data source for this analysis. In addition, these studies argue
that earnings convergence occurs between refugees and any reference group over time (12
9
years) with educational attainment and language acquisition conditioning the speed of
convergence. We will explore this presumed earnings convergence in more detail in the
following section.
III. Stylized Facts
Canadian researchers are fortunate in having at their disposal two administrative data
bases that when combined yield the researcher a portrait of the immigrant upon arrival
(LIDS) and records his/her economic performance while residing in Canada (IMDB). The
LIDS or landings records are exhaustive and cover every permanent legal immigrant to
Canada who arrived after 1980. It is a snapshot that records various socio-economic and
demographic features upon arrival. Our version of LIDS covers 4.1 million entrants between
1980 and 2001. The IMDB or immigration database combines both the LIDS database to the
immigrant’s yearly tax records. This administrative database only covers immigrants who file
income tax and hence the coverage is limited to 40-50 percent of all past arrivals. We will
employ this data set to generate some stylized facts below and in our more extensive analysis
in the next section.12
The human capital attributes of refugees varied considerably and was, to some extent
a reflection of educational opportunities available in refugee producing countries.
12 The IMDB has one major weakness, namely the disappearance of immigrants over time through death, emigration or retirement but otherwise provides a time series picture of refugee and immigrants.
10
49.6%
36.4%
14.0%
66.9%
22.0%
11.0%
50.6%
23.8%
25.5%
80.4%
13.3%
6.3%
74.8%
14.5%
10.7%
49.5%
17.9%
32.6%
0%
20%
40%
60%
80%
100%
Refugee Family Skilled Refugee Family Skilled
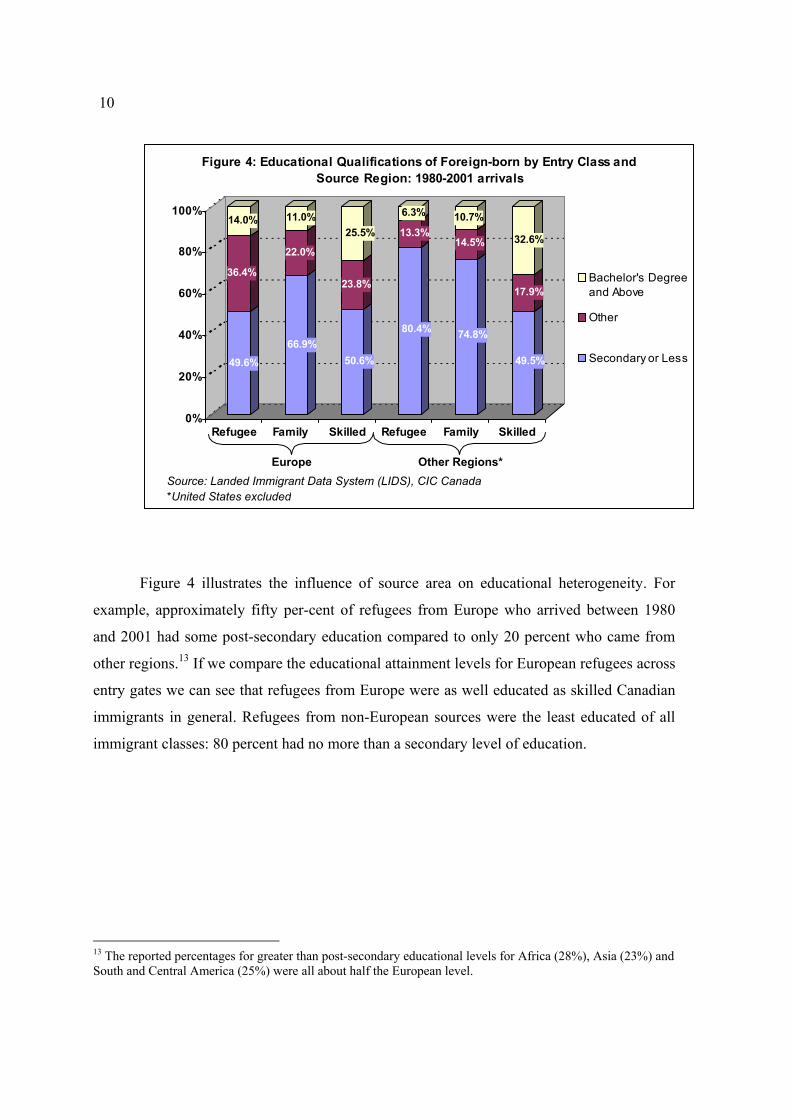
Figure 4: Educational Qualifications of Foreign-born by Entry Class and Source Region: 1980-2001 arrivals
Bachelor's Degreeand Above
Other
Secondary or Less
Europe Other Regions*Source: Landed Immigrant Data System (LIDS), CIC Canada*United States excluded
Figure 4 illustrates the influence of source area on educational heterogeneity. For
example, approximately fifty per-cent of refugees from Europe who arrived between 1980
and 2001 had some post-secondary education compared to only 20 percent who came from
other regions.13 If we compare the educational attainment levels for European refugees across
entry gates we can see that refugees from Europe were as well educated as skilled Canadian
immigrants in general. Refugees from non-European sources were the least educated of all
immigrant classes: 80 percent had no more than a secondary level of education.
13 The reported percentages for greater than post-secondary educational levels for Africa (28%), Asia (23%) and South and Central America (25%) were all about half the European level.
11
25.5%
74.5%
51.6%
48.4%
69.6%
30.4%
43.1%
56.9%
47.1%
52.9%
67.8%
32.2%
0%
20%
40%
60%
80%
100%
Refugee Family Skilled Refugee Family Skilled
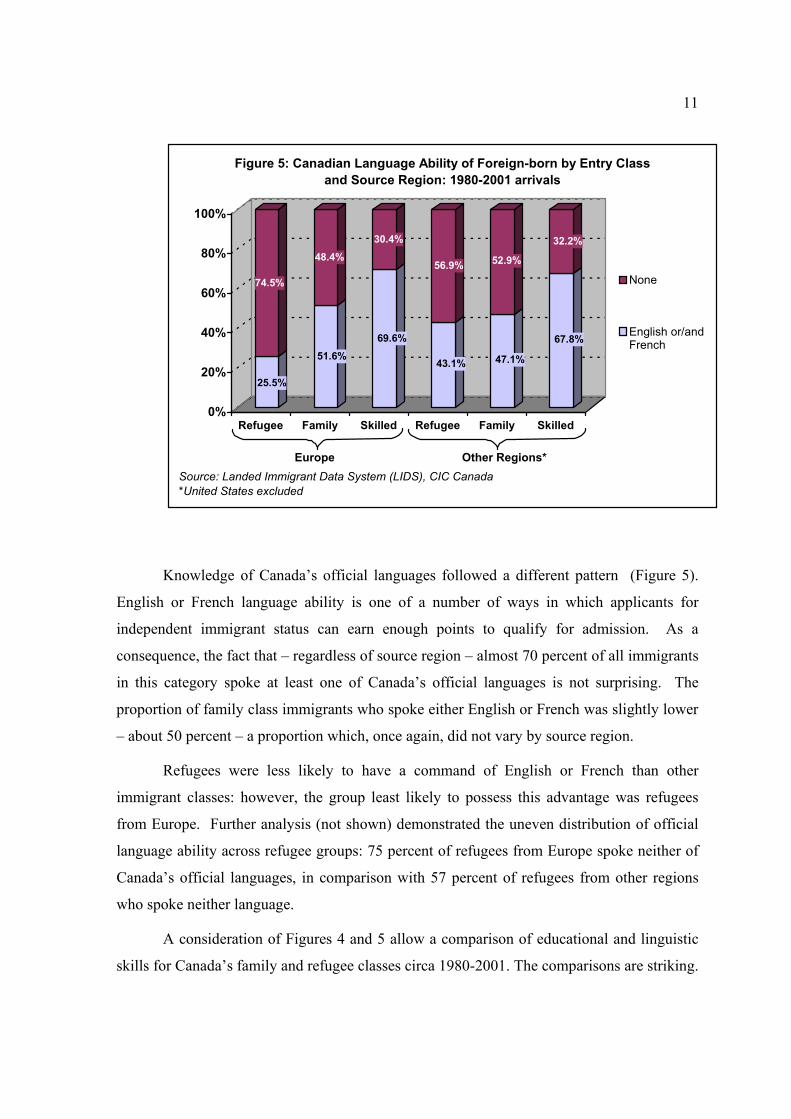
Figure 5: Canadian Language Ability of Foreign-born by Entry Class and Source Region: 1980-2001 arrivals
None
English or/andFrench
Europe Other Regions*Source: Landed Immigrant Data System (LIDS), CIC Canada*United States excluded
Knowledge of Canada’s official languages followed a different pattern (Figure 5).
English or French language ability is one of a number of ways in which applicants for
independent immigrant status can earn enough points to qualify for admission. As a
consequence, the fact that – regardless of source region – almost 70 percent of all immigrants
in this category spoke at least one of Canada’s official languages is not surprising. The
proportion of family class immigrants who spoke either English or French was slightly lower
– about 50 percent – a proportion which, once again, did not vary by source region.
Refugees were less likely to have a command of English or French than other
immigrant classes: however, the group least likely to possess this advantage was refugees
from Europe. Further analysis (not shown) demonstrated the uneven distribution of official
language ability across refugee groups: 75 percent of refugees from Europe spoke neither of
Canada’s official languages, in comparison with 57 percent of refugees from other regions
who spoke neither language.
A consideration of Figures 4 and 5 allow a comparison of educational and linguistic
skills for Canada’s family and refugee classes circa 1980-2001. The comparisons are striking.
12
European refugees were more highly educated than either independent or family class
immigrants from this region, but were more likely to be linguistic disadvantaged. For non-
European family class members the educational attainments and linguistic skills are near
identical to non-European refugee attainments. In sum, European refugees are a unique group
in terms of higher educational levels and less linguistic skills. These differential human
capital endowments of education and language should affect refugee economic performance,
which we will document below.
IV. Refugee Economic Outcomes - Economic Outcomes: Entry Cohorts and Immigrant Admission Categories
The IMDB data set allows us to analyze the economic outcome of refugees from
several dimensions. Essentially, the methodology employed here is to identify a class or type
of earnings (e.g. employment income, social assistance) and ask how did the refugee group
who reported this type of earnings fare vis-à-vis other entry categories. We will also expand
this analysis by computing refugee total income, that is we combine the refugee’s target
income (e.g. employment earnings) with all other sources of earnings (self-employed, social
assistance, etc.) reported for the refugee.
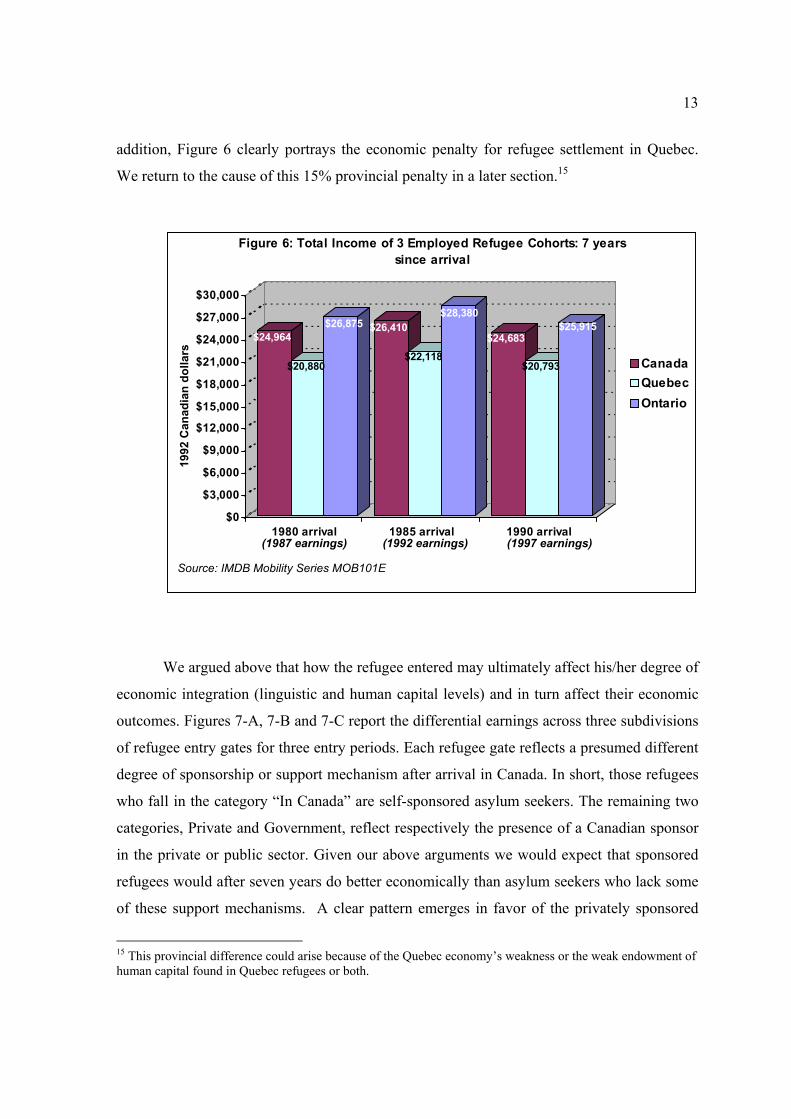
Figure 6 presents an overview of total earned income by all employed refugees seven
years after arrival for three different cohorts based on date of arrival: 1980, 1985 and 1990.14
A further distinction is made to isolate regional differences by specifying the earnings of
refugees in Canada and for the province of Quebec. This figure allows us to detect if there is
an entry or period effects. In other words, has the earned income prospects of refugees
changed between those refugees who entered in the 1980 or 1990s? The answer is no, since
seven years after their respective arrival dates the 1980 and 1990 refugee cohorts reported
near identical earned incomes. A period affect nevertheless appears in 1992 when refugees
for the 1985 cohort earned about $2,000 more (1992 constant dollars) after seven years in
Canada than either the 1980 or 1990 cohorts. Thus, although no long-term decline in refugee
earned income appears after 1980, it was better to have arrived before Canada’s recession. In
14 Figure 6 reports total income from all sources for refugees who reported employment earnings.
13
addition, Figure 6 clearly portrays the economic penalty for refugee settlement in Quebec.
We return to the cause of this 15% provincial penalty in a later section.15
$24,964
$20,880
$26,875 $26,410
$22,118
$28,380
$24,683
$20,793
$25,915
$0
$3,000
$6,000
$9,000
$12,000
$15,000
$18,000
$21,000
$24,000
$27,000
$30,000
1992
Can
adia
n do
llars
1980 arrival 1985 arrival 1990 arrival
Figure 6: Total Income of 3 Employed Refugee Cohorts: 7 years since arrival
CanadaQuebecOntario
(1987 earnings) (1992 earnings) (1997 earnings)
Source: IMDB Mobility Series MOB101E
We argued above that how the refugee entered may ultimately affect his/her degree of
economic integration (linguistic and human capital levels) and in turn affect their economic
outcomes. Figures 7-A, 7-B and 7-C report the differential earnings across three subdivisions
of refugee entry gates for three entry periods. Each refugee gate reflects a presumed different
degree of sponsorship or support mechanism after arrival in Canada. In short, those refugees
who fall in the category “In Canada” are self-sponsored asylum seekers. The remaining two
categories, Private and Government, reflect respectively the presence of a Canadian sponsor
in the private or public sector. Given our above arguments we would expect that sponsored
refugees would after seven years do better economically than asylum seekers who lack some
of these support mechanisms. A clear pattern emerges in favor of the privately sponsored
15 This provincial difference could arise because of the Quebec economy’s weakness or the weak endowment of human capital found in Quebec refugees or both.
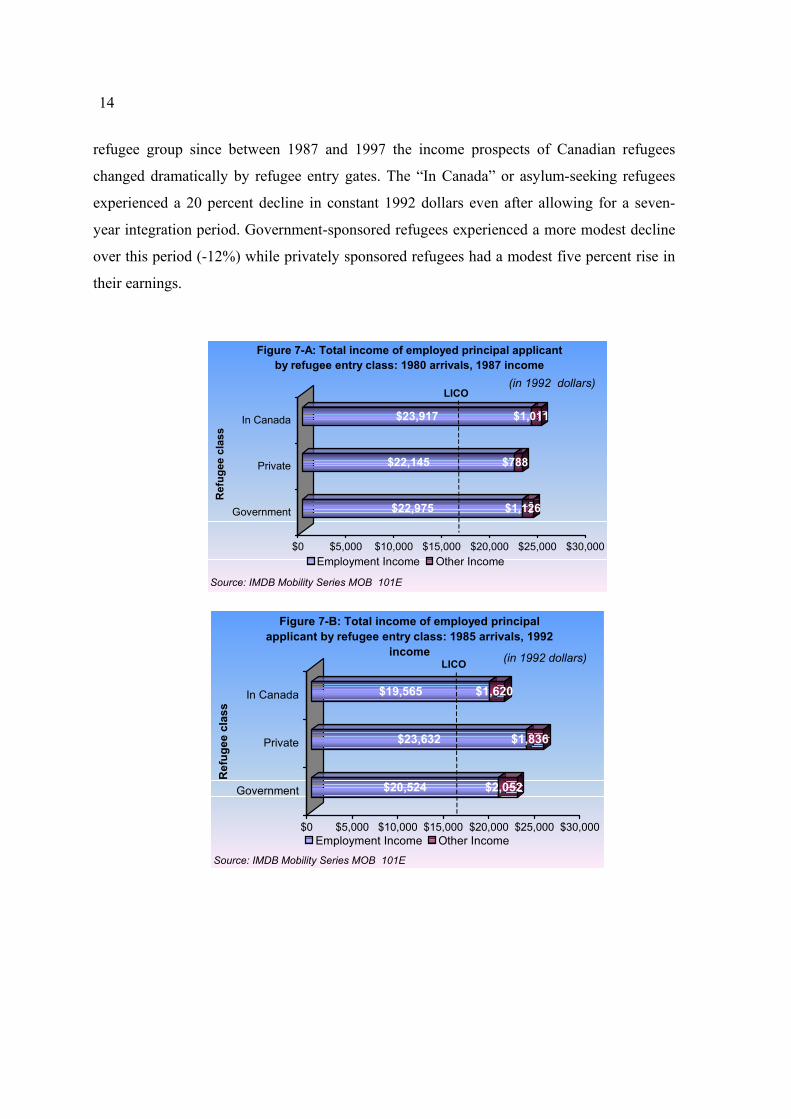
14
refugee group since between 1987 and 1997 the income prospects of Canadian refugees
changed dramatically by refugee entry gates. The “In Canada” or asylum-seeking refugees
experienced a 20 percent decline in constant 1992 dollars even after allowing for a seven-
year integration period. Government-sponsored refugees experienced a more modest decline
over this period (-12%) while privately sponsored refugees had a modest five percent rise in
their earnings.
$22,975 $1,126
$22,145 $788
$23,917 $1,011
$0 $5,000 $10,000 $15,000 $20,000 $25,000 $30,000
Government
Private
In Canada
Ref
ugee
cla
ss
Figure 7-A: Total income of employed principal applicant by refugee entry class: 1980 arrivals, 1987 income
Employment Income Other Income
Source: IMDB Mobility Series MOB 101E
(in 1992 dollars) LICO
$20,524 $2,052
$23,632 $1,836
$19,565 $1,620
$0 $5,000 $10,000 $15,000 $20,000 $25,000 $30,000
Government
Private
In Canada
Ref
ugee
cla
ss
Figure 7-B: Total income of employed principal applicant by refugee entry class: 1985 arrivals, 1992
income
Employment Income Other IncomeSource: IMDB Mobility Series MOB 101E
(in 1992 dollars) LICO
15
$20,172 $944
$23,313 $1,094
$19,143 $996
$0 $5,000 $10,000 $15,000 $20,000 $25,000 $30,000
Government
Private
In Canada R
efug
ee c
lass
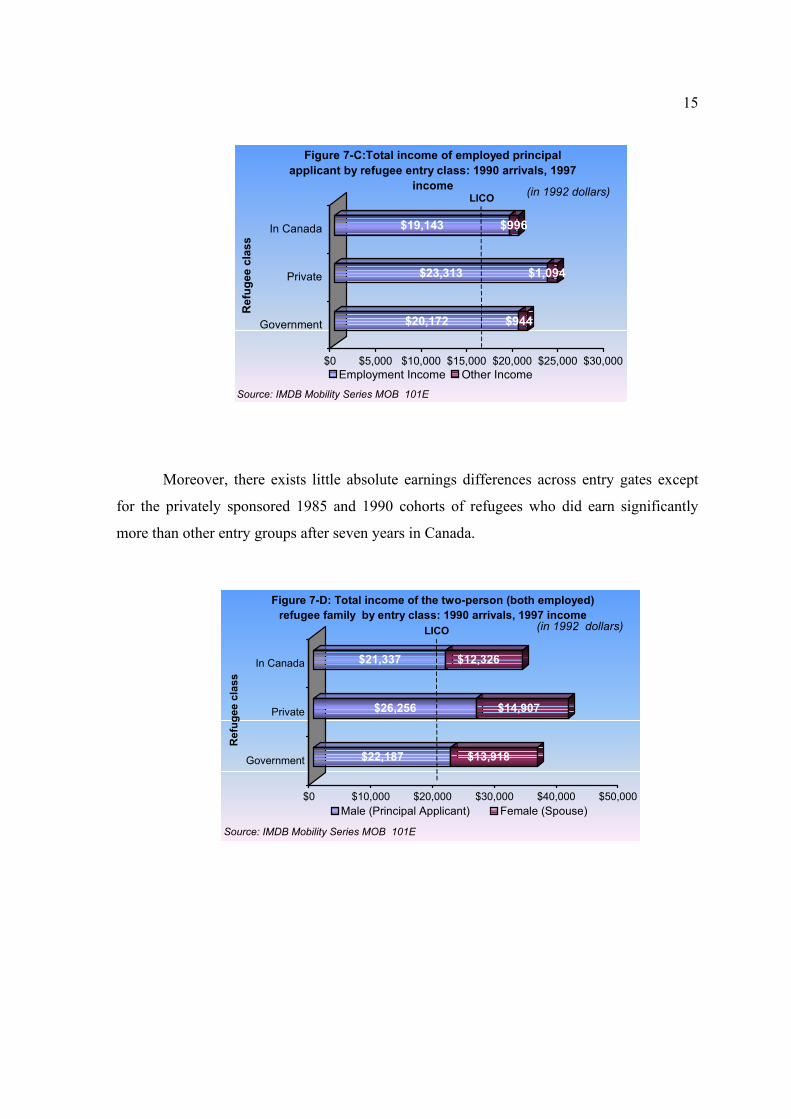
Figure 7-C:Total income of employed principal applicant by refugee entry class: 1990 arrivals, 1997
income
Employment Income Other IncomeSource: IMDB Mobility Series MOB 101E
(in 1992 dollars) LICO
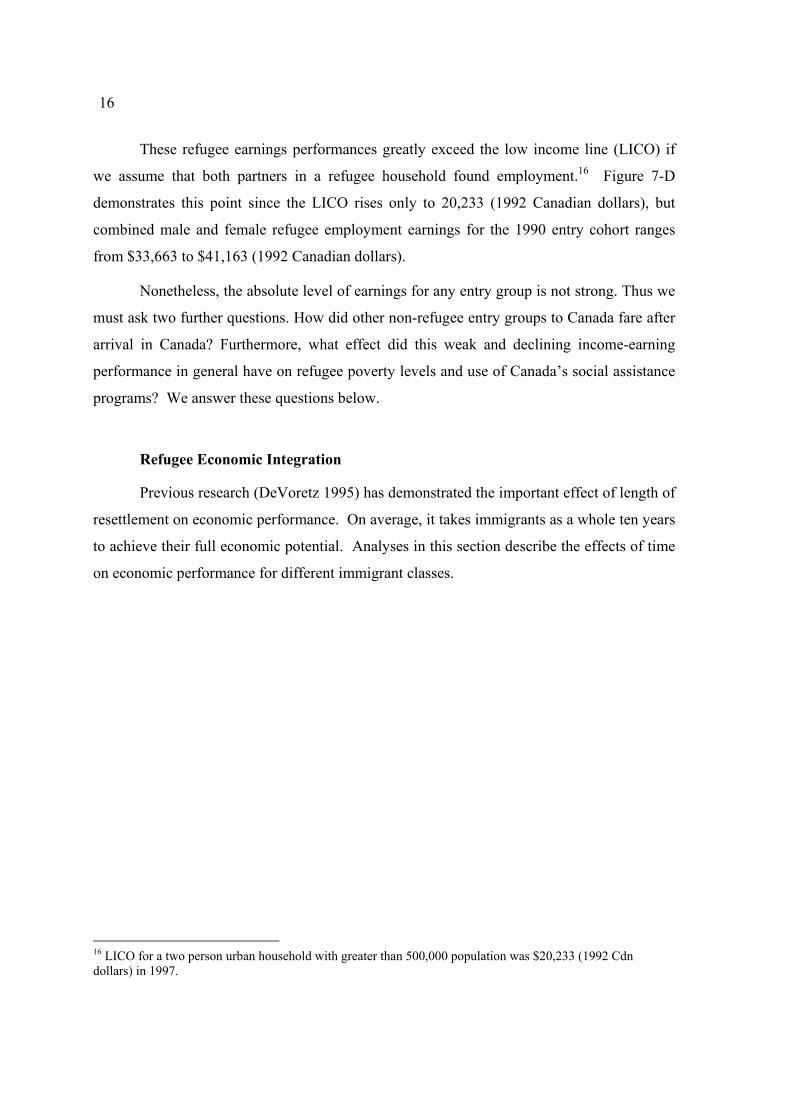
Moreover, there exists little absolute earnings differences across entry gates except
for the privately sponsored 1985 and 1990 cohorts of refugees who did earn significantly
more than other entry groups after seven years in Canada.
$22,187 $13,918
$26,256 $14,907
$21,337 $12,326
$0 $10,000 $20,000 $30,000 $40,000 $50,000
Government
Private
In Canada
Ref
ugee
cla
ss
Figure 7-D: Total income of the two-person (both employed) refugee family by entry class: 1990 arrivals, 1997 income
Male (Principal Applicant) Female (Spouse)
Source: IMDB Mobility Series MOB 101E
(in 1992 dollars) LICO
16
These refugee earnings performances greatly exceed the low income line (LICO) if
we assume that both partners in a refugee household found employment.16 Figure 7-D
demonstrates this point since the LICO rises only to 20,233 (1992 Canadian dollars), but
combined male and female refugee employment earnings for the 1990 entry cohort ranges
from $33,663 to $41,163 (1992 Canadian dollars).
Nonetheless, the absolute level of earnings for any entry group is not strong. Thus we
must ask two further questions. How did other non-refugee entry groups to Canada fare after
arrival in Canada? Furthermore, what effect did this weak and declining income-earning
performance in general have on refugee poverty levels and use of Canada’s social assistance
programs? We answer these questions below.
Refugee Economic Integration
Previous research (DeVoretz 1995) has demonstrated the important effect of length of
resettlement on economic performance. On average, it takes immigrants as a whole ten years
to achieve their full economic potential. Analyses in this section describe the effects of time
on economic performance for different immigrant classes.
16 LICO for a two person urban household with greater than 500,000 population was $20,233 (1992 Cdn dollars) in 1997.
17
Figure 8-A: Assimilation Profiles for 1980 Family Class, Skilled and Refugee Cohorts: Employment Earnings
$0$5,000
$10,000$15,000
$20,000$25,000$30,000
$35,000$40,000
$45,000$50,000
0 3 6 9 12 15 18Years since arrival
1992
Can
adia
n do
llars
Refugees
FamilyClassSkilledWorkers
Source: IMDB Mobility Series MOB 101E
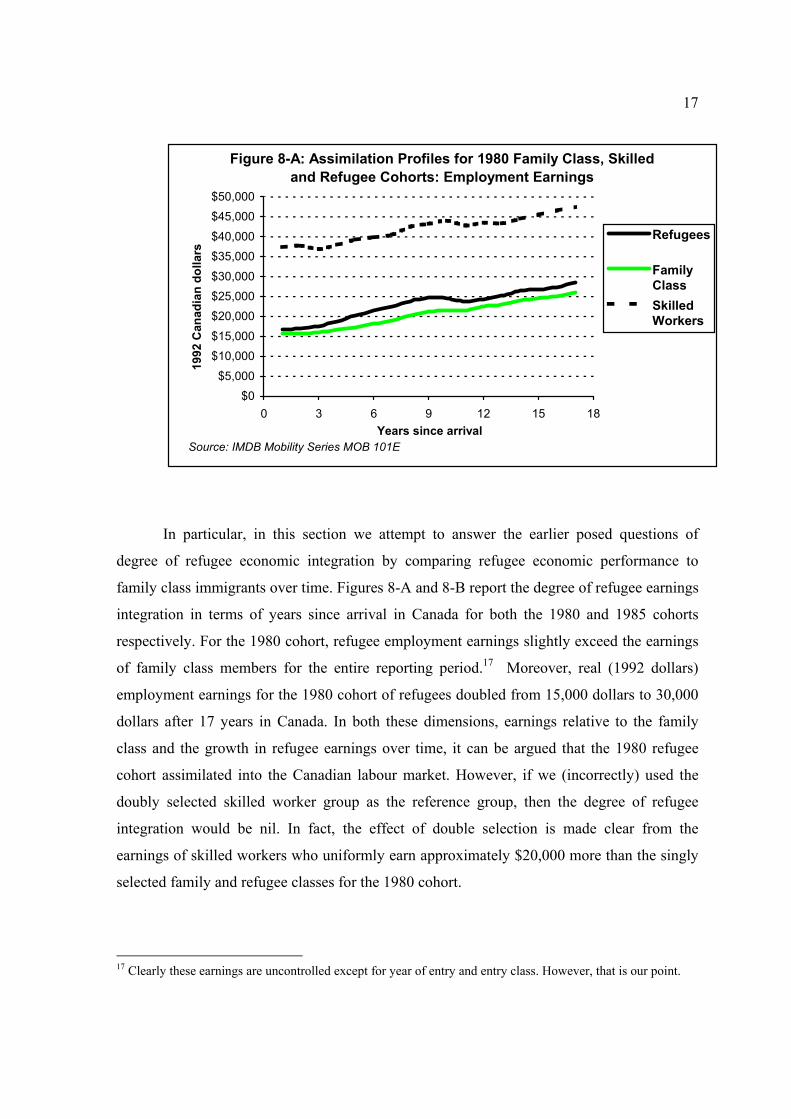
In particular, in this section we attempt to answer the earlier posed questions of
degree of refugee economic integration by comparing refugee economic performance to
family class immigrants over time. Figures 8-A and 8-B report the degree of refugee earnings
integration in terms of years since arrival in Canada for both the 1980 and 1985 cohorts
respectively. For the 1980 cohort, refugee employment earnings slightly exceed the earnings
of family class members for the entire reporting period.17 Moreover, real (1992 dollars)
employment earnings for the 1980 cohort of refugees doubled from 15,000 dollars to 30,000
dollars after 17 years in Canada. In both these dimensions, earnings relative to the family
class and the growth in refugee earnings over time, it can be argued that the 1980 refugee
cohort assimilated into the Canadian labour market. However, if we (incorrectly) used the
doubly selected skilled worker group as the reference group, then the degree of refugee
integration would be nil. In fact, the effect of double selection is made clear from the
earnings of skilled workers who uniformly earn approximately $20,000 more than the singly
selected family and refugee classes for the 1980 cohort.
17 Clearly these earnings are uncontrolled except for year of entry and entry class. However, that is our point.
18
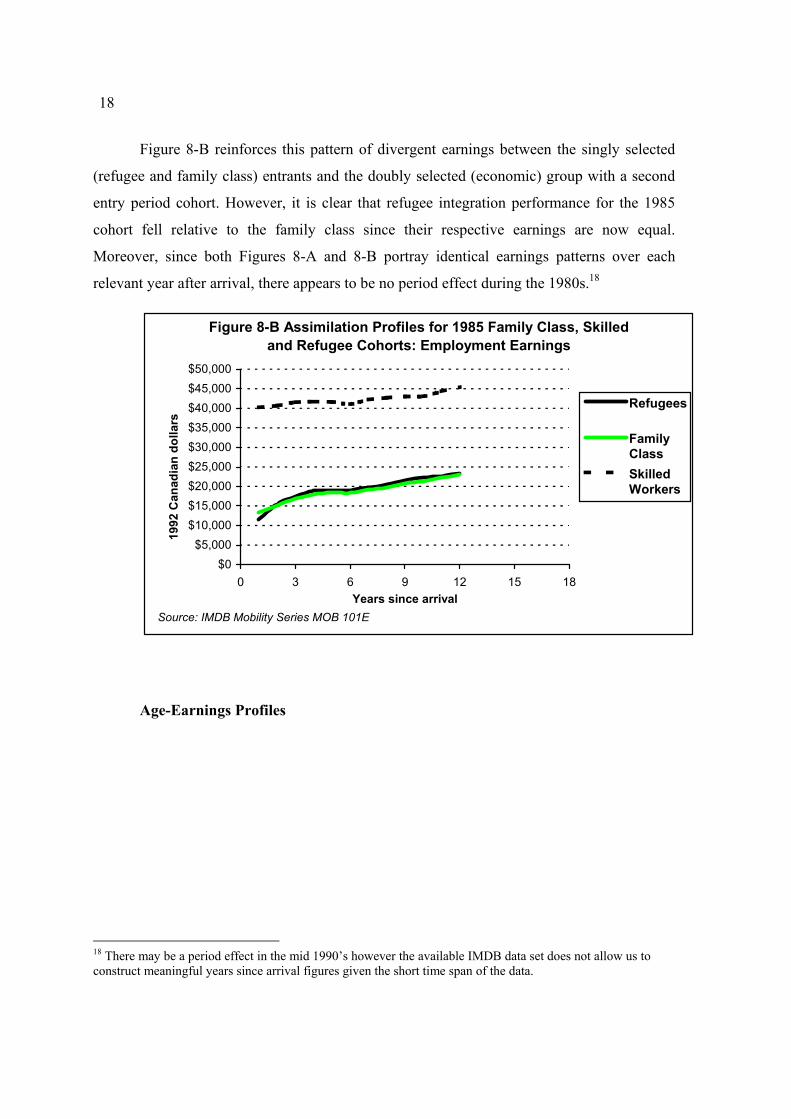
Figure 8-B reinforces this pattern of divergent earnings between the singly selected
(refugee and family class) entrants and the doubly selected (economic) group with a second
entry period cohort. However, it is clear that refugee integration performance for the 1985
cohort fell relative to the family class since their respective earnings are now equal.
Moreover, since both Figures 8-A and 8-B portray identical earnings patterns over each
relevant year after arrival, there appears to be no period effect during the 1980s.18
Figure 8-B Assimilation Profiles for 1985 Family Class, Skilled and Refugee Cohorts: Employment Earnings
$0$5,000
$10,000$15,000$20,000$25,000$30,000$35,000$40,000$45,000$50,000
0 3 6 9 12 15 18Years since arrival
1992
Can
adia
n do
llars
Refugees
FamilyClassSkilledWorkers
Source: IMDB Mobility Series MOB 101E
Age-Earnings Profiles
18 There may be a period effect in the mid 1990’s however the available IMDB data set does not allow us to construct meaningful years since arrival figures given the short time span of the data.
19
Figure 9: Family Class and Refugee Employment Earnings in 1992 by Age Group (1980 arrivals)
$0
$5,000
$10,000
$15,000
$20,000
$25,000
$30,000
15-24 25-34 35-49 50-64 65+Age group
1992
Can
adia
n do
llars
Family
Refugees
Source: IMDB Mobility Series MOB 101E
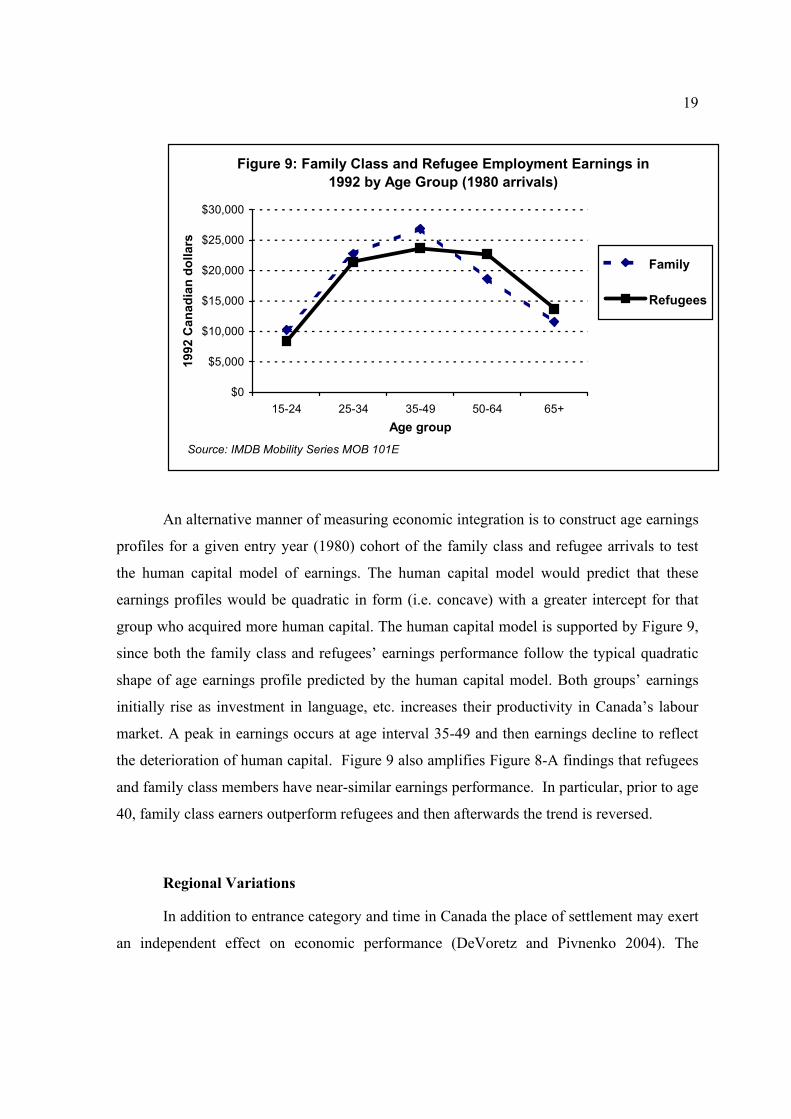
An alternative manner of measuring economic integration is to construct age earnings
profiles for a given entry year (1980) cohort of the family class and refugee arrivals to test
the human capital model of earnings. The human capital model would predict that these
earnings profiles would be quadratic in form (i.e. concave) with a greater intercept for that
group who acquired more human capital. The human capital model is supported by Figure 9,
since both the family class and refugees’ earnings performance follow the typical quadratic
shape of age earnings profile predicted by the human capital model. Both groups’ earnings
initially rise as investment in language, etc. increases their productivity in Canada’s labour
market. A peak in earnings occurs at age interval 35-49 and then earnings decline to reflect
the deterioration of human capital. Figure 9 also amplifies Figure 8-A findings that refugees
and family class members have near-similar earnings performance. In particular, prior to age
40, family class earners outperform refugees and then afterwards the trend is reversed.
Regional Variations
In addition to entrance category and time in Canada the place of settlement may exert
an independent effect on economic performance (DeVoretz and Pivnenko 2004). The
20
underlying proposition in this section is that either due to differential selection criteria or a
weak economy (or both) Quebec-bound refugees would have a weaker performance. Also, it
should be noted that to extent the Quebec-bound refugees are francophone they will have
limited outmigration possibilities after arrival.19 All of these forces should contribute to
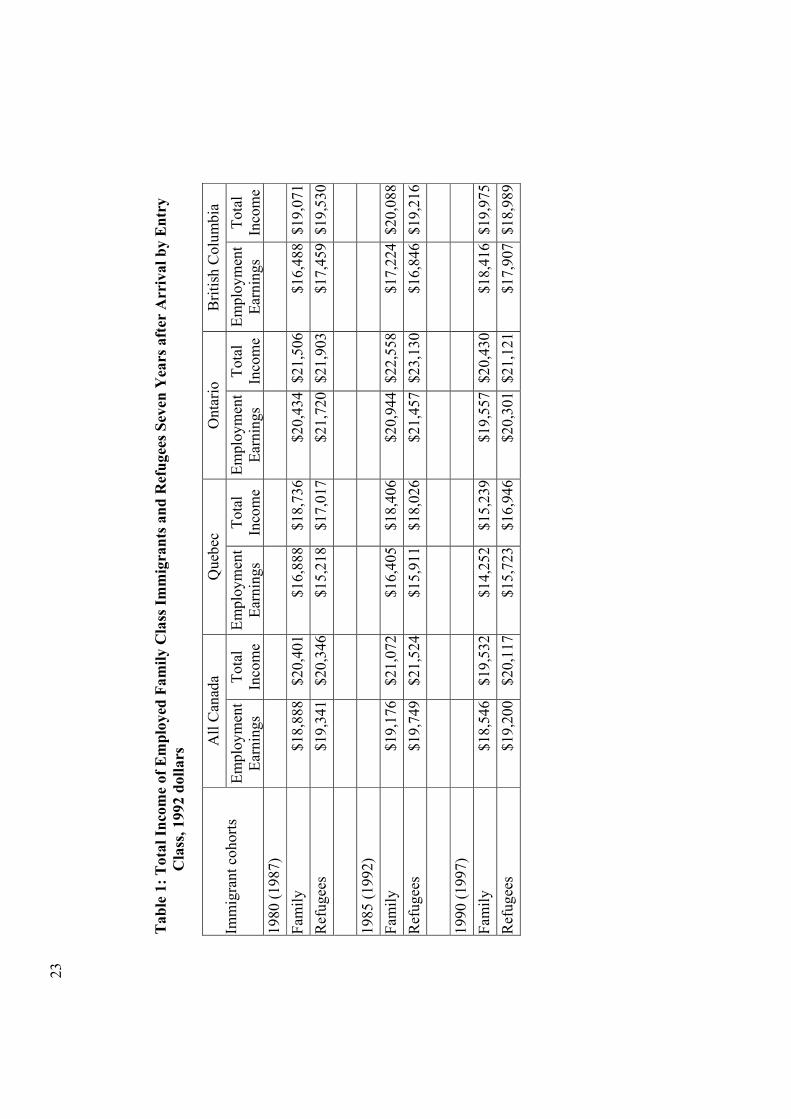
differential regional refugee earnings. Table 1 presents two measures of earnings
(employment earnings and total income) across the three provinces for employed refugees
and family class entrants over time.
19 See DeVoretz, Pivnenko and Coulombe (2003) for a more complete description of immigrant and refugee economic performance in Quebec.
23
T
able
1: T
otal
Inco
me
of E
mpl
oyed
Fam
ily C
lass
Imm
igra
nts a
nd R
efug
ees S
even
Yea
rs a
fter
Arr
ival
by
Ent
ry
Cla
ss, 1
992
dolla
rs A
ll C
anad
a Q
uebe
c O
ntar
io
Brit
ish
Col
umbi
a Im
mig
rant
coh
orts
Em
ploy
men
tEa
rnin
gs
Tota
l In
com
e Em
ploy
men
tEa
rnin
gs
Tota
l In
com
e Em
ploy
men
tEa
rnin
gs
Tota
l In
com
eEm
ploy
men
tEa
rnin
gs
Tota
l In
com
e19
80 (1
987)
Fa
mily
$1
8,88
8$2
0,40
1$1
6,88
8$1
8,73
6 $2
0,43
4$2
1,50
6$1
6,48
8$1
9,07
1R
efug
ees
$19,
341
$20,
346
$15,
218
$17,
017
$21,
720
$21,
903
$17,
459
$19,
530
1985
(199
2)
Fa
mily
$1
9,17
6$2
1,07
2$1
6,40
5$1
8,40
6 $2
0,94
4$2
2,55
8$1
7,22
4$2
0,08
8R
efug
ees
$19,
749
$21,
524
$15,
911
$18,
026
$21,
457
$23,
130
$16,
846
$19,
216
1990
(199
7)
Fa
mily
$1
8,54
6$1
9,53
2$1
4,25
2$1
5,23
9 $1
9,55
7$2
0,43
0$1
8,41
6$1
9,97
5R
efug
ees
$19,
200
$20,
117
$15,
723
$16,
946
$20,
301
$21,
121
$17,
907
$18,
989
24
Ontario clearly offers superior income prospects for either refugees or family class
entrants. The 1980 refugee cohort which lived in Ontario in 1987 earned 35% (15%) more in
earnings than the 1980 refugee cohort resident in Quebec (British Columbia) in 1987 (Table
3 row 1). By 1997 the relative advantage of refugees living in Ontario versus Quebec and
British Columbia slightly declined. Family class immigrants, our reference group,
experienced a similar disparity in earning outcomes across provinces. However, contrary to
the refugee experience these interprovincial income disparities grew between 1987 and 1997.
In sum, after seven years in Canada earnings differentials persisted by province of residence
for both refugees and the family class immigrants.
V. Refugee use of Canada’s Social Safety Net
Earnings constitute an important measure of economic integration. To balance this
measure, however, it is important to know to what extent refugees use Canada’s social safety
net. How do the successive refugee co-horts of 1980, 1985 and 1990 fare with respect to
poverty levels? Canada has a relative poverty index or Low Income Cutoff (LICO) criterion
which reports income levels for families or unattached individuals who spend 20% or more
than the average on food, shelter and clothing. There are many experiments which we could
perform to test if refugees receive a total income greater than LICO. In this case we choose a
LICO based on single-family refugee household with one principal refugee applicant who
was already employed.20 It is apparent from Figure 7-A that after seven years in Canada the
1980 refugee cohort, regardless of selection gate, earned on average a total income in excess
of LICO. Subsequent cohorts in 1992 and 1997 also exceeded the poverty levels if they had
reported earned income. What these diagrams indicate is that on average, refugees were not
members of the working poor. However, this does not mean that those refugees who did not
report employment earnings or belonged to a multiple-member household were not poor. We
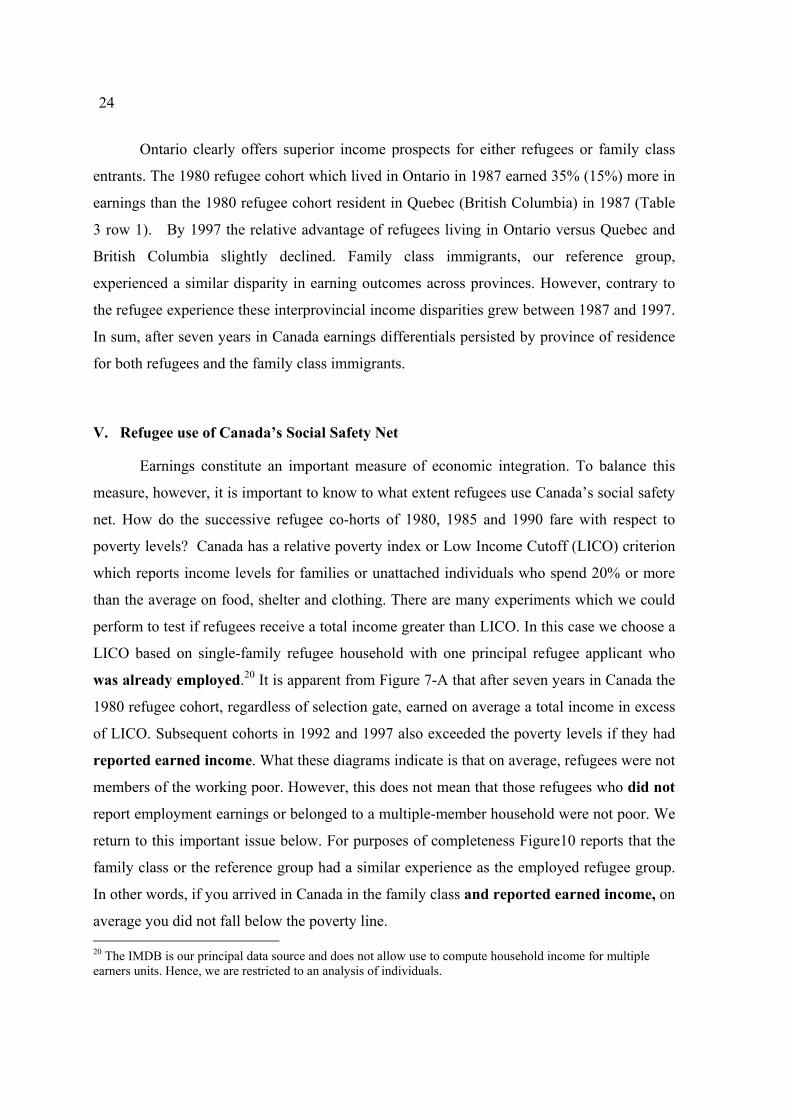
return to this important issue below. For purposes of completeness Figure10 reports that the
family class or the reference group had a similar experience as the employed refugee group.
In other words, if you arrived in Canada in the family class and reported earned income, on
average you did not fall below the poverty line. 20 The IMDB is our principal data source and does not allow use to compute household income for multiple earners units. Hence, we are restricted to an analysis of individuals.
25
$18,546 $987
$19,176 $1,897
$18,888 $1,513
$0 $5,000 $10,000 $15,000 $20,000 $25,000 $30,000
1997 (1990 arrival)
1992 (1985 arrival)
1987 (1980 arrival)
Year
Figure 10: Total income of employed family class immigrants: 7 years after arrival
Employment Income Other Income
Source: IMDB Mobility Series MOB 101E
(in 1992 dollars) LICO
The concept of total income used in this analysis includes both earned income and
government transfers for only those refugees who reported at least some earned income.21
This masks the true extent of refugee poverty in Canada. The analytical concept must be
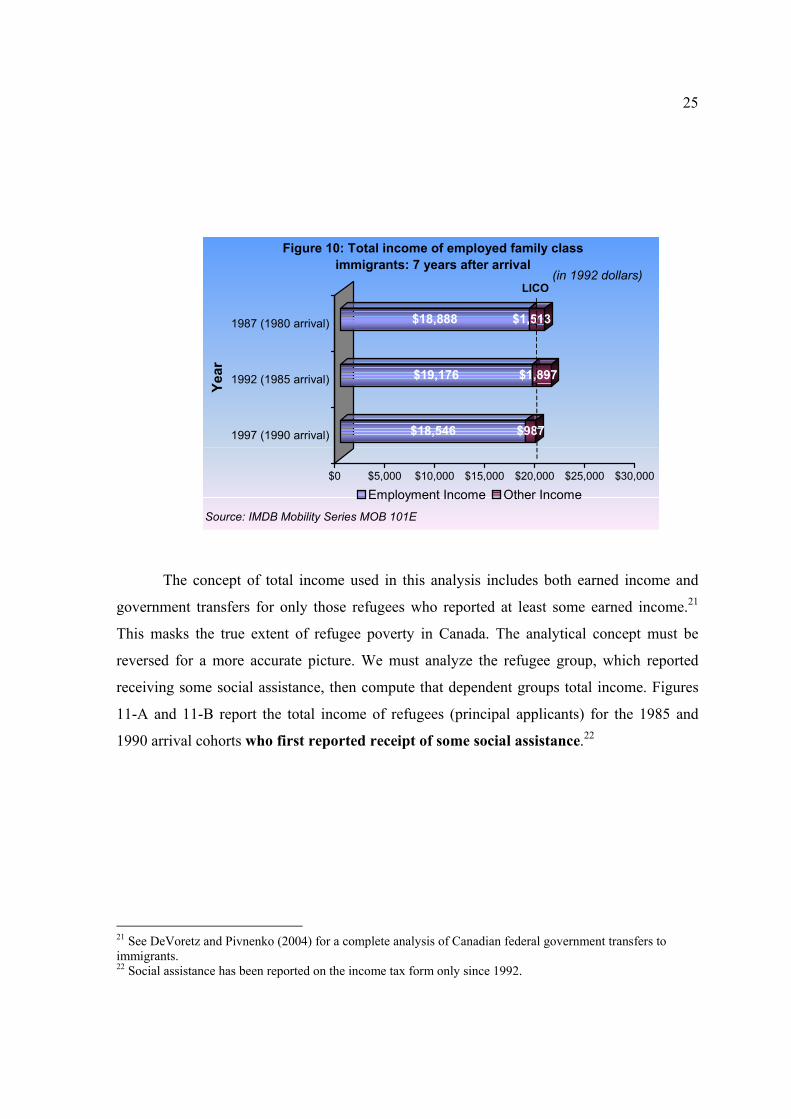
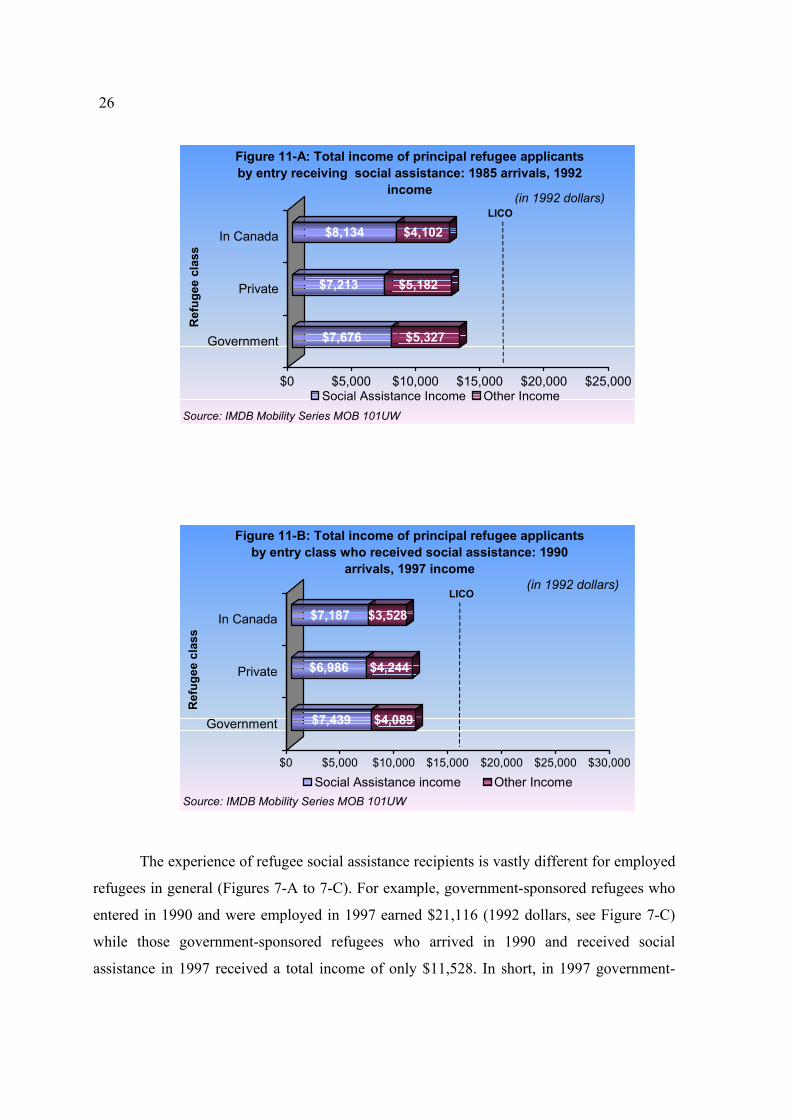
reversed for a more accurate picture. We must analyze the refugee group, which reported
receiving some social assistance, then compute that dependent groups total income. Figures
11-A and 11-B report the total income of refugees (principal applicants) for the 1985 and
1990 arrival cohorts who first reported receipt of some social assistance.22
21 See DeVoretz and Pivnenko (2004) for a complete analysis of Canadian federal government transfers to immigrants. 22 Social assistance has been reported on the income tax form only since 1992.
26
$7,676 $5,327
$7,213 $5,182
$8,134 $4,102
$0 $5,000 $10,000 $15,000 $20,000 $25,000
Government
Private
In Canada
Ref
ugee
cla
ss
Figure 11-A: Total income of principal refugee applicants by entry receiving social assistance: 1985 arrivals, 1992
income
Social Assistance Income Other IncomeSource: IMDB Mobility Series MOB 101UW
(in 1992 dollars) LICO
$7,439 $4,089
$6,986 $4,244
$7,187 $3,528
$0 $5,000 $10,000 $15,000 $20,000 $25,000 $30,000
Government
Private
In Canada
Ref
ugee
cla
ss
Figure 11-B: Total income of principal refugee applicants by entry class who received social assistance: 1990
arrivals, 1997 income
Social Assistance income Other IncomeSource: IMDB Mobility Series MOB 101UW
(in 1992 dollars) LICO
The experience of refugee social assistance recipients is vastly different for employed
refugees in general (Figures 7-A to 7-C). For example, government-sponsored refugees who
entered in 1990 and were employed in 1997 earned $21,116 (1992 dollars, see Figure 7-C)
while those government-sponsored refugees who arrived in 1990 and received social
assistance in 1997 received a total income of only $11,528. In short, in 1997 government-
27
sponsored refugees who received some social assistance had a total income level that was
only 70% of the LICO level. An additional disturbing finding embedded in Figures 11-A and
11-B is that both earned income and social assistance declined in real terms across the co-
horts between 1992 and 1997. In short, long-term refugee poverty (after seven years in
Canada) worsened in the 1990s. Given these vastly different economic outcomes among all
refugees on those who received some social assistance we now analyze the incidence of
social assistance by refugee cohorts or entry gates.
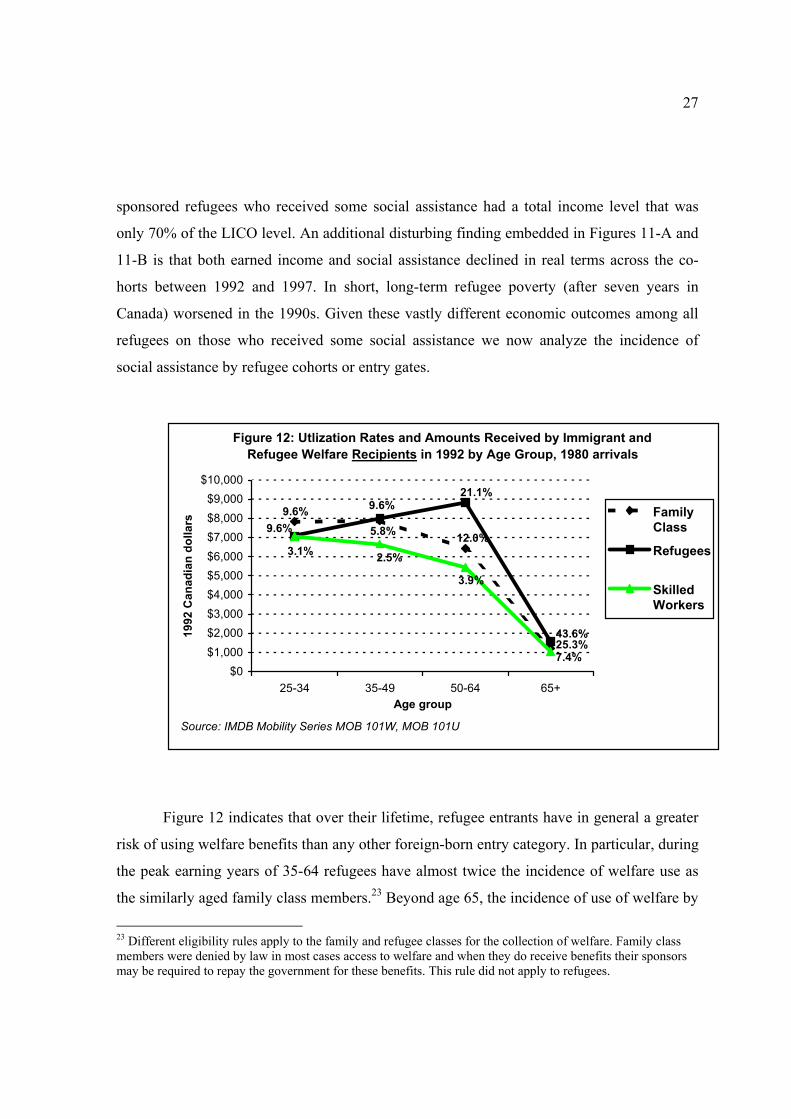
Figure 12: Utlization Rates and Amounts Received by Immigrant and Refugee Welfare Recipients in 1992 by Age Group, 1980 arrivals
9.6%5.8% 12.0%
25.3%
9.6%
9.6%21.1%
43.6%
3.1% 2.5%
3.9%
7.4%$0
$1,000$2,000$3,000$4,000$5,000$6,000$7,000$8,000$9,000
$10,000
25-34 35-49 50-64 65+Age group
1992
Can
adia
n do
llars
FamilyClass
Refugees
SkilledWorkers
Source: IMDB Mobility Series MOB 101W, MOB 101U
Figure 12 indicates that over their lifetime, refugee entrants have in general a greater
risk of using welfare benefits than any other foreign-born entry category. In particular, during
the peak earning years of 35-64 refugees have almost twice the incidence of welfare use as
the similarly aged family class members.23 Beyond age 65, the incidence of use of welfare by
23 Different eligibility rules apply to the family and refugee classes for the collection of welfare. Family class members were denied by law in most cases access to welfare and when they do receive benefits their sponsors may be required to repay the government for these benefits. This rule did not apply to refugees.
28
refugee claimants who arrived in 1980 rose to about 44% of that age group still resident in
Canada in 1992.
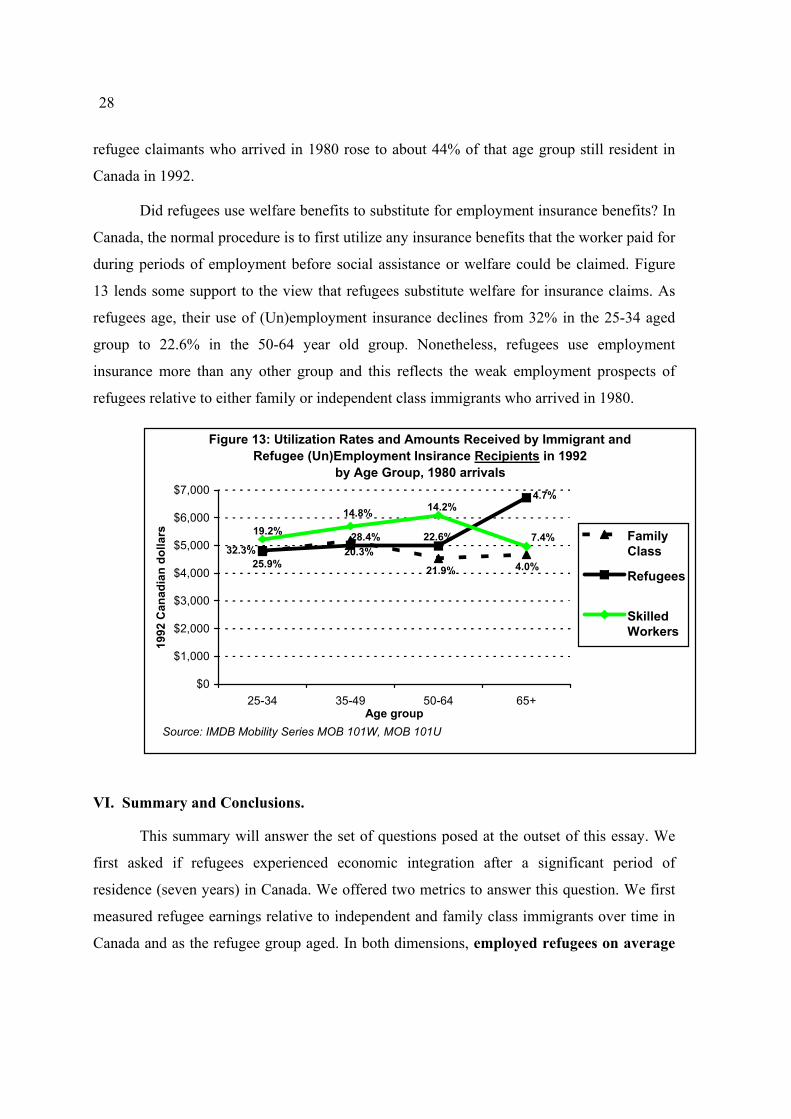
Did refugees use welfare benefits to substitute for employment insurance benefits? In
Canada, the normal procedure is to first utilize any insurance benefits that the worker paid for
during periods of employment before social assistance or welfare could be claimed. Figure
13 lends some support to the view that refugees substitute welfare for insurance claims. As
refugees age, their use of (Un)employment insurance declines from 32% in the 25-34 aged
group to 22.6% in the 50-64 year old group. Nonetheless, refugees use employment
insurance more than any other group and this reflects the weak employment prospects of
refugees relative to either family or independent class immigrants who arrived in 1980.
Figure 13: Utilization Rates and Amounts Received by Immigrant and Refugee (Un)Employment Insirance Recipients in 1992
by Age Group, 1980 arrivals
25.9%20.3%
21.9% 4.0%32.3%
28.4% 22.6%
4.7%
19.2%14.8% 14.2%
7.4%
$0
$1,000
$2,000
$3,000
$4,000
$5,000
$6,000
$7,000
25-34 35-49 50-64 65+Age group
1992
Can
adia
n do
llars Family
Class
Refugees
SkilledWorkers
Source: IMDB Mobility Series MOB 101W, MOB 101U
VI. Summary and Conclusions.
This summary will answer the set of questions posed at the outset of this essay. We
first asked if refugees experienced economic integration after a significant period of
residence (seven years) in Canada. We offered two metrics to answer this question. We first
measured refugee earnings relative to independent and family class immigrants over time in
Canada and as the refugee group aged. In both dimensions, employed refugees on average
29
have integrated into the Canadian economy. First, with respect to their reference group
(family class) employed refugees earn an equal amount of income both at their time of
arrival and in each successive year of residence.
We next asked if this performance varied by refugee date of arrival or across
particular refugee entry gates. Evidence appears that refugees have been affected sometimes
positively by their date of arrival during the 1980-1997 study period since the 1985 arrival
group earned the highest income after seven years in Canada. There is some evidence that
privately sponsored refugee earnings exceed other refugee groups over the study period. This
may be because private sponsors have more time or motivation than the regular social system
to help refugees find first jobs or help marginal people with their qualifications. Next, our
major proposition that Canadian refugees follow a human capital model of earnings
performance is supported by the available evidence.
Finally, even given this relatively strong economic performance of the average
employed refugee, economic poverty was an endemic and growing problem for refugees. For
those refugees who received social assistance, their total income level was extremely low or
less than $12,000 (1992 dollars) per refugee. This weak performance occurred seven years
after their arrival! Thus, whether a refugee fared well in Canada’s labour market ultimately
depended upon employment prospects. Evidence from Canada’s IMDB records for the study
period indicates that only 52 percent of those refugees aged 20 to 64 found employment.
Thus, the refugee population’s earnings performance is truly bi-modal.
Economic outcome is probably dependent not only on human capital, but on
opportunity. The regional differences in refugee economic integration suggest that local job
market conditions affect refugees’ chances of successful integration, regardless of human
capital characteristics. Given the fact that federal policy is shifting to encourage provincial
jurisdictions more autonomy in matters of refugee resettlement, further in-depth study of
local conditions that promote or hamper economic integration should be a matter of high
priority.
30
Refugees are not, and should not be selected on the basis of their potential
contribution to the Canadian economy. The data in this report demonstrate that, despite this
fact, refugees do not constitute a major drain on the economy. Although their economic
performance is not as impressive as that of independent immigrants, for whom human capital
is the selection criterion, it is generally robust. However, although the economy may not be
suffering, refugees – particularly the most recent arrivals – apparently are. Lower average
wage earnings are consigning ever-greater proportions of refugees to the poverty ranks of
Canadian society. This is a serious problem that calls for investigation of factors such as lack
of recognition of credentials, and discrimination, which militate against finding jobs on the
one hand, and job training programs and perhaps private sponsorship on the other, which
may facilitate the integration process.
31
References
Beiser, M. & Hou, F. 2000. Gender Differences in Language Acquisition and Employment Consequences among Southeast Asian Refugees in Canada. Canadian Public Policy 26 (3): 311-330.
Citizenship and Immigration Canada. 1998. The Economic Performance of Immigrants: Immigration Category Perspective. IMDB Profile Series.
Cortes, K. E. 2001. Are Refugees Different from Economic Immigrants? Some Empirical Evidence on the Heterogeneity of Immigrant Groups in the United States. Center for Labor Economics, University of California at Berkeley. Working Paper No 41.
DeSilva, A. 1997. Earnings of Immigrant Classes in the Early 1980s in Canada: A Reexamination. Canadian Public Policy 23 (2): 179-202.
DeVoretz, D. J., ed. 1995. Diminishing Returns: The Economics of Canada’s Recent Immigration Policy. Toronto: C.D. Howe Institute; and Vancouver: The Laurier Institution.
DeVoretz, D. & Pivnenko. S. 2004. Immigrant Public Finance Transfers: A Comparative Analysis by City. Canadian Journal of Urban Research, in press.
DeVoretz, D., Pivnenko, S. & Coulombe, D.S. 2003. The Immigration Triangle: Quebec, Canada and the Rest of the World. RIIM Working Paper No. 03-11. Vancouver: Simon Fraser University, Centre of Excellence, Immigration.
Shi, Y. 2003. The Impact of Canada’s Immigration Act on Chinese Independent Immigration. RIIM Working Paper No. 03-07. Vancouver: Simon Fraser University, Centre of Excellence, Immigration.