Embed Size (px)
Citation preview
Carlos Pestana Barros & Nicolas Peypoch
A Comparative Analysis of Productivity Change in Italian and
Portuguese Airports
WP 006/2007/DE
_________________________________________________________
Amélia Branco & João Carlos Lopes
The Economic Performance of Clustered and Non
Clustered Firms along the different Phases of the Cluster
Life Cycle: The Portuguese Cork Industry Case
WP 26/2013/DE/UECE/GHES
_________________________________________________________
Department of Economics
WORKING PAPERS
ISSN Nº 0874-4548
School of Economics & Management
University of Lisbon
The Economic Performance of Clustered and Non Clustered Firms along
the different Phases of the Cluster Life Cycle: The Portuguese Cork
Industry Case
Amélia Branco 1 and João Carlos Lopes 2
1 ISEG - School of Economics and Management, Lisboa University and GHES – Group of
Social and Economic History, Lisbon, Portugal
2 ISEG - School of Economics and Management, Lisboa University and UECE - Research
Unit on Complexity and Economics, Lisbon, Portugal
November, 2013
ABSTRACT
This paper is about the relative economic performance of clustered and non-clustered
companies in the different phases of the cluster life cycle. It starts with the explanation of a
puzzling localization behaviour, namely that most of the Portuguese cork manufacturing firms
are concentrated in Santa Maria da Feira, a small county in the north of the country, whereas
the bulk of the cork is produced in the south (Alentejo and Ribatejo). The historical roots and
past and path dependence of the trajectory of this cluster are examined, as well as the
identification of its life cycle phases. A comparative analysis of the economic performance of
firms localized in Santa Maria da Feira and in other regions of the country is then made, using
labour productivity data for a long time span of several decades. This exercise is a quantitative
illustration of the crucial importance of history for the understanding of cluster dynamics, as
well as many other (evolutionary) economic phenomena.
Keywords: Cork Industry, Cluster Life Cycle, Santa Maria da Feira, Portugal.
JEL codes: R12; L73; N60; O14
1
1. Introduction
This paper is about the relative economic performance of clustered and non-clustered
companies in the different phases of the cluster life cycle. According to the relevant literature
on the subject, clusters tend to follow a predictable path in time, from emergence to the
development phase, followed by maturity and eventual decline or renewal.
As clusters can be an important determinant of the economic evolution of the regions where
they are located, the identification and understanding of the different phases of a cluster life
cycle are crucial to regional policy. In this sense, to obtain a better knowledge of the economic
dynamics of regions and the strengths and weaknesses that they have in the complex process of
the location of industrial production activities in the globalization era of our times.
In this study, an empirical application is tentatively made of the Portuguese cork industry and
its well established cluster at Santa Maria da Feira. This is an important sector in Portugal and
is in fact the only one where Portugal has world leadership, both in production and international
trade, as well as in the research, technological and innovation domains. It is also an interesting
case study given that the environmental and rural development advantages of this industry are
very important in some rural areas of the country, as cork is a renewable raw material that is
removed from (without destructing) a forest tree (cork oak).
First of all, the main facts and trends of this industry are briefly discussed, and an explanation
is given for a puzzling location behaviour, namely that most of the Portuguese cork
manufacturing firms are concentrated in Santa Maria da Feira, a small county in the north of
the country, whereas the bulk of cork is produced in the south, in the Alentejo and Ribatejo
districts. The main historical reason explaining this puzzle is connected with the dominant
position in that region of an anchor firm - Amorim & Irmãos – which created a hub and spoke
format for this cluster, although some elements of a Marshallian industrial district are also
evident in Santa Maria da Feira where there are a large number of small firms with a
predominance of a traditional (family-owned) cork industry.
After this brief panoramic view of the cork industry in Portugal, the historical roots and past
and path dependency of the trajectory of the Feira cork cluster are examined, with the main
purpose of identifying its life cycle phases, which is the main contribution of this paper. Along
with some qualitative trends, the analysis is based on a quantitative approach, using four
indicators: 1) the number of firms, 2) workers, 3) working hours and, 4) the value of production.
2
The analysis covers a long time span, from 1947 until the present (in fact, up to 2009, which is
the last year data is available for empirical analysis).
As well as the identification of the stages of the cluster life cycle, an analysis of the economic
performance of firms located in Santa Maria da Feira and in other regions of the country is
made, also covering a long time span of several decades. This compares labour productivity
values and hourly wages as well as those from export performance for a recent period (2004-
2011).
This empirical analysis is a quantitative illustration of the crucial importance of history for the
understanding of cluster dynamics, as well as many other (evolutionary) economic phenomena.
They constitute a useful contribution to the understanding of this important industry in Portugal,
together with the qualitative analysis of the historical, social, political and institutional features
of the lengthy development process of the Santa Maria da Feira cork cluster.
The paper is organized as follows. The theoretical framework about clusters and their life cycle
phases is presented in section 2. Section 3 describes the main features of the Portuguese cork
industry, with particular focus on the cork cluster of Santa Maria da Feira. In section 4, the
historical roots and past and path dependency of the trajectory of this cluster are exposed, as
well as the identification of its life cycle phases. Section 5 concludes, presenting a synthesis of
the main findings and some lines for future research.
2. Theoretical background: a life cycle approach.
Clusters are very important for regional development (Porter 2003), since they improve regional
prosperity, as of clustered firms obtain high returns resulting from agglomeration economies
and external economies in the Marshallian sense. A better and more profound understanding of
the cluster in all its facets helps regional policy decision makers.
In his masterpiece, Principles of Economics, Alfred Marshall (1890) argued that external
economies emerging from an industrial district resulted from the agglomeration of small firms,
strongly connected with each other and specialized in different phases of the same production
process. A concentration of this kind permits the creation of a pool of specialized workers and
forces the creation of subsidiary industries and specialized suppliers.
During the 1970’s, the concept of Marshallian district was applied to the case of Italy by
Giacomo Becattini, which retook the concepts of industrial atmosphere and external economies,
3
but also introduced new elements, such as the local people’s historical and social roots and the
relationship between the people and the production system, whereby firms and market
institutions are one small part of the Industrial District. The “localized industry is embedded in
a community of people” (Becattini, Bellandi and De Propis 2009).
The same type of economies can also be included in the notion of cluster described by Porter
(1990 and 1998)1. According to Martin and Sunley (2003), the conceptualization of a “cluster”
can be chaotic, as there are many definitions and forms of clusters. Putting aside the critics,
according to Porter’s definition, there are two strong features that determine the concept: the
connections between firms and their geographical proximity. Thus clusters can be described as
a geographical concentration of interconnected firms, specialized suppliers, service providers
and institutions2, competing and cooperating in the same location. The advantages of clustered
firms result from Marshallian external economies and from agglomerated economies which
boost the competitive advantage of a sector and/or a region. The local grouping of similar firms
in related industries within a well-defined area refines this concept and allows for the
identification of the cluster’s basic units: firms and institutions that are connected to a specific
sector (defining a value chain) and geographically concentrated. Menzel and Fornahl (2009)
argued that interconnections inside the “spatial and sectorial involucre” refer to traded and
untraded interdependencies3.
Empirical studies making comparisons between clustered and non-clustered firms reinforce the
conclusion that companies inside the cluster tend to perform better that non-clustered
companies (Spencer et al, 2010).
An analysis over a long term perspective may bring new conclusions to the fore which
emphasize the understanding of how and why the cluster actually became a cluster and how it
evolves. However, the historical factors that were prevelant at the time of the origin of a cluster
may not be the same in terms of its functioning and sometimes the advantages of the clustered
1 Clusters and Industrial districts are different concepts, as clusters can have different sizes and the firms within
clusters can also have different dimensions. Similarly, the "industrial atmosphere" present in industrial district can
also be found in the cluster, to the extent that the formal relation between enterprises can be strengthened by the
presence of a social network of cooperation with roots in local history and culture. In this paper we use these
concepts indistinctly.For further discussion, see Soler i Marco (2008); Becattini, Bellandi and De Propis (2009)
and Catalan, Miranda and Ramon-Muñoz (2011). 2 These institutions include universities, standards-settings, agencies, think tanks, vocational training research
providers and trade associations. 3 Market exchange of goods and services; labour market mobility; imitation behaviour, social networks, face-to-
face interaction and cooperation.
4
firms diminish and are not permanently present, or can even become a threat in the face of
external pressures or internal changes.
A more dynamic approach is necessary to be able to capture all the different phases of the
evolution of a cluster, considering it as a complex and adaptive system. The evolutionary
economic geography approach (Boschman and Frenken 2006) contemplates the life cycle of
clusters, placing focus on their origin, how and why they decline and how and why they shift
into new fields. Examination of the life cycle of a cluster allows the identification of different
stages and associated characteristics. Menzel and Fornahl (2010) distinguish between
emergence, growth, maturity and decline, as phases of a cluster’s life and attach different
characteristics to the different stages.
However, few clusters follow a rigid life cycle from emergence to growth and decline.
Following Martin and Sunley (2011), the adaptive cycle model can be used for understanding
complex systems such as a cluster. This approach tries to deal with two contradictory features
of a dynamic system: stability and change. Stability implies a growing internal interconnection
among the parts of the system but tends to reduce the capacity to adapt to a changing
environment. The concept of “Resilience” plays a crucial role in the survival of a dynamic
system. The adaptive life cycle conciliates these contradictory features by taking into account
several phases of the cycle which can be evaluated according to three dimensions: 1)
accumulation of resources; 2) internal connectivity of a system’s components; 3) Resilience, a
measure of system vulnerability to (and recovering from) shocks.
Some studies, like Sedita and Belussi (2009), applied to Italian industrial districts, link the
several phases of the life cycle to quantitative and qualitative characteristics. Also Menzel and
Fornahl (2010) point out quantitative and qualitative aspects that are determinant during the
several phases of a cluster’s evolution.
In terms of the quantitative aspects, the number of firms and employees is different along the
cluster’s life cycle. In the emergence phase, with only a few but growing number of small firms;
in the growth phase with a growing number of employees; in the mature phase, when the cluster
is able to maintain employment at a high level; in the declining phase, when a diminishing
number of firms and employees can be observed.
In terms of a qualitative perspective, several factors influence the different stages during the
life cycle of a local cluster, some related with the external environment of the cluster and others
specific to the cluster and its dynamics.
5
2.1. The Emergence phase
The roots and genesis of a cluster are hard to identify, but this stage is crucial for establishing
the cluster basis and its subsequent growth process. The understanding of how and why clusters
emerge is critical, since the choices made in the past can influence the subsequent choices.
What factors influence the emergence of a cluster? There are several prominent factors at the
origin of a cluster: factors specific to the cluster and/or its territory (“local factors”) and “global
factors”, such as the entry of multinational corporations (Belussi and Sedita 2009).
The local factors are determined by historical legacy and social capital connected to industrial
structure (for instance ancient craft tradition, the values and attitudes towards entrepreneurship,
cooperation, innovation and institutions). Also relevant, are the resource endowments (natural
resources, labour, infrastructures, etc.) and the presence of an anchor firm that could pave the
way to success and stimulate several start-ups. Local demand and national/local policies
complete these local factors.
Menzel and Fornahl (2009) sustain that the context in which the cluster arises is decisive for its
growth, because the cluster must reach a critical level in terms of firms and employees in order
to move on to the next phase. The growth rate of the firms inside the cluster must exceed the
growth of the non-clustered firms. The number of spin-offs is crucial and they can be boosted
by the local business environment.
This phase coincides with rapid growth and the accumulation of resources, such as: specialized
productive capital, supporting institutions and specialized labour. The interconnectivity of the
system components increases (between firms and institutions) and the resilience (adaptability)
is high (Martins and Sunley 2011).
Some authors argue that the establishment of a cluster in a certain region can result from random
facts or “coincidences”. Krugman (1991) claims that “historical accidents” are responsible for
the cluster emergence, meaning that specific features of a location are not so important in an
initial phase and evolution emerges randomly within the economic landscape. Along these lines
Arthur (1994), Boshma and Frenken (2006) described the origin of a cluster as a stochastic
process of start-ups and spin-offs. The cluster establishes itself when the number of firms
reaches a threshold and generates increasing returns. Klepper (2001) offers a more company-
focused perspective: successful firms attract more firms and the location of these firms is
accidental. Martin and Sunley (2006) argue that “coincidences” are not random, but a result
from a strategic option by the firms and sometimes the regional particularities are important.
6
During the origin of the cluster, its main functioning and features are established, in terms of
sectorial specialization and networks between firms, leading to the definition of a technological
direction.
2.2. The Development phase
This stage is dependent on initial conditions and also of local firms’ ability to anticipate or react
to changes affecting international demand and/or global competition. A strong increase in
employment as a result of the strong growth of existing firms and a high number of start-ups
characterizes a growing cluster. The cluster becomes well established and may eventually
stabilize around a particular form, structure and mode of self-reproduction. The
interconnections are high and resilience is lower.
During this phase, the clustered firms perform better, reinforcing the spacial concentration and
resources accumulation. The creation of a specialized labour market and supportive
infrastructure leads to the competitive advantage of the clustered companies, based on
innovation and higher productivity.
According to Elola et al. (2012), the development phase is mainly driven by the path dependent
mechanism and the cluster can be in this stage for a considerable amount of time, depending on
how inflexible it becomes and on the nature of external shocks. The factors present during this
stage can also be local and/or global. In terms of local factors, Elola et al. (2012) highlight the
social capital accumulation and also the firms’ strategies. The strategic capabilities developed
by clustered firms and regional agents are determinant for the competitive advantage of the
cluster and firms can adopt a strategy based on cost leadership or diversification. In terms of
the global factors, these authors emphasise the role of cluster-leading firms and cluster
associations in bringing in outside knowledge to the cluster. In other cases, a reallocation
process can take place in order to get some relationships with services outside the cluster.
2.3. The Maturity Stage
The maturity stage is decisive for the future of the cluster and the lock-in situation may be or
may not be avoidable. In quantitative terms, a mature cluster is in equilibrium, with neither a
significant growth or a decrease in terms of employees and firms. Martin and Sunley (2011)
call this phase the “conservation” phase. The cluster stabilizes around a particular form,
structure and self-reproduction mode.
According to Martin and Sunley (2011), when facing a sudden change or shock, the cluster can
enter into a “release phase”: some firms close, others disinvest and the cluster contracts in size.
7
The decline can result from a “downward causation” (cluster to firms) or an “upward causation”
(firms to cluster).
Menzel and Fornahl (2009) refer to the fact that declining clusters face a decreasing number of
firms and specialist employees due to failures, mergers and rationalizations. Start-ups become
rare. The cluster loses the ability to sustain its diversity, to adjust to changing condition as well
as the potential for independent renewal.
Considering Elola et al. (2012), it appears that the former local factors no longer provide sources
of competitive advantages to the firms and the cluster and “lock-in” situations may occur. The
survival capacity of the cluster depends on the firms’ capabilities to react to changes and renew.
Following Martin and Sunley (2011) three alternatives are possible: 1) Firms have the upgrade
capacity to enter in a new development path through the implementation new, yet related,
technologies; 2) an old cluster declines and disappears, but is replaced by a new one with new
specialization; 3) the cluster declines and no new cluster emerges, leading to the industry
disappearing in that location.
To sum up, the evolutionary process of clusters is accompanied by the evolution of path
dependence, influenced by the initial conditions and the subsequent capabilities developed by
firms during their growth phases. The development of the clustering process is influenced by
multiple path dependences and this phenomenon cannot be solely attributed to Marshallian
external economies, but also depends on local firms’ specific experiences of learning and
innovation.
3. The most relevant facts and trends of the Portuguese cork business
Before entering into the identification of different phases of the life cycle of the cork industry
cluster of Santa Maria da Feira the main facts of the historical evolution of the cork business
need to be presented, as they can also shed some light on the understanding of the cluster
formation and evolution.
The cork business has three facets4. Firstly, in the forest, cork is obtained from the cork oak tree
(Quercus suber) and in Portugal these trees can be found in the “montado” ecosystem. The
Iberian Peninsula possesses soil and climate conditions which give Portugal and Spain an
4 In respect of the different facets of the cork business and its evolution in Spain and Portugal, see Zapata 1996,
Zapata 2002; Parejo 2010.
8
absolute competitive advantage in the production of cork. The western Mediterranean Basin
presents optimal natural conditions for growing cork oak and, in particular, the southwest of
the Iberian Peninsula is the most important region in terms of the area occupied by this tree for
almost two centuries (Aronson, Pereira and Pausas 2009: 13). The cork in raw-material goes to
the cork industries.
Secondly, there are several types of cork industries. The Cork Planks industry produces planks,
a semi-transformed product that can be used to produce bottle stoppers; the manufactured
industry, which is emblematic the natural cork industry where stoppers and discs are produced;
and the Agglomerates industry which produces agglomerated cork products.
Thirdly, the international trade of cork and cork products is dominated by Portugal and Spain,
as they are the most important producers of cork and export the majority of their cork products.
So, the international dimension of the cork business was always present in these two Iberian
countries.
Concerning technological breakthroughs, the most important innovation was the discovery of
the capabilities of cork as a stopper for bottles with liquids, namely champagne. This radical
innovation marked the beginning of the cork industry. Still today the major use for cork is the
production of stoppers. This discovery is attributed to a French monk, Pierre Perignon, at the
end of the 17th century. The onset of this industry in Portugal occurred later (during the first
years of the 19th century) and was initially organized in small units with manual and family
labour. Mechanization began in 1820 with the plane, a tool designed to cut the cork planks for
the manufacture of stoppers. The most relevant feature of the dominant stopper industry is the
fact that it was essentially a handicraft until the 1890s.
At the end of the 19th century another major radical innovation took place: the agglomerated
cork. This innovation led to a more capital-intensive industry, coexisting with the traditional
cork stopper industry that is highly intensive in specialized labour (Zapata et al. 2009). It also
allowed for the production of a range of cork products with several uses for construction as well
as the production of agglomerated stoppers. This new period was marked by the growing
importance of the cork business worldwide. Also in Portugal, the cork agglomerated industries
took off, albeit financed by foreign capital.
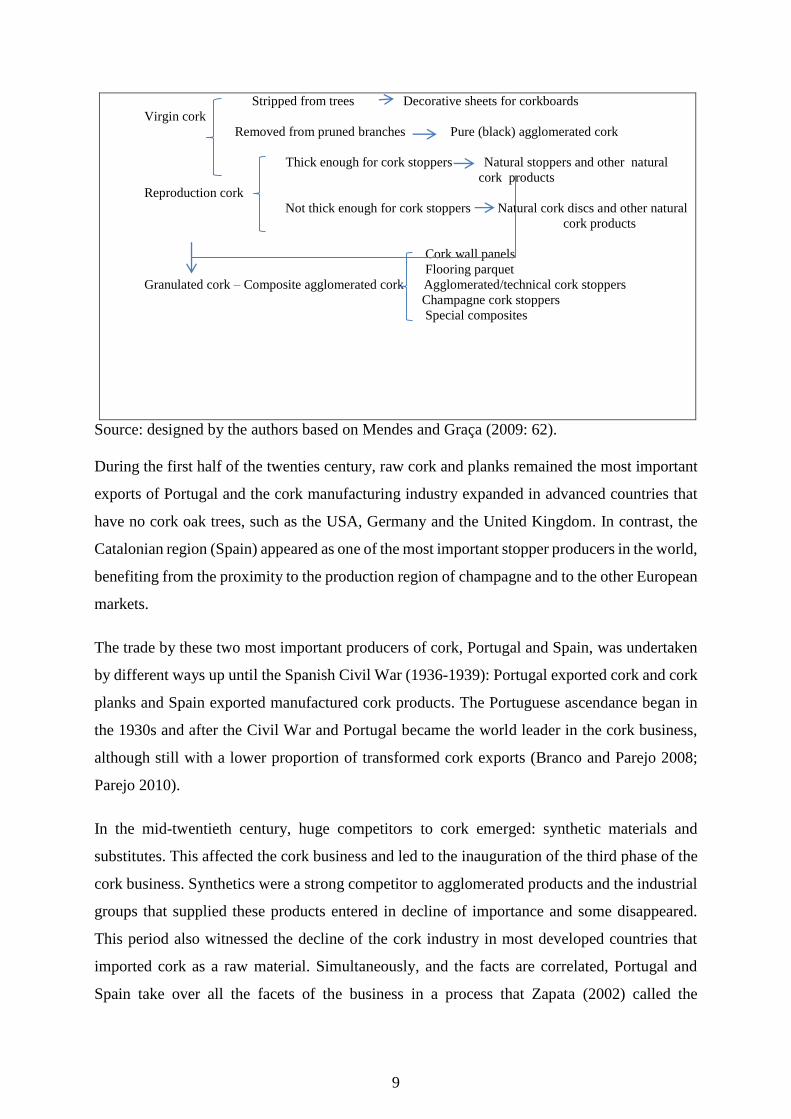
Figure 1: Cork and its products
9
Stripped from trees Decorative sheets for corkboards
Virgin cork
Removed from pruned branches Pure (black) agglomerated cork
Thick enough for cork stoppers Natural stoppers and other natural
cork products
Reproduction cork
Not thick enough for cork stoppers Natural cork discs and other natural
cork products
Cork wall panels
Flooring parquet
Granulated cork – Composite agglomerated cork Agglomerated/technical cork stoppers
Champagne cork stoppers
Special composites
Source: designed by the authors based on Mendes and Graça (2009: 62).
During the first half of the twenties century, raw cork and planks remained the most important
exports of Portugal and the cork manufacturing industry expanded in advanced countries that
have no cork oak trees, such as the USA, Germany and the United Kingdom. In contrast, the
Catalonian region (Spain) appeared as one of the most important stopper producers in the world,
benefiting from the proximity to the production region of champagne and to the other European
markets.
The trade by these two most important producers of cork, Portugal and Spain, was undertaken
by different ways up until the Spanish Civil War (1936-1939): Portugal exported cork and cork
planks and Spain exported manufactured cork products. The Portuguese ascendance began in
the 1930s and after the Civil War and Portugal became the world leader in the cork business,
although still with a lower proportion of transformed cork exports (Branco and Parejo 2008;
Parejo 2010).
In the mid-twentieth century, huge competitors to cork emerged: synthetic materials and
substitutes. This affected the cork business and led to the inauguration of the third phase of the
cork business. Synthetics were a strong competitor to agglomerated products and the industrial
groups that supplied these products entered in decline of importance and some disappeared.
This period also witnessed the decline of the cork industry in most developed countries that
imported cork as a raw material. Simultaneously, and the facts are correlated, Portugal and
Spain take over all the facets of the business in a process that Zapata (2002) called the
10
“Iberization of the Cork Business”. As a result Portugal’s position was reinforced and it became
the world leader in the export of cork and also in the production of manufactured cork products,
the latter having been dominant in the Portuguese cork exports structure since the second half
of the 1960s (Branco e Parejo 2008; Parejo 2010).
Finally, the cork business has three strong features that have been reinforced since the second
half of the 1980s (Zapata et al. 2009): the concentration of demand in the market of wine
producers, mainly from Europe, enhanced by the positive effect of the entry of Portugal and
Spain to the European Union; the cork industry became a mono-product, specializing in the
production of stoppers; Portuguese cork exports showed a stable, although slightly diminishing
trend.
4. The life cycle of the cork industry cluster of Santa Maria da Feira
In this section we will try to analyse the life cycle of the cork industry cluster of Santa Maria
da Feira, using the concepts and methods described in section 2. It is necessary to identify the
different phases of this cycle chronologically, which is a difficult task, given the somewhat
nature of the concepts in question (Martin and Sunley, 2003). To start with we describe a brief
history of the origins of the cork industry in this region of Portugal.
4.1 The origin of the cork industry in Santa Maria da Feira
At the end of the 19th century, according to the Inquérito Industrial (Industrial Census), which
took place in 1890, four cork workshops were located in the Aveiro district, with only seven
employees.
The origins of the Amorim Group, which acted as an anchor firm, go back to 1908, when the
Amorim family established a small workshop producing manufactured cork stoppers at Santa
Maria de Lamas (in the county of Santa Maria da Feira).. In 1917 the Amorim family already
had a factory in Cortinhas (also in Santa Maria da Feira). Amorim&Irmãos5 was founded in
1922, being a family business that would prompted the Portuguese stoppers to the world. In
the 1930s it was already the largest producer in the north region, with 150 workers. During this
decade, the firm adopted a strategy of backward vertical integration by acquiring a small store
in Abrantes, near one of the biggest area of cork oak forest and also near the railway line. In
5 Regarding the history and importance of Amorim&Irmãos see also Santos (1997) and Branco and Parejo
(2011).
11
1939 this store became a factory, producing planks for the main factory. In the 1940s,
Amorim&Irmãos employed 321 workers with a production capacity of 70,000 tonnes of cork a
day. Using a definition by Chandler (1990), Amorim&Irmão can now be classified as a “big
business”. The firm also controlled the distribution channels, cutting out the intermediaries and
had a dominant presence in the cork business at the time, buying Portuguese cork and selling it
to wine producers. Surrounding this “big business” at Santa Maria da Feira were a large number
of small handicraft workshops, based on family labour, producing stoppers to supply the Porto
wine producers. Several studies6 highlight the importance of two elements in cork industry of
Feira: the ties between Amorim&Irmãos and the other small firms, and; the small size of these
firms enabled them to cope better with fluctuations in external demand.
As emphasized in section 2, the local factors behind a clustering situation are based on a
historical, cultural and social legacy. Several aspects can be pointed out: since the onset of the
cork industry, Santa Maria da Feira has been connected with stoppers production; the existence
of small and family firms in the north, including Santa Maria da Feira, was a consequence of
the development of the Porto wine business, although producers often sold their product to
intermediary exporters, sometimes with low quality; the internal consumption of stoppers was
very low as Porto wine was exported in wine barrels; as an anchor firm, Amorim&Irmãos
always demonstrated specific and differing characteristics, with an integrated business, a
considerable number of employees and a dominance of distribution channels; a social network
and strong bonds between the big firm and other small businesses (some of them functioning
out of family homes, others being small handicraft workshop) in both a formal and more
informal way, creating a Marshallian industrial atmosphere.
4.2 The Emergence phase
Bearing in mind all relevant factors it is considered that the emergence stage of the Santa Maria
da Feira cork cluster started in the 1930s, when the number of firms in this region increased and
attained a level of about a quarter of all Portuguese cork firms in the 1940s. However, the
relative weight of the number of employees and hours worked is only around 15% and the
percentage of output value is below 10%, which points to a small average size of firm. As we
only possess data for all of the most significant indicators as from 1947, this is the starting point
of our chronology. The end of the emergence phase of the Santa Maria da Feira cork cluster
6 Ruivo 19996, 1995 and 1992; Mira 1998a, 1998b and 1994.
12
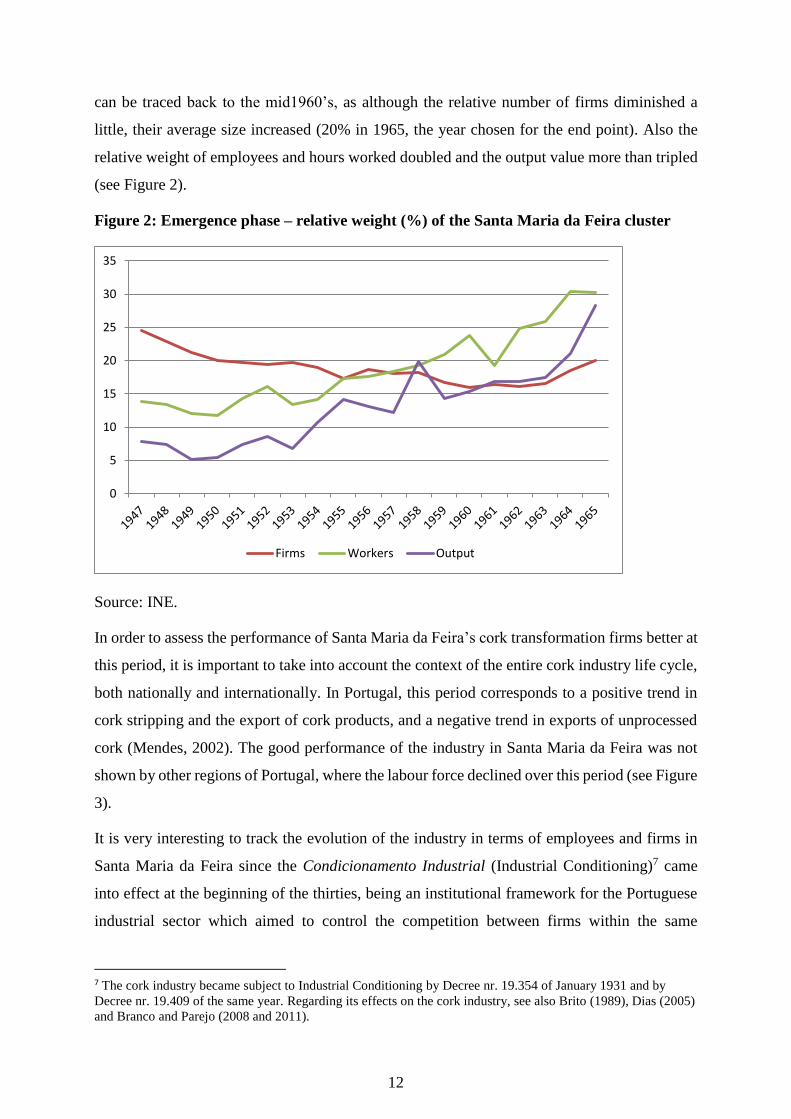
can be traced back to the mid1960’s, as although the relative number of firms diminished a
little, their average size increased (20% in 1965, the year chosen for the end point). Also the
relative weight of employees and hours worked doubled and the output value more than tripled
(see Figure 2).
Figure 2: Emergence phase – relative weight (%) of the Santa Maria da Feira cluster
Source: INE.
In order to assess the performance of Santa Maria da Feira’s cork transformation firms better at
this period, it is important to take into account the context of the entire cork industry life cycle,
both nationally and internationally. In Portugal, this period corresponds to a positive trend in
cork stripping and the export of cork products, and a negative trend in exports of unprocessed
cork (Mendes, 2002). The good performance of the industry in Santa Maria da Feira was not
shown by other regions of Portugal, where the labour force declined over this period (see Figure
3).
It is very interesting to track the evolution of the industry in terms of employees and firms in
Santa Maria da Feira since the Condicionamento Industrial (Industrial Conditioning)7 came
into effect at the beginning of the thirties, being an institutional framework for the Portuguese
industrial sector which aimed to control the competition between firms within the same
7 The cork industry became subject to Industrial Conditioning by Decree nr. 19.354 of January 1931 and by
Decree nr. 19.409 of the same year. Regarding its effects on the cork industry, see also Brito (1989), Dias (2005)
and Branco and Parejo (2008 and 2011).
0
5
10
15
20
25
30
35
Firms Workers Output
13
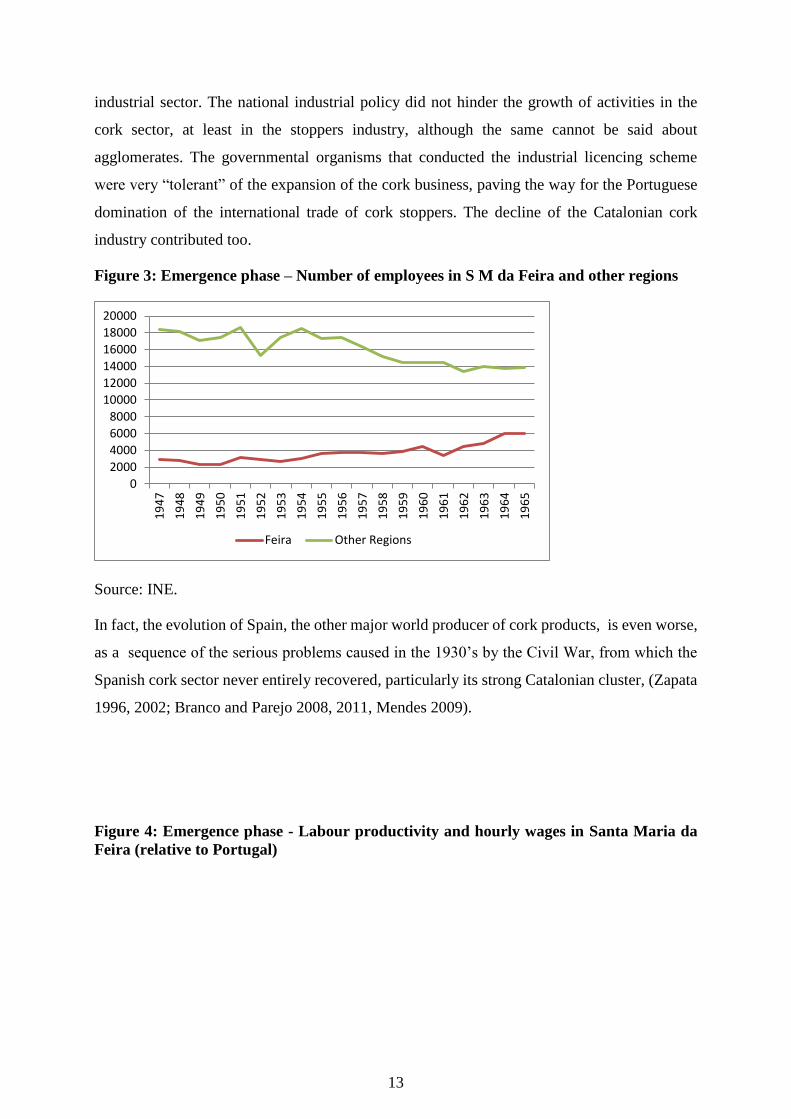
industrial sector. The national industrial policy did not hinder the growth of activities in the
cork sector, at least in the stoppers industry, although the same cannot be said about
agglomerates. The governmental organisms that conducted the industrial licencing scheme
were very “tolerant” of the expansion of the cork business, paving the way for the Portuguese
domination of the international trade of cork stoppers. The decline of the Catalonian cork
industry contributed too.
Figure 3: Emergence phase – Number of employees in S M da Feira and other regions
Source: INE.
In fact, the evolution of Spain, the other major world producer of cork products, is even worse,
as a sequence of the serious problems caused in the 1930’s by the Civil War, from which the
Spanish cork sector never entirely recovered, particularly its strong Catalonian cluster, (Zapata
1996, 2002; Branco and Parejo 2008, 2011, Mendes 2009).
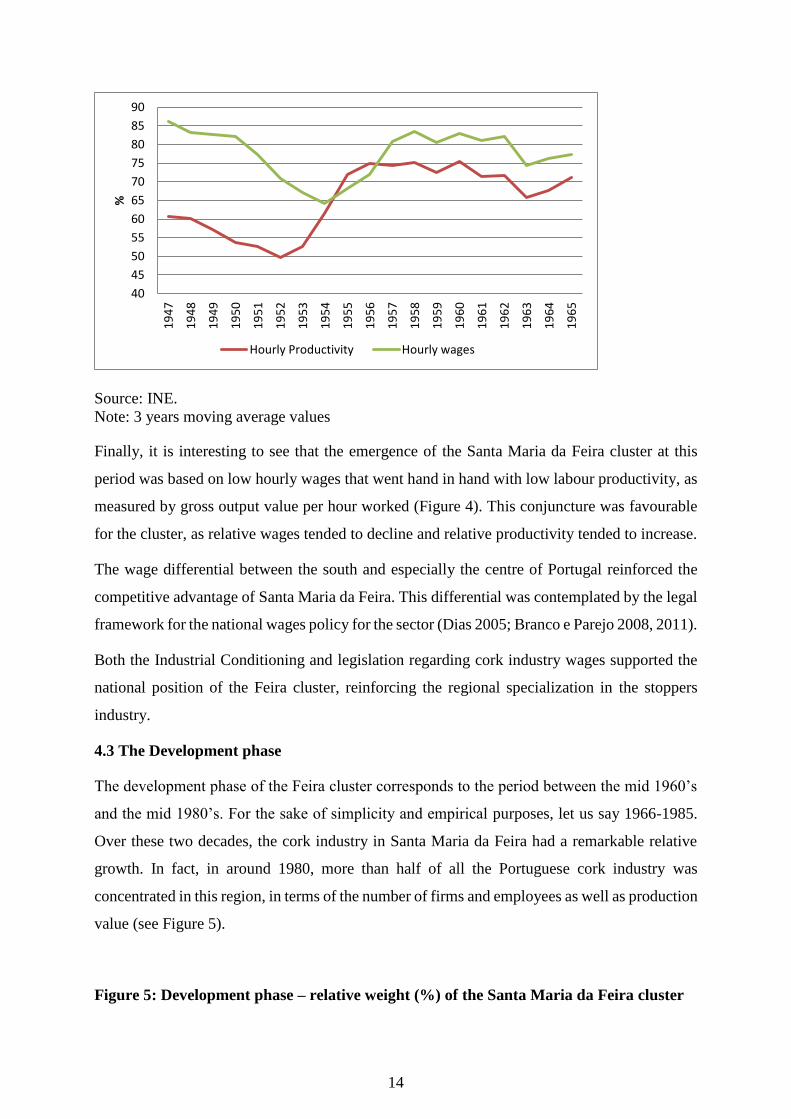
Figure 4: Emergence phase - Labour productivity and hourly wages in Santa Maria da
Feira (relative to Portugal)
0
2000
4000
6000
8000
10000
12000
14000
16000
18000
20000
19
47
19
48
19
49
19
50
19
51
19
52
19
53
19
54
19
55
19
56
19
57
19
58
19
59
19
60
19
61
19
62
19
63
19
64
19
65
Feira Other Regions
14
Source: INE.
Note: 3 years moving average values
Finally, it is interesting to see that the emergence of the Santa Maria da Feira cluster at this
period was based on low hourly wages that went hand in hand with low labour productivity, as
measured by gross output value per hour worked (Figure 4). This conjuncture was favourable
for the cluster, as relative wages tended to decline and relative productivity tended to increase.
The wage differential between the south and especially the centre of Portugal reinforced the
competitive advantage of Santa Maria da Feira. This differential was contemplated by the legal
framework for the national wages policy for the sector (Dias 2005; Branco e Parejo 2008, 2011).
Both the Industrial Conditioning and legislation regarding cork industry wages supported the
national position of the Feira cluster, reinforcing the regional specialization in the stoppers
industry.
4.3 The Development phase
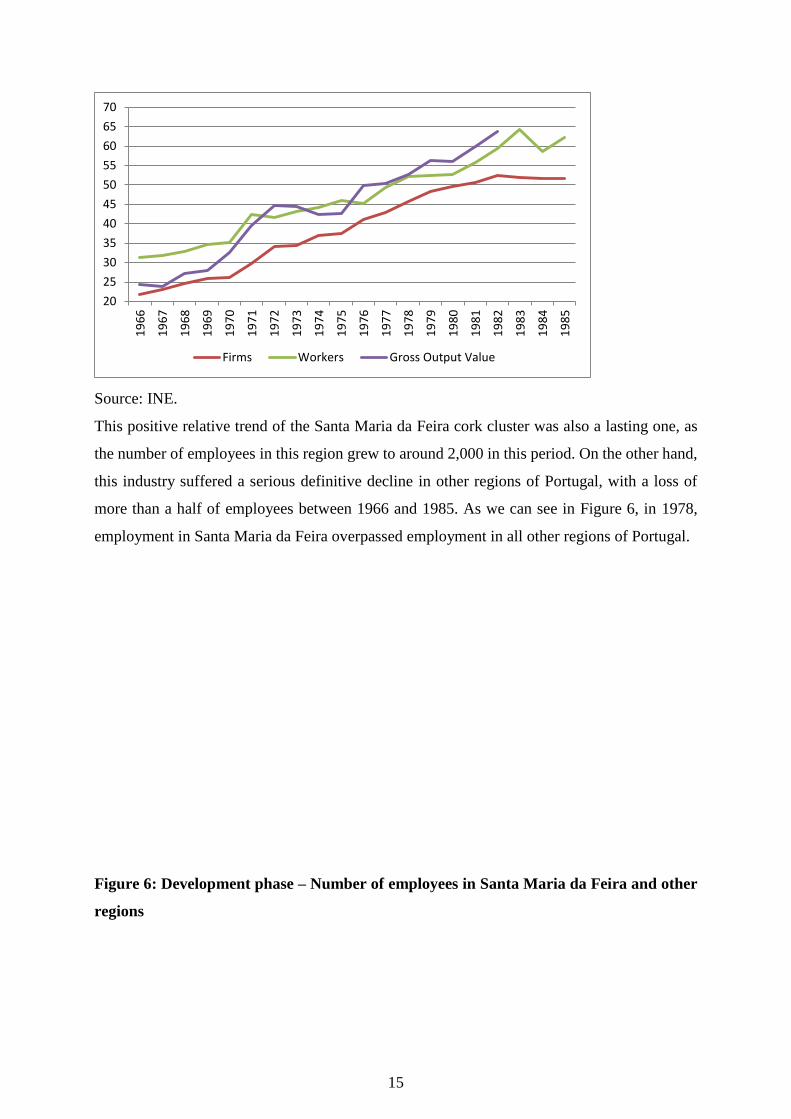
The development phase of the Feira cluster corresponds to the period between the mid 1960’s
and the mid 1980’s. For the sake of simplicity and empirical purposes, let us say 1966-1985.
Over these two decades, the cork industry in Santa Maria da Feira had a remarkable relative
growth. In fact, in around 1980, more than half of all the Portuguese cork industry was
concentrated in this region, in terms of the number of firms and employees as well as production
value (see Figure 5).
Figure 5: Development phase – relative weight (%) of the Santa Maria da Feira cluster
40
45
50
55
60
65
70
75
80
85
90
19
47
19
48
19
49
19
50
19
51
19
52
19
53
19
54
19
55
19
56
19
57
19
58
19
59
19
60
19
61
19
62
19
63
19
64
19
65
%
Hourly Productivity Hourly wages
15
Source: INE.
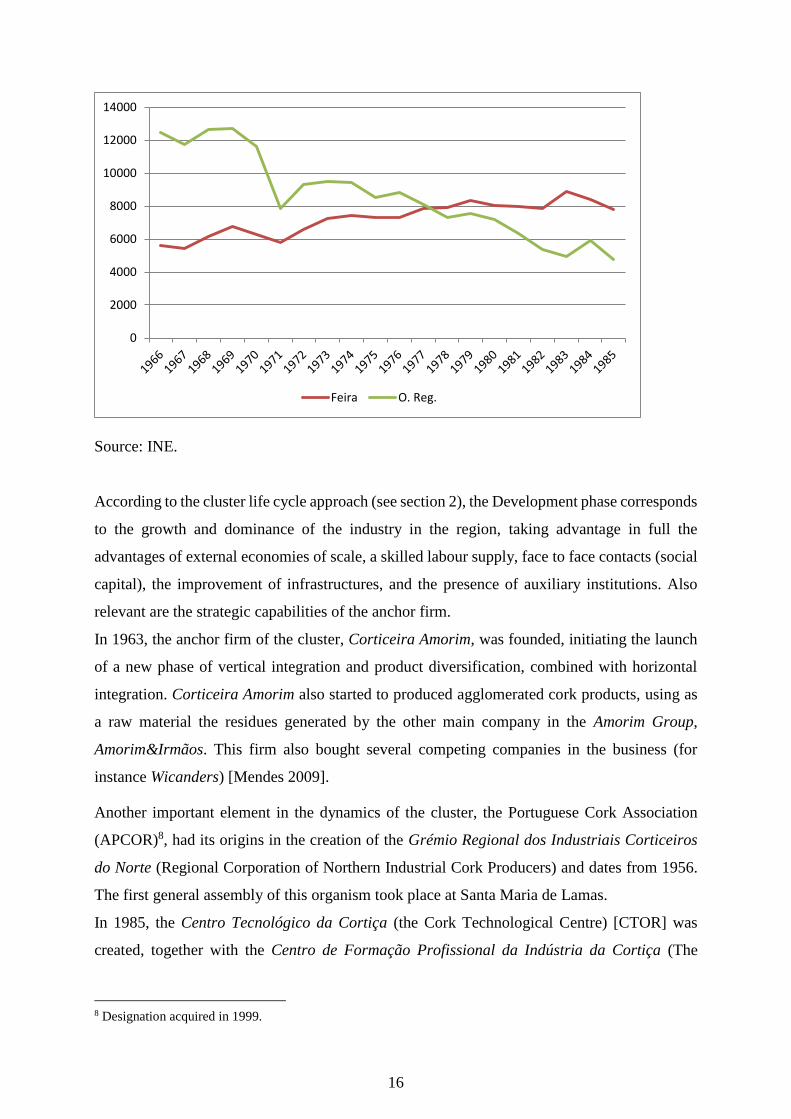
This positive relative trend of the Santa Maria da Feira cork cluster was also a lasting one, as
the number of employees in this region grew to around 2,000 in this period. On the other hand,
this industry suffered a serious definitive decline in other regions of Portugal, with a loss of
more than a half of employees between 1966 and 1985. As we can see in Figure 6, in 1978,
employment in Santa Maria da Feira overpassed employment in all other regions of Portugal.
Figure 6: Development phase – Number of employees in Santa Maria da Feira and other
regions
20
25
30
35
40
45
50
55
60
65
70
19
66
19
67
19
68
19
69
19
70
19
71
19
72
19
73
19
74
19
75
19
76
19
77
19
78
19
79
19
80
19
81
19
82
19
83
19
84
19
85
Firms Workers Gross Output Value
16
Source: INE.
According to the cluster life cycle approach (see section 2), the Development phase corresponds
to the growth and dominance of the industry in the region, taking advantage in full the
advantages of external economies of scale, a skilled labour supply, face to face contacts (social
capital), the improvement of infrastructures, and the presence of auxiliary institutions. Also
relevant are the strategic capabilities of the anchor firm.
In 1963, the anchor firm of the cluster, Corticeira Amorim, was founded, initiating the launch
of a new phase of vertical integration and product diversification, combined with horizontal
integration. Corticeira Amorim also started to produced agglomerated cork products, using as
a raw material the residues generated by the other main company in the Amorim Group,
Amorim&Irmãos. This firm also bought several competing companies in the business (for
instance Wicanders) [Mendes 2009].
Another important element in the dynamics of the cluster, the Portuguese Cork Association
(APCOR)8, had its origins in the creation of the Grémio Regional dos Industriais Corticeiros
do Norte (Regional Corporation of Northern Industrial Cork Producers) and dates from 1956.
The first general assembly of this organism took place at Santa Maria de Lamas.
In 1985, the Centro Tecnológico da Cortiça (the Cork Technological Centre) [CTOR] was
created, together with the Centro de Formação Profissional da Indústria da Cortiça (The
8 Designation acquired in 1999.
0
2000
4000
6000
8000
10000
12000
14000
Feira O. Reg.
17
Centre for Professional Training of the Cork Industry) [CINCORK]. The CTOR was of great
importance, as it changed the technological centre from France to Portugal, being one of the
most advance research centre of its kind in the world (APCOR 2006). The CINCORK started
its activity also in Santa Maria da Feira, promoting the training of highly skilled employees.
The onset of synthetic and plastic products was a death sentence for several cork agglomerate
industrial groups in the region of Setúbal, namely Mundet. Amorim&Irmãos resisted better to
strong competition from these products since its business was essentially the production of cork
stoppers. Furthermore, the initial low-cost strategy, a potential creator of a “lock-in” situation,
was abandoned. The cluster of Santa Maria da Feira overcame the challenge of globalization,
benefiting also from the decline of other foreign cork industries, located both in Portugal and
outside the country.
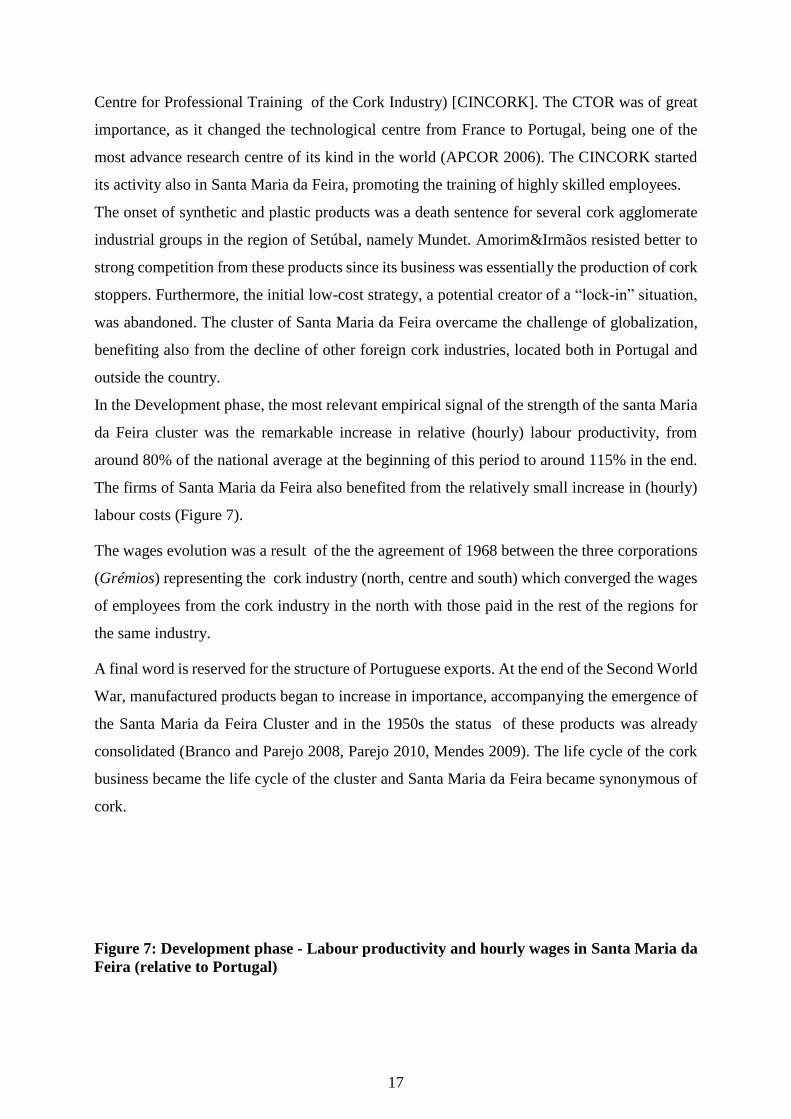
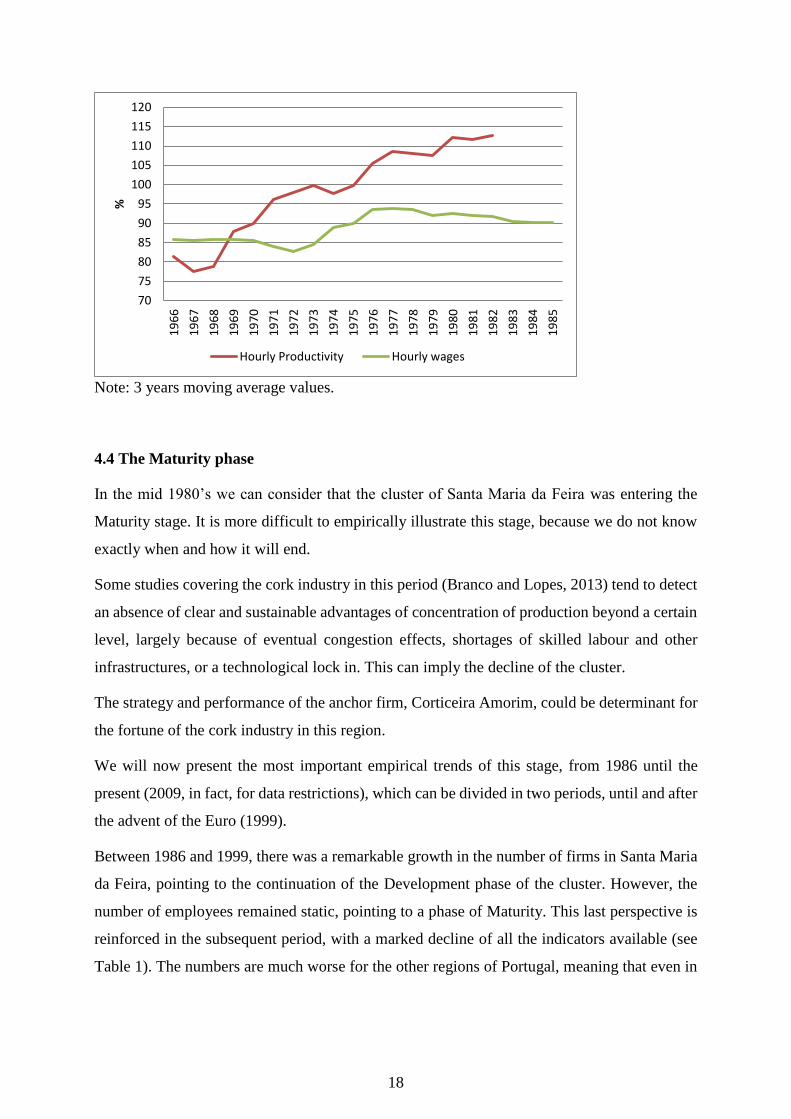
In the Development phase, the most relevant empirical signal of the strength of the santa Maria
da Feira cluster was the remarkable increase in relative (hourly) labour productivity, from
around 80% of the national average at the beginning of this period to around 115% in the end.
The firms of Santa Maria da Feira also benefited from the relatively small increase in (hourly)
labour costs (Figure 7).
The wages evolution was a result of the the agreement of 1968 between the three corporations
(Grémios) representing the cork industry (north, centre and south) which converged the wages
of employees from the cork industry in the north with those paid in the rest of the regions for
the same industry.
A final word is reserved for the structure of Portuguese exports. At the end of the Second World
War, manufactured products began to increase in importance, accompanying the emergence of
the Santa Maria da Feira Cluster and in the 1950s the status of these products was already
consolidated (Branco and Parejo 2008, Parejo 2010, Mendes 2009). The life cycle of the cork
business became the life cycle of the cluster and Santa Maria da Feira became synonymous of
cork.
Figure 7: Development phase - Labour productivity and hourly wages in Santa Maria da
Feira (relative to Portugal)
18
Note: 3 years moving average values.
4.4 The Maturity phase
In the mid 1980’s we can consider that the cluster of Santa Maria da Feira was entering the
Maturity stage. It is more difficult to empirically illustrate this stage, because we do not know
exactly when and how it will end.
Some studies covering the cork industry in this period (Branco and Lopes, 2013) tend to detect
an absence of clear and sustainable advantages of concentration of production beyond a certain
level, largely because of eventual congestion effects, shortages of skilled labour and other
infrastructures, or a technological lock in. This can imply the decline of the cluster.
The strategy and performance of the anchor firm, Corticeira Amorim, could be determinant for
the fortune of the cork industry in this region.
We will now present the most important empirical trends of this stage, from 1986 until the
present (2009, in fact, for data restrictions), which can be divided in two periods, until and after
the advent of the Euro (1999).
Between 1986 and 1999, there was a remarkable growth in the number of firms in Santa Maria
da Feira, pointing to the continuation of the Development phase of the cluster. However, the
number of employees remained static, pointing to a phase of Maturity. This last perspective is
reinforced in the subsequent period, with a marked decline of all the indicators available (see
Table 1). The numbers are much worse for the other regions of Portugal, meaning that even in
70
75
80
85
90
95
100
105
110
115
120
19
66
19
67
19
68
19
69
19
70
19
71
19
72
19
73
19
74
19
75
19
76
19
77
19
78
19
79
19
80
19
81
19
82
19
83
19
84
19
85
%
Hourly Productivity Hourly wages
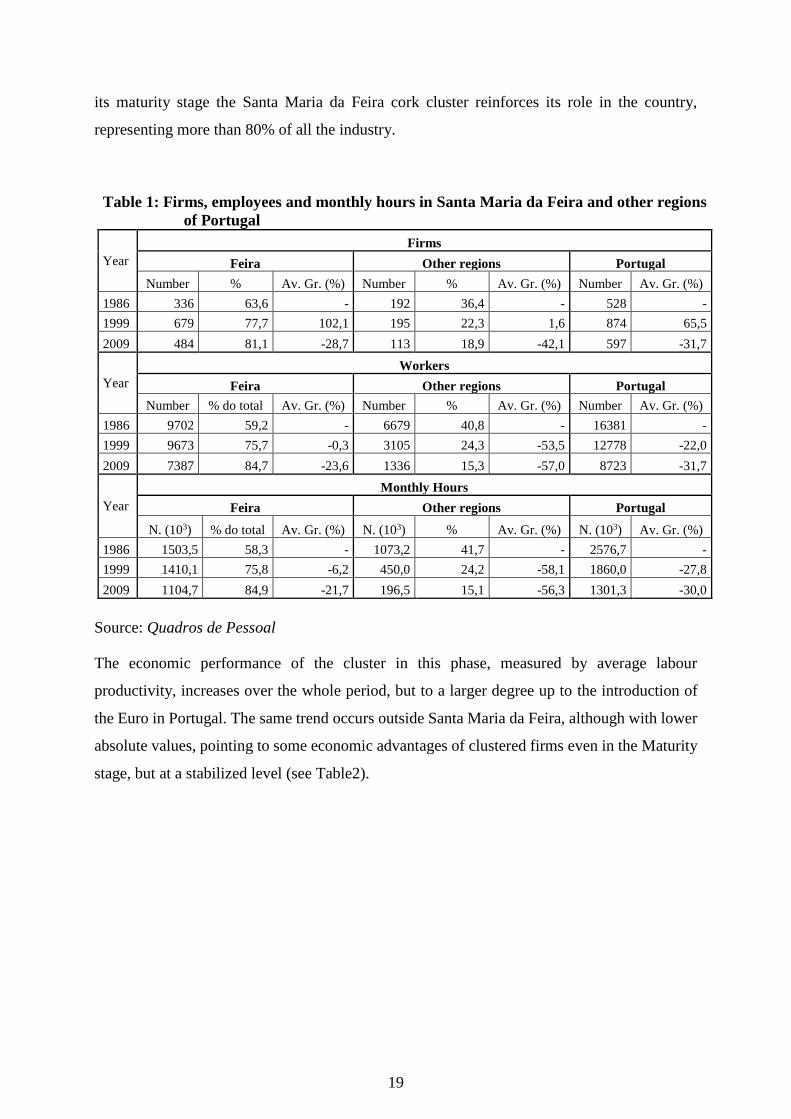
19
its maturity stage the Santa Maria da Feira cork cluster reinforces its role in the country,
representing more than 80% of all the industry.
Table 1: Firms, employees and monthly hours in Santa Maria da Feira and other regions
of Portugal
Year
Firms
Feira Other regions Portugal
Number % Av. Gr. (%) Number % Av. Gr. (%) Number Av. Gr. (%)
1986 336 63,6 - 192 36,4 - 528 -
1999 679 77,7 102,1 195 22,3 1,6 874 65,5
2009 484 81,1 -28,7 113 18,9 -42,1 597 -31,7
Year
Workers
Feira Other regions Portugal
Number % do total Av. Gr. (%) Number % Av. Gr. (%) Number Av. Gr. (%)
1986 9702 59,2 - 6679 40,8 - 16381 -
1999 9673 75,7 -0,3 3105 24,3 -53,5 12778 -22,0
2009 7387 84,7 -23,6 1336 15,3 -57,0 8723 -31,7
Year
Monthly Hours
Feira Other regions Portugal
N. (103) % do total Av. Gr. (%) N. (103) % Av. Gr. (%) N. (103) Av. Gr. (%)
1986 1503,5 58,3 - 1073,2 41,7 - 2576,7 -
1999 1410,1 75,8 -6,2 450,0 24,2 -58,1 1860,0 -27,8
2009 1104,7 84,9 -21,7 196,5 15,1 -56,3 1301,3 -30,0
Source: Quadros de Pessoal
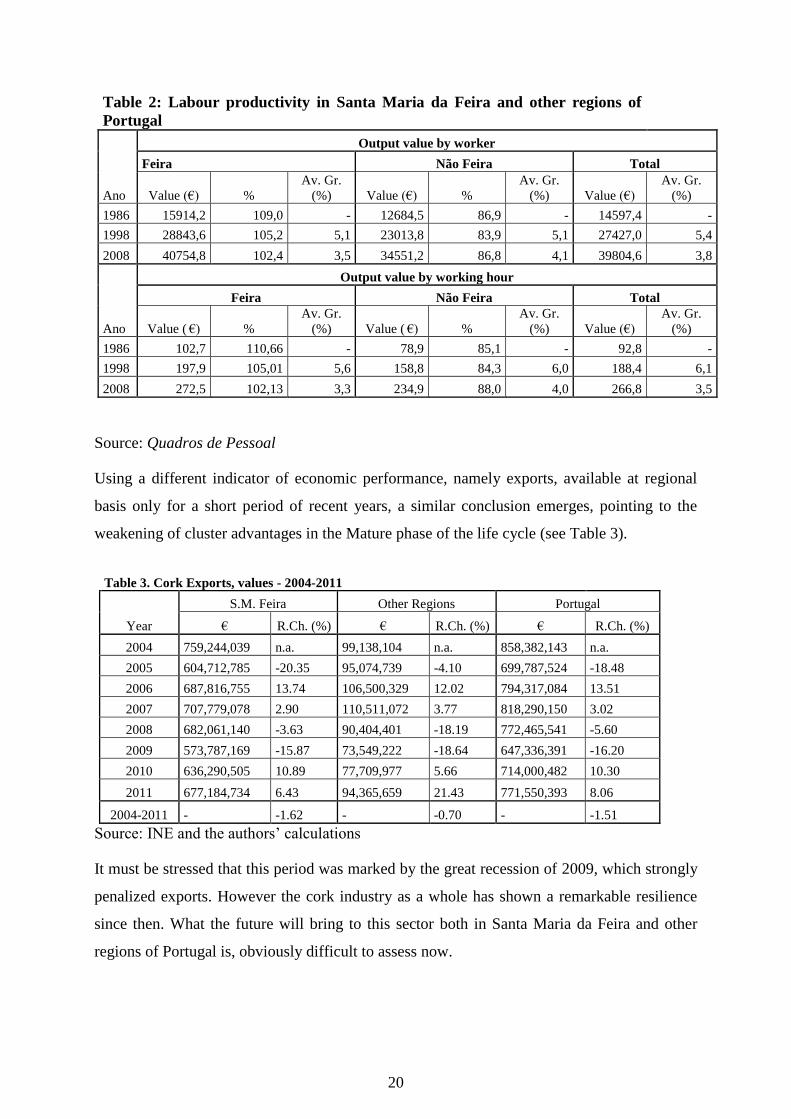
The economic performance of the cluster in this phase, measured by average labour
productivity, increases over the whole period, but to a larger degree up to the introduction of
the Euro in Portugal. The same trend occurs outside Santa Maria da Feira, although with lower
absolute values, pointing to some economic advantages of clustered firms even in the Maturity
stage, but at a stabilized level (see Table2).
20
Table 2: Labour productivity in Santa Maria da Feira and other regions of
Portugal
Ano
Output value by worker
Feira Não Feira Total
Value (€) %
Av. Gr.
(%) Value (€) %
Av. Gr.
(%) Value (€)
Av. Gr.
(%)
1986 15914,2 109,0 - 12684,5 86,9 - 14597,4 -
1998 28843,6 105,2 5,1 23013,8 83,9 5,1 27427,0 5,4
2008 40754,8 102,4 3,5 34551,2 86,8 4,1 39804,6 3,8
Ano
Output value by working hour
Feira Não Feira Total
Value ( €) %
Av. Gr.
(%) Value ( €) %
Av. Gr.
(%) Value (€)
Av. Gr.
(%)
1986 102,7 110,66 - 78,9 85,1 - 92,8 -
1998 197,9 105,01 5,6 158,8 84,3 6,0 188,4 6,1
2008 272,5 102,13 3,3 234,9 88,0 4,0 266,8 3,5
Source: Quadros de Pessoal
Using a different indicator of economic performance, namely exports, available at regional
basis only for a short period of recent years, a similar conclusion emerges, pointing to the
weakening of cluster advantages in the Mature phase of the life cycle (see Table 3).
Table 3. Cork Exports, values - 2004-2011
Year
S.M. Feira Other Regions Portugal
€ R.Ch. (%) € R.Ch. (%) € R.Ch. (%)
2004 759,244,039 n.a. 99,138,104 n.a. 858,382,143 n.a.
2005 604,712,785 -20.35 95,074,739 -4.10 699,787,524 -18.48
2006 687,816,755 13.74 106,500,329 12.02 794,317,084 13.51
2007 707,779,078 2.90 110,511,072 3.77 818,290,150 3.02
2008 682,061,140 -3.63 90,404,401 -18.19 772,465,541 -5.60
2009 573,787,169 -15.87 73,549,222 -18.64 647,336,391 -16.20
2010 636,290,505 10.89 77,709,977 5.66 714,000,482 10.30
2011 677,184,734 6.43 94,365,659 21.43 771,550,393 8.06
2004-2011 - -1.62 - -0.70 - -1.51
Source: INE and the authors’ calculations
It must be stressed that this period was marked by the great recession of 2009, which strongly
penalized exports. However the cork industry as a whole has shown a remarkable resilience
since then. What the future will bring to this sector both in Santa Maria da Feira and other
regions of Portugal is, obviously difficult to assess now.
21
5. Concluding remarks
This paper concerns the relative economic performance of clustered and non-clustered
companies in the different phases of the industry and cluster life cycles.
It starts with the theoretical discussion and identification of four sequential stages, namely
Emergence, Development, Maturity and (eventual) Renewal or Decline, based on the findings
of relevant literature on this subject.
The empirical research is focused on the Portuguese cork industry case, approached from a
historical and socio-economic long term perspective. The main focal point is an apparently
puzzling situation regarding location, namely that most of the Portuguese cork manufacturing
firms are nowadays concentrated in Santa Maria da Feira, a small county in the north of the
country, whereas the bulk of cork is produced in the south (Alentejo and Ribatejo).
After a brief explanation of this and some other relevant facts and trends about the cork
manufacturing business in Portugal, the historical roots and past and path dependence of the
Santa Maria da Feira cork cluster was exposed, as well as the identification of its life cycle
phases.
A comparative analysis of the economic performance of firms localized in Santa Maria da Feira
and in other regions of the country was then made, using labour productivity and wages data
for a long time span of several decades, covering all the stages of the cluster evolution.
This exercise is a quantitative illustration of the crucial importance of history for the
understanding of cluster dynamics, as well as many other (evolutionary) economic phenomena.
The main conclusions substantially support the theoretical predictions found in the cluster life
cycle literature. In the emergence phase, between the mid 1940’s and the mid 1960’s, the Santa
Maria da Feira cork cluster became slowly more important, in terms of the number of
companies, employees and production, but the economic performance (productivity) is below
the country’s average. In the Development phase, until the mid-1980’s, a remarkable growth of
the cluster occurs, as well as a substantial improvement in its absolute and relative economic
performance, measured by hourly labour productivity. Finally, the Maturity stage in the 1990s
and the first decade of the new millennium is denoted by an apparent exhaustion of the
advantages of clustering, with congestion and possible lock in effects.
22
It has not yet been clearly and unequivocally determined whether the future phase of the Santa
Maria da Feira cork cluster will be one of decline or renewal as this depends on many factors,
which warrant continuous and careful observation and research. One of the most determinant
factors is the business strategy and behaviour of the anchor firm, Corticeira Amorim, which has
led for a long time the cork business in Portugal and indeed the rest of the world.
Acknowledgements. Financial support from the FCT (Fundação para a Ciência e a
Tecnologia – Portugal) is gratefully acknowledged.
References
Aronso, J., Pereira, J. S. and Pausa, J. G. (2009), “The tree” in Aronso, J.; Pereira, J. S.; Pausa,
J. G. (eds), Cork Oak Woodlands on the Edge, Island press, Washington, USA, pp. 11-
23.
Associação Portuguesa da Cortiça (APCOR) (2006), “APCOR. 50 anos 1956-2006”, APCOR.
Becattini, G., Bellandi, M. and De Propris, L. (eds) (2009), A Handbook of Industrial Districts,
Edwar Elgar, United Kingdom.
Belussi, F. and Sedita, S. R. (2009), Life Cycle vs. Multiple Path Dependency in Industrial
Districts, European Planning Studies, Vol. 17, n.º4, pp. 505-528.
Branco, A. and Lopes, J. C. (2013), Vantagens da concentração geográfica da produção: o caso
da indústria corticeira de Santa Maria da Feira, WP 04/2013/DE/GHES/UECE, Lisbon.
Boschma, R. A. and Frenken, K. (2006), Why is economic geography not an evolutionary
science?, Journal of Economic Geography, 6, pp. 273-302.
Branco, A. and Parejo, F. M. (2011), “Distrito industrial y competitividad en el mercado
international: la industria corchera de Feira en Portugal” in Catalan, J., Miranda, J. A. and
Ramon-Muñoz, R. (eds) (2011), Distritos e Clusters en la Europa del Sur, LID Editora
Empresarial, Madrid, Spain, pp. 123-142.
23
Branco, A., Parejo, F. M. (2008), Incentives or obstacles? The institutional aspects of the cork
business in the Iberian Peninsula (1930-1975), Revista de Historia Económica – Journal
of Iberian and Latin America Economic History, 1, pp. 17-44.
Brito, J. M. B. (1989), A industrialização portuguesa no pós guerra (1948-1965). O
Condicionamento Industrial, Edições Dom Quixote, Lisbon,
Catalan, J., Miranda, J. A. e Ramon-Muñoz, R. (2011), “Distritos, Clusters, y ventaja
competitiva: interpretaciones y debates” in Catalan, J.; Miranda, J. A. e Ramon-Muñoz,
R. (eds) (2011), Distritos e Clusters en la Europa del Sur, LID Editora Empresarial,
Madrid, Spain, pp. 9-36.
Chandler, A. D. (1990), Scale and scope: the dynamics of industrial capitalism, Harvard
University Press.
Dias, A. (2005), “O impacto das florestas no crescimento económico moderno durante o Estado
Novo (1930-1974)”, tese de Doutoramento em História Económica e Empresarial,
Instituto Superior de Economia e Gestão (ISEG), Lisboa.
Elola, A., Valdaliso, J. M., López, S. M. and Aranguren, M. J. (2012), Cluster Life Cycles, Path
Dependency and Regional Economic Development: Insights from a Meta-Study on
Basque Clusters, European Planning Studies, Vol. 20, n.º 2, pp. 257-279.
Keppler, S. (1997), Industry life cycle, Industrial and Corporate Change, Vol. 6, n.º 1, pp. 145-
181.
Krugman, P. (1991), Geography and Trade, Cambridge, MA: MIT Press.
Marshall, A. (1920), Principles of economics, 8th Edition, London and New York, Macmillan;
1st Edition 1890.
Martin, R. L. and Sunley, P. J. (2011), Conceptualizing Cluster Evolution: Beyond the life
Cycle Model?, Regional Studies, Vol. 45, 10, pp. 1299-1318.
Martin, R. L. and Sunley, P. J. (2006), Path dependence and regional economic evolution,
Journal of Economic Geography, 6, pp. 395-437.
24
Martin, R. L. and Sunley, P. J. (2003), Deconstructing Clusters: chaotic concept or policy
panacea, Journal of Economic Geography, 3, pp. 5-35.
Mendes, A. (2009), “Cork Production and manufacturing in Portugal from the mid of the XIXth
century to the end of the XXth century” in Zapata, S. (ed.), Cork Oak Woodlands and
Cork Industry: present, past and future, Museu del Suro de Palafrugell, Palafrugell, pp.
808-839.
Mendes, A. and Graça, J. (2009), “Cork Bottle Stoppers and Other Cork Products” in Aronson
et al. (eds), Cork Oak Woodlands on the Edge, Island press, USA, pp.59-6.
Mendes, A. (2002), “A economia do sector da cortiça em Portugal. Evolução das actividades
de produção e transformação ao longo dos séculos XIX e XX, Porto, Universidade
Católica Portuguesa (Working Paper).
Menzel, M. and Fornahl, D. (2009), Cluster life cycles – dimensions and rationales of cluster
evolution, Industrial and Corporate Change, Vol. 19, n.º 1, pp. 205-238.
Mira, N. (1998a), “Concentração Industrial: o mercado corticeiro português” in III Encontro de
Economistas de Língua Portuguesa, Vol. I, pp. 401-412.
Mira, N. (1998b), Modelo com custos de transporte explicativos das decisões de localização:
aplicação ao sector corticeiro português, Estudos de Economia, Vol. XVIII, 3, pp. 373-
384.
Mira, N. (1994), Uma estratégia de localização industrial para o sector corticeiro, Economia e
Sociologia, 58, pp. 165-177.
Parejo, F. (2010), El negocio del Corcho en España durante el siglo XX, Estudios de Historia
Económica, 57, Banco de España, Madrid.
Porter, M. (2003), The economic performance of regions, Regional Studies, Vol. 37 (6&7) pp.
549-578.
Porter, M. (1998), On Competition, Harvard Business School Press, Boston, MA.
Porter, M. (1990), The Competitive Advantage of Nations, Macmillan, London.
Ruivo, M. (1996), O impacto do espaço familiar na diferenciação regional da indústria da
cortiça em Portugal, Sociedade e Território, 23 (Outubro), pp. 95-105.
25
Ruivo, M. (1995), “A indústria da cortiça na Feira – um distrito industrial?” in VVVAA
(coords.), Por onde vai a economia portuguesa?, Actas da Conferência realizada por
ocasião do jubileu académico de Francisco Pereira de Moura, ISEG, Lisboa.
Ruivo, M. (1992), Logiques familiales, flexibilite pProductive et main-d’ouvre secondarire. Le
cas du district industriel du liége à Feira (Portugal), These pour le doctorat en sciences
économiques, Universite de Paris I – Pantheon – Sorbonne, Paris.
Santos, C. O. (1997), Amorim: História de uma família, Grupo Amorim, two volumes.
Soler i Marco, V. (ed.) (2008), Los Distritos Industriales, Mediterraneo Economico, Fundación
CAJAMAR, Espanha.
Spencer, S., Vinodral, T., Gertler, M. and Wolfe, D. (2010), Do Clusters Make a Difference?
Defining and Assessing their Economic performance, Regional Studies, 44 (6), 697-715.
Zapata, S. (1996), Corcho extremeño Y andaluz, tapones gerundenses, Revista Historia
Industrial, n.º10, pp. 37-66.
Zapata, S. (2002), Del suro a la cortiça. El ascendo de Portugal a la primera potencia corchera
del mundo, Revista de Historia Industrial, 22, pp. 109-137.
Zapata, S., Parejo, F. , Branco, A., Gutierrez, M., Blanco, J., Renaud, P. and Voth, A. (2009),
“Manufacture and Trade of Cork Products: An International Perspective” in Aronso, J.,
Pereira, J. S. and Pausa, J. G. (eds), Cork Oak Woodlands on the Edge, Island press,
Washington, USA, pp. 189-200.