Embed Size (px)
Citation preview
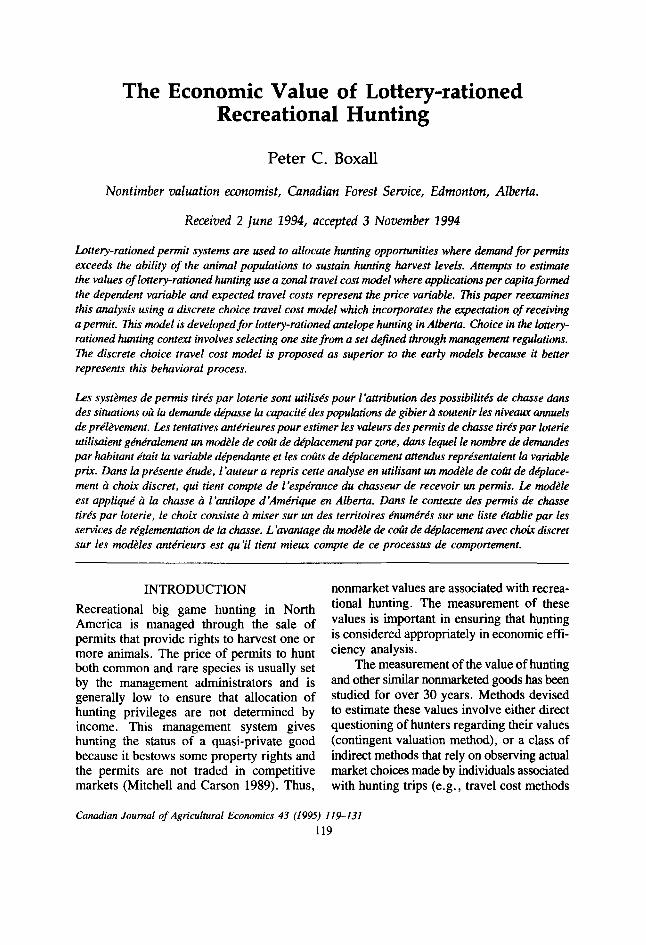
The Economic Value of Lottery-rationed Recreational Hunting
Peter C. Boxall
Nontimber valuation economist, Canadian Forest Service, Edmonton, Alberta.
Received 2 ] m e 1994, accepted 3 November 1994
Lottery-rationed permit systems are used to allocate hunting opportunities where demand for permits exceeds the ability of the animal populations to sustain hunting harvest levels. Anempts to estimate the values of lottery-rationed hunting use a zonal travel cost model where applications per capita formed the dependent variable and expected travel costs represent the price variable. This paper reexamines this analysis using a discrete choice travel cost model which incolporates the expectation of receiving a permit. This model is developed for lottery-rationed antelope hunting in Alberta. Choice in the lottery- rationed hunting context involves selecting one site from a set deJned through management regulations. The discrete choice travel cost model is proposed as superior to the early models because it bener represents this behavioral process.
Les syst2mes de permis tire's par loterie sont utilise's pour 1 'attribution a2s possibilite's de chasse dans des situations ou la demande dkpasse la capacite' des popuhtions de gibier b soutenir les niveaux unnuek de pre'l2vement. Les tentatives antLrieures pour estimer les valeurs des p e m k de chasse tire's par loterie utilisaient ge'ne'ralement un mod& de COW a2 de'placement par zone, dans lequel le mmbre de demandes par habitant e'tait la variable de'pendante et les coats de de'placement attendus reprisentaient la variable prix. Dans la pre'sente e'tude, 1 'auteur a repris cette analyse en utilisant un mod& de coat de d4place- ment choix discret, qui tient compte de l'espe'rance du chasseur de recevoir un permis. LQ nwd2le est applique' a la chasse a l'antilope d'Ame'rique en Alberta. Dans le contexte des permis de chasse tire's par loterie, le choix consiste b miser sur un des territoires e'nume're's sur une liste e'tablie par les services de re'glementation de la chasse. L'avantage du d 2 l e de coat de de'placement avec choix discret sur les mod2les ante'rieurs est qu 'il tient mieux compte de ce processus de comportement.
INTRODUCTION nonmarket values are associated with recrea- Recreational big game hunting in North America is managed through the sale of permits that provide rights to harvest one or more animals. The price of permits to hunt both common and rare species is usually set by the management administrators and is generally low to ensure that allocation of hunting privileges are not determined by income. This management system gives hunting the status of a quasi-private good because it bestows some property rights and the permits are not traded in competitive markets (Mitchell and Carson 1989). Thus,
tional hunting. The measurement of these values is important in ensuring that hunting is considered appropriately in economic effi- ciency analysis.
The measurement of the value of hunting and other similar nonmarketed goods has been studied for over 30 years. Methods devised to estimate these values involve either direct questioning of hunters regarding their values (contingent valuation method), or a class of indirect methods that rely on observing actual market choices made by individuals associated with hunting trips (e.g., travel cost methods
Canadian Journal of Agricultural Economics 43 (1995) 119-131 119
120 CANADIAN JOURNAL OF AGRICULTURAL ECONOMICS
or TCM). However, a complication in the measurement of hunting values arises when a lottery-rationed system is used to randomly allocate permits among hunters. This system is commonly used in North America to allo- cate permits where interest in hunting some species is greater than the population a species can support on a sustained basis. The mea- surement of these values is difficult to assess because constraining demand through the lottery allows the researcher only to question or observe the behavior of those actually selected through the lottery.
Estimating values of these activities by studying successful lottery applicants raises two issues. First, an econometric issue arises because using data on the actual hunters means in most cases that one trip only is observed and, without accounting for the probability of being selected in the lottery, the coefficients of the estimated demand model will be biased. Second, unlike a market mechanism that allocates units of a good to those who value it most, a lottery gives all an equal chance of obtaining the good. Thus, comparing consumer surplus measures under different rationing methods requires the use of applications made to the lottery as the quantity measure. Mumy and Hanke (1975) show that without pricing, the value of an additional permit allocated by a lottery should be the expected value of the probabilities of high-valued and low-valued users receiving the next permit. The random assignment of permits results in this becoming the average consumer surplus. Thus, in this paper, the use of applications, adjusted for the probability of selection, is proposed as a correct measure of quantity demanded in estimating welfare measures associated with lottery-rationed hunting.
While Nickerson (1990) examined aspects of the demand for lottery-rationed hunting, John Loomis (1980, 1982a, 1982b) and Loomis et a1 (1985), in a series of articles, devised an intriguing method for estimating benefits associated with this type of hunting. Loomis (1982a) was able to demonstrate that the benefits estimated con- sidering the entire lottery sample differed
from those derived using conventional methods, which consider only the successful lottery winners. Benefits were estimated by modifying the traditional zonal TCM (called below the modified TCM) where the depen- dent variable was applications per capita instead of trips per capita, and the expected costs of travelling between origin zones and hunting sites were used as a price proxy. This method could be useful to resource managers, who are under increasing pressure to assess the impact of expansion of forestry and agriculture on wildlife-related recreational values. Loomis’s method enables analysis of trade-offs without collecting additional data from hunters through expensive surveys. Thus, the modified TCM may allow benefits to be estimated using information typically collected during the lottery application process.
This paper reexamines the lottery- rationed problem by applying Loomis’s travel cost framework using a discrete choice or random utility model (RUM). These models have been used in the travel cost literature to estimate the benefits of various recreational activities (e.g., Coyne and Adamowicz 1992; Bockstael et a1 1989). The advantage of dis- crete choice TCMs over the more traditional TCM framework is that they explicitly incor- porate both substitution and site-quality effects. The application of RUMS to lottery- rationed hunting is particularly advantageous where a permit usually results in one trip, which supports assumptions relating to independence of choice occasions and no diminishing marginal utility of trips. They also operate at an individual level and avoid criticisms of the zonal approach to TCM analyses (Fletcher et a1 1990; Smith 1989). It is argued that this model better represents the decision an individual faces of choosing a single site among several to apply through the lottery for a hunting permit.
The Modified Travel Cost Model The traditional or Hotelling-Clawson-Knetsch (HCK) ‘ICM, described by Rosenthal etal (1984) and Dwyer et al(1977), derives a demand curve by using the number of trips taken and associated travel costs as pricequantity points.
LOTTERY-RATIONED RECREATIONAL HUNTING 121
The dependent variable, the quantity of trips, can be specified on an individual level or a zonal level where it represents trips per capita based on population levels in zones. Once the demand curve is estimated, consumer surplus associated with the recreational activity at a particular site can be estimated. One assump- tion required by this TCM is that any recrea- tionist can visit a site at current travel costs or price. In other words, there is no excess demand or constraints denying access to those who wish (and can afford) to visit the site in question. In the lottery-rationed recreation context, this assumption is clearly violated. Loomis (1982a) showed that actual visits do not serve as the correct measure of demand with lotteries. Rather, the number of visits hunters wish to make, as approximated by the number of lottery applications, and expected travel costs, represent theoretically correct measures of quantity and price.
Loomis (1982a, 1982b) and Loomis et al (1985) used HCK zonal TCMs in single-site and multiple-site models to estimate the value of lottery-rationed hunting permits. Zonal HCK TCMs are now recognized as inferior to TCMs that use individual-level data. This is because strong assumptions about indi- vidual behavior are represented by a zonal “average,” the treatment of substitute sites (Fletcher et a1 1990), and the sensitivity of demand estimates to definition of origin zones (Sutherland 1982). This latter concern is particularly relevant to lottery-rationed recreation. In zonal approaches to travel cost analysis, origin boundaries must be flexible, considering that some recreationists make zero visits from a particular origin to the site(s). This can result in dependent variables with values of zero that are unworkable in demand functions with the log-log and semi- log functional forms common in HCK TCMs. Some researchers suggest redefining origins such that there are none with zero visits (e.g., Rosenthal et a1 1984). Others simply discard origins with zero visits (e.g., Hellerstein 1991) or add a constant to every origin’s dependent variables (e.g., Mullen and Menz 1985). The treatment of zero visits is critical in analyzing lottery-rationed demands where
large numbers of zeros arise when there are no applications for some permits from some origins.
An Alternative Model Structure In order to utilize Loomis’s modified travel cost model, an individual-level TCM should be specified. One of the problems in using individual-level data in the modified TCM framework in the lottery case is that each individual can usually make one application for one of a number of recreation zones. This results in a vector of applications for sites con- sisting of ones and a large number of zeros. In order to utilize individual-level data while accounting for the binary nature of these par- ticular choice situations, a discrete choice TCM may better represent behavior in most lottery-rationed hunting systems, especially when a successful applicant makes only one visit to the site because of the short time period during which hunting is allowed by regulation.
Discrete choice TCMs use random utility theory to explicitly model choice among a set of substitute alternatives on a given choice occasion, with each choice occasion assumed independent of the others. The choice is modeled as a function of the characteristics of substitute alternatives. A recreationist (indexed as i ) receives utility, U, from visiting a site (indexed as]? equal to U, = U(Xu,Si), where Xu is a vector of characteristics of s i te j perceived by individual i , and Si is a vector of individual characteristics. Utility is modeled as a random variable where part is known or observable to the investigator and the remainder is not. Thus, U, = K, + E , where V, = flX,,Si) is the former compo- nent, and E , the latter. E can be interpreted as an error term related to the research effort. Estimation proceeds by assuming a particular functional form for V( .), the observable com- ponent of the utility function and a particular distribution for E .
Considering that a recreationist faces a choice of one site from a finite set C of sites, the probability, T , that si tej will be visited is equal to the probability that the utility gained from visitingj is greater than or equal
122 CANADIAN JOURNAL OF P LGRICULTURAL ECONOMICS
based on a set of site characteristics. The number of applications for a site can be esti- mated by:
to the utilities of choosing any other site in C. Thus, for individual i, the probability of applying to si tej is:
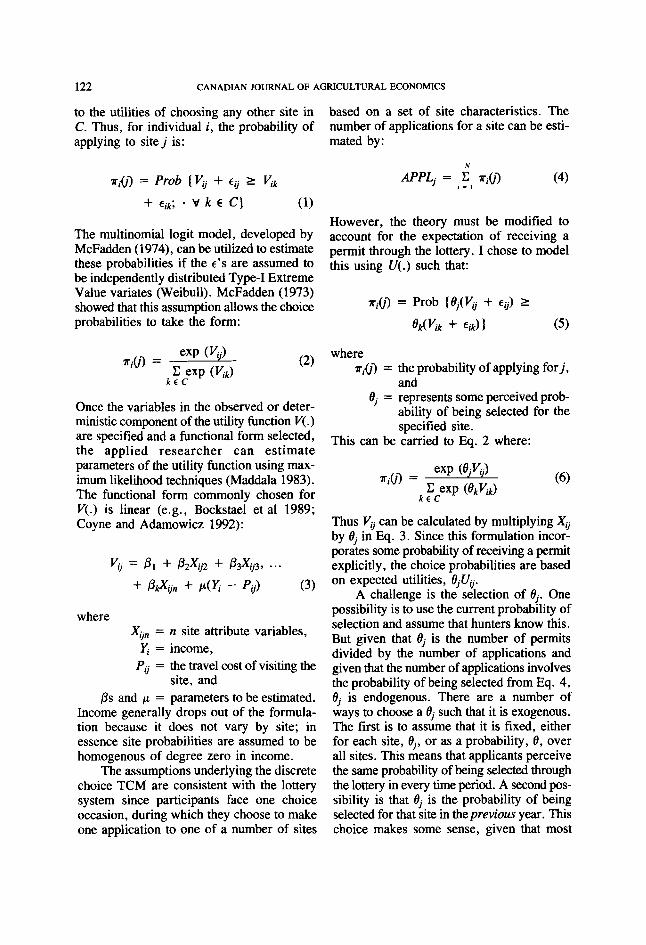
The multinomial logit model, developed by McFadden (1974), can be utilized to estimate these probabilities if the c’s are assumed to be independently distributed Type-I Extreme Value variates (Weibull). McFadden (1973) showed that this assumption allows the choice probabilities to take the form:
Once the variables in the observed or deter- ministic component of the utility function V( .) are specified and a functional form selected, the applied researcher can estimate parameters of the utility function using max- imum likelihood techniques (Maddala 1983). The functional form commonly chosen for V(.) is linear (e.g., Bockstael et a1 1989; Coyne and Adamowicz 1992):
where Xijn = n site attribute variables,
& = income, Pu = the travel cost of visiting the
site, and 0s and p = parameters to be estimated.
Income generally drops out of the formula- tion because it does not vary by site; in essence site probabilities are assumed to be homogenous of degree zero in income.
The assumptions underlying the discrete choice TCM are consistent with the lottery system since participants face one choice occasion, during which they choose to make one application to one of a number of sites
N
APPLj = c r i b ] (4) , = I
However, the theory must be modified to account for the expectation of receiving a permit through the lottery. I chose to model this using U(. ) such that:
where xi(j) = the probability of applying forj,
and 8, = represents some perceived prob-
ability of being selected for the specified site.
This can be carried to Eq. 2 where:
Thus Vij can be calculated by multiplying Xij by in Eq. 3. Since this formulation incor- porates some probability of receiving a permit explicitly, the choice probabilities are based on expected utilities, OjUij.
A challenge is the selection of 8,. One possibility is to use the current probability of selection and assume that hunters know this. But given that 8, is the number of permits divided by the number of applications and given that the number of applications involves the probability of being selected from Eq. 4, 8, is endogenous. There are a number of ways to choose a 8, such that it is exogenous. The first is to assume that it is fixed, either for each site, O,, or as a probability, 8, over all sites. This means that applicants perceive the same probability of being selected through the lottery in every time period. A second pos- sibility is that 8, is the probability of being selected for that site in theprevious year. This choice makes some sense, given that most
LOTTERY-RATIONED RECREATIONAL HUNTING 123
U.S. lottery hunts make previous success rates available on the application and that, in Alberta, information brochures provide this information. A combination of the two strate- gies is also possible. In this case, the manage- ment authority provides information about the previous year’s success rates as an overall probability of being drawn for a license. Finally, additional research could be con- ducted to determine hunters’ perception of the probabilities and a set of explanatory variables explaining this probability. Candidate vari- ables could include past applications and selection successes, information provided by the agency, and socio-economic and general experiential variables. In other words, Oj could be modeled in an expectations frame- work with some lagged explanatory variables to ensure exogeneity .
Variables incorporated into the utility function can include expected travel costs, site characteristics or qualities that recreationists may be aware of, and characteristics of the recreationists themselves. The qualities of sites enter the model in such a way as to allow choices among multiple sites, permitting sub- stitution to be explicitly incorporated in the model. This model also has management implications because it can predict the distri- bution of applications among sites and how this may change following changes in quality or closure of sites.
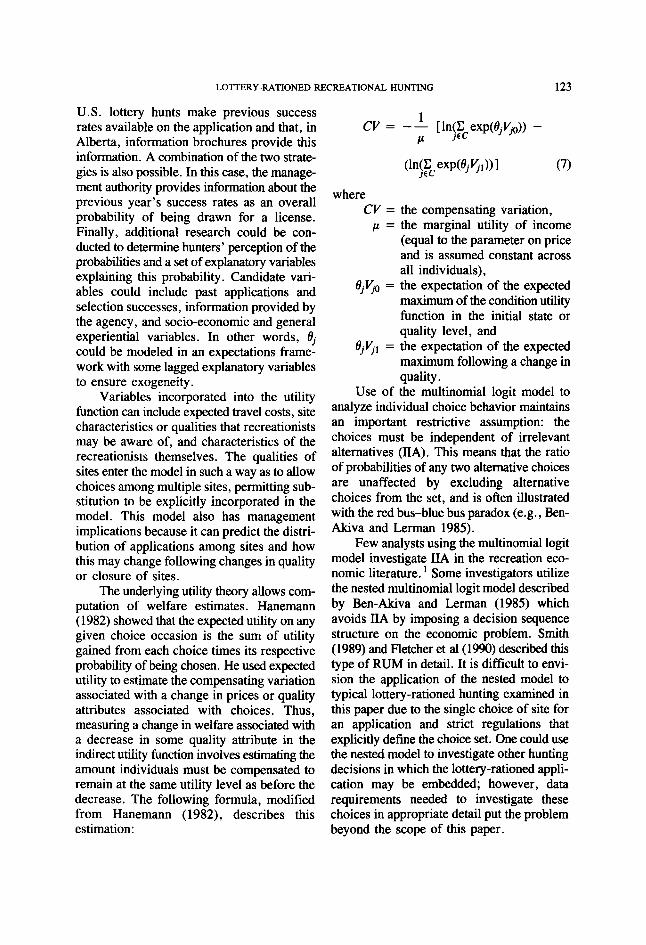
The underlying utility theory allows com- putation of welfare estimates. Hanemann (1982) showed that the expected utility on any given choice occasion is the sum of utility gained from each choice times its respective probability of being chosen. He used expected utility to estimate the compensating variation associated with a change in prices or quality attributes associated with choices. Thus, measuring a change in welfare associated with a decrease in some quality attribute in the indirect utility function involves estimating the amount individuals must be compensated to remain at the same utility level as before the decrease. The following formula, modified from Hanemann (1982), describes this estimation:
1 p
CV = -- [ln(E exp(O,Vfl)) -
(7)
where CV = the compensating variation,
p = the marginal utility of income (equal to the parameter on price and is assumed constant across all individuals),
d j q 0 = the expectation of the expected maximum of the condition utility function in the initial state or quality level, and
Ojq, = the expectation of the expected maximum following a change in quality.
Use of the multinomial logit model to analyze individual choice behavior maintains an important restrictive assumption: the choices must be independent of irrelevant alternatives (IIA). This means that the ratio of probabilities of any two alternative choices are unaffected by excluding alternative choices from the set, and is often illustrated with the red bus-blue bus paradox (e.g., Ben- Akiva and Lerman 1985).
Few analysts using the multinomial logit model investigate IIA in the recreation eco- nomic literature. Some investigators utilize the nested multinomial logit model described by Ben-Akiva and Lerman (1985) which avoids IIA by imposing a decision sequence structure on the economic problem. Smith (1989) and Fletcher et al(1990) described this type of RUM in detail. It is difficult to envi- sion the application of the nested model to typical lottery-rationed hunting examined in this paper due to the single choice of site for an application and strict regulations that explicitly define the choice set. One could use the nested model to investigate other hunting decisions in which the lottery-rationed appli- cation may be embedded; however, data requirements needed to investigate these choices in appropriate detail put the problem beyond the scope of this paper.
124 CANADIAN JOURNAL OF AGRICULTURAL ECONOMICS
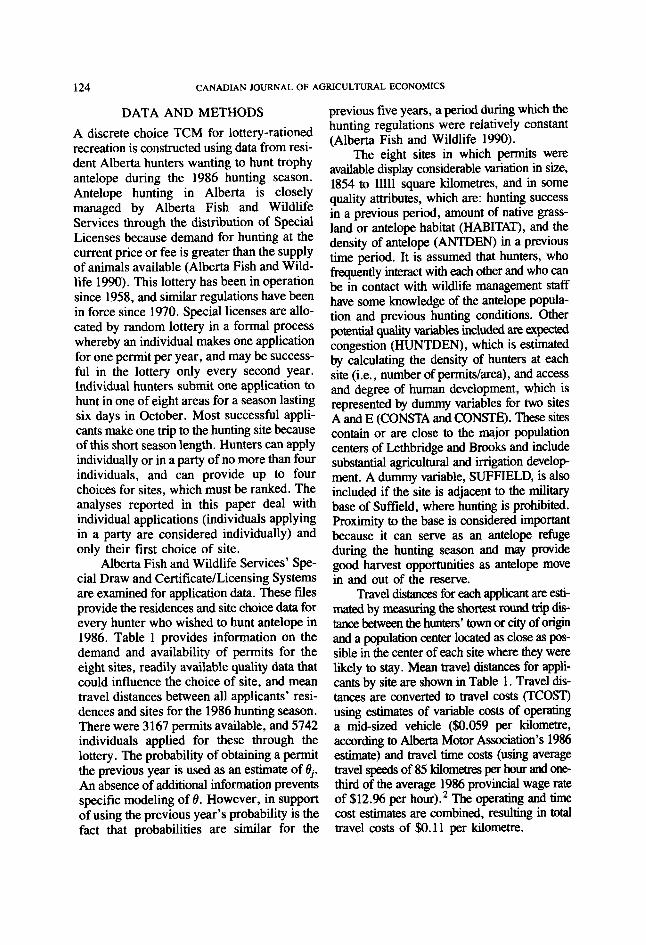
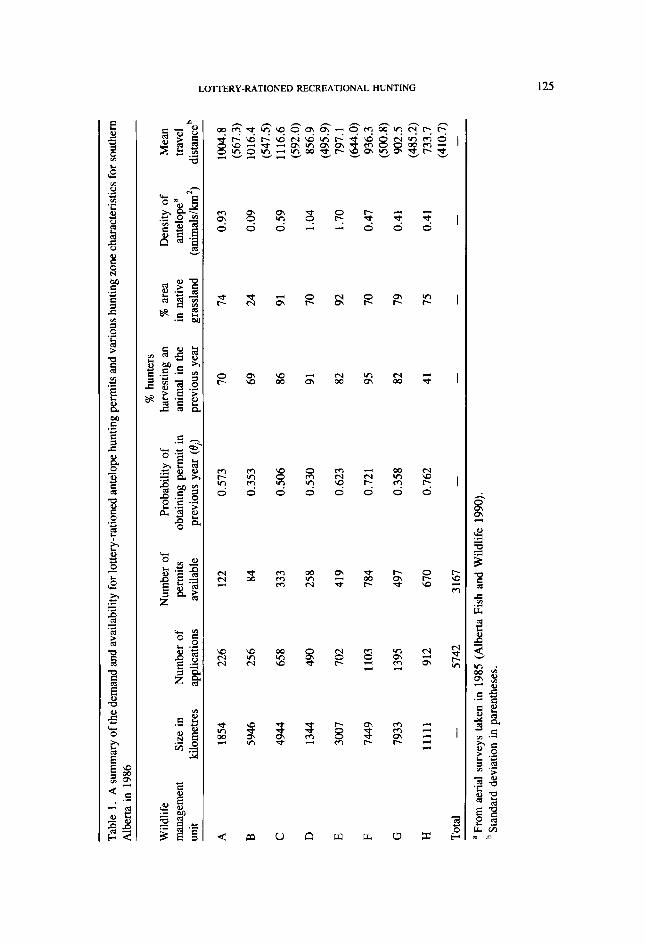
DATA AND METHODS A discrete choice TCM for lottery-rationed recreation is constructed using data from resi- dent Alberta hunters wanting to hunt trophy antelope during the 1986 hunting season. Antelope hunting in Alberta is closely managed by Alberta Fish and Wildlife Services through the distribution of Special Licenses because demand for hunting at the current price or fee is greater than the supply of animals available (Alberta Fish and Wild- life 1990). This lottery has been in operation since 1958, and similar regulations have been in force since 1970. Special licenses are allo- cated by random lottery in a formal process whereby an individual makes one application for one permit per year, and may be success- ful in the lottery only every second year. Individual hunters submit one application to hunt in one of eight areas for a season lasting six days in October. Most successful appli- cants make one mp to the hunting site because of this short season length. Hunters can apply individually or in a party of no more than four individuals, and can provide up to four choices for sites, which must be ranked. The analyses reported in this paper deal with individual applications (individuals applying in a party are considered individually) and only their first choice of site.
Alberta Fish and Wildlife Services’ Spe- cial Draw and Certificate/Licensing Systems are examined for application data. These files provide the residences and site choice data for every hunter who wished to hunt antelope in 1986. Table 1 provides information on the demand and availability of permits for the eight sites, readily available quality data that could influence the choice of site, and mean travel distances between all applicants’ resi- dences and sites for the 1986 hunting season. There were 3167 permits available, and 5742 individuals applied for these through the lottery. The probability of obtaining a permit the previous year is used as an estimate of (Ij. An absence of additional information prevents specific modeling of 8 . However, in support of using the previous year’s probability is the fact that probabilities are similar for the
previous five years, a period during which the hunting regulations were relatively constant (Alberta Fish and Wildlife 1990).
The eight sites in which permits were available display considerable variation in size, 1854 to lllll square Hometres, and in some quality attributes, which are: hunting success in a previous period, amount of native grass- land or antelope habitat (HABITAT), and the density of antelope (ANTDEN) in a previous time period. It is assumed that hunters, who frequently interact with each other and who can be in contact with wildlife management staff have some knowledge of the antelope popula- tion and previous hunting conditions. Other potential quality variables included are expected congestion (HUNTDEN), which is estimated by calculating the density of hunters at each site (i.e., number of permitdarea), and access and degree of human development, which is represented by dummy variables for two sites A and E (CONSTA and CONSTE). These sites contain or are close to the major population centers of Lethbridge and Brooks and include substantial agricultural and irrigation develop- ment. A dummy variable, SUFFIELD, is also included if the site is adjacent to the military base of Suffield, where hunting is prohibited. Proximity to the base is considered important because it can serve as an antelope refuge during the hunting season and may provide good harvest opportunities as antelope move in and out of the reserve.
Travel distances for each apphcant are esti- mated by measuring the shortest round trip dis- tance between the hunters’ town or city of origin and a population center located as close as pos- sible in the center of each site where they were likely to stay. Mean travel distances for appli- cants by site are shown in Table 1 . Travel dis- tances are converted to travel costs (TCOST) using estimates of variable costs of operating a mid-sized vehicle ($0.059 per kilometre, according to Alberta Motor Association’s 1986 estimate) and travel t h e costs (using average travel speeds of 85 kilometres per hour and one third of the average 1986 provincial wage rate of $12.% per hour).’ The operating and time cost estimates are combined, resulting in total travel costs of $0.11 per kilometre.
~ ~~
Tabl
e 1.
A su
mm
ary
of th
e dem
and
and
avai
labi
lity
for l
otte
ry-r
atio
ned
ante
lope
hun
ting
perm
its a
nd v
ario
us h
untin
g zo
ne c
hara
cter
istic
s for
sout
hern
Alberta
in 1
986
% h
unte
rs
Wild
life
Num
ber
of
Prob
abili
ty o
f ha
rves
ting
an
% a
rea
Den
sity
of
Mea
n m
anag
emen
t Si
ze in
N
umbe
r of
pe
rmits
ob
tain
ing
perm
it in
an
imal
in
the
in n
ativ
e an
telo
pea
trave
l un
it ki
lom
etre
s ap
plic
atio
ns
avai
labl
e pr
evio
us y
ear
(Oj)
prev
ious
yea
r gr
assl
and
(ani
mal
s/km
*)
dist
ance
b
A
1854
22
6 12
2 0.
573
70
74
0.93
10
04.8
9
(567
.3)
B 59
46
256
84
0.35
3 69
24
0.
09
1016
.4
5 (5
47.5
) 8
C
4944
65
8 33
3 0.
506
86
91
0.59
11
16.6
3 fil
(592
.0)
CI
D 13
44
490
258
0.53
0 91
70
1.
04
856.
9 (4
95.9
) E
E 30
07
702
419
0.62
3 82
92
1.
70
797.
1 5
F 74
49
1103
78
4 0.
721
95
70
0.47
93
6.3
F
G 79
33
1395
49
7 0.
358
82
79
0.41
90
2.5
5 - (644.0)
(500
.8)
c
(485
.2)
0
H
1111
1 91
2 67
0 0.
762
41
75
0.41
73
3.7
(410
.7)
Tota
l -
5742
31
67
-
-
-
-
-
aFro
m ae
rial
surv
eys
take
n in
198
5 (Alberta F
ish
and
Wild
life
1990
). St
anda
rd d
evia
tion
in p
aren
thes
es.
126 CANADIAN JOURNAL OF AGRICULTURAL ECONOMICS
Socio-economic data on applicants are limited because they are not collected through the application process. Average income for Alberta cities, towns and villages is available and is used as a proxy for the income levels of hunters.
Multinomial logit analyses are conducted using LIMDEP 6.0 software. The discrete choice form, or conditional logit analysis (McFadden 1973), is utilized. Using this procedure, the probability of an individual making an application to any of the eight sites is estimated as a function of site qualities, ej, the probability of selection the previous year, and socio-economic characteristics as explained above. A linear functional form is chosen, and various combinations of indepen- dent variables are examined. Collinearity is examined using correlation matrices. Statistical significance of coefficients is assessed by asymptotic f-tests. The specifica- tion of the model chosen for welfare analysis is based on results from log-likelihood ratio tests; the magnitude of p2, a statistic devel- oped by McFadden (1973), and is considered analogous to R2 in ordinary least squares3; and the ability of the model to predict the actual distribution of applications among the available sites using a x 2 test.
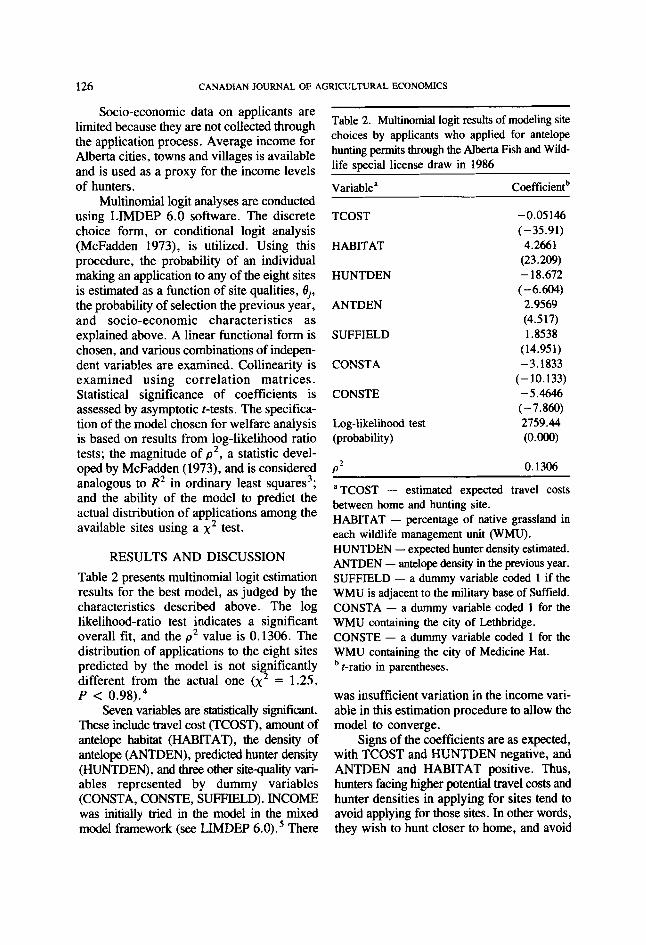
RESULTS AND DISCUSSION Table 2 presents multinomial logit estimation results for the best model, as judged by the characteristics described above. The log likelihood-ratio test indicates a significant overall fit, and the p2 value is 0.1306. The distribution of applications to the eight sites predicted by the model is not significantly different from the actual one (x2 = 1.25, P < 0.98).4
Seven variables are statistically sigdicant. These include travel cost (TCOST) , amount of antelope habitat (HAl3ITAT), the density of antelope (ANTDEN), predicted hunter density (HUNTDEN), and three other sitequality vari- ables represented by dummy variables (CONSTA, CONSTE, SUFFIELD). INCOME was initially tried in the model in the mixed model framework (see LIMDEP 6.0).5 There
Table 2. Multinomial logit results of modeling site choices by applicants who applied for antelope hunting permits through the Alberta Fish and Wild- life special license draw in 1986
Variablea Coefficient
TCOST
HABITAT
HUNTDEN
ANTDEN
SUFFIELD
CONSTA
CONSTE
Log-likelihood test (probability)
P2
-0.05146 (-35.91) 4.2661
(23.209) - 18.672 (-6.604) 2.9569 (4.517) 1.8538
(14.951) -3.1833
(- 10.133) -5.4646 (-7.860) 2759.44 (0.0W
0.1306
a TCOST - estimated expected travel costs between home and hunting site. HABITAT - percentage of native grassland in each wildlife management unit (WMU). HUNTDEN - expected hunter density estimated. ANTDEN - antelope density in the previous year. SUFFIELD - a dummy variable coded 1 if the WMU is adjacent to the military base of Suffield. CONSTA - a dummy variable coded 1 for the WMU containing the city of Lethbridge. CONSTE - a dummy variable coded 1 for the WMU containing the city of Medicine Hat.
t-ratio in parentheses.
was insufficient variation in the income vari- able in this estimation procedure to allow the model to converge.
Signs of the coefficients are as expected, with TCOST and HUNTDEN negative, and ANTDEN and HABITAT positive. Thus, hunters facing higher potential travel costs and hunter densities in applying for sites tend to avoid applying for those sites. In other words, they wish to hunt closer to home, and avoid
LO’ITERY-RATIONED RECREATIONAL HUNTING 127
areas where they face competition from other hunters. On the other hand, increased chances of seeing antelope and higher amounts of habitat have a positive influence on where they choose to apply for permits.
The site-specific dummy variables also perform as expected in the model. CONSTA and CONSTE, which represent high levels of human development, are negative, suggesting that hunters avoid applying to these sites. SUFFIELD, on the other hand, is positive, supporting the hypothesis that hunting close to the military base is attractive.
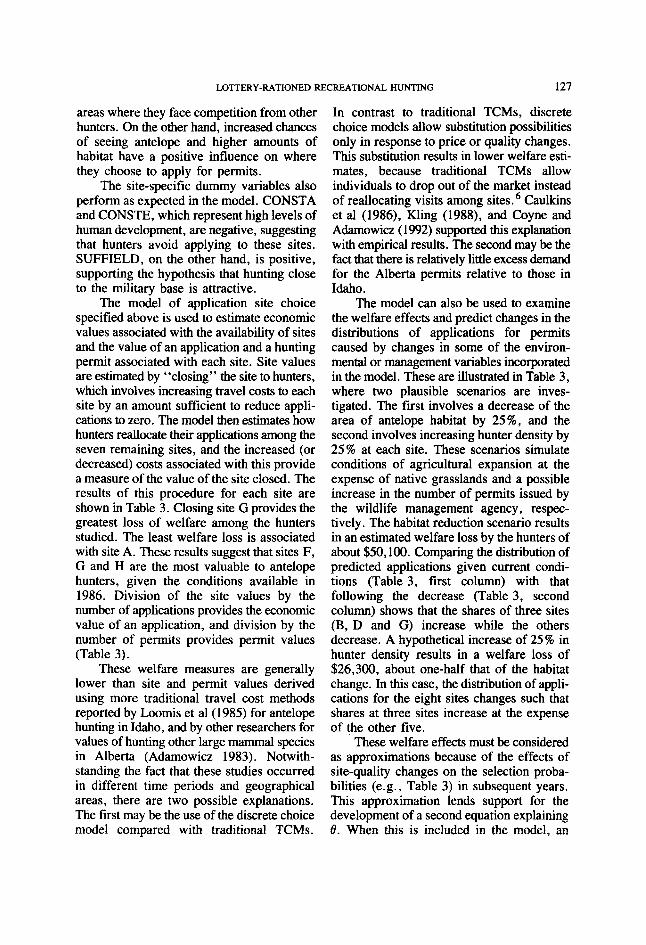
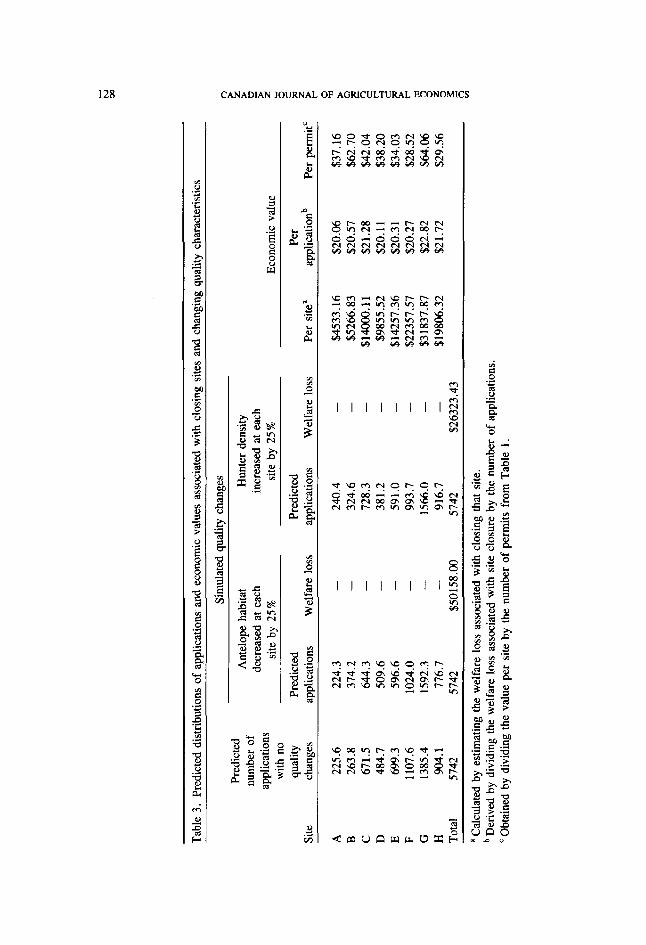
The model of application site choice specified above is used to estimate economic values associated with the availability of sites and the value of an application and a hunting permit associated with each site. Site values are estimated by “closing” the site to hunters, which involves increasing travel costs to each site by an amount sufficient to reduce appli- cations to zero. The model then estimates how hunters reallocate their applications among the seven remaining sites, and the increased (or decreased) costs associated with this provide a measure of the value of the site closed. The results of this procedure for each site are shown in Table 3. Closing site G provides the greatest loss of welfare among the hunters studied. The least welfare loss is associated with site A. These results suggest that sites F, G and H are the most valuable to antelope hunters, given the conditions available in 1986. Division of the site values by the number of applications provides the economic value of an application, and division by the number of permits provides permit values (Table 3).
These welfare measures are generally lower than site and permit values derived using more traditional travel cost methods reported by Loomis et a1 (1985) for antelope hunting in Idaho, and by other researchers for values of hunting other large mammal species in Alberta (Adamowicz 1983). Notwith- standing the fact that these studies occurred in different time periods and geographical areas, there are two possible explanations. “‘he first may be the use of the discrete choice model compared with traditional TCMs.
In contrast to traditional TCMs, discrete choice models allow substitution possibilities only in response to price or quality changes. This substitution results in lower welfare esti- mates, because traditional TCMs allow individuals to drop out of the market instead of reallocating visits among sites. Caulkins et a1 (1986), Kling (1988), and Coyne and Adamowicz (1992) supported this explanation with empirical results. The second may be the fact that there is relatively little excess demand for the Alberta permits relative to those in Idaho.
The model can also be used to examine the welfare effects and predict changes in the distributions of applications for permits caused by changes in some of the environ- mental or management variables incorporated in the model. These are illustrated in Table 3, where two plausible scenarios are inves- tigated. The first involves a decrease of the area of antelope habitat by 25%, and the second involves increasing hunter density by 25% at each site. These scenarios simulate conditions of agricultural expansion at the expense of native grasslands and a possible increase in the number of permits issued by the wildlife management agency, respec- tively. The habitat reduction scenario results in an estimated welfare loss by the hunters of about $50,100. Comparing the distribution of predicted applications given current condi- tions (Table 3, first column) with that following the decrease (Table 3, second column) shows that the shares of three sites (B, D and G) increase while the others decrease. A hypothetical increase of 25% in hunter density results in a welfare loss of $26,300, about one-half that of the habitat change. In this case, the distribution of appli- cations for the eight sites changes such that shares at three sites increase at the expense of the other five.
These welfare effects must be considered as approximations because of the effects of site-quality changes on the selection proba- bilities (e.g., Table 3) in subsequent years. This approximation lends support for the development of a second equation explaining 8. When this is included in the model, an
Tabl
e 3.
Pre
dict
ed d
istri
butio
ns o
f ap
plic
atio
ns and e
cono
mic
val
ues
asso
ciat
ed w
ith c
losi
ng s
ites
and
chan
ging
qua
lity
char
acte
ristic
s
Sim
ulat
ed q
ualit
y ch
ange
s 0
Ant
elop
e ha
bita
t H
unte
r de
nsity
>
>
z c3
Pred
icte
d nu
mbe
r of
appl
icat
ions
si
te b
y 25
%
site
by
25%
Ec
onom
ic v
alue
E
decr
ease
d at
eac
h in
crea
sed
at e
ach
with
no
E e s Si
te
chan
ges
appl
icat
ions
W
elfa
re l
oss
appl
icat
ions
W
elfa
re l
oss
Per
site
a ap
plic
atio
nb
Per
perm
it'
g 8
qual
ity
Pred
icte
d Pr
edic
ted
Per
A
225.
6 22
4.3
-
240.
4 -
$453
3.16
$2
0.06
$3
7.16
>
B 26
3.8
374.
2 -
324.
6 -
$526
6.83
$2
0.57
$6
2.70
c,
D
484.
7 50
9.6
-
381.
2 -
$985
5.52
$2
0.11
$3
8.20
2
E 69
9.3
596.
6 -
591 .
O -
$142
57.3
6 $2
0.31
$3
4.03
g
F 11
07.6
10
24.0
-
993.
7 -
$223
57.5
7 $2
0.27
$2
8.52
F
G
13
85.4
15
92.3
-
1566
.0
-
$318
37.8
7 $2
2.82
$6
4.06
w 2
$198
06.3
2 $2
1.72
$2
9.56
0
H
904.
1 77
6.7
-
916.
7 -
Tota
l 57
42
5742
$5
0158
.00
5742
$2
6323
.43
s ti
C
671.
5 64
4.3
-
728.
3 -
$14O
Oo.
11
$21.
28
$42.
04
5
a C
alcu
late
d by
est
imat
ing
the
wel
fare
loss
ass
ocia
ted
with
clo
sing
that
site
. D
eriv
ed b
y di
vidi
ng th
e w
elfa
re lo
ss a
ssoc
iate
d w
ith s
ite c
losu
re b
y th
e number o
f ap
plic
atio
ns.
Obt
aine
d by
div
idin
g th
e va
lue
per
site
by
the
num
ber
of p
erm
its f
rom
Tab
le 1
.
LOTTERY-RATIONED RECREATIONAL HUNTING 129
overall equilibrium should be maintained following site-quality changes, resulting in a more accurate assessment of welfare changes.
CONCLUSION Original research on the problem of estimating the value of lottery-rationed recrea- tional hunting suggests that the traditional TCM can be modified to examine these values (Loomis 1982a 1982b; Loomis et a1 1985). This paper reexamines this problem in a random utility framework incorporating the expectation of receiving a permit. The model developed in this paper involves the use of an individual-level discrete choice travel cost model instead of the traditional zonal travel cost model originally proposed. This par- ticular type of travel cost model better represents the behavioral process underlying applying for lottery-rationed hunting permits because each individual can make only one choice of a site for future recreational hunting trips. In the example used in this paper, an individual applies for a permit that allows hunting during a six-day period in one site defined under a specific management regime. The proposed model thus works well at estimating nonmarket economic values associated with this activity, since most individuals take one trip to one site during a season for this activity.
The model is developed for lottery- rationed antelope hunting in Alberta using data containing information from all hunters who applied in a given year. The resulting model predicts a distribution of applications among eight possible sites that is not statisti- cally different from the actual one. It incor- porates a number of site-quality variables such as amount of antelope habitat, expected hunter densities, and expected harvest success. Eco- nomic values are estimated for permits, appli- cations, sites, and the effects of changes in two of the site-quality variables.
Future research in lottery-rationed demand should focus on the expectation of selection in the 1ottery.While the travel cost model presented here is more consistent with the behavioral aspects of the recreational
activity than previous models, the dynamic nature of the selection probabilities may have substantial impacts on welfare effects associated with quality changes. Attempts to explore recreation choices and welfare impacts of quality changes over multiple time periods are limited at present. Recent research efforts by Adamowicz (1994) and Hellerstein (1993), however, suggest that economists are not far from including dynamic features in models of recreation demand.
NOTES ‘Specific tests for IIA have been developed by McFadden et a1 (1977) and Hausman and McFadden (1984). These tests compared the parameters from a multinomial logit model using the full choice set with those derived from a model using the choice set with one or more alternatives removed. The intuition behind the tests is that the model is correctly specified if the coefficient esti- mates from the two models are consistent. ’Travel time costs are an issue in travel cost models (see Fletcher et al 1990). One-third of the wage rate is commonly chosen as the standard, based on the work of Cesario (1976) and others. In this study, the wage rate is calculated from infor- mation obtained from the Alberta Department of Labour. In 1986, the average salaried employee earned $15.01 per hour, and the average non- salaried wage was $10.81 per hour. The mean of these two wage rates is used. A sensitivity analysis of the fraction and the estimate of the wage rate is not performed in order not to detract from the main purpose of the paper. 3This statistic is calculated: 1 - [C(C)/S(O)] where C(0) is the log-likelihood evaluated at coefficients = 0, and C(C) is the log-likelihood evaluated at convergence. Thus p2 appraises the proportion of the initial log-likelihood explained by the model. ?he model is examined for IIA by estimating additional models with the choice set reduced by various choice alternatives and comparing the model with the full choice set model using Hausman and McFadden’s (1984) test. I could not assume IL4 in a few comparisons. In these few comparisons, the coefficients from the full and reduced choice set models are similar; inspection of coefficients’ 95 % confidence intervals show considerable overlap, suggesting the models are identical sta- tistically. A possibility is that the IIA test may not be powerful enough to examine IIA in all
130 CANADIAN JOURNAL OF AGRICULTURAL ECONOMICS
circumstances, which may explain why other researchers rarely report IIA tests in the TCM literature. The lack of IIA suggests that individuals may view two or more choice alternatives as one alternative. But since lottery-rationed hunting choice sets are usually well-known by the hunters, and are defined as discrete sites by regulation, this possibility is problematic in this study. I chose not to modify the choice set because of the question- able results with the IIA test, and because of the fact that any corrective actions such as the use of nested logit models may impose incorrect behavioral assumptions on the hunters that may be as bad or worse than any caused by the lack of IIA. 5The mixed-model framework incorporates choice-specific variables, such as HUNTDEN in this study, with individual-specific variables such as sex, age or income. The problem with con- sidering the individual characteristics in the con- ditional logit model is that they are the same for each possible choice faced by an individual. This typically results in the model not converging in the estimation procedure due to a singular Hessian. 6While hunter numbers are on the decline in Alberta (Boxall et al 1991), research suggests that the decline is due largely to declines in waterfowl hunting (Boxall and Smith 1986), which is not a lottery-rationed activity. Big game hunting, par- ticularly among those interested in hunting unique species such as antelope, seems to be a traditional activity for many participants. This suggests that substitution rather than exit may be a more likely response to price and/or quality changes.
ACKNOWLEDGMENT This research was supported by the Canadian Forest Service’s Science and Technology Oppor- tunities Fund. I thank Anita Duarte-Pedrosa, Laverne Smith and Corinne Knopf for assistance with this research and Drs. W. Adamowicz, J . Englin, J. Loomis and E. Wilman for com- menting on preliminary drafts of the manuscript.
REFERENCES Adamowicz, W. L. 1983. Economic analysis of hunting big game species in the eastern slopes of Alberta. MSc thesis. Edmonton: University of Alberta. Adamowicz, W. L. 1994. Habit formation and variety seeking in a discrete choice model of recreation demand. Journal of Agricultural and Resource Economics 19: 19-31. Alberta Fish and Wildlife Division. Management plan for pronghorn antelope in Alberta.
Wildlife Management Planning Series 3. Fish and Wildlife Division, Forestry Lands and Wildlife, Edmonton, Alberta. Ben-Akiva, M. and S. Lerman. 1985. Discrete Choice Analysis: lkeory and Application to Travel Demand. Cambridge: Massachusettes Institute of Technology Press. Bockstael, N. S., K. E. McCoMeU and I. E. Strand. 1989. A random utility model for sports- fishing: Some preliminary results for Florida. Marine Resource Economics 6: 245-60. Boxall, P. C., E. DuWors and F. L. Filion. 1991. Trends and factors influencing participation in recreational hunting in Canada: A dynamic model. In Transactions of the XXth Congress of the Inter- national Union of Game Biologists, edited by S. Cysanyi and J. Emhaft, pp. 658-69. Godollo, Hungary: University of Agricultural Sciences. Boxall, P. C. and L. C. Smith. 1986. Charac- teristics of Alberta’s hunters. Occasional Paper 1, Resource Economics and Assessment, Alberta Fish and Wildlife Division, Edmonton, Alberta. Caulkins, P., R. Bishop and N. Bouwes. 1986. The travel cost model for lake recreation: A com- parison of two methods for incorporating site quality and substitution effects. American Journal of Agricultural Economics 68: 291-97. Cesario, F. J. 1976. Value of time in recreation benefit studies. Land Economics 52: 32-41. Coyne, A. G. and W. L. Adamowicz. 1992. Modeling choice of site for hunting bighorn sheep. Wildlife Society Bulletin 20: 26-33. Dwyer, J. F., J. R. Kelly and M. D. Bowes. 1977. Improved procedures for valuation of the contribution of recreation to national economic development. Research Report 128. Urbana- Champaign: University of Illinois, Water Resources Center. Fletcher, J. J., W. L. Adamowicz and T. Graham-Tomasi. 1990. The travel cost model of recreation demand: Theoretical and empirical issues. Leisure Sciences 12: 119-47. Hanemann, W. M. 1982. Applied welfare anal- ysis with qualitative response models. Working Paper 241. Berkeley: University of California. Hausman, J. and D. McFadden. 1984. Specifi- cation tests for the multinomial logit model. Econometrica 52: 1219-40. Hellerstein, D. 1991. Using count data models in travel cost analysis with aggregate data. American Journal of Agricultural Economics 73: 860-67. HeUerstein, D. 1993. Intertemporal data and travel cost analysis. Environmental and Resource ECO- nomics 3: 193-207.
LOTTERY-RATIONED RECREATIONAL HUNTING 131
Kling, C. L. 1988. Comparing welfare estimates of environmental quality changes from recreation demand models. Journal of Environmental Eco- nomics and Management 15: 331-40. Loomis, J. B. 1980. Monetizing the benefits under alternative river recreation use allocation systems. Water Resources Research 16: 28-32. Loomis, J. B. 1982a. Use of travel cost models for evaluating lottery rationed recreation: Appli- cation to big game hunting. Journal of Leisure Research 14: 117-24. Loomis, J. B. 198213. Effect of nonprice rationing on benefit estimates from publicly provided recre- ation. Journal of Environmental Management
Loomis, J. B., D. M. Donnelly, C. F. Sorg and L. Oldenburg. 1985. Net economic value of hunting unique species in Idaho: Bighorn sheep, mountain goat, moose, and antelope. USDA Forest Service Resource Bulletin RM-109. Fort Collins: Rocky Mountain Forest and Range Experiment Station. Maddala, F. S. 1983. Limited-dependent and Qualitative Variables in Econometrics. New York: Cambridge University Press. McConnell, K. E. 1985. The economics of out- door recreation. Chap. 15 in Handbook ofNatural Resource and Energy Economics: Vol. II , edited by A. V. Kneese and J. L. Sweeney. New York: North Holland Press. McFadden, D. 1973. Conditional logit analysis of qualitative choice behavior. In Frontiers in Econometrics, edited by P. Zarembka. New York: Academic Press.
14: 283-89.
McFadden, D., W. Tye and K. Train. 1977. An application of diagnostic tests for the irrelevant alter- natives property of the multinomial logit model. Transportation Research Record 637: 39-46. Mitchell, R. C. and R. T. Carson. 1989. Using Surgveys to Value Public Goods: The Contingent Valuation Method. Washington, DC: Resources for the Future. Mullen, J. K. and F. C. Menz. 1985. The effects of acidification damages on the economic value of the Adirondack fishery to New York anglers. American Journal of Agricultural Economics
Mumy, G . and S. Hanke. 1975. Public invest- ment criteria for underpriced public products. American Economic Review 65: 712-19. Nickerson, P. H. 1990. Demand for the regula- tion of recreation: The case of elk and deer hunting in Washington State. Land Economics 66: 437-47. Rosenthal, D. H., J. B. Loomis and G. L. Peterson. 1984. The travel cost model: Concepts and applications. USDA Forest Service General Technical Report RM-109. Fort Collins: Rocky Mountain Forest and Range Experiment Station. Smith, V. K. 1989. Taking stock of progress with travel cost recreation demand models: Theory and implementation. Marine Resource Economics 6:
Sutherland, R. J. 1982. The sensitivity of travel cost estimates of recreation demand to functional form and definition of origin zones. Western Journal of Agricultural Economics 7: 87-98.
67: 112-19.
279-3 10.