Embed Size (px)
Citation preview
The economics of ecosysTems anD BioDiversiTyfor WaTer anD WeTlanDs
TeeB for WaTer anD WeTlanDs
The Institute for European Environmental Policy (IEEP) is an independent not-for-profit institute. Based in London and Brussels, the Institute’s major focus is the development, implementation and evaluation of policies of environmental significance, with a focus both on Europe and the global dimension. www.ieep.eu.
The Convention on Wetlands of International Importance, called the Ramsar Convention, is an intergovernmental treaty that provides the framework for national action and inter-national cooperation for the conservation and wise use of wetlands and their resources.
Paper citation: Russi D., ten Brink P., Farmer A., Badura T., Coates D., Förster J., Kumar R. and Davidson N. (2013) The Economics of Ecosystems and Biodiversity for Water and Wetlands. IEEP, London and Brussels; Ramsar Secretariat, Gland.
Authors: Daniela Russi, Patrick ten Brink, Andrew Farmer and Tomas Badura (Institute for European Environmental Policy - IEEP), David Coates (CBD Secretariat), Johannes Förster (UFZ), Ritesh Kumar (WI) and Nick Davidson (Ramsar Secretariat)
TEEB Water and Wetlands core team: Patrick ten Brink, Andrew Farmer and Daniela Russi (IEEP), Nicolas Bertrand (UNEP), David Coates (CBD Secretariat), Nick Davidson & Claudia Fenerol (Ramsar Secretariat), Johannes Förster (UFZ), Ritesh Kumar (Wetlands International), and Mark Smith (IUCN).
Acknowledgements: The development of this report has been initiated by the Ramsar Convention Secretariat, with financial support from the Norwegian, Swiss and Finnish Governments and the International Union for Conservation of Nature (IUCN). We would like to thank the following for valuable inputs, review and suggestions – Maja Stade Aarønæs, Sasha Alexander, Solange Ashu, Edward Barbier, Katrien Van der Biest, James Blignaut, Andrew Bovarnick, Luke Brander, Rebecca Benner, Alejandro Calvache, Ioli Christopoulou, Lucy Emerton, Philine zu Ermgassen,
Rudolf de Groot, Dorethee Herr, Jan Petter Huberth Hansen, Ian Harrison, Miroslav Honzak, Hiroe Ishihara, Finn Katerås, Marianne Kettunen, Georgina Langdale, Karin Lexén, Brian Loo, Sarah Mack, Leonardo Mazza, Michelle Molnar, Andreas Obrecht, Hugh Robertson, Elisabeth Schlaudt, Tone Solhaug, Andrew Seidl, Graham Tucker, Heidi Wittmer and the TEEB Coordination Group and Advisory Board.
We are very grateful to the many individuals who submitted case examples, helping to identify a wide range of values and responses to these values from across the globe. The report also benefited from fruitful discussions in the margins of the United Nations Conference on Sustainable Development 2012 (Rio+20), the eleventh meeting of the Conference of the Parties to the Ramsar Convention on Wetlands in July 2012, and the eleventh meeting of the Conference of the Parties to the Convention on Biological Diversity (CBD) in October 2012.
Standard disclaimer: The contents and views contained in this report are those of the authors, and do not necessarily represent those of any of the contributors, reviewers or organisations supporting this work.
Cover photo: enviromantic.
Design and layout: 100WATT.
Copyright © Institute for European Environmental Policy (IEEP) & Ramsar Secretariat, 2013 TEEB is hosted by the United Nations Environment Programme and supported by the following donors. Website: www.teebweb.org
TeeB for WaTer anD WeTlanDs1
The “nexus” between water, food and energy is one of the most fundamental relationships and challenges for society. The importance of this nexus was re-emphasised at the UN Conference on Sustainable Development (Rio+20) in June 2012. The outcome document adopted at Rio+20 “The Future We Want” noted: “We recognize the key role that ecosystems play in maintaining water quantity and quality and support actions within respective national boundaries to protect and sustainably manage these ecosystems” UNCSD (2012, para 122). Wetlands are a fundamental part of local and global water cycles and are at the heart of this nexus. We also expect wetlands to be key to meeting the Millennium Development Goals (MDGs) and the future Sustainable Development Goals (SDGs).
Wetlands are essential in providing water-related ecosystem services, such as clean water for drinking, water for agriculture, cooling water for the energy sector and regulating water quantity (e.g. flood regulation). In conjunction with their role in erosion control and sediment transport, wetlands also contribute to land formation and therefore resilience to storms. Moreover, they provide a wide range of services that are dependent on water, such as agricultural production, fisheries and tourism.
Notwithstanding the high value of the ecosystem services that wetlands provide to humankind, wetlands continue to be degraded or lost due to the effects of intensive agricultural production, irrigation, water extraction for domestic and industrial use, urbanisation, infrastructure and industrial development and pollution. In many cases, policies and decisions do not take into
account these interconnections and interdependencies sufficiently. However, the full value of water and wetlands needs to be recognised and integrated into decision-making in order to meet our future social, economic and environmental needs. Using the maintenance and enhancement of the benefits of water and wetlands is, therefore, a key element in a transition to a green economy.
We thank the Norwegian, Swiss and Finnish Governments for their support of this initiative and welcome this publication, produced by The Ramsar Convention on Wetlands, the Convention on Biological Diversity (CBD), the Institute for European Environmental Policy (IEEP), the International Union for Conservation of Nature (IUCN), the Helmholtz Centre for Environmental Research (UFZ) and Wetlands International. It is an invaluable reminder of the key role that wetlands, some of the most biodiverse regions on our planet, play in our societies and economies.
Anada Tiéga Secretary General, Ramsar Convention on Wetlands
Braulio F. de Souza Dias Executive Secretary, Convention on Biological Diversity
Pavan Sukhdev Chair of the TEEB Advisory Board
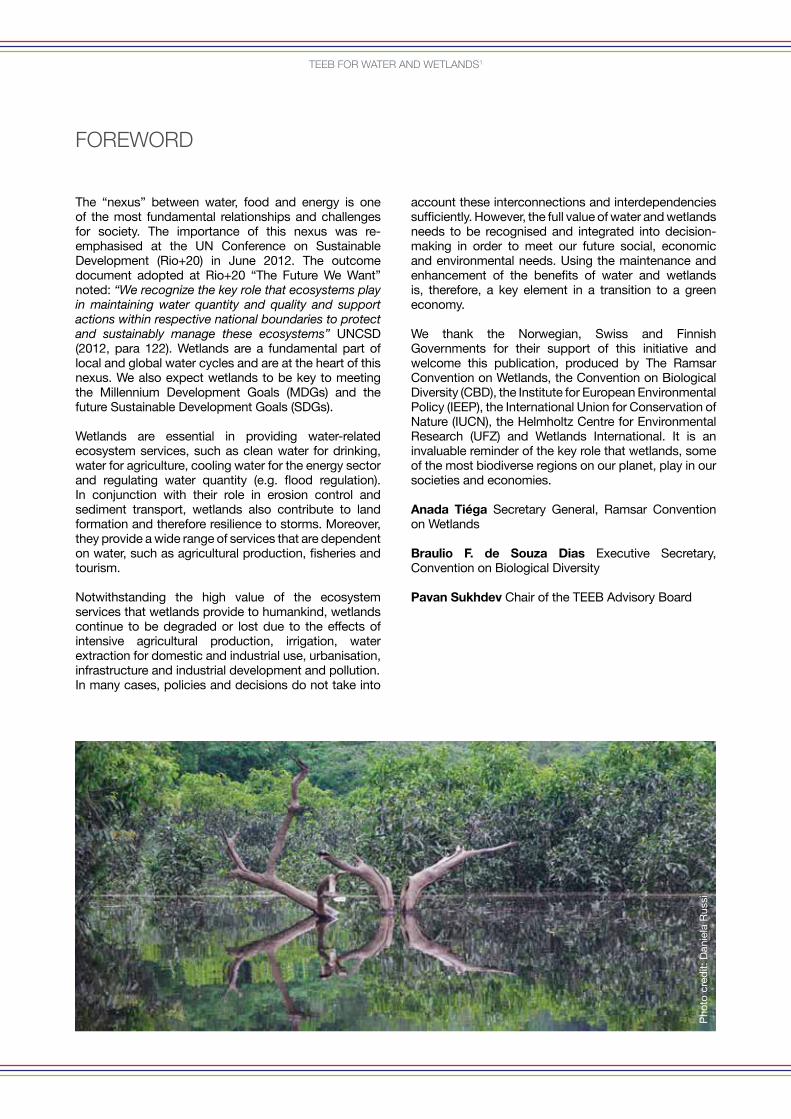
foreWorD
Pho
to c
red
it: D
anie
la R
ussi
TeeB for WaTer anD WeTlanDs
1. The “nexus” between water, food and energy is one of the most fundamental relationships - and increasing challenges - for society.
2. Water security is a major and increasing concern in many parts of the world, including both the availability (including extreme events) and quality of water.
3. Global and local water cycle are strongly dependent on wetlands.
4. Without wetlands, the water cycle, carbon cycle and nutrient cycle would be significantly altered, mostly detrimentally. Yet policies and decisions do not sufficiently take into account these interconnections and interdependencies.
5. Wetlands are solutions to water security – they provide multiple ecosystem services supporting water security as well as offering many other benefits and values to society and the economy.
6. Values of both coastal and inland wetland ecosystem services are typically higher than for other ecosystem types.
7. Wetlands provide natural infrastructure that can help meet a range of policy objectives. Beyond water availability and quality, they are invaluable in supporting climate change mitigation and adaption, support health as well as livelihoods, local development and poverty eradication.
8. Maintaining and restoring wetlands in many cases also lead to cost savings when compared to man-made infrastructure solutions.
9. Despite their values and despite the potential policy synergies, wetlands have been, and continue to be, lost or degraded. This leads to biodiversity loss - as wetlands are some of the most biodiverse areas in the world, providing essential habitats for many species - and a loss of ecosystem services.
10. Wetland loss can lead to significant losses of human wellbeing, and have negative economic impacts on communities, countries and business, for example through exacerbating water security problems.
11. Wetlands and water-related ecosystem services need to become an integral part of water management in order to make the transition to a resource efficient, sustainable economy.
12. Action at all levels and by all stakeholders is needed if the opportunities and benefits of working with water and wetlands are to be fully realised and the consequences of continuing wetland loss appreciated and acted upon.
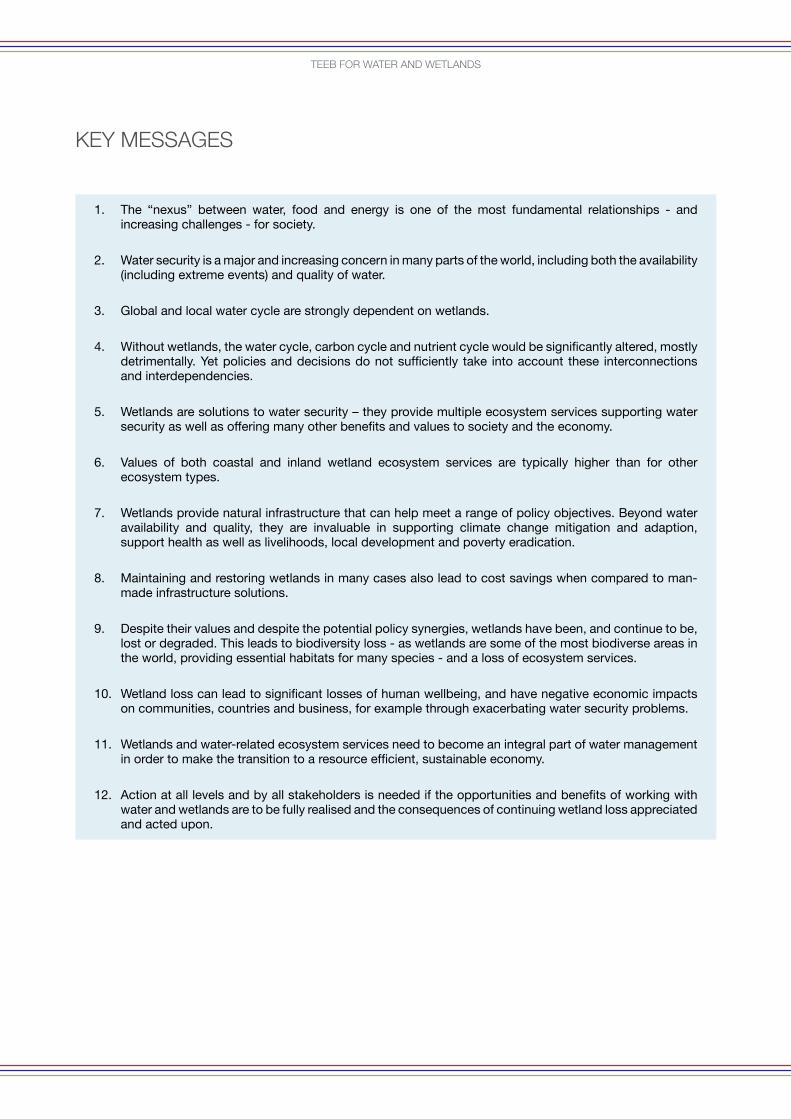
Key messages
TeeB for WaTer anD WeTlanDs1
1. InTroDucTIon ............................................................................................................................................. 01
2. THE IMPorTAncE oF WATEr AnD WETLAnDS ....................................................................................... 05 2.1. The water cycle and wetlands .................................................................................................................. 05
2.2. The values of water and wetlands ............................................................................................................ 07 2.3. Status and trends of water and wetlands ................................................................................................. 14 2.4. The economic benefits of restoring degraded wetlands .......................................................................... 16
3. IMProVInG MEASurEMEnT AnD ASSESSMEnT For BETTEr GoVErnAncE .................................. 19 3.1. Introduction ............................................................................................................................................... 19 3.2. Indicators .................................................................................................................................................. 21 3.3. Geospatial mapping .................................................................................................................................. 24 3.4. Monetary valuation ................................................................................................................................... 26 3.5. Environmental accounting ........................................................................................................................ 28 3.6. Gaps and needs ........................................................................................................................................ 30 3.7. A practical stepwise approach to assessing the values ........................................................................... 31
4. InTEGrATInG THE VALuE oF WATEr AnD WETLAnDS InTo DEcISIon-MAKInG .............................. 35 4.1. Introduction ............................................................................................................................................... 35 4.2. Wetlands and integrated water resources management .......................................................................... 35 4.3. Improving site management ..................................................................................................................... 38 4.4. Regulation and land use planning ............................................................................................................ 38 4.5. Property rights and improving the distribution of costs and benefits ....................................................... 39 4.6. Using market-based instruments to protect water and wetland ecosystem services.............................. 40
5. TrAnSForMInG THE MAnAGEMEnT APProAcH To WATEr AnD WETLAnDS ................................. 47 5.1. Introduction ................................................................................................................................................ 47 5.2. Restoration................................................................................................................................................ 47 5.3. Traditional practices and local knowledge ................................................................................................ 51 5.4. Sustainaible tourism ................................................................................................................................. 51 5.5. Synergies between wetland restoration/conservation and poverty alleviation ......................................... 53 5.6. Transition management............................................................................................................................. 53 5.7. Conclusions: water and wetlands as a solution ....................................................................................... 56
Annex I. case study example applying the six steps ......................................................................................... 59
Annex II. The evidence base on the values of wetlands .................................................................................... 62
rEFErEncES ........................................................................................................................................................ 72
TaBle of conTenTs
Pho
to c
red
it: N
ick
Dav
idso
n
TeeB for WaTer anD WeTlanDs
01
TEEB context
The Economics of Ecosystems and Biodiversity (TEEB) is an international initiative to draw attention to the benefits of biodiversity. It focuses on the values of biodiversity and ecosystem services, the growing costs of biodiversity loss and ecosystem degradation, and the benefits of action addressing these pressures. The TEEB initiative has brought together over five hundred authors and reviewers from across the continents in the fields of science, economics and policy.
Ecosystem services are the benefits that people, society and the economy receive from nature. For example: water provision and purification, flood and storm control, carbon storage and climate regulation, food and materials provision, scientific knowledge, recreation and tourism (MA, 2005a; TEEB, 2010; TEEB, 2011; see also Chapter 2). The TEEB initiative has demonstrated the usefulness of presenting evidence on the values of nature and targeting the messages to different audiences. Understanding and communicating the economic, social and cultural value of ecosystem services (many of which nature provides for “free”) is crucial to fostering better management, conservation and restoration practices.
TEEB Water and Wetlands
This TEEB for Water and Wetlands report underlines the fundamental importance of wetlands in the water cycle and in addressing water objectives reflected in the Rio+20 agreement, the Millennium Development Goals and forthcoming post 2015 Sustainable Development Goals. The report presents insights on both critical water-related ecosystem services and also on the wider ecosystem services from wetlands, in order to encourage additional policy momentum, business commitment, and investment in the conservation, restoration, and wise use of wetlands.
The coverage of different types of wetlands in this report follows the definition adopted in the text of the Ramsar Convention on Wetlands (see Box 1.1), so it includes both inland and coastal (near-shore marine) wetlands. The Ramsar Convention on Wetlands is the multilateral environment agreement that embodies the commitments of its 163 Contracting Parties to maintain the ecological character of their Wetlands of International Importance and to plan for the “wise” (or sustainable) use of wetlands in their territories (see Box 1.3).
TEEB Water and Wetlands aims to show how recognizing, demonstrating, and capturing the values of ecosystem services related to water and wetlands can lead to better informed, more efficient, and fairer decision making. Appreciating the values of wetlands
to both society and the economy can help inform and facilitate political commitment to policy solutions.
TEEB Water and Wetlands is about the “water - wetlands - ecosystem services” interface – it concerns the importance of water and its role in underpinning all ecosystem services and the fundamental role of wetlands in global and local water cycles. It is about
1 inTroDUcTion
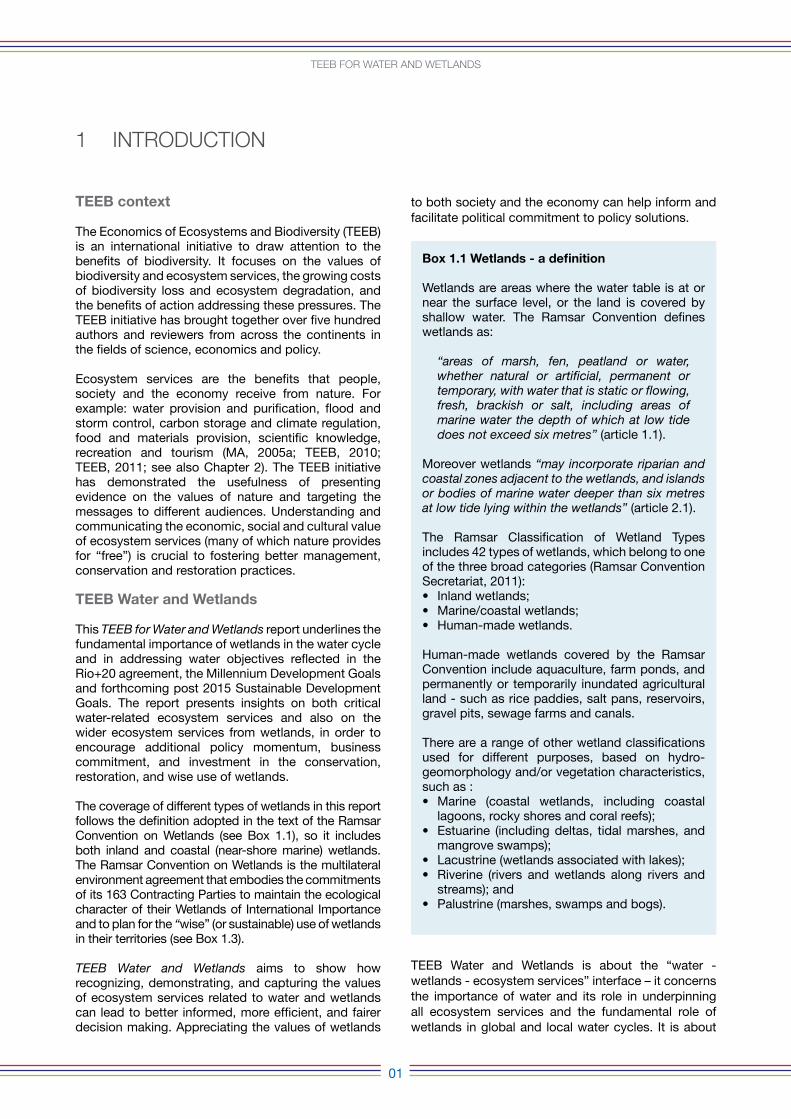
Box 1.1 Wetlands - a definition
Wetlands are areas where the water table is at or near the surface level, or the land is covered by shallow water. The Ramsar Convention defines wetlands as:
“areas of marsh, fen, peatland or water, whether natural or artificial, permanent or temporary, with water that is static or flowing, fresh, brackish or salt, including areas of marine water the depth of which at low tide does not exceed six metres” (article 1.1).
Moreover wetlands “may incorporate riparian and coastal zones adjacent to the wetlands, and islands or bodies of marine water deeper than six metres at low tide lying within the wetlands” (article 2.1).
The Ramsar Classification of Wetland Types includes 42 types of wetlands, which belong to one of the three broad categories (Ramsar Convention Secretariat, 2011):• Inland wetlands;• Marine/coastal wetlands;• Human-made wetlands.
Human-made wetlands covered by the Ramsar Convention include aquaculture, farm ponds, and permanently or temporarily inundated agricultural land - such as rice paddies, salt pans, reservoirs, gravel pits, sewage farms and canals.
There are a range of other wetland classifications used for different purposes, based on hydro-geomorphology and/or vegetation characteristics, such as : • Marine (coastal wetlands, including coastal
lagoons, rocky shores and coral reefs);• Estuarine (including deltas, tidal marshes, and
mangrove swamps);• Lacustrine (wetlands associated with lakes);• Riverine (rivers and wetlands along rivers and
streams); and• Palustrine (marshes, swamps and bogs).
the “values” of the ecosystem services provided by water and wetlands, which can be expressed in a number of ways and methods. In some cases, the values of biodiversity and ecosystems can be presented qualitatively (e.g. which cities benefit from which wetland for water purification or flood control). In other cases, they can be in quantitative terms (e.g. the number of people benefitting from clean water) and in others, when appropriate, in monetary terms (e.g. the monetary value of sequestered carbon, avoided costs of water pre-treatment and supply, or avoided costs of potential flood damage).
This report aims to support evidence-based decision making by presenting an array of ecosystem service values in varying contexts.
Box 1.2 Intergovernmental agreements and initiatives concerning water and wetlands
Concerns in the 1960s over the loss and deterioration of wetlands and its impact on people and nature is what led to the first of the modern global intergovernmental environmental agreements (MEAs), the Convention on Wetlands – established in February 1971 in the town of Ramsar in the Islamic Republic of Iran and hence known as the “Ramsar Convention”. The now 163 Contracting Parties (member states) to the Convention commit to the “Conservation and wise use of all wetlands through local and national actions and international cooperation, as a contribution towards achieving sustainable development throughout the world.” The Convention’s Strategic Plan recognises that to achieve this “… it is essential that the vital ecosystem services, and especially those related to water and those that wetlands provide to people and nature through their natural infrastructure, are fully recognized, maintained, restored and wisely used” (COP11 Resolution XI.3, 2012).
The Convention covers all types of wetland from the mountains to the sea, including inland wetlands (both open water and vegetated), coastal and near-shore marine wetlands (e.g. coral reefs, mangroves, and tidal estuaries and marshes) and human-made wetlands (e.g. rice paddy, fish-ponds and reservoirs).
There are three main pillars of Convention implementation: i. The wise use of all wetlands; ii. The designation and management of Wetlands of International Importance (Ramsar Sites); and iii. International Cooperation – including for transboundary wetlands and river basins, and migratory wetland-dependent species, notably waterbirds.
There are also key links between the water and wetlands agenda of Ramsar and CBD and those
of other MEAs, notably with the UN Convention to Combat Desertification (UNCCD) concerning the key role of wetlands and water management in drylands; the Convention on Migratory Species (CMS) concerning key site networks for migratory wetland-dependent species; and the UN Framework Convention on Climate Change (UNFCCC), concerning wetlands as natural water infrastructure for nature-based adaptation to climate change and in view of their equally important role in mitigating impacts of greenhouse gas emissions.
Two other MEAs focus specifically on transboundary water management issues: the 1992 UNECE Convention on the Protection and Use of Transboundary Watercourses and International Lakes (Water Convention)1 is intended to strengthen national measures for the protection and ecologically sound management of transboundary surface waters and groundwaters. The Global Programme of Action for the Protection of the Marine Environment from Land-based Activities (GPA) was adopted by the international community in 1995 and “aims at preventing the degradation of the marine environment from land-based activities by facilitating the realization of the duty of States to preserve and protect the marine environment”. It is the only global initiative directly addressing the connectivity between terrestrial, freshwater, coastal and marine ecosystems.
Box 1.3 “Wise use” of Wetlands
The “wise use” concept adopted by the Ramsar Convention’s Contracting Parties is widely recognised as the longest established example amongst intergovernmental processes of the implementation of ecosystem-based landscape-scale approaches to the conservation and sustainable development of natural resources, including wetlands (Finlayson et al., 2012).
Wise use of wetlands is now defined by Ramsar as “the maintenance of their ecological character, achieved through the implementation of ecosystem approaches, within the context of sustainable development” 2,3.
In turn, “ecological character” is “the combination of ecosystem components, processes and services that characterize the wetland at any given point of time”.
Wise use and the maintenance of the ecological character of wetlands form the guiding principles for wetland management planning under the Ramsar Convention.
TeeB for WaTer anD WeTlanDs
02
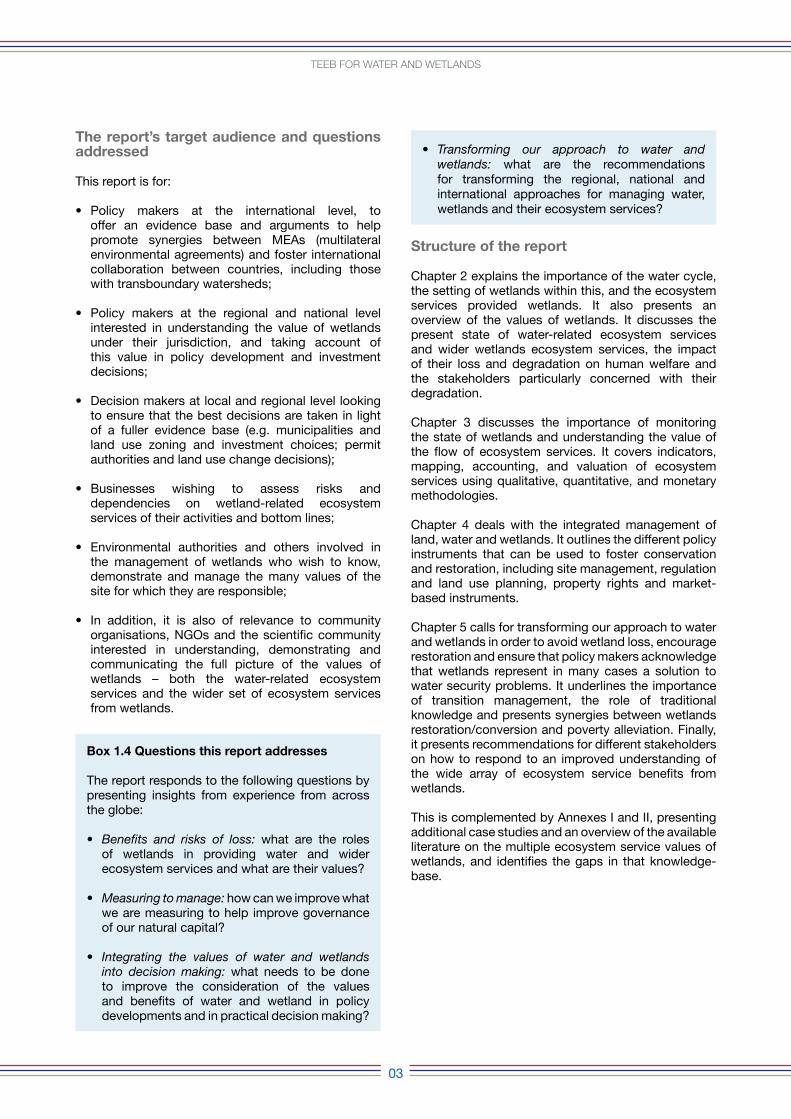
The report’s target audience and questions addressed
This report is for:
• Policy makers at the international level, to offer an evidence base and arguments to help promote synergies between MEAs (multilateral environmental agreements) and foster international collaboration between countries, including those with transboundary watersheds;
• Policy makers at the regional and national level interested in understanding the value of wetlands under their jurisdiction, and taking account of this value in policy development and investment decisions;
• Decision makers at local and regional level looking to ensure that the best decisions are taken in light of a fuller evidence base (e.g. municipalities and land use zoning and investment choices; permit authorities and land use change decisions);
• Businesses wishing to assess risks and dependencies on wetland-related ecosystem services of their activities and bottom lines;
• Environmental authorities and others involved in the management of wetlands who wish to know, demonstrate and manage the many values of the site for which they are responsible;
• In addition, it is also of relevance to community organisations, NGOs and the scientific community interested in understanding, demonstrating and communicating the full picture of the values of wetlands – both the water-related ecosystem services and the wider set of ecosystem services from wetlands.
Structure of the report
Chapter 2 explains the importance of the water cycle, the setting of wetlands within this, and the ecosystem services provided wetlands. It also presents an overview of the values of wetlands. It discusses the present state of water-related ecosystem services and wider wetlands ecosystem services, the impact of their loss and degradation on human welfare and the stakeholders particularly concerned with their degradation.
Chapter 3 discusses the importance of monitoring the state of wetlands and understanding the value of the flow of ecosystem services. It covers indicators, mapping, accounting, and valuation of ecosystem services using qualitative, quantitative, and monetary methodologies.
Chapter 4 deals with the integrated management of land, water and wetlands. It outlines the different policy instruments that can be used to foster conservation and restoration, including site management, regulation and land use planning, property rights and market-based instruments.
Chapter 5 calls for transforming our approach to water and wetlands in order to avoid wetland loss, encourage restoration and ensure that policy makers acknowledge that wetlands represent in many cases a solution to water security problems. It underlines the importance of transition management, the role of traditional knowledge and presents synergies between wetlands restoration/conversion and poverty alleviation. Finally, it presents recommendations for different stakeholders on how to respond to an improved understanding of the wide array of ecosystem service benefits from wetlands.
This is complemented by Annexes I and II, presenting additional case studies and an overview of the available literature on the multiple ecosystem service values of wetlands, and identifies the gaps in that knowledge-base.
• Transforming our approach to water and wetlands: what are the recommendations for transforming the regional, national and international approaches for managing water, wetlands and their ecosystem services?
Box 1.4 Questions this report addresses
The report responds to the following questions by presenting insights from experience from across the globe:
• Benefits and risks of loss: what are the roles of wetlands in providing water and wider ecosystem services and what are their values?
• Measuring to manage: how can we improve what we are measuring to help improve governance of our natural capital?
• Integrating the values of water and wetlands into decision making: what needs to be done to improve the consideration of the values and benefits of water and wetland in policy developments and in practical decision making?
TeeB for WaTer anD WeTlanDs
03
Pho
to c
red
it: N
ick
Dav
idso
n
TeeB for WaTer anD WeTlanDs
05
2 The imPorTance of WaTer anD WeTlanDs
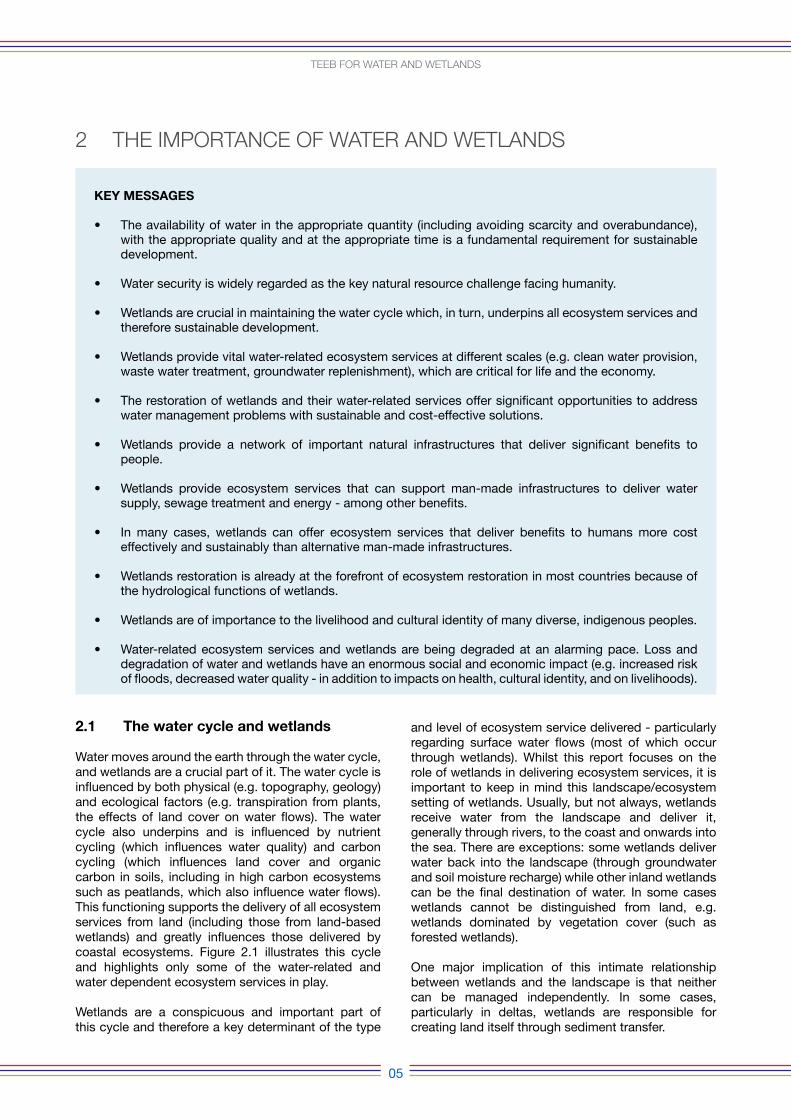
KEY MESSAGES
• The availability of water in the appropriate quantity (including avoiding scarcity and overabundance), with the appropriate quality and at the appropriate time is a fundamental requirement for sustainable development.
• Water security is widely regarded as the key natural resource challenge facing humanity.
• Wetlands are crucial in maintaining the water cycle which, in turn, underpins all ecosystem services and therefore sustainable development.
• Wetlands provide vital water-related ecosystem services at different scales (e.g. clean water provision, waste water treatment, groundwater replenishment), which are critical for life and the economy.
• The restoration of wetlands and their water-related services offer significant opportunities to address water management problems with sustainable and cost-effective solutions.
• Wetlands provide a network of important natural infrastructures that deliver significant benefits to people.
• Wetlands provide ecosystem services that can support man-made infrastructures to deliver water supply, sewage treatment and energy - among other benefits.
• In many cases, wetlands can offer ecosystem services that deliver benefits to humans more cost effectively and sustainably than alternative man-made infrastructures.
• Wetlands restoration is already at the forefront of ecosystem restoration in most countries because of the hydrological functions of wetlands.
• Wetlands are of importance to the livelihood and cultural identity of many diverse, indigenous peoples.
• Water-related ecosystem services and wetlands are being degraded at an alarming pace. Loss and degradation of water and wetlands have an enormous social and economic impact (e.g. increased risk of floods, decreased water quality - in addition to impacts on health, cultural identity, and on livelihoods).
2.1 The water cycle and wetlands
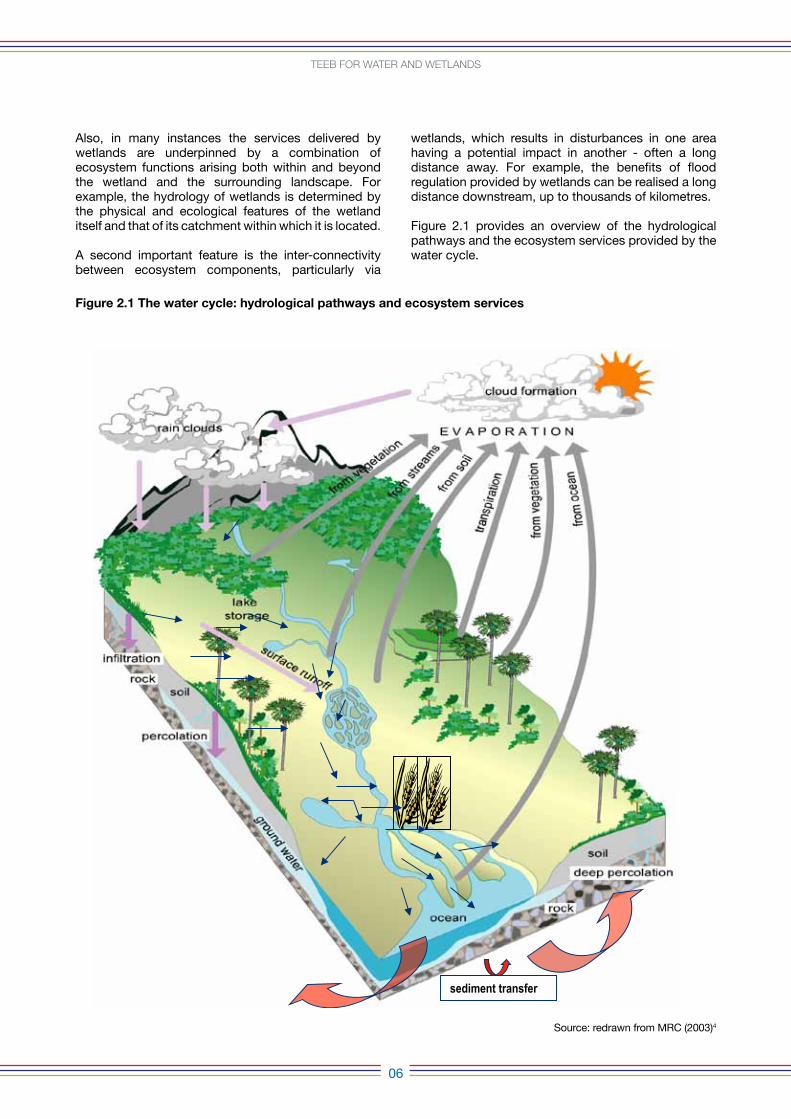
Water moves around the earth through the water cycle, and wetlands are a crucial part of it. The water cycle is influenced by both physical (e.g. topography, geology) and ecological factors (e.g. transpiration from plants, the effects of land cover on water flows). The water cycle also underpins and is influenced by nutrient cycling (which influences water quality) and carbon cycling (which influences land cover and organic carbon in soils, including in high carbon ecosystems such as peatlands, which also influence water flows). This functioning supports the delivery of all ecosystem services from land (including those from land-based wetlands) and greatly influences those delivered by coastal ecosystems. Figure 2.1 illustrates this cycle and highlights only some of the water-related and water dependent ecosystem services in play.
Wetlands are a conspicuous and important part of this cycle and therefore a key determinant of the type
and level of ecosystem service delivered - particularly regarding surface water flows (most of which occur through wetlands). Whilst this report focuses on the role of wetlands in delivering ecosystem services, it is important to keep in mind this landscape/ecosystem setting of wetlands. Usually, but not always, wetlands receive water from the landscape and deliver it, generally through rivers, to the coast and onwards into the sea. There are exceptions: some wetlands deliver water back into the landscape (through groundwater and soil moisture recharge) while other inland wetlands can be the final destination of water. In some cases wetlands cannot be distinguished from land, e.g. wetlands dominated by vegetation cover (such as forested wetlands).
One major implication of this intimate relationship between wetlands and the landscape is that neither can be managed independently. In some cases, particularly in deltas, wetlands are responsible for creating land itself through sediment transfer.
TeeB for WaTer anD WeTlanDs
06
Also, in many instances the services delivered by wetlands are underpinned by a combination of ecosystem functions arising both within and beyond the wetland and the surrounding landscape. For example, the hydrology of wetlands is determined by the physical and ecological features of the wetland itself and that of its catchment within which it is located.
A second important feature is the inter-connectivity between ecosystem components, particularly via
wetlands, which results in disturbances in one area having a potential impact in another - often a long distance away. For example, the benefits of flood regulation provided by wetlands can be realised a long distance downstream, up to thousands of kilometres.
Figure 2.1 provides an overview of the hydrological pathways and the ecosystem services provided by the water cycle.
Figure 2.1 The water cycle: hydrological pathways and ecosystem services
sediment transfer
Source: redrawn from MRC (2003)4
TeeB for WaTer anD WeTlanDs
07
2.2 The values of water and wetlands
The values of water
Water itself has a value; this is most notable for drinking, irrigation, food production, sanitation, energy use, forestry, tourism, housing etc. Indeed, for some activities it is a commercially supplied product (e.g. the IT and medical sectors require high purity waters). It is fundamental for society and for the economy and underpins most of our activities.
The lack of water can have significant effects on health, livelihoods, the economy, and on the operations and efficiency of industry across most sectors. The Rio+20 final declaration recognised water as a fundamental right and underlined its core role in sustainable development (see Box 2.1).
All sectors of the economy depend on water directly and/or indirectly. The agricultural sector depends on water for crop and livestock production; the energy sector for hydropower and for cooling at thermoelectric power plants; the tourism sector for the natural beauty provided by rivers, lakes and the sea. Where water is scarce, water security concerns can arise between users or between regions (e.g. in trans-boundary contexts). Water pollution can diminish the value of water in a similar way to scarcity by making the water unusable. Over-abundance of water can be equally problematic; for example, the impacts of catastrophic flooding on lives, property and economy. For all these reasons, the wise use of water and management of the resource and its sources is of critical importance.
Wetlands, the water cycle and ecosystem services
Inland wetlands cover at least 9.5 million km2 (i.e. about 6.5% of the Earth’s land surface), with inland and coastal wetlands together covering a minimum of 12.8 million km2 (Finlayson et al. 1999). They deliver a range of ecosystem services, i.e. benefits that people obtain from ecosystems (Finlayson et al., 1999; MA 2005a). The most well-known and widespread definition of ecosystem services is the one proposed by the Millennium Ecosystem Assessment report (MA, 2005a), which categorised them into four groups: provisioning, regulating, cultural and supporting ecosystem services5 (see Box 2.2).
Box 2.1 The rio+20 Global commitment “The Future We Want”: Some selected references to water
119. We recognize that water is at the core of sustainable development as it is closely linked to a number of key global challenges. We therefore reiterate the importance of integrating water in sustainable development and underline the critical importance of water and sanitation within the three dimensions of sustainable development.
120. We reaffirm the commitments made in the Johannesburg Plan of Implementation and Millennium Declaration regarding halving by 2015 the proportion of people without access to safe drinking water and basic sanitation and the development of integrated water resource management and water efficiency plans, ensuring sustainable water use. We commit to the progressive realization of access to safe and affordable drinking water and basic sanitation for all, as necessary for poverty eradication, to protect human health, and to significantly improve the implementation of integrated water resource management at all levels - as appropriate. In this regard, we reiterate these commitments in particular for developing countries through the mobilization of resources from all sources, capacity building and technology transfer.
121. We reaffirm our commitments, regarding the human right to safe drinking water and sanitation, to be progressively realized for our populations with full respect for national sovereignty. We also highlight our commitment to the 2005-2015 International Decade for Action “Water for Life.”
122. We recognize the key role that ecosystems play in maintaining water quantity and quality and support actions within the respective national boundaries to protect and sustainably manage these ecosystems.
Source: UNCSD (2012)
Box 2.2 classification of Ecosystem Services by the Millennium Ecosystem Assessment
1. Provisioning services: products obtained from ecosystems, e.g. fresh water, food, fibre, fuel, genetic resources, biochemical, natural medicines and pharmaceuticals.
2. Regulating services: benefits obtained from the regulation of ecosystem processes, e.g. water regulation, erosion regulation, water purification, waste regulation, climate regulation and natural hazard regulation (e.g. droughts, floods, storms).
3. Cultural services: nonmaterial benefits people obtain from ecosystems through spiritual enrichment, cognitive development, reflection, recreation, and aesthetic experiences, e.g. cultural diversity, knowledge systems, educational values, social relations, sense of place, cultural heritage and ecotourism.
4. Supporting services: those that are necessary for the production of all other ecosystem services. They differ from provisioning, regulating, and cultural services in that their impacts on people are often indirect or occur over a very long time,
TeeB for WaTer anD WeTlanDs
08
First and foremost, wetlands are a key factor in the global water cycle and in regulating local water availability and quality. Wetlands contribute to water purification, including denitrification and detoxification, as well as to nutrient cycling, sediment transfer, and nutrient retention and exports. Water is a provisioning ecosystem service itself, but it is also necessary to all other provisioning ecosystem services (e.g. food, fibre, timber) and most regulating ecosystem services (e.g. water purification, flood protection), supporting ecosystem services (e.g. photosynthesis, primary production, nutrient cycling), and cultural ecosystem services (e.g. recreation, aesthetic experience, spiritual enrichment). The role of wetlands in water-related provisioning, regulating and supporting services is one of the fundamental factors in ensuring water security, but also in maintaining other ecosystem services. Other provisioning ecosystem services delivered by wetlands include food (e.g. fish, rice and other agricultural products), timber, fibre and non-timber forest products, and hence often play an important role in the livelihood of many communities. For example, global inland capture fisheries production in 2010 was 11.2 million tonnes and inland aquaculture production was 41.7 million tonnes (FAO, 2012a); all of this derived from wetlands.
While vegetative wetlands occupy only 2% of seabed area, they represent 50% of carbon transfer from oceans to sediments, often referred to as ‘Coastal Blue Carbon’ (Sifleet et al., 2011). Degradation of coastal wetlands generally leads to a high level of carbon emissions - in the order of 2,000 tCO2/km2/yr, taking an average over 50 years (Duarte et al., 2005 and Crooks et al., 2011). The organic carbon stored per unit area of seagrass meadows is similar to that of forests, making them a globally significant carbon stock. It has been estimated that they could store between 4 and 20 Pg of organic carbon, and that present rates of seagrass loss could result in the release of up to 299 Tg carbon per year (Fourqurean et al., 2012).
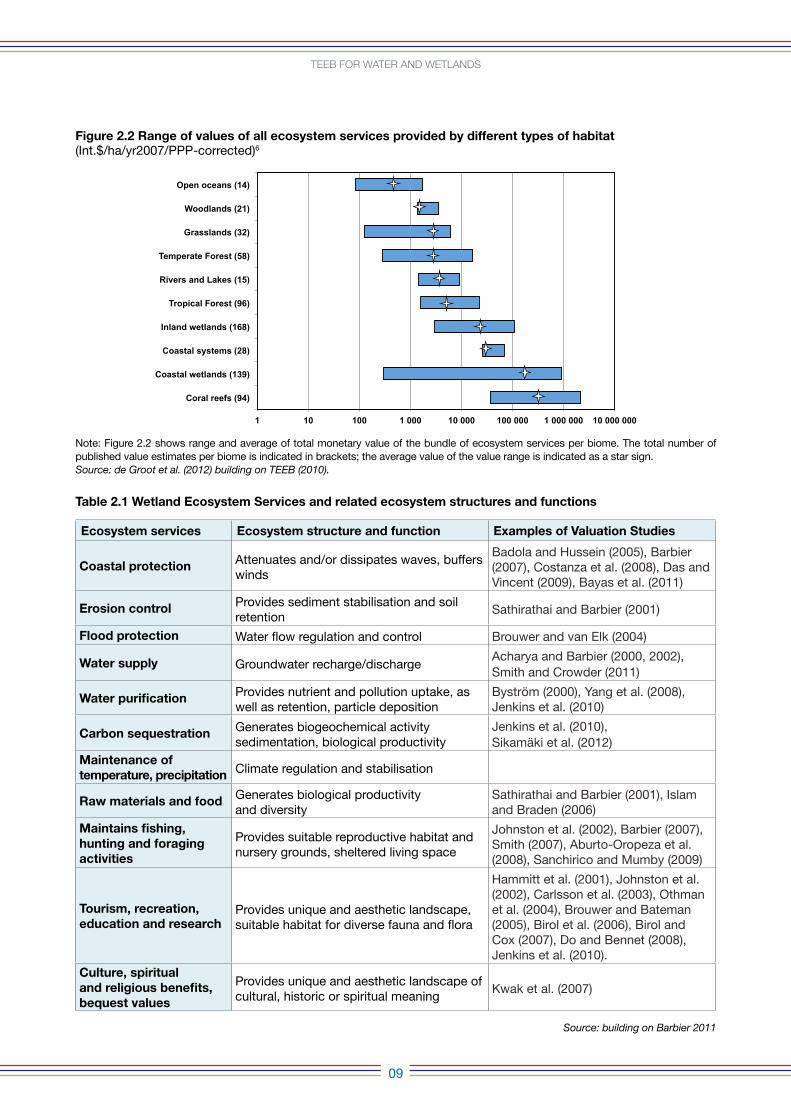
Figure 2.2 presents a summary of the literature on the monetary values of wetlands and other ecosystems, showing that wetland ecosystems can have among the highest values. Wetland ecosystems can be of particularly high value where they regulate water quality and flow, thus providing clean water and mitigating natural hazards to nearby towns and cities. Coral reefs are the ecosystems with highest monetary value
often due to associated high recreation and tourism importance, community benefits (e.g. fishery nursery), as well as protection from natural hazards. However, if all supporting and regulating ecosystem services were taken into account, many of which are essential for human welfare and even survival, their share in the total estimated monetary value of wetlands would notably increase.
As regards coral reefs, they can also be significantly impacted by the knock-on effects of damages to other ecosystems, especially wetlands. For example, degraded inland wetland ecosystems might deposit large amounts of pollutants/sediments that damage coral reefs in coastal areas. Thus, degradation of wetlands can in turn impact other systems with even higher monetary value.
Ecosystem functions, the flow of ecosystem services, and the economic value to society and the economy are site specific and depend on the ecological, social and economic systems and their interactions. For this reason the value ranges in Figure 2.2 and Table 2.1 further below need to be considered as indicative.
Table 2.1 presents an overview of ecosystem services from wetlands, how they related to ecosystem structure and functions and presents some examples of key valuation studies.
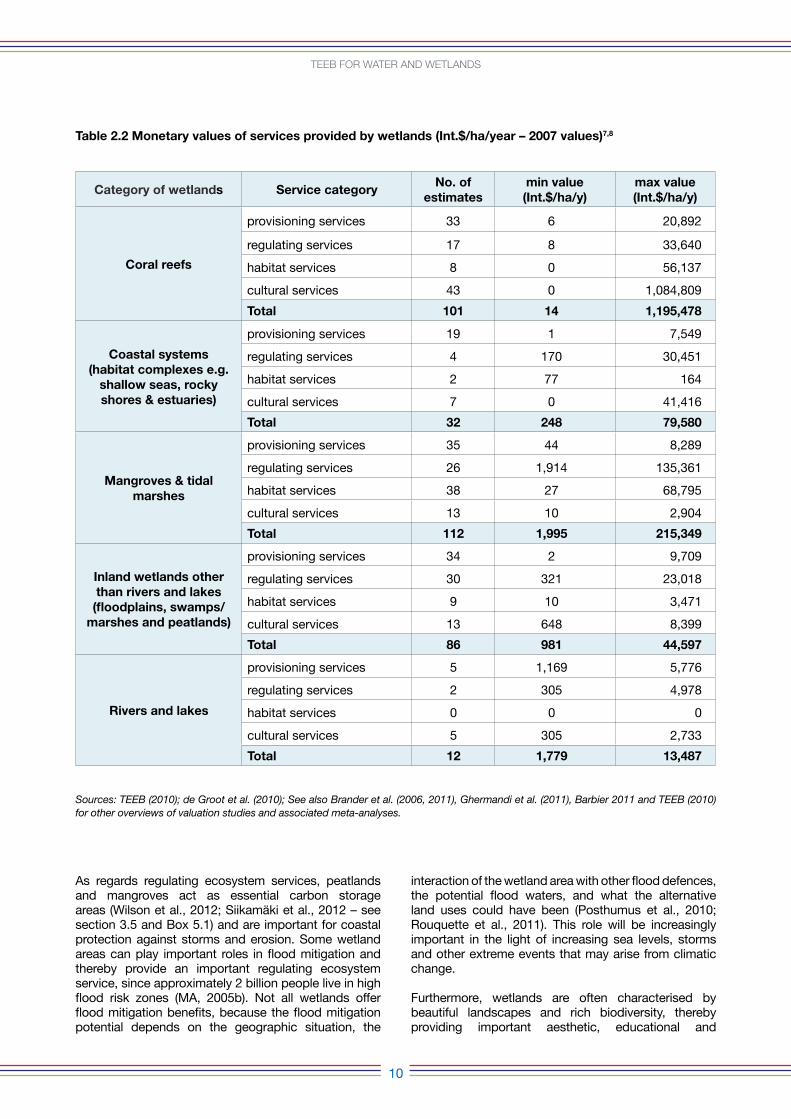
Table 2.2 presents an overview of the wider literature on the monetary values of ecosystem services provided by wetlands, taken from TEEB (2010). These tables present the range of values from the literature and a number of estimates available in the ecosystem service category (for full tables see Annex II; for further discussion see TEEB, 2010, Appendix III; de Groot et al., 2010; Van der Ploeg and de Groot, 2010; and Van der Ploeg et al., 2010; de Groot et al., 2012).
The actual values for a given site or given policy challenge or decision will have to be assessed in its specific context, and the values in the table should be taken as indicative values; not extrapolated to any specific water or wetland. There are techniques available, such as value transfer, which can help where there are sufficient similarities between the study site and values from literature, but they need to be used with care. This approach (and the caveats surrounding it) is explained further in TEEB (2010).
whereas changes in the other categories have relatively direct and short-term impacts on people. Some services, like erosion regulation, can be categorised as both a supporting and a regulating service, depending on the time scale and immediacy of their impact on people. Supporting services include primary production, nutrient cycling and water cycling.
Source: derived from MA (2005a)
TeeB for WaTer anD WeTlanDs
09
Figure 2.2 range of values of all ecosystem services provided by different types of habitat (Int.$/ha/yr2007/PPP-corrected)6
Table 2.1 Wetland Ecosystem Services and related ecosystem structures and functions
Source: building on Barbier 2011
Ecosystem services Ecosystem structure and function Examples of Valuation Studies
coastal protection Attenuates and/or dissipates waves, buffers winds
Badola and Hussein (2005), Barbier (2007), Costanza et al. (2008), Das and Vincent (2009), Bayas et al. (2011)
Erosion control Provides sediment stabilisation and soil retention
Sathirathai and Barbier (2001)
Flood protection Water flow regulation and control Brouwer and van Elk (2004)
Water supply Groundwater recharge/dischargeAcharya and Barbier (2000, 2002),Smith and Crowder (2011)
Water purification Provides nutrient and pollution uptake, as well as retention, particle deposition
Byström (2000), Yang et al. (2008), Jenkins et al. (2010)
carbon sequestration Generates biogeochemical activity sedimentation, biological productivity
Jenkins et al. (2010),Sikamäki et al. (2012)
Maintenance of temperature, precipitation Climate regulation and stabilisation
raw materials and food Generates biological productivity and diversity
Sathirathai and Barbier (2001), Islam and Braden (2006)
Maintains fishing, hunting and foraging activities
Provides suitable reproductive habitat and nursery grounds, sheltered living space
Johnston et al. (2002), Barbier (2007), Smith (2007), Aburto-Oropeza et al. (2008), Sanchirico and Mumby (2009)
Tourism, recreation, education and research
Provides unique and aesthetic landscape, suitable habitat for diverse fauna and flora
Hammitt et al. (2001), Johnston et al. (2002), Carlsson et al. (2003), Othman et al. (2004), Brouwer and Bateman (2005), Birol et al. (2006), Birol and Cox (2007), Do and Bennet (2008), Jenkins et al. (2010).
culture, spiritual and religious benefits, bequest values
Provides unique and aesthetic landscape of cultural, historic or spiritual meaning
Kwak et al. (2007)
1 10 100 1 000 10 000 100 000 1 000 000 10 000 000
Coral reefs (94)
Coastal wetlands (139)
Coastal systems (28)
Inland wetlands (168)
Tropical Forest (96)
Rivers and Lakes (15)
Temperate Forest (58)
Grasslands (32)
Woodlands (21)
Open oceans (14)
Note: Figure 2.2 shows range and average of total monetary value of the bundle of ecosystem services per biome. The total number of published value estimates per biome is indicated in brackets; the average value of the value range is indicated as a star sign. Source: de Groot et al. (2012) building on TEEB (2010).
TeeB for WaTer anD WeTlanDs
10
Table 2.2 Monetary values of services provided by wetlands (Int.$/ha/year – 2007 values)7,8
Sources: TEEB (2010); de Groot et al. (2010); See also Brander et al. (2006, 2011), Ghermandi et al. (2011), Barbier 2011 and TEEB (2010) for other overviews of valuation studies and associated meta-analyses.
As regards regulating ecosystem services, peatlands and mangroves act as essential carbon storage areas (Wilson et al., 2012; Siikamäki et al., 2012 – see section 3.5 and Box 5.1) and are important for coastal protection against storms and erosion. Some wetland areas can play important roles in flood mitigation and thereby provide an important regulating ecosystem service, since approximately 2 billion people live in high flood risk zones (MA, 2005b). Not all wetlands offer flood mitigation benefits, because the flood mitigation potential depends on the geographic situation, the
interaction of the wetland area with other flood defences, the potential flood waters, and what the alternative land uses could have been (Posthumus et al., 2010; Rouquette et al., 2011). This role will be increasingly important in the light of increasing sea levels, storms and other extreme events that may arise from climatic change.
Furthermore, wetlands are often characterised by beautiful landscapes and rich biodiversity, thereby providing important aesthetic, educational and
category of wetlands Service categoryno. of
estimatesmin value (Int.$/ha/y)
max value (Int.$/ha/y)
coral reefs
provisioning services 33 6 20,892
regulating services 17 8 33,640
habitat services 8 0 56,137
cultural services 43 0 1,084,809
Total 101 14 1,195,478
coastal systems (habitat complexes e.g.
shallow seas, rocky shores & estuaries)
provisioning services 19 1 7,549
regulating services 4 170 30,451
habitat services 2 77 164
cultural services 7 0 41,416
Total 32 248 79,580
Mangroves & tidal marshes
provisioning services 35 44 8,289
regulating services 26 1,914 135,361
habitat services 38 27 68,795
cultural services 13 10 2,904
Total 112 1,995 215,349
Inland wetlands other than rivers and lakes
(floodplains, swamps/marshes and peatlands)
provisioning services 34 2 9,709
regulating services 30 321 23,018
habitat services 9 10 3,471
cultural services 13 648 8,399
Total 86 981 44,597
rivers and lakes
provisioning services 5 1,169 5,776
regulating services 2 305 4,978
habitat services 0 0 0
cultural services 5 305 2,733
Total 12 1,779 13,487
TeeB for WaTer anD WeTlanDs
11
recreational ecosystem services that contribute to human wellbeing, cultural identity and economy. Wetlands may hold important spiritual values for some cultures. Many people across the world have cultural value links with water and wetlands that may be overlooked when changes occur to these habitats. While these are not monetary values, it is essential to recognise that such values are important for local communities.
It is also important to note that the ecosystem services that wetlands provide are not always synergistic with each other. Maximising ecosystem services for water supply or flood defence could imply trade-offs, for example, with biodiversity or cultural values. In such cases it is important to be clear on priorities for wetland management and, therefore, which trade-offs are acceptable and which are not (see section 4.2).
Finally, it should be noted that determining the value of water and wetland ecosystem services is different from the concept of the price paid by consumers for water supply. The price of water supply, if priced at all, can be determined by factors such as infrastructure and treatment costs, which may be subsidised and take into account other factors. This is different from the value of water as an ecosystem service.
Box 2.3 provides some examples of ecosystem services provided by wetlands and Box 2.4 a country perspective.
Box 2.3 Examples of ecosystem services delivered by wetlands
Carbon sequestration from peatlands
Even though peatlands only cover 3% of the global land area, they contain approximately 30% of all the carbon on land, equivalent to 75% of all atmospheric carbon and twice the carbon stock in the global forest biomass. They represent the most important carbon storage on land and the second most important one on Earth, next to the oceans. The carbon in peat has accumulated over thousands of years thanks to permanent waterlogging and restricting aerobic decay. The peatland equilibrium between production and decay is, however, delicate and can easily be disturbed by human activities. Drainage for agriculture or forestry turns peatlands from a carbon sink to a carbon source. CO2 emissions from peatland drainage, fires and exploitation are approximately 3 billion tonnes per year, which equates to more than 10% of the global fossil fuel emissions. For this reason, restoration and conservation of peatlands represent a key strategy for climate change mitigation (along with protection of other peatland ecosystem services).
Sources: Parish et al. (2008); FAO (2012b)
Denitrification from estuarine environments
Nitrogen plays a key role in determining the presence of the different species in most coastal areas and is often a limiting factor for primary production. The excess influx of nutrients like nitrogen and phosphorus (mainly caused by run-off of inorganic fertilisers, manure and detergents) results in eutrophication. This consists of an increase of primary producers such as algae, which then rapidly die off. Their subsequent aerobic decay drastically reduces the oxygen available for other species, in some cases even blocking sunlight under the water surface and producing harmful toxins.
Piehlert and Smyth (2011) demonstrated that salt marshes and temperate shallow-water estuarine ecosystems (such as submerged aquatic vegetation and oyster reefs) present significant rates of natural denitrification (bacterial nitrogen removal by reduction of the nitrates to gaseous N2), which helps mitigate the problem. The nitrogen removal function of these habitats provides an important contribution to the estuarine ecosystem function.
Source: Piehler and Smyth (2011)
Seafood and other ecosystem services from coral reefs
Coral reefs are one of the ecosystems with the highest level of biodiversity, and, even though they cover only 0.2% of the world’s oceans, they contain about 25% of marine species.
They provide habitat to a wide range of fish and invertebrate species, sustaining the livelihood of millions of people. It is estimated that a well-managed reef in the Indian and Pacific Oceans can provide between 5 and 15 tons of seafood per square kilometre per year. In addition, coral reefs provide a wide range of ecosystem services: they represent a major tourist attraction, protect shores and islands from surges and storms, and provide habitat for many reef-dwelling species that can potentially be used for pharmaceuticals. In addition, it is estimated that a well-managed reef in the Indian and Pacific Oceans can provide between 5 and 15 tons of seafood per square kilometre per year.
Sources: Cesar et al. (2003); World Meteorological Organization (2010); UNEP-WCMC (2001); WRI (2012)
12
TeeB for WaTer anD WeTlanDs
cost-effectiveness of natural infrastructures
Public and private sector of the economy and society directly benefit from the ecosystem services provided by water and wetlands, including individuals, communities and cities, the agriculture, forestry, energy and health sectors, and many others. At the national and regional scales, the sustainable management of water and wetland-related ecosystem services can thus provide multiple benefits, contributing to national security, human well-being, health and livelihood.
Wetlands work as natural infrastructure and networks of natural ecosystems that deliver a range of important ecosystem services, described in section 2.1 above (Krchnak et al., 2011). In some cases they substitute built infrastructure and in other cases complement it, with ecological and man-made infrastructures interlinked.
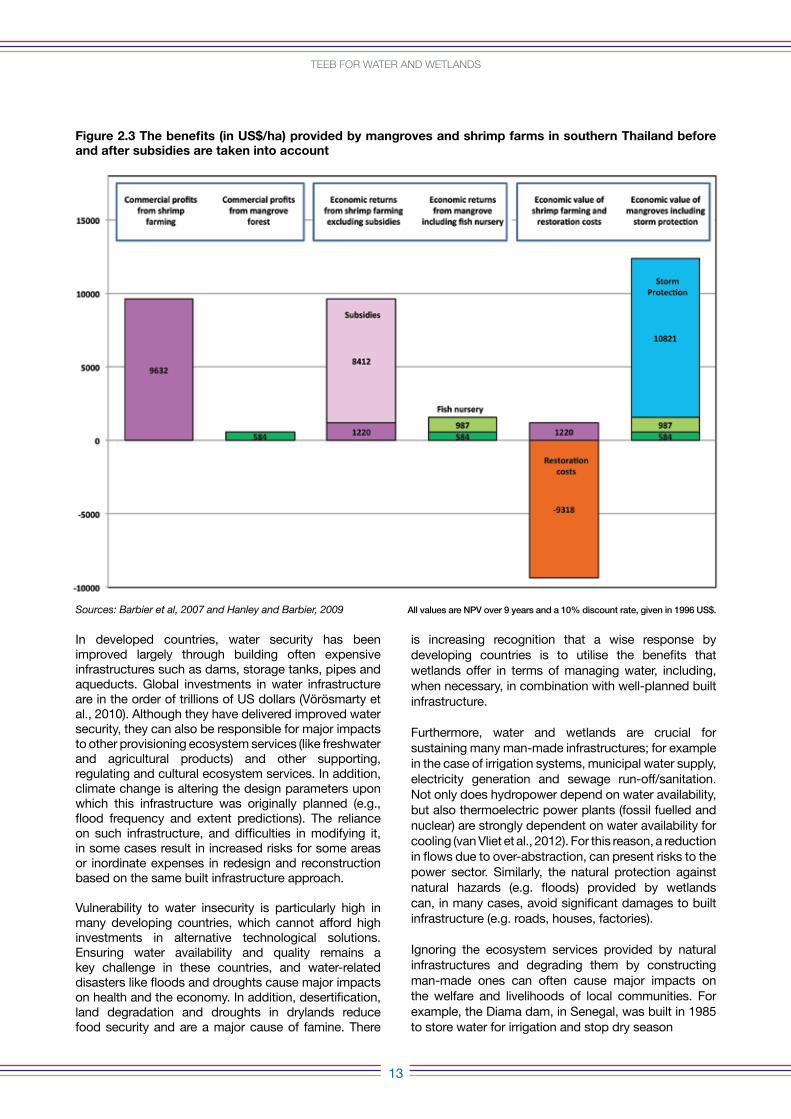
Wise use of wetlands, including the conservation and restoration of hydrological functions, is essential in maintaining an infrastructure that can help meet a wide range of policy objectives. In many cases, natural ecosystems can provide ecosystem services at a lower price than hard engineered approaches. For example, the benefits of mangroves in Southern Thailand were estimated at about US$10,821/ha for coastal protection against storms, US$987/ha for fish nurseries and US$584/ha, in net present value terms for collected wood and non-timber forest products (see Figure 2.3 and Barbier, 2007, where all values are in net present value)9. According to this estimate, most of the economic benefits associated to mangrove conservation were due to the role of the mangrove wetlands as a natural infrastructure against storm. In contrast, the benefits of commercial shrimp farming were estimated at US$ 9,632/ha with government subsidies contributing the equivalent of US$8,412/ha (Figure 2.3). Hence shrimp production without subsidies over the period creates benefits of only US$1,120/ha which is dwarfed by the monetary value of the ecosystem services provided by mangrove conservation (see also Hanley and Barbier 2009). While the benefits of mangroves are provided continuously, shrimp production declines after five years and shrimp farms are abandoned when turning unproductive. The costs of restoring mangroves are US$9,318/ha beyond the private profits from shrimp and have to be borne by the public. Further examples are provided in Box 2.5.
Box 2.4 Value of floodplains for nutrient retention and carbon sequestration in Germany
In Germany, only 30% of the original floodplains along major rivers and streams are active, meaning that they are still connected to the river and become flooded during flood events (Brunotte et al., 2009). The other 70% are inactive floodplains behind dykes with built infrastructure, such as housing and industry, which were valued at approximately €267 billion. While the value of such built assets in the active floodplains is only €35 billion, the value of their natural assets in the form of nutrient retention and carbon sequestration can be considerably higher (Scholz et al., 2012).
In Germany the overall potential of active floodplains for nitrogen retention is approximately 42,000 tons per year and for phosphorous retention approximately 1,200 tons per year. Compared to rivers, retention capacities of floodplains are on average two times higher for nitrogen and ten times higher for phosphorous, with retention being greatest during flood events. The calculated marginal cost for nitrogen retention in the active floodplains reaches about €252 million per year and for phosphorous €72 million per year. These figures are calculated using the replacement cost method, i.e. calculating the price of nutrient removal through an artificial water treatment plant.
The calculated carbon stocks of soils in the active floodplains amount to 549 million tCO2equivalent and in the inactive floodplains to 774 million tCO2equivalent. Although peatlands cover only 7% of the floodplains, they contain 70% of the carbon stock. In particular, in the inactive floodplains intense land use is causing peatland degradation resulting in emissions of 2.53 million tCO2equivalent per year, corresponding to the CO2emissions per year of 1.27 million cars. More than two thirds of these emissions (1.8 million tCO2equivalent per year) originate from inactive floodplains behind dykes. The cost of these carbon emissions ranges between €35 million per year (based on a market price for carbon of €13.82 per tCO2) up to €177 million per year (based on calculations on the potential global economic costs associated with climate change, which are estimated at about €70/tCO2).
The restoration of inactive floodplains, e.g. through the realignment of dykes, is a possible option for reducing carbon emissions and enhancing nutrient retention to improve water quality. This can be in particular an option in rural areas, where the value of built infrastructure behind dykes is often low. This would also reduce the maintenance costs of dykes.
Sources: Brunotte et al. (2009) and Scholz et al. (2012)
Pho
to c
red
it: N
ick
Dav
idso
n
13
TeeB for WaTer anD WeTlanDs
Figure 2.3 The benefits (in uS$/ha) provided by mangroves and shrimp farms in southern Thailand before and after subsidies are taken into account
Sources: Barbier et al, 2007 and Hanley and Barbier, 2009
In developed countries, water security has been improved largely through building often expensive infrastructures such as dams, storage tanks, pipes and aqueducts. Global investments in water infrastructure are in the order of trillions of US dollars (Vörösmarty et al., 2010). Although they have delivered improved water security, they can also be responsible for major impacts to other provisioning ecosystem services (like freshwater and agricultural products) and other supporting, regulating and cultural ecosystem services. In addition, climate change is altering the design parameters upon which this infrastructure was originally planned (e.g., flood frequency and extent predictions). The reliance on such infrastructure, and difficulties in modifying it, in some cases result in increased risks for some areas or inordinate expenses in redesign and reconstruction based on the same built infrastructure approach.
Vulnerability to water insecurity is particularly high in many developing countries, which cannot afford high investments in alternative technological solutions. Ensuring water availability and quality remains a key challenge in these countries, and water-related disasters like floods and droughts cause major impacts on health and the economy. In addition, desertification, land degradation and droughts in drylands reduce food security and are a major cause of famine. There
is increasing recognition that a wise response by developing countries is to utilise the benefits that wetlands offer in terms of managing water, including, when necessary, in combination with well-planned built infrastructure.
Furthermore, water and wetlands are crucial for sustaining many man-made infrastructures; for example in the case of irrigation systems, municipal water supply, electricity generation and sewage run-off/sanitation. Not only does hydropower depend on water availability, but also thermoelectric power plants (fossil fuelled and nuclear) are strongly dependent on water availability for cooling (van Vliet et al., 2012). For this reason, a reduction in flows due to over-abstraction, can present risks to the power sector. Similarly, the natural protection against natural hazards (e.g. floods) provided by wetlands can, in many cases, avoid significant damages to built infrastructure (e.g. roads, houses, factories).
Ignoring the ecosystem services provided by natural infrastructures and degrading them by constructing man-made ones can often cause major impacts on the welfare and livelihoods of local communities. For example, the Diama dam, in Senegal, was built in 1985 to store water for irrigation and stop dry season
All values are NPV over 9 years and a 10% discount rate, given in 1996 US$.
influx of saline water into the lower delta. The dam led to hyper-salinisation, expansion of area covered by invasive weeds, a reduction of daily income per fisher to less than US$3 per day, a decrease in the number of women able to gather grasses for weaving to less than 20 women, and the disappearance of cattle grazing in the delta. When the seasonal flooding of the delta was restored by changing the timing of the flood releases of the dam, the income per fisher increased to over US$20 per day, more than 600 women were able to gather weaving materials from the delta, and livestock grazing was again possible (more than 150,000 cattle days per year) (Krchnak et al., 2011; Hamerlynck and Duvail, 2008). Thus changing the performance of the built infrastructure allowed for re-building of the natural infrastructure.
2.3 Status and trends of water and wetlands
What has been lost? Trends in wetland area
People have been progressively draining, in-filling and converting both coastal and inland wetlands for many centuries, since at least Roman times in Europe and since the 17th century in North America. This destruction and degradation continues. Major drivers of loss and degradation have been (and continue to be) conversion to first extensive and then intensive agriculture (croplands), changes in water use and availability, increasing urbanisation and infrastructure development and, on the coast, also port and industrial developments and aquaculture.
Overall, estimates suggest that since 1900 the world has lost around 50% of its wetlands (UNWWAP, 2003), with 60% loss in Europe (55-67% losses in different countries; EEA 2010) and 54% loss since the 18th century in the USA (exceeding 90% loss in some states; Dahl 1990) and further 5% losses of both inland and coastal wetlands more recently (Dahl 2006). Highest rates of loss in these countries were in the 1950-1980 period, with losses continuing but more slowly since then. For example, in Europe whilst a further 2.7% of inland vegetated wetlands were lost between 1990 and 2006, open waters increased by 4.4% and coastal wetland area remained stable (EEA 2010).
Whilst wetland losses have generally slowed in North America and Europe, this is not the case everywhere else. In China, natural inland wetlands decreased in area by 33% between 1978 and 2008, whilst artificial inland wetlands increased by 122% over the same period, and 31% of coastal wetlands were lost (Niu et al. 2012). Overall losses of coastal wetlands in East Asia over the 50 years to 2005 have been high: 51% in China, 40% in the Republic of Korea and >70% in Singapore (MacKinnon et al. 2012). In addition to the large total areas of coastal wetlands land-claimed in East Asia, chiefly for urban, infrastructure and port and industrial developments, annual rates of loss have also been particularly high, at up to 6 times more rapid than rates of loss reported from elsewhere. In addition, further major coastal land-claims are on-going or have been approved in this region, totalling at least a further 6,000 km2 (MacKinnon et al. 2012).
Trends in areas of different wetland types reflect these general patterns. coastally, 20% (3.6 million hectares) of mangroves were reported lost between 1980 and 2005, with 80% losses over this period in some countries (FAO, 2007). Whilst reported rates of mangrove loss in most regions have slowed since 2000, the loss rate in Asia (the region with the largest mangrove area) accelerated. Similarly, 20% of seagrass beds are estimated as having being lost between 1930 and 2003 (Butchart et al. 2010), and 85% of oyster reefs have been lost (Beck et al. 2011). At least 38% of UK
Box 2.5 Examples of wetland ecosystem services as a more cost-efficient solution than technological alternatives
The Scheldt estuary, Belgium and the Netherlands
A cost-benefit analysis on infrastructural works planned for the Scheldt estuary, flowing from Belgium into the Netherlands, showed that a combination of dikes and flood plains could offer more benefits than major measures - such as a storm surge barrier. The planned work included deepening the fairway to the harbour of Antwerp and complementary measures to protect the land from storm floods coming from the North Sea. The cost-benefit analysis took into account the ecosystem services using a contingent valuation approach for the recreational value of new floodplains. Based on these results, the Dutch and Flemish governments approved an integrated management plan consisting of restoration of approximately 2,500 ha of intertidal and 3,000 ha of non-tidal areas, reinforcement of dikes, and dredging to improve the fairway to Antwerp.
Sources: De Nocker et al. (2004); Meire et al. (2005); Broekx et al. (2011)
Fynbos Biome, Western Cape, South Africa
The economic benefits of wetlands in the Fynbos Biome of the Western Cape, South Africa, were estimated using a replacement approach, which calculated the water treatment capacity of wetlands. The economic benefit was calculated on the basis of the cost of performing the same service, i.e. removal of nitrogen, with man-made water treatment plants. The study calculated the average value of the wetlands’ water treatment service as US$ 12,385/ha per year, which is a high enough value to compete with alternative land uses.
Source: Turpie (2010)
TeeB for WaTer anD WeTlanDs
14
TeeB for WaTer anD WeTlanDs
15
estuaries had been lost by the 1990s (Davidson et al. 1991). Wetland area lost from 14 of the world’s major deltas (mostly coastal) was over 52% between the 1980s and early 2000s (Coleman et al 2008). Loss of coastal vegetated wetlands (saltmarshes) in the USA was only 1.5% between mid-1970s and mid-1980s and a further 0.7% from 1998-2004 (Dahl & Johnson 1991; Dahl 2006), but for part of the Mississippi delta there was an earlier greater loss, of about 50% from 1956-2004, with most rapid rates of loss in the 1970s (Bernier et al. 2006). In south-east UK, almost 90% of saltmarsh has been lost through land-claims and rising sea-levels (Hughes & Paramor 2004).
Inland open water area (of both natural and artificial wetlands) decreased overall by 6% in the 15 years from 1993-2007, but within this trend is a larger decrease (9.5%) up to 2000, followed by a 3% increase in area during the 2000s (Prigent et al. 2012), likely at least in part a consequence of recent increases in dam and water storage construction (Acreman 2012). Similarly in Europe there was a 4.4% increase in open water areas from 1990-2006, largely through the creation of artificial waterbodies by new dams (EEA 2010).
Trends in inland vegetated wetlands are less well documented, but examples include a 5.0% loss of European marshes and bogs between 1990 and 2006 (EEA 2010), and a loss of 2.5% of inland wetlands in the USA between mid-1970s and mid-1980s (Dahl & Johnson 1991) and further losses of vegetated inland wetlands up to 2004 (Dahl 2006) – although these losses since the 1990s were counterbalanced by a 12% increase in restored and created ponds over the same period. In Morocco 25% of inland wetland area was lost in 20 years in the late 20th century, with losses of some types of wetland being up to 98% (Green et al. 2002). What has been lost? Trends in wetland-dependent species
Unsurprisingly, trends in the status of wetland-dependent species follow the overall patterns of continuing wetland loss. The Living Planet Index (LPI) for freshwater species and populations has declined by 37% in 38 years between 1970 and 2008 – a larger decline that for any other biome - and for tropical regions there has been an even greater (70%) decline, in contrast to an increase of 35% in the freshwater temperate index (WWF 2012). The marine LPI (which includes many coastal species) has also declined (by 22%) over the same period. Regionally, the decline in the overall LPI has been greatest in the Indo-Pacific biogeographic realm (64%).
For waterbirds (Wetlands International 2010), whilst the global status of biogeographic populations has improved slightly between 1976 and 2005, more populations remain in decline (38%) than are increasing (20%). As for the LPI, the global trend masks major
differences in status across regional, flyways and taxa: whilst populations in Europe and North America have relative good, and improving, status since the mid-1970s, those depending on South America and Africa, and long-distance migrants worldwide have a much poorer and declining status, and the status of all types of waterbird population in the Asia-Pacific region has been, and continues to be, particularly bad. Whilst the status of some waterbird taxa has improved, that of others is deteriorating rapidly: the status of shorebirds (sandpipers, plovers and their allies) decreased by 33% over the 20 years to 2005 (Butchart et al. 2010), with populations using the East Asia-Australasia flyway with especially poor and rapidly declining status.
What remains? Global wetland area
The global extent of coastal and inland wetlands is estimated to be in excess of 12.8 million km2, but this is recognised as a considerable underestimate. Estimates for global area of inland (freshwater) wetlands vary considerably (from 5.3 – 9.5 million km2), but are also considered underestimates (Finlayson et al. 1999). Much of the total area is inland wetlands: for example, 5.7 million km2 of natural freshwater wetlands (including 3.85-4 million km2 of peatlands); and 1.3 million km2 of rice paddy (see Spiers 1999). Open water wetlands (both natural and human-made) cover a seasonal maximum of 5.66 million km2 (Prigent et al. 2012). Areas of coastal wetlands are smaller, and include 0.5 million km2 of major estuaries (MA 2005c); 0.566 million km2 of major deltas (Coleman et al. 2008); 0.138-0.147 million km2 of mangroves (FAO 2007; Giri et al. 2011); 0.177 million km2 of seagrass beds (Green & Short 2003); and 0.392 million km2 of saltmarshes and up to 0.6 million km2 of coral reefs (cited in Crooks et al. 2011).
What is the state of the remaining wetlands?
Wetlands continue to face severe pressures, despite many benefits they provide to people and many conservation/restoration successes from recent efforts at local to national to global scales. Although there is no comprehensive assessment of the state of the world’s remaining wetlands, many are recognised as having deteriorated in status and to be currently degraded. In 2012, 127 governments reporting to the Ramsar Convention indicated that the overall status of their wetlands had deteriorated in recent years in 28% of countries but improved in only 19% (Ramsar Convention 2012). Other examples include that coral reef condition (live hard coral cover) deteriorated by 38% between 1980 and 2004, with most occurring in the 1980-1990 decade (Butchart et al. 2010). Eutrophication of inland and particularly coastal wetlands, leading to algal blooms and hypoxia (low oxygen levels) is increasing in some areas, for example the Baltic Sea (Conley et al. 2011). Major changes in water management, including through damming and increasing abstraction upstream has led to impacts on downstream wetlands
16
TeeB for WaTer anD WeTlanDs
in many river basins, through reductions or changes in water availability (e.g. Carpenter et al. 2011). Long-term and accelerating reduction of regulating services has occurred in Yangtse basin wetlands, linked to agricultural intensification (Dearing et al. 2012). In many areas of the world, island wetlands have been degraded at a worrying pace, due to the absence of a clear legal
framework for their protection combined with strong pressure for tourism development in coastal areas. For example, in Greece 60 island wetlands have been lost during the last 3 decades (Catsadorakis et al, 2007; Georgiadis et al., 2010). Designation of wetlands as protected areas, nationally or internationally, does not mean that they necessarily remain in a healthy state: for example, in China the area of national wetland reserves has decreased over the past 30 years, and over three-quarters of reserves are reported as in poor condition (Zheng et al. 2012). Likewise, while 30% of Ramsar Contracting Parties report that the condition of their Ramsar Sites has improved in recent years, 17% report deteriorating status.
What are the costs of inaction?
Many water resource developments that have been undertaken to increase access to water have not given adequate consideration to harmful trade-offs with other services provided by wetlands, and many such conversions of wetlands have favoured provisioning services (notably food production) at the expense of losing or reducing delivery of regulating and supporting services from both those locations, and elsewhere downstream in river basins (MA, 2005b). Given the often high values, and the diversity, of ecosystem services provided by intact wetlands (section 2.2), and that a large proportion of these values are from water-related regulating services such as regulation of water flows, moderation of extreme events and water purification, the widespread and major losses of all types of inland and coastal wetlands have inevitably already led to a progressively increasing major loss of wetland ecosystem service value delivery to people. Permitting the remaining wetlands be converted or letting them degrade means further loss of their value to people.
Such costs of inaction (or actions to convert wetlands) can be very high. For example, coastal wetlands in the USA are estimated to currently provide US$23.2 billion per year in storm protection services alone. But large areas of such wetlands have already been lost, and further loss is continuing. A loss of one hectare of such wetland is estimated to correspond to an average increase in storm damage from specific storms of US$33,000 (Constanza et al. 2008). The costs of just one recent summer flooding event in the UK, in 2007, are estimated at £3.2 billion (USD 5.2 billion) (Environment Agency 2010), with damage and costs occurring largely in areas of former river floodplain
converted through urban, industrial and infrastructure developments.
2.4 The economic benefits of restoring degraded wetlands
When wetlands have been allowed to be lost or degraded, there is a second category of the cost of such inaction: the cost of restoration (see sections 5.3 for further exploration of the costs and benefits of restoring different wetland types). Overall, whilst costs of restoration can be high, and require long-term management investment, the resulting economic benefits to people can outweigh such costs (see e.g. Alexander & McInnes 2012). However, in general even with active restoration interventions, once wetlands have been disturbed, they either recover slowly (over decades or centuries) or move towards alternate states that differ from their original (pre-disturbance) state (Moreno-Mateos et al. 2012; Mossman et al. 2012). In any case, just as loss and degradation of wetlands leads to loss of the economic benefits of ecosystem services, restoration of wetlands can restore some of those services and hence deliver high economic benefits.
Removing the stressors or pressures on the ecological character of existing wetlands is the best practice for preventing further loss and degradation. When this is not feasible or when degradation has already occurred, wetland restoration must be considered as a potential response option. The commitments and obligations under the Ramsar Convention clearly mandate wise use and the avoidance of wetland loss and degradation as the first and highest priority. The Convention has also provided national governments and others with a framework on how to avoid, mitigate and compensate for wetland loss and degradation, which includes identification of the opportunities for wetland restoration12.
In the past, some wetland restoration efforts have failed due to, among other things, narrow objectives which focus on one benefit or a partial suite of benefits. The inability to recognise or appreciate the potential for achieving multiple benefits across sectors has, in some cases, precluded cost-effective, participatory approaches to wetland restoration that may be more successful in recovering benefits and delivering more sustainable outcomes for people and the environment.
Decision makers should recognise the full suite of environmental, cultural and socio-economic benefits from wetland restoration, as the failure to recognize these multiple benefits often greatly undermines the rationale for wetland restoration and compromises future well-being (Alexander et al., 2012).
Box 2.6 shows some examples of benefits provided by wetland restoration. Other examples are included in Box 5.1.
17
TeeB for WaTer anD WeTlanDs
Box 2.6 Examples of benefits related to restoration of wetlands
Waza floodplain, Cameroon
Loth (2004) calculated that engineering works to reinstate the flooding regime in the Waza floodplain (8,000 km2), which was damaged in the 1970’s by the construction of a large irrigated rice scheme, would cost approximately US$11 million. The same study calculated that the economic effects of flood loss were almost US$50 million over the 20 years since the scheme was constructed, including direct economic losses of more than US$2 million/year through reduced dry season grazing, fishing, natural resource harvesting and surface water supplies. The costs of restoring the flood regime would be covered by the benefits in less than five years and would bring around US$2.3 million additional income per year to the region. This figure includes the opportunity cost of the loss of millet and sorghum production and of gum arabic harvesting opportunities.
Source: Loth (2004)
Manalana wetland, South Africa
In 2006 the ‘Working for Water’ (WfW) public works programme invested €86,000 to restore the Manalana wetland (near Bushbuckridge, Mpumalanga). It was estimated that the total economic benefits provided by the rehabilitated wetland was €182,000 in Net Present Value terms; that the value of livelihood benefits derived from the degraded wetland was just 34% of what could be achieved after investment in ecosystem rehabilitation; and that the provisioning services now provided by the rehabilitated wetlands have an economic value of €297/household per year. In addition, the Manalana wetland acted as a safety net for poor households during periods of economic difficulties such as high unemployment.
Source: Pollard et al. (2008)
Hail Haor wetlands, Bangladesh
The Management of Aquatic ecosystems through Community Husbandry (MACH) project, initiated by the Bangladesh government and the United States Agency for International Development (USAID), aimed to address the problems related with the drainage of wetlands for agricultural production. MACH estimated the economic benefits of the Hail Haor wetlands to be almost US$8 million per year using GIS-based land-use mapping and interviews with the local community.
The economic benefits of fishery, non-fish aquatic products, use of aquatic vegetation, pasture, dry season rice, transportation and recreation were included. Thanks to the protection strategy implemented by the project, fish catch improved by 80% in Hail Haor. Moreover, ecotourism in the area increased as a result of the rising number of resident bird species allowed by the ban on fishing and aquatic plant harvesting in the protected area.
Source: Thompson and Balasinorwala (2010)Restoration of wetlands for local livelihoods and health, Central Asia
Intensification and expansion of irrigation activities in Central Asia led to shrinking of the Aral Sea and degradation of the Amu Darya delta in Uzbekistan, leaving only 10 per cent of the original wetlands. The Interstate Committee on the Aral Sea, in consultation with the World Bank, requested the development of a coherent strategy for the restoration of the Amu Darya delta. A Strategic Environmental Assessment (SEA) approach was used to structure the decision making process. Valuation of the ecosystem services was instrumental in changing the course of development from technocratic and unsustainable interventions, towards the restoration of natural processes that were better capable of creating added value to inhabitants under the dynamic conditions of a water-stressed delta. The process created a strong coalition of local stakeholders and authorities, resulting in the necessary pressure to convince the national government and the donor community to invest in a pilot project- the restoration of the Sudoche wetlands. The project resulted in an increase in productivity of the region:
• The income of both poorest and richest households have increased;
• The number of cattle has increased;• Production of hay for own use and selling on
regional market has increased; • Cutting of reeds and selling of reed-fiber mats
(boards) has increased; • Fish consumption has increased up to 15 kg a
week per family; • Population of muskrats increased.
The best indicator of success is the return of young people to the villages in the region.
Source: Slootweg (2010a); Slootweg et al. (2008)
Pho
to c
red
it: N
ick
Dav
idso
n
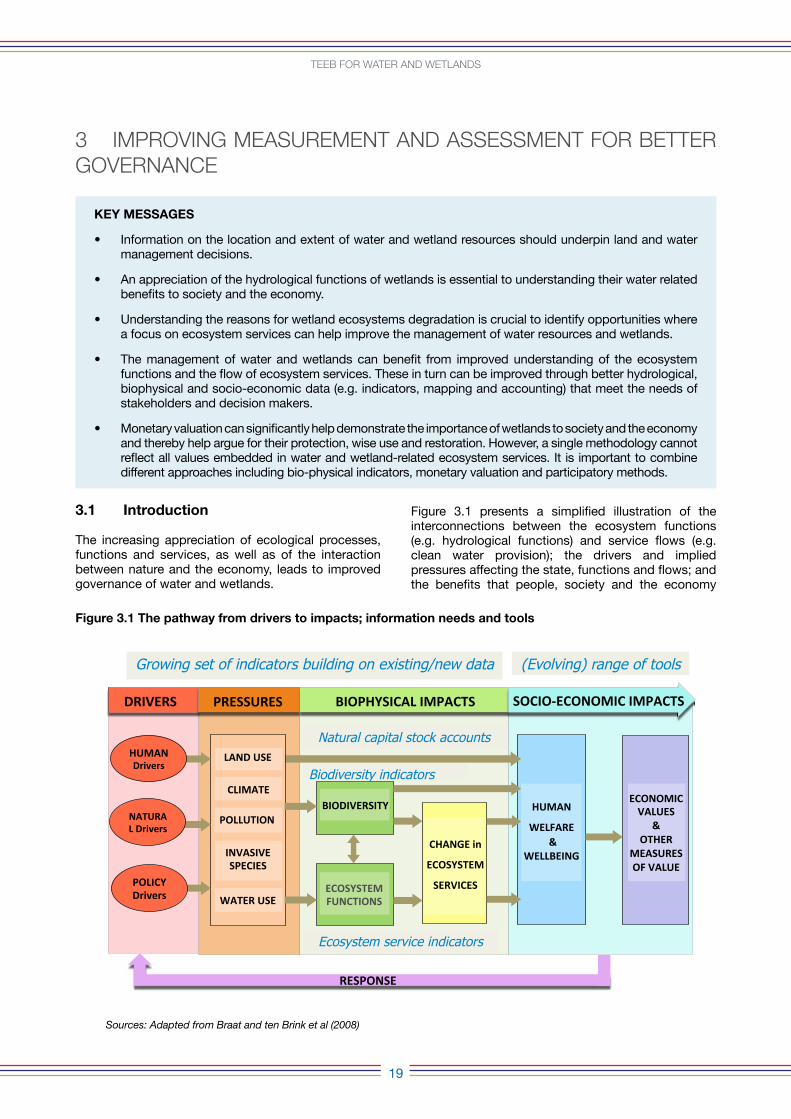
TeeB for WaTer anD WeTlanDs
19
3 imProving measUremenT anD assessmenT for BeTTer governance
KEY MESSAGES
• Information on the location and extent of water and wetland resources should underpin land and water management decisions.
• An appreciation of the hydrological functions of wetlands is essential to understanding their water related benefits to society and the economy.
• Understanding the reasons for wetland ecosystems degradation is crucial to identify opportunities where a focus on ecosystem services can help improve the management of water resources and wetlands.
• The management of water and wetlands can benefit from improved understanding of the ecosystem functions and the flow of ecosystem services. These in turn can be improved through better hydrological, biophysical and socio-economic data (e.g. indicators, mapping and accounting) that meet the needs of stakeholders and decision makers.
• Monetary valuation can significantly help demonstrate the importance of wetlands to society and the economy and thereby help argue for their protection, wise use and restoration. However, a single methodology cannot reflect all values embedded in water and wetland-related ecosystem services. It is important to combine different approaches including bio-physical indicators, monetary valuation and participatory methods.
3.1 Introduction
The increasing appreciation of ecological processes, functions and services, as well as of the interaction between nature and the economy, leads to improved governance of water and wetlands.
Figure 3.1 presents a simplified illustration of the interconnections between the ecosystem functions (e.g. hydrological functions) and service flows (e.g. clean water provision); the drivers and implied pressures affecting the state, functions and flows; and the benefits that people, society and the economy
Figure 3.1 The pathway from drivers to impacts; information needs and tools The Pathway from Drivers to Impacts, Informa8on Needs and Tools
Source: Adapted from Braat and ten Brink et al (2008)
DRIVERS PRESSURES BIOPHYSICAL IMPACTS
LAND USE
CLIMATE
POLLUTION
INVASIVE SPECIES
WATER USE
HUMAN
WELFARE &
WELLBEING
ECONOMIC VALUES
& OTHER
MEASURES OF VALUE
SOCIO-‐ECONOMIC IMPACTS
RESPONSE
CHANGE in
ECOSYSTEM
SERVICES
BIODIVERSITY
ECOSYSTEM FUNCTIONS
HUMAN Drivers
NATURAL Drivers
POLICY Drivers
Growing set of indicators building on existing/new data (Evolving) range of tools
Natural capital stock accounts
Ecosystem service indicators
Biodiversity indicators
Sources: Adapted from Braat and ten Brink et al (2008)
20
TeeB for WaTer anD WeTlanDs
gain from nature and the tools to value these benefits - whether adopting economic or other metrics. The figure also shows the role of indicators and different measurement/assessment approaches in contributing to the evidence base and good governance. Environmental accounts are also becoming an increasingly important part of the landscape (see section 3.6 on the System of Environmental-Economic Accounting – SEEA).
The Convention on Biological Diversity’s (CBD) Strategic Plan for Biodiversity 2011-2020 includes commitments to raise awareness of the value of biodiversity and to integrate them into plans, strategies, and accounts (Aichi Biodiversity Targets 1 and 2). Parties to the CBD are currently revising their National Biodiversity Strategies and Actions Plans (NBSAPs) to take on board physical assessments of nature and flow of ecosystem services. Collection, systematisation, and interpretation of environmental, economic, and social information are crucial to this process.
The values of nature: a combination of measures to develop the full picture
Historically, there has been a lack of understanding of the multiple values of water and wetlands. The values of these ecosystems have seldom been adequately acknowledged or taken into account in the policy making and private decision making processes. This has been a contributing factor to the continuous loss and degradation of water-related ecosystems and wetlands that we are experiencing. Improving awareness on the importance and values of nature is crucial for better governance as a way to support conservation, wise use and restoration of wetlands, while helping achieve development objectives.
A focus on ecosystem services in the management of water and wetlands can help identify opportunities for: 1) better harnessing and maintaining the multiple benefits that ecosystem services related to water and wetlands provide; 2) developing more cost effective strategies than conventional technical solutions can offer; and 3) avoiding costs related to the loss of biodiversity and ecosystem services.
In order to unlock these potentials, it is necessary to recognise who benefits by how much from which ecosystem services and how this might improve with positive restoration and management activities - or risk being negatively affected by any ecosystem degradation.
Different approaches and tools can help assess the benefits that flow from water and wetlands by providing different and complementary information, including qualitative, quantitative, spatial and monetary approaches. Given their relevance to demonstrating value, each of the elements is presented below.
1) Qualitative analysis is based on non-numerical information, which describes values and benefits that are not easily translated into quantitative information (e.g. landscape beauty, impacts on security and wellbeing, cultural and spiritual values). For instance, determining which wetlands have particular cultural values to which communities is in itself an important means of communicating value.
2) Quantitative data are used to represent the state of, and the changes in, the ecosystems and the services they provide using numerical units of measurement (e.g. groundwater availability in a watershed in cubic metres; nitrogen and phosphorus in a water body in micrograms per litre; carbon annually sequestered in peatlands in tonnes per hectare per year; number of people who benefit from access to clean water from wetlands). The value of ecosystems can be demonstrated using physical stock and flow indicators as well as social indicators (e.g. proportion of households benefitting from access to clean water).
3) Geospatial mapping allows the quantitative data to be linked with geographical information (e.g. which community benefits from clean water provision from a given wetland). It can also be the basis of modelling the outcomes of alternative land and water management decisions on specific wetland sites. This can be integrated into local accounting and decision making tools (e.g. InVEST, see section 3.4).
4) Monetary valuation can build on biophysical information on the services provided by ecosystems to derive values (e.g. carbon storage in wetland sea grass systems of tCO2/ha can be converted to stock and sequestration values by multiplying it by the carbon price in the international markets). It can be of help to inform a specific decision, management tool or policy instrument, e.g. the strategies of using wetlands for carbon sequestration, ecosystem based adaptation to climate change, flood mitigation or the establishment of a water fund (see section 3.5).
Assessments of ecosystem services that build on these approaches and that aim at informing ecosystem management and decision making should also usefully include a stakeholder process for targeting ecosystem services that are of high priority for the different stakeholder categories. Participation can be important for both a provision of evidence (and hence quality of the analysis) and for the buy-in and acceptance of the decision (e.g. land use change, permits, investments, or payment for ecosystem services). This can help take into account qualitative indicators of importance and stakeholder preferences, thus complementing the quantitative and monetary indicators.
Integrative models exist that build on these approaches
21
TeeB for WaTer anD WeTlanDs
and describe in a qualitative or quantitative way possible changes in service delivery and their socio-economic consequences (see the pathway as depicted in Fig. 3.1). The key challenge of these models is to capture the complexity of ecosystem processes and ecosystem service valuation, while remaining transparent and user-friendly tools. Examples of these approaches include Bayesian belief networks, which allow the use of qualitative, quantitative, monetary, appreciation data, while involving stakeholders (van der Biest et al, 2013; Haines, 2011).
The sections below explore in more detail the issues, practices and some key developments of different parts of Figure 3.1 and different steps related to assessing and demonstrating the value of water and wetlands. Section 3.2 focuses on biodiversity and ecosystem service indicators. Section 3.3 presents some examples of geospatial mapping. Section 3.4 discusses advantages and limits of monetary valuation to argue for wetland conservation and restoration. Section 3.5 explores environmental accounting. Section 3.6 focuses on the information needs for an improved wetland and water management. Finally, section 3.7 presents six practical steps assessing values to inform governance of environmental challenges. See also MA (2005a), TEEB (2010), TEEB (2011), TEEB (2012b) on the state of ecosystems, the flow of ecosystem services, their indicators, measurement and assessment.
3.2 Indicators
Information on the state of ecosystems is fundamental for assessing their capacity to deliver ecosystem services. It is also important to explore possible ecological thresholds, where ecosystem functions can be irreversibly lost, with often significant (and non-linear) impacts on the flow of ecosystem services.
Good water and wetland management requires information on the stock of natural capital, on the flow of ecosystem services it provides and on how these are changing.Indicators play an important role in informing public policies regarding water and wetlands. They report on the overall status, trends of ecosystems and their values, thereby helping to identify the most urgent environmental problems to address, while also helping to set up the policy priorities. In addition, they are key to target setting, policy, and instrument design and evaluation, as they can be used to assess to what extent a certain policy is contributing to the achievement of a desired policy objective. It is important, therefore, to identify and use indicators that capture the different dimensions of values of water and wetlands and are useful in practical decision making.
The level and type of evidence may be very different when considering the national level (e.g. through national water or carbon accounts) and the local level, where data needs should be specifically tailored to the local problem and context (e.g. decisions on permit granting to drain a wetland, or designing a payment for ecosystem service scheme for water purification and provision or flood control).
One area of new momentum at the international level is that on bio-physical and ecosystem service indicators (ten Brink et al., 2011a; TEEB, 2010). They are powerful tools to help demonstrate and communicate the values of nature. Table 3.1 presents some examples of ecosystem service indicators. Which indicators should be the focus of policy attention depends on the policy or decision objective and on the particular ecosystem being looked at. This in turn reflects national priorities and challenges.
Pho
to c
red
it: D
anie
la R
ussi
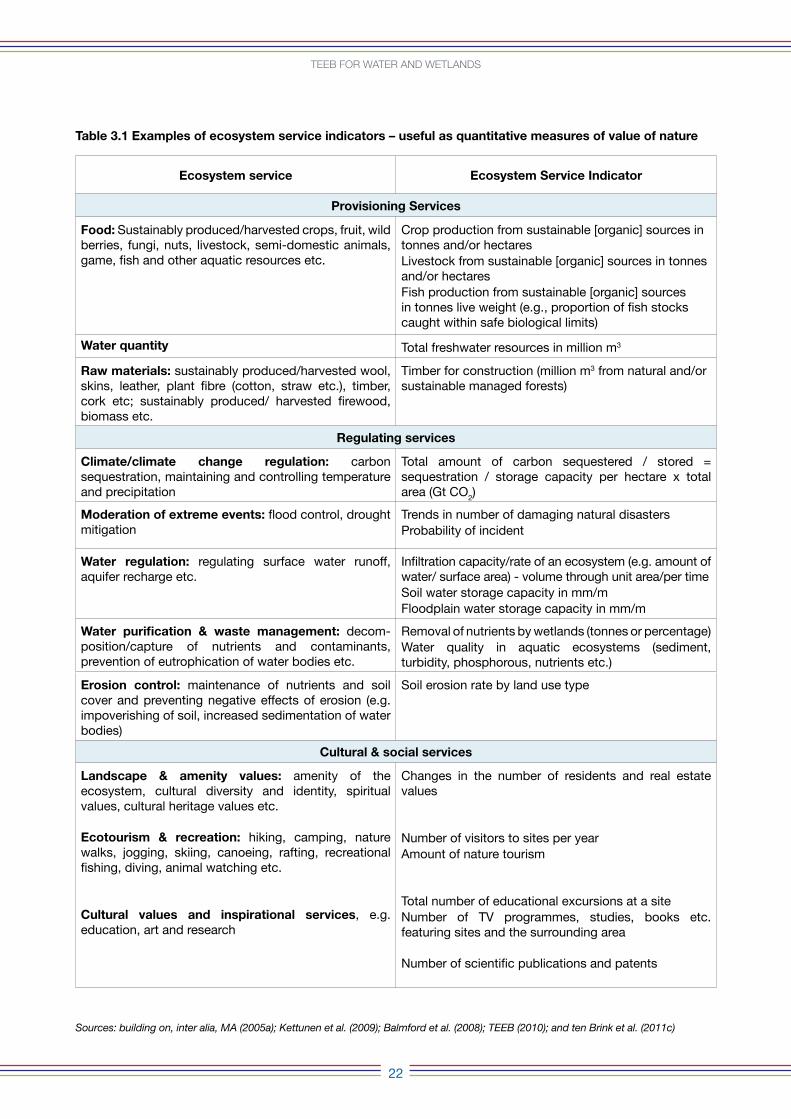
Ecosystem service Ecosystem Service Indicator
Provisioning Services
Food: Sustainably produced/harvested crops, fruit, wild berries, fungi, nuts, livestock, semi-domestic animals, game, fish and other aquatic resources etc.
Crop production from sustainable [organic] sources in tonnes and/or hectaresLivestock from sustainable [organic] sources in tonnes and/or hectaresFish production from sustainable [organic] sources in tonnes live weight (e.g., proportion of fish stocks caught within safe biological limits)
Water quantity Total freshwater resources in million m3
raw materials: sustainably produced/harvested wool, skins, leather, plant fibre (cotton, straw etc.), timber, cork etc; sustainably produced/ harvested firewood, biomass etc.
Timber for construction (million m3 from natural and/or sustainable managed forests)
regulating services
climate/climate change regulation: carbon sequestration, maintaining and controlling temperature and precipitation
Total amount of carbon sequestered / stored = sequestration / storage capacity per hectare x total area (Gt CO2)
Moderation of extreme events: flood control, drought mitigation
Trends in number of damaging natural disastersProbability of incident
Water regulation: regulating surface water runoff, aquifer recharge etc.
Infiltration capacity/rate of an ecosystem (e.g. amount of water/ surface area) - volume through unit area/per timeSoil water storage capacity in mm/mFloodplain water storage capacity in mm/m
Water purification & waste management: decom-position/capture of nutrients and contaminants, prevention of eutrophication of water bodies etc.
Removal of nutrients by wetlands (tonnes or percentage)Water quality in aquatic ecosystems (sediment, turbidity, phosphorous, nutrients etc.)
Erosion control: maintenance of nutrients and soil cover and preventing negative effects of erosion (e.g. impoverishing of soil, increased sedimentation of water bodies)
Soil erosion rate by land use type
cultural & social services
Landscape & amenity values: amenity of the ecosystem, cultural diversity and identity, spiritual values, cultural heritage values etc.
Ecotourism & recreation: hiking, camping, nature walks, jogging, skiing, canoeing, rafting, recreational fishing, diving, animal watching etc.
cultural values and inspirational services, e.g. education, art and research
Changes in the number of residents and real estate values
Number of visitors to sites per yearAmount of nature tourism
Total number of educational excursions at a siteNumber of TV programmes, studies, books etc. featuring sites and the surrounding area
Number of scientific publications and patents
Table 3.1 Examples of ecosystem service indicators – useful as quantitative measures of value of nature
Sources: building on, inter alia, MA (2005a); Kettunen et al. (2009); Balmford et al. (2008); TEEB (2010); and ten Brink et al. (2011c)
TeeB for WaTer anD WeTlanDs
22
TeeB for WaTer anD WeTlanDs
23
Indicators can be designed for a variety of policy objectives. For example, Box 3.1 shows information on a set of indicators being considered by the Subsidiary Body on Scientific, Technical and Technological Advice (SBSTTA) to measure, inter alia, the state of water-related ecosystems and the ecosystem services they provide in the context of the implementation of the Strategic Plan for Biodiversity 2011-2020 and its Aichi Biodiversity Targets.
This work also shows that many indicators are potentially available, including through environmental agencies and statistical bodies, beyond the traditional environment/biodiversity interests. This is particularly the case for those used for monitoring progress towards sustainable development targets.
Indicators within the Millennium Development Goals (MDG) and the Rio+20 successor Sustainable Development Goals (SDG), that are currently being discussed, include several related to water – notably Target 7c under Goal 7 (Environmental sustainability) – which is to halve by 2015 the proportion of the population without sustainable access to safe drinking water and basic sanitation. Wetland ecosystems will be critically important in contributing to achieving these targets. Ecosystem services from wetlands are also means of achieving other key MDGs. These include Goal 1 on poverty and hunger and Goals 3 to 5 on equality and health, given, inter alia, the importance of ecosystem services especially to the rural poor (TEEB, 2011) (see also discussion in Chapter 5).
Figure 3.2 presents a more complete picture of the range of targets from the MDG commitments and the Strategic Plan on Biodiversity 2011 to 2020. This figure builds on and extends the earlier figure on the water cycle (Figure 2.1).
Box 3.1 Potential water-related ecosystem service indicators for the Strategic Plan for Biodiversity 2011-2020 and the Aichi Biodiversity targets
1. Clean water
1.1: Proportion of population using an improved drinking water source (in use)
1.2: Proportion of population using an improved sanitation facility (in use)
1.3: Water quality (in use)1.4: Wastewater treatment (in use)1.5: (a) Proportion of cities obtaining water
supplies from protected areas; and/or (b) Proportion of protected areas established and managed primarily to protect water supplies (to be derived)
1.6: Area of wetland used in water treatment (including both natural and constructed) needing development)
1.7: Access to improved drinking water based on change in water quality (under development through FAO LADA/UNCCD)
2. Water availability/water security
2.1: Water scarcity (or presented as “Proportion of total water resources used”) (in use)
2.2: Water use intensity by economic activity (in use)
2.3: Human and economic losses due to water-related natural disasters (in use)
2.4: Percentage of population living in water hazard prone areas (needs development)
2.5: Land affected by desertification (in use)2.6: Water footprint (needs some development)2.7: Soil moisture (likely available soon from new
remote sensing data)2.8: Climate moisture index (CMI) (Aridity index) (in
use)
2.9: Extent of terrestrial carbon storage vulnerable to water insecurity (can be derived from water scarcity and carbon storage metrics)
2.10: Trends in number of water-related conflicts and number/magnitude of inter-state conflicts (needs some development)
3. Sediment transfer
3.1: Sediment transfer (partly available, needs to be further derived)
4. Provisioning services related
4.1: Actual hydropower installed capacity/potential capacity (in use)
4.2: Area water-logged by irrigation (in use)4.3: Area salinised by irrigation (in use)4.4: Crop water productivity (in use)
5. Disease regulation
5.1: Population affected by water-related diseases (in use)
5.2: Parasite loadings (needs further work)
6. Indicators of enabling conditions (water-related)
6.1: Incorporation of water-related ecosystem services into national planning processes (can be derived from existing sources)
6.2: Progress in implementation of Integrated Water Resources Management (IWRM) (in use)
6.3: Women represented in water management (under development, included in response to the tenth meeting of the Conference of the Parties request to capture gender)
Source: SCBD (2011)
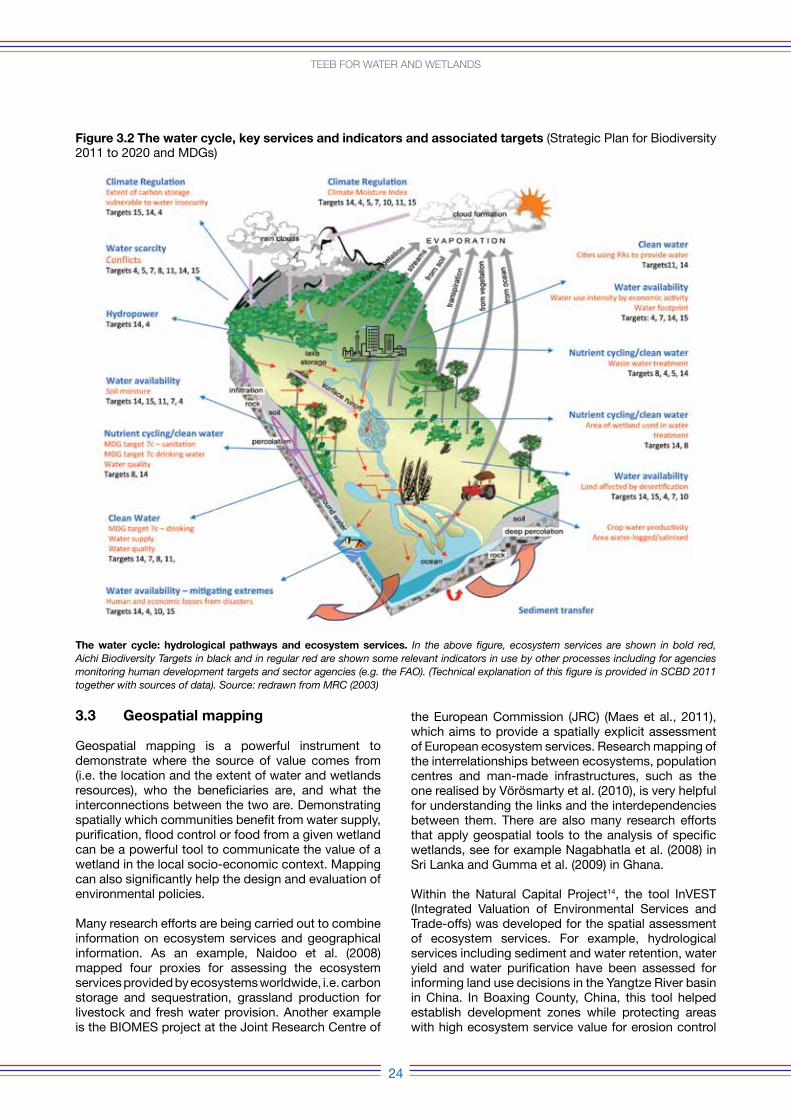
3.3 Geospatial mapping
Geospatial mapping is a powerful instrument to demonstrate where the source of value comes from (i.e. the location and the extent of water and wetlands resources), who the beneficiaries are, and what the interconnections between the two are. Demonstrating spatially which communities benefit from water supply, purification, flood control or food from a given wetland can be a powerful tool to communicate the value of a wetland in the local socio-economic context. Mapping can also significantly help the design and evaluation of environmental policies.
Many research efforts are being carried out to combine information on ecosystem services and geographical information. As an example, Naidoo et al. (2008) mapped four proxies for assessing the ecosystem services provided by ecosystems worldwide, i.e. carbon storage and sequestration, grassland production for livestock and fresh water provision. Another example is the BIOMES project at the Joint Research Centre of
the European Commission (JRC) (Maes et al., 2011), which aims to provide a spatially explicit assessment of European ecosystem services. Research mapping of the interrelationships between ecosystems, population centres and man-made infrastructures, such as the one realised by Vörösmarty et al. (2010), is very helpful for understanding the links and the interdependencies between them. There are also many research efforts that apply geospatial tools to the analysis of specific wetlands, see for example Nagabhatla et al. (2008) in Sri Lanka and Gumma et al. (2009) in Ghana.
Within the Natural Capital Project14, the tool InVEST (Integrated Valuation of Environmental Services and Trade-offs) was developed for the spatial assessment of ecosystem services. For example, hydrological services including sediment and water retention, water yield and water purification have been assessed for informing land use decisions in the Yangtze River basin in China. In Boaxing County, China, this tool helped establish development zones while protecting areas with high ecosystem service value for erosion control
Figure 3.2 The water cycle, key services and indicators and associated targets (Strategic Plan for Biodiversity 2011 to 2020 and MDGs)
The water cycle: hydrological pathways and ecosystem services. In the above figure, ecosystem services are shown in bold red, Aichi Biodiversity Targets in black and in regular red are shown some relevant indicators in use by other processes including for agencies monitoring human development targets and sector agencies (e.g. the FAO). (Technical explanation of this figure is provided in SCBD 2011 together with sources of data). Source: redrawn from MRC (2003)
24
TeeB for WaTer anD WeTlanDs
and flood protection by setting aside key conservation areas (Yukuan et al., 2010). The same instrument has also been used to help inform the establishment of a Water Fund in Colombia (see Box 5.3 and Annex I), the development of an Integrated Coastal Zone Management Plan in Belize, and to locate the best areas for conservation activities and define the best management practices for forestry and plantations in Indonesia15. In each case, the existence and value of water-related ecosystem services has been an important aspect of the evidence base driving change.
There is also a wide range of complementary research projects which aim to improve the availability and quality of information on wetlands at the global level. Box 3.2 presents two such examples that should help improve the evidence base on water, wetlands and their ecosystem services.
Box 3.2 Towards improved availability and quality of information on wetlands and water
Developing a Global Wetland Observation System (GWOS)
Data and information on the location, areas and state of wetlands and their ecosystem services are patchy, and information is scattered widely through published and unpublished sources and datasets. The Ramsar Convention has recognised the urgent need to improve access to, and analysis of, wetland data and information, and has placed a top priority in its future scientific and technical work (COP11 Resolution XI.17, 2012) for establishing a “Global Wetland Observation System” (GWOS), for the benefit of the Convention and for all others concerned with the wise use of wetlands. The GWOS is being scoped and developed as an open partnership, linked with GEO-BON and others, between those involved with collecting and analysing wetland-related data, and those needing to improve their access to such information for wetland assessment and reporting purposes. It is expected that its functionality will include access to published papers and reports, spatial data-layers relevant to wetlands, tools for spatial analysis of wetland status and trends, and an archive function to help maintain access to time-limited project datasets. The GWOS will provide a source for not only the periodic State of the World’s Wetlands and their Services (SoWWS) reporting to the Ramsar Convention, but also for a Watershed Health Index tool similar to the recently published Ocean Health Index (Halpern et al. 2012), and for the Convention on Biological Diversity (CBD) and the upcoming Intergovernmental Science-policy Platform on Biodiversity and Ecosystem Services (IPBES), amongst others.
Piloting a regional GWOS approach: the Mediterranean Wetlands Observatory (MWO) and Globwetlands-II project
The Mediterranean Wetlands Observatory (MWO) is a Mediterranean Wetlands Initiative (MedWet)/ Station Biologique de la Tour du Valat initiative to monitor and assess Mediterranean wetlands. It demonstrates how a regional GWOS partnership approach for sharing and serving up wetland information for decision-makers can be successfully developed. In 2012 the MWO issued its first technical report and synthesis for decision-makers, providing an assessment of past and present status of Mediterranean wetlands, and their future issues and pressures, the “Mediterranean Wetland Outlook 2012”, available on: http://www.medwetlands-obs.org/.
The European Space Agency’s “Globwetlands-II” project, working in partnership with Ramsar’s Scientific & Technical Review Panel, Medwet, the MWO, Wetlands International and a number of Ramsar/Medwet national focal points, has been designed to both support the work of the MWO and to develop better use of remote sensing techniques for the monitoring and management of wetlands, through the creation of harmonised geo-information maps and indicators. It consists of a remote sensing toolbox for satellite image processing and a GIS toolbox for indicator calculation. As well as supporting in-country capacity-development for using satellite imagery, it has also been assessing trends in Mediterranean wetlands and their surrounding areas since the 1970s, focusing on the southern and eastern Mediterranean coasts. The techniques are now being planned for application in the northern Mediterranean, and have the potential for transfer to other parts of the world. More information is available on: http://www.globwetland.org.
The Global Wetlands Initiative
The International Water Management Institute’s (IWMI) “Global Wetlands Initiative” will provide a multi-purpose and multiple-scale inventory with core data elements which will be built through a combination of continental and regional initiatives with regional and national delivery of the outcomes in order to ensure greater relevance and effective dissemination of wetland-related information. The initiative aims to provide a multiple-scale and purpose-driven global wetland mapping and inventory data resource through continental and regional projects that can support further wetland assessment and management. IWMI is one of the five International Organisation Partners (IOPs) of the Ramsar Convention. More information is available on: http://www.iwmi.cgiar.org/wetlands/GlobalWetlandInventoryMapping.asp
25
TeeB for WaTer anD WeTlanDs
26
TeeB for WaTer anD WeTlanDs
3.4 Monetary valuation
Monetary valuation can translate part of the information obtained through qualitative and quantitative indicators into monetary figures. For example, the wastewater purification service provided by healthy wetlands can be valued in monetary terms through the equivalent cost of a wastewater treatment plant that would provide a similar service. Additionally, the revenues generated from tourism can give an indication of the importance of the cultural ecosystem services provided by wetlands. Some ecosystem services have a direct economic value that can be readily monetised, such as the local economic value of fish catches. Monetary valuation can give an indication of the society’s preferences that is easily understandable and communicable. It can help make explicit preferences that are normally hidden and not reflected in market prices (e.g. the preference for clean water).
In many cases, provisioning ecosystem services (such as food or timber) are more visible and are favoured in the policy-making process because they have a market price, but there are many other ecosystem services that are less visible and often overlooked or underrepresented in the policy-making processes. The calculation of the economic value of traditionally less well covered provisioning services (e.g. the value of some genetic materials or of water provision from wetlands) and non-provisioning ecosystem services (e.g. water purification, waste water treatment, and erosion control) contribute to the arguments for conservation, wise use and restoration.
For example, a study carried out in 2009 by the International Union for Conservation of Nature (IUCN) together with the Environment and Agricultural Research Centre and the Economic and Social Policy Analysis Centre estimated that the annual economic benefits derived from agriculture in the Sourou Valley, Burkina Faso, were only 3% of the total ecosystem services (valued at US$21.2 million), despite the fact that in the mid-1990s the government had launched a master plan for agricultural development in the region. Timber products instead accounted for 37%, non-timber forest products for 21%, pastures for 18%, and both fishery and transportation on water for 10% (Somda and Nianogo, 2010). As another example, a recent study demonstrated that most potential carbon emissions due to mangrove loss could be avoided at a cost between $4 and $10 per ton of CO
2 (Siikamäki et al., 2012).
The outcomes of any valuation process depend on what the various stakeholders value, whose values count, who benefits, and the manner in which social and ecological systems interlinkages are accounted for. Values and the process of valuation reflect socially and culturally constructed realities linked to worldviews, mind-sets and belief systems shaped
by social interactions, as well as political and power relations operating within a realm of local, regional and global interdependencies (Wilk and Cliggett, 2006; Hornborg et al., 2007).
Thus the choice of valuation methods also involves choosing the socio-cultural context which emerges from the understanding of what values are, or should be, and how they should be elicited. Valuation methods imply certain models of humans, nature and their interactions and they define whether values are revealed, discovered or constructed (Vatn and Bromley, 1994). Seen in this perspective, valuation methods function as “value-articulating” institutions by defining a set of rules concerning valuation processes (Jacobs, 1997). In other words, valuation provides a tool for self-reflection, alerting the different groups of stakeholders to the consequences of their choices and behaviour on various dimensions of natural and human capital (Zavestoski, 2004). It can therefore contribute to change the way in which societies manage wetlands.
Different methods can be used for monetary valuation and each one has its own advantages and limitations. They provide different kinds of information and differ in the degree of required resources and stakeholder involvement. The three most used categories of monetary valuation are the following:
1) Monetary valuation methodologies based on markets: for example using market prices to value services not in the market (e.g. non-marketed fish, timber, other forest products, water); estimating value via the avoided cost of prevented environmental damage; using the costs of substitutes, mitigation or restoration options as indicators of value;
2) Monetary valuation methodologies based on revealed preferences: for example, using the Travel Cost method to estimate the value of a protected area through the amount of time and money people spend to visit it; using the Hedonic Pricing method, which use changes in property prices due to changes in the surrounding environment as an indicator of landscape value;
3) Monetary valuation methodologies based on stated preferences: for example using Contingent Valuation, which is based on asking people’s willingness to pay for improved environmental protection (e.g. improved water quality) or to accept compensation for a reduction in the environmental quality.
Box 3.3 shows some examples of monetary valuation of ecosystem services provided by wetlands, complementing those in chapter 2.
27
TeeB for WaTer anD WeTlanDs
Given the growing level of interest in monetary valuation and commitments to understanding the values of nature, it is important to have a realistic insight on the scope and limitations of different valuation tools (see TEEB, 2010, for a discussion). Generally, a range of methodologies will be needed to help assess the range of values embedded in water and wetland-related ecosystem services, which include both biophysical and monetary approaches. It has been noted that ethical values, cultural needs, human rights, sacredness, and ancestral rights are of fundamental importance and not amenable to economic analysis (Martinez-Alier et al., 1997). Furthermore, there are concerns regarding the use of monetary valuation and a perception that monetary valuation could lead to a “commoditisation of nature” (McCauley, 2006). It has also been argued that monetary valuation is anthropocentric in nature and ignores the ecosystems that do not provide direct benefits to people and the economy.
It is important to recognise these concerns. However, to ignore the economic value (including monetary value) of nature is to reduce the ability to make robust arguments that have a chance of informing decisions for the conservation of important ecosystems. The use of monetary valuation in many cases enhances the social visibility of the benefits brought about by environmental protection and restoration. By doing so, it can act as a counterweight to the pressures causing environmental degradation, which are driven by economic activities where market prices do not take into account negative impacts on health and the environment (sometimes termed “externalities”16). In these cases, economic assessments can help address this imbalance by demonstrating the importance of protecting and restoring our natural heritage to policy-
Box 3.3 Examples of monetary values of ecosystem services delivered by wetlands
Water supply
The Te Papanui Conservation Park (Lammermoor Range) provides the Otago region, New Zealand, with ecosystem services valued at around US$96 million (which is the avoided cost of outsourcing the water that is currently provided for free by Te Papanui). The most important ecosystem service is the water supplied for the city of Dunedin (calculated at around US$65 million of net present value in 2005) for electricity (around US$22 million), and for irrigation water (around US$8.5 million).
Sources: New Zealand Department of Conservation (2006); BPL (Butcher Partners Limited) (2006)
Flood control
The 3,000 ha Muthurajawela Marsh near Colombo, Sri Lanka provides flood attenuation ecosystem services that have been valued at over US$5 million/year. This value was calculated by estimating the costs needed to construct a drainage system and pumping station that would provide the same flood control function, by extrapolating costs of construction of such system in a nearby area.
Source: Emerton and Kekulandala (2003)
Storm protection and erosion control
The storm protection and erosion control services performed by the 1,800 ha of mangroves in the Ream National Park, Cambodia, were valued at US$300,000/year. Moreover, the mangroves provide habitat, nursery and breeding grounds for fish, as well as firewood, medicinal plants and construction materials. All these subsistence goods were valued at almost US$600,000 per year.
Source: Emerton et al. (2002)
Nitrogen regulation
The increase of blue crab fishery from a 30% reduction in nitrogen loading in the Neuse River Estuary, North Caroline, was estimated at a discounted present value of $2.56 million. The increase in fishery is related to the change in primary production and the subsequent impact on hypoxia (low dissolved oxygen), which in turn, affects blue crabs and their preferred prey.
Source: Smith and Crowder, 2011
Multiple benefits
A recent monetary valuation of eight ecosystem services provided by British Columbia’s Lower Mainland was performed across nine land classes (mostly marine and forest ecosystems), using a combination of first-hand and literature data. The results show that 30% of the known ecosystem services in the Lower Mainland’s aquatic ecosystems (i.e. the ones for which data can be found) provide $30 to $60 billion in benefits every year. The most important ecosystem service values were found to be aesthetic and recreation services (between $23 billion and $44 billion per year), water supply (between $2.3 billion and $7 billion per year) and disturbance regulation – i.e. protection from storms and flooding, drought recovery – (between $2 and $5 billion per year). The authors used a discount rate of between 0 and 5%.
Source: Molnar et al., 2012
28
TeeB for WaTer anD WeTlanDs
m a i n r e p o r t
makers, managers, and the general public. (TEEB, 2010; TEEB 2011). Some examples are provided in Box 3.4.
There is a growing momentum and commitment to understanding the values of nature at a national level (Strategic Plan for Biodiversity 2011-2020) and at a company level. Companies can take into account the ecosystem services via the use of corporate ecosystem service valuation tools and ecosystem service benchmarks, which allow evaluating investment risks and opportunities associated with biodiversity and ecosystem service (see WBCSD, 2012; TEEB 2012a; Grigg et al., 2011; KPMG and NVI, 2011).
It should also be noted that the values of ecosystems can be assessed through methodologies aiming to measure the socio-economic value of ecosystem services, but without using monetary values. For example, the University of Essex and partners have recently carried out a project called HighARCS, which developed freshwater programmes in Asia where they have applied ‘spider web’ evaluation models (see Figure 4.1 and Kettunen et al. 2013) in a participatory ranking exercise. In this way, they assessed how different stakeholders valued the ecosystem services provided by wetlands, without assigning them a monetary value17 (see the material on http://www.higharcs.org).
3.5 Environmental accounting
Many policy decisions aim to maximise policy objectives such as economic growth or employment generation and therefore are directly influenced by and evaluated against the indicators provided by national accounts such as Gross Domestic Product (GDP), economic growth rate and government deficit. Natural capital is often ignored, among other reasons because it is not included in national accounting, as defined by the System of National Accounts (SNA)18.
Hence measuring natural capital, the ecosystem services that it provides, and the changes in
Box 3.4 Ecosystem service values influencing decision making
Water purification
The ecosystem services provided by the Nakivubo Swamp (catchment area >40km2) to the Greater City of Kampala, Uganda, in terms of water purification was estimated at US$2 million/year (which would be the cost of the infrastructure required to provide a similar service). The cost of managing the wetland in order to simultaneously optimise its waste treatment potential and maintain its ecological integrity is about US$235,000 per year. This study led to the reversal of previous plans to drain and reclaim the wetland, and consequently significant conservation benefits. It also entailed conservation risks (risk that the pressure from waste water will affect biodiversity, and in turn other ecosystem functions and services).
Sources: Emerton and Bos (2004); UNDP-UNEP Poverty-Environment Facility (2008)
Multiple Ecosystem Services
The contribution of coral reefs and mangroves to Belize’s economy was estimated for 2007 at between US$150 million and US$196 million for tourism (12-15% of GDP), between US$14 million and US$16 million for fisheries, and between US$231 million and US$347 million for protection from erosion and wave-induced damage. The water-related ecosystem services were estimated to be the largest. These results were used by local NGOs to advocate for tougher fishing regulations, mangrove protection, and also to calculate compensation for damages caused by a container ship grounding on the barrier reef in January 2009.
Sources: Cooper et al. (2008); Humes, A. (2010); Supreme Court of Belize (2010)
Cultural ecosystem services for tourism
The Atoll Ecosystem Conservation project, implemented by the Maldivian Ministry of Housing, Transport and Environment, supported by the GEF and UNDP, carried out a study to calculate the monetary value of coastal and marine diversity, and focussed on the two main economic sectors: fisheries and tourism. The direct benefits from the two sectors were evaluated using the market price method. The tourism sector employs 64,000 people or 58% of the workforce. Taking into account both direct and indirect production, consumption and earnings, the current upstream contribution of tourism to GDP is estimated to be US$ 764 million (Rf 9,741 million) or 67% of GDP. Official records show that the fisheries sector contributes Rf 855 million, or 8.5% of GDP (Emerton et al. 2009). There are also direct benefits from biodiversity: already in 1993 it was estimated that a single Grey Reef Shark is worth US$ 3,300 a year to the Maldivian tourism industry, compared with the one-off value of US$32 that a fisherman would get from the same shark (Anderson and Ahmed 1993). As a consequence, the Government of the Maldives banned the fishing of sharks in 2010.
Sources: Phan and Meerer (2009), Emerton et al. (2009), Anderson and Ahmed (1993)
29
TeeB for WaTer anD WeTlanDs
m a i n r e p o r t
its state is essential for nature to be taken into account in the decision-making processes. Natural capital and environmental-economic accounts can play a key role in systematically collecting information on the links between the economy and the environment.
One of the approaches to complementing economic accounts with environmental statistics is represented by the National Accounts Matrix including Environmental Accounts (NAMEA). NAMEA associates information on environmental impacts (in physical units) to standard economic accounts. It is organised in a matrix based on the input-output methodology developed by the economist Leontief. The environmental data collected in NAMEA are pressure indicators, and include two environmental sets of data: one for environmental problems (i.e. the greenhouse effect) and another for pollutants. The environmental problems and pollutants to be included depend on the political priorities of each country.
Water NAMEA is currently in use in many countries. It provides valuable information for water management (e.g. water use per added value of each sector), including not only direct use, but also all water use along the production chain.
Another complementary approach is represented by the System of Environmental-Economic Accounts (SEEA). Launched in 1993 by the United Nations and the World Bank, SEEA provides an internationally agreed methodology for environmental accounting. The SEEA framework has a similar structure and definitions as the SNA, and therefore it can be used together with economic statistics and indicators. A revision of the SEEA is currently being prepared by the UN Committee of Experts on Environmental-Economic Accounting (UNCEEA). The new SEEA will include:
1) The core environmental resource accounts, which measure in physical terms the energy, water and material flows that cross the boundary between the economy and the environment and circulate within the economy (Volume 1, published in 2012, see SEEA, 2012);
2) The experimental ecosystem accounts, which aim to measure the state of ecosystems, their capacity to provide ecosystem services and the economic costs of avoiding or repairing environmental damages (Volume 2, due in 2013);
3) Extensions and applications of the accounts, i.e. various monitoring and analytical approaches that could be adopted using SEEA data in order to describe ways in which SEEA can be used to inform policy analyses (Volume 3, expected after Volume 2 is completed).
In addition, several international initiatives and commitments on environmental accounting have been put in place in recent years (see Box 3.5).
Box 3.5 International commitments on environmental accounting
WAVES: Global Partnership for Ecosystem Valuation and Wealth Accounting
The World Bank’s WAVES partnership, launched in 2010 at the CBD COP-10 in Nagoya, Japan, calls for countries to implement the SEEA where there are already agreed methodologies, as well as to contribute to the development of innovative accounting methodologies to take into account the natural capital (e.g. experimental ecosystem accounts). Countries engaged in the partnership include Australia, Canada, Japan, Norway, France, the UK, Botswana, Colombia, Costa Rica, Madagascar and the Philippines. The partnership and commitments to accounts have received a positive boost from the Rio+20 commitments. The recent Gaborone Declaration by 10 African Nations (2012) also called for support for green accounting and created momentum for the accounts related commitments at Rio+20. For further information see: http://www.wavespartnership.org/waves/about-us
Rio+20 commitments
At the Rio+20 Conference in June 2012, fifty-seven countries and the European Commission supported a communiqué that called on governments, the UN system, international financial institutions and other international organizations to strengthen the implementation of natural capital accounting around the world and factor the value of natural assets like clean air, clean water, forests and other ecosystems into countries’ systems of national accounting. 86 companies also joined forces behind the move and committed to collaborating globally to integrate natural capital considerations into their decision-making processes. In addition, governments have recognised the need for broader measures of progress to complement GDP in order to better inform policy decisions, and have requested the UN Statistical Commission to launch a programme of work in this area (UNCSD, 2012).
Legislative requirements for accounts: a European example
In the European Union, the Regulation on National Environmental Economic Accounts has been adopted, which requires the 27 member countries to regularly report on various resources
30
TeeB for WaTer anD WeTlanDs
Water is a priority area for the implementation of SEEA. For this reason, a SEEA subsystem, called SEEA-Water19, was developed by the United Nations Statistical Commission (UNSC), together with the London Group on Environmental Accounting20 to provide a conceptual framework to organise hydrological and economic information on water in a standardised and consistent way. SEEA-Water measures the water stocks and abstraction for production purposes, household consumption (including reuse), as well as the pollution that is released into the environment. It also includes costs related to collection, purification, distribution and treatment and the price paid by final consumers (see Box 3.6).
Many countries have developed, or are in the process of developing, water accounting, e.g. France, Spain, the Netherlands, Mauritius, Mexico, Moldova, Canada, and Australia (European Environmental Agency, 2010, Eurostat, 2002, UNESCO-WWAP and UNSD, 2011).
In addition, experimental ecosystem accounts are currently being developed to expand the scope of environmental accounting. A standardised methodological approach for experimental ecosystem accounts will be proposed in SEEA Volume 2. In addition, European Environment Agency is developing Ecosystem Capital Accounts (ECA), as the European contribution to the discussion on SEEA Volume 2 (EEA, 2011). The main difference between environmental accounting (SEEA Volume 1) and ecosystem accounts (SEEA Volume 2) is that, while the former measures the flows of resources between nature and the economy, the latter aims to also take into account the resources that do not directly enter the market and the ecosystem services they provide, including regulation, support/habitat and cultural ecosystem services.
Another accounting approach that is used for water is the Water Footprint, which gives an indication of the water consumption associated with products (along the entire life cycle) or countries (Hoekstra and Chapagain, 2006). The methodology distinguishes between blue water (water abstracted from surface or groundwater), green water (precipitation water that is stored in the soil as soil moisture or stays on top of the soil or vegetation) and grey water (polluted water). The Water Footprint gives an indication of the water embedded in a product or consumed by a country (including the embedded water in products). However, it should be kept in mind that it cannot give information on the environmental impact, as it sums up water intakes all along the production chain of a product or across a nation and thereby cannot take into account local water availability and quality.
3.6 Gaps and needs
Decision-making benefits from an improved evidence base. In practice, this will require specific data collection exercises for local decisions to reflect local conditions and the specific nature of the decision. Box 3.7 presents the information needs to improve decision making on water and wetlands, and section 3.7 also presents a way forward for assessing the values of nature for specific local decisions.
and emissions related to water, air, land and also on environmental taxes. Such harmonised reporting methods will ensure a clearer picture of the interlinkages between the economy and the environment. It will also give a clearer indication of the flow of resources through the Member States’ economies. Additional modules can be proposed every three years. The inclusion of ecosystem -related accounting is one area of potential inclusion under discussion.
Box 3.6 Information contained in the SEEA-Water
(a) Stocks and flows of water resources within the environment;
(b) Pressures imposed on the environment by the economy in terms of water abstraction and emissions added to wastewater and released into the environment or removed from wastewater;
(c) The supply of water and its use as an input in the production process and by households;
(d) The reuse of water within the economy;
(e) The costs of collection, purification, distribution and treatment of water, as well as the service charges paid by its users;
(f) The financing of these costs, that is, who is to pay for the water supply and sanitation services;
(g) The payment of permits for access to abstract water or to use it as a sink for the discharge of wastewater;
(h) The hydraulic stock in place, as well as investments in hydraulic infrastructure made during the accounting period.
Source: United Nations (2012)
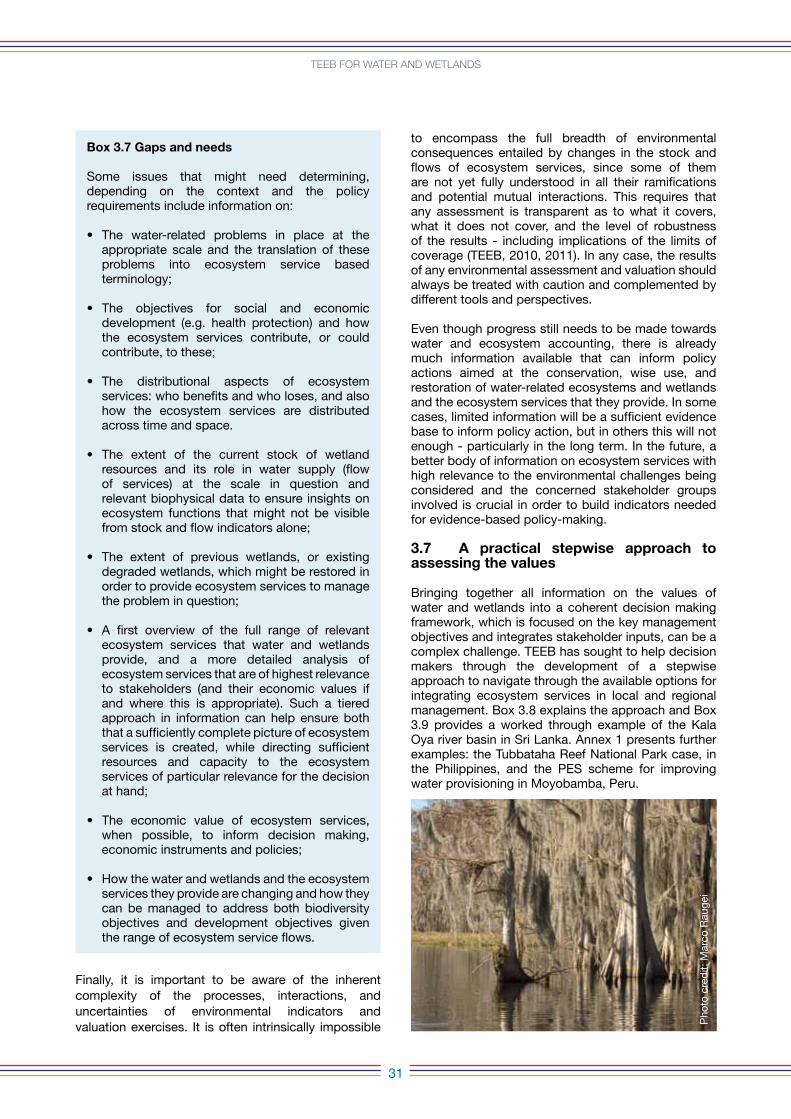
31
TeeB for WaTer anD WeTlanDs
Finally, it is important to be aware of the inherent complexity of the processes, interactions, and uncertainties of environmental indicators and valuation exercises. It is often intrinsically impossible
to encompass the full breadth of environmental consequences entailed by changes in the stock and flows of ecosystem services, since some of them are not yet fully understood in all their ramifications and potential mutual interactions. This requires that any assessment is transparent as to what it covers, what it does not cover, and the level of robustness of the results - including implications of the limits of coverage (TEEB, 2010, 2011). In any case, the results of any environmental assessment and valuation should always be treated with caution and complemented by different tools and perspectives.
Even though progress still needs to be made towards water and ecosystem accounting, there is already much information available that can inform policy actions aimed at the conservation, wise use, and restoration of water-related ecosystems and wetlands and the ecosystem services that they provide. In some cases, limited information will be a sufficient evidence base to inform policy action, but in others this will not enough - particularly in the long term. In the future, a better body of information on ecosystem services with high relevance to the environmental challenges being considered and the concerned stakeholder groups involved is crucial in order to build indicators needed for evidence-based policy-making.
3.7 A practical stepwise approach to assessing the values
Bringing together all information on the values of water and wetlands into a coherent decision making framework, which is focused on the key management objectives and integrates stakeholder inputs, can be a complex challenge. TEEB has sought to help decision makers through the development of a stepwise approach to navigate through the available options for integrating ecosystem services in local and regional management. Box 3.8 explains the approach and Box 3.9 provides a worked through example of the Kala Oya river basin in Sri Lanka. Annex 1 presents further examples: the Tubbataha Reef National Park case, in the Philippines, and the PES scheme for improving water provisioning in Moyobamba, Peru.
Box 3.7 Gaps and needs
Some issues that might need determining, depending on the context and the policy requirements include information on:
• The water-related problems in place at the appropriate scale and the translation of these problems into ecosystem service based terminology;
• The objectives for social and economic development (e.g. health protection) and how the ecosystem services contribute, or could contribute, to these;
• The distributional aspects of ecosystem services: who benefits and who loses, and also how the ecosystem services are distributed across time and space.
• The extent of the current stock of wetland resources and its role in water supply (flow of services) at the scale in question and relevant biophysical data to ensure insights on ecosystem functions that might not be visible from stock and flow indicators alone;
• The extent of previous wetlands, or existing degraded wetlands, which might be restored in order to provide ecosystem services to manage the problem in question;
• A first overview of the full range of relevant ecosystem services that water and wetlands provide, and a more detailed analysis of ecosystem services that are of highest relevance to stakeholders (and their economic values if and where this is appropriate). Such a tiered approach in information can help ensure both that a sufficiently complete picture of ecosystem services is created, while directing sufficient resources and capacity to the ecosystem services of particular relevance for the decision at hand;
• The economic value of ecosystem services, when possible, to inform decision making, economic instruments and policies;
• How the water and wetlands and the ecosystem services they provide are changing and how they can be managed to address both biodiversity objectives and development objectives given the range of ecosystem service flows.
Pho
to c
red
it: M
arco
Rau
gei
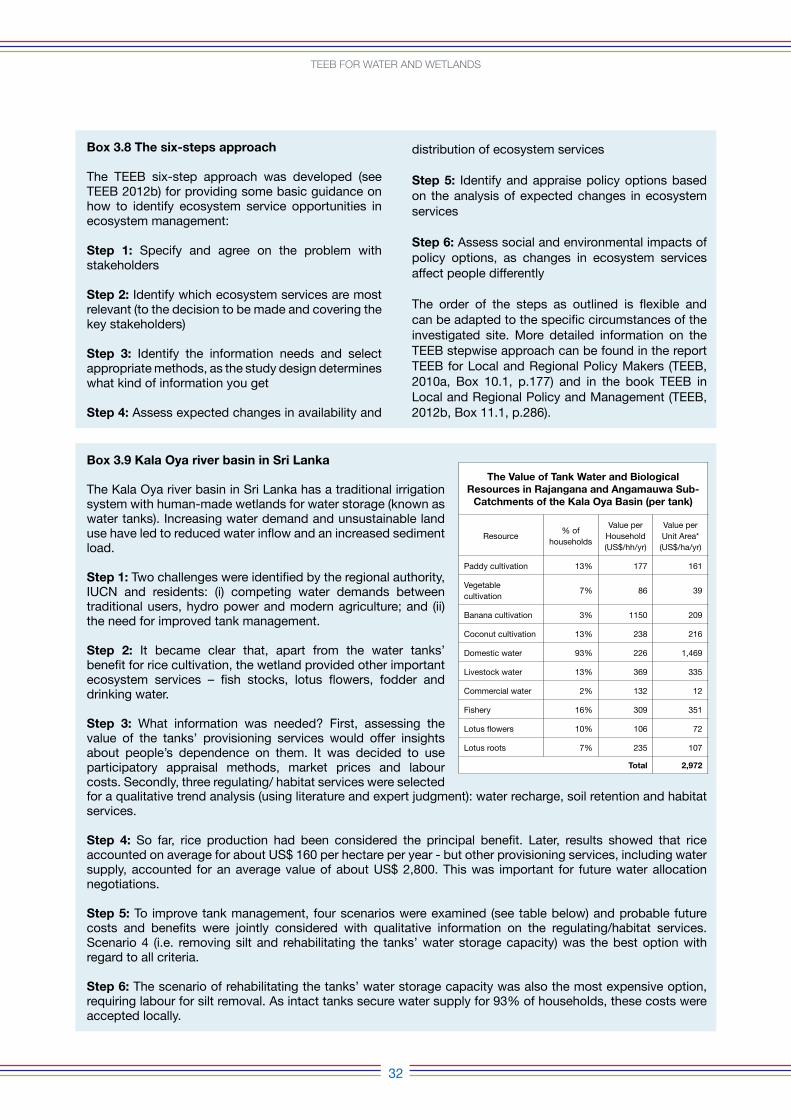
32
TeeB for WaTer anD WeTlanDs
Box 3.8 The six-steps approach
The TEEB six-step approach was developed (see TEEB 2012b) for providing some basic guidance on how to identify ecosystem service opportunities in ecosystem management:
Step 1: Specify and agree on the problem with stakeholders
Step 2: Identify which ecosystem services are most relevant (to the decision to be made and covering the key stakeholders)
Step 3: Identify the information needs and select appropriate methods, as the study design determines what kind of information you get
Step 4: Assess expected changes in availability and
distribution of ecosystem services
Step 5: Identify and appraise policy options based on the analysis of expected changes in ecosystem services
Step 6: Assess social and environmental impacts of policy options, as changes in ecosystem services affect people differently
The order of the steps as outlined is flexible and can be adapted to the specific circumstances of the investigated site. More detailed information on the TEEB stepwise approach can be found in the report TEEB for Local and Regional Policy Makers (TEEB, 2010a, Box 10.1, p.177) and in the book TEEB in Local and Regional Policy and Management (TEEB, 2012b, Box 11.1, p.286).
Box 3.9 Kala oya river basin in Sri Lanka
The Kala Oya river basin in Sri Lanka has a traditional irrigation system with human-made wetlands for water storage (known as water tanks). Increasing water demand and unsustainable land use have led to reduced water inflow and an increased sediment load.
Step 1: Two challenges were identified by the regional authority, IUCN and residents: (i) competing water demands between traditional users, hydro power and modern agriculture; and (ii) the need for improved tank management.
Step 2: It became clear that, apart from the water tanks’ benefit for rice cultivation, the wetland provided other important ecosystem services – fish stocks, lotus flowers, fodder and drinking water.
Step 3: What information was needed? First, assessing the value of the tanks’ provisioning services would offer insights about people’s dependence on them. It was decided to use participatory appraisal methods, market prices and labour costs. Secondly, three regulating/ habitat services were selected for a qualitative trend analysis (using literature and expert judgment): water recharge, soil retention and habitat services.
Step 4: So far, rice production had been considered the principal benefit. Later, results showed that rice accounted on average for about US$ 160 per hectare per year - but other provisioning services, including water supply, accounted for an average value of about US$ 2,800. This was important for future water allocation negotiations.
Step 5: To improve tank management, four scenarios were examined (see table below) and probable future costs and benefits were jointly considered with qualitative information on the regulating/habitat services. Scenario 4 (i.e. removing silt and rehabilitating the tanks’ water storage capacity) was the best option with regard to all criteria.
Step 6: The scenario of rehabilitating the tanks’ water storage capacity was also the most expensive option, requiring labour for silt removal. As intact tanks secure water supply for 93% of households, these costs were accepted locally.
The Value of Tank Water and Biological resources in rajangana and Angamauwa Sub-
catchments of the Kala oya Basin (per tank)
Resource% of
households
Value per Household (US$/hh/yr)
Value per Unit Area* (US$/ha/yr)
Paddy cultivation 13% 177 161
Vegetable cultivation
7% 86 39
Banana cultivation 3% 1150 209
Coconut cultivation 13% 238 216
Domestic water 93% 226 1,469
Livestock water 13% 369 335
Commercial water 2% 132 12
Fishery 16% 309 351
Lotus flowers 10% 106 72
Lotus roots 7% 235 107
Total 2,972
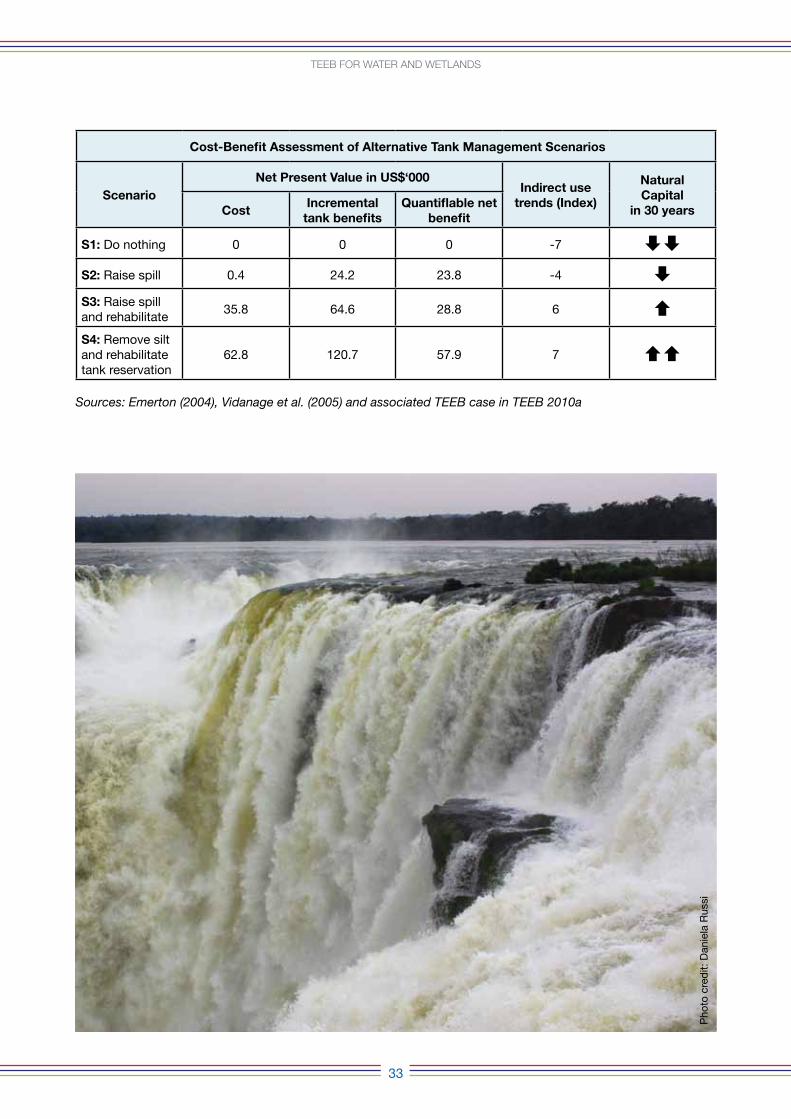
33
TeeB for WaTer anD WeTlanDs
cost-Benefit Assessment of Alternative Tank Management Scenarios
Scenarionet Present Value in uS$‘000
Indirect use trends (Index)
naturalcapital
in 30 yearscostIncremental
tank benefitsQuantiflable net
benefit
S1: Do nothing 0 0 0 -7 S2: Raise spill 0.4 24.2 23.8 -4 S3: Raise spill and rehabilitate
35.8 64.6 28.8 6 S4: Remove silt and rehabilitate tank reservation
62.8 120.7 57.9 7
Sources: Emerton (2004), Vidanage et al. (2005) and associated TEEB case in TEEB 2010a
Pho
to c
red
it: D
anie
la R
ussi
Pho
to c
red
it: M
arco
Rau
gei
TeeB for WaTer anD WeTlanDs
35
4 inTegraTing The valUe of WaTer anD WeTlanDs inTo Decision-maKing
KEY MESSAGES
• Integrated management approaches such as Integrated Water Resource Management (IWRM), Integrated Coastal Zone Management (ICZM) and Maritime Spatial Planning (MSP), if properly applied, allow decision makers to simultaneously achieve multiple objectives (e.g. ensuring water, food and energy security, mitigating and adapting to climate change, alleviating poverty) and to deal with the synergies and trade-offs among them.
• In order to better manage and protect water and wetland ecosystem services, a range of different instruments and management approaches should be combined. These include improving site management, regulation and land use planning, property rights, improving or creating markets by information, pricing and incentives, and direct investments.
• Market-based instruments like taxes, fees, subsidies and their reform, tradable permit schemes, banking and Payment for Ecosystem Services (PES) programmes can play an important role in that they can encourage the efficient use of resources, foster environmental protection, and involve a variety of social actors. These are however not a panacea, but should be seen as a complement to environmental regulation in the context of good governance.
4.1 Introduction
Understanding the value of water and wetland ecosystem services is only the first step. To use this understanding to help promote these services, and thereby help protect wetlands, requires its integration into appropriate types of decision making. A wide range of decision making contexts and tools directly or indirectly affect water and wetlands. Spatial planning approaches have been adopted in many cases, such as Integrated Water Resource Management (IWRM), Integrated Coastal Zone Management (ICZM) and Maritime Spatial Planning (MSP). Environmental regulation in various forms - from designating protected areas and investing in their management to regulations focusing on reducing pressures on wetlands - provides another route for protecting water and wetlands.
Businesses and consumers are highly sensitive to the prices they pay for goods and services, but these may not take account of the loss of value from degrading water and wetland ecosystem services. A range of Market-Based Instruments (MBIs) can be used to address this imbalance.
This section explores the different types of tools and instruments used in decision-making by explaining how the value of water and wetland ecosystem services can be better integrated into the design of these governance and market approaches, thus providing a stronger basis for promoting wetlands and the water and other services they provide. Restoration, being such a major topic in itself, is covered in Chapter 5.
4.2 Wetlands and integrated water resources management
Water and wetland management have historically focused on individual management objectives mainly aimed at maximising provisioning ecosystem services (e.g. agricultural production, fisheries). This approach has led in many cases to an impoverishment in ecosystems’ capabilities of delivering regulating, supporting and cultural ecosystem services. However, it is being increasingly recognised that wetlands should be managed to meet a wide range of interacting environmental, social and economic objectives (see for example Maltby and Acreman, 2011; Rouquette et al., 2011; Morris et al., 2009; Moreno-Mateos and Comin, 2010). Such ‘multi-objective’ management results in provision of a wider range of ecosystem services, including fishery preservation, improved water quality, flood control, carbon sequestration and recreation, in parallel with improved biodiversity.
Figure 4.1 presents a schematic to illustrate the trade-offs that in many cases can be found across ecosystem services from different land use choices. It shows the ecosystem service flows from a natural ecosystem, extensive agriculture and high impact intensive agriculture practice. Where agricultural output is maximised and with limited management of production efficiencies, the land usually produces less of other ecosystem services. In some cases this kind of intensive agriculture can be a social optimum, but in others it maximises private benefit at a cost to the wider society due to high externalities. Understanding the trade-offs entailed in land-use choices can help in good governance; this understanding needs to factor
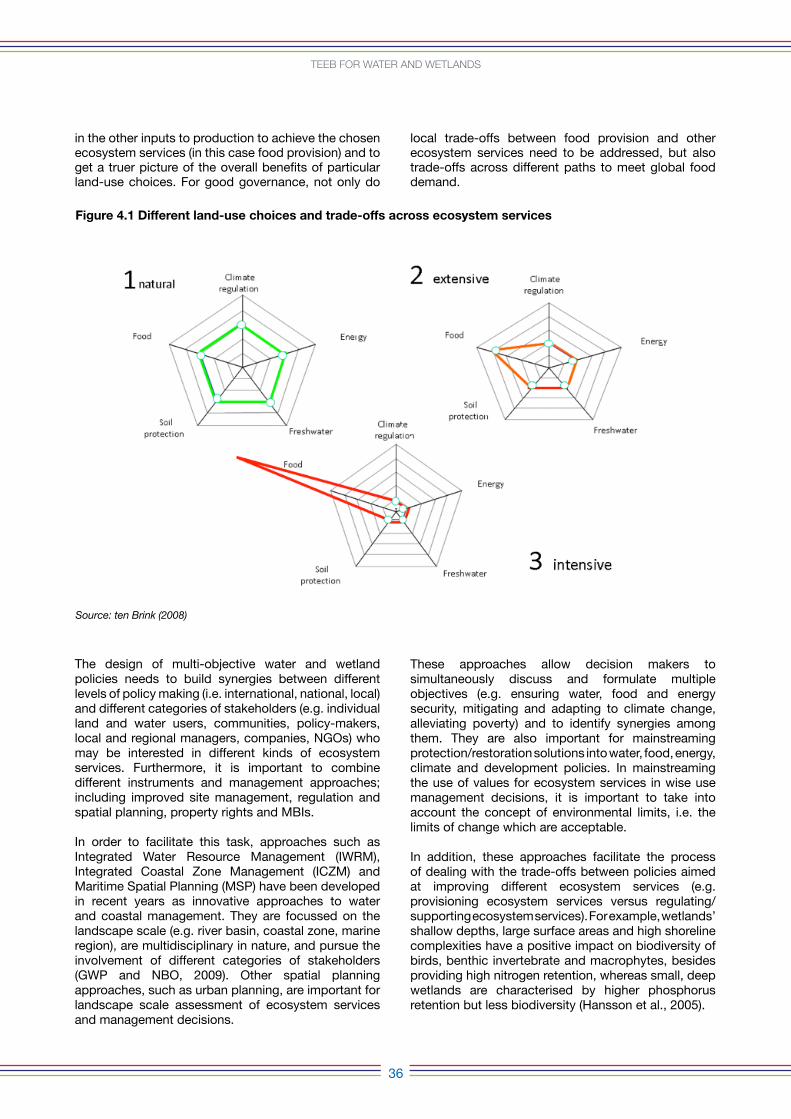
36
TeeB for WaTer anD WeTlanDs
in the other inputs to production to achieve the chosen ecosystem services (in this case food provision) and to get a truer picture of the overall benefits of particular land-use choices. For good governance, not only do
local trade-offs between food provision and other ecosystem services need to be addressed, but also trade-offs across different paths to meet global food demand.
The design of multi-objective water and wetland policies needs to build synergies between different levels of policy making (i.e. international, national, local) and different categories of stakeholders (e.g. individual land and water users, communities, policy-makers, local and regional managers, companies, NGOs) who may be interested in different kinds of ecosystem services. Furthermore, it is important to combine different instruments and management approaches; including improved site management, regulation and spatial planning, property rights and MBIs.
In order to facilitate this task, approaches such as Integrated Water Resource Management (IWRM), Integrated Coastal Zone Management (ICZM) and Maritime Spatial Planning (MSP) have been developed in recent years as innovative approaches to water and coastal management. They are focussed on the landscape scale (e.g. river basin, coastal zone, marine region), are multidisciplinary in nature, and pursue the involvement of different categories of stakeholders (GWP and NBO, 2009). Other spatial planning approaches, such as urban planning, are important for landscape scale assessment of ecosystem services and management decisions.
These approaches allow decision makers to simultaneously discuss and formulate multiple objectives (e.g. ensuring water, food and energy security, mitigating and adapting to climate change, alleviating poverty) and to identify synergies among them. They are also important for mainstreaming protection/restoration solutions into water, food, energy, climate and development policies. In mainstreaming the use of values for ecosystem services in wise use management decisions, it is important to take into account the concept of environmental limits, i.e. the limits of change which are acceptable.
In addition, these approaches facilitate the process of dealing with the trade-offs between policies aimed at improving different ecosystem services (e.g. provisioning ecosystem services versus regulating/supporting ecosystem services). For example, wetlands’ shallow depths, large surface areas and high shoreline complexities have a positive impact on biodiversity of birds, benthic invertebrate and macrophytes, besides providing high nitrogen retention, whereas small, deep wetlands are characterised by higher phosphorus retention but less biodiversity (Hansson et al., 2005).
Figure 4.1 Different land-use choices and trade-offs across ecosystem services
Source: ten Brink (2008)
37
TeeB for WaTer anD WeTlanDs
Similarly in lowland rural floodplains, management trade-offs can be found between biodiversity protection and modern agriculture (Rouquette et al., 2011). Conversely, it is also important to recognise synergies between policies and objectives - such as the role of wetlands in recharging soil water tables which can supply water to agricultural users and the role of improved soil management in improving crop yields and reducing off farm impacts, including on wetlands. Box 4.1 provides three examples of integrated water management.
Box 4.1 Examples of integrated water management
The Pangani River Basin, Tanzania
The Pangani River Basin, Tanzania, provides livelihoods to over three million people, mainly from agriculture and fisheries. Water is extremely scarce in the area and not all aspirations for the basin regarding agricultural and energy production can be met. The IUCN Water and Nature Initiative (WANI) carried out a project between 2002 and 2001 in the area on Integrated Water Resource Management (IWRM), which included 1) participatory governance, 2) increased institutional capacity at basin level, 3) increased knowledge about water resources, 4) empowerment of water users, and 5) conflict resolution and platforms for stakeholder dialogue. Environmental flow assessment and economic analysis of ecosystem services were used in order to explore strategies for improving the river basin management.
Thanks to this process, water users have been empowered to participate in IWRM and climate change adaptation, through dialogue and decentralised water governance, resulting in a better understanding of the water sector’s vulnerability to climate changes and in pilot actions aimed at adaptation. In addition, crucial knowledge on social, economic and environmental trade-offs for different water allocations have been explored through the development of a number of scenarios, with the objective of contributing to the future governance of the river basin.
Source: IUCN (2011)
The Komadugu Yobe Basin, Upstream of Lake Chad, Nigeria
In the Komadugu Yobe Basin (area of 148.999 km2, 95% in Nigeria) unsustainable water management practices changed the seasonal river flow and caused widespread environmental degradation. Moreover, there was fragmented regulation, conflicting responsibilities among institutions, lack of coordination for hydro-agricultural developments, and inequitable access to water resources in
addition to growing tensions and risk of conflicts among water users. In response to these problems, the IUCN Water and Nature Initiative (WANI) and national partners launched an IWRM project which included 1) the establishment of new institutions for implementing IWRM at the basin and national level, such as the State IWRM Committees; 2) the development and adoption of a water basin charter; 3) the development of a Catchment Management Plan to resolve water problems, which promoted data collection activities and a water audit; and 4) Livelihood pilot projects (field interventions to improve river flow by removing weeds and silt blockages). Finally, financial management and awareness raising activities were also implemented.
Stakeholder collaboration resulted in a Catchment Management Plan, a Water Charter and the empowerment of stakeholders to participate in water management. The reform of water governance improved the transparency of water management, encouraged the remediation of some degraded ecosystems and the restoration of the river flow patterns. In addition, the number of conflicts decreased and governments have pledged millions of dollars in new investment for basin restoration through the Hadejia-Jama’are-Komadugu-Yobe Basin Trust Fund.
Source: Barchiesi et al. (2011)
Catchment planning in South Africa
In Mhlathuze municipality, an area identified as a biodiversity hotspot, a classic case of ‘development’ versus ‘conservation’ dilemma led to conflict in the rapidly industrializing municipality, in large part due to poverty and lack of local opportunities. The municipality undertook a strategic catchment assessment. The study highlighted the ‘free’ ecosystem services provided by the area (nutrient cycling, waste management, water supply, water regulation, and flood and drought management). The annual value of these ecosystem services was estimated at R1.7 billion (nearly US$200 million). Politicians reacted positively once they realised the economic value of these ecosystem services.
The municipality embarked upon a negotiating process to identify (1) sensitive ecosystems that should be conserved, (2) linkages between ecosystems, and (3) zones that could be developed without impacting the area’s ability to provide ecosystem services. More importantly, (4) it identified management actions that would ensure not only the survival of key biodiversity assets, but also sustainable development opportunities using biodiversity resources.
Source: TEEB (2012b) and Van der Wateren et al. (2004)
4.3 Improving site management
On-site integrated management is crucial for the restoration and protection of water and wetland related ecosystem services. However, to do this requires site managers to understand the values of the ecosystem services provided by water and wetlands by working with experts and local communities and also to have funds available for management. For example, decentralised flood protection measures (i.e. a set of small technical interventions distributed throughout an entire drainage area such as: retention basins, small dams, artificial lakes, restoration of meanders and vegetation near river channels, afforestation of flood plains, and better soil management) can significantly reduce the occurrence and intensity of floods (Reinhardt et al., 2011). The damage potential of storms for coastal areas, river floods and landslides can be considerably reduced through a combination of careful land use planning and ecosystem maintenance or restoration to enhance buffering capacity (Maltby and Acreman, 2011). As regards site designation, there are currently 2,065 registered Ramsar sites, covering 197,347,539 hectares21. There are many more wetland sites that are under national or other designations (e.g. EU’s Natura 2000). Designation itself, when complemented by wise use of the wetland, due site management
and associated investment, can lead to important improvements in ecological status of the site and increases in ecosystem service provision. A key challenge is to obtain the funding needed for due management. This can be facilitated by site designation and clear communication as to the importance and benefits of the sites for biodiversity and also wider socio-economic benefits (Kettunen et al., 2010, and Kettunen et al., 2013).
Box 4.2 provides an example of good on-site management practices.
4.4 regulation and land use planning
In order to translate an assessment of the value of water and wetland ecosystem services into improved decision making, there has to be an effective governance framework in place. Effective and efficient regulation of activities that impact water and wetlands is, therefore, necessary to halt losses, stimulate restoration, and maintain the integrity of ecosystems and the ecosystem services they provide to people. This not only includes the basic legal and institutional frameworks for regulatory action, but also a situation where there is respect for the rule of law (i.e. laws are implemented). Corruption can be a major impediment which cannot be overcome simply by improving the evidence base for water ecosystem services through better valuation of the benefits nature provides. This is particularly true for water where built infrastructure involves large capital and operational investment and high opportunities for corruption.
The participatory process for the Chingaza-Sumapaz-Guerrero Conservation Corridor
The High Andean páramo ecosystems contain important wetland systems, which have high ecological, social and cultural value. Their sponge-like soils, uniquely adapted vegetation, wet grasslands, lagoons and lakes capture and retain water, acting as a flood buffer in the rainy season, and a steady source of water in the dry season. The Chingaza-Sumapaz-Guerrero Conservation Corridor, designed by a participatory process led by Conservation International (CI) Colombia and the Bogota Water Supply Company, protects and manages the páramos of Chingaza to provide multiple benefits. A landscape-level programme prioritises some areas for conservation, others for restoration, and others for natural resource use, ensuring that the Corridor’s páramo wetland ecosystems can sustainably provide clean water for the 8 million residents of Bogotá farther downstream, habitat for endemic species, and land and irrigation for local communities well-being. CI has also developed a forest carbon program, the first of its kind in Colombia under the Kyoto Protocol’s Clean Development Mechanism, to generate carbon credit financing that will support field activities and benefit local communities.
Source: Conservation International (2012)
Box 4.2 Example of good on-site management
The Essex Marshes, UK
Salt marshes provide an important contribution to water quality by removing pollutants and absorbing carbon dioxide. They also protect boat moorings and marinas and reduce the need for costly artificial sea defences. In the past 25 years, the Essex coast experienced the loss of approximately 50% of its original 30,000 hectares of salt marshes, and 1% is still being lost each year as a result of increased sea levels and coastal squeeze. Essex Wildlife Trust created a major coastal re-alignment project in 2002, with the objective of restoring salt marshes. The project will provide approximately £500,000 in benefits over the next twenty years through savings or new incomes on issues such as sea wall maintenance, water quality, flood defence, created ecotourism opportunities and waste water management.
Source: Natura 2000 web page, http://www.natura.org
38
TeeB for WaTer anD WeTlanDs
There are three main types of environmental regulatory approaches (TEEB, 2011):
1. Regulation of water discharges that sets standards for emissions, ambient quality and technical practice (e.g. best available techniques), performance (e.g. water quality objectives) or management (e.g. agricultural activities) practices; water quantity regulation (e.g. limits on abstraction);
2. Regulation of products, which sets restrictions on product use (e.g. activities damaging endangered species) or production standards (e.g. certification, best practice codes);
3. Spatial planning, which regulates land uses and establishes protected areas (e.g. spatial planning frameworks such as IWRM, ICZM and MSP).
Examples of regulation and spatial planning to improve water and wetland management include the control of pollution from waste water treatment plants to protect the quality of surface water for other users, the designation of areas protecting drinking water sources from nitrate contamination, and the design of non-conversion zones in order to safeguard mangroves that provide important benefits or the establishment of protected areas. Further examples can be found earlier in this report (e.g. Box 4.1). Effective regulation and careful spatial planning help control some critical pressures on wetlands, including water abstraction and pollution, which in turn make the ecosystems less vulnerable to external challenges such as climate change, floods and storms.
4.5 Property rights and improving the distribution of costs and benefits
Institutional arrangements, such as property rights, mediate the linkages between wetland ecosystem services and human societies. These are often based on customary and traditional management practices linked to wetlands.
These rights set up the rules that delimit the range of activities granted to individuals (or groups) over specific (or range of) ecosystem services), including, but not limited to: defining access (right to enter a defined physical area and enjoy non-subtractive benefits), withdrawal (right to obtain resource units or products of resource systems), management (right to regulate internal use patterns and transform resource by making improvements), exclusion (right to determine who will have an access right, and how that right may be transferred), and alienation (right to sell or lease exclusion, management or withdrawal rights) (Schlager and Ostrom, 1992).
The complexity of property rights has an influence on the way costs and benefits of ecosystem services are distributed and shared across societies and thereby
have an important influence on the way priorities on ecosystem services are generated, managed and trade-offs negotiated.
Furthermore, lack of clearly defined property rights and the degree of fit with ecosystem structure and processes that underpin ecosystem services can accentuate wetland degradation and loss through conflicts, non-cooperative behaviour, and inefficient management.
Including social fairness as an objective of ecosystem management, along with ecological sustainability and economic efficiency, is a key step towards improved sharing of costs and benefits related to policy decisions linked with water and wetlands.
Mapping stakeholders and institutions with ecosystem services and eliciting stakeholder differentiated benefit and cost sharing provides the analytical framework for assessing social fairness dimensions, particularly ecosystem services trade-offs.
Regulations and fiscal measures, such as the polluter pays principle and full cost recovery, can make the economic cost of damage to biodiversity and ecosystem services visible to, and felt by, those responsible – thus changing the incentives that influence their actions. Tools such as payments for ecosystem services (see next section) provide mechanisms for incentivising resource stewardship by rewarding the providers of these services.
Clarifying rights, in particular collective rights to common property, enables building broad-based stakeholder engagement in wetland management and sustained provision of ecosystem services.
Box 4.3 provides an example on the influence of property right on the ecosystem services provided by wetlands.
Box 4.3 chilika Fisheries, India
Chilika, a lagoon and Ramsar Site located on the eastern coast of Odisha State, supports high biodiversity and harbours several endangered and endemic species. The lagoon provides a livelihood for 200,000 local fishers and generates over 9% of the state’s foreign revenue from marine products. For generations, Chilika fishers evolved a management system based on resource partitioning wherein access to each fisher group
39
TeeB for WaTer anD WeTlanDs
4.6 using market-based instruments to protect water and wetland ecosystem services
The behaviour of companies, nations and citizens is strongly influenced by the prices they pay for goods and services. However, the prices of goods and services often do not take account of the economic losses caused by the degradation of water and wetland ecosystems and, therefore, the loss of value from degraded ecosystem services. A range of different Market-Based Instruments (MBIs) can play an important role in integrating the costs associated with such loss of value into decision making and consequently influencing the behaviour of citizens and companies. Examples include taxes and charges, phasing out or reforming environmentally harmful subsidies, quantity-based instruments, liability rules, and payment for ecosystem services (TEEB, 2011). Examples of how each of these is used in the context of protecting water and wetland ecosystem services are described below.
Taxes, fees, subsidies and charges
Taxes, fees and charges discourage environmentally harmful activities by increasing their costs compared to other more environmentally friendly alternatives (see Box 4.4 for an example). Subsidies, where duly targeted, reduce the costs related to sustainable activities or products, thereby increasing their market competitiveness. In theory, environmental taxes are more efficient than regulation because they make agents with lower abatement costs pollute (and pay) less than those with higher costs. In fact, the former will find it more convenient to reduce their environmental impact than to pay the tax, whereas the latter will prefer to continue polluting and paying the tax. As a result, costs to society as a whole are lower. Besides, tax policies encourage economic agents to continuously try to reduce their environmental impact, instead of binding them to a certain standard (Pearce and Turner, 1990). In addition, environmental taxes provide a source of funding that may be used to support environmental-friendly practices.
was determined based on the species they specialised in catching. However, from 1984-85 prawn culture was introduced in Chilika to provide low-income families with a supplementary income. Prawn and shrimp export potential thrived thanks to increasing international demand, devaluation of the Indian Rupee, and trade liberalization. This triggered a massive influx of workers from farming communities into culture fishery ultimately leading to occupational displacement and loss of fishing grounds of traditional fishers in addition to conflicts with the immigrants. Meanwhile, Chilika underwent rapid degradation owing to increased sediment loads from the catchments and reduced connectivity with the sea. Fisheries declined substantively from over 8,000 MT reported in 1985/86 to 1,700 MT in 1998-99.
The Government of Odisha established The Chilika Development Authority (CDA) in 1992 to improve fishermen’s livelihood through restoration activities, including restoring the lagoon-sea. Restoration of hydrological regimes, in particular the salinity gradient, led to a remarkable recovery of ecosystem. Within four years there was a near seven fold increase in fish landings, fourfold increase in average productivity, and 56 new species of fish and shell fish recorded. However, the fishermen’s per capita income increased by only 34% while 85% of the fishers continued to be indebted and the amount of debt per household tended to increase by a similar figure. Their access to basic amenities continued to be much below the state averages.
The reason is that exports to international markets (primarily of prawns) contribute only 22% of the total added value of fishery. 38% of the value added takes place beyond the landing centres, in which the fishers do not participate or receive a share, as per the present structure, more than 90% of the total catch of 33,300 fishers is channelised through 500 middlemen and 800 local traders. Due to very limited presence of formal credit institutions and weak asset base, the fishermen are forced to take loans and advances from the middlemen at a higher rate of interest along with a precondition to sell the entire catch at prices determined by the latter, which are 10 – 12% lower than the market price. CDA is trying to address these problems through a Fisheries Resource Management Plan centred on a co-management strategy with active participation of fishers. An apex central society for Chilika fishery has been established to improve fishermen’s financial stability and working efficiency. Credit is being made available to these groups on viable terms, along with extensive capacity building and infrastructural support. Interventions such as provision of ice boxes are assisting the fishers to maintain fish fresh for longer and negotiate a better
price. A regulatory regime for fisheries is also being introduced and will set exemplary punishment and disincentives for any form of fishing detrimental to the ecosystem. Finally, the bases of community managed fisheries are being established in Chilika, and all these interventions are increasingly improving both fishermen’s livelihood and ecosystems’ health.
Source: Kumar et al., 2011
40
TeeB for WaTer anD WeTlanDs
Quantity-based instruments
Quantity-based instruments, such as tradable permit schemes, set a limit on the use of a resource, allocate the use right certificates to the users by auctions or free of charge, and create an artificial market for trading the rights (see Box 4.6 for some examples). There are a number of experiences on the use of water rights trading to enhance the efficiency of water use to protect water bodies and also on the use of water banks (see for example the IIED webpage on water markets, with more than 60 case studies from around the world). Trading in water rights is not limited to quantitative use of water, but can also be applied to trading in rights to discharge pollutants.
Water banks are innovative instruments that have been implemented in California, Australia, Chile, Mexico, China, and Spain, among others. They are generally used to deal with droughts in order to use in urban areas part of the water normally employed in agriculture and to compensate the
farmers for the economic loss that results. Water banks work as follows: the intermediary, usually a governmental body, purchases the right to use water from owners willing to sell it. Afterwards, it sells the water rights on the market, establishing the rules and the administrative framework. This mechanism automatically assigns water to the users that maximise its profitability, thereby promoting the efficiency of the system.
In wetland banking, an activity which has detrimental effects on wetlands is counterbalanced by a purchase of wetland credits, which are issued for activities that restore, enhance, create or preserve other wetland areas. Wetland banking can be a means to obtain funds from the private sector targeted at wetland restoration, and it is mostly used in the US (TEEB 2012a).
Box 4.5 The low price of irrigation water in Spain and Italy
In Spain and Italy the dry climate means that water is needed for the irrigation of many crops, but water resources are scarce in many areas. This is exacerbated by the low water prices for agriculture, which are well below costs and encourage an excessive usage. Both in Italy and Spain the costs related to the construction of infrastructures for irrigation are mostly covered by national and European funds (i.e. by taxpayers), and are not recovered in prices, and neither are environmental externalities. In addition, in Italy, the water tariff is mostly based on the irrigated area and not on the volumetric usage; therefore farmers are not encouraged to economise their water usage. The irrigation subsidy often encourages the choice of water-intensive crops (often for export) in areas characterised by water scarcity. The total subsidies to irrigated agriculture in the most important Spanish river basins are calculated at about €911 million per year by Calatrava and Garrido (2010). The same authors estimate the recovery rate of capital cost at between 30% and 50% (while they estimate the recovery rate for operation and maintenance cost at between 90 and 99%). According to the OECD (2010), the total cost recovery rate in Italy ranges between 20 and 30% in the South and between 50% and 80% in the North. Similar problems occur in other parts of the world where water prices are low.
Sources: Massarutto (2003); Calatrava and Garrido (2010); Arcadis et al. (2012); OECD (2010)
Box 4.6 Examples of tradable permit schemes
The salinity credits in the catchment area of Bet Bet, Victoria, Australia
In 2003, the Australian government funded eleven pilot projects to develop market-based instruments (MBIs) to improve water quality. One of them was an innovative salinity credit system established in the catchment area of Bet Bet, Victoria (9,600 ha). The salinity of the river in this area is caused by the reduction in aquifer recharge produced in turn by a reduction in permanent vegetation with deep roots. Salinization threatens agriculture in the area, damages infrastructures and has a negative impact on the river ecosystems. The Bet Bet tradable salinity credits were assigned based on an auction, where farmers could offer their commitment to undertake actions to reduce salinity in exchange for a certain payment. The farmers who won the auction could fulfil the obligations by reducing salinity in their fields or by buying salinity credits from other farmers who had achieved higher reductions than those established in the contracts that resulted from the auction.
Source: Connor et al. (2008)
Water use rights, China
In Zhangye City, Ganzhou District, Gansu Province a water right tradable permits scheme was launched in 2002. Water use right certificates were distributed to county irrigation districts and subsequently to townships, villages and households. In Minle County, each district distributed certificates to households based on the land area and a water resource deployment scheme, which was checked, ratified and strictly enforced. High-efficiency users were given
41
TeeB for WaTer anD WeTlanDs
42
TeeB for WaTer anD WeTlanDs
Liability-based instruments
Liability-based instruments assign responsibility for preventing and remediating environmental impacts to those who cause them. Liability rules create an economic incentive to developers/users to incorporate the risk of a potential hazard and the value of remediation into their decisions. They establish that those who damage the environment beyond a defined limit must pay for restoration or to compensate the loss of ecosystem services, and thereby they provide economic incentives to reduce risk and stimulate technical improvement. An example is the liability regime established in the European Union, which specifically includes damage both to water objectives and biodiversity objectives within the scope of the regime. The law requires, for example, that if a company discharges pollutants causing damage which threatens the legal objectives of EU water policy, it is required to pay for the restoration of various water bodies in the EU. This provides a strong incentive to avoid such damage, thus helping to preserve the ecosystem services from that water body. Similar legislation is in place in a number of other countries across the world.
Box 4.8 shows some examples of liability and compensation.
Payment for Ecosystem Services
Payment for Ecosystem Services (PES) can be a useful instrument to finance conservation of water-related ecosystems and wetlands and to involve new stakeholder (e.g. companies). PES programmes allow for the translation of the ecosystem services that ecosystems provide for free into financial incentives for their conservation, targeted at the local actors who own or manage the natural resources. They can be funded by the ecosystem service users or by foundations, NGOs or government agencies, when the ecosystem service user is the society as a whole or a very broad category of stakeholders. REDD+ is an example of an international programme to fund the protection of ecosystem services. PES programmes bring economic benefits to both ecosystem service users (who benefit from a lower cost than that associated with the degradation of the natural resources and the reduction/cessation of the ecosystem services they provide) and ecosystem services providers (who receive compensation for their conservation/restoration activities), besides benefitting the ecosystems and the associated natural resources (Wunder, 2005; Fisher et al., 2009; ten Brink et al., 2011b).
The amount of payment in a PES programme can be established through monetary valuation of the remunerated ecosystem services, negotiation among the involved stakeholders, or reverse auctions. In most cases, the price is determined through a negotiation process based on the opportunity costs
preference for distribution of use rights and per capita use was determined based on proximity to water resources. The water used for agriculture significantly decreased as a result of the scheme. This enables a more efficient use of water and forms an important tool in the protection of water bodies.
Source: Forest Trends (2009)
Water quality rights trading in the United States
Trading for water pollution discharges is well established in the United States. The US EPA issued a National Water Quality Trading Policy in January 2003. Such trading is a voluntary option for operators enabling them to meet their permit limits in a more cost effective way. The EPA argues that trading provides both significant economic and environmental benefits. For example, full implementation of trading has been estimated to be able to save $1 billion in waste water treatment costs in the Chesapeake Bay alone. To support trading, the EPA produced a range of support tools, including a handbook and IT support systems for companies and advice to regulators on how to integrate trading with traditional permitting approaches.
Source: EPA (2009)
Box 4.8 Examples of liability and compensation
Oil spills: compensation and legislative response
The Exxon Valdez oil spill (1989), affected 200km of Alaskan coastline. The legal proceedings included a compensation claim for both use and non-use values. Exxon settled its lawsuit with the US Government for US$1 billion and agreed to spend around US$2 billion on clean-up; it later settled a class action lawsuit for additional amounts. The disaster also led to the US Oil Pollution Act 1990.
The Erika oil spill in 1999 of 10 million litres of oil caused the death of up to 100,000 birds near the French Atlantic coast. Within the EU, this led to the ‘Erika I package’ (legislation for double-hulled ships and Liability Directive) (Europa, 2007).
After the 2010 Deepwater Horizon oil spill in the Gulf of Mexico, BP, the responsible oil company, created a US$20 billion escrow compensation fund. Its ceiling increased in July 2010 when BP set aside a pre-tax charge of US$32.2 billion to cover liabilities (BP, 2010).
43
TeeB for WaTer anD WeTlanDs
because monetary valuation is generally a lengthy and expensive process and reverse auctions involve high transaction costs and uncertainties. The development of PES schemes has been most widely used for the protection of water-related ecosystem services.
Box 4.9 provides some examples of PES schemes on water-related ecosystems and wetlands (see also the Peru case in Annex I). These examples show the importance of taking a wider catchment-based approach to understanding how water-related ecosystem services are threatened, in order to develop a PES scheme to target these pressures and so protect the services provided.
Box 4.9 Examples of Payment for Ecosystem Services in watersheds and wetlands
The PES programme in Costa Rica
A PES scheme in Costa Rica remunerates four kinds of forest-related ecosystem services: 1) the storage of carbon in forest biomass, 2) the supply of water for human consumption, agriculture and energy production, 3) the conservation of biodiversity, 4) the landscape beauty. The majority of funding comes from fuel taxes, although various international institutions help finance the project. To receive payment, forest owners must submit a plan and carry out sustainable forest management practices, such as firewalls or reforestation plans.
Source: Pagiola (2008)
The Payment for Hydrological Environmental Services programme, Mexico
The Programme was established to finance the hydrological ecosystem services provided by forests, and in particular, the protection of watersheds and aquifer recharge. The programme is financed through part of the federal taxes on water, and remunerates forest owners for maintaining the forest cover in areas where forests have a high impact on the water ecosystem services and are subject to high risk of deforestation.
Source: Muñoz-Piña et al. (2008)
Pimampiro PES programme, Ecuador
A PES programme is being carried out in Ecuador to protect the water catchment area of the Pimampiro municipality. The programme was designed to protect the water quality and quantity of the river basin Palaurco through the conservation of native forests. The beneficiaries of the payment are 19 farms. The funding is derived from a surcharge of 20% in the water prices paid by the 1,350 families
with water metering, plus some funds of the Pimampiro municipality and the interests of a fund made available by the FAO and the Inter-American Foundation.
Source: Wunder and Alban (2008)
The Vittel PES programme, France
At the end of the 1980’s, Vittel, a French mineral water company, initiated a PES programme to preserve the quality of its bottled water, which was threatened by the presence of nitrates and pesticides associated with the intensification of agricultural and livestock raising practices upstream. After approximately ten years of negotiations between the company and the farmers, a package of incentives available to farmers in the area was established, including: 18 and 30 year-contracts to ensure continuity; the abolition of the debt associated with the purchase of land by farmers; an average of €200 per hectare per year for five years to cover the costs related to the transition to the new, more sustainable agricultural model; a lump sum of up to €150,000 per farm to meet the initial costs; workers paid by Vittel to produce organic fertilizer for the farmers; technical assistance and free introduction to new social and professional networks. The programme was a success: 26 of the 27 farms in the area adhered and chose 30-year contracts, allowing the protection of 92% of the water catchment area.
Source: Perrot-Maître (2006)
The SCaMP programme in the UK
United Utilities (UU) Group PLC is the UK’s largest water business and provides water and wastewater services to approximately 7 million people in the north west of England. It also owns 57,000 ha of land, much of which in protected areas. In 2005, UU launched a PES scheme called Sustainable Catchment Management Programme (SCaMP), with the objective of improving water quality. Between 2005 and 2010, the SCaMP covered an area of 20,000 ha and invested £10.6 million in a set of environmental measures to restore drained, burnt and overgrazed moorland and degraded blanket bog, as well as to increase diversity of hay meadow/rush pastures and woodlands. In order to facilitate the engagement of the farmers who leased land within the project area, UU encouraged them to enter the Higher Level Stewardship (HLS) agri-environment scheme and, since the HLS only covers half of the capital investment costs, to provide part or all of the upfront costs (e.g. building, fencing, gripping). UU also implemented a SCaMPII project in its remaining land (30,000ha), which includes 53 projects and an investment of £11.6
44
TeeB for WaTer anD WeTlanDs
Voluntary schemes
Voluntary offsetting schemes also exist that encourage private, companies and public bodies to offset their impacts by financing restoration or conservation projects (see TEEB 2011).
Currently, the most used offsetting schemes are voluntary carbon credits programmes, which in recent years have shown a promising growth rate. Mechanisms need to be established to ensure transparency, additionality and a direct link between the payment and the CO2 reduction, as well as the permanence of the CO2 in time and a low environmental impact. In this regard, the role of the intermediary institutions, which manage the programme, finance the mitigation projects and sell the carbon credits to the interested citizens or companies, is very important in ensuring credibility and effectiveness. To increase the level of reliability and transparency of voluntary compensation schemes, international certification programmes have been established, such as for example the Greenhouse
million between 2010 and 2015. The measures included in this second project are similar to the ones of SCaMP and are mainly focussed on water quality improvement.
While aimed at improving water quality, the projects led to important co-benefits, such as improving biodiversity, increasing rates of carbon sequestration, securing greater water retention and maintaining the tenant farmers income. As a result of the catchment management measures, significant improvements were observed in protected areas; 273 ha of new native broadleaved woodland were created; 23 ha of degraded upland hay meadow were brought into favourable management; 10 ha of upland heath were restored; and 9.3 km of new native species hedgerows were established. Other positive outcomes were the reduction in sediment reaching the streams due to the re-establishment of vegetation, and the re-colonisation of common cotton grasses and crowberry due to the removal of grazing stocks.
Sources: Anderson and Ross (2011) and McGrath and Smith (2006)
The PES scheme for enhancing biodiversity in paddy fields in Japan
A PES scheme has been carried out since 2003 in Toyoka city, Japan, to improve biodiversity in the paddy fields, and in particular to protect the Oriental White Storks, a species that was extinct in Japan and has been reintroduced since 2005. The payment is granted by the municipal government to farmers who carry out activities to enhance biodiversity in their paddy fields, i.e. 1) Cultivate rice with organic farming or certified reduced chemicals farming methods (i.e. reduced usage of chemical pesticides and chemical fertilizers) in order to improve biodiversity, i.e. the so-called Storks-Friendly Farming (SFF) agricultural techniques. The standard to be certified as ‘reduced’ chemical farming varies according to the certification scheme that the farmers apply; 2) Prolongation of water pooling (i.e. around 220 days per year, which is needed to support water borne species, versus the 80 days per year of conventional farming). The payment is meant to cover a) the cost of human resources needed to enhance and monitor biodiversity (in particular for the increase in water usage and monitoring costs); b) the increased costs associated to maintenance of the slope along the paddy fields, due to the reduced drying out period; c) the reduced yields. The total amount was previously JPY 40,000 per year per 10 acres, but it was reduced to JPY 7,000 from 2009 for the following two reasons.
Firstly, the farmers are now eligible to receive JPY 8,000 per year under a national payment scheme (established following the example of the Toyoka payment scheme). Secondly, farmers receive a premium price for the rice produced through SFF. Currently the rice produced through SFF is sold at a price that is 1.5 to 2 times higher than the rice produced with conventional farming.
Source: http://www.city.toyooka.lg.jp
Box 4.7 The wetland offset methodology in the Mississippi Delta
The American Carbon Registry (ACR) has recently certified the first wetland offset methodology “Restoration of Degraded Deltaic Wetlands of the Mississippi Delta” developed by Tierra Resources, and funded by Entergy Corporation through its Environmental Initiatives Fund. The methodology is applicable at a large scale to broadly address wetland restoration through numerous eligible restoration techniques including hydrologic management, reforestation and afforestation, and it is being tested with a two-year pilot carbon offset project at the wetlands near Luling, Louisiana, started at the end of 2012.
The methodology and the pilot project were initiated thanks to an innovative partnership with St. Charles Parish, Rathborne Land Company, Comite Resources and The Climate Trust. The public-private partnership intends to allow the Parish to pursue wetlands assimilation as a more sustainable form of wastewater infrastructure
45
TeeB for WaTer anD WeTlanDs
Gas Protocol-Project Accounting, ISO 14064 and the Climate Community and Biodiversity Alliance (CCBA) standard. Carbon credits in wetlands can deliver important co-benefits like biodiversity protection, water regulation and purification, and enhanced tourism potentiality.
Carbon offsetting schemes represent an interesting option to find additional financing for wetland conservation or enhancement, because, as explained in Chapter 2, wetlands provide an important carbon sequestration function. Box 4.7 shows an example of an offsetting scheme in the Mississippi Delta.
Scope and limits of Market Based Instruments
Making constructive use of markets by improving the information available to consumers and putting in place MBIs can play an important role in the improvement of water-related ecosystem services and wetlands, influence policy-making and favour the involvement of a wide range of stakeholders. Furthermore, they can contribute to make the environmental issues an element of a company’s profit and loss accounts and hence increase their visibility in the eye of the managers. Finally, MBIs are also information raising instruments, and even when the price increase is small, they may provide an important signalling and awareness effect.
However, the use of MBIs should be seen as a complement to environmental regulation, which is only adequate in some specific contexts. For example, water rights trading can only work where illegal water abstraction is prevented by effective regulation.
MBIs typically allow more flexibility to private actors, who can choose between polluting and paying a tax/buy a tradable right/be subject to liability. Therefore, it may not be advisable to use them to protect high-value water and wetland ecosystems or to achieve site-specific protection goals. In addition, incentive-based approaches are often designed using a trial-and-error procedure, which allows the tax or the amount of tradable permits to be gradually adjusted to reach the
desired objective. For this reason, MBIs should not be used where failures can lead to severe and irreversible environmental impacts (Bayon, 2004).
In general, MBIs are effective when the cause of environmental degradation is mainly economic (i.e. the lack of internalisation of environmental externalities), such as is the case for over-abstraction of water for agricultural irrigation or many cases of damage from over-fishing in coastal areas. If the chief obstacles to protecting ecosystem services are other factors of social, institutional, technical, logistic nature (e.g. the lack of knowledge of water ecosystem services or corruption) it is then preferable to use regulations or other environmental policy instruments such as spatial planning or awareness-raising. Also, it should be borne in mind that the ecosystem service concept and the related valuation methods are anthropocentric in nature and do not capture non-human benefits of ecosystems.
MBIs have also other drawbacks (TEEB, 2011). Introducing environmental taxes or charges often generates political opposition and is generally less accepted than setting technical requirements through environmental standards (hence a reward scheme tends to be more acceptable than a punitive charging or taxation scheme). Furthermore, MBIs can be questioned under an ethical point of view, as in some way they may be perceived as giving the “right to pollute” to those who can afford to pay. They, therefore, need to be constructed in a way that provides genuine incentives to deliver protection of water and wetland ecosystem services.
In some cases, monetary valuation and MBIs can even undermine the use of other kinds of languages and values (e.g. those related to ethics, culture, human rights), and evidence has been found on the fact that under some circumstances a monetary incentive can “crowd-out” moral, intrinsic motivations for environmental protection (Martinez-Alier, 2002; Kosoy and Corbera, 2010; Clements et al., 2010). For a discussion on the scope and limits of monetary valuation see also Section 3.3 and TEEB (2010).
To conclude, decision makers require arguments to support the protection of water and wetlands. In some cases, a simple argument based on a general recognised importance of water may be sufficient. In other cases, different valuation tools may be needed. Here we have focused on the approaches based on monetary valuation, but other approaches may be relevant in different circumstances.
MBIs are one of the possible means to enable the values of water and wetland ecosystem services to be recognised, and should complement other alternative approaches, such as planning and regulation. In any case, it is important to note that if the values of water and wetland ecosystem services are not conveyed in terms understandable and acceptable to those who make decisions, there is a serious risk that these services will be degraded or lost.
than conventional treatment that leverages limited funds while compensating the landowner for the servitude independent of ratepayers.
Wetland restoration will help the region promote carbon sequestration, preventing carbon release during wetland loss, offsetting sea level rise, and increasing the resiliency of the wetland ecosystem to drought by introducing continuous inputs of freshwater. In addition, restored wetlands dissipate surge and wave energies thereby protecting levees from breeching during the tropical storm events that are predicted to increase due to climate change.
Source: Mack et al. (2012)

Pho
to c
red
it: D
anie
la R
ussi
TeeB for WaTer anD WeTlanDs
47
5 Transforming The managemenT aPProach To WaTer anD WeTlanDs
KEY MESSAGES
• The critical role of wetlands in the water cycle, and water related ecosystem services, need to be at the heart of the transition to a sustainable economy.
• Management of water and wetlands should focus on the full suite of benefits and not on only a single issue - whether biodiversity or a single ecosystem service.
• Favouring the link between local communities and wetlands can give an important contribution to conservation and restoration by increasing local acceptance of, and engagement with, change.
• Ensuring that the wide range of ecosystem services continues to be delivered - whether food and clean water to local communities or carbon storage for global benefits – requires further loss of wetlands be avoided.
• The increase in the value of ecosystem services can outweigh the restoration costs. The actual level of benefit is site-specific.
• Improving the state of water and wetlands can have a positive effect on poverty alleviation by contributing to food, water and energy security. By addressing several policy objectives, it creates a more sustainable foundation for management action to protect and enhance water and wetland ecosystem services. It can help with implementing the broader sustainable development agenda, including access to water as a human right.
• Incorporating traditional knowledge and practices can lead to effective restoration and wise use of wetlands.
• It is important to carefully manage a transition process by understanding winners and losers and, if appropriate, compensating those whose’ interests are more severely affected.
• Awareness-raising and education are also crucial, increasing acceptance and buy-in.
5.1 Introduction
The instruments outlined in Chapter 4 are crucial to building a new management approach aimed at enhancing conservation and restoration of wetlands, which should look for multiple win-win outcomes (e.g. improving water security while enhancing livelihoods and alleviating poverty). This last chapter will explore options to promote a change in the management approach to wetlands and their water-related services.
5.2 restoration
Costs of restoration, its potential and timescale are very ecosystem and site specific. Figure 5.1 gives some figures on the restoration costs for different kinds of ecosystems (more details can be found in TEEB, 2011, Chapter 9, Annex 1). Restoration of coral reefs is the most expensive example provided (up to 11,000,000 €/ha in a restoration project in South-East Asia), and is followed by restoration of coastal systems, mangroves and estuaries (325,000 €/ha in the Bolsa Chica estuary, California). Other restoration activities may be much
cheaper, e.g. a restoration of freshwater wetlands in Denmark through hydrological manipulation (8,375€/ha) and a project involving mangrove replantation in Thailand (between 8,800 and 9,300 €/ha).
Also, restoration can take a long time. Mudflats can be restored quickly (1 to 10 years) and saltmarshes and reed beds can be restored within 10 years in certain circumstances, but 100 in others. Restoration of grey dunes and dune slacks that offer coastal protection and water purification benefits is estimated at between 100 and 500 years, and blanket, raised bogs that are important for carbon sequestration can take millennia to restore (Barnam and Morris, 2007). In other cases, the loss of ecosystem services can be irreversible, such as the loss of methane from melted permafrost.
Prioritisation of activities is necessary to ensure efficiency and effectiveness of conservation and management policies. This can be done through integrated assessment and management, as well as spatial planning (see Chapter 4).
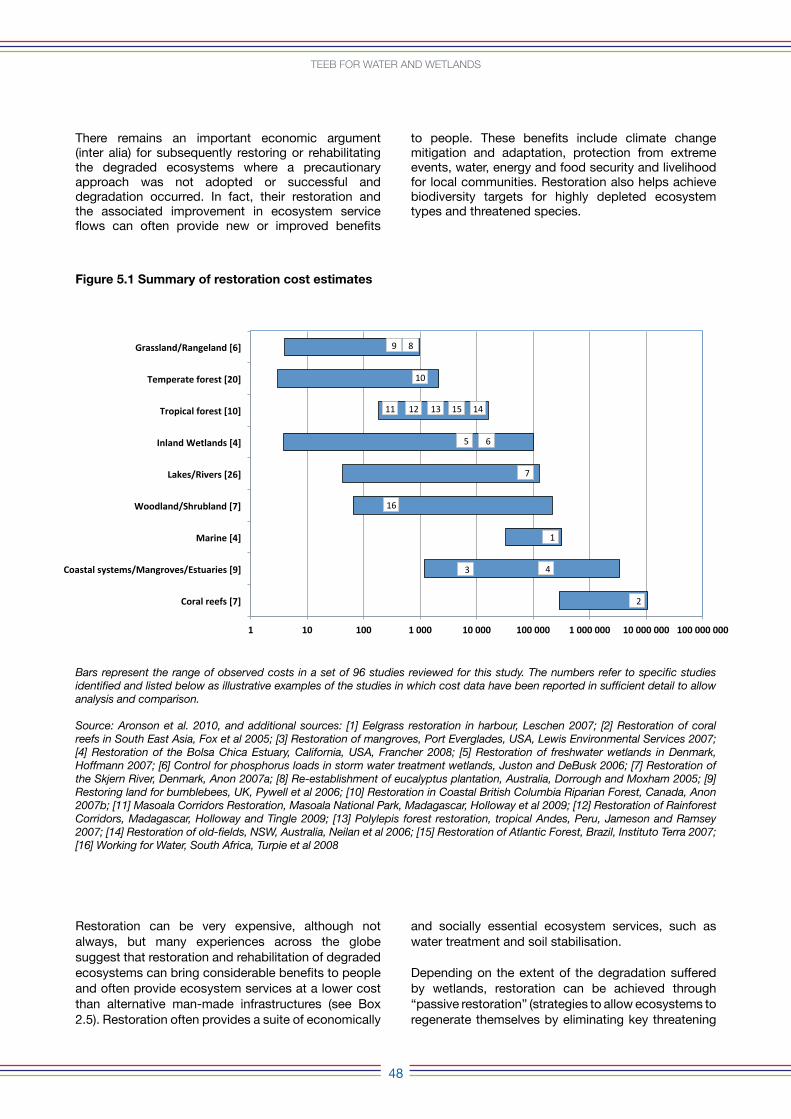
There remains an important economic argument (inter alia) for subsequently restoring or rehabilitating the degraded ecosystems where a precautionary approach was not adopted or successful and degradation occurred. In fact, their restoration and the associated improvement in ecosystem service flows can often provide new or improved benefits
to people. These benefits include climate change mitigation and adaptation, protection from extreme events, water, energy and food security and livelihood for local communities. Restoration also helps achieve biodiversity targets for highly depleted ecosystem types and threatened species.
Restoration can be very expensive, although not always, but many experiences across the globe suggest that restoration and rehabilitation of degraded ecosystems can bring considerable benefits to people and often provide ecosystem services at a lower cost than alternative man-made infrastructures (see Box 2.5). Restoration often provides a suite of economically
and socially essential ecosystem services, such as water treatment and soil stabilisation.
Depending on the extent of the degradation suffered by wetlands, restoration can be achieved through “passive restoration” (strategies to allow ecosystems to regenerate themselves by eliminating key threatening
Figure 5.1 Summary of restoration cost estimates
Bars represent the range of observed costs in a set of 96 studies reviewed for this study. The numbers refer to specific studies identified and listed below as illustrative examples of the studies in which cost data have been reported in sufficient detail to allow analysis and comparison.
Source: Aronson et al. 2010, and additional sources: [1] Eelgrass restoration in harbour, Leschen 2007; [2] Restoration of coral reefs in South East Asia, Fox et al 2005; [3] Restoration of mangroves, Port Everglades, USA, Lewis Environmental Services 2007; [4] Restoration of the Bolsa Chica Estuary, California, USA, Francher 2008; [5] Restoration of freshwater wetlands in Denmark, Hoffmann 2007; [6] Control for phosphorus loads in storm water treatment wetlands, Juston and DeBusk 2006; [7] Restoration of the Skjern River, Denmark, Anon 2007a; [8] Re-establishment of eucalyptus plantation, Australia, Dorrough and Moxham 2005; [9] Restoring land for bumblebees, UK, Pywell et al 2006; [10] Restoration in Coastal British Columbia Riparian Forest, Canada, Anon 2007b; [11] Masoala Corridors Restoration, Masoala National Park, Madagascar, Holloway et al 2009; [12] Restoration of Rainforest Corridors, Madagascar, Holloway and Tingle 2009; [13] Polylepis forest restoration, tropical Andes, Peru, Jameson and Ramsey 2007; [14] Restoration of old-fields, NSW, Australia, Neilan et al 2006; [15] Restoration of Atlantic Forest, Brazil, Instituto Terra 2007; [16] Working for Water, South Africa, Turpie et al 2008
1 10 100 1 000 10 000 100 000 1 000 000 10 000 000 100 000 000
Coral reefs [7]
Coastal systems/Mangroves/Estuaries [9]
Marine [4]
Woodland/Shrubland [7]
Lakes/Rivers [26]
Inland Wetlands [4]
Tropical forest [10]
Temperate forest [20]
Grassland/Rangeland [6]
2
43
1
7
65
14 15 13 12 11
10
8 9
16
TeeB for WaTer anD WeTlanDs
48
processes) or, when spontaneous self-regeneration is not possible, active interventions (TEEB, 2011, Chapter 9). Examples of active interventions are tree planting and rewetting drained peatlands and coastal wetlands by reducing water losses (e.g. through blocking drains and reducing groundwater extraction). In many cases, restoring a site will not lead to the same level of biodiversity and ecosystem service flows, because ecosystem degradation has entailed that one or more thresholds of irreversibility (e.g. species extinction) has been passed. In these cases, rehabilitation can be carried out, in order to restore/rehabilitate at least some ecosystem processes and allow the provision of certain ecosystem services.
Box 5.1 provides some examples of wetlands restoration and the benefits they provided to people.
Box 5.1 Examples of wetland restoration projects and their benefits
Peatland restoration in Mecklenburg-Western Pomerania, Germany
In Germany over 930,000 ha of peatlands were drained to allow for agricultural production. In the Mecklenburg-Western Pomerania state in North-Eastern Germany, 97% of the 300,000 ha of peatland was drained. As a consequence, the carbon stored in the peat was degraded leading to carbon emissions. In the last two decades, cattle rearing decreased in this area, reducing the need for grazing areas and fodder production, reducing the agricultural opportunity costs. In addition, an increased need for water storage was foreseen in view of the future effects of climate change in the area. For these reasons and for the high costs of maintaining drainage infrastructure and equipment, the Ministry of Agriculture, the Environment and Consumer protection (MLUV) of the Mecklenburg-Western Pomerania state (MV) prepared in 2000 a peatland restoration strategy, which was mainly financed by the state and the EU.
Between 2000 and 2008, an area of 29,764 ha (equivalent to about 10% of the area of drained peatlands in MV) has been restored. Emissions of about 300,000 tCO
2equivalents every year are avoided (with an average of 10.4 tCO2equivalents per hectare) (Schäfer, 2009). When assuming a marginal cost of damage caused by carbon emissions of 70€ per tCO2 (Federal Environment Agency, 2007), the effort to restore peatlands avoids damage from carbon emissions of up to €21.7 million every year, on average €728 per hectare of restored peatlands.
Based on this the idea of the so-called “MoorFutures” were born (www.moorfutures.de): companies and individuals can invest in peatland restoration for offsetting their carbon emissions. Restored peatlands also generate additional benefits for biodiversity, providing habitat for native animal and plant species. For example sea-eagles and ospreys can be observed all year round, while hundreds of migrating cranes use the sites as a stopover on their north-south migration. This increases also the attractiveness of the region as a destination for nature tourism.
Furthermore, restored peatlands also generate income through extensive grazing, production of reed or sphagnum mosses (to be used respectively as substrate in horticulture and as building material/biofuels) and the growth of alder forests (whose timber can be used to produce high quality furniture). These so-called “paludicultures” allow for the production of commodities while maintaining the multiple functions and services of peatlands. This can further reduce opportunity costs making peatland restoration a potential win-win-win option for climate change mitigation, land use and biodiversity conservation.
Sources: Förster (2010); MLUV MV (2009); Schäfer (2009)
Peatland restoration in Bellacorick, Ireland
The industrial cutaway peatland at Bellacorick was restored in 2009, by blocking drains, creating peat ridges to contain the water and landscape the peatland surface. The project led to a higher water table level and the extensive recolonisation of the former bare peat substrate by vascular and moss vegetation. The restoration project re-established the carbon sink sink function of natural peatlands. It was estimated that the benefits in terms of carbon restoration were worth on average €1,506 per ha for the avoided carbon loss (75 tCO2eq. per ha; adopting a carbon price of €20t CO2eq.) and €118 per hectare per year for the average net carbon sequestration (5.9 tCO2eq. per ha per year).
Source: Wilson et al. (2012)
River Napa restoration, USA
The Napa Valley suffered major repetitive losses due to frequent flooding in populated areas, with the last major flood occurring in 1986, forcing the evacuation of 5000 residents, causing the loss of three lives, and damage of US$100 million (1986 dollars). The present value of damageable property within the floodplain is well over US$ 1 billion. In
TeeB for WaTer anD WeTlanDs
49
order to avoid and mitigate floods in the Napa River Basin, a US$ 400 million project was initiated in 2000, with the objective of increasing the capacity of the wetlands adjacent to the river to handle flood waters, while maintaining and restoring its original shape and alignment. Local stakeholders including residents, researchers, business owners, representatives from the state and civil society, came up with a new plan called the “Living River Guidelines.” Existing floodwalls and levees were replaced with terraced marshes, wider wetland barriers, and restored riparian zones. Also, the river was restored closer to its original shape, allowing it to meander as much as possible. Over 700 acres around the Napa city were converted to marshes, wetlands and mudflats. 50% of project costs were financed locally through a 1% yearly sales tax increase for 20 years, and the other 50% by federal sources, grants and loans from the state. The project reduced the risk of floods, increased property values and tourism, and improved the water quality and wildlife habitats. Extensive private investment in property development totalling US $400 million has occurred since the approval of the flood project. Flood insurance rates for about 3,000 properties will either be be lowered or eliminated when the regulatory flood maps are changed through the Federal Emergency Management Agency (FEMA).
Source: Almack (2010)
Mangrove restoration in Senegal
45,000 ha of mangroves in the estuaries of Casamance and Sine Saloum, out of 185,000 ha, have been lost since the 1970s due to droughts, reduced freshwater flows caused by upstream agricultural activities, deforestation for obtaining firewood and timber for construction activities, and infrastructures like dams and roads. Mangrove degradation caused a sharp reduction in fish stock and there was also an increase in water salinity, which in turn hinders the growth of paddy rice.
In 2008, the Senegalese NGO Oceanium replanted 163 ha of mangroves. In the following years, it obtained financial support from the company Danone, which allowed it to plant a further 1,700 ha in 2009 and 4,900 ha in both 2010 and 2011. The project led to an increase in fishery resources and wood. It was also registered under the Clean Development Mechanism (CDM) of the United Nations Framework Convention on Climate Change (UNFCCC).
Source: http://www.livelihoods.eu/livelihoods-fund.htmlRestoration of coastal habitats
In the UK, sea walls have been built to protect land from erosion and flood events. Their maintenance is cost intensive and it is increasingly recognised, that these defences cause the degradation or loss of coastal and intertidal habitats (e.g. mud flats and salt marshes), and the ecosystem services they provide, in particular coastal protection and flood defence. Through deliberate breaching of the sea walls the coastline realigns further inland and the coastal ecosystems and their ecosystem services are restored. In the Humber estuary, this option of managed realignment was found to have a positive net present value after around 30 to 40 years, reaching a benefit of about £11.5 million over a period of 50 years. Over the same period, the maintenance of the sea walls would result in more costs than benefits. Managed realignment is in particular an option in rural areas, where opportunity costs of land are low.
Source: Turner et al. 2007
Restoration of coastal wetlands to reduce land loss
In Louisiana, land loss has already claimed 1,880 square miles of coastal wetlands since the 1930s. In order to address this problem, a Master Plan for the Coasts was approved in May 2012. The Master Plan is based on a two-year scientific analysis, which was used to select 109 high performing projects that could deliver measurable benefits in terms of flood risk reduction and sustainable land building, as well as enhancing the provision of ecosystem services. The projects were chosen on the basis of a wide range of environmental, economic and social criteria, including ecosystem services such as freshwater availability, oyster and shrimp provision, carbon sequestration, nutrient uptake. The Master Plan will inform Louisiana’s coastal investments for the next 50 years, with a total investment of $50 billion in restoration projects (e.g. bank stabilisation, barrier island/headland restoration, hydrological restoration, marsh creation, oyster barrier reef establishment), risk reduction projects (e.g. levees and elevating homes).
Source: http://www.coastalmasterplan.louisiana.gov/
TeeB for WaTer anD WeTlanDs
50
Box 5.2 Examples of the relation between traditional knowledge and wetland protection
Pond dredging and clean-up, Sakata, Niigata City, Japan
Katabushin is a traditional form of lagoon management, which consists of dredging the lagoon to remove debris, which is then used to fertilise surrounding rice paddies, together with reed cutting and rubbish collection on the banks. The Sakata lake ecosystems were degraded since the 1960s, and threatened with succession and eutrophication after the Katabushin practice ceased. Katabushin was revived in 2002, after interviewing elders who remembered the state of the lake before degradation. The Sakata conservation group organises every year a Katabushin event, which attracts between 200 and 300 participants and is crucial for the conservation and restoration of Sakata. The event plays a key role in preserving Sakata’s culture by allowing participants to sample lotus and water chestnut dishes. Also, lessons on dry lotus blossom arrangement are organised during the event.
Source: Tsujii and Sasagawa (2012)
Prespa Lakes, Greece, Albania and the FYR of Macedonia
The Micro and Macro Prespa Lakes are among the oldest lakes in Europe. They are very rich in biodiversity and host many endemic species. In the past, many traditional activities were linked to the conservation of wet meadows. Until the 1980s, cattle grazing maintained the diverse and short vegetation of the wet meadows, allowing the presence of rare bird species such as pelicans and the then rare cormorants. Reeds were used as a building and insulation material, as a resource for making household objects and as animal feed. Buffalo grazing controlled the spread of the reed beds and allowed the presence of wet meadows. Wet meadows play an important role in the ecosystems of the lake (they are used as spawning grounds by some fish species and as feeding and nesting areas for water birds, and support a large number of invertebrate, amphibians, reptiles and mammals). A programme is now being carried out by the Society for the Protection of Prespa (SPP) for the integrated management of water resources in the two Prespa lakes, which will aim to reconnect with traditional practices; one of the main activities of the programme is the re-introduction of the traditional management of reed beds through grazing by buffaloes.
Source: Papayannis and Pritchard (2011)
5.3 Traditional practices and local knowledge
Traditional practices and local knowledge can play an important role in the wise use of wetlands, and need to be taken into account in wetland management. Recognising and strengthening the link of local communities to wetlands can contribute to conservation by involving a wide range of stakeholders. Also, local and traditional knowledge should be considered key in managing wetland ecosystem services. In many cases, traditionally evolved techniques of ecosystem management are better tailored to local conditions than external management approaches. Moreover, involvement of local communities is a key factor for successful policy change and its acceptance.
The integration of traditional water and related resource management practices can often increase the cost-effectiveness of restoration projects by, for example, reducing the need for outside expertise, tools and technologies or increasing community involvement due to the accrual of valuable co-benefits.
Box 5.2 shows one of the 33 examples presented in a recently published book on the relationship between culture and wetland protection in Japan (Tsujii and Sasagawa, 2012) and one of the case studies analysed in a report on the cultural values in the Mediterranean (Papayannis and Pritchard, 2011).
5.4 Sustainable tourism
Sustainable tourism can contribute to transition management, since it is a way of supporting local livelihoods and local cultures, while generating incentives for the conservation and management of natural resources. In addition, sustainable tourism in wetlands can help provide means for conservation and improvement of ecosystem services. In many cases, it also facilitates the acceptance and enforcement of environmental regulation by local populations and businesses, and can be combined with communication and education activities, targeted both to local communities and tourists. According to the UNWTO definition, sustainable tourism should “make optimal use of environmental resources that constitute a key element in tourism development, maintaining essential ecological processes and helping to conserve natural heritage and biodiversity” (Ramsar and UNWTO, 2012). Key elements of sustainable tourism are appropriate planning, regulating and monitoring of tourist activities, as well as the involvement of local communities e.g. though training activities and credit schemes to set up small tourism businesses (UNEP, 2011).
Tourism in wetlands depends on the water-related ecosystem services delivered by healthy wetlands
TeeB for WaTer anD WeTlanDs
51
(e.g. freshwater, flood protection), and also on other ecosystem services (e.g. beautiful landscapes), and therefore constitutes and additional motivation for restoration and conservation
Box 5.3 presents some examples of sustainable tourism management that brings benefits to local communities.
Box 5.3 Examples of sustainable tourism
Tubbataha Reefs Natural Marine Park, Philippines
The Tubbataha Reefs Natural Marine Park was created in 1988, which banned fisheries, as destructive fishing was increasingly threatening the function of the reef as a nursery ground for the Sulu Sea. Intact reefs are also attractive for dive tourists providing an important source of income. However, the ban alone was insufficient to solve the problem. Interests were divided between those pushing for a fishing ban within the park and the fishers claiming their rights to extract resources in the park. Externally imposed park rules were not respected.
In 1999 a workshop was held involving all interest groups. Fishers were not convinced of the benefits of a no-take zone and information on this could not be provided in the short term. However, a willingness-to-pay study among tourists visiting the area opened up options for better balancing the costs and benefits of conservation between the stakeholders in a way that all stakeholders were willing to accept the no-take policy, even without proofs of the medium-term benefits to fisheries. Tourists are asked to pay a conservation fee, which is used for managing the protected area, compensate fishermen and fund livelihood initiatives in communities in the region. Also, there are regulations controlling scuba diving to protect the reefs from potential damage from tourism. As a result the no-take zone was respected and fish biomass increased both within the park and outside park boundaries (spillover effect) benefiting local fisheries.
After a decade of difficulties, this marine protected area was swiftly and successfully implemented. Critical for this was the well-facilitated involvement of all stakeholders, the identification of significant income potential from visitors, and a short term re-distribution of funds which could provide sufficient incentive for local fishermen to accept the no-take zone, so that the future benefits of this measure could become tangible.
Ibera marshes, Argentina
In the Ibera Marshes in Argentina, conservation-based tourism activities have revived the economy of Colonia Carlos Pellegrini, near the Ramsar Site “Lagunas y Esteros del Iberá”, creating new jobs and allowing local inhabitants stay employed in the town rather than migrate to cities to look for work. Around 90% of the population now work in the tourism sector. In order to favour local employment, the site managers provide local rangers and guides with training on working with guiding tourists. In addition, local communities receive support to establish municipal nature trails.
Lake Ichkeul, Tunisia
Two droughts in 1992 and 2002 and the large volume of water abstraction for agriculture led to a decline in Lake Ichkeul’s ecosystems (e.g. 75% reduction of waterbirds) and to a consequent reduction in the interest of tourists in the lake. Improved water management practices allowed the restoration of the lake, resulting in the doubling of the number of tourists since 2005. The promotion of the lake as a tourist destination helped raise awareness on the value of the lake ecosystems and the importance of the wise use of the wetland. It also generated new sources of income for the Park management and conservation and allowed establishment of basic training and credit schemes to increase the involvement of local communities in tourism activities.
Lake Nakuru, Kenya
Lake Nakuru receives every year around 149,500 international and 95,500 domestic visitors, who are charged an entrance fee of US$ 80 and US$ 11 respectively. The income from the entrance fees and concession fees from lodges contributes to paying for the costs of park management. Overall, around 70% of Kenya’s international tourism is targeted to wildlife, and therefore biodiversity conservation is not only an environmental objective but it is also crucial for the country’s economy. Awareness of the importance of nature is promoted by a large-scale environmental education programme, involving about 100,000 school students each year and with inexpensive wildlife viewing tours that the National Park runs for residents.
Source (for above four cases): Ramsar and UNWTO (2012)
52
TeeB for WaTer anD WeTlanDs
5.5 Synergies between wetland restoration/conservation and poverty alleviation
Improving and restoring wetlands can be a cost-effective way of meeting a range of policy, business, and private objectives. This includes not only water security, but also food and energy security, since water plays a key role in agriculture and energy production (see Chapter 2). Moreover, wetlands have a central role in climate change adaption and their sustainable management in many cases is able to improve their resilience to climate change by mitigating its effects (e.g. increased storms, droughts and floods). Well-preserved wetlands also contribute to social cohesion and economic stability by ensuring livelihood for local communities and to preserving cultural identity. For all these reasons, ensuring healthy and well-preserved wetlands is crucial to alleviate poverty and meet the UN Millennium Development Goals for 2015 (WWAP, 2012). They are also expected to be instrumental in contributing to meeting the Sustainable Development Goals that will be set post- 2015.
Reallocating investments to protect water-related ecosystem services and natural water infrastructures, including wetlands, will be crucial in fulfilling these objectives. For example, water and sanitation can be improved through wetland restoration. Access to clean freshwater can be ensured by healthy wetlands like rivers and lakes. Investments in water and wetland management will provide long-term economic benefits, reduce overall costs, and may be cheaper than the alternative technological solutions (see Box 2.5 for some examples). Also, restored wetlands can provide livelihood for local communities (e.g. by supporting viable fish populations or attracting tourists). Box 5.4 shows some examples of poverty alleviation associated to wetland restoration projects.
5.6 Transition management
Some types of wetlands have a negative image in the eye of the general public. For example, swamps, marshes and bogs are often seen as insalubrious places, which favour the spread of diseases like malaria. Furthermore, protection and restoration of wetlands can not only bring (direct or indirect) economic benefits to many people, but they can simultaneously negatively impact other stakeholders (e.g. restoring coastal mangroves for storm protection can impact the livelihood of shrimp farmers). In many cases a trade-off is found between the conservation or improvement of supporting and regulating ecosystem services (e.g. flood protection, sediment transport and water purification) and the delivery of provisioning ecosystem services (e.g. agricultural products and timber); see section 4.2 for further details. The resulting loss in employment opportunities may cause local populations to oppose sustainable wetland management.
Reducing the magnitude of the negative impact of wetland restoration can only be achieved by taking into account the bundle of ecosystem services that are affected by the measures instead of looking at the effects on services individually. As transitions almost always involve trade-offs, it is key to reduce the extent of the trade-offs by looking at the sum of the effects on the different ecosystem services and do this on a larger spatial scale. Integrative modelling approaches such as Bayesian belief networks are being successfully applied (van der Biest et al, 2013; Haines, 2011) to evaluate bundled services. Coupling spatial planning and trade-off analysis improves functional understanding of ecosystem service trade-offs, determines the overall impact of land use shifts on ecosystem service supply and can determine the most cost-beneficial land use transitions.
Box 5.4 Synergies between ecosystem restoration and poverty alleviation
The Volta River Basin, Ghana and Burking Faso
The Volta River Basin’s area (400,000 km2) includes six countries, but 85% is located in Burkina Faso and Ghana. During the last decades, extensive exploitation of natural resources in the area, due to population increase and poverty, led to water scarcity, land degradation and siltation of river channels. In order to simultaneously address both environmental and poverty issues in the basin, the IUCN Water and Nature Initiative (WANI), launched the project “Improving Water Governance in the Volta River Basin”, in partnership with national partners. The project consisted of 1) the establishment of participatory and multi-scale (local, national, transboundary and regional)
governance frameworks for joint management of water resources; 2) livelihood pilot projects (rehabilitation of a small dam, digging of 3 wells, plantation of 27,000 tree seedlings and 6,500 fruit seedlings, provision of 19 water pumps and more than 40 sheep or goats); 3) collection of data to inform decision-making, including socio-economic surveys and a water audit. The project included awareness raising activities and financial, management and technical training targeted to the local population.
The pilot projects showed the positive impact on poverty alleviation of integrated water resource management, and set the basis for further improvements. In addition, the awareness raising and training activities helped local communities to improve their farming techniques.
Source: Welling et al. (2012)
53
TeeB for WaTer anD WeTlanDs
For this reason, a careful management of the transition process towards an improved protection of water-related ecosystem services and wetlands is crucial, not only from an ethical point of view but also for the wide acceptance of the needed reforms. Disseminating knowledge on the benefits that wetlands provide to local communities can help counterbalance the negative vision on wetlands some stakeholders may have. In addition, it helps build a balanced view on the trade-offs involved with wetland management, thereby increasing acceptance and participation in the required transition policies and actions. Ensuring an equitable sharing of the benefits may imply compensating those whose benefits are eroded as a consequence of the enhancement of other ecosystem services.
For a successful transition, it is important that the needs of all relevant stakeholders are addressed (and especially the most vulnerable ones).
In the case of the Tubbataha Reefs Natural Marine Park (see Box 5.3 and Annex 1) simply establishing a no-take zone did not solve the problem of reef degradation as fishermen continued entering the area applying unsustainable fishing methods. Only when a compensation payment generated through a fee on dive tourism was introduced did fishermen agree on respecting the no-take zone. As a result, fish populations within the park regenerated leading to a “spillover effect” to the areas outside the park which in turn increased the catch of fishermen beyond what they caught earlier without the no-take zone. The compensation payment allowed fishermen to receive immediate benefits from a no-take zone and helped to overcome the time lag in the recovery of the reef ecosystem.
The example of Kala Oya in Sri Lanka (Box 3.9) illustrates how the re-introduction of traditional practices for water management can help local communities to realise multiple benefits from ecosystem services provided by the traditional man-made water tank system and inform restoration strategies. In a stakeholder process costs and benefits of different management options for water tanks with regards to ecosystem services were assessed. It was found that rice cultivation is only one benefit besides many others including water provisioning for domestic use and livestock, fisheries and harvest of lotus flowers. Although manual removal of silt was the most labour and therefore cost intensive option for rehabilitating the tank system, local communities opted for this strategy as they could apply it themselves having better control over their resources.
In the case of the restoration of the Napa River (see Box 5.1), not only did the extreme flood events mobilise decision makers to restore the river bed but local stakeholders, including residents, researchers, business owners, and representatives from the state and civil society, came up with a new plan called the “Living River Guidelines.” They were important change agents for proposing strategies that created multiple
benefits for the local community including reduced potential flood damages, improved water quality and habitats, and creating higher recreational values. Eventually also insurance rates are expected to decline due to lower flood risks.
Box 5.5 provides some further case examples for a successful transition management.
Box 5.5 Example of transition management initiatives
Water Funds in Latin-America
The Northern Andes region faces three critical problems: 1) natural ecosystems, mainly páramo and mountain forests – the key hydrologic regulators of the region – are threatened by conversion to crop and ranch land; 2) ranchers and farmers depend on the land for their livelihoods; and 3) growing population and demand for water. Coupled with unpredictable impacts of climate change, there is a threat to the long term availability of natural resources in the region.
Preventing access to the natural ecosystems would harm the farmers’ livelihoods. However, allowing continued conversion increases the likelihood of ecosystem degradation and threatens access to water services, such as clean drinking water for these same people, as well as downstream users and beneficiaries such as cities, water utilities, agricultural and beverage industries.Water funds aim at solving this conflict by establishing long-term financial mechanisms that involve a public-private partnership of water users who determine how to invest financial resources in activities for maintaining or enhancing water services in priority areas while providing additional benefits to local communities living upstream in the watershed.
The Nature Conservancy (TNC) developed a step-by-step methodology for how to create a water fund. The general components include:
1) Assess the feasibility of an ecosystem service approach: identify the ecosystems and people that are water service “suppliers” and identify those that are “users”, and ensure the legal, biophysical, and institutional conditions are amenable to a water fund. Use existing data whenever possible.
2) Develop sustainable financial mechanisms with transparent management. Finance can come from public agencies (e.g. water utilities, hydropower companies), companies (e.g.
54
TeeB for WaTer anD WeTlanDs
beverage companies, agriculture associations), citizens (e.g. in cities paying fees, taxes, for water use), grants and private foundations, bilateral and multilateral donor agencies and the financial returns generated from the trust fund.
3) Establish a multi-stakeholder institutional mechanism, which includes representatives of all stakeholders (public and private). It should make decisions about how to spend money in the watershed, prioritising investment based on feasibility studies and, in some cases, on the advice from a technical committee.
4) Implement concrete actions to generate services and conservation benefits, e. g. securing protection of natural ecosystems; and implementing best management practices on productive systems to provide ecosystem services.
5) Establish an accountability system to ensure delivery of services and protection of natural ecosystems including indicators that allow measuring the impact of the action on the ecosystems, the services they provide and on the livelihoods of people.
Creating a water fund requires time, leadership, particular biophysical and social conditions, and a “fit” with national and regional laws. Developing feasibility studies, identifying good regions for the water fund approach, engaging stakeholders, selling the model, and establishing relationships involve large upfront costs. Effective replication in new regions requires people to undertake these tasks and charismatic leadership to engage new stakeholders.
Despite these hurdles, water funds are proliferating throughout Latin America particularly through a relatively new initiative: the Latin American Water Funds Partnership, an alliance supported by The Nature Conservancy, FEMSA Foundation, Inter-American Development Bank (IADB) and Global Environment Facility (GEF), created to preserve healthy watersheds and help protect water supplies in the region. The Partnership comprises investments of over US 27 million that will create, implement and capitalise at least 32 water funds in Ecuador, Colombia, Peru, Brazil, Mexico and other countries in Latin America and the Caribbean. These will support the conservation of watersheds that in turn could benefit around 50 million people in rural and urban areas.
Sources: Calvache et al. (2012); Goldman et al. (2010a); Goldman et al. (2010b)
The Quito Water Conservation FundAbout 80% of the water for the nearly two million inhabitants of the city of Quito, Ecuador, comes from three protected areas. A variety of activities threaten the availability of this regular clean water supply mainly due to land conversion for farming in the watershed.
The Quito Water Conservation Fund (Fondo para la Conservación del Agua – FONAG) was created with an initial investment of US$ 1,000 from The Nature Conservancy (TNC) and US$ 20,000 from the Quito water company. Other water users have since joined the water fund, such as the Quito electric company and private organizations including a beer company (Cervecería Nacional), a water bottling company (Tesalia Springs Co.) and a Swiss Cooperation (COSUDE). The endowment reached US$ 5.4 million at the end of December 2008 and is now almost US$ 8 million. In 2008 alone, the endowment yielded US$ 800,000 which FONAG invested in conservation projects. After a 7-year process a municipal by-law was passed by which the Quito water company will provide 2% of their revenue to the water fund (up from the initial 1% commitment).
FONAG uses the revenue from the water fund to finance various programmes and projects including control and monitoring of protected areas, restoration of natural vegetation, environmental education and outreach, training in watershed management, productive projects with local communities and a hydrological monitoring programme. One of the main beneficiaries of the activities is the local communities that live close to the water sources.
Showing results has been crucial for maintaining support. According to Arias et al. (2010), during 10 years FONAG has:
• Helped conserve the watersheds that provide 80% of the water upon which the citizens of Quito, a population of 1.8 million, depend;
• Involved 500,000 ha of land;• Involved 35,500 children in environmental
education programmes;• Re-vegetated and maintained ~600 hectares of
land/year for the past 4 years;• Reforested 2,033 ha with over 2,000,000 trees;• Hired, trained, and employed 11 community
parks guards;• Engaged over 200 families in community
development projects in rural basins.
In addition, recent monitoring and evaluation projects are helping to demonstrate the impact
55
TeeB for WaTer anD WeTlanDs
5.7 conclusions: water and wetlands as a solution
An understanding of the values and benefits that people derive from water and wetlands should be central to the development and implementation of regional, national and international policies addressing these assets as well as specific management decisions for individual sites. In many cases, ensuring these values are fully taken into account requires that the approach to water and wetlands is transformed. Furthermore, this approach needs to be considered within the wider context of the management of the natural environment and its relation with economy. Thus transforming the approach to water and wetland management is part of an overall transition to a sustainable global economy.
The transformation starts with an appreciation of the full suite of values and benefits that water and wetlands provide to society. These assets are the source of multiple benefits, but often these are either not recognised, or only one is appreciated. Understanding the multiple benefits means having access to sufficient information to make the necessary assessments, engaging with local communities, and having robust tools to determine values and changes in these.
Understanding the values is only a first step in the transformation. Taking full account of these values requires a more integrated decision-making approach than has commonly been the case to date. Because of the significant economic benefits derived from wetland ecosystem services, there are consequences for many different decision makers. Hence there is a need for effective and integrated decision making. For example, improving the state of water and wetlands can have a positive effect on poverty alleviation, by ensuring food, water and energy security. By addressing several policy objectives, it creates a more robust foundation for management action to protect and enhance water and wetland ecosystem services. It can help with meeting the MDGs and also the Rio+20 endorsement that access to water is a human right and be a core element of local, regional and international development cooperation.
It is important to prioritise the protection of these ecosystems and restore them where possible. Further loss of such systems is very likely to lead to a net loss in ecosystem services and economic value to local communities and will have a negative impact on human well-being.
Engagement with people is critical in transforming the management approach. Understanding ecosystem values often requires discussion with communities to determine the services derived from water and wetlands, not least taking account of traditional knowledge. Such knowledge is often also critical for developing good management solutions to protect and enhance ecosystem services. Awareness raising and education is also crucial for the transition. It can help with water and wetland protection and improvement, since it increases acceptance and participation. This is critical for stakeholder buy in and for transition management. It is important to be able demonstrate that the transition is one to an overall improvement for all.
Collective action between governments, business, NGOs, local communities and indigenous peoples is needed to ensure the long-term sustainability of water and wetlands, and the global economy. Given the increasing human population and its dependence on water and wetlands, full recognition of the values and benefits of nature is a pressing imperative.
of FONAG; an analysis on water-related impacts revealed that waterways with water fund investments as opposed to those without have greater ecological integrity, improved riparian and aquatic habitat quality, reduced erosion, and a more balanced temperature.
The municipality of Quito now looks to watershed conservation in addition to built infrastructure as a way to provide clean water to its citizens.
Sources: Arias et al. (2010); Echavarria (2002); Encalada et al. (2011)
The water fund in East Cauca Valley, Colombia
In the East Cauca Valley of Colombia, The Nature Conservancy (TNC) and Asocaña, an association of sugar cane producers who provided most of the funding, led to the creation of a water fund, called Fondo de Agua por la Vida y la Sostenibilidad (FAVS) – Water Fund for Life and Sustainability. Asocaña relies on a regular supply of clean water for sugar cane production. Since its creation in 2009, this fund has invested more than US$ 2 million in watershed protection, and now is seeking to start an endowment fund to ensure long term yields to make the fund self-sustainable. Several other groups, including community-based grassroot organizations, the regional environmental authority, and a peace and social justice organization also participate in the fund. Activities carried out through investments by the fund include conserving at least 125,000 ha of the natural ecosystems and improving management of the landscape. These activities will benefit 920,000 people downstream and sugar cane production, an important industry for the Colombian economy.
Source: Goldman et al. (2010c)
56
TeeB for WaTer anD WeTlanDs
Practical recommendations for stakeholders to respond to the value of water and wetlands in decision-making
At the global level, there is a need to ensure implementation of the Strategic Plan for Biodiversity 2011-2020, the Ramsar Strategic Plan 2009-2015, the UNFCCC, the MDGs, and strategic planning and implementation of the many Multilateral Environmental Agreements (MEAs). The role and value of water and wetlands should be integrated in each of these, in order to improve water security and other water-related benefits. It is an awareness and governance challenge, with potential for significant synergies and efficiency gains, because investments in wetlands are investments in human welfare.
national and international policy makers
• Integrate the values of water and wetlands into decision making and national development strategies – in policies, regulation and land use planning, incentives and investment, and enforcement. Make full use of the NBSAPs (National Biodiversity Strategies and Action Plans) process to help with integration;
• Ensure that wetland ecosystem services options and benefits are fully considered as solutions to land and water use management objectives and development;
• Develop improved measurement and address knowledge gaps, using biodiversity and ecosystem services indicators and environmental accounts. This requires an improved science-policy interface and support for the scientific/research communities. The recently established Intergovernmental Platform on Biodiversity and Ecosystem Services (IPBES)5 could contribute significantly in this area;
• Reform price signals via water cost recovery, resource pricing and reforming environmentally harmful subsidies, so that they promote sustainability;
• Commit to restoration targets and/or programmes, improving ecosystem health and functioning, thereby achieving the multiple benefits of working with nature.
Local and regional policy-makers
• Assess the interactions between wetland ecosystems, communities, man-made infrastructures and the economy and ensure the evidence base is available to decision makers, whether spatial planners, permit authorities, investment programme authorities, inspectors or the judiciary;
• Integrate planning systems - e.g. water supply and management to take into account both ecosystem-based infrastructures and man-made infrastructures;
• Ensure due engagement/participation of communities (including indigenous peoples) and ensure that traditional knowledge is duly integrated into management solutions.
Site managers
• Assess the status and trends in wetland ecosystem services, including identification of components and processes that are required to sustain the provision of these services6;
• Assess the interlinkages between livelihood systems and ecosystem services, particularly property rights and distribution of costs and benefits associated with ecosystem services provision7;
• Develop site management plans to ensure wise use of wetlands, including sustained provision of ecosystem services8;
• Use valuation of ecosystem services as a means to communicate the role of wetlands in the local and regional economy, support resource raising, or inform decision makers of the impacts and trade-offs linked with developmental policies impacting wetlands9;
• Include mechanisms for capturing ecosystem service values as incentives for the stewardship of local resource use within management plans. Where possible and relevant, use tools such as payments of ecosystem services, taxes and other economic instruments to rationalise incentives linked with ecosystem services;
57
TeeB for WaTer anD WeTlanDs
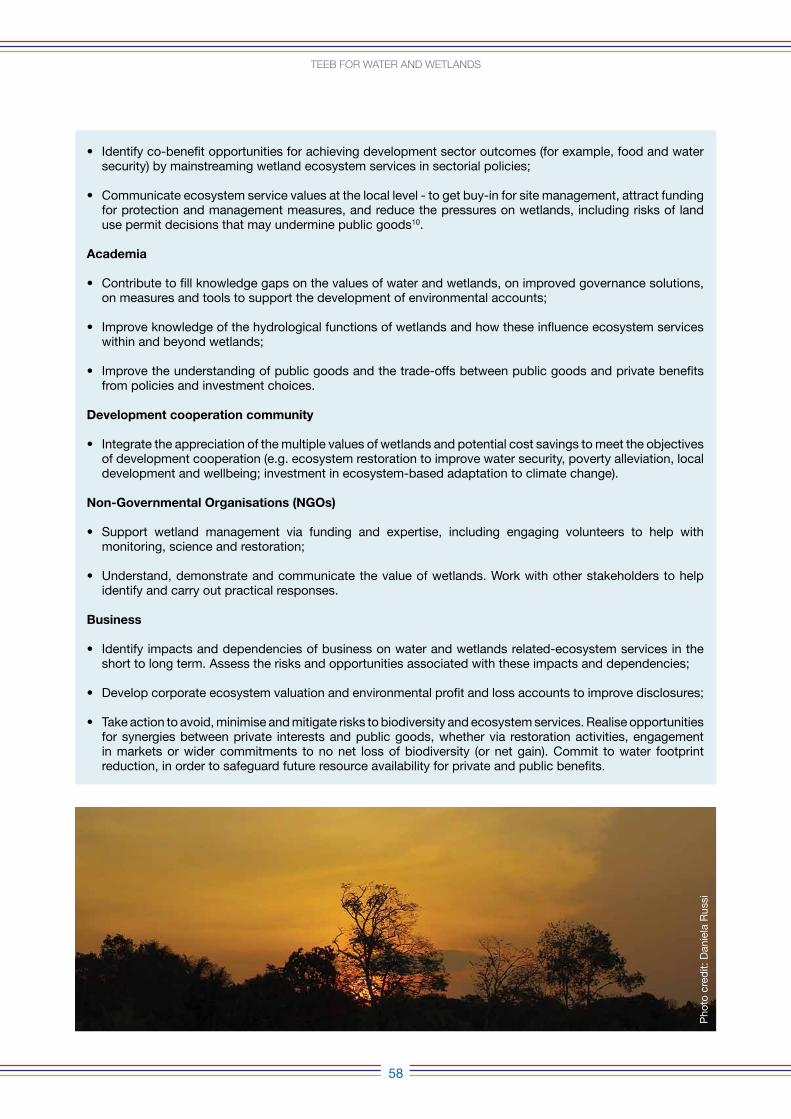
• Identify co-benefit opportunities for achieving development sector outcomes (for example, food and water security) by mainstreaming wetland ecosystem services in sectorial policies;
• Communicate ecosystem service values at the local level - to get buy-in for site management, attract funding for protection and management measures, and reduce the pressures on wetlands, including risks of land use permit decisions that may undermine public goods10.
Academia
• Contribute to fill knowledge gaps on the values of water and wetlands, on improved governance solutions, on measures and tools to support the development of environmental accounts;
• Improve knowledge of the hydrological functions of wetlands and how these influence ecosystem services within and beyond wetlands;
• Improve the understanding of public goods and the trade-offs between public goods and private benefits from policies and investment choices.
Development cooperation community
• Integrate the appreciation of the multiple values of wetlands and potential cost savings to meet the objectives of development cooperation (e.g. ecosystem restoration to improve water security, poverty alleviation, local development and wellbeing; investment in ecosystem-based adaptation to climate change).
non-Governmental organisations (nGos)
• Support wetland management via funding and expertise, including engaging volunteers to help with monitoring, science and restoration;
• Understand, demonstrate and communicate the value of wetlands. Work with other stakeholders to help identify and carry out practical responses.
Business
• Identify impacts and dependencies of business on water and wetlands related-ecosystem services in the short to long term. Assess the risks and opportunities associated with these impacts and dependencies;
• Develop corporate ecosystem valuation and environmental profit and loss accounts to improve disclosures;
• Take action to avoid, minimise and mitigate risks to biodiversity and ecosystem services. Realise opportunities for synergies between private interests and public goods, whether via restoration activities, engagement in markets or wider commitments to no net loss of biodiversity (or net gain). Commit to water footprint reduction, in order to safeguard future resource availability for private and public benefits.
58
TeeB for WaTer anD WeTlanDs
Pho
to c
red
it: D
anie
la R
ussi
59
TeeB for WaTer anD WeTlanDs
Annex I
Applying the stepwise approach: a PES scheme for improving water provisioning in Moyobamba, Peru (TEEB 2012, p245, based on renner 2010)
Step 1: specify and agree on the problem
The water supply for Moyobamba, a city of about 42,000 inhabitants located in the Andean foothills in northern Peru, depends on the three watersheds: Rumiyacu, Mishquiyacu and Almendra. These biodiverse areas were impacted by land-use change during the last decades. As a consequence, the quality and quantity of water coming from these watersheds declined, which negatively impacted city inhabitants. The public company EPS is responsible for supplying the city with water and considered increasing measures for water treatment and to restrict water supply. This would have increased the costs for potable water production (León and Renner, 2010; Renner 2010). A significant improvement in land use was needed for the conservation and restoration of ecosystem services that support water quality and supply, in order to satisfy demand from water of companies and citizens, while improving farmers’ livelihoods.
Public authorities and representatives from civil society, with advice from the Deutsche Gesellschaft für Internationale Zusammenarbeit (GIZ), an institution working in the field of international cooperation, started a dialogue in order to identify the causes for the degradation and the necessary actions for improving the management of the watersheds (León and Renner, 2010). As there was no scheme for water management, a steering committee that included the relevant upstream and downstream stakeholders, was established.
Step 2: identify which ecosystem services are relevant
Preliminary assessments pointed out that the underlying cause of ecosystem degradation and deteriorating water quality was in particular the migration of poor families from the high Andean regions. Due to lack of knowledge on appropriate land practices for the Amazon ecosystem and economic alternatives, they converted forests of the upstream areas to agriculture, causing changes in the provision of ecosystem services. Livestock, together with wastewater from processing coffee as well as soil erosion, were identified to be major causes for decreasing water quality. In particular, forests on slopes and along rivers were directly relevant for erosion control and the filtration of nutrient rich water from farmland.
Step 3: define the information needs and select appropriate methods
Due to the recognition of the importance of forests for water provision, the municipality declared Rumiyacu-Mishquiyacu and Almendra as municipal conservation areas. Furthermore, it was agreed between the public
water company ESP and other stakeholders within the steering committee to carry out a series of assessments: 1) characterise ecosystem services, 2) understand stakeholder relations, 3) characterise the socio-economic context and 4) identify land use alternatives.
The assessment included:
• hydrological modelling based on the Soil and Water Assessment Tool (SWAT) to estimate water supply and sedimentation rates;
• calculations of the socio-economic and environmental costs and benefits associated with different land uses as perceived on site by farmers and off site by downstream communities, using the assessment model ECOSAUT;
• demand-based assessment for water for household purposes and irrigation;
• assessment of the costs of water treatment by the EPS;
• a survey on the willingness to pay of city inhabitants for better water quality.
Step 4: Assess the changes in the flow of ecosystem services
The change in the delivery of ecosystem services was estimated for different land-use scenarios. For monitoring the impact of the actions taken to enhance ecosystem services and to reduce pollutants, the steering committee decided to focus on measuring water quality (i.e. pH and the concentration of faecal coliform bacteria). The information collected during the assessment phase (2004–2005) contributed to the understanding of interests and needs of the involved stakeholders and in supporting the activities of the design and consolidation phase (2006–2009).
It was found that in the past the pollutants coming from upstream farmland contributed to the deterioration of water quality. As a consequence, the decline of water quality increased the costs for water treatment by EPS from US$80,000 in 2001 to US$250,000 in 2004. Therefore, critical areas such as forests that provide ecosystem services for water filtration and erosion control were identified within the watersheds and actions for their protection or restoration were taken. Agro-forests fulfil similar functions and could help to restore ecosystem services if planted in critical areas. Also trees and shrubs along the margins of fields would reduce erosion and increase water filtration.
After implementing first measures for enhancing ecosystem services and reducing pollutants, the concentration of microorganisms (faecal coliform bacteria) decreased, indicating an improvement in water quality (Renner, personal communication).
Step 5: identify and assess policy options
During the consolidation phase (2006–2009) different policy options were assessed. The willingness to pay survey showed that 82 per cent of the interviewees were positive about paying a fee for improving water
quality (Nowack 2005). Based on this, a compensation mechanism through PES was agreed in a public hearing. City inhabitants pay roughly US$0.33 per household/month, amounting to approximately US$30,000 per year, and the collected funds go to a separate account of the EPS water company, which is supervised by the steering committee. It does not provide compensation to upstream farmers (service providers) in cash but in the form of technical and material support and environmental education, which helps farmers to change their management practices. Currently, a public investment project of the Regional Government of San Martin takes on part of the transaction costs of about US$800 per hectare related to the switch from slash and burn agriculture to agro-forestry systems.
Upstream farmers qualify for receiving compensation if they:
• reduce unsustainable forest use, refrain from intensive agricultural practices and introduce agro-forestry systems (e.g. shade-grown coffee);
• avoid water contamination by livestock and coffee wastewater;
• increase the margins around agricultural land for enhancing natural vegetation and the ecosystem services it provides in terms of water filtration and erosion control.
Currently the scheme is in its implementation phase, which includes the negotiation of formal contracts with the farmers (service providers) (MINAM 2010; León and Renner 2010). At the same time, measures to restore the watershed are already being undertaken.
Step 6: assess distributional impacts
Besides the benefits upstream farmers derive from the compensation, they feel socially more accepted. Instead of being the reason for the problem they become part of the solution. In addition, switching farming practices to shade-grown coffee also provides economic benefits. In general civil society is beginning to take part in decision-making processes, and local governance structures are being strengthened, which opens up opportunities for an equitable management of resources. As the process is still in its beginning, results in terms of regeneration of ecosystems and their services and the self-sufficiency of the compensation scheme will have to be assessed within the medium to long term. This local initiative was supported by the Ministry of Environment (MINAM) and the National Sanitation Services Superintendence (SUNASS). Commitment of key stakeholders, government authorities from all levels as well as the civil society, contributed considerably to the success.
Ecosystem services in regional planning in Sumatra, Indonesia (TEEB 2012, Box 6.5, p177 based on Barano et al. 2010)
In Sumatra, Indonesia, local communities rely on many ecosystem services: the provision of a clean, regular water supply for drinking, hydropower and irrigation is one of them, but the forests also protect communities from floods, droughts and landslides, while regulating air pollution and maintaining the fertility of the soil for agriculture. However, deforestation and land conversion is threatening biodiversity and affects many ecosystem services.
Step 1: specify and agree on the problem
In October 2008, the ten provincial governors of Sumatra and four Indonesian government ministers made a historic commitment to protect the remaining forests and critical ecosystems of Sumatra. Spatial planning is critical for achieving this commitment (Hudalah and Woltjer 2007).
Having developed national and several island-wide spatial plans in 2009, the Indonesian government began to design spatial plans at province and district levels as recently as 2010. District and provincial governments are integrating ecosystem services and biodiversity into spatial plans, through a Roadmap Action Plan, which sets out an ‘Ecosystem Vision’ for conserving Sumatran ecosystems. This roadmap was developed by a forum of NGOs known as Forum Tata Ruang Sumatera (ForTRUST) and several national government agencies, and promoted by the Ministry of Environment. Considerable decision-making power was transferred to the local level by decentralization.
Step 2: identify which ecosystem services are relevant
Forest conversion, mostly for palm oil, pulp and paper plantations and illegal logging, is causing losses of biodiversity and degrading many ecosystem services. The conversion of lowland deep peat forests – mostly in eastern Sumatra – is the most prominent example of such degradation and is considered as a major contributor to global carbon emissions. Existing and prospective forest concessions threaten to have even greater adverse impacts.
Step 3: define the information needs and select appropriate methods
The goal of district level planning is to determine high priority protection zones as well as zones where conversion to other uses can take place without heavily degrading ecosystem services. A tool developed by the Natural Capital Project for mapping and valuing ecosystem services, InVEST (Integrated Valuation of Ecosystem Services and Trade-offs – see Tallis et al. 2010), is being used to inform the Sumatra spatial plan. Its application is one of the actions specified in the Roadmap Action Plan to help integrate ecosystem services into land-use decisions.
60
TeeB for WaTer anD WeTlanDs
61
TeeB for WaTer anD WeTlanDs
Step 4: assess the changes in the flow of ecosystem services
Following a request by government decision-makers, InVEST is being applied by the World Wildlife Fund as part of the forum of NGOs who are assisting with land-use planning in Sumatra, known as Forum Tata Ruang Sumatera. The results were (ForTRUST). InVEST provides mapped information on where, and how much, ecosystem services are supplied, and how these patterns might change under future land-use scenarios. It can be overlaid with biodiversity information to see where ecosystem services and conservation priorities overlap. InVEST was used to model the quantity and location of high-quality habitat, carbon storage and sequestration, annual water yield, erosion control and water purification under two scenarios: the Sumatra ecosystem vision as proposed in the Roadmap Action Plan and a business-as-usual scenario corresponding to the government’s current spatial plan.
Step 5: identify and assess policy options
In June 2010, the results were disseminated and preliminary recommendations were offered to government representatives from 18 districts in central Sumatra. The results were based on the potential gains or losses in ecosystem services if the ecosystem vision (as outlined in the Roadmap Action Plan) was implemented. On the basis of InVEST’s results, recommendations were made on how to prioritise areas for forest restoration, where nearby habitat quality indicated the potential to create forest corridors for wildlife and where forests could help reduce erosion and sedimentation of water sources. Information on ecosystem services was also used to implement incentive mechanisms that reward sustainable land use and conservation, which the local government committed to establish. Projects for the Roadmap include forest carbon projects, payments for watershed services, certified forestry and agriculture, and ecotourism. InVEST resulted in informed discussions of forest carbon projects by identifying where carbon storage and sequestration potential is high.
Results were also relevant to the design of payments for watershed services, by identifying where the services of water yield and avoided erosion are provided, and where beneficiaries are located who could pay to ensure continued service delivery. For instance, a district that gains in sediment retention if a sustainable spatial plan is implemented, and has a town or dam downstream from the sediment retention area, could be a potential location for a payment for watershed services scheme to control erosion.
Step 6: assess distributional impacts
The potential for land-use change to create winners and losers was assessed at the relatively coarse scale of individual settlements and dams. The potential for new income sources was also identified: given the high levels of carbon emissions from conversion of
peatlands in Riau, this spatial plan has the potential to make a major contribution to the commitment by the Indonesian government to reduce greenhouse gas emissions by 26 per cent by 2020 (with respect to the 2005 level). It can also support the two-year moratorium on new permits to convert natural forests and peatlands, announced in May 2010. Building on partnerships between the Indonesian Government and the governments of Norway and Australia, forest carbon projects are being planned in central Sumatra, particularly in carbon-rich peat land areas. Local communities may thus access new sources of income from these emerging markets and payments.
Another option would be to identify in which areas local population depends most heavily on ecosystem services for their well-being and to take this information into account in the planning process. For example, when including the direct dependence of people on ecosystem services in the calculation of the gross domestic product (GDP) – the so-called ‘GDP of the poor’ – it was found that ecosystem services make up 75 per cent of the GDP of the 99 million rural poor people in Indonesia (ten Brink et al., 2011a).
Tracing the steps of the TEEB approach: building a conservation constituency by balancing costs and benefits in the Tubbataha reef national Park, Philippines (TEEB 2012, Box 7.14, p. 212)
The Tubbataha Reefs are one of the largest true coral formations in the Philippines, lying in the very centre of the Sulu Sea. In late 1980s, intensification of fishing and the use of destructive fishing methods seriously threatened the Tubbataha Reefs.
This example illustrates that the TEEB steps can be applied in an alternative order as well: here, an increasing awareness that certain ecosystem services were at risk (Step 2) led to a national decision for setting up a marine protected area (Step 5). Then, it became apparent that the problem could only be understood and tackled jointly with local stakeholders (Step 1), which came along with a definition of information needs (Step 3) and the identification of additional policy instruments (Step 5 refined). These were subsequently backed up by studies confirming the local benefits resulting from a no-take zone for fisheries (Steps 4 and 6).
Step 2: identify which ecosystem services are relevant
The Tubbataha reefs are the habitat for a multitude of species and genetic diversity, besides providing the Sulu Sea and eastern coastline of Palawan with fish and invertebrate larvae. Biologists hypothesised that the water current disperses these larvae and that a marine protected area would have important beneficial spill-over effects to surrounding fishing grounds (as shown, for example, by Alcala and Russ, 1990, 2006).
Furthermore the reefs are an appealing destination for diving tourism.
Step 5: implementation of policy options
In response to growing threats, the Tubbataha Reef National Marine Park (TRNMP) was declared in 1988 by means of a presidential decree. This transferred the area’s management authority from the Municipal Government of Cagayancillo to the national government through the Department of Environment and Natural Resources.
Step 1 and 3: specify and agree on the problem and identify information needs
In the following years, it became apparent that defining a new protected area was insufficient to solve the problem. Interests were divided between those pushing for a fishing ban within the park and those claiming their rights to extract resources in the park. Externally imposed park rules were not respected. Finally in 1999 a workshop was held involving all interest groups – preservationists as well as fishers. Fishers were not convinced of the benefits of a no-take zone. Information on this could not be provided in the short term. However, a willingness-to-pay study among tourists visiting the area opened up options for better balancing costs and benefits of conservation between the stakeholders in a way that all stakeholders were willing to accept the no-take policy, even without proofs of the medium-term benefits to fisheries.
Step 5: assess and identify policy option and Step 6: address distributional impacts
This method provided quick results and informed the user fee system for divers, which was introduced in 2000. It included a sharing scheme regulating the distribution of the collected entrance fees to also cover compensation payments to local fishermen for their lost access to the park. Fishermen agreed to respect the no-take zone. The direct benefits from entrance fees provided the incentive to change at a moment when future increases in catch due to spill-over from the no-take zone were still to be confirmed.
Step 4 and 6: assess impacts on ecosystem services and on distribution
Only several years after these measures were successfully implanted, the increase in the ecosystem services from this area could be assessed. Local monitoring of biophysical indicators showed that compared to other offshore reefs, Tubbataha has a higher fish biomass. Also, fish biomass in the nearby reef Jessie Beazly had doubled since 2000, which to a large extent can be attributed to its proximity to Tubbataha (Dygico, 2006). Reef health, fish biomass and densities have improved or have stabilised. Live coral cover stabilised at 40 per cent from 1999 to 2003 before reaching 50 per cent in 2004 (Sabater and Ledesma, 2004).
Perhaps most importantly, fish catches by fishermen near the marine protected areas increased from 10kg/day to 15-20kg/day for the period 1999-2004 (Todd and Nunez, 2004). Additional analysis by means of socio-economic indicators (lot and house ownership, quality of construction materials and household utilities, electricity access, toilet ownership) point to a considerable increase in living standards from 2000 to 2004 in Cagayancillo (Tongson and Cola, 2007).
After a decade of difficulties, the area was swiftly and successfully protected. The no-take policy favoured divers, dive operators and researchers. Fishers from the municipality of Cagayancillo, which traditionally depended on fishing, bore the cost by giving up their access rights, but the share in entrance fees and the increases in catch due to spill-over effects offset those costs. Critical for the success of this case was the well-facilitated involvement of all stakeholders, the identification of significant income potential from visitors, and a short term re-distribution of funds which could provide sufficient incentive for local fishermen to accept the no-take zone, so that the future benefits of this measure could become tangible.
Annex II: the evidence base on the values of wetlands
Introduction
This annex provides an overview of the research aiming to assess the monetary values of wetland ecosystem services across the globe. It is intended to support this report by providing evidence on the monetary values of wetlands and, by doing so, help to support better informed policy-making. Furthermore, this annex provides an analysis of what the future needs for valuation research are and where the priorities of forthcoming valuation studies should lie in order to build a stronger and more comprehensive knowledge-base on the values of wetland ecosystem services. The information provided in this annex extensively builds on the overview of the valuation literature provided in TEEB (2010) and associated TEEB database (Van der Ploeg and de Groot, 2010; Van der Ploeg et al., 2010). The database of values is likely to be regularly updated (see Ecosystem Service Partnership (http://www.es-partnership.org/esp).
Values of wetlands
The tables below present a summary of the values available in the literature across five identified types of wetlands, as summarised by TEEB (2010), appendix 3. As noted in TEEB (2010), and wider literature, there remains a range of gaps in the literature on the values of wetlands and therefore the existing data should be seen as indicative. Furthermore, it has to be acknowledged that valuation of ecosystem services has many limitations. Values by definition are instrumental, anthropocentric, individual-based, subjective, context dependent, marginal and state
62
TeeB for WaTer anD WeTlanDs
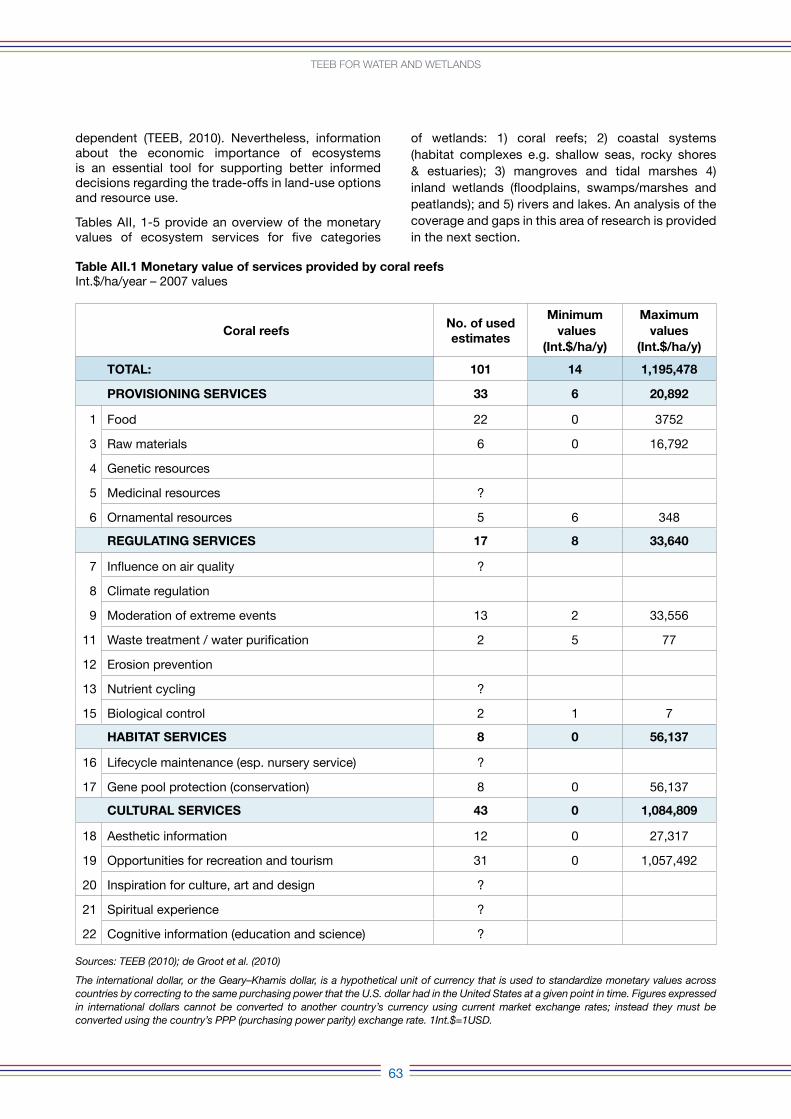
dependent (TEEB, 2010). Nevertheless, information about the economic importance of ecosystems is an essential tool for supporting better informed decisions regarding the trade-offs in land-use options and resource use.
Tables AII, 1-5 provide an overview of the monetary values of ecosystem services for five categories
of wetlands: 1) coral reefs; 2) coastal systems (habitat complexes e.g. shallow seas, rocky shores & estuaries); 3) mangroves and tidal marshes 4) inland wetlands (floodplains, swamps/marshes and peatlands); and 5) rivers and lakes. An analysis of the coverage and gaps in this area of research is provided in the next section.
63
TeeB for WaTer anD WeTlanDs
Table AII.1 Monetary value of services provided by coral reefs Int.$/ha/year – 2007 values
coral reefsno. of used estimates
Minimum values
(Int.$/ha/y)
Maximumvalues
(Int.$/ha/y)
ToTAL: 101 14 1,195,478
ProVISIonInG SErVIcES 33 6 20,892
1 Food 22 0 3752
3 Raw materials 6 0 16,792
4 Genetic resources
5 Medicinal resources ?
6 Ornamental resources 5 6 348
rEGuLATInG SErVIcES 17 8 33,640
7 Influence on air quality ?
8 Climate regulation
9 Moderation of extreme events 13 2 33,556
11 Waste treatment / water purification 2 5 77
12 Erosion prevention
13 Nutrient cycling ?
15 Biological control 2 1 7
HABITAT SErVIcES 8 0 56,137
16 Lifecycle maintenance (esp. nursery service) ?
17 Gene pool protection (conservation) 8 0 56,137
cuLTurAL SErVIcES 43 0 1,084,809
18 Aesthetic information 12 0 27,317
19 Opportunities for recreation and tourism 31 0 1,057,492
20 Inspiration for culture, art and design ?
21 Spiritual experience ?
22 Cognitive information (education and science) ?
Sources: TEEB (2010); de Groot et al. (2010)
The international dollar, or the Geary–Khamis dollar, is a hypothetical unit of currency that is used to standardize monetary values across countries by correcting to the same purchasing power that the U.S. dollar had in the United States at a given point in time. Figures expressed in international dollars cannot be converted to another country’s currency using current market exchange rates; instead they must be converted using the country’s PPP (purchasing power parity) exchange rate. 1Int.$=1USD.
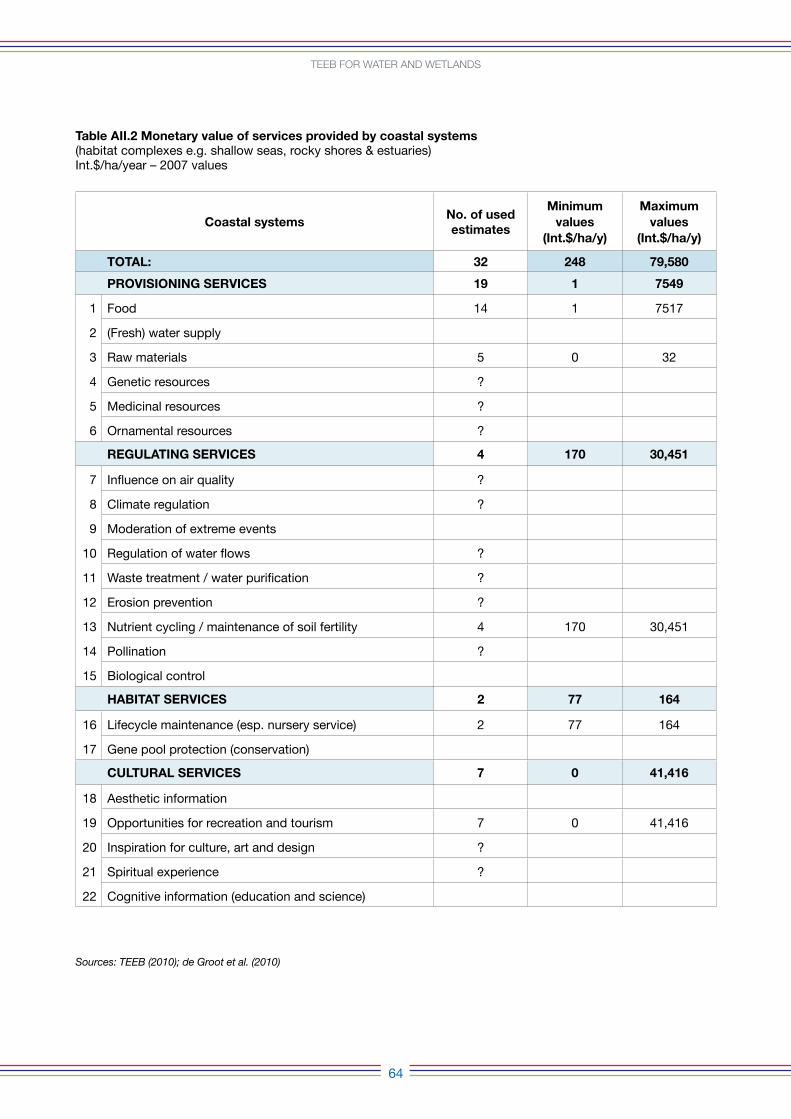
64
TeeB for WaTer anD WeTlanDs
Table AII.2 Monetary value of services provided by coastal systems (habitat complexes e.g. shallow seas, rocky shores & estuaries)Int.$/ha/year – 2007 values
Sources: TEEB (2010); de Groot et al. (2010)
coastal systems no. of used estimates
Minimumvalues
(Int.$/ha/y)
Maximumvalues
(Int.$/ha/y)
ToTAL: 32 248 79,580
ProVISIonInG SErVIcES 19 1 7549
1 Food 14 1 7517
2 (Fresh) water supply
3 Raw materials 5 0 32
4 Genetic resources ?
5 Medicinal resources ?
6 Ornamental resources ?
rEGuLATInG SErVIcES 4 170 30,451
7 Influence on air quality ?
8 Climate regulation ?
9 Moderation of extreme events
10 Regulation of water flows ?
11 Waste treatment / water purification ?
12 Erosion prevention ?
13 Nutrient cycling / maintenance of soil fertility 4 170 30,451
14 Pollination ?
15 Biological control
HABITAT SErVIcES 2 77 164
16 Lifecycle maintenance (esp. nursery service) 2 77 164
17 Gene pool protection (conservation)
cuLTurAL SErVIcES 7 0 41,416
18 Aesthetic information
19 Opportunities for recreation and tourism 7 0 41,416
20 Inspiration for culture, art and design ?
21 Spiritual experience ?
22 Cognitive information (education and science)
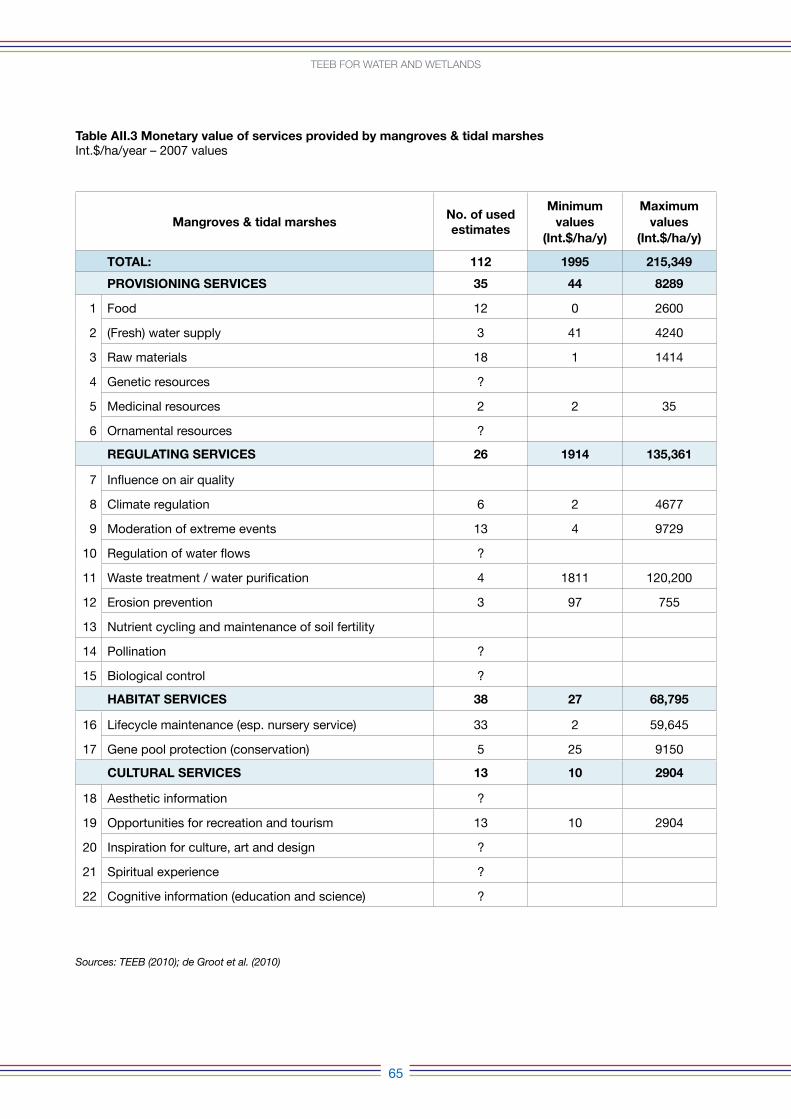
65
TeeB for WaTer anD WeTlanDs
Table AII.3 Monetary value of services provided by mangroves & tidal marshesInt.$/ha/year – 2007 values
Sources: TEEB (2010); de Groot et al. (2010)
Mangroves & tidal marshesno. of used estimates
Minimumvalues
(Int.$/ha/y)
Maximumvalues
(Int.$/ha/y)
ToTAL: 112 1995 215,349
ProVISIonInG SErVIcES 35 44 8289
1 Food 12 0 2600
2 (Fresh) water supply 3 41 4240
3 Raw materials 18 1 1414
4 Genetic resources ?
5 Medicinal resources 2 2 35
6 Ornamental resources ?
rEGuLATInG SErVIcES 26 1914 135,361
7 Influence on air quality
8 Climate regulation 6 2 4677
9 Moderation of extreme events 13 4 9729
10 Regulation of water flows ?
11 Waste treatment / water purification 4 1811 120,200
12 Erosion prevention 3 97 755
13 Nutrient cycling and maintenance of soil fertility
14 Pollination ?
15 Biological control ?
HABITAT SErVIcES 38 27 68,795
16 Lifecycle maintenance (esp. nursery service) 33 2 59,645
17 Gene pool protection (conservation) 5 25 9150
cuLTurAL SErVIcES 13 10 2904
18 Aesthetic information ?
19 Opportunities for recreation and tourism 13 10 2904
20 Inspiration for culture, art and design ?
21 Spiritual experience ?
22 Cognitive information (education and science) ?
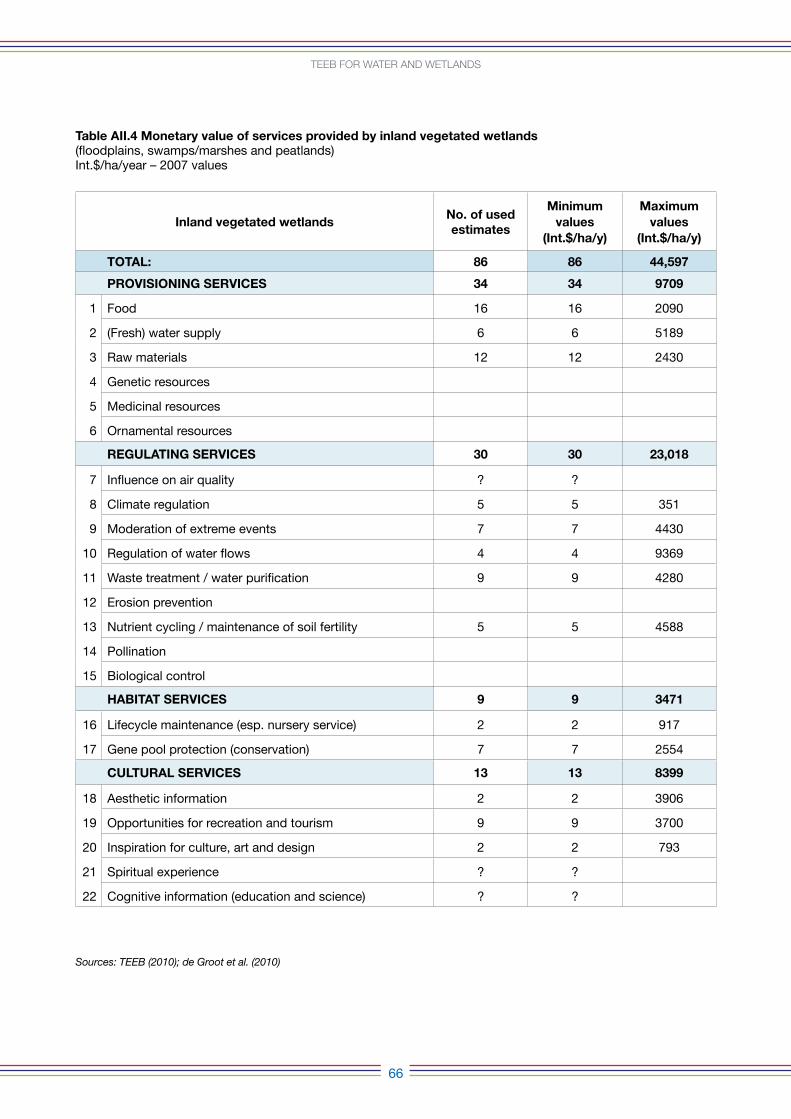
66
TeeB for WaTer anD WeTlanDs
Table AII.4 Monetary value of services provided by inland vegetated wetlands (floodplains, swamps/marshes and peatlands)Int.$/ha/year – 2007 values
Sources: TEEB (2010); de Groot et al. (2010)
Inland vegetated wetlands no. of used estimates
Minimumvalues
(Int.$/ha/y)
Maximumvalues
(Int.$/ha/y)
ToTAL: 86 86 44,597
ProVISIonInG SErVIcES 34 34 9709
1 Food 16 16 2090
2 (Fresh) water supply 6 6 5189
3 Raw materials 12 12 2430
4 Genetic resources
5 Medicinal resources
6 Ornamental resources
rEGuLATInG SErVIcES 30 30 23,018
7 Influence on air quality ? ?
8 Climate regulation 5 5 351
9 Moderation of extreme events 7 7 4430
10 Regulation of water flows 4 4 9369
11 Waste treatment / water purification 9 9 4280
12 Erosion prevention
13 Nutrient cycling / maintenance of soil fertility 5 5 4588
14 Pollination
15 Biological control
HABITAT SErVIcES 9 9 3471
16 Lifecycle maintenance (esp. nursery service) 2 2 917
17 Gene pool protection (conservation) 7 7 2554
cuLTurAL SErVIcES 13 13 8399
18 Aesthetic information 2 2 3906
19 Opportunities for recreation and tourism 9 9 3700
20 Inspiration for culture, art and design 2 2 793
21 Spiritual experience ? ?
22 Cognitive information (education and science) ? ?
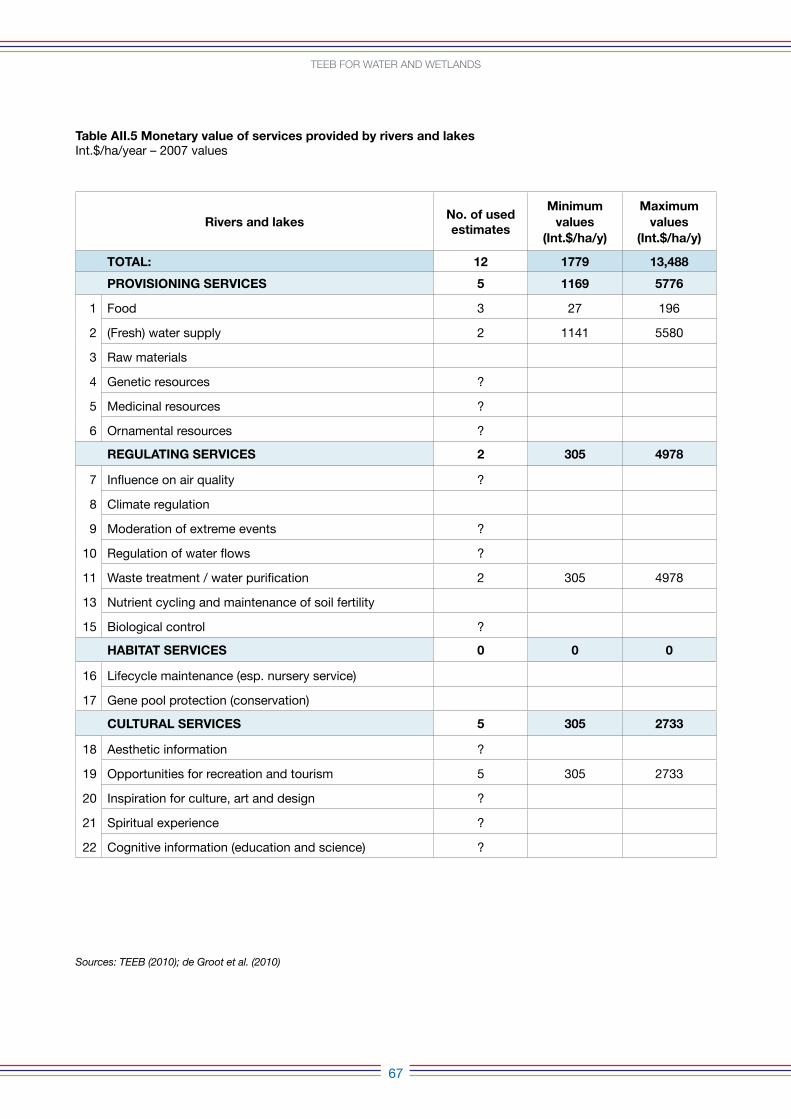
67
TeeB for WaTer anD WeTlanDs
Table AII.5 Monetary value of services provided by rivers and lakes Int.$/ha/year – 2007 values
Sources: TEEB (2010); de Groot et al. (2010)
rivers and lakesno. of used estimates
Minimumvalues
(Int.$/ha/y)
Maximumvalues
(Int.$/ha/y)
ToTAL: 12 1779 13,488
ProVISIonInG SErVIcES 5 1169 5776
1 Food 3 27 196
2 (Fresh) water supply 2 1141 5580
3 Raw materials
4 Genetic resources ?
5 Medicinal resources ?
6 Ornamental resources ?
rEGuLATInG SErVIcES 2 305 4978
7 Influence on air quality ?
8 Climate regulation
9 Moderation of extreme events ?
10 Regulation of water flows ?
11 Waste treatment / water purification 2 305 4978
13 Nutrient cycling and maintenance of soil fertility
15 Biological control ?
HABITAT SErVIcES 0 0 0
16 Lifecycle maintenance (esp. nursery service)
17 Gene pool protection (conservation)
cuLTurAL SErVIcES 5 305 2733
18 Aesthetic information ?
19 Opportunities for recreation and tourism 5 305 2733
20 Inspiration for culture, art and design ?
21 Spiritual experience ?
22 Cognitive information (education and science) ?
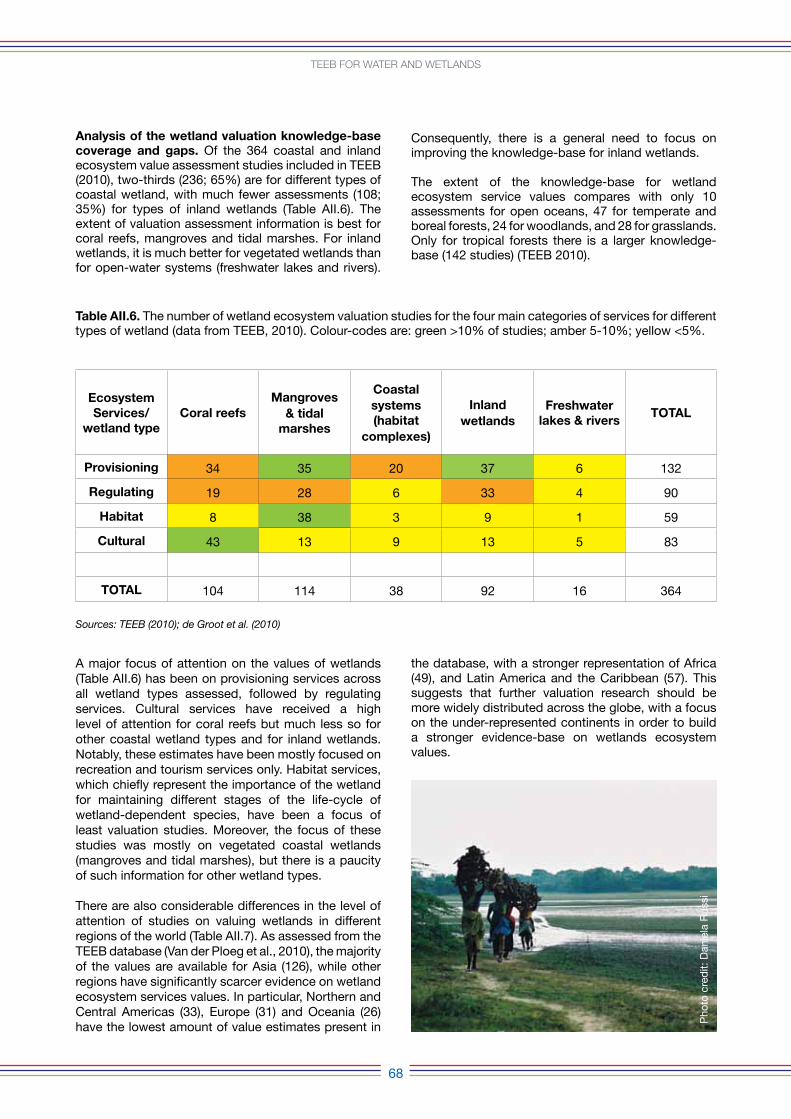
68
TeeB for WaTer anD WeTlanDs
Table AII.6. The number of wetland ecosystem valuation studies for the four main categories of services for different types of wetland (data from TEEB, 2010). Colour-codes are: green >10% of studies; amber 5-10%; yellow <5%.
Sources: TEEB (2010); de Groot et al. (2010)
Ecosystem Services/
wetland typecoral reefs
Mangroves & tidal
marshes
coastalsystems (habitat
complexes)
Inlandwetlands
Freshwater lakes & rivers
ToTAL
Provisioning 34 35 20 37 6 132
regulating 19 28 6 33 4 90
Habitat 8 38 3 9 1 59
cultural 43 13 9 13 5 83
ToTAL 104 114 38 92 16 364
Analysis of the wetland valuation knowledge-base coverage and gaps. Of the 364 coastal and inland ecosystem value assessment studies included in TEEB (2010), two-thirds (236; 65%) are for different types of coastal wetland, with much fewer assessments (108; 35%) for types of inland wetlands (Table AII.6). The extent of valuation assessment information is best for coral reefs, mangroves and tidal marshes. For inland wetlands, it is much better for vegetated wetlands than for open-water systems (freshwater lakes and rivers).
Consequently, there is a general need to focus on improving the knowledge-base for inland wetlands.
The extent of the knowledge-base for wetland ecosystem service values compares with only 10 assessments for open oceans, 47 for temperate and boreal forests, 24 for woodlands, and 28 for grasslands. Only for tropical forests there is a larger knowledge-base (142 studies) (TEEB 2010).
A major focus of attention on the values of wetlands (Table AII.6) has been on provisioning services across all wetland types assessed, followed by regulating services. Cultural services have received a high level of attention for coral reefs but much less so for other coastal wetland types and for inland wetlands. Notably, these estimates have been mostly focused on recreation and tourism services only. Habitat services, which chiefly represent the importance of the wetland for maintaining different stages of the life-cycle of wetland-dependent species, have been a focus of least valuation studies. Moreover, the focus of these studies was mostly on vegetated coastal wetlands (mangroves and tidal marshes), but there is a paucity of such information for other wetland types.
There are also considerable differences in the level of attention of studies on valuing wetlands in different regions of the world (Table AII.7). As assessed from the TEEB database (Van der Ploeg et al., 2010), the majority of the values are available for Asia (126), while other regions have significantly scarcer evidence on wetland ecosystem services values. In particular, Northern and Central Americas (33), Europe (31) and Oceania (26) have the lowest amount of value estimates present in
the database, with a stronger representation of Africa (49), and Latin America and the Caribbean (57). This suggests that further valuation research should be more widely distributed across the globe, with a focus on the under-represented continents in order to build a stronger evidence-base on wetlands ecosystem values.
Pho
to c
red
it: D
anie
la R
ussi
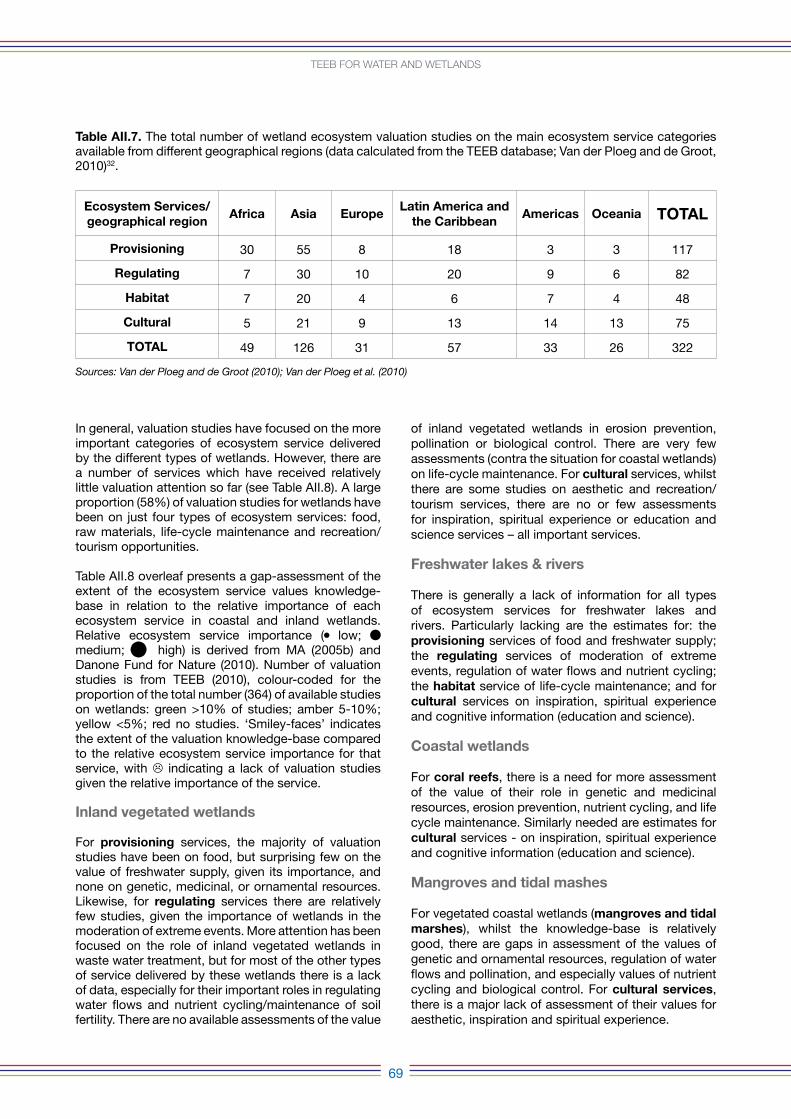
69
TeeB for WaTer anD WeTlanDs
Sources: Van der Ploeg and de Groot (2010); Van der Ploeg et al. (2010)
In general, valuation studies have focused on the more important categories of ecosystem service delivered by the different types of wetlands. However, there are a number of services which have received relatively little valuation attention so far (see Table AII.8). A large proportion (58%) of valuation studies for wetlands have been on just four types of ecosystem services: food, raw materials, life-cycle maintenance and recreation/tourism opportunities.
Table AII.8 overleaf presents a gap-assessment of the extent of the ecosystem service values knowledge-base in relation to the relative importance of each ecosystem service in coastal and inland wetlands. Relative ecosystem service importance ( low; medium; high) is derived from MA (2005b) and Danone Fund for Nature (2010). Number of valuation studies is from TEEB (2010), colour-coded for the proportion of the total number (364) of available studies on wetlands: green >10% of studies; amber 5-10%; yellow <5%; red no studies. ‘Smiley-faces’ indicates the extent of the valuation knowledge-base compared to the relative ecosystem service importance for that service, with indicating a lack of valuation studies given the relative importance of the service.
Inland vegetated wetlands
For provisioning services, the majority of valuation studies have been on food, but surprising few on the value of freshwater supply, given its importance, and none on genetic, medicinal, or ornamental resources. Likewise, for regulating services there are relatively few studies, given the importance of wetlands in the moderation of extreme events. More attention has been focused on the role of inland vegetated wetlands in waste water treatment, but for most of the other types of service delivered by these wetlands there is a lack of data, especially for their important roles in regulating water flows and nutrient cycling/maintenance of soil fertility. There are no available assessments of the value
of inland vegetated wetlands in erosion prevention, pollination or biological control. There are very few assessments (contra the situation for coastal wetlands) on life-cycle maintenance. For cultural services, whilst there are some studies on aesthetic and recreation/tourism services, there are no or few assessments for inspiration, spiritual experience or education and science services – all important services.
Freshwater lakes & rivers
There is generally a lack of information for all types of ecosystem services for freshwater lakes and rivers. Particularly lacking are the estimates for: the provisioning services of food and freshwater supply; the regulating services of moderation of extreme events, regulation of water flows and nutrient cycling; the habitat service of life-cycle maintenance; and for cultural services on inspiration, spiritual experience and cognitive information (education and science).
coastal wetlands
For coral reefs, there is a need for more assessment of the value of their role in genetic and medicinal resources, erosion prevention, nutrient cycling, and life cycle maintenance. Similarly needed are estimates for cultural services - on inspiration, spiritual experience and cognitive information (education and science).
Mangroves and tidal mashes
For vegetated coastal wetlands (mangroves and tidal marshes), whilst the knowledge-base is relatively good, there are gaps in assessment of the values of genetic and ornamental resources, regulation of water flows and pollination, and especially values of nutrient cycling and biological control. For cultural services, there is a major lack of assessment of their values for aesthetic, inspiration and spiritual experience.
Table AII.7. The total number of wetland ecosystem valuation studies on the main ecosystem service categories available from different geographical regions (data calculated from the TEEB database; Van der Ploeg and de Groot, 2010)32.
Ecosystem Services/geographical region
Africa Asia EuropeLatin America and
the caribbeanAmericas oceania ToTAL
Provisioning 30 55 8 18 3 3 117
regulating 7 30 10 20 9 6 82
Habitat 7 20 4 6 7 4 48
cultural 5 21 9 13 14 13 75
ToTAL 49 126 31 57 33 26 322
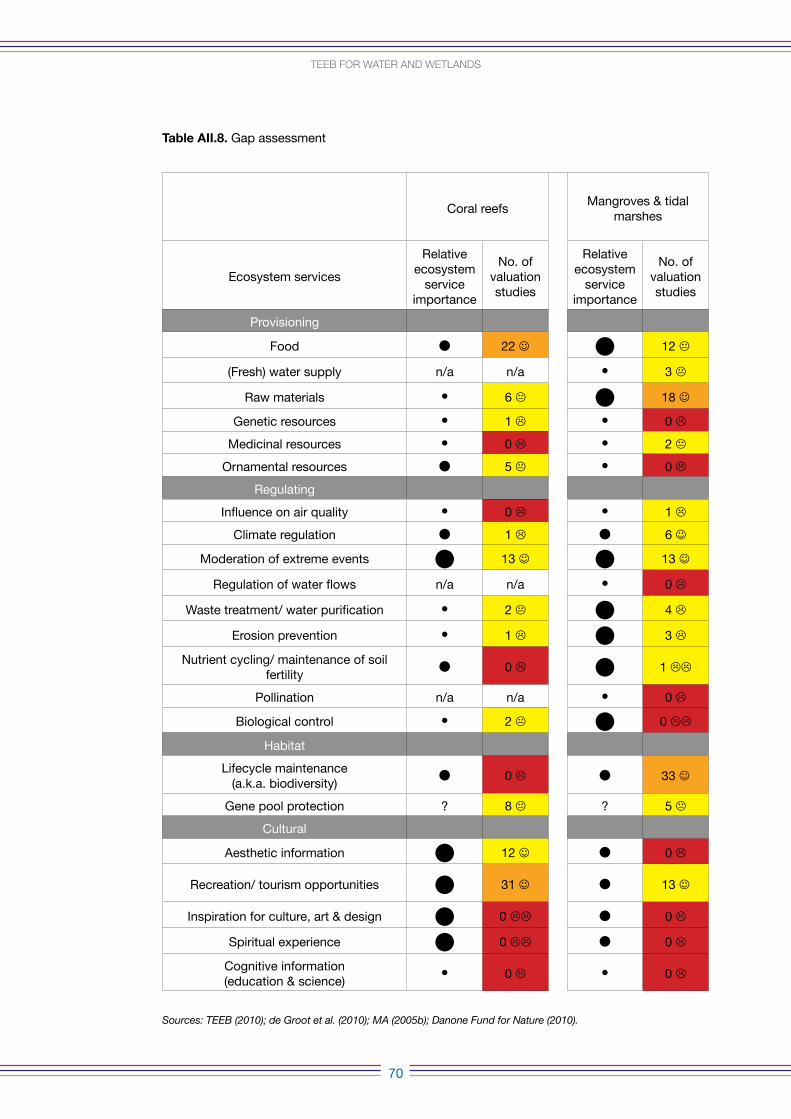
70
TeeB for WaTer anD WeTlanDs
Coral reefsMangroves & tidal
marshes
Coastal systems (habitat complexes e.g. shallow seas,
rocky shores & estuaries)
Inland vegetated wetlands (floodplains, swamps/marshes and
peatlands)
Freshwater lakes & rivers
Ecosystem services
Relative ecosystem
service importance
No. of valuation studies
Relative ecosystem
service importance
No. of valuation studies
Relative ecosystem
service importance
No. of valuation studies
Relative ecosystem
service importance
No. of valuation studies
Relative ecosystem
service importance
No. of valuation studies
TOTAL
Provisioning
Food 22 J 12 K 14 J 16 J 3 67
(Fresh) water supply n/a n/a 3 K 1 6 2 12
Raw materials 6 K 18 J 5 K 12 J 1 42
Genetic resources 1 0 0 1 0 2
Medicinal resources 0 2 K 0 1 0 3
Ornamental resources 5 K 0 0 1 0 6
Regulating
Influence on air quality 0 1 0 0 0 1
Climate regulation 1 6 J 0 5 K 1 13
Moderation of extreme events 13 J 13 J 1 7 0 34
Regulation of water flows n/a n/a 0 0 4 0 4
Waste treatment/ water purification 2 K 4 0 9 K 2 17
Erosion prevention 1 3 0 1 0 5
Nutrient cycling/ maintenance of soil fertility
0 1 4 K 5 1 11
Pollination n/a n/a 0 0 1 0 1
Biological control 2 K 0 1 1 0 4
Habitat
Lifecycle maintenance (a.k.a. biodiversity)
0 33 J 2 2 0 37
Gene pool protection ? 8 K ? 5 K ? 1 ? 7 K ? 1 22
Cultural
Aesthetic information 12 J 0 1 2 K 0 15
Recreation/ tourism opportunities 31 J 13 J 7 K 9 J 5 65
Inspiration for culture, art & design 0 0 0 2 0 2
Spiritual experience 0 0 0 0 0 0
Cognitive information (education & science)
0 0 1 0 0 1
Sources: TEEB (2010); de Groot et al. (2010); MA (2005b); Danone Fund for Nature (2010).
Table AII.8. Gap assessment
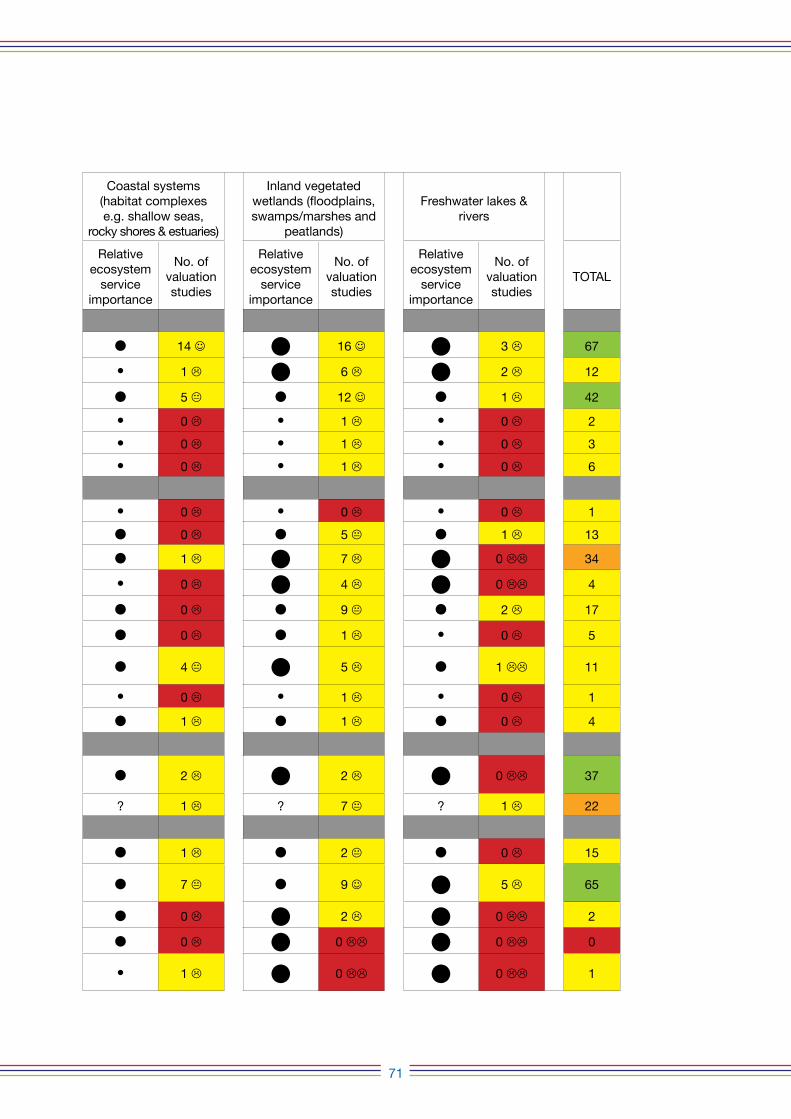
71
Coral reefsMangroves & tidal
marshes
Coastal systems (habitat complexes e.g. shallow seas,
rocky shores & estuaries)
Inland vegetated wetlands (floodplains, swamps/marshes and
peatlands)
Freshwater lakes & rivers
Ecosystem services
Relative ecosystem
service importance
No. of valuation studies
Relative ecosystem
service importance
No. of valuation studies
Relative ecosystem
service importance
No. of valuation studies
Relative ecosystem
service importance
No. of valuation studies
Relative ecosystem
service importance
No. of valuation studies
TOTAL
Provisioning
Food 22 J 12 K 14 J 16 J 3 67
(Fresh) water supply n/a n/a 3 K 1 6 2 12
Raw materials 6 K 18 J 5 K 12 J 1 42
Genetic resources 1 0 0 1 0 2
Medicinal resources 0 2 K 0 1 0 3
Ornamental resources 5 K 0 0 1 0 6
Regulating
Influence on air quality 0 1 0 0 0 1
Climate regulation 1 6 J 0 5 K 1 13
Moderation of extreme events 13 J 13 J 1 7 0 34
Regulation of water flows n/a n/a 0 0 4 0 4
Waste treatment/ water purification 2 K 4 0 9 K 2 17
Erosion prevention 1 3 0 1 0 5
Nutrient cycling/ maintenance of soil fertility
0 1 4 K 5 1 11
Pollination n/a n/a 0 0 1 0 1
Biological control 2 K 0 1 1 0 4
Habitat
Lifecycle maintenance (a.k.a. biodiversity)
0 33 J 2 2 0 37
Gene pool protection ? 8 K ? 5 K ? 1 ? 7 K ? 1 22
Cultural
Aesthetic information 12 J 0 1 2 K 0 15
Recreation/ tourism opportunities 31 J 13 J 7 K 9 J 5 65
Inspiration for culture, art & design 0 0 0 2 0 2
Spiritual experience 0 0 0 0 0 0
Cognitive information (education & science)
0 0 1 0 0 1
rEFErEncESAburto-Oropeza, O., Ezcurra E., Danemann G., Valdez V., Murray J., Sala E. (2008). Mangroves in the Gulf of California increase fishery yields. Proceedings of the
National Academy of Sciences, 105: 10456–10459.Acreman, M.C. (2012). Wetlands and water storage: current and future trends and issues. Ramsar Scientific and Technical Briefing Note No. 2. Ramsar Convention
Secretariat, Gland, Switzerland. 12pp.Alcala, A. C. and Russ, G. R. (1990). A direct test of the effects of protective management on abundance and yield of tropical marine resources’, J. Cons. int. Explor.
Mer, ICES Journal of Marine Science, 47(1):40–47.Alcala, A. C. and Russ, G. R. (2006). No-take marine reserves and reef fisheries management in the Philippines: A new people power revolution, Ambio, 35 (5): 245–254.Alexander, S., McInnes, R. (2012). The benefits of wetland restoration. Ramsar Scientific and Technical Briefing Note No. 4. Ramsar Convention Secretariat, Gland,
Switzerland. 20pp.Almack K. (2010). River restoration to avoid flood damage, USA, http://www.eea.europa.eu/atlas/teeb/river-restoration-to-avoid-flood-1.Anderson, P and Ross, S (2011). United Utilities Sustainable Catchment Management Programme. Volume 1. Executive Report.Anderson, R. C. and H. Ahmed (1993). The Shark Fisheries of the Maldives. Ministry of Fisheries and Agriculture, Republic of Maldives, and Food and Agriculture
Organization of the United Nations (FAO). 77p. http://thimaaveshi.files.wordpress.com/2009/09/the-shark-fisheries-in-the-maldives.pdf.Arcadis, InterSus, Fresh Thoughts Consulting, Ecologic, Typsa (2012). The role of water pricing and water allocation in agriculture in delivering sustainable water use in
Europe, http://ec.europa.eu/environment/water/quantity/pdf/agriculture_report.pdf.Acharya, G. and Barbier, E.B. (2000). Valuing groundwater recharge through agricultural production in the Hadejia-Jama’are Wetlands in Northern Nigeria. Agricultural
Economics, 22, 247–259.Arias, V., Benitez S. and Goldman R. (2010). TEEBcase: Water fund for catchment management, Ecuador, available at: TEEBweb.org.Badola, R. and Hussain, S.A. (2005). Valuing ecosystems functions: an empirical study on the storm protection function of Bhitarkanika mangrove ecosystem, India.
Environmental Conservation, 32: 85–92.Balmford, A., Rodrigues, A. S. L., Walpole, M., ten Brink, P., Kettunen, M., Braat, L. and de Groot, R. (2008). The Economics of Biodiversity and Ecosystems: Scoping
the Science, European Commission (Contract: ENV/070307/2007/486089/ETU/B2), Cambridge, http://ec.europa.eu/environment/nature/biodiversity/economics/pdf/scoping_science_report.pdf.
Barano, T., Bhagabati N., Conte M., Ennaanay D., Hadian O., McKenzie E., Olwero N., Tallis H., Wolny S., Ng G. (2010). Integrating Ecosystem Services into Spatial Planning in Sumatra, Indonesia. TEEBcase see TEEBweb.org.
Barbier, E. B. (2007). Valuing ecosystem services as productive inputs. Economic Policy 22 (49):177–229.Barbier E. B. (2011). Wetlands as natural assets, Hydrological Sciences Journal, 56 (8): 1360-1373.Barchiesi S., Cartin M., Welling R., Yawson D. (2011) Komadugu Yobe Basin, Upstream of Lake Chad, Nigeria. IUCN Water Programme – Demonstration case study
no. 1. http://data.iucn.org/dbtw-wpd/edocs/2011-097.pdf.Bayas L. J.C., Marohn C., Dercon G., Dewi S., Piepho H.P., Joshi L., van Noordwijk M. and Cadisch G. (2011). Influence of coastal vegetation on the 2004 tsunami wave
impact Aceh.Proceedings of the National Academy of Sciences 108:18612-18617.Bayon, R. (2004). Making Environmental Markets Work: Lessons from Early Experience with Sulphur, Carbon, Wetlands, and Other Related Markets, Forest Trend,
Washington, DC.Beck, M.W., Brumbaugh, R.D., Airoldi, L., Carranza, A., Coen, L.D., Crawford, C., Defeo, O., Edgar, G.J., Hancock, B., Kay, M.C., Lenihan, H.S., Luckenbach, M.W.,
Toropova, C.L., Zhang, G., Guo, X. (2011). Oyster reefs at risk and recommendations for conservation, restoration and management. Bioscience 61: 107-116.Bernier, J.C., Morton, R.A., Barras, J.A. (2006). Constraining rates and trends of historical wetland loss, Mississippi River Delta Plain, South-Central Louisiana. In: Y.J.
Xu & V.P. Singh (eds.), Coastal Environment and Water Quality. Water Resources Publications, Highlands Ranch, USA. pp371-382.Birol, E. and Cox, V. (2007). Using choice experiments to design wetland management programmes: the case of the Severn Estuary Wetland, UK. Journal of
Environmental Planning and Management, 50 (3): 363–380.Birol, E., Karousakis, K. and Koundouri, P. (2006). Using a choice experiment to account for preference heterogeneity in wetland attributes: the case of Cheimaditida
wetland in Greece. Ecological Economics, 60: 145–156.Brouwer, R. and Bateman, I.J. (2005). Temporal stability and transferability of models of willingness to pay for flood control and wetland conservation. Water Resources
Research, 41, 1–6.Brouwer, R. and van Elk, R. (2004). Integrated ecological, economics and social impact assessment of alternative flood control policies in the Netherlands. Ecological
Economics, 50: 1–21.BP (British Petroleum) (2010). BP sets out Gulf of Mexico costs, further asset sales and strong operating performance, www.bp.com/extendedgenericarticle.do?cate
goryId=2012968&contentId=7063921.BPL (Butcher Partners Limited) (2006). Evaluation Study of the Economic Benefits of Water in Te Papanui Conservation Park (Prepared for the New Zealand Department
of Conservation of New Zealand), www.doc.govt.nz/upload/documents/conservation/threats-and-impacts/benefits-of-conservation/economic-benefits-te-papanui.pdf.
Braat, L. and ten Brink, P. (eds) with Bakkes, J., Bolt, K., Braeuer, I., ten Brink, B., Chiabai, A., Ding, H., Gerdes, H., Jeuken, M., Kettunen, M., Kirchholtes, U., Klok, C., Markandya, A., Nunes, P., van Oorschot, M., Peralta-Bezerra, N., Rayment, M., Travisi, C. and Walpole, M. (2008). The Cost of Policy Inaction (COPI): The Case of Not Meeting the 2010 Biodiversity Target, European Commission, Brussels.
Brander, L.M., Brauer, I., Gerdes, H., Ghermandi, A., Kuik, O., Markandya, A., Navrud, S., Nunes, P.A.L.D., Schaafsma, M., Vos, H. and Wagtendonk, A. (2011). Using meta-analysis and GIS for value transfer and scaling up: Valuing climate change induced losses of European wetlands. Environmental and Resource Economics. DOI: 10.1007/s10640-011-9535-1.
Brander, L.M., Florax, J.G.M. & Vermaat, J.E. (2006). The empirics of wetland valuation: A comprehensive summary and meta-analysis of the literature. Environmental and Resource Economics, 33(2): 223-250.
Broekx S., Smets S., Liekens I., Bulckaen D. and De Nocker L. (2011). Designing a long-term flood risk management plan for the Scheldt estuary using a risk-based approach’, Natural Hazards, 57 (2): 245-266.
Brunotte, E., Dister, E., Günther-Diringer, D., Koenzen, U. & D. Mehl (2009): Flussauen in Deutschland. Erfassung und Bewertung des Auenzustandes. Naturschutz und Biologische Vielfalt. 87. 141S. plus Anhang. Bonn - Bad Godesberg.
Butchart, S.H.M., et al. (2010). Global Biodiversity: Indicators of Recent Declines. Science 328: 1164-1168. DOI: 10.1126/science.1187512.Byström, O. (2000). The replacement value of wetlands in Sweden. Environmental and Resource Economics, 16, 347–362.Calatrava and Garrido (2010). Measuring Irrigation Subsidies in Spain: An application of the GSI Method for quantifying subsidies. http://www.iisd.org/gsi/sites/default/
files/irrig_spain.pdf.Calvache, A., S. Benítez y A. Ramos (2012). Fondos de Agua: Conservando la Infraestructura Verde. Guía de Diseño, Creación y Operación. Alianza Latinoamericana
de Fondos de Agua. The Nature Conservancy, Fundación FEMSA y Banco Interamericano de Desarrollo. Bogotá, Colombia. 144p.Carlsson, F., Frykblom, P. and Lilijenstolpe, C. (2003). Valuing wetland attributes: an application of choice experiments. Ecological Economics, 47: 95–103.Carpenter, S.J., Stanley, E.H., Vander Zanden, M.J. (2011). State of the World’s Freshwater Ecosystems: Physical, Chemical, and Biological Changes. Annu. Rev.
Environ. Resour. 36: 75–99.Catsadorakis, G. and K. Paragamian (2007). Inventory of the Aegean Islands’ wetlands. Identity, ecological status and threats. World Wide Fund for Nature-WWF
Greece. ISBN: 978-960-85918-4-4, 392pp.Cesar H., Burke L., Pet-Soede L. (2003). The economics of worldwide coral reef degradation. Report for WWF and ICRAN, http://pdf.wri.org/cesardegradationreport100203.
pdf.Clements T., John A., Nielsen K., Dara A., Setha T., Milner-Gulland E.J., (2010). Payments for biodiversity conservation in the context of weak institutions: Comparison
of three programs from Cambodia. Ecological Economics 69 (6): 1283–1291.Coleman, J.M., Huh, O.K., Braud, D. (2008). Wetland loss in world deltas. Journal of Coastal Research 24, 1-14.Conley D.J., Carstensen J., Aigars J., Axe P., Bonsdorff E., Eremina T., Haahti B.M., Humborg C., Jonsson P., Kotta J., Lännegren C., Larsson U., Maximov A.,
Rodriguez Medina M., Lysiak-Pastuszak E., Remeikaitė-Nikienė N., Walve J., Wilhelms S., Zillén L. (2011). Hypoxia is increasing in the coastal zone of the Baltic Sea. Environmental Science & Technology 45, 6777-6783.
Connor J.D., Ward J., Clifton C., Proctor W., MacDonald D.H. (2008). Designing, testing and implementing a trial dryland salinity credit trade scheme. Ecological Economics, 67 (4): 574-588.
Conservation International (2012). Chingaza-Sumapaz- Páramo de guerrero conservatio corridor. Colombia. http://www.conservation.org/Documents/field_demonstrations/CI_Field_Demonstration_Colombia_English.pdf.
Constanza R., Perez-Maqueo O., Martinez M.L., Sutton P., Anderson S.J., Mulder K. (2008). The value of coastal wetlands for hurricane protection. Ambio 37: 241-248.Cooper E., Burke L. and Bood N. (2008). Coastal Capital: Belize. The Economic Contribution of Belize’s Coral Reefs and Mangroves, World Resources Institute,
Washington, DC, http://pdf.wri.org/working_papers/coastal_capital_belize_wp.pdf.
72
TeeB for WaTer anD WeTlanDs
Crooks S., Herr D., Tamelander J., Laffoley D., and Vandever J. (2011). Mitigating Climate Change through Restoration and Management of Coastal Wetlands and Near-shore Marine Ecosystems: Challenges and Opportunities” Environment Department Paper 121, World Bank, Washington, DC.http://data.iucn.org/dbtw-wpd/edocs/2011-009.pdf.
Dahl T.E. (1990). Wetland losses in the United States 1780’s to 1980’s. U.S. Department of the Interior, Fish and Wildlife Service. Washington, D.C. 13pp.Dahl T.E. (2006). Status and trends of wetlands in the coterminous United States 1998 to 2004. U.S. U.S. Department of the Interior, Fish and Wildlife Service.
Washington, D.C. 112pp.Dahl T.E., Johnson C.E. (1991). Status and trends of wetlands in the conterminous United States, mid-1970s to mid-1980s. U.S. Department of the Interior, Fish and
Wildlife Service, Washington, D.C.Danone Fund for Nature. (2010). Achieving Carbon Offsets through Mangroves and Other Wetlands. November 2009 Expert Workshop Meeting Report, ed. Nick
Davidson. Danone Group/IUCN/Ramsar Convention Secretariat, Gland, Switzerland. 87pp.Davidson N.C., Laffoley D.d’A., Doody J.P., Way L.S., Gordon J., Key R., Drake C.M., Pienkowski M.W., Mitchell R.M., Duff K.L. (1991). Nature conservation and
estuaries in Great Britain. Nature Conservancy Council, Peterborough, UK. 422pp.Das S. and Vincent J.R. (2009). Mangroves protected villages and reduced death toll during Indian super cyclone. Proceedings of the National Academy of Sciences,
106, 7357–7360.Day J.W., Boesch D.F., Clairain E.J., Kemp G.P., Laska S.B., Mitsch W.J., Orth K., Mashriqui H., Reed D.R., Shabman L., Simenstad C.A., Streever B.J., Twilley R.R.,
Watson C.C., Wells J.T., Whigham D.F.(2007). Restoration of the Mississippi Delta: lessons from hurricanes Katrina and Rita. Science 315:1679-1684.de Groot R., Kumar P., van der Ploeg S. (2010). Estimates of Monetary Values of Ecosystem Services. Appendix III in TEEB (2010).de Groot R., Brander L., van der Ploeg S., Costanza R., Bernard F., Braat L., Christi, M., Crossman N., Ghermandi A., Hein L., Hussain,S., Kumar P., McVittie A., Portela
R., Rodriguez L.C., ten Brink P., van Beukering P., (2012). Global estimates of the value of ecosystems and their services in monetary units. Ecosystem Services 1, 50–61.
de Groot R., Stuip M., Finlayson M. and Davidson N. (2006) Valuing Wetlands: Guidance for Valuing the Benefits Derived from Wetland Ecosystem Services, Ramsar Technical Report No 3, CBD Technical Series No 27, www.cbd.int/doc/publications/cbd-ts-27.pdf.
De Nocker L., Broekx S. and Liekens I. (2004). Maatschappelijke kosten-batenanalyse voor de actualisatie van het Sigmaplan, Conclusies op hoofdlijnen, Tussentijds rapport in opdracht van Ministerie van de Vlaamse Gemeenschap, LIN AWZ, Afdeling Zeeschelde, door Vito i.s.m. Tijdelijke Vereniging RA-IMDC, Vito, September, available from www.sigmaplan.be.
Dearing J.A., Yang X., Dong X., Zhang E., Chen X., Langdon P.G., Zhang K., Zhang W., Dawson T.P. (2012). Extending the timescale and range of ecosystem services through paleoenvironmental analyses, exemplified in the lower Yangtse basin. Proceeding of the National Academy of Sciences, E1111-E1120. Doi: 10.1073/pnas.1118263109.
Do T.N. and Bennett J. (2008). Estimating wetland biodiversity values: a choice modelling application in Vietnam’s Mekong River Delta. Environment and Development Economics, 14: 163–186.
Duarte C.M., Middelburg J.J., Caraco N. (2005). Major Role of Marine Vegetation on the Oceanic Carbon Cycle. Biogeosciences 2:1–8.Dygico M. (2006). Tubbataha reefs: A marine protected area that works, WWF-Philippines, Quezon City, Philippines.Echavarria M. (2002). Financing watershed conservation: The FONAG water fund in Quito, Ecuador. in Pagiola, S., Bishop, J., Landell-Mills, N. (eds). Selling forest
environmental services: Market-based mechanisms for conservation and development. EarthScan, London and Sterling. pp. 91-102.EEA (2010). EU 2010 biodiversity baseline. EEA Technical Report No. 12/2010. European Environment Agency, Copenhagen. 121pp.EEA (2011). An experimental framework for ecosystem capital accounting in Europe, EEA technical report No.13/2011, http://www.eea.europa.eu/publications/an-
experimentalframework-for-ecosystem.Emerton L. and Kekulandala L.D.C.B. (2003). Assessment of the Economic Value of Muthurajawela Wetland. Occasional Papers of IUCN Sri Lanka, No. 4.Emerton L., Baig S., and Saleem M. (2009). Valuing Biodiversity. The economic case for biodiversity conservation in the Maldives. AEC Project by IUCN, Ministry of
Housing, Transport and Environment, Government of Maldives and UNDP Maldives.Emerton, L. (2004). The Kala Oya River Basin, Sri Lanka: where small irrigation tanks are not really small. Case studies in wetland valuation Nr. 9. Integrating Wetland
Economic Values into River Basin Management. IUCN Sri Lanka. http://www.ecosystemmarketplace.com/pages/dynamic/resources.library.page.php?page_id=145§ion=biodiversity_market&eod=1.
Emerton L. and Bos E. (2004). Value: Counting Ecosystems as an Economic Part of Water Infrastructure, IUCN, Gland, Switzerland and Cambridge, http://data.iucn.org/dbtw-wpd/edocs/2004-046.pdf.
Emerton L., Seilava R. and Pearith H. (2002). Bokor, Kirirom, Kep and Ream National Parks, Cambodia: Case studies of economic and development linkages, field study report, in Review of Protected Areas and their Role in the Socio-Economic Development of the Four Countries of the Lower Mekong Region, International Centre for Environmental Management, Brisbane and IUCN Regional Environmental Economics Programme, Karachi, http://cmsdata.iucn.org/downloads/casestudy03ream.pdf.
Encalada A., Ibarra L.C., and de la Paz M.C. (2011). Diagnóstico de la integridad ecológica y la calidad del agua de los ríos en las zonas de manejo del FONAG. Informe Final , Laboratorio de Ecología Acuática de la Universidad San Francisco de Quito. The Nature Conservancy.
Environment Agency (2010). The costs of the summer 2007 floods in England. Environment Agency, Bristol, UK. 41pp.EPA (2009). Water Quality Trading Toolkit for Permit Writers. United States Environmental Protection Agency, Washington.Europa: Summaries of EU legislation (2007). Maritime safety: Accelerated phasing-in of double-hull oil tankers’, http://europa.eu/legislation_summaries/transport/
waterborne_transport/l24231_en.htm.Eurostat (2002). Water Accounts – Results of pilot studies. Luxembourg. http://epp.eurostat.ec.europa.eu/cache/ITY_OFFPUB/KS-47-02-284/EN/KS-47-02-284-EN.
PDF.FAO (2007). The World’s Mangroves 1980–2005, FAO Forestry Paper, Rome, ftp://ftp.fao.org/docrep/fao/010/a1427e/a1427e00.pdf.FAO (2012a). The State of World Fisheries and Aquaculture, FAO Fisheries and Aquaculture Department, Food and Agriculture Organization of the United Nations,
Rome.FAO (2012b). Peatlands-guidance for climate change mitigation by conservation, rehabilitation and sustainable use. Second edition. http://www.fao.org/docrep/015/
an762e/an762e.pdf.Federal Environment Agency (2007) Economic Valuation of Environmental Damage. Methodological Convention for Estimates of Environmental Externalities. Dessau,
85pp. http://www.umweltdaten.de/publikationen/fpdf-l/3482.pdf.Ferraro P.J. (2008). Asymmetric information and contract design for payments for environmental services. Ecological Economics 65 (4): 810-821.Finlayson, C. M., (2012). Forty years of wetland conservation and wise use. Aquatic Conservation: Marine and Freshwater Ecosystems 22: 139–143.Finlayson C.M., Davidson N.C., Spiers A.G., Stevenson N.J. (1999). Global wetland inventory – current status and future priorities. Marine & Freshwater Research 50:
717-727.Fisher B., Turner R.K., Morling P. (2009). Defining and classifying ecosystem services for decision making. Ecological Economics, 68 (3): 643 –653.Forest Trend (2009). Markets for Ecosystem Services in China: An Exploration of China’s ‘Eco-compensation’ and Other Market-Based Environmental Policies, www.
forest-trends.org/documents/files/doc_2317.pdf.Förster, J. (2010). Peatland restoration for carbon sequestration, Germany, http://www.eea.europa.eu/atlas/teeb/peatland-restoration-for-carbon-sequestration-
germany-1/at_download/file.Fourqurean J.W., Duarte C.M., Kennedy H., Marbà N., Holmer M., Mateo M.A., Apostolaki E.T., Kendrick G.A., Krause-Jensen D., McGlathery K.J., Serrano O. (2012).
Seagrass ecosystems as a globally significant carbon stock. Nature Geoscience 5: 505–509.Gaborone Declaration (2012). The Gaborone Declaration of the Summit for Sustainability in Africa, 24 to 25 May 2012, Botswana.http://www.conservation.org/
conferences/africa_sustainability_summit/Documents/Gaborone-Declaration-HoS-endorsed_5-25-2012_Govt-of-Botswana_CI_Summit-for-Sustainability-in-Africa.pdf.
Georgiadis N.M., Paragamian K., Giannakakis T., Poursanidis D., Catsadorakis G. (2010). Types of artificial water bodies in the Aegean island (Greece), their environmental impact and potential value for biodiversity. In Christodoulou and Stamou (eds) Environmental Hydraulics. Taylor & Francis Group, London, ISBN 978-0-415-58475-3.
Ghermandi A., Bergh J.C.J.M. van den, Brander L.M., Groot H.L.F. de, Nunes P.A.L.D., (2010). Values of natural and human-made wetlands: A meta-analysis. Water Resour. Res. 46, W12516.
Giri C., Ochieng E., Tieszen L.L., Zhu Z., Singh A., Loveland T., Masek J., Duke N. (2011). Status and distribution of mangrove forests of the world using earth observation satellite data. Global Ecology & Biogeography 20, 154-159.
Goldman R., Benítez S., Calvache A. and Montambault J. (2010a). Measuring the Effectiveness of Water Funds: Guidance Document for Development of Impact Measures. TNC, Arlington, Virginia.
Goldman R.L., Benitez S., Calvache A., and Ramos A. (2010b). Water funds: Protecting watersheds for nature and people. The Nature Conservancy, Arlington, Virginia.Goldman R.L., Benitez S., Calvache A., Davidson S., Ennaanay D., McKenzie E., Tallis H. (2010c) TEEBcase: Water Funds for conservation of ecosystem services in
watersheds, Colombia, available at: TEEBweb.org.
73
TeeB for WaTer anD WeTlanDs
Green A.J., El Hamzaoui M., Aziz El Agbani M., Franchimont J. (2002). The conservation status of Moroccan wetlands with particular reference to waterbirds and to changes since 1978. Biological Conservation 104: 71-82.
Green E.P., Short F.T. (2003). World atlas of seagrasses. Univ. Of California Press, Los Angeles. 298pp.Grigg A., Harper M. and Verbunt S. (2011). Tread lightly: Biodiversity and ecosystem services risk and opportunity management within the extractive industry. The
Natural Value Initiative.Gumma M., Thenkabail P.S., Fujii H., Namara R. (2009). Spatial models for selecting the most suitable areas of rice cultivation in the Inland Valley Wetlands of Ghana
using remote sensing and geographic information systems. Journal of Applied Remote Sensing 3, 033537.GWP and NBO (Global Water Partnership and Network of Basin Organisation) (2009). A Handbook for Integrated Water Resources Management in Basins, http://www.
gwptoolbox.org/images/stories/Docs/gwp_inbo%20handbook%20for%20iwrm%20in%20basins_eng.pdf.Haines-Young R. (2011). Exploring ecosystem service issues across diverse knowledge domains using Bayesian Belief Networks. Progress in Physical Geography
35(5): 681-699.Halpern B.S., Longo C., Hardy D., McLoed K.L., Samhouri J.F., Katona S.K., Kleisner K., Lester S.E., O’Leary J., Ranelletti M., Rosenberg A.A., Scarborough C., Selig
E.R., Best B.D., Brumbaugh D.R., Chapin S., Crowder L.B., Daly K.L., Doney S.C., Elfes E., Fogarty M.J., Gaines S.D., Jacobsen K.I., Karrer L.B., Leslie H.M., Neeley E., Pauly D., Polasky S., Ris B., St Martin K., Stone G.S., Sumaila U.R. and Zeller D. (2012). An index to assess the health and benefits of the global ocean. Nature 488: 615-620. doi:10.1038/nature11397.
Hamerlynck O. and Duvail S. (2008). Case Study 4: Ecosystem restoration and livelihoods in the Senegal River Delta, Mauritania. In: Fisher R.J., Maginnis S., Jackson W.J., Barrow E. and Jeanrenaud S.. Linking Conservation and Poverty reduction: Landscapes, People and Power. London: Earthscan: 68-77.
Hammitt J.K., Liu J.-T. and Liu J.-L. (2001). Contingent valuation of a Taiwanese wetland. Environment and Development Economics, 6, 259–268.Hanley N. and Barbier E. B. (2009). Valuing ecosystem services’, in Pricing Nature: Cost-Benefit Analysis and Environmental Policy, Edward Elgar, London.Hansson L.A., Brönmark C. P., Nilsson A., Åbjörnsson K. (2005). Conflicting demands on wetland ecosystem services: nutrient retention, biodiversity or both?
Freshwater Biology 50: 705–714.Hoekstra A.Y. and Chapagain A.K. (2006). Water footprints of nations: water use by people as a function of their consumption pattern. Water Resource Manage.Hornborg A., McNeill J. and Martinez-Alier J. (2007). Rethinking Environmental History: World- System History and Global Environmental change, Altamira Press,
Lanham, MD.Hudalah D. and Woltjer J. (2007). Spatial planning system in transitional Indonesia. International Planning Studies 12(3): 291-303.Hughes R.G., Paramor O.A.L. (2004). On the loss of saltmarshes in south-east England and methods for their restoration. J. Applied Ecology 41: 440-448.Humes A. (2010). Owners of ship Westerhaven must pay $11.5 million for damage to Barrier Reef caused by negligence, Amandala, Belize, www.amandala.com.bz/
index.php?id=9757.Islam M. and Braden J.B. (2006). Bio-economic development of flood plains: farming versus fishing in Bangladesh. Environment and Development Economics, 11:
95–126.IUCN (2011). Pangani River Basin, Tanzania. WANI Case Study, http://www.waterandnature.org/sites/default/files/documents/pdf/pangani-web.pdf.Jacobs M. (1997). Environmental valuation, deliberative democracy and public decision-making. In J. Foster (ed.). Valuing Nature? Economics, Ethics and Environment,
Routledge, London, pp 211-231.Jenkins W.A., Murray B.C., Kramer R.A., Faulkner S. (2010). Valuing ecosystem services from wetlands restoration in the Mississippi Alluvial Valley. Ecological
Economics, 69, 1051–1061.Johnston R.J., Grigalunas T.A., Opaluch J.J., Mazzotta M., Diamantedes J. (2002). Valuing estuarine resource services using economic and ecological models: The
Peconic Estuary system. Coastal Management, 30 (1): 47–65.Kettunen M., Bassi S., Gantioler S. and ten Brink P. (2009). Assessing Socio-Economic Benefits of Natura 2000: A Toolkit for Practitioners (November 2009 edition),
Output of the European Commission project Financing Natura 2000: Cost estimate and benefits of Natura 2000, IEEP, Brussels.Kettunen M., Berghöfer A., Bouamrane M., Brunner A., Chape S., Conner,N., Dudley N., Ervin J., Gidda S.B., Morling P., Mulongoy K. J., Pabon L., Seidl A., Stolton S.,
ten Brink P., Vakrou A., (2011). Recognising the value of protected areas. In TEEB (2011).Kettunen M., and ten Brink P. (Eds) (2013). The Social and Economic Benefits of Protected Areas: An Assessment Guide. Earthscan from Routledge, Abingdon and
New York.Kosoy N. and Corbera E. (2010). Payments for ecosystem services as commodity fetishism. Ecological Economics 69 (6): 1228–1236.KPMG and NVI (2011). Biodiversity and ecosystem services: Risk and opportunity analysis within the pharmaceutical industry. The Natural Value Initiative.Kraemer R. A., Guzmán Castro Z., Seroa da Motta R., Russell C. (2003). Economic Instruments for Water Management: Experiences from Europe and Implications for
Latin America and the Caribbean, Inter-American Development Bank. Regional Policy Dialogue Study Series.Krchnak K.M., Smith D.M., Deutz A. (2011). Putting Nature in the Nexus: Investing in Natural Infrastructure to Advance Water-Energy-Food Security, Bonn2011
Conference: The Water, Energy and Food Security Nexus – Solutions for the Green Economy. Background Papers for the Stakeholder Engagement Process.Kumar R., Horwitz P., Milton G. R., Sellamuttu S. S., Buckton S. T., Davidson N. C., Pattnaik A. K., Zavagli M and Baker C. 2011. Assessing wetland ecosystem services
and poverty interlinkages: a general framework and case study. Hydrological Sciences Journal. 56(8)1602-1621.Kwak S.-J., Yoo S.-H. and Lee C.-K. (2007). Valuation of the Woopo Wetland in Korea: a contingent valuation study. Environment and Development Economics, 12:
323–328.Lehmann M., ten Brink P., Bassi S., Cooper D., Kenny A., Kuppler S., von Moltke A., and Withana S. (2011). Reforming Subsidies. In TEEB (2011).León F. and Renner I. (2010). Conservation of water sources in Moyobamba: A brief review of the first experience in payments for environmental services in Peru’,
Mountain Forum Bulletin, vol X, no 1, pp85–86.Loth P. (ed) (2004). The Return of the Water: Restoring the Waza Logone Floodplain in Cameroon, IUCN, Gland, Switzerland and Cambridge.MA (Millennium Ecosystem Assessment) (2005a). Ecosystems and Human Well-being: Synthesis. Island Press, Washingon, DC.MA (Millennium Ecosystem Assessment) (2005b). Ecosystems and Human Well-Being: Wetlands and Water Synthesis. World Resources Institute, Washington, DC.Mack S.K., Lane R.R., Day J.W. (2012). Application of the First Certified Methodology for Wetland Carbon Credits to a Wetland Municipal Effluent Assimilation System
in lulling, Louisiana. WEFTEC 2012 Annual Technical Exhibition and Conference. New Orleans, LA. October, 2012, http://weftec2012.conferencespot.org/Application-of-the-First-Certified-Methodology-for-Wetland/Application-of-the-First-Certified-Methodology-for-Wetland/1.
MacKinnon J., Verkeuil Y.I., Murray N. (2012). IUCN situation analysis on East and Southeastern Asian intertidal wetlands, with particular reference to the Yellow Sea (including the Bohai Sea). Occasional paper of the IUCN Species Survival Commission No. 47. IUCN, Gland, Switzerland & Cambridge, UK. 70pp.
Maes J., Paracchini M.L., Zulian G. (2011). A European assessment of the provision of ecosystem services. JRC Scientific and Technical Reports. Luxembourg: Publications Office of the European Union.
Maltby E. and Acreman M.C. (2011). Ecosystem services of wetlands: pathfinder for a new paradigm, Hydrological Sciences Journal, 56(8): 1341-1359.Martinez Alier J., Munda G., O’Neill J. (1997). Weak comparability of values as a foundation for ecological economics, Ecological Economics, 26: 277-286.Martinez-Alier J. (2002). The environmentalism of the poor. A study of ecological conflicts and valuation. Cheltenham: Edward Elgar.Massarutto A. (2003) Water pricing and irrigation water demand: efficiency vs. sustainability. European Environment 13/2003, 100-119.McCauley D.J. (2006). Selling out on nature. Nature, 443: 27-28.McGrath M. and Smith M. (2006). Sustainable Catchment Management Programme (SCaMP): from hilltop to tap, in BHS 9th National Hydrology Symposium, Durham.Meadows D. (1998). Indicators and Information Systems for Sustainable Development – A Report to the Balaton Group, The Sustainability Institute, Hartland, VT, www.
sustainer.org/pubs/Indicators&Information.pdf.Meire P., Ysebaert T., van Damme S., van den Bergh E., Maris T. and Struyg E. (2005). The Scheldt estuary: a description of a changing ecosystem, Hydrobiologia, vol
540, nos 1–3, pp1–11.MINAM (2010). Compensación por servicios ecosistémicos: Lecciones aprendidas de una experiencia piloto, Lima, Peru, Las microcuencas Mishiquiyacu, Rumiyacu
y Almendra de San Martín, Perú, Ministerio del Ambiente; http://cdam.minam.gob.pe/novedades/compensacionleciones.pdf.MLUV MV (Ministerium für Landwirtschaft, Umwelt und Verbraucherschutz Mecklenburg-Vorpommern) (2009). Konzept zum Schutz und zur Nutzung der Moore.
Fortschreibung des Konzeptes zur Bestandssicherung und zur Entwicklung der Moore. Ministerium für Landwirtschaft, Umwelt und Verbraucherschutz Mecklenburg-Vorpommern, Schwerin, 109p.
Molnar M., Kocian M. and Batker D. (2012). Valuing the Aquatic Benefits of British Columbia’s Lower Mainland: Near shore Natural Capital Valuation. David Suzuki Foundation and Earth Economics.
Moreno-Mateos D. and Comin F.A. (2010). Integration objectives and scales for planning and implementing wetland restoration and creation in agricultural landscapes. Journal of Environmental Management, 91:2087-2095.
Moreno-Mateos D., Power M.E., Comin F.A., Yockteng R. (2012). Structural and functional loss in restored wetland ecosystems. PLoS Biol. 10 (1), e1001247. doi: 10.1371/journal.pbio.1001247.
Morris J., Hess T., Gowing D., Trawick P., Leeds-Harrison P., Blowers A., Tucker G. (2009). RELU Integrated Floodplain Management, Department of Natural Resources,
74
TeeB for WaTer anD WeTlanDs
Cranfield University, School of Applied Sciences.Morris R. K. A. and Barham P. (2007). The Habitats Directive as a driver for sustainable development in the coastal zone: The example of the Humber estuary, in B. A.
Larson (ed) Sustainable Development Research Advances, Nova Science Publishers, New York.Mossman H.L., Davy A.J., Grant A. (2012). Does managed coastal realignment create saltmarshes with ‘equivalent biological characteristics’ to natural reference sites?
J. Applied Ecology, doi: 10.1111/j.1365-2664.2012.02198.x.MRC (Mekong River Commission)(2003). Mekong River Awareness Kit: interactive self-study CD-Rom. Mekong River Commission. P.O. Box 6101, Unit 18 Ban Sithane
Neua, Sikhottabong District, Vientiane 01000, Lao PDR.Muñoz-Piña C., Guevara A., Torres J.M., Braña J. (2008). Paying for the hydrological services of Mexico’s forests: Analysis, negotiations and results. Ecological
Economics 65 (4): 725 – 736.Muralikrishna G., Thenkabail, P. S., Fujii H.; Namara R. (2009). Spatial models for selecting the most suitable areas of rice cultivation in the Inland Valley Wetlands of
Ghana using remote sensing and geographic information systems. Journal of Applied Remote Sensing, 3 (1): 3-21.Nagabhatla N., Finlayson C.M., Seneratna Sellamuttu S., Gunawardena A. (2008). Application of Geospatial Tools to Monitor Change in a Micro-Tidal Estuary for the
Purpose of Management Planning, Ceylon Journal of Science (Biological Sciences), 37 (1): 73-86.Naidoo R., Balmford A., Costanza R., Fisher B., Green R.E., Lehner B., Malcolm T.R., Ricketts T.H. (2008). Global mapping of ecosystem services and conservation
priorities. Proceedings of the National Academy of Sciences of the United States of America 105, 9495-9500.Natural Capital Declaration (2012). http://www.naturalcapitaldeclaration.org/the-declaration/#.New Zealand Department of Conservation (2006). The Value of Conservation: What Does Conservation Contribute to the Economy? NZDC, New Zealand.Niu Z.G., Zhang H.Y., Wang X.W., Niu Z., Zhang H., Wang X., Yao W., Zhou D., Zhao K., Zhao H., Li N., Huang H., Li C., Yang J., Liu C., Liu S., Wang L., Li Z., Yang Z.,
Qiao F., Zheng Y., Chen Y., Sheng Y., Gao X., Zhu W., Wang W., Wang H., Weng Y., Zhuang D., Liu J., Luo Z., Cheng X., Guo Z., Gong P. (2012). Mapping wetland changes in China between 1978 and 2008. Chinese Science Bulletin. doi: 10.1007/s11434-012-5093-3.
Nowack M. (2005). Implementación de un esquema de pago por servicios ambientales: Un estudio de la voluntad a pagar, Proyecto Regional Cuencas Andinas, Moyabamba, GTZ, Peru.
OECD (2010). OECD Member Country Questionnaire Responses on Agricultural Water Resource Management, http://www1.oecd.org/dataoecd/7/31/44763686.pdf.Othman J., Bennett J. and Blamey R. (2004). Environmental management and resource management options: a choice modelling experience in Malaysia. Environment
and Development Economics, 9: 803–824.Pagiola S. (2008). Payment for environmental services in Costa Rica. Ecological Economics (4): 712-724.Papayannis T. and Pritchard D. E. (2011). Culture and Wetlands in the Mediterranean: an Evolving Story, Athens, Med-INA.Parish F., Sirin A., Charman D., Joosten H., Minayeva T., Silvius M. and Stringer L. (Eds.) (2008). Assessment on Peatlands, Biodiversity and Climate Change: Main
Report. Global Environment Centre, Kuala Lumpur and Wetlands International, Wageningen.Pearce D. W. and Turner R. K. (1990). Economics of Natural Resources and the Environment, Harvester Wheatsheaf, Hemel Hempstead, Hertfordshire, UK.Perrot-Maître D. (2006). The Vittel payments for ecosystem services: a “perfect” PES case?. Project Paper, no. 3, International Institute for Environment and Development
(IIED) and Department for International Development (DFID), London, http://www.katoombagroup.org/documents/tools/TheVittelpaymentsforecosystemservices.pdf.
Phan N.H.T., Meerer S.V.D. (2009). Final Evaluation of the UNDP / GEF Project: Coastal and Marine Biodiversity Conservation and Sustainable Use in the Con Dao islands region, Vietnam.
Piehler M. F., and Smyth A. R. (2011). Habitat-specific distinctions in estuarine denitrification affect both ecosystem function and services. Ecosphere 2(1): art.12.Pollard S. R., Kotze D. C. and Ferrari G. (2008). Valuation of the livelihood benefits of structural rehabilitation interventions in the Manalana Wetland, in D. C. Kotze
and W. N. Ellery (eds) WETOutcome Evaluate: An Evaluation of the Rehabilitation Outcomes at Six Wetland Sites in South Africa, WRC Report No TT 343/08, Water Research Commission, Pretoria.
Posthumus H., Rouqyette J.R., Morris J., Gowing D.J.G., Hess T.M. (2010). A framework for the assessment of ecosystem goods and services: a case study on lowland floodplains in England. Ecological Economics 69: 1510-1523.
Prigent C., Papa F., Aires F., Jimenez C., Rossow W.B., Matthews E. (2012). Changes in land surface water dynamics since the 1990s and relation to population pressure. Geophysical Research Letters 39, L08403, doi: 10.1029/2012GL051276.
PUMA (2011). PUMA’s Environmental Profit and Loss Account for the year ended 31 December 2010. http://about.puma.com/wp-content/themes/aboutPUMA_theme/financial-report/pdf/EPL080212final.pdf.
Ramsar (1971). The Convention on Wetlands text, as originally adopted in 1971.http://www.ramsar.org/cda/en/ramsar-documents-texts-convention-on-20708/main/ramsar/1-31-38%5E20708_4000_0__.
Ramsar and UNWTO (UN World Tourism Organization) (2012). Destination wetlands: supporting sustainable tourism. Secretariat of the Ramsar Convention on Wetlands, Gland, Switzerland & World Tourism Organization (UNWTO), Madrid, Spain.
Ramsar Convention Secretariat (2011). The Ramsar Convention Manual: a guide to the Convention on Wetlands (Ramsar, Iran, 1971), 5th ed. Ramsar Convention Secretariat, Gland, Switzerland.
Ramsar Convention (2012). Report of the Secretary General on the implementation of the Convention at the global level. Ramsar COP11 DOC. 7. http://www.ramsar.org/pdf/cop11/doc/cop11-doc07-e-sg.pdf.
Reinhardt C., Bölscher J., Schulte A., Wenzel R. (2011). Decentralised water retention along the river channels in a mesoscale catchment in south-eastern Germany. Physics and Chemistry of the Earth. 36: 309-318.
Renner I. (2010). Compensation scheme for upstream farmers in municipal protected area, Peru. TEEBcase available at: TEEBweb.org.Rouquette J.R., Posthumus H., Morris J., Hess T.M., Dawson Q.L., Gowing D.J.G. (2011). Synergies and trade-offs in the management of lowland rural floodplains: an
ecosystem services approach, Hydrological Sciences Journal, 56:8, 1566-1581.Sabater M. and Ledesma M. (2004). Project monitoring report, World Wide Fund for Nature Philippines (WWF), Quezon City, Philippines.Sanchirico J.N. and Mumby P. (2009). Mapping ecosystem functions to the valuation of ecosystem services: implications of species– habitat associations for coastal
land-use decisions. Theoretical Ecology, 2: 67–77.Sathirathai S. and Barbier E.B. (2001). Valuing mangrove conservation, southern Thailand. Contemporary Economic Policy, 19, 109–122.SCBD (2011). Possible indicators for water and water-related ecosystem services for the Strategic Plan for Biodiversity 2011-2020 and the Aichi biodiversity targets.
UNEP/CBD/SBSTTA/15/INF/10.SCBD (2012). Report of the work of the expert group on maintaining the ability of Biodiversity to continue to support the water cycle. UNEP/CBD/COP/11/INF/2, 10
September 2012. http://www.cbd.int/doc/meetings/cop/cop-11/information/cop-11-inf-02-en.pdf.Schäfer A. (2009). Moore und Euros – die vergessenen Millionen. Archiv für Forstwesen und Landschaftsökologie 43, 156-160.Schlager E. and Ostrom E. (1992). Property Rights Regimes and Natural Resources: A Conceptual Analysis. Land Economics, 68:249-262.Scholz M., Mehl D., Schulz-Zunkel C., Kasperidus H.D., Born W., Henle K. (2012): Ökosystemfunktionen von Flussauen - Analyse und Bewertung von
Hochwasserretention, Nährstoffrückhalt, Kohlenstoffvorrat, Treibhausgasemissionen und Habitatfunktion. Naturschutz und Biologische Vielfalt, 124, 367p.Schuyt K. and Brander L. (2004). The Economic Values of the World’s Wetlands, Gland/Amsterdam, WWF.SEEA (2012). System of Environmental-Economic Accounting Central Framework. White cover publication, pre-edited text subject to official editing. http://unstats.
un.org/unsd/envaccounting/White_cover.pdf.Sifleet S., Pendleton L., Murray B.C. (2011). State of the Science on Coastal Blue Carbon. A Summary for Policy Makers. Nicholas Institute Report 11-06.Siikamäki J., Sanchirico J.N., Jardine S.L. (2012). Global economic potential for reducing carbon dioxide emissions from mangrove loss. Proceedings of the National
Academy of Sciences of the United States of America. 109:14369-14374.Slootweg R. based on Van der Wateren et al. (2004). Catchment planning incorporates ecosystem service values, South Africa. TEEBcase (see TEEBweb.org).Slootweg, R. (2010a). Wetland restoration incorporates ecosystem service values, Aral Sea, Central Asia. TEEBcase (see TEEBweb.org).Slootweg R. (2010b). Water transfer project influenced by ecosystem service evaluation, Egypt. TEEBcase (see TEEBweb.org).Slootweg R., van Beukering P.L.H., Immerzeel D. (2008). Valuation of Ecosystem Services and Strategic Environmental Assessment: Lessons from Influential Cases.
Reports of the Netherlands Commission for Environmental Assessment (www.eia.nl).Smith M.D. (2007). Generating value in habitat-dependent fisheries: the importance of fishery management institutions. Land Economics, 83: 59–73.Smith M.D. and Crowder L.B. (2011). Valuing Ecosystem Services with Fishery Rents: A Lumped-Parameter Approach to Hypoxia in the Neuse River Estuary.
Sustainability 3: 2229-2267.Somda J. and Nianogo A. J. (2010). Wetland valuation changes policy perspectives, Burkina Faso, http://www.eea.europa.eu/atlas/teeb/wetland-valuation-changes-
policy-perspectives.Spiers A.G. (1999). Review of international/continental wetland resources. Pp 63-104 in: C.M. Finlayson, A.g. Spiers (eds.), Global review of wetland resources and
priorities for inventory. Supervising Scientist Report No. 144. Canberra, Australia.
75
TeeB for WaTer anD WeTlanDs
Supreme Court of Belize (2010). Westerhaven Decision, Belize (26 April 2010), Claim No 45.Tallis H.T., Ricketts T., Nelson E., Ennaanay D., Wolny S., Olwero N., Vigerstol K., Pennington D., Mendoza G., Aukema J., Foster J., Forrest J., Cameron D., Arkema K.,
Lonsdorf E., and Kennedy C. (2010). InVEST 1.004 beta User’s Guide. The Natural Capital Project, Stanford University.TEEB (2010). The Economics of Ecosystems and Biodiversity: Ecological and Economic Foundations. Editor: Kumar P.. Earthscan, London and Washington.TEEB (2010a). The Economics of Ecosystems and Biodiversity for Local and Regional Policy Makers. Report, Editors: Wittmer H. and Gundimeda H., 209p.TEEB (2010b). A Quick Guide to The Economics of Ecosystems and Biodiversity for Local and Regional Policy Makers. Editors: Wittmer H. and Gundimeda H., 8p.TEEB (2011). The Economics of Ecosystems and Biodiversity in National and International Policy Making. Editor: ten Brink P.. Earthscan, London.TEEB (2012a). The Economics of Ecosystems and Biodiversity in Business and Enterprise. Editor Bishop J., Earthscan, London.TEEB (2012b). The Economics of Ecosystems and Biodiversity in Local and Regional Policy and Management. Edited by Heidi Wittmer and Haripriya Gundimeda.
Earthscan from Routledge, Abingdon and New York. 340p.ten Brink B. (2008). presentation at the Workshop: The Economics of the Global Loss of Biological Diversity 5-6 March 2008, Brussels, Belgium.ten Brink P., Gantioler S., Gundimeda H., Sukhdev P., Tucker G., and Weber J-L. (2011a). Strengthening indicators and accounting systems for natural capital. In TEEB
(2011). The Economics of Ecosystems and Biodiversity (TEEB) in National and International Policy Making An output of TEEB, edited by Patrick ten Brink, IEEP. Earthscan, London.
ten Brink P., Bassi S., Bishop J., Harvey C.A., Karousakis K., Markandya A., Nunes P.A.L.D., McConville A.J., Ring I., Ruhweza A., Sukhdev P., Vakrou A., van der Esch S., Verma M., and Wertz-Kanounnikoff S. (2011b). Rewarding Benefits through Payments and Markets. In TEEB (2011).
ten Brink P., Gantioler S., Gundimeda H., Sukhdev P., Tucker G., and Weber J-L. (2011c). Strengthening indicators and accounting systems for natural capital. In TEEB (2011) The Economics of Ecosystems and Biodiversity (TEEB) in National and International Policy Making An output of TEEB, edited by Patrick ten Brink, IEEP. Earthscan, London.
ten Brink P., Mazza L., Badura T., Kettunen M. and Withana S. (2012a). Nature and its Role in the Transition to a Green Economy. A TEEB report. Forthcoming www.teebweb.org and www.ieep.eu.
ten Brink P., Bassi S., Badura T., Hart K., and Pieterse M. (2012b). Incentive Measures and Biodiversity – A Rapid Review and Guidance Development – Volume 3: Guidance to identify and address incentives which are harmful to biodiversity A report to Defra.
Thompson P. and Balasinorwala T. (2010). Wetland protection and restoration increases yields, Bangladesh, http://www.eea.europa.eu/atlas/teeb/wetland-protection-and-restorationincreases-1.
Todd, D. and Nunez, E. (2004). GEFME study of the nature and role of local benefits in GEF program areas: The case of Tubbataha Reef National Marine Park, Sulu Sea, Philippines, Working Document.
Tongson E. and Cola R. (2007). Negotiating stakeholder agreements for conservation: The case of Tubbataha Reefs, Philippines, Science Diliman, 19 (1): 47–63.Tsujii T. and Sasagawa K. (ed.) (2012). 33 Examples of the Cultures and Technologies of Wetlands in Japan. Relationship with Local People and Communities. Wetlands
International Japan.Turner R. K., Burgess D., Hadley D., Coombes E., and Jackson N. (2007). A cost-benefit appraisal of coastal managed realignment policy. Global Environmental
Change 17(3-4): 397-407.Turpie (2010) J., Wastewater treatment by wetland, South Africa, http://www.eea.europa.eu/atlas/teeb/water-quality-amelioration-value-of/view.UNCSD (2012). Rio+20 declaration – “The Future We Want” (UN document A/66/L.56). Online: http://www.uncsd2012.org/content/documents/727The%20Future%20
We%20Want%2019%20June%201230pm.pdf.UNDP–UNEP Poverty-Environment Facility (2008). Making the Economic Case: A Primer For Mainstreaming Environment in National Development Planning, www.
unpei.org/PDF/Makingthe-economic-caseprimer.pdf.UNEP (2011). Towards a Green Economy: Pathways to Sustainable Development and Poverty Eradication, www.unep.org/greeneconomy.UNEP-WCMC (2001). World Atlas of Coral Reefs. Cambridge, UK.UNESCO-WWAP and UNSD (2011). Monitoring Framework for Water.United Nations (2012). SEEA-Water. System of Environmental-Economic Accounting for Water. Department of Economic and Social Affairs. Statistics Division.UNWWAP (United Nations World Water Assessment Programme) (2003). Water for People, Water for Life, http://webworld.unesco.org/water/wwap/facts_figures/
protecting_ecosystems.shtml.Van der Biest K., Jacobs S., De Bie T., Liekens I., D’Hondt R., Van Herzele A., Staes J., De Meester L., Aertsens J., De Nocker L., Landuyt D., Goethals P., Ceuterick
M., Turkelboom F.and Meire P. (2013). Ecosystem services of freshwater ecosystems “ECOFRESH”. Final Report. Brussels: Belgian Science Policy 2013 (Research Programme Science for a Sustainable Development).
Van der Ploeg S. and de Groot R.S. (2010). The TEEB Valuation Database – a searchable database of 1310 estimates of monetary values of ecosystem services. Foundation for Sustainable Development, Wageningen, The Netherlands. www.fsd.nl.
Van der Ploeg S., Wang Y., Gebre Weldmichael T. and de Groot R.S. (2010). The TEEB Valuation Database – a searchable database of 1310 estimates of monetary values of ecosystem services. Foundation for Sustainable Development, Wageningen, The Netherlands.
Van der Wateren T., Diederichs N., Mander M., Markewicz T. and O’Connor T. (2004). uMhlathuze Strategic Catchment Assessment, Richard bay, South Africa. Case study compiled for the drafting of CBD guidelines on Biodiversity in SEA. uMhlathuze Municipality.
Van Vliet M.T.H., Yearsley J.R., Ludwig F., Vögele S., Lettenmaier D.P., Kabat P. (2012). Vulnerability of US and European electricity supply to climate change. Nature Climate Change.
Vatn A. and Bromley D. (1994). Choices without prices without apologies, Journal of Environmental Economics and Management, 26:129-148.Vidanage S., Perera S. and Kallesoe M. (2005). The Value of Traditional Water Schemes: Small Tanks in the Kala Oya Basin, Sri Lanka. IUCN Water, Nature and
Economics Technical Paper No. 6, IUCN - The International Union for Conservation of Nature, Ecosystems and Livelihoods Group Asia.Vörösmarty C. J., McIntyre P.B., Gessner M.O., Dudgeon D., Prusevich A., Green P., Glidden S., Bunn S. E., Sullivan C.A., Reidy Liermann C., Davies P. M. (2010) Global
threats to human water security. Nature, vol 467: 555-561.WBCSD (World Business Council for Sustainable Development) (2012). Water valuation. Welling R., Cartin M., Baykono D., Diallo D. (2012) Volta River Basin: Ghana
and Burkina Faso, http://data.iucn.org/dbtw-wpd/edocs/2012-010.pdf.Wetlands International (2010). State of the world’s waterbirds. S. Delany, S. Nagy & N. Davidson (compilers). Wetlands International, Ede, The Netherlands. 21pp.Wilk R. and Cliggett L. (2006). Economies and Cultures: Foundations of Economic Anthropology, 2nd edn, Westview Press, Boulder, CO.Wilson D., Renou-Wilson F., Farrell C., Bullock C., Müller C. (2012). Carbon Restore – The Potential of Restored Irish Peatlands for Carbon Uptake and Storage. The
Potential of Peatlands for Carbon Sequestration (2007-CCRP-1.6). CCRP Report, Prepared for the Environmental Protection Agency, http://www.epa.ie/downloads/pubs/research/climate/CCRP_15_web.pdf.
World Meteorological Organization (2010) Climate, Carbon and Coral Reefs. WMO-No. 1063.WRI (2012), Reefs at Risk Revisited in the Coral Triangle, http://pdf.wri.org/reefs_at_risk_revisited_coral_triangle.pdf.Wunder S. (2005). Payment for environmental services: some nuts and bolts. Centre for International Forestry Research (CIFOR) Occasional Paper No.4, http://www.
cifor.cgiar.org/publications/pdf_files/OccPapers/OP-42.pdf..Wunder S., Albán M. (2008). Decentralized payments for environmental services: The case of Pimampiro and Profafor in Ecuador. Ecological Economics 65 (4): 685-
698.WWAP (World Water Assessment Programme) (2012). The United Nations World Water Development Report 4: Managing Water under Uncertainty and Risk. Paris,
UNESCO.WWF (2012). Living Planet Report 2012. Biodiversity, biocapacity and better choices. WWF International, Gland, Switzerland. 160pp.Yang W., Chang J., Xu B., Peng C., Ge Y. (2008). Ecosystem service value assessment for constructed wetlands: a case study in Hangzhou, China. Ecological
Economics, 68, 116–125.Yukuan W., Bin F., Colvin C., Ennaanay D., McKenzie E., Min C. (2010) Mapping conservation areas for ecosystem services in land-use planning, China, available at:
TEEBweb.org.Zavestoski S. (2004). Constructing and Maintaining Ecological Identities: The Strategies of Deep Ecologists. In Clayton , S. and Opotow , S. (eds.). Identity and the
Natural Environment: The Psychological Significance of Nature , The MIT Press , Cambridge , MA , pp 297-316.Zheng Y., Zhang H., Niu Z., Gong P. (2012). Protection efficacy of national wetland reserves in China. Chinese Science Bulletin 57, 1-19.
76
TeeB for WaTer anD WeTlanDs
1 http://www.unece.org/env/water/
2 The phrase “in the context of sustainable development” is intended to recognise that whilst some wetland development is inevitable and that many developments have important benefits to society, developments can be facilitated in sustainable ways by approaches elaborated under the Convention, and it is not appropriate to imply that ‘development’ is an objective for every wetland.
3 Ramsar COP9 Resolution IX.1 Annex A (2005).
4 Mekong River Awareness Kit: interactive self-study CD-Rom. Mekong River Commission. P.O. Box 6101, Unit 18 Ban Sithane Neua, Sikhottabong District, Vientiane 01000, Lao PDR.
5 This classification, while internationally broadly accepted, is not the only possible one, and indeed other classifications have been proposed. The choice on the classification to be adopted depends on the purpose for which it is used (Fisher et al., 2009; Costanza, 2008). The MA’s classification in Box 2.2 is a powerful instrument for environmental education and awareness-raising. However, it does not fully distinguish between intermediate and final ecosystem services, potentially leading to double counting (Wallace, 2007; Hein 2006). In fact, with the MA’s classification, the same ecosystem services may be taken into account firstly as regulation and supporting ecosystem services, and then as provisioning or cultural ecosystem services (e.g. water regulation and storm protection provided by mangroves, and the resulting cultural ecosystem services enjoyed by tourists). Double counting is to be avoided when carrying out a monetary valuation or environmental accounting (but it is not so relevant if the goal is environmental education), and in order to do so Boyd and Banzhaf (2007) propose a definition of ecosystem services as components of nature that are directly used to produce human welfare, thereby only taking into account the final and not the intermediate ecosystem services. Wallace (2007) proposes a definition based on the human needs satisfied by the ecosystem services, which are grouped into four categories: 1) basic needs (food, oxygen, water, energy), 2) protection from predators, diseases, parasites and 3) physical and chemical benevolent environment (temperature, humidity, electricity, chemicals), and 4) cultural performance. Finally, if the goal is to make a decision that affects a certain area, the most appropriate definition is based on the relation between the production of ecosystem services and the location where they are enjoyed. For example, Hein et al. (2006) propose a spatially explicit definition of ecosystems, i.e. the set of species and populations in a spatially defined area, the interactions among them and with the abiotic elements.
6 The international dollar, or the Geary–Khamis dollar, is a hypothetical unit of currency that is used to standardise monetary values across countries by correcting to the same purchasing power that the U.S. dollar had in the United States at a given point in time. Figures expressed in international dollars cannot be converted to another country’s currency using current market exchange rates; instead they must be converted using the country’s PPP (purchasing power parity) exchange rate. 1Int.$=1USD.
7 Ibid, last endnote.
8 Habitat ecosystem services is an alternative name for supporting ecosystem services. The change in their denomination was proposed by the TEEB (2010, chapter 1), in order to highlight the ability of ecosystems to provide habitat for migratory species and allow natural selection processes to maintain the vitality of the gene pool.
9 Net Present Value (NPV) over 20 years (1996-2004) at 10% discount rate
10 This method uses questionnaires to ask people how much they would be willing to pay to protect or enhance ecosystems and the services they provide, or alternatively how much they would be willing to accept for their loss or degradation, see section 3.4
11 Useful source of further information: http://intl.pnas.org/content/109/18/E1111.full.pdf. mangrove atlas, seagrass atlas
12 Ramsar COP11 Resolution XI.9 (2012)
13 Decision X/2, annex. Biodiversity http://www.cbd.int/sp/targets.http://www.cbd.int/sp/targets.
14 www.naturalcapitalproject.org
15 TEEBcase by Thomas Barano, Emily McKenzie, Nirmal Bhagabati, Marc Conte, Driss Ennaanay, Oki Hadian, Nasser Olwero, Heather Tallis, Stacie Wolny, Ginny Ng (2010) Integrating Ecosystem Services into Spatial Planning in Sumatra, Indonesia, available at: TEEBweb.org.
16 An externality is a negative or positive impact caused by an agent to another one without compensating it. An example of a negative externality is the reduction in a fisherman’s income due to the pollution caused by a factory upstream, which reduces the available fish in a river.
17 http://www.higharcs.org.
18 The SNA is an internationally agreed standard for national economic accounts. Its first version was adopted in 1953, and it is the main source of information for internationally comparable economic aggregates and indicators such as Gross Domestic Production (GDP), value added, income and consumption.
19 For more information, see http://unstats.un.org/unsd/envaccounting/seeaw/seeawaterwebversion.pdfhttp://unstats.un.org/unsd/envaccounting/seeaw/seeawaterwebversion.pdf.
20 The London Group is an informal group of experts primarily from national statistical agencies but also international organizations that discuss accounting and have been influential in the SEEA process, both on methodologies and on sharing practice. http://unstats.un.org/unsd/envaccounting/londongroup/
21 http://www.ramsar.org/cda/en/ramsar-home/main/ramsar/1_4000_0__
22 http://www.watershedmarkets.org/
23 A reverse auction is an auction where many sellers compete to offer a good/service to a buyer by undercutting their prices, whereas in classical auctions many buyers compete for a good/service to be sold by one seller. Reverse auctions allow reducing the asymmetry of information, and are useful when the ecosystem services buyers are not aware of the opportunity costs associated with the provision of the required ecosystem service, and could therefore set a higher price than needed, with the consequence that fewer ecosystem services are obtained than theoretically possible. Reverse auctions force the providers of ecosystem services to compete among them, lowering the price of ecosystem services to a level close to their opportunity costs. As a disadvantage, they present higher transaction costs and administrative difficulties, and also a higher degree of uncertainty, because the participants’ offers may be determined by many often unpredictable factors, e.g. risk aversion, strategic behaviour, and information availability (Ferraro, 2008). See Box 4.6 for an example of an auction-based PES (the salinity credits in the catchment area of Bet Bet, Australia).
24 The opportunity cost is represented by the benefit that an agent waives when choosing an action rather than another. For example, when deciding to conserve a forest instead of using the land for agriculture, the opportunity cost associated with this decision is the benefit that would have been obtained by selling the crops cultivated on that land.
25 The importance of water for sustainable development, and the key role played by ecosystems in maintaining water quantity and quality, were recognised at the Rio+20 Conference, held in June 2012 (see paragraphs 119 to 124 of the outcome document “The Future We Want”; also see Box 2.1). During the Rio+20 conference, the need for developing integrated water resource management and water efficiency plans was stressed, as well as the commitment to ensure safe drinking water and sanitation to an increasing portion of world population.
26 http://www.ipbes.net.
27 See Ramsar Handbook 1: Concepts and approaches for wise use of wetlands and 15: A Ramsar Framework for wetland inventory and ecological character description for guidance on the topic
28 Ramsar Resolution XI.13: An integrated framework for linking wetland conservation and wise use with poverty eradication
29 See Ramsar Handbook 18: Managing wetlands
30 See Ramsar Technical Report 3: Valuing wetlands: Guidance for valuing the benefits derived from wetland ecosystem services
31 See Ramsar Handbook 6: Wetland CEPA
32 As can be seen from the total number of monetary values, it differs from the discussion presented in the previous and subsequent analysis. The differing number of studies is mainly due to two issues 1) the monetary values for the whole world (n=12) have been excluded; and 2) the database has been updated since the publication of the TEEB (2010) study. Nonetheless, general geographical patterns can be assumed to be the same.
77
TeeB for WaTer anD WeTlanDs
This report presents insights on both critical water-related ecosystem services and also on the wider ecosystem services from wetlands. The objective is encourage additional policy
momentum, business commitment, and investment in the conservation, restoration, and wise use of wetlands. The report seeks to show how recognising, demonstrating, and capturing the values of ecosystem services related to water and wetlands can lead to better informed, more efficient, and fairer decision making. Appreciating the values of wetlands to both society and
the economy can help inform and facilitate political commitment to policy solutions.
TEEB Water and Wetlands is about the “water - wetlands - ecosystem services” interface – it concerns the importance of water and its role in underpinning all ecosystem services and the
fundamental role of wetlands in global and local water cycles. It is also about the wide range of ecosystem services provided by nature to people and the economy that need to be taken into
account to ensure that the full benefits of nature are not overlooked. It is about the “values” of nature which can be expressed in a number of ways and methods, including qualitative,
quantitative and monetary indicators.
This report aims to support evidence-based decision making by presenting an array of ecosystem service values in varying contexts.
TEEB Water and Wetlands aims to contribute towards the wise use of wetlands through creating better understanding of ecosystem service values and benefits and their integration in
decision making at all levels.