Embed Size (px)
Citation preview
1
The Economics of Ecosystems and Biodiversity (TEEB): Water and Wetlands
Policy instruments to progress towards wise use
Daniela Russi Senior Policy Analyst
Institute for European Environmental Policy, IEEP
2
What decisions do we take? Many different scales
Local – e.g. site management, decisions on restoration, construction, individual regulatory decisions
Hydrological scale (river basin, coastal area, etc.) – e.g. integrated water resource management, dams
Regional/national – e.g. designing regulation, economic instruments, subsidies, policy prioritisation, sectoral policy planning
Transboundary – e.g. transboundary river basins, coasts
International – e.g. climate negotiations, international agreements
slide by Andrew farmer and Daniela Russi
3
Policy instruments – Regulations
Regulations that reduce pressures on wetlands (e.g. regulation of water discharges, emissions standards)
Regulation of products – restrictions on product use (e.g. re:
endangered species; pesticides, detergents) or production standards
Establishment of Protected Areas
Land-use planning
o Integrated Water Resource Management (IWRM)
o Integrated Coastal Zone Management (ICZM)
o Marine Spatial Planning (MSP)
slide by Patrick ten Brink and Daniela Russi
4
IWRM, ICZM, MSP
Focused on landscape scale (e.g. river basin, coastal area, marine region)
Multi disciplinary approach
They engage the key stakeholders:
o Source of knowledge on ecosystem services
o Allows buy-in into relevant decisions
They allow policy makers to address multiple objectives, identify synergies among them, discuss trade-offs
slide by Patrick ten Brink and Daniela Russi
5
The Pangani River Basin IWRM (East Africa) (www.panganibasin.com)
The Pangani River Basin provides livelihoods to over three million people, mainly from agriculture and fisheries
Between 2002 and 2010, the IUCN Water and Nature Initiative (WANI) carried out a IWRM to provide information to the government on costs and benefits of different water resource management strategies (US$4.78 million). Objectives:
o To understand the hydrology of the river basin, the functioning of ecosystems and their link to human economy
o To discuss trade-offs (e.g. between maximising agricultural production, hydropower production or ecosystem services)
Used to help planning in situation of assumed increase in water demand
Source: TEEBcase by Cross and Förster, mainly based on PBWO/IUCN (2009) and Turpie et al. (2005)
slide by Patrick ten Brink and Daniela Russi
6
Restoration
Restoration and rehabilitation of degraded ecosystems can bring considerable benefits to people, also economic. Examples:
o Climate change mitigation and adaptation
o Flood risk prevention
o Reduction of damage of storms
o Livelihood for local communities
Sometimes natural systems present cheaper options than man-made systems
slide by Patrick ten Brink and Daniela Russi
7
An example of good on-site management: the Essex Marshes, UK
Over 25 years the Essex coast lost approximately 50% of its 30,000 ha of salt
marshes, and 1% continues to be lost every year
In 2002, the Essex Wildlife Trust created the largest EU coastal re-alignment
project to restore the salt marshes (81 ha of intertidal habitats created)
Over the next 20 years expected savings of £500,000/ year on sea wall maintenance
Additional benefits include: improved water quality, flood defence, ecotourism and recreation opportunities
Source: http://www.natura.org slide by Daniela Russi
8
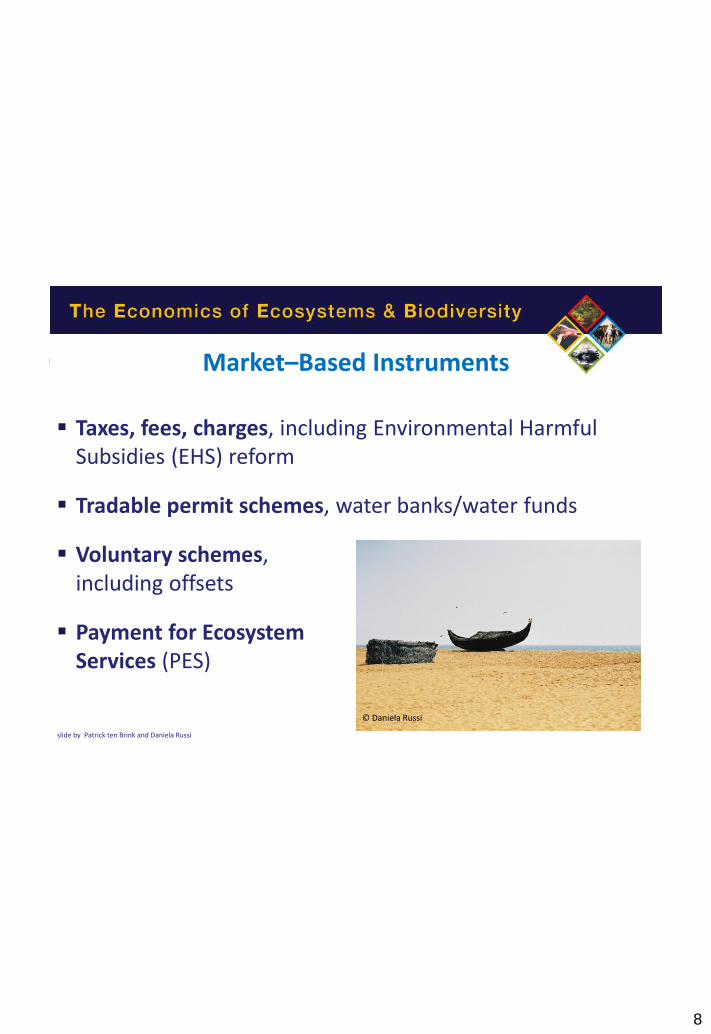
Market–Based Instruments
Taxes, fees, charges, including Environmental Harmful Subsidies (EHS) reform
Tradable permit schemes, water banks/water funds
Voluntary schemes, including offsets
Payment for Ecosystem Services (PES)
© Daniela Russi
slide by Patrick ten Brink and Daniela Russi
9
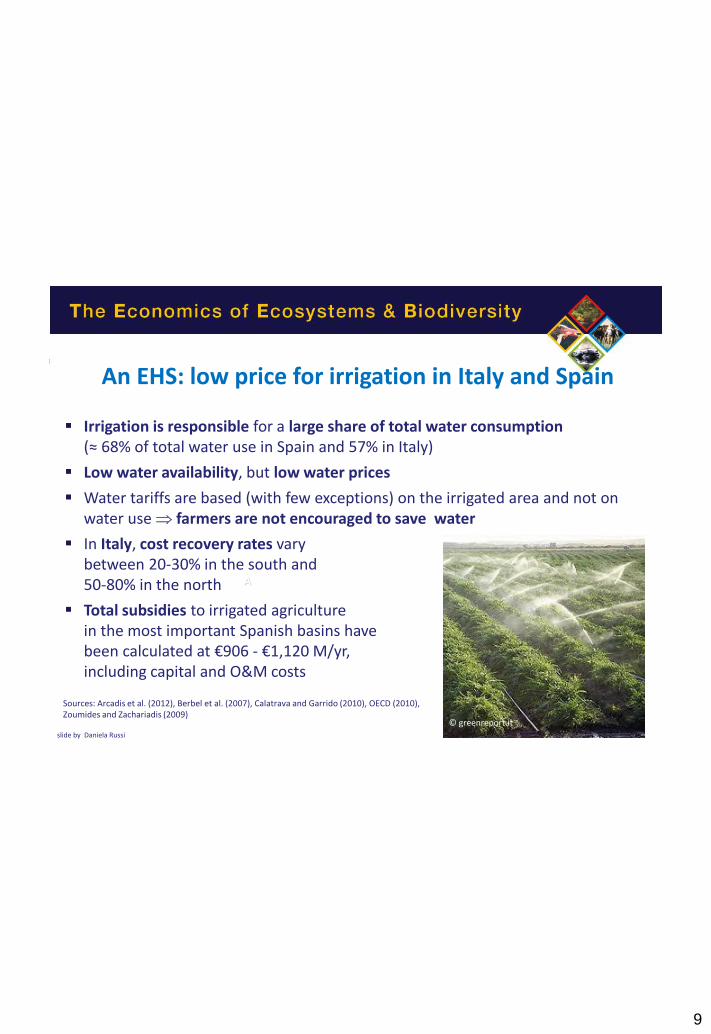
Irrigation is responsible for a large share of total water consumption (≈ 68% of total water use in Spain and 57% in Italy)
Low water availability, but low water prices
Water tariffs are based (with few exceptions) on the irrigated area and not on water use farmers are not encouraged to save water
In Italy, cost recovery rates vary between 20-30% in the south and 50-80% in the north
Total subsidies to irrigated agriculture in the most important Spanish basins have been calculated at €906 - €1,120 M/yr, including capital and O&M costs
A
© greenreport.it
Sources: Arcadis et al. (2012), Berbel et al. (2007), Calatrava and Garrido (2010), OECD (2010), Zoumides and Zachariadis (2009)
An EHS: low price for irrigation in Italy and Spain
slide by Daniela Russi
10
Salinization threatens agriculture in the area, damages infrastructure and has a negative impact on the river ecosystems
It is caused by the reduction in aquifer recharge produced by a reduction in permanent vegetation with deep roots
The Bet Bet tradable salinity credits auction: farmers could offer their commitment to undertake actions to reduce salinity in exchange for a certain payment
The farmers who won the auction could fulfil the obligations by reducing salinity in their fields or by buying salinity credits from other farmers who had achieved higher reductions than those established in their contracts
© www.surfline.com Source: Connor et al. (2008)
The salinity credits in Bet Bet, Australia
slide by Daniela Russi
11
Around 930,000 ha of peatlands have been drained in Germany for agriculture, 300,000 of which in the area of Mecklenburg- Vorpommern. Peatland drainage causes emissions of around 20 million tonnes of CO2-eq. per year
Between 2000 and 2008, 29,764 ha of peatlands have been restored, by raising the water level in order to prevent further oxidation of the peat
Also, a system of carbon credits (MoorFutures) for the voluntary market was established
1 MoorFutures= 1tCO2/yr = 35€
8,000 MoorFutures sold in M-V so far restoration of 55 ha
© http://www.moorfutures.de
Source: TEEB case by Förster (2009), mainly based on MLUV - Mecklenburg-Vorpommern (2009), Schäfer (2009)
The MoorFutures programme (restoration+offsetting credits)
slide by Daniela Russi
12
Wunder’s definition (Wunder, 2005): o (a) a voluntary transaction where
o (b) a well-defined ES or a land use likely to secure that service
o (c) is being ‘bought’ by a (minimum one) service buyer
o (d) from a (minimum one) service provider
o (e) if and only if the service provider secures service provision (conditionality)
They can be funded by governmental bodies, private business or foundations/NGOs
Payment usually based on the opportunity costs of conservation and not on monetary evaluation long process of negotiation
Payment for Ecosystem Services
A
slide by Daniela Russi
13
The barrier to conservation is mainly economic in nature
A small fee may change the individual decisions of the owners or managers of natural resources
Property rights are well defined and the environmental services are definable
Buyers and suppliers can be identified, and a transaction between these two categories of actors is possible
It should not be regarded as a panacea or blueprint for environmental conservation
It works when:
slide by Daniela Russi
14
Vittel, France
PES programme to preserve the quality of Vittel’s bottled water, threatened by the presence of nitrates and pesticides due to the intensification of agricultural and livestock raising practices upstream
10 years of negotiations
Package of incentives available to farmers: o 18 and 30 year-contracts to ensure continuity
o abolition of the debt associated with the purchase of land by farmers
o an average of €1000/ha to cover the costs related to the transition
o a lump sum of up to €150,000 per farm to meet the initial costs
o Technical assistance
Success: protection of 92% of the water catchment area
slide by Daniela Russi
15
Scope of MBI – they are useful to
Offer incentives for more sustainable practice
Engage new stakeholders
Improve funding opportunities
Allow more flexibility to private actors
Act as an educational tool
slide by Daniela Russi
© greenreport.it
© Daniela Russi
16
Limitations of MBI Are complementary – not substitutes – to regulation
Not advisable to protect high-value ecosystems or in cases where failures can lead to severe/irreversible impacts
Only effective when the cause for environmental degradation is mainly economic (e.g. not useful in case of corruption, or to prevent illegal water abstraction)
Risk of commoditisation of nature?
Crowding-out of moral motivations?
slide by Daniela Russi
© Daniela Russi
17
Wetlands protection/improvement should be integrated in policy-making at all levels, in order to progress towards wise use
In order to do that, the ES provided by wetlands need to be assessed – using qualitative, quantitative and monetary methodologies – depending on the objectives, the available information, time and resources
A variety of policy tools can contribute to wise use, including regulation, establishment of PAs, integrated management and MBIs
Transforming our approach
slide by Patrick ten Brink and Daniela Russi
© Daniela Russi