Embed Size (px)
Citation preview
The Edible SchoolyardProgram Evaluation: Tools and Case Studies
Summary of survey results on evaluation
• Whatever people say in survey

Evaluationin a nutshell
Why evaluate? How to begin? Partner? Study design? What to do with my results?

Why evaluate?Participants
Staff
Funders
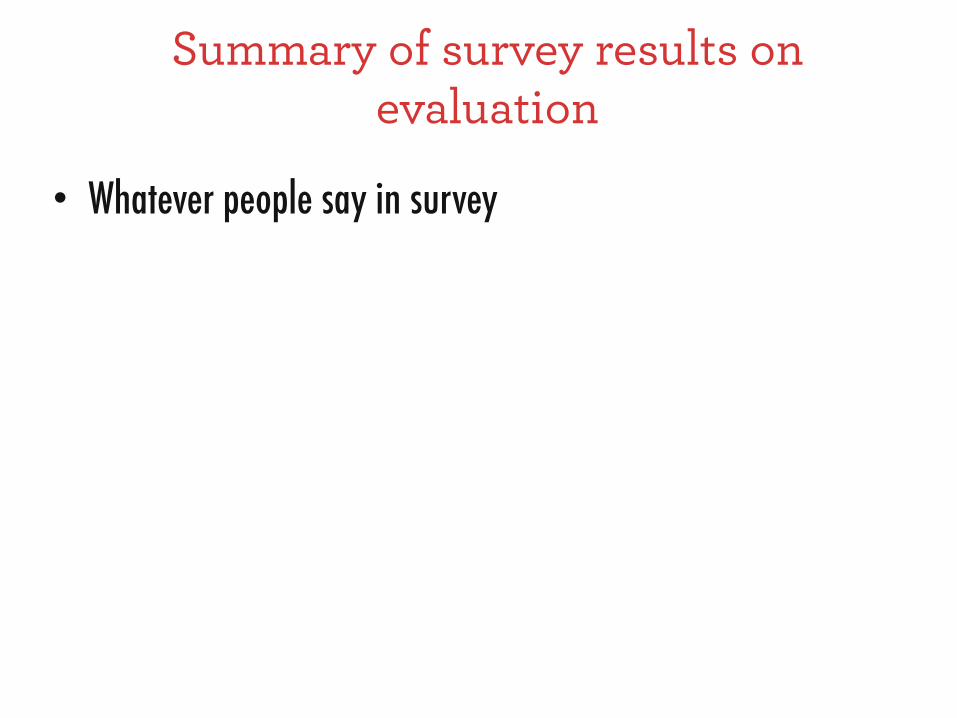
How do I begin?
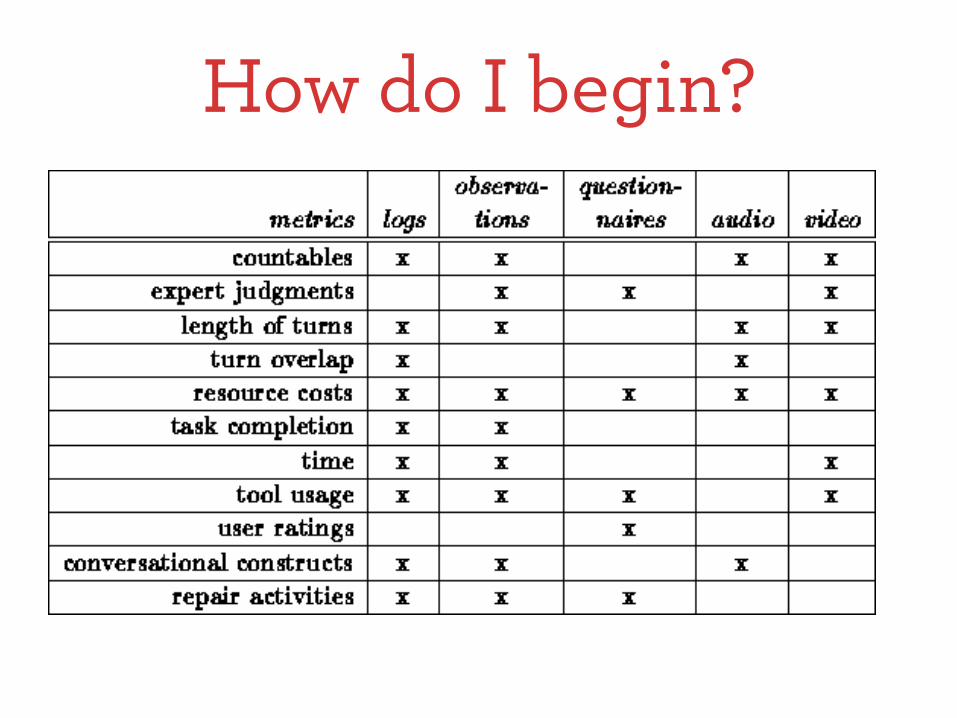
How do I begin?

Who do I partner with?
Social Scientists
Economists

Study Design…and the counterfactual
versus
+

Before and after: OXO !+ control: OXO O O !Time series: O O O X O O O !+ control: O O O X O O O O O O O O O !Crossover: O O O X O O O O O O O O O O O O X O O O !Randomize!
Stud
y D
esig
n

How do I use my results?
Enough theory!
• Why did they evaluate? • How did they lay the foundation? • With whom did they partner? • What study design did they use? • How did they use their results?
Edible Schoolyard New Orleans
Changing the way children eat, learn and live at five FirstLine Schools

• Founded New Orleans’ first charter school in 1998
• Operates five open-admissions schools:
Samuel J. Green Charter School Arthur Ashe Charter School Langston Hughes Academy Phillis Wheatley Community School Joseph S. Clark Preparatory High School
• 3,102 students
• 94% African American, 4% Hispanic, 1% Caucasian, 1% Other
• 88% qualify for free school meals

Mind – Body - SpiritESYNOLA
is Whole Child Development
ESYNOLA provides a rich variety of experiences for our students to nurture character, health, and active citizenship !ESYNOLA integrates gardening and cooking into FirstLine schools’ curriculum, culture and cafeteria.
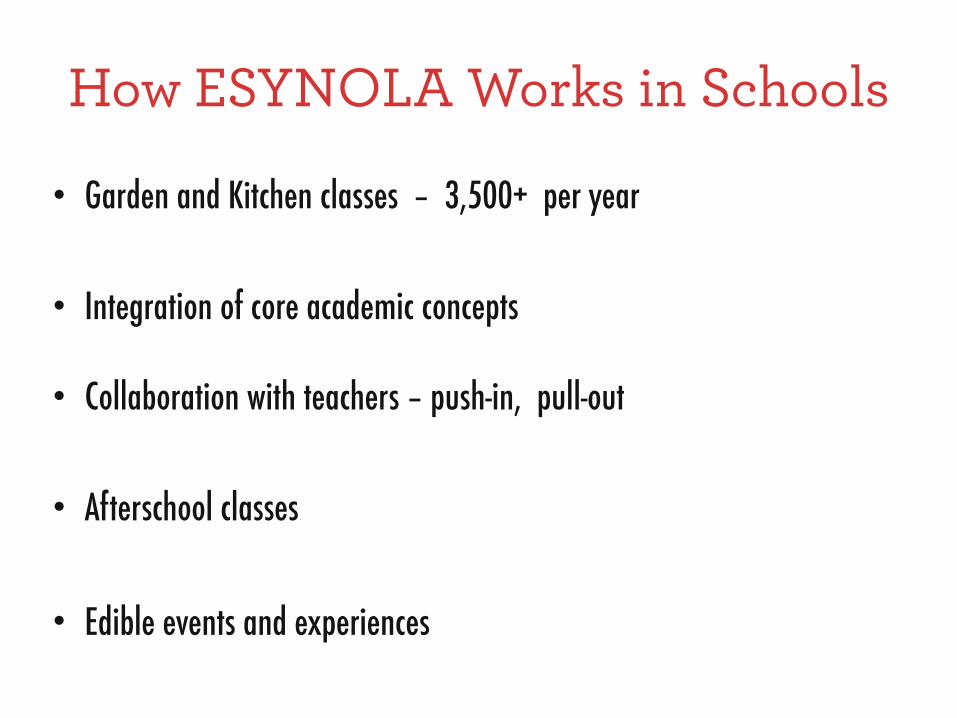
How ESYNOLA Works in Schools
• Garden and Kitchen classes – 3,500+ per year
!• Integration of core academic concepts
• Collaboration with teachers – push-in, pull-out
!• Afterschool classes
!• Edible events and experiences

Events and Experiences• Special Events like Family Food Nights, Open Garden Days,
Watermelon Day, Sweet Potato Fest – more than 50 per year • Grade level “edible” experiences like Citrus Pick, Iron Chef, and
Market-to-Table
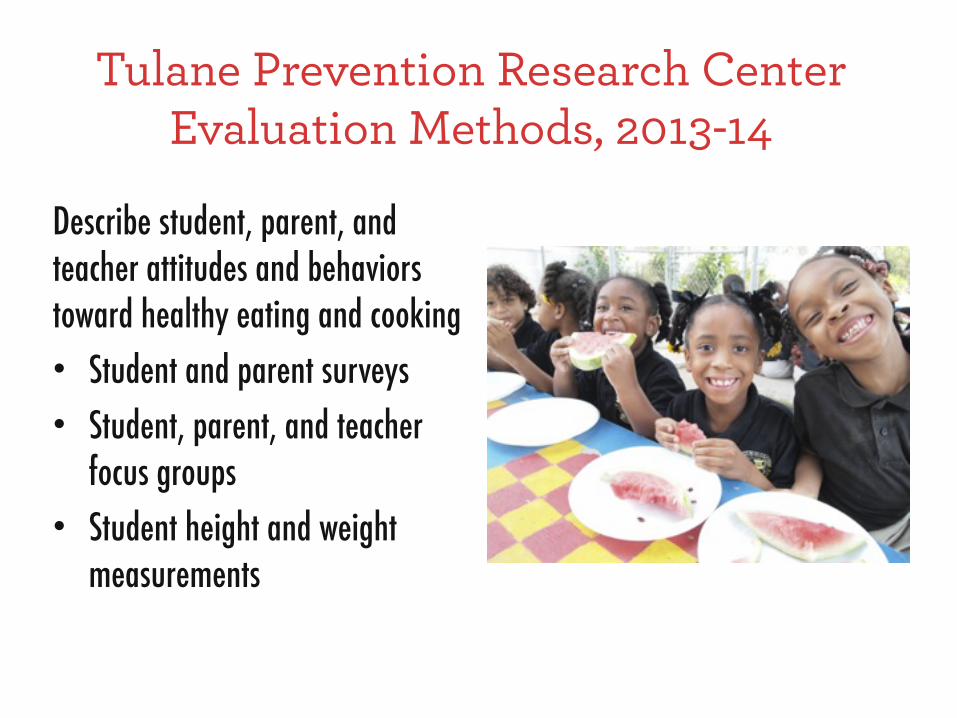
Tulane Prevention Research Center Evaluation Methods, 2013-14
Describe student, parent, and teacher attitudes and behaviors toward healthy eating and cooking • Student and parent surveys • Student, parent, and teacher
focus groups • Student height and weight
measurements

Key Results: FFV Consumption
• Fruit and vegetable consumption among ESYNOLA students is higher than the national average
• Salty and sweet snack consumption among ESYNOLA students is lower than the national average
0%
23%
45%
68%
90%
Fruit Green vegetables
10%
61%
48%
85%
ESYNOLANational

“What I like is that I get to taste and learn
different things. And you know try different things from all around the world. And what I like is at school…they give us fruit for breakfast and lunch…and healthy choices. And I love salads.“
-Student from Ashe

Key Results: Habits and Skills
• Dietary decisions are mostly influenced by family and personal tastes; peer pressure is also a factor at school
• Ability to cook and follow a recipe is high among students who attend ESYNOLA classes

“My son, who was in Edible Schoolyard last year,
said it was his resolution to cook one meal a week for his family, and he’s kept that up. And of course, my younger son had to follow him. So now, they both have a night each week that they cook. And they either find the recipe or they tell me what they’re interested in and we find the recipe and then cook.”
-Parent from Wheatley

Physical Fitness• Parents want their children to
be healthy and are interested in ESYNOLA programming
• Overweight and obesity prevalence is in line with state level (around 40%), though higher than national average (33%)
• Parents, teachers, and students want more physical education

ESYNOLA Program ValueValue of ESYNOLA Program seen
by all focus group participants: • Experiential learning
• Exposure to new foods
• Skill transfer from classroom to home
• Modeling of healthy behaviors
• Integrated learning
• Social emotional well-being
ESYNOLA “ …helps our students be more open
minded about things, they are more willing to try more fruits and vegetables, anything that the garden teachers give them, they’ll try it. This translates to other things in life and provides a positive message.”
-Teacher from Green !
“ …is planting a seed that will help the kids down the road, in terms of having a healthy diet.”
-Teacher from Ashe

Recommendations
1. Garden and kitchen classes should be available to all students in all schools
!
2. Students should be empowered to make decisions about the ESYNOLA classes
!
3. Continue to develop healthier recipes of favorite and traditional dishes

More Recommendations
4. Communication to parents is critical for their involvement in ESYNOLA events and classes
!
5. Create a strong connection between what is taught in ESYNOLA classes and what is being served in the cafeterias
!
6. Increase physical activity opportunities at school

Even More Recommendations
7. Replicate methods used to encourage fruit consumption to encourage vegetable consumption
!8. Send students home with tools to make healthy meals !9. Help the students make the connection between unhealthy dietary habits and lack
of energy !10. Facilitate collaboration between ESYNOLA staff and classroom teachers

Changes in Methodology for 2015-16• Obtain active consent for student surveys from parents (not just opt
out) !• Compare 5th and 6th graders from two FirstLine schools to a control
group at a school with same food service provider but no ESYNOLA programming
!• Account for the minutes of programming (dosage) that each student
receives to more accurately evaluate the impact of ESYNOLA programming and changes in student knowledge and behavior


The Edible SchoolyardEdible Schoolyard NYC

Evaluation Process and Tools!!!!!! ! ! Andrew Barrett!! ! ! Program Director

What do we want to do?
!!
➢Began participatory strategic planning process that included staff and board (October 2013, approved October 2014) !
➢ Identified program goals, expansion opportunities, and target outcomes
34
Mission
!!
Transforming the hearts, minds, and eating habits of young New Yorkers through an
integrated seed to table education.

35
What do we want to do?
For Students !➢ Grade appropriate proficiency in knowledge, skills, attitudes and
preferences related to growing, preparing, cooking and eating plant-based foods !
➢ Increase in growing, preparing and consuming plant-based foods !➢ Increase in sharing and advocacy behaviors related to growing, preparing,
and consuming plant-based foods in the school environment & beyond !For Educators !➢ Educators demonstrate increased knowledge, skills and attitudes related to
building, maintaining and teaching from a garden/kitchen classroom !➢ Educators are able to plan, build and successfully maintain a garden and
kitchen program !!
36
What should we measure?
!!!!
➢Taproot Grant (October 2014-March 2015) !
➢Prioritized Macro and Micro Outcomes we want to measure
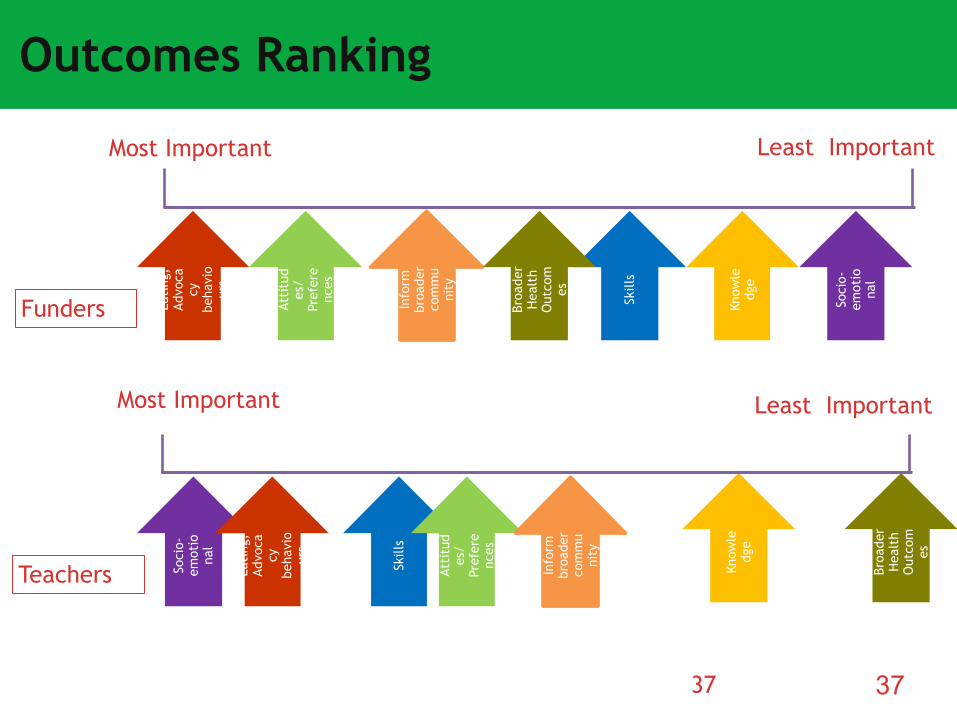
37
Outcomes Ranking
37
Know
ledg
e
Skill
s
Atti
tud
es/
Pref
ere
nces
Soci
o-
emot
iona
l
Eati
ng,
Advo
cacy
be
havi
our
s
Info
rm
broa
der
com
mu
nity
Broa
der
Hea
lth
Out
com
es
Most Important Least Important
Funders
Know
ledg
e
Skill
s
Atti
tud
es/
Pref
ere
nces
Soci
o-
emot
iona
l
Eati
ng,
Advo
cacy
be
havi
our
s
Info
rm
broa
der
com
mu
nity
Broa
der
Hea
lth
Out
com
es
Teachers
Least ImportantMost Important

38
How do we measure it?
➢Determined specific metrics for each outcome !
➢Reviewed existing evaluation instruments (Plate Waste Study and Student Survey with Columbia Teachers College, in-class observation) !
➢Identified areas for development as well as necessary instruments (Expand Parent Survey, Add in-class projects to test knowledge and skills)
!!
!

39
Outcome Metric Data Source Frequency
Appreciation for growing and cooking healthy
food.
Preference/behavioral intention for cooking
related activitiesStudent Survey 1x/year 2014-15
2x/year 2015-16
Confidence in one’ own capacity for cooking Self-efficacy for cooking Student Survey 1x/year 2014-15
2x/year 2015-16
Willingness to try plant based foods
Willingness to try plant based foods at home Parent Survey 1x/year 2013-15
2x/year 2015-16
Willingness to try tastings in classes Teacher observation 8-10x/year
(every class)
Attitude/intention to eat plant based outside of
the classroom
Choosing plant based foods in cafeteria Plate Study 1x/year 2014-15
2x/year 2015-16
Child requests for plant based food at home Parent Survey 1x/year 2013-15
2x/year 2015-16
Preference for taste of plant based foods Student Survey 1x/year 2014-15
2x/year 2015-16
Attitudes and Preferences
40
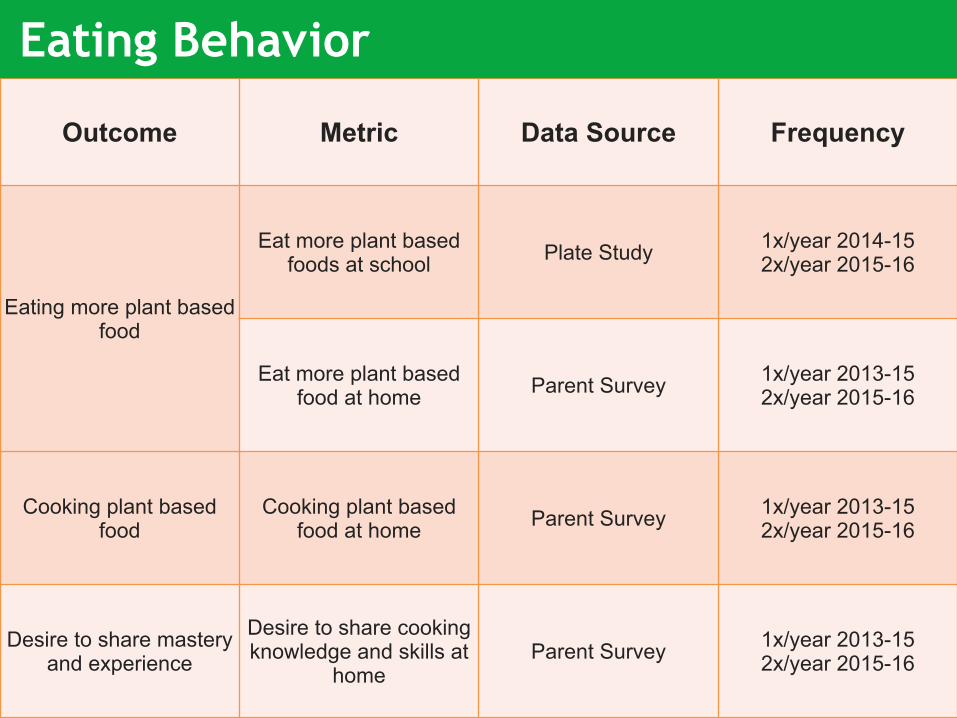
Outcome Metric Data Source Frequency
Eating more plant based food
Eat more plant based foods at school Plate Study 1x/year 2014-15
2x/year 2015-16
Eat more plant based food at home Parent Survey 1x/year 2013-15
2x/year 2015-16
Cooking plant based food
Cooking plant based food at home Parent Survey 1x/year 2013-15
2x/year 2015-16
Desire to share mastery and experience
Desire to share cooking knowledge and skills at
homeParent Survey 1x/year 2013-15
2x/year 2015-16
Eating Behavior
41
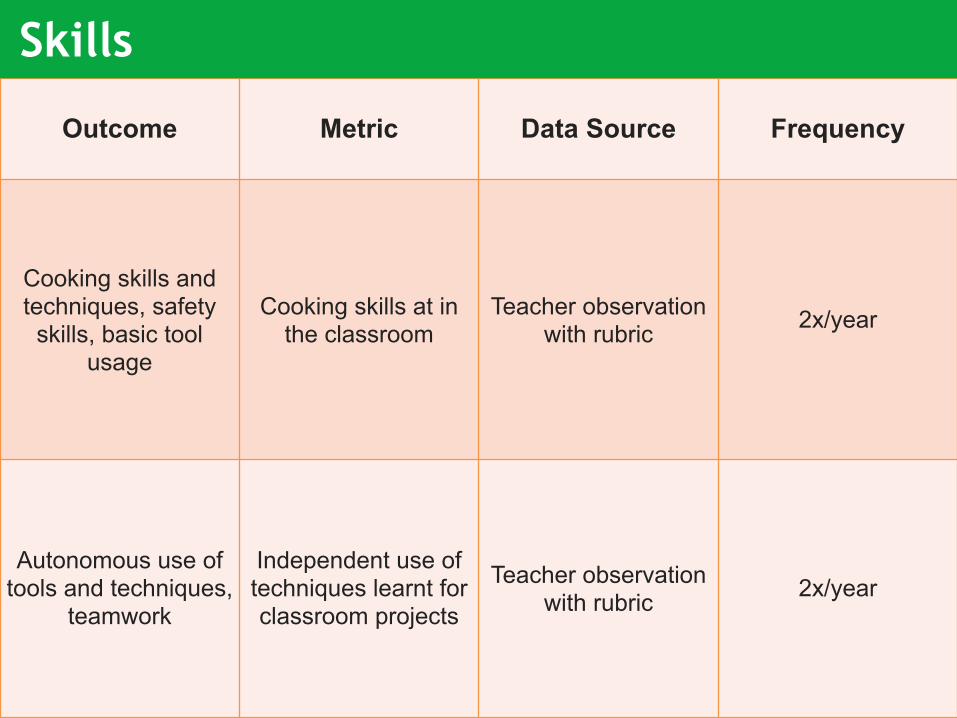
Outcome Metric Data Source Frequency
Cooking skills and techniques, safety
skills, basic tool usage
Cooking skills at in the classroom
Teacher observation with rubric 2x/year
Autonomous use of tools and techniques,
teamwork
Independent use of techniques learnt for classroom projects
Teacher observation with rubric 2x/year
Skills
42
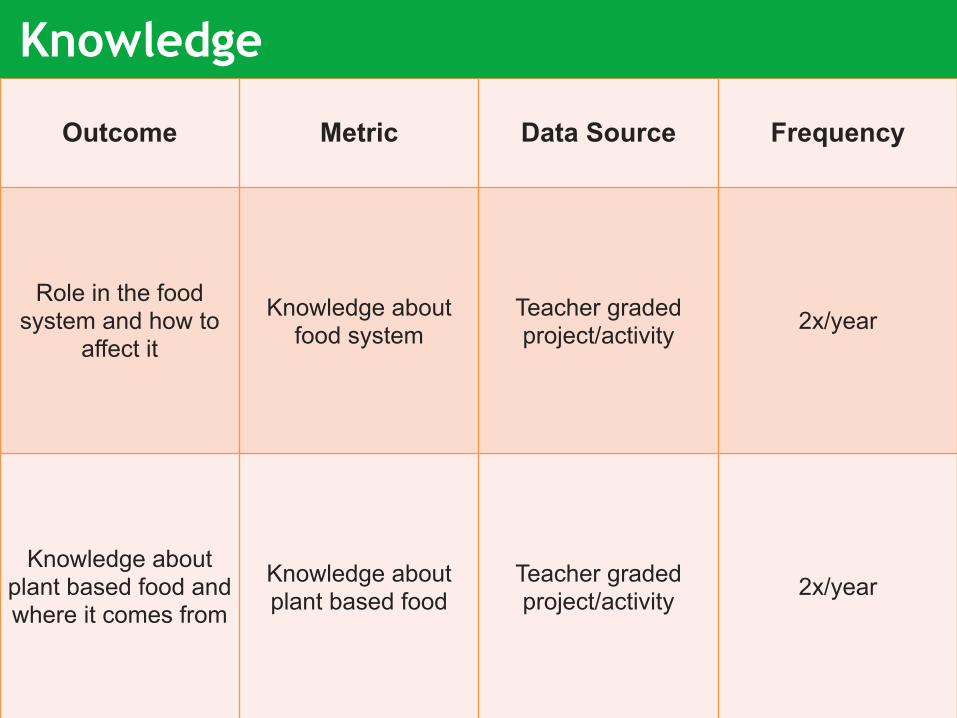
Outcome Metric Data Source Frequency
Role in the food system and how to
affect it
Knowledge about food system
Teacher graded project/activity 2x/year
Knowledge about plant based food and where it comes from
Knowledge about plant based food
Teacher graded project/activity 2x/year
Knowledge
43
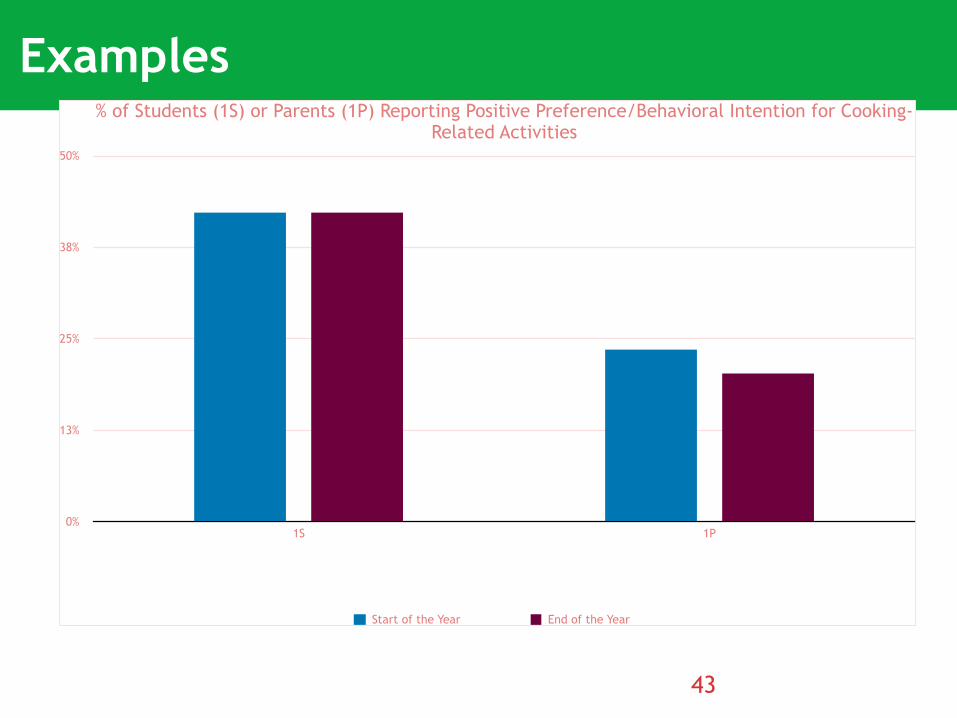
Examples% of Students (1S) or Parents (1P) Reporting Positive Preference/Behavioral Intention for Cooking-
Related Activities
0%
13%
25%
38%
50%
1S 1P
Start of the Year End of the Year

44
Examples% of Students Making Healthier Selections as Reported by Plate Study (5), Parent Survey (6),
and Student Survey (7)
0%
9%
17%
26%
34%
5 6 7
Start of the Year End of the Year

The Edible Schoolyard Berkeley

Evaluations
• School Lunch Initiative • Alumni Interviews • YPQI
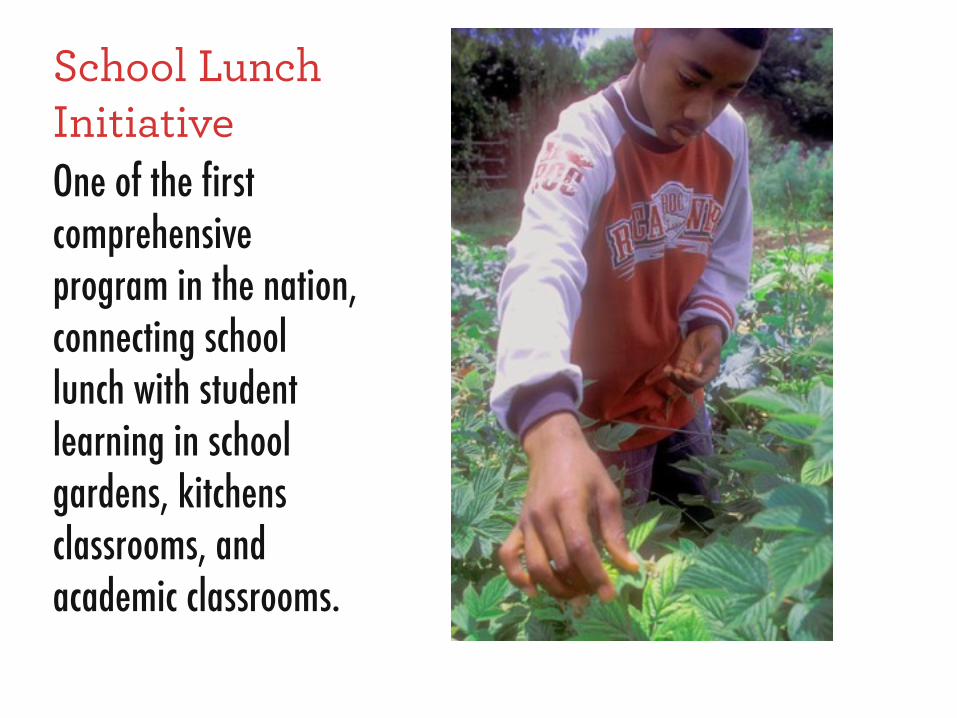
School Lunch InitiativeOne of the first comprehensive program in the nation, connecting school lunch with student learning in school gardens, kitchens classrooms, and academic classrooms.
Key Findings
• Edible Education changes student knowledge about healthy food choices!
• Edible Education changes student preference for fruits and vegetables, especially leafy green ones!
• Edible Education changes student attitudes towards the school eating experience!

Alumni Interviews
Ms. Tanner had things she always did in the garden. Like keeping the insect log and having activities about learning how we grow food and the earth in general. Definitely opened me up to a new kind of science, because we had never done anything outside with science. It started me being interested in science, especially in conservation….She talked to us about things in the garden that were affected by global warming. It brought science to be a more applicable thing in my life. - Izumi De Los Rios Kobara(2009 – 2012)

Alumni Interviews
It forced students and teachers into different roles. Teachers were still teachers, but they were having conversations with you…felt like the playing field was equal. Students were teaching students things. I remember that feeling really empowering. - Clara Williams (1998 - 2001)

YPQI • Partnership with the Horner Foundation and the David P. Weikart
Center for Youth Program Quality. • Assesses:
– Safe Environment – Supportive Environment – Interaction – Engagement – Youth Centered policies and practices – High expectations for youth and staff – Access

Why did they evaluate? How did they lay the groundwork? With whom did they partner? What study design did they use? How did they use their results?
Recap
The Edible SchoolyardTHANK YOU!
Kareem Raad, Berkeley Public Health Department [email protected] !Claudia Barker, ESYNOLA [email protected] !Andrew Barrett, ESYNYC [email protected] !Kyle Cornforth, ESYB [email protected]


![WELCOME! [] Schoolyad Gard… · WELCOME! Bonnie Lohman: Garden Specialist, Blooming Heights Edible Schoolyard Brian Wheat: Biology and Food Science Instructor/Edible Schoolyard Coordinator](https://img.pdfslide.net/doc/110x75/5eacd750b6ce2025ab3e72c2/welcome-schoolyad-gard-welcome-bonnie-lohman-garden-specialist-blooming.jpg)