Embed Size (px)
Citation preview
The Effect of Deadline Imposed Time Pressure on Audit Quality
Steven M. Glover
School of Accountancy
Marriott School of Business
Brigham Young University, Provo, UT
James C. Hansen
School of Accounting and Taxation
Goddard School of Business and Economics
Weber State University, Ogden, UT
and
Timothy A. Seidel
School of Accountancy
Jon M. Huntsman School of Business
Utah State University, Logan, UT
February 2015
Acknowledgements: We thank Linda Myers, Tom Omer, Roy Schmardebeck, Jacob Haislip,
Keith Jones, Brant Christensen, Derek Oler, Matt Sherwood, Erik Beardsley, workshop
participants at Utah State University, and conference participants at the 2014 BYU Accounting
Research Symposium and the 2015 American Accounting Association Auditing Section Midyear
Meeting for helpful comments and suggestions.
The Effect of Deadline Imposed Time Pressure on Audit Quality
ABSTRACT: We examine the association between deadline imposed time pressure and audit
quality. Using different measures of audit quality, we find consistent evidence of lower audit
quality when auditors are under heightened deadline imposed time pressure. We find that these
negative effects persist even among auditors with more resources at their disposal. Our findings
suggest that auditors completing procedures at or near the required (or extended) filing deadline
may compromise audit quality to meet the reporting requirement. There is substantial interest by
regulators and the auditing profession in identifying observable indicators of audit quality. Our
results suggest that the audit report date could be such an indicator—unfortunately, an accounting
standard change in 2009 had the unintended consequence of essentially eliminating the
information content of the audit report date and as a result financial statement users now have less
opportunity to identify auditors under heightened deadline imposed time pressure.
Keywords: audit quality; deadline imposed time pressure; misstatements
1
I. INTRODUCTION
The Public Company Accounting Oversight Board (PCAOB) issued Staff Audit Practice
Alert No. 10 on December 4, 2012, which addresses professional skepticism in audits. The
PCAOB Office of the Chief Auditor issued the report because of observations from PCAOB
oversight activities that “raised concerns about whether auditors consistently and diligently apply
professional skepticism” (PCAOB 2012a, 1). In the section titled “Impediments to the
Application of Professional Skepticism” the alert reads:
“…scheduling and workload demands can put pressure on partners and other engagement
team members to complete their assignments too quickly, which might lead auditors to
seek audit evidence that is easier to obtain rather than evidence that is more relevant and
reliable, to obtain less evidence than is necessary, or to give undue weight to confirming
evidence without adequately considering contrary evidence” (PCAOB 2012a, 7).
Jay Hanson, PCAOB Board Member, highlighted similar concerns in a speech on March 28,
2014 stating that:
“One of the biggest impediments to auditor skepticism, however, in my view, is the
calendar. Public companies have filing deadlines to meet, and they are rarely missed.
When they are missed, the consequences can be serious, including declining share prices
and harm to investors. If potential issues are discovered late in the audit process, or an
issue is not resolved in a timely manner, auditors may feel pressure to cut corners. We
have seen it in inspections and enforcement matters: Auditors recognize that there may be
a problem with management's estimates or conclusions but allow themselves to be talked
out of doing anything about it. Staying organized and proactively dealing with problems
far ahead of filing deadlines will help the auditor avoid running out of time as well as the
pressure to accept insufficient audit evidence” (Hanson 2014).
These concerns suggest that impediments to auditor skepticism, such as imposed time pressure,
can result in lower quality audits. Prior academic studies have examined the effect of time
pressure (i.e., time budget pressure, deadline time pressure, etc.) on auditor judgment and
performance in experimental settings (e.g. McDaniel 1990; Choo 1995; Glover 1997). In
general, these studies find that time pressure produces negative effects, although there are
2
specific contexts where time pressure does not affect or can positively affect auditor judgment.1
A recent survey of public company auditors indicates that the timeliness of completing audit
fieldwork is associated with audit quality (Christensen et al. 2014). In this study we use archival
evidence to examine broadly whether deadline imposed time pressure affects audit quality.
Auditors of public companies with periodic Securities and Exchange Commission (SEC)
reporting requirements subject auditors to a compressed timeframe in which to obtain sufficient
evidence to form a basis for their opinion on the financial statements. Thus, periodic financial
reporting deadlines create deadline imposed time pressure. Although prior experimental and
qualitative findings suggest deadline imposed time pressure produces negative effects in general,
consistent evidence from qualitative, experimental, and archival methodologies can strengthen
the robustness of findings and enhance the generalizability of results by mitigating concerns
about internal and external validity (Allee et al. 2007).2
We construct our proxy for deadline imposed time pressure by identifying the date of the
auditor’s report and counting the days between the audit report date and a company’s required
10-K filing deadline. We use the audit report date because it is the date the auditor has gained
sufficient evidence to form the opinion on the financial statements.3 We consider firms to be
under high deadline pressure when the audit report date is near (within seven days), at, or slightly
1 For example, Glover (1997) finds that deadline pressure can reduce the influence of irrelevant information on
auditors’ judgment. 2 See Allee et al. (2007) as an example of the benefit of examining a research question with multiple methodologies.
Although they examine an unrelated research question, they use archival data to complement prior experimental
findings. 3 Although it may be argued that substantial evidence has been gathered by the time earnings are released, the
earnings release is not audited and firms insist that audit procedures are typically still in process after the earnings
release (see U.S. Securities and Exchange Commission (SEC). 2002a. Summary of Comments Relating to Proposed
Amendments to Accelerate Periodic Report Filing Dates and Disclosure Concerning Website Access to Reports.
Release No. 33-8089. Washington, D.C.: SEC. Available at: http://www.sec.gov/rules/extra/33-8089summary.htm.)
In addition, prior research finds that since 2002, the earnings announcement release lag has shortened. Bronson et
al. (2014) find that only 32 percent of companies waited until the date of the auditor’s report to release earnings in
2004 and this percentage declined even further to less than 10 percent by 2011.
3
beyond the original (or extended) required filing deadline. We proxy for compromised audit
quality using material misstatements (as revealed through subsequent financial statement
restatements) and the subsequent receipt of an SEC comment letter related to a company’s Form
10-K for Generally Accepted Accounting Principles (GAAP) or disclosure related issues—
consistent with findings in a recent survey of auditors and investors that both financial statement
restatements and SEC comment letters are leading indicators of lower audit quality (Christensen
et al. 2014). In our analysis, we control for variables that have been shown in prior literature to
affect our measures of audit quality.
We find a positive association between audits completed under deadline imposed time
pressure and our measures of compromised audit quality.4 We find consistent results using a
matched sample based on the propensity to be under high deadline imposed time pressure. These
results are robust to: (1) separately examining subsamples of large (i.e., large accelerated filers),
mid-size (i.e., accelerated filers), and small (i.e., non-accelerated filers) companies with a similar
required deadline; (2) controlling for internal deadline pressure; (3) controlling for engagement-
level budget pressure; (4) excluding companies with high uncertainty (i.e., high volatility in
revenues); (5) excluding companies that release fourth quarter earnings well in advance of the
audit report date; and (6) different types of misstatements (i.e., those related to accounts or
transactions that are typically completed late in the audit process and all others). In additional
analyses, we examine whether auditors with more resources are able to mitigate the negative
effect of deadline imposed time pressure. With certain exceptions, we find little evidence to
suggest that large auditors (Big N auditors), auditors in larger offices, and auditors of clients with
4 In terms of economic magnitude, the odds of misstatement (subsequent receipt of an SEC comment letter) among
companies where the audit report date is on the required SEC filing deadline is 40 (17) percent higher than the odds
of misstatement (subsequent receipt of an SEC comment letter) among companies whose audit report date is not on
the required filing deadline.
4
non-busy season fiscal year-ends are able to effectively mitigate the negative impact of deadline
imposed time pressure on audit quality. Consistent with the negative effects of deadline imposed
time pressure found in prior experimental studies, our findings suggest that auditors completing
procedures at or near the required filing deadline (or extended deadline) may compromise audit
quality, consistent with regulator concerns of foregoing audit procedures or obtaining less than
sufficient evidence to meet the required filing deadline.
These findings also have implications for regulators, standard setters, academics, audit
professionals, and investors. Initiatives to identify observable indicators of audit quality are on
the agendas of the International Auditing and Assurance Standards Board (IAASB 2013), the
Public Company Accounting Oversight Board (PCAOB 2012b, 2013, 2014), the American
Institute of Certified Public Accountants (AICPA 2014), the Center for Audit Quality (CAQ
2014), as well as audit firms themselves (KPMG 2011; PwC 2014). Although the opening quotes
from the PCAOB suggest a concern with the potential negative effect of deadline imposed time
pressure, the PCAOB’s discussion of audit quality indicators (AQI) does not include a measure
of the timeliness of the completion of audit fieldwork (PCAOB 2013). Our results suggest that,
in addition to the other potential AQIs suggested by the PCAOB, a potentially observable
indicator of audit quality would be the date the auditors completed fieldwork. Prior to 2009, that
date coincided with the auditor’s report date. However, this reporting convention changed in
response to Statement of Financial Accounting Standards (SFAS) No. 165 (now codified in
Accounting Standards Codification (ASC) Topic 855). SFAS No. 165, issued in 2009, requires
companies to evaluate subsequent events through the date the financial statements are issued
(i.e., the filing date of the financial statements with the SEC). In response to this change in
GAAP, current auditor practice is to date the audit report in conjunction with the filing of the
5
financial statements with the SEC. As such, users of the financial statements have less visibility
into when auditors obtain sufficient audit evidence to support their opinion and therefore, less
opportunity to identify auditors under heightened deadline imposed time pressure. Although
unintentional, this highlights one potential negative effect of SFAS No. 165 (ASC 855). We
believe this has important implications for the PCAOB’s project regarding potential AQIs and
their project to improve the auditor’s reporting model.5 Our findings suggest that an important
AQI could be provided in the auditor’s report in the form of dual-dating of the audit opinion to
clearly convey the date of the end of audit fieldwork (first date) as well as the date through which
subsequent events were considered (second date). Therefore, our findings suggest in the
PCAOB’s consideration of additional communication and enhancements to the auditors’ report,
they consider requiring auditors to report the date fieldwork was completed.
The remainder of the paper is organized as follows. We discuss prior research and
develop our hypothesis in Section II. We provide a description of our sample selection and
empirical methods in Section III. We describe our results in Section IV. In the final section, we
summarize the key results and provide conclusions.
II. PRIOR LITERATURE AND HYPOTHESIS DEVELOPMENT
Ordonez and Benson (1997, 122) state the following:
“Time constraint exists whenever there is a time deadline, even if the person is able to
complete the task in less time. Time pressure indicates that the time constraint induced
some feeling of stress and created a need to cope with the limited time.”
The increased levels of stress associated with time pressure, impacts cognitive processes
(Lundberg 1993; Maule and Hockey 1993) and negates benefits obtained from receiving training
5 In August 2013, the PCAOB issued for public comment proposed auditing standards and related amendments on
the auditor’s report. Proposed enhancements include the communication of critical audit matters, new elements of
the report related to auditor independence, auditor tenure, the auditor’s responsibilities for other information outside
the financial statements, and enhanced communication related to auditors’ responsibilities for fraud.
6
in a specific task (Zakay and Wooler 1984). DeZoort (1998) suggests two primary types of time
pressure in the audit literature: time budget pressure and time deadline pressure.6 Deadline
pressure arises from the anticipation of penalties (implicit and/or explicit) of not meeting a goal
by a predetermined point in time (Hogarth 1990). Mano (1990) posits that in daily life
individuals adjust their actions to avoid the penalties associated with missing deadlines. These
adjustments in action can include working faster at the task at hand, lowering the quality of
performance on the task, or disregarding less important tasks. In our study, we refer this type of
time pressure as deadline imposed time pressure.
Although time budget pressure and deadline imposed audit pressure are often related and
overlapping, prior research suggests they are not identical. Kelley et al. (1999) survey both Big-
6 and non Big-6 auditors (audit staff and seniors) and find that senior auditor respondents report
that they face deadline imposed time pressure more often than time budget pressure. Seniors
report that they experience more pressure and stress from deadline imposed time pressure than
from time budget pressures. Staff auditors report that they face deadline imposed time and
budget pressures equally, and report equal pressure and stress from each. Both senior and staff
auditors associate poorer audit quality with time budget pressure than with deadline imposed
time pressure. Christensen et al. (2014) survey audit professionals and investors and find that
audit partners view the timely completion of the audit as relating to higher quality, but neither
audit partners nor investors view profitability as being related to quality, suggesting time
pressure rather than budget pressure affects audit quality.
Several experimental studies find, in general, that time pressure can negatively impact
audit quality (see e.g., Rhode 1978; Alderman and Deitrick 1982; Kelley and Margheim 1990;
6 See DeZoort and Lord (1997) and DeZoort (1998) for a discussion of research that examines time budget pressure.
7
McDaniel 1990; Ragunathan 1991; Willet and Page 1996; Bennett et al. 2014). However, prior
research also suggests that this negative impact may depend on the type of time pressure (i.e.,
time budget pressure vs. deadline imposed time pressure), the setting (i.e., the risk of
misstatement), and the experience of the auditor. Margheim et al. (2005) find that although both
time budget and deadline imposed time pressures increase stress levels, deadline imposed time
pressure does not affect all levels of auditors the same. In their experiment, they find that staff
auditors under deadline imposed time pressure will exhibit more dysfunctional behaviors that
negatively affect audit quality than senior auditors in the same setting.7 Coram et al. (2004)
examine experimentally whether auditors faced with differing levels of both budget time
pressure and the risk of misstatement will respond with reduced audit quality choices (i.e.
accepting doubtful audit evidence and truncating a selected sample). They find that auditors will
accept doubtful audit evidence when working under high budget time pressure, regardless of
whether the risk of misstatement is high or low. Coram et al. (2004) also find that auditors will
truncate a selected sample when time pressure is high, but only when the risk of misstatement is
low. Other experimental studies have examined whether the experience of the auditor
determines whether time pressure affects audit quality. Bamber and Bylinski (1987) examine
how managers estimate review hours needed (opinion formulation phase) to review audit testing
on accounts that are either generally considered material or immaterial. Audit deadline imposed
time pressure is manipulated between groups when the managers are estimating the time actually
needed to review accounts. They find that managers budget more time for accounts that are
material and accounts identified as critical in the planning phase. When estimating the time
7 Margheim et al. (2005) report that both staff and senior auditor subjects exhibit dysfunctional behaviors when
faced with time deadline pressure, although the staff auditors are expected to exhibit a larger variety of
dysfunctional behaviors.
8
actually needed to review accounts when audit testing is completed, time pressure had no effects
on the managers’ judgments.
Prior experimental studies focusing exclusively on deadline imposed time pressure
generally suggest that it has a negative effect on auditor judgments and decisions. For example,
McDaniel (1990) examines whether audit effectiveness is decreased in the presence of deadline
imposed time pressure and a structured audit program. She finds that greater levels of deadline
imposed time pressure result in more errors in auditing inventory, regardless of whether a
structured audit program is used. In contrast, Glover (1997) finds that deadline imposed time
pressure can reduce the influence of irrelevant information on auditors’ judgment. Consistent
with this finding, Choo (1995) finds that auditors’ judgment improved when deadline imposed
time pressure moved from low to moderate levels. However, Choo (1995) finds that when
deadline imposed time pressure moves from moderate to high levels, auditors’ judgment
performance declines, due to the disregard of relevant cues. Psychology research shows that
time pressure and job effectiveness exhibit an inverted U-shaped function (Easterbrook 1959).
Choo (1995) finds that this theory has the highest explanatory power for his results. A typical
audit would be at the uppermost point of the inverted U-shaped function (i.e. a standard audit
will have a moderate level of deadline imposed time pressure). Therefore as deadline imposed
time pressure increases in an audit, the job effectiveness will decrease. McDaniel (1990)
supports this argument and sets up her study where the lowest level of deadline imposed time
pressure is at the apex of the U-shaped function.
Additionally, prior research also provides some evidence that the cause of the deadline
imposed time pressure influences whether time pressure affects audit quality. Bennet and
Hatfield (2014) perform an experiment examining whether deadline imposed time pressure
9
affects auditors’ judgments about materiality and sufficiency of audit evidence in relation to
reporting on the effectiveness of internal control over financial reporting. They find that auditors
under deadline imposed time pressure assess a higher level of materiality thus reducing sample
sizes when they are, at least in part, responsible for the deadline imposed time pressure (i.e.,
started internal control testing late in the year, etc.).
Although the effect of time pressure, including deadline pressure, on audit quality has
been examined experimentally, there is a dearth of archival studies related to this topic. One
related archival study by Lambert et al. (2014) examines whether mandated changes in required
filing deadlines (shortening of required filing deadlines) negatively impacts earnings quality. In
periods of shortened deadlines, they find higher discretionary accruals. Blankley et al. (2014)
examines the relationship between audit report lags and future restatements and find that higher
abnormal audit report lags have a greater likelihood of future restatement.8 Another study by
Lopez and Peters (2012) examines whether auditor workload compression, measured as the
number of clients within an auditor office with a similar fiscal year-end, affects audit quality.
They find Big-N auditors with greater workload compression have larger discretionary accruals.
These studies suggest that shortened filing deadlines and more compressed auditor workloads
can have a negative effect on clients’ earnings quality.
Public companies with required reporting deadlines subject auditors to a compressed
timeframe in which to obtain sufficient evidence to form a basis for their opinion on the financial
statements. When auditors are completing required audit procedures at or very near the SEC 10-
8 In additional analysis, Blankley et al. (2014) include an indicator variable in their restatement model for whether
the company is within 5 days of the SEC deadline. They do not find a significant result on this variable, but do find
that the interaction of this indicator with abnormal audit lag is positively related to future restatements. Given that
the abnormal audit lag variable in essence captures missing an internal deadline, which we identify and include as a
control in additional analysis, and given the dynamics of accurately capturing external deadline pressure (i.e.,
identifying the right filer status and year, adjusting for weekends and holidays, etc.), we believe our results add
further insight into the direct effects of external deadline imposed time pressure on audit quality.
10
K filing deadline the deadline imposed time pressure is high and may compromise audit quality.
Thus, we hypothesize the following (stated in the alternative form):
Hypothesis: Audit quality is lower for auditors under tight deadline imposed time
pressure relative to auditors under less deadline imposed time pressure.
III. SAMPLE SELECTION AND RESEARCH DESIGN
Sample Selection
Our sample is comprised of all client-year observations with a fiscal year-end between
June 1, 2000 and June 15, 2009 with sufficient data from Compustat, the Center for Research in
Security Prices (CRSP), and Audit Analytics to construct our model variables. We exclude
foreign filers subject to different filing deadlines,9 as well as client-year observations where the
company delists from a public stock exchange between the filing date and the subsequent year
filing date.10 Our sample period begins in 2000 due to availability of restatement data, and ends
in 2009 due to changes in practice related to the dating of audit reports as a result of accounting
standard changes. In May 2009, the Financial Accounting Standards Board (FASB) issued
SFAS No. 165, Subsequent Events (now codified in ASC 855), effective for fiscal years ending
after June 15, 2009. Before the issuance of SFAS No. 165, auditors would date their report when
sufficient evidence was obtained to support the audit opinion. As such, in many instances, the
auditor dated the audit opinion before the financial statements were widely distributed.
Following the adoption of SFAS No. 165, public companies are required to evaluate subsequent
events through the financial statement filing date. Although there are no auditor requirements in
9 Foreign filers are identified using Audit Analytics variable FORM_FKEY. We exclude those where
FORM_FKEY is listed as 20-F or 40-F. We only include observations where FORM_FKEY is listed as 10-K,
10KSB, or 10-K405. 10 We identify observations of delisting due to bankruptcy, liquidation, or other events using Compustat variable
DLRSN. We exclude observations where DLRSN equals 02 (bankruptcy), 03 (liquidation), 07 (Other - no longer
files with SEC among other reasons but pricing continues), 09 (now a private company), or 10 (Other - no longer
files with SEC among other reasons).
11
the standard, auditors began dating their opinions on the date the financial statements are filed
with the SEC.11
To examine whether the practice of dating of the audit report date changed after SFAS
No. 165, we provide descriptive statistics of the reporting lag (the number of days between the
company’s fiscal year-end and the filing of the 10-K), the audit report lag (the number of days
between the company’s fiscal year-end and the date of the auditor’s report), and the number of
days between the audit report date and the 10-K filing date (DAYSBTW). We obtain dates for
all company-year observations filing a 10-K, 10-KSB, or 10-K405 in Audit Analytics from 2000
through 2013. Table 1 provides the distributions of each of these variables in both the pre- and
post-SFAS No. 165 periods. Panel A provides the distributions for all available company-year
observations and Panel B provides the distributions for all company-year observations with a Big
N auditor. In the pre-SFAS No. 165 period, we find that mean reporting lag is approximately 81
days while the mean audit report lag is approximately 61 days. In the post-SFAS No. 165
period, the mean reporting lag is approximately 74 days while the mean audit report lag is
approximately 72 days. In addition, the distribution of the number of days between the audit
report date and the filing date (DAYSBTW) varies widely in the pre-SFAS No. 165 period,
while in the post-SFAS No. 165 period, the entire distribution is close to zero providing
empirical support for the practice of dating the audit report close to or on the date of filing.
Next, we perform tests of our hypothesis by first identifying the required filing deadline
for each company-year observation in the sample. We calculate the required filing date using the
company’s fiscal year-end and adding the appropriate number of days based on the company’s
11 The PCAOB Standing Advisory Group discussed this in their meeting on July 15, 2010. A webcast of the
discussion can be found at http://pcaobus.org/News/Webcasts/Pages/07152010_SAGMeeting.aspx
12
filer status and fiscal year, adjusted for holidays and weekends.12 Historically, SEC registrants
had ninety days to file the annual report. However, in September 2002, the SEC approved a
Final Rule that changed the deadlines for submitting periodic financial reports (e.g., 10-K and
10-Q) for accelerated filers. Accelerated filers are SEC registrants that have a public float of at
least $75 million, have been subject to the SEC’s reporting requirements for at least twelve
calendar months, previously have filed at least one annual report, and are not eligible to file their
quarterly and annual reports on Forms 10-QSB and 10-KSB. Beginning in December 2003,
accelerated filers are required to file their annual financial reports within 75 days of the
company’s fiscal year-end. Although the SEC’s rule would eventually shorten this window to 60
days, this ruling was postponed and eventually, in 2005, overruled. In December 2005, the SEC
voted to adopt amendments to create a new category of large accelerated filers, which would
include companies with a public float of $700 million or more. Large accelerated filers were
subject to a sixty-day window to file the annual report. For further details on the SEC’s Final
Rules and current reporting requirements, refer to Appendix A.
Next, we identify the number of days between the audit report date (using Audit
Analytics variable SIG_DATE_OF_OP_S, which is the signature date on the audit opinion) and
the required filing deadline. We then reconcile to Audit Analytics’ Non-timely Filer Information
and Analysis database to determine if the observations in our sample where the audit report date
follows the required filing deadline filed an NT 10-K. If an SEC registrant cannot file Form 10-
K within the required filing deadline, the company must file within one business day of the due
12 We adjust required filing deadlines falling on weekends by utilizing the SAS command ‘weekday’. When the
calculated required filing deadline falls on a weekend (i.e., Saturday or Sunday), we change the required filing
deadline to the following Monday. We also obtain a list of holidays when the stock exchanges are closed for trading
and adjust the required filing deadline to the next weekday (see http://nyseholidays.blogspot.com/2012/11/nyse-
holidays-from-2000-2010.html).
13
date a Form 12b-25 (designated as an “NT 10-K” in the EDGAR filing system). If the company
is unable to file “without unreasonable effort or expense” then the report will be deemed filed on
time if the company files an NT 10-K and then files the annual report no later than the 15th
calendar day following the due date for the missed report. From this procedure we find very few
discrepancies, suggesting minimal error in identifying the required filing date. For each
discrepancy identified, we manually adjust the required filing deadline based on review of the
related SEC filings in EDGAR.
Table 2 presents our sample selection procedures and the composition of the samples for
both of our audit quality measure tests. When audit quality is measured using misstatements, our
sample consists of 31,676 company-years with available data to construct model variables.
When audit quality is measured using the subsequent receipt of a GAAP or disclosure related
SEC comment letter, our sample consists of 31,608 company-year observations. We find that for
65.3 percent of each sample, the audit report date precedes the required filing deadline by more
than a week. We find that the audit report date is within a week of the required filing deadline
for 24.1 percent of the samples and on the required filing deadline for 5.2 percent of the samples.
We find that 5 percent of the samples file an NT 10-K and subsequently file within the fifteen-
calendar-day extension provided by the SEC, where 3.5 percent later file within twelve calendar
days and 1.5 percent file in the last three days. For the samples, 0.4 percent file late (during the
thirty days after the fifteen day extension provided by filing an NT 10-K). We exclude
company-years from the samples where the 10-K is filed more than thirty days after the extended
deadline.
14
Research Design
To test our hypothesis of whether deadline imposed time pressure affects audit quality,
we measure deadline imposed time pressure as the proximity of the auditor’s report date to the
required filing deadline and measure audit quality in two ways. DeFond and Zhang (2014) state
that each proxy for audit quality has its own strengths and weaknesses and that no single proxy
portrays a complete picture. As such, they recommend that researchers examine different
measures when making inferences about audit quality. In a recent survey, Christensen et al.
(2014) find that auditors and investors believe that financial statement restatements and the
receipt of SEC comment letters are the two leading indicators of lower audit quality. As such,
we measure audit quality using material misstatements (as revealed through subsequent financial
statement restatements) and the subsequent receipt of a GAAP or disclosure related SEC
comment letter related to a company’s Form 10-K.
Misstatements
We first capture audit quality using material misstatements (revealed through subsequent
financial statement restatements). Restatements are identified using Audit Analytics’ Non-
Reliance Restatements database. Because auditing standards require the auditor to plan and
perform the audit to obtain reasonable assurance about whether the financial statements are free
of material misstatement (PCAOB 2003), a subsequently revealed misstatement suggests that the
auditor failed to detect and/or report the misstatement. A number of studies use misstatements to
proxy for audit quality (e.g., Kinney et al. 2004; Stanley and DeZoort 2007; McGuire et al. 2012;
Schmidt 2012; Francis and Michas 2013; and Lobo and Zhao 2013).
To test our hypothesis where audit quality is measured using material misstatements, we
estimate the following logistic regression model:
15
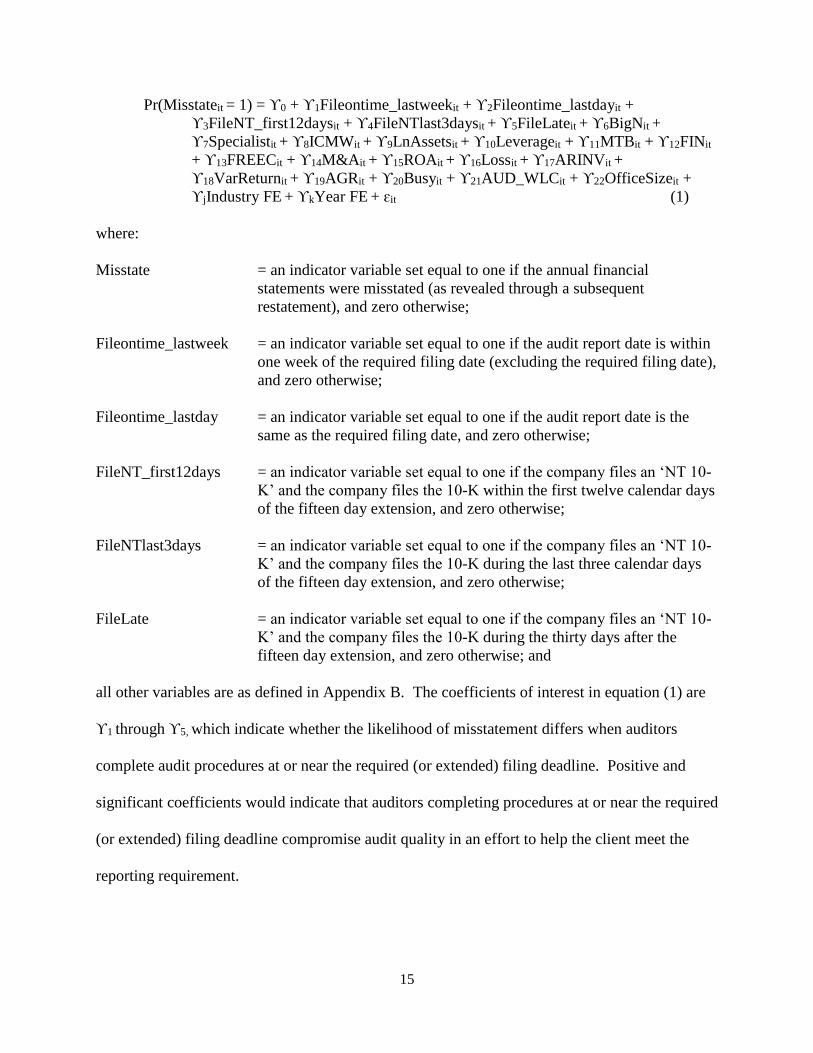
Pr(Misstateit = 1) = ϒ0 + ϒ1Fileontime_lastweekit + ϒ2Fileontime_lastdayit +
ϒ3FileNT_first12daysit + ϒ4FileNTlast3daysit + ϒ5FileLateit + ϒ6BigNit +
ϒ7Specialistit + ϒ8ICMWit + ϒ9LnAssetsit + ϒ10Leverageit + ϒ11MTBit + ϒ12FINit
+ ϒ13FREECit + ϒ14M&Ait + ϒ15ROAit + ϒ16Lossit + ϒ17ARINVit +
ϒ18VarReturnit + ϒ19AGRit + ϒ20Busyit + ϒ21AUD_WLCit + ϒ22OfficeSizeit +
ϒjIndustry FE + ϒkYear FE + ɛit (1)
where:
Misstate = an indicator variable set equal to one if the annual financial
statements were misstated (as revealed through a subsequent
restatement), and zero otherwise;
Fileontime_lastweek = an indicator variable set equal to one if the audit report date is within
one week of the required filing date (excluding the required filing date),
and zero otherwise;
Fileontime_lastday = an indicator variable set equal to one if the audit report date is the
same as the required filing date, and zero otherwise;
FileNT_first12days = an indicator variable set equal to one if the company files an ‘NT 10-
K’ and the company files the 10-K within the first twelve calendar days
of the fifteen day extension, and zero otherwise;
FileNTlast3days = an indicator variable set equal to one if the company files an ‘NT 10-
K’ and the company files the 10-K during the last three calendar days
of the fifteen day extension, and zero otherwise;
FileLate = an indicator variable set equal to one if the company files an ‘NT 10-
K’ and the company files the 10-K during the thirty days after the
fifteen day extension, and zero otherwise; and
all other variables are as defined in Appendix B. The coefficients of interest in equation (1) are
ϒ1 through ϒ5, which indicate whether the likelihood of misstatement differs when auditors
complete audit procedures at or near the required (or extended) filing deadline. Positive and
significant coefficients would indicate that auditors completing procedures at or near the required
(or extended) filing deadline compromise audit quality in an effort to help the client meet the
reporting requirement.
16
Control variables follow prior literature. We control for auditor characteristics, company
characteristics, and transactions that have been shown to affect the likelihood of misstatement to
the extent that these variables are widely available for our sample (e.g., Dechow et al. 1996;
Summers and Sweeney 1998; Kinney et al. 2004; Blankley et al. 2012; Cao et al. 2012; Lobo and
Zhao 2013). In addition, because clients with greater financial reporting risk may be more likely
to file at or near the reporting deadline, we control for financial reporting risk using a
commercially-developed accounting and governance risk score (AGR). Charles et al. (2010)
find that AGR scores effectively proxy for an element of risk beyond what has traditionally been
captured by various risk measures in audit fee models. Prior research also finds that AGR scores
perform as well or better than academic measures and other commercially-developed measures,
including the F-score, at detecting misstatements (see e.g., Price et al. 2011 and Daines et al.
2010). We also include controls for auditor resource constraints. Lopez and Peters (2012) find
evidence that workload pressures, as proxied by the audit busy season and auditor workload
compression, within an office are associated with lower audit quality (greater magnitudes of
abnormal accruals). We include industry and year fixed effects to control for variation in
misstatements across industry and time, and we cluster standard errors by company to control for
serial dependence (Petersen 2009).
SEC Comment Letters
We also capture audit quality using the subsequent receipt of a GAAP or disclosure
related SEC comment letter related to a company’s Form 10-K. Receipt of such a letter would
indicate a potential deficiency in the appropriate application of or disclosure required by GAAP.
Prior research suggests that SEC comment letters are negatively correlated with input measures
of audit quality such as the use of a large auditor and unexplained audit fees and positively
17
correlated with indicators of poor corporate governance (see Cassell et al. 2013 and Hribar et al.
2014). Additionally, in a survey of audit professionals, Christensen et al. (2014) find that SEC
comment letters and enforcement actions were the second most frequently mentioned publicly
available signals of low audit quality (restatements being the most frequently mentioned signal).
To test our hypothesis where audit quality is measured using the subsequent receipt of an
SEC comment letter, we estimate the following logistic regression model:
Pr(Commentletterit =1) = α0 + α1Fileontime_lastweekit + α2Fileontime_lastdayit +
α3FileNT_first12daysit + α4FileNTlast3daysit + α5FileLateit + α6LnMVEit + α7Ageit
+ α8Leverageit + α9MTBit + α10FINit + α11M&Ait + α12Lossit + α13ICMWit +
α14Restateit + α15Rank_zscoreit + α16VarReturnit + α17BigNit + α18Secondtierit +
α19Specialistit + α20AGRit + α21Busyit + α22AUD_WLCit + α23OfficeSizeit +
αjIndustry FE + αkYear FE + ɛit (2)
where:
Commentletter = an indicator variable set equal to one if the company receives a GAAP or
disclosure related SEC comment letter related to a company’s Form 10-K
during the twelve months subsequent to the annual report filing date, and
zero otherwise; and
all other variables are as defined in Appendix B. Similar to the misstatement test, the
coefficients of interest in equation (2) are α1 through α5, which indicate whether the receipt of a
GAAP or disclosure related SEC comment letter in the subsequent year differs when the auditor
completes audit procedures at or near the required filing deadline.
Following Cassell et al. (2013), we control for company size, age, leverage, growth, the
extent of financing, merger and acquisition activity, financial distress, the presence of a material
weakness in internal controls over financial reporting, the announcement of prior financial
reporting misstatements, volatility in stock returns, auditor characteristics, and financial
reporting risk. In addition, we include controls for auditor resource constraints, industry and
18
year fixed effects to control for variation across industry and time, and we cluster standard errors
by company to control for serial dependence (Petersen 2009).
Propensity-Score Matched Samples
To alleviate concerns that the relation between external deadline pressure and audit
quality is driven by risk factors likely influencing the deadline pressure, we also test our
Hypothesis using propensity-score matched (PSM) samples. Matched samples are typically used
to deal with nonlinearities that are not well specified (Cram et al. 2009). Rosenbaum and Rubin
(1983) propose a matching technique using a function of covariates rather than by separately
matching covariates. We obtain PSM samples by first grouping company-year observations in
each of our external deadline pressure categories (Fileontime_lastweek, Fileontime_lastday,
FileNT_first12days, FileNT_last3days, and FileLate) into one grouping, which we label
Ext_Deadline_Press. We then estimate the propensity to be a company with external deadline
time pressure using the following probit regression:
Pr(Ext_Deadline_Pressit = 1) = β0 + β1BigNit + β2Specialistit + β3ICMWit + β4LnAssetsit +
β5Leverageit + β6MTBit + β7FINit + β8FREECit + β9M&Ait + β10ROAit + β11Lossit
+ β12ARINVit + β13VarReturnit + β14AGRit + β15Rank_zscoreit + β16Busyit +
β17AUD_WLCit + β18OfficeSizeit + βjIndustry FE + βkYear FE + ɛit (3)
where:
Ext_Deadline_Press = an indicator variable set equal to one if the company is in one of the
external deadline time pressure categories (i.e., Fileontime_lastweek,
Fileontime_lastday, FileNT_first12days, FileNT_last3days, and
FileLate ), and zero otherwise; and
all other variables are as defined in Appendix B. For each company-year observation where
Ext_Deadline_Press equals one, we identify the company-year observation where
Ext_Deadline_Press equals zero with the closest propensity score (where the difference in
propensity score does not exceed 0.5). This procedure generates 4,811 successful matches for
19
the misstatement test and 4,795 successful matches for the SEC comment letter test. Panel B of
Table 6 provides the differences in mean and median values for these control variables between
the external deadline pressure observations and the control observations. Although we do not
achieve covariate balance for all variables (BigN, Specialist, ICMW, Leverage, ROA, Loss,
Rank_zscore, AGR, Busy, AUD_WLC, and OfficeSize), we note that the differences in the mean
and median values of these variables between the treatment and matched sample, although
statistically significant, are similar in magnitude. Additionally, we control for each of these risk
characteristics in our tests.
IV. EMPIRICAL RESULTS
Correlations
Table 3 presents the correlations of our audit quality measures and our variables
capturing deadline imposed time pressure. We do not find significant positive correlations
between our audit quality measures suggesting that these measures capture different aspects of
audit quality. We find that misstatements are positively correlated with companies filing during
the extension period (i.e., those filing an NT disclosure) and those that file after the extension
period. We find that the subsequent receipt of an SEC comment letter related to GAAP or
disclosure issues in the 10-K is positively correlated with each of our measures of deadline
imposed time pressure with the exception of filing during the first twelve days of the extension
period.
Tests of Hypothesis
Misstatements
Table 4 presents the results of the test of our Hypothesis using misstatements as a proxy
for audit quality and Panel A provides descriptive statistics for the sample. Panel B provides the
results of our test. We find that the area under the ROC curve is close to 0.7, which indicates
20
adequate model fit (Hosmer and Lemeshow 2000). After controlling for financial reporting risk
and company and auditor characteristics that have been shown to affect the likelihood of
misstatement, we find a greater likelihood of misstatement when the audit report date is near, at,
or slightly beyond the original required filing deadline relative to companies with an audit report
date preceding the required filing deadline by more than a week. Although the likelihood of
misstatement is greater for companies with an audit report date within a week of the required
filing deadline relative to companies with an audit report date preceding the required filing
deadline by more than a week, tests of equality of the coefficients between Fileontime_lastweek,
Fileontime_lastday, FileNT_first12days, FileNT_last3days, and FileLate reveal that the
likelihood of misstatement for companies with an audit report date within a week of the required
filing deadline is less than that of companies with an audit report date on the required filing date
or during the first 12 days of the extended deadline period. We do not find a significant
difference in the likelihood of misstatement among companies with an audit report date on the
required filing deadline and companies that file an NT 10-K and then file subsequently.
Examination of the odds ratios suggests meaningful economic impact. Holding other predictor
variables fixed, the odds of having a material misstatement with high deadline imposed time
pressure over the odds of having a material misstatement without high deadline imposed time
pressure ranges from 1.110 to 1.543. In terms of percent change, the odds for high deadline
imposed time pressure companies are 11 to 54 percent higher than the odds for companies not
under high deadline imposed time pressure. These results suggest that auditors completing
21
procedures at or near the required filing deadline (or extended deadline) may compromise audit
quality in an effort to help the client meet the reporting requirement.
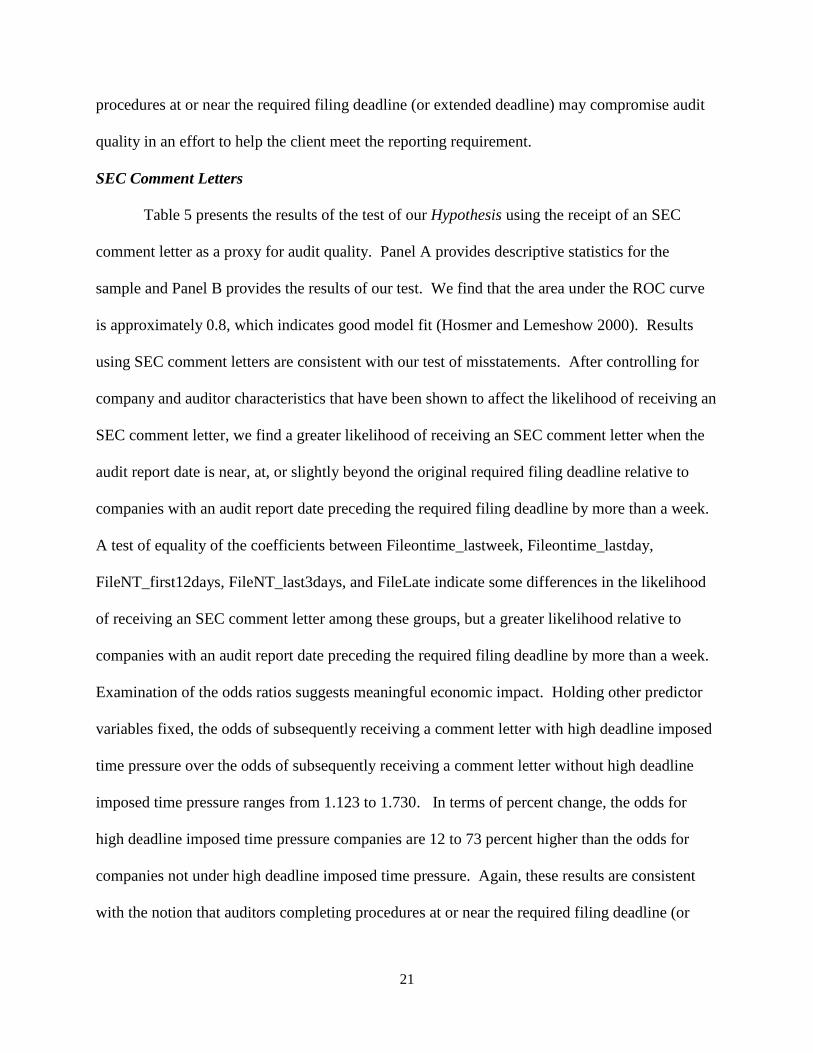
SEC Comment Letters
Table 5 presents the results of the test of our Hypothesis using the receipt of an SEC
comment letter as a proxy for audit quality. Panel A provides descriptive statistics for the
sample and Panel B provides the results of our test. We find that the area under the ROC curve
is approximately 0.8, which indicates good model fit (Hosmer and Lemeshow 2000). Results
using SEC comment letters are consistent with our test of misstatements. After controlling for
company and auditor characteristics that have been shown to affect the likelihood of receiving an
SEC comment letter, we find a greater likelihood of receiving an SEC comment letter when the
audit report date is near, at, or slightly beyond the original required filing deadline relative to
companies with an audit report date preceding the required filing deadline by more than a week.
A test of equality of the coefficients between Fileontime_lastweek, Fileontime_lastday,
FileNT_first12days, FileNT_last3days, and FileLate indicate some differences in the likelihood
of receiving an SEC comment letter among these groups, but a greater likelihood relative to
companies with an audit report date preceding the required filing deadline by more than a week.
Examination of the odds ratios suggests meaningful economic impact. Holding other predictor
variables fixed, the odds of subsequently receiving a comment letter with high deadline imposed
time pressure over the odds of subsequently receiving a comment letter without high deadline
imposed time pressure ranges from 1.123 to 1.730. In terms of percent change, the odds for
high deadline imposed time pressure companies are 12 to 73 percent higher than the odds for
companies not under high deadline imposed time pressure. Again, these results are consistent
with the notion that auditors completing procedures at or near the required filing deadline (or
22
extended deadline) may compromise audit quality in an effort to help the client meet the
reporting requirement.
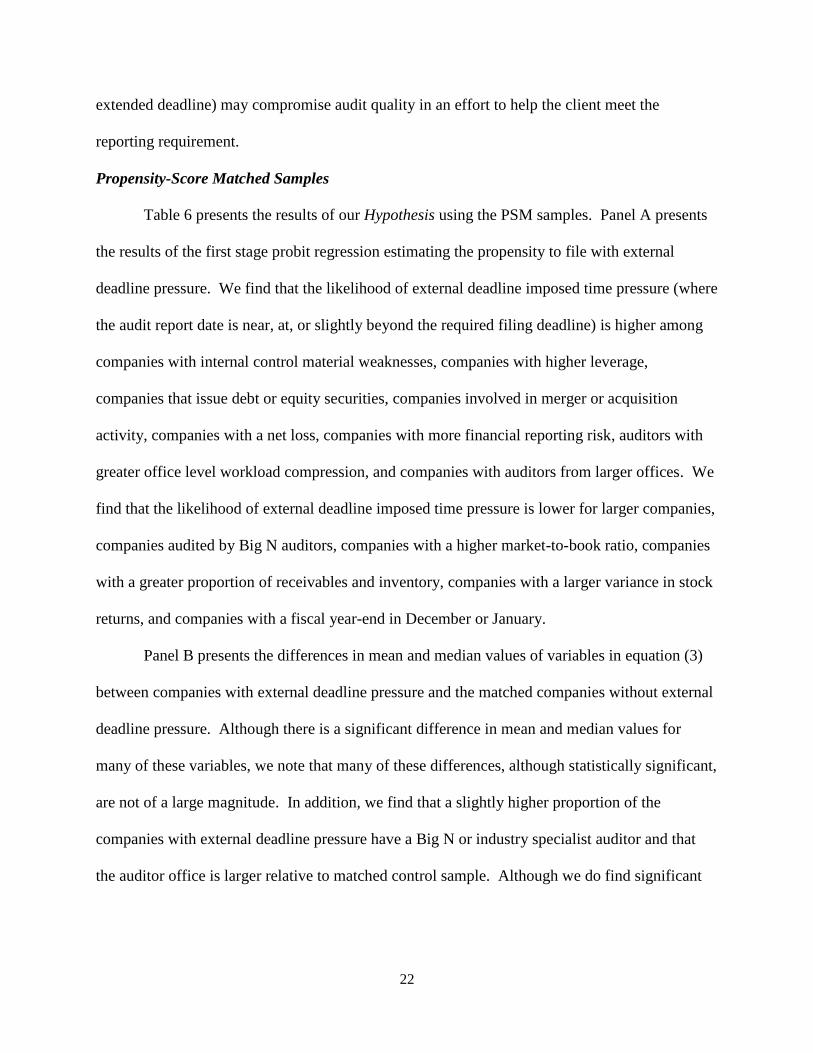
Propensity-Score Matched Samples
Table 6 presents the results of our Hypothesis using the PSM samples. Panel A presents
the results of the first stage probit regression estimating the propensity to file with external
deadline pressure. We find that the likelihood of external deadline imposed time pressure (where
the audit report date is near, at, or slightly beyond the required filing deadline) is higher among
companies with internal control material weaknesses, companies with higher leverage,
companies that issue debt or equity securities, companies involved in merger or acquisition
activity, companies with a net loss, companies with more financial reporting risk, auditors with
greater office level workload compression, and companies with auditors from larger offices. We
find that the likelihood of external deadline imposed time pressure is lower for larger companies,
companies audited by Big N auditors, companies with a higher market-to-book ratio, companies
with a greater proportion of receivables and inventory, companies with a larger variance in stock
returns, and companies with a fiscal year-end in December or January.
Panel B presents the differences in mean and median values of variables in equation (3)
between companies with external deadline pressure and the matched companies without external
deadline pressure. Although there is a significant difference in mean and median values for
many of these variables, we note that many of these differences, although statistically significant,
are not of a large magnitude. In addition, we find that a slightly higher proportion of the
companies with external deadline pressure have a Big N or industry specialist auditor and that
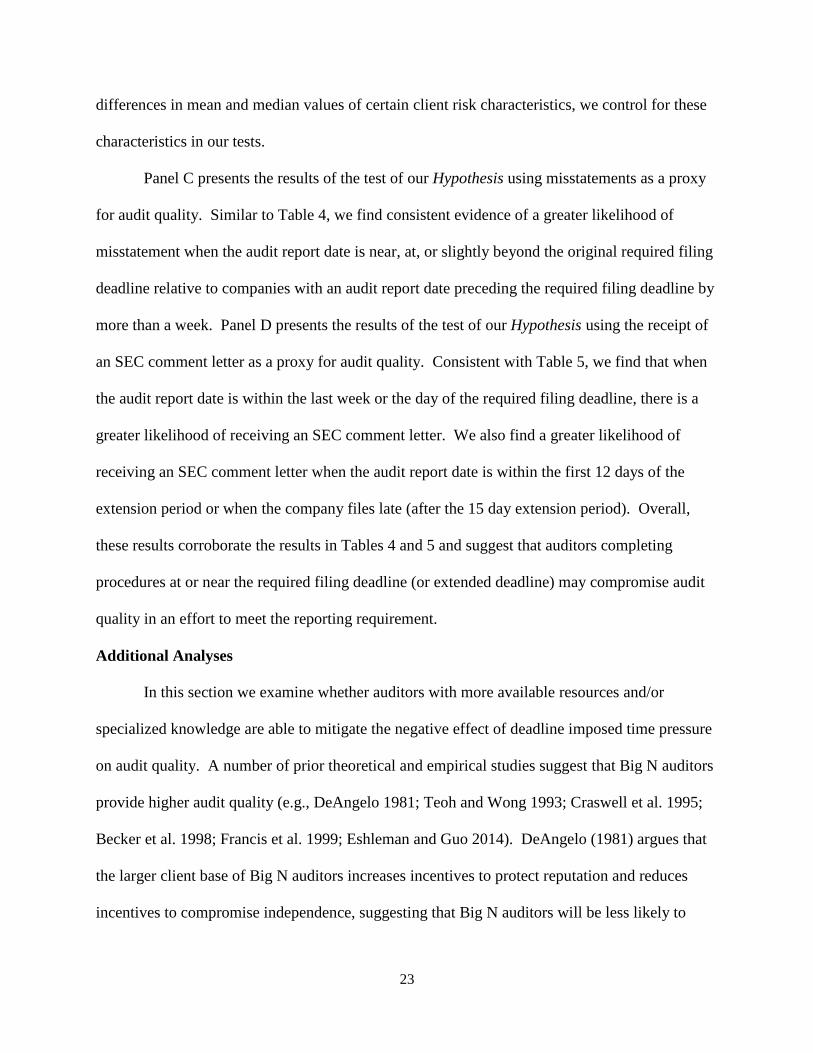
the auditor office is larger relative to matched control sample. Although we do find significant
23
differences in mean and median values of certain client risk characteristics, we control for these
characteristics in our tests.
Panel C presents the results of the test of our Hypothesis using misstatements as a proxy
for audit quality. Similar to Table 4, we find consistent evidence of a greater likelihood of
misstatement when the audit report date is near, at, or slightly beyond the original required filing
deadline relative to companies with an audit report date preceding the required filing deadline by
more than a week. Panel D presents the results of the test of our Hypothesis using the receipt of
an SEC comment letter as a proxy for audit quality. Consistent with Table 5, we find that when
the audit report date is within the last week or the day of the required filing deadline, there is a
greater likelihood of receiving an SEC comment letter. We also find a greater likelihood of
receiving an SEC comment letter when the audit report date is within the first 12 days of the
extension period or when the company files late (after the 15 day extension period). Overall,
these results corroborate the results in Tables 4 and 5 and suggest that auditors completing
procedures at or near the required filing deadline (or extended deadline) may compromise audit
quality in an effort to meet the reporting requirement.
Additional Analyses
In this section we examine whether auditors with more available resources and/or
specialized knowledge are able to mitigate the negative effect of deadline imposed time pressure
on audit quality. A number of prior theoretical and empirical studies suggest that Big N auditors
provide higher audit quality (e.g., DeAngelo 1981; Teoh and Wong 1993; Craswell et al. 1995;
Becker et al. 1998; Francis et al. 1999; Eshleman and Guo 2014). DeAngelo (1981) argues that
the larger client base of Big N auditors increases incentives to protect reputation and reduces
incentives to compromise independence, suggesting that Big N auditors will be less likely to
24
compromise audit quality even when facing deadline imposed time pressure. In addition,
because Big N auditors are larger, they may be able to effectively allocate resources in order to
avoid low quality audits when under external deadline time pressure. Thus, we examine whether
the negative effect of deadline imposed time pressure on audit quality is lower for Big N
auditors.13 Likewise, auditors in larger offices may be able to effectively allocate resources to
client engagements under deadline imposed time pressure. Francis and Yu (2009) find that audit
quality is higher among clients in larger Big 4 auditor offices. They suggest that this result is
likely due to greater knowledge and resource sharing. If auditors in larger offices are able to
effectively utilize more audit personnel when faced with external deadline pressure, audit quality
may not suffer. As such, we examine whether the negative effect of deadline imposed time
pressure is lower for auditors in large offices.14 Finally, because auditor resources may be
constrained during certain times of the year, thus reducing the effectiveness of
resource/personnel allocation, we examine whether auditors during non-busy times of the year
(non-busy season) are able to mitigate the negative effect of deadline imposed time pressure.15
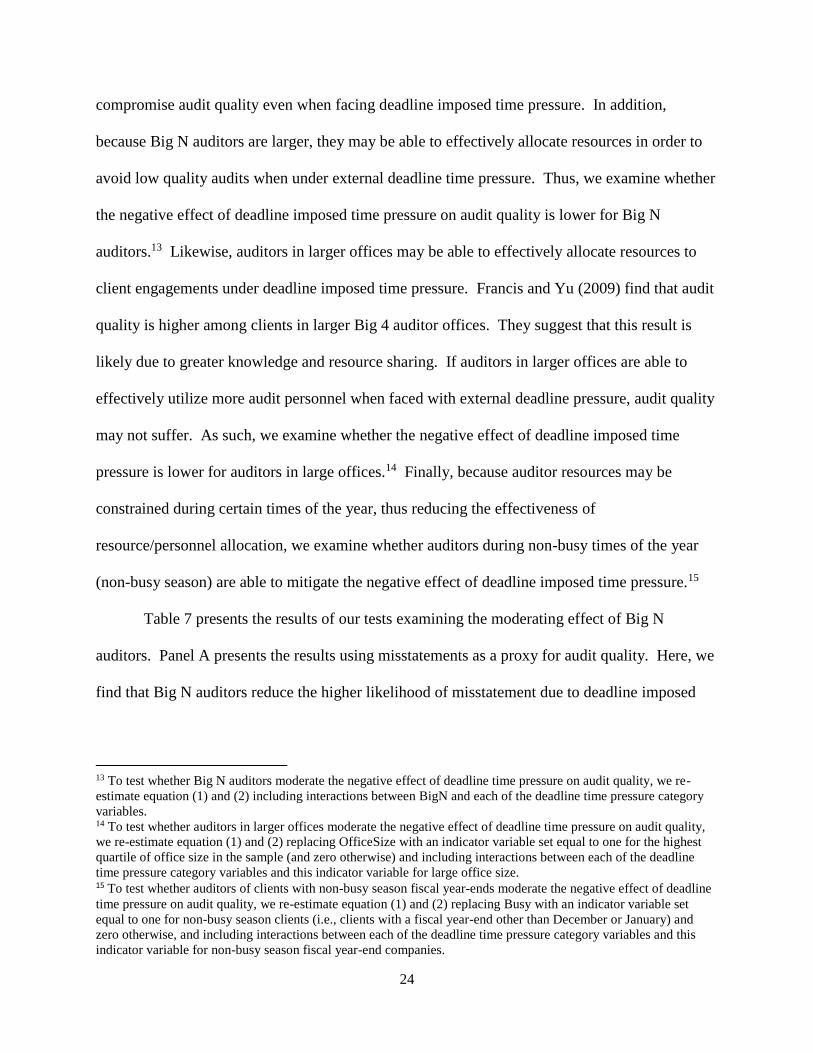
Table 7 presents the results of our tests examining the moderating effect of Big N
auditors. Panel A presents the results using misstatements as a proxy for audit quality. Here, we
find that Big N auditors reduce the higher likelihood of misstatement due to deadline imposed
13 To test whether Big N auditors moderate the negative effect of deadline time pressure on audit quality, we re-
estimate equation (1) and (2) including interactions between BigN and each of the deadline time pressure category
variables. 14 To test whether auditors in larger offices moderate the negative effect of deadline time pressure on audit quality,
we re-estimate equation (1) and (2) replacing OfficeSize with an indicator variable set equal to one for the highest
quartile of office size in the sample (and zero otherwise) and including interactions between each of the deadline
time pressure category variables and this indicator variable for large office size. 15 To test whether auditors of clients with non-busy season fiscal year-ends moderate the negative effect of deadline
time pressure on audit quality, we re-estimate equation (1) and (2) replacing Busy with an indicator variable set
equal to one for non-busy season clients (i.e., clients with a fiscal year-end other than December or January) and
zero otherwise, and including interactions between each of the deadline time pressure category variables and this
indicator variable for non-busy season fiscal year-end companies.
25
time pressure when a company files late (after the 15 day extension period). However, when the
audit report date is near or on the required filing deadline, or during the extension period, we do
not find a moderating effect. This suggests that even among large auditors, deadline imposed
time pressure negatively affects audit quality. Panel B presents the results using the receipt of an
SEC comment letter as a proxy for audit quality. Here, we do not find a moderating effect for
Big N auditors in any of the deadline time pressure categories. Taken together, although Big N
auditors are less likely to succumb to compromising audit quality when the audit report date is
after the extension period (at least in terms of misstatements), deadline imposed time pressure
appears to negatively impact audit quality, even among the largest auditors.
Table 8 presents the results of our tests examining the moderating effect of large auditor
offices. Panel A presents the results using misstatements as a proxy for audit quality. Here, we
do not find that large auditor offices reduce the higher likelihood of misstatement due to deadline
imposed time pressure. Panel B presents the results using the receipt of an SEC comment letter
as a proxy for audit quality. We only find a moderating effect on the likelihood of receiving an
SEC comment letter due to deadline imposed time pressure when a company files late (after the
15 day extension period) for large auditor offices. Thus, we find little evidence that even among
auditors in large offices, deadline imposed time pressure appears to negatively impact audit
quality.
Table 9 presents the results of our tests examining the moderating effect of auditors
during less busy times of the year (i.e., non-busy season). Panel A presents the results using
misstatements as a proxy for audit quality. Panel B presents the results using the receipt of an
SEC comment letter as a proxy for audit quality. We find consistent evidence in both tests, that
auditors are able to mitigate the negative effects of deadline imposed time pressure during the
26
early part of the extension period (i.e., during the first 12 days of the 15 day extension period).
However, we do not find a mitigating effect in any of the other time pressure categories (near or
at the required filing deadline, or at the extended deadline). Thus, even during times of the year
when auditors are less constrained, the negative effects of deadline imposed time pressure
remain.
Robustness Tests
Separate Analyses by Required Time to File
To ensure that the results from our primary analyses are not driven solely by smaller,
more problematic companies, we segregate our sample by the different deadline requirements.
Only large accelerated filers are subject to the 60 day filing requirement beginning in 2006.
Over the sample period, accelerated filers were initially subject to the 90 day requirement and
then beginning in 2006, the 75 day requirement. Non-accelerated filers, the smallest companies,
are subject to the 90 day filing requirement.
Table 10 presents the results of these tests. Panel A presents the misstatement tests.
Here, we find even with the largest filers, that deadline imposed time pressure increases the
likelihood of misstatement. Specifically, in the first column, which includes companies-years
subject to a 60 day filing requirement, we find an increased likelihood of misstatement when the
audit report date is on the required filing deadline or during the first 12 days of the NT extension.
In the second and third columns, we find evidence suggesting that deadline imposed time
pressure for companies filing within 75 days or 90 days generally increases the likelihood of
misstatement. Overall, these results suggest that external deadline pressure affects audit quality
for large, mid-size, and small companies.
27
Panel B presents the SEC comment letter tests. In general, we do not find an increased
likelihood of receiving a comment letter when examining separately companies subject to
different required filing deadlines. The only exceptions are companies filing during the first
twelve days of the extension period and those filing after the extension period that are subject to
the 75 day filing requirement, where there is an increased likelihood of receiving an SEC
comment letter. As such, it appears that on average, the effect of an increased likelihood of an
SEC comment letter only manifests in the aggregate.
Internal Deadline Pressure
Although imposed external deadlines subject auditors to a compressed timeframe in
which to obtain sufficient evidence to form a basis for their opinion on the financial statements,
companies may also exert pressure on auditors to complete audit procedures in an effort to meet
internally set deadlines.16 Prior research suggests there are potential benefits to filing the annual
report earlier (relative to the prior year). Choudhary et al. (2013) find a decrease in information
asymmetry in the form of decreased percentage changes in bid/ask spreads for companies that
file early relative to companies that file within the required filing time permitted. In addition, for
companies filing on time but near or at the externally imposed deadline, it is possible that the
reduction in audit quality is a result of internal deadline pressure rather than external deadline
pressure. As such, we examine the effect of internal deadline pressure on audit quality.
To do this, we re-estimate equations (1) and (2) including an additional variable to
capture internal deadline pressure. We examine two different measures of internal deadline
pressure. The first measure, IDP1, is an indicator variable set equal to one if the current year
16 For example, in a disciplinary proceeding issued on August 11, 2009, the PCOAB barred Thomas J. Linden from
being associated with a registered public accounting firm. This was due to the dysfunctional audit behavior of Mr.
Linden in order to help his client, Navistar, meet an internally set deadline (PCAOB 2009).
28
audit report date and filing date are within 2 days of the expected filing date (prior year filing
date adjusted forward for weekends and holidays) and the expected filing date is within the
required filing deadline, and zero otherwise. The second measure, IDP2, is an indicator variable
set equal to one if the current year audit report date and file date are within -3 to +6 days of the
expected filing date (prior year filing date adjusted forward for weekends and holidays), the audit
report date and filing date are within a day of each other, and the expected filing date is within
the required filing deadline, and zero otherwise.17
In untabulated analyses, for both measures, we continue to find an increased likelihood of
misstatement when the audit report date is near, at, or slightly beyond external deadlines
(including extended deadlines). When internal deadline pressure is measured using IDP1, we
find a lower likelihood of misstatement. When internal deadline pressure is measured using
IDP2, we do not find that internal deadline pressure affects the likelihood of misstatement. In
addition, we do not find that internal deadline pressure affects the likelihood of receiving a
GAAP or disclosure related SEC comment letter in the subsequent year related to the 10-K.
However, we continue to find consistent results with our primary tests related to external
deadline imposed time pressure. Overall, we do not find evidence suggesting that audit quality is
diminished under internal deadline pressure. However, controlling for internal deadline pressure,
we continue to find evidence suggesting that audit quality is negatively impacted, on average, by
external deadline imposed time pressure.
17 In untabulated analysis, we examine alternative measures of internal deadline pressure by altering the window of
time around the expected filing date (based on the prior year filing date for companies that filed timely, adjusted for
weekends and holidays). Results of these alternative windows are qualitatively consistent with those presented in
Table 7.
29
Engagement-level Budget Pressure
Because deadline imposed time pressure and audit engagement budget pressure can often
be related, we re-perform our tests including a control for engagement-level budget pressure. To
capture engagement-level budget pressure we take the absolute value of the percentage change in
audit fees relative to the prior year. We multiply this by negative one so that higher values of
this measure capture observations where the current year audit fee is very close to the prior year
audit fee. Because audit fee data is only available beginning in the year 2000, our sample is
reduced to fiscal years 2001 through 2009 with available audit fee data. We find results remain
robust with the inclusion of this additional control for budget pressure.
Removing Companies with High Sales Volatility
Given the possibility that companies with greater uncertainty and higher risk are more
difficult to audit and more likely to face external deadline imposed time pressure, we re-perform
our tests after excluding company-year observations with high sales volatility (over the previous
three years) in order to reduce this concern. Specifically, we rank the observations in the sample
by sales volatility and drop the highest quartile. We find consistent results in our misstatement
and comment letter tests with these subsamples.
Removing Observations where the Earnings Announcement Date is Early
Although the auditor has no responsibility for client’s public earnings announcements
and recent trends suggest that audit procedures are still in process for many companies when
fourth quarter earnings are released to the public (see e.g., Bronson et al. (2014) and U.S. SEC
Summary of Comments Relating to Proposed Amendments to Accelerate Periodic Report Filing
Dates and Disclosure Concerning Website Access to Reports. Release No. 33-8089), we re-
perform our tests after excluding observations where the fourth quarter earnings release is more
30
than twenty days or fifteen days before the audit report date. We find consistent results in our
misstatement and comment letter tests with these subsamples.
The Nature of the Restatement
We recognize that audit procedures around certain types of accounts and events are likely
to be completed late in the audit. As such, we examine misstatements of tax-related accounts,
impairments of assets (including intangible assets), and merger and acquisition related issues
separately from all other misstatements. This captures 1,210 misstated company-years (or
approximately 32 percent) of the total 3,791 misstated company-years in our sample. Among
these types of misstatements, we find consistent evidence of lower audit quality when the audit
report date is at, on, or slightly beyond the original or extended required filing deadline. When
separately examining all other types of misstatements, we find lower audit quality when the audit
report date is on the required filing deadline or during the fifteen day extension period. Thus,
while accounts that are typically audited later in the audit process have a higher likelihood of
subsequent restatement, we find evidence that the negative effects of deadline imposed time
pressure is pervasive across other types of misstatements as well.
Sensitivity Analysis of Deadline Imposed Time Pressure
In our primary analyses, we identify deadline imposed time pressure as those companies
with an audit report date within a week of the required filing deadline. In untabulated analyses,
we find consistent results with those presented when limiting this to within 6, 5 or 4 days of the
required filing deadline or expanding this to within 10 days of the required filing deadline.
V. SUMMARY AND CONCLUSION
PCAOB Staff Audit Practice Alert No. 10 (PCAOB 2012a) raises concerns that audit
scheduling can cause auditors to feel pressured to ‘complete assignments too quickly’ which can
lead to dysfunctional audit behavior (e.g. gathering easy to obtain evidence as opposed to
31
relevant and reliable evidence; insufficient amounts of evidence; giving undue weight to
confirming evidence without adequately considering contrary evidence). With these concerns in
mind, we examine whether audits completed under deadline imposed time pressure, as proxied
by the proximity of the audit report date to a company’s 10-K filing deadline, are associated with
measures of low audit quality.
We find evidence that audits that are completed under deadline imposed time pressure
(i.e., the audit report date is near, at, or slightly beyond the original (or extended) required 10-K
filing deadline) are associated with different measures of compromised audit quality. These
results are robust to: (1) separately examining subsamples of large (i.e., large accelerated filers),
mid-size (i.e., accelerated filers), and small (i.e., non-accelerated filers) companies with a similar
required deadline; (2) controlling for internal deadline pressure; (3) controlling for engagement-
level budget pressure; (4) excluding companies with high uncertainty (i.e., high volatility in
revenues); (5) excluding companies that release fourth quarter earnings well in advance of the
audit report date; and (6) different types of misstatements. We also find that these negative
effects persist among larger auditors, auditors from larger offices, and in certain circumstances
among auditors of clients with non-busy season fiscal year-ends. Our findings suggest that
auditors completing procedures at or near the required (or extended) filing deadline may
compromise audit quality in an effort to meet the reporting requirement. These results
complement and strengthen the robustness of results from prior experimental research, and
thereby mitigate concerns about internal and external validity.
Our results suggest that a potentially observable indicator of audit quality would be the
date the auditors completed fieldwork. Prior to 2009, that date coincided with the auditor’s
report date. However, the audit report date no longer is a useful indicator of the date auditors
32
complete fieldwork. In response to SFAS No. 165, issued in 2009, auditors now date the audit
report in conjunction with the SEC filing. This provides less opportunity for users of the
financial statements to identify auditors under deadline imposed time pressure. Although
unintentional, this highlights an unintended consequence to financial statement users from the
issuance of SFAS No. 165. We believe this has important implications for the PCAOB’s project
regarding potential indicators of audit quality and their project to improve the auditor’s reporting
model. Our findings suggest that an important indicator of audit quality could be provided in the
auditor’s report in the form of dual-dating of the audit opinion to clearly convey the date of the
end of audit fieldwork (first date) as well as the date through which subsequent events were
considered (second date). Therefore, our findings suggest that improvements to the auditor’s
report, include a requirement to report the date fieldwork was completed.
33
REFERENCES
Alderman, C. W., and J. W. Deitrick. 1982. Auditors’ perceptions of time budget pressures and
premature sign-offs: A replication and extension. Auditing: A Journal of Practice and
Theory 1 (2): 53-68.
Allee, K. D., N. Bhattacharya, E. L. Black, and T. E. Christensen. 2007. Pro forma disclosure
and investor sophistication: External validation of experimental evidence using archival
data. Accounting, Organizations and Society 32 (3): 201-222.
American Institute of Certified Public Accountants (AICPA). 2014. Enhancing Audit Quality.
Plans and Perspectives for the U.S. CPA Profession. August 2014, New York, NY.
Ashbaugh, H., R. LaFond, and B. W. Mayhew. 2003. Do nonaudit services compromise auditor
independence? Further evidence. The Accounting Review 78 (3): 611-639.
Bamber, E. M., and J. H. Bylinski. 1987. The effects of planning memorandum, time pressure
and individual auditor characteristics on audit managers’ review time judgments.
Contemporary Accounting Research 4 (1): 127-143.
Becker, C. L., M. L. DeFond, J. Jiambalvo, and K. R. Subramanyam. 1998. The effect of audit
quality on earnings management. Contemporary Accounting Research 15 (1): 1-24.
Bennet, G. B., and R. C. Hatfield. 2014. Do approaching deadlines influence auditors’
materiality assessments and audit sampling decisions? Working paper, University of
Massachusetts Amherst and University of Alabama.
Bennet, G. B., R. C. Hatfield, and C. M. Stefaniak. 2014. The effect of deadline pressure on pre-
negotiation positions: A comparison of auditors and client management. Working paper,
University of Massachusetts Amherst, University of Alabama, and Oklahoma State
University.
Blankley, A. I., D. N. Hurtt, and J. E. MacGregor. 2012. Abnormal audit fees and restatements.
Auditing: A Journal of Practice & Theory 31 (1): 79-96.
Blankley, A. I., D. N. Hurtt, and J. E. MacGregor. 2014. The Relationship between audit report
lags and future restatements. Auditing: A Journal of Practice & Theory 33 (2): 27-57.
Bronson, S. N., A. Masli, and J. H. Schroeder. 2014. Jumping the gun: Consequences of
announcing earnings when the audit is less complete. Working paper, University of
Kansas and Indiana University.
Cao, Y., L. A. Myers, and T. C. Omer. 2012. Does company reputation matter for financial
reporting quality? Evidence from restatements. Contemporary Accounting Research 29
(3): 956-990.
34
Cassell, C. A., L. M. Dreher, and L. A. Myers. 2013. Reviewing the SEC’s review process: 10-K
comment letters and the cost of remediation. The Accounting Review 88 (6): 1875-1908.
Center for Audit Quality (CAQ). 2014. CAQ Approach to Audit Quality Indicators. Washington,
DC. Available at http://www.thecaq.org/docs/reports-and-publications/caq-approach-to-
audit-quality-indicators-april-2014.pdf?sfvrsn=2
Charles, S. L., S. M. Glover, and N. Y. Sharp. 2010. The association between financial reporting
risk and audit fees before and after the historic events surrounding SOX. Auditing: A
Journal of Practice & Theory 29 (1): 15-39.
Choo, F. 1995. Auditors’ judgment performance under stress: A test of the predicted relationship
by three theoretical models. Journal of Accounting, Auditing & Finance 10 (3): 611-641.
Choudhary, P., K. J. Merkley, and J. D. Schloetzer. 2013. Does filing form 10-K early matter?
Working paper, Georgetown University and Cornell University.
Christensen, B. E., S. M. Glover, T. C. Omer, and M. K. Shelley. 2014. Understanding audit
quality: Insights from audit professionals and investors. Working paper, Texas A&M
University, Brigham Young University, and the University of Nebraska–Lincoln.
Coram, P., J. Ng, and D. R. Woodliff. 2004. The effect of risk of misstatement on the propensity
to commit reduced audit quality acts under time budget pressure. Auditing: A Journal of
Practice and Theory 23 (2): 159-167.
Cram, D. P., V. Karan, and I. Stuart. 2009. Three threats to validity of choice-based and
matched-sample studies in accounting research. Contemporary Accounting Research 26
(2): 477-516.
Craswell, A. T., J. R. Francis, and S. L. Taylor. 1995. Auditor brand name reputations and
industry specializations. Journal of Accounting and Economics 20 (3): 297-322.
Daines, R. M., I. D. Grow, and D. F. Larcker. 2010. Rating the ratings: how good are
commercial governance ratings? Journal of Financial Economics 98 (3): 439-461.
DeAngelo, L. E. 1981. Auditor size and audit quality. Journal of Accounting & Economics 3 (3):
183-199.
Dechow, P. M., R. G. Sloan, and A. P. Sweeney. 1996. Causes and consequences of earnings
manipulation: An analysis of firms subject to enforcement actions by the SEC.
Contemporary Accounting Research 13 (1): 1-36.
DeFond, M. L., and J. Zhang. 2014. A review of archival auditing research. Journal of
Accounting & Economics 58 (2-3): 275-326.
35
DeZoort, F. T., and A. T. Lord. 1997. A review and synthesis of pressure effects research in
accounting. Journal of Accounting Literature 16: 28-85.
DeZoort, F. T. 1998. Time pressure research in auditing: Implications for practice. The Auditor’s
Report 22 (1): 11-12, 14.
Easterbrook, J. A. 1959. The Effect of Emotion on Cue Utilization and the Organization of
Behavior. Psychological Review 66 (6): 183-201.
Eshleman, J. D., and P. Guo. 2014. Do Big 4 Auditors Provide Higher Audit Quality after
Controlling for the Endogenous Choice of Auditor? Auditing: A Journal of Practice and
Theory 33 (4): 197-219.
Francis, J. R., E. L. Maydew, and H. C. Sparks. 1999. The role of big 6 auditors in the credible
reporting of accruals. Auditing: A Journal of Practice and Theory 18 (2): 17-34.
Francis, J. R., and P. N. Michas. 2013. The contagion effect of low-quality audits. The
Accounting Review 88 (2): 521-552.
Francis, J. R., and M. D. Yu. 2009. Big 4 office size and audit quality. The Accounting Review
84 (5): 1521-1552.
Glover, S. M. 1997. The influence of time pressure and accountability on auditors’ processing of
nondiagnostic information. Journal of Accounting Research 35 (2): 213-226.
Hanson, J. D. 2014. A Call to Action for Future Auditors. Indianapolis, IN (March 28).
http://pcaobus.org/News/Speech/Pages/03282014_BAS.aspx
Hogarth, R. M. (Ed.) 1990. Insights in Decision Making. The University of Chicago Press:
Chicago, Illinois.
Hosmer, D. W., and S. Lemeshow. 2000. Applied Logistic Regression. New York: Wiley.
Hribar, P., T. Kravet, and R. Wilson. 2014. A new measure of accounting quality. Review of
Accounting Studies 19 (1): 506-538.
International Auditing and Assurance Standards Board. 2013. A framework for audit quality.
The International Federation of Accountants.
Kelley, T., and L. Margheim. 1990. The impact of time budget pressure, personality, and
leadership variables on dysfunctional auditor behavior. Auditing: A Journal of Practice
and Theory 9 (2): 21-42.
Kelley, T., L. Margheim, and D. Pattison. 1999. Survey on the differential effects of time
deadline pressure versus time budget pressure on auditor behavior. The Journal of
Applied Business Research 15 (4): 117-128.
36
Kinney, Jr, W. R., Z. V. Palmrose, and S. Scholz. 2004. Auditor independence, non-audit
services, and restatements: Was the U.S. government right? Journal of Accounting
Research 42 (3): 561-588.
KPMG. 2011. Audit quality framework: Example slides for audit committee communications
and discussions. October 2011.
Lambert, T. A., K. L. Jones, and J. F. Brazel. 2014. Unintended consequences of accelerated
filings: Are mandatory reductions in audit delay associated with reductions in earnings
quality? Working paper, University of Massachusetts Amherst, George Mason
University, and North Carolina State University.
Lobo, G. J., and Y. Zhao. 2013. Relation between audit effort and financial report misstatements:
Evidence from quarterly and annual restatements. The Accounting Review 88 (4): 1385-
1412.
Lopez, D. M., and G. F. Peters. 2012. The effect of workload compression on audit quality.
Auditing: A Journal of Practice & Theory 31 (4): 139-165.
Lundberg, U. 1993. On the Psychobiology of stress and health. In Time Pressure and Stress in
Human Judgment and Decision Making, edited by O. Svenson, and A. J. Maule, 41-53.
New York, NY: Plenum Press.
Mano, H. 1990. Emotional states and decision making. Advances in Consumer Research 17 (1):
577-584.
Margheim, L., T. Kelley, and D. Pattison. 2005. An empirical analysis of the effects of auditor
time budget pressure and time deadline pressure. The Journal of Applied Business
Research 21 (1): 23-36.
Maule, A. J., and R. J. Hockey. 1993. State, stress and time pressure. In Time Pressure and
Stress in Human Judgment and Decision Making, edited by O. Svenson, and A. J. Maule,
83-101. New York, NY: Plenum Press.
McDaniel, L. 1990. The effects of time pressure and audit program structure on audit
performance. Journal of Accounting Research 28 (2): 267-285.
McGuire, S. T., T. C. Omer, and N. Y. Sharp. 2012. The impact of religion on financial reporting
irregularities. The Accounting Review 87 (2): 645-673.
Ordonez, L., and L. Benson. 1997. Decision under Time Pressure: How Time Constraint Effects
Risky Decision Making. Organization Behavior and Human Decision Processes 71 (2):
121-140.
37
Petersen, M. A. 2009. Estimating standard errors in financial panel data sets: Comparing
approaches. Review of Financial Studies 22 (1): 435-480.
Price III, R. A., N. Y. Sharp, and D. A. Wood. 2011. Detecting and predicting accounting
irregularities: A comparison of commercial and academic risk measures. Accounting
Horizons 25 (4): 755-780.
Public Company Accounting Oversight Board (PCAOB). 2003. Reports on Audited Financial
Statements. Interim Standard AU 508. Washington, D.C.: PCAOB.
Public Company Accounting Oversight Board (PCAOB). 2009. Order Making Findings and
Imposing Sanctions. PCAOB Realease No. 105-2009-004, Washington, D.C.: PCAOB.
Public Company Accounting Oversight Board (PCAOB). 2012a. Staff Audit Practice Alert No.
10: Maintaining and Applying Professional Skepticism in Audits. Washington, D.C.:
PCAOB.
Public Company Accounting Oversight Board (PCAOB). 2012b. Strategic Plan: Improving
Relevance and Quality of the Audit for the Protection and Benefit of Investors, 2012-
2016. November 30, 2012.
Public Company Accounting Oversight Board (PCAOB). 2013. Standing Advisory Group
meeting briefing paper, Audit Quality Indicators. May 15-16, 2013. Available at:
http://pcaobus.org/News/Events/Documents/05152013_SAGMeeting/Audit_Quality_Indi
cators.pdf.
Public Company Accounting Oversight Board (PCAOB). 2014a. Session on Audit Quality
Indicators. 2014 PCAOB/AAA Annual Meeting memo and meeting materials, dated
April 17, 2014.
PwC. 2014. Our focus on audit quality: 2014 report. Available at
http://www.pwc.com/us/en/audit-assurance-services/publications/our-focus-on-audit-
quality.jhtml.
Ragunathan, B. 1991. Premature signing-off of audit procedures: An analysis. Accounting
Horizons 5 (2): 71-79.
Reichelt, K. J., and D. Wang. 2010. National and office-specific measures of auditor industry
expertise and effects on audit quality. Journal of Accounting Research 48 (3): 647-686.
Reynolds, J. K., and J. R. Francis. 2001. Does size matter? The influence of large clients on
office-level auditor reporting decisions. Journal of Accounting and Economics 30 (3):
375-400.
Rhode, J. 1978. The Independent Auditors’ Work Environment: A Survey. Commission on
Auditors Responsibilities, Research Study No. 4. New York, NY: AICPA.
38
Rosenbaum, P. R., and D. B. Rubin. 1983. The central role of the propensity score in
observational studies for causal effects. Biometrika 70 (1): 41-55.
Schmidt, J. J. 2012. Perceived auditor independence and audit litigation: The role of nonaudit
services fees. The Accounting Review 87 (3): 1033-1065.
Stanley, J., and F. DeZoort. 2007. Audit firm tenure and financial restatements: An analysis of
industry specialization and fee effects. Journal of Accounting and Public Policy 26 (2):
131-159.
Summers, S. L., and J. T. Sweeney. 1998. Fraudulently misstated financial statements and
insider trading: An empirical analysis. The Accounting Review 73 (1): 131-146.
Teoh, S. H., and T.J. Wong. 1993. Perceived auditor quality and the earnings response
coefficient. The Accounting Review 68 (2): 346-367.
Willet, C., and M. Page. 1996. A survey of time budget pressure and irregular auditing practices
among newly qualified UK Chartered Accountants. British Accounting Review 28: 101-
120.
Zakay, D., and S. Wooler. 1984. Time pressure, training and decision effectiveness. Ergonomics
27 (3): 273-284.
39
APPENDIX A
SEC Registrant Required Filing Deadlines for Periodic Reports
SEC rule 33-8128, Acceleration of Periodic Report Filing Dates and Disclosure Concerning
Website Access to Reports
“We are adopting amendments to our rules and forms to accelerate the filing of quarterly and
annual reports under the Securities Exchange Act of 1934 by domestic reporting companies that
have a public float of at least $75 million, that have been subject to the Exchange Act's reporting
requirements for at least 12 calendar months and that previously have filed at least one annual
report. The changes for these accelerated filers will be phased-in over three years. The annual
report deadline will remain 90 days for year one and change from 90 days to 75 days for year
two and from 75 days to 60 days for year three and thereafter. The quarterly report deadline will
remain 45 days for year one and change from 45 days to 40 days for year two and from 40 days
to 35 days for year three and thereafter. The phase-in period will begin for accelerated filers with
fiscal years ending on or after December 15, 2002.”
SEC rule 33-8507, Temporary Postponement of the Final Phase-In Period for Acceleration of
Periodic Filing Dates
“We are adopting amendments to postpone for one year the final phase-in period for acceleration
of the due dates of quarterly and annual reports required to be filed under the Securities
Exchange Act of 1934 by certain reporting companies known as “accelerated filers,” which are
issuers that have a public float of at least $75 million, that have been subject to the Exchange
Act’s reporting requirements for at least 12 calendar months, that previously have filed at least
one annual report, and that are not eligible to file their quarterly and annual reports on Forms 10-
QSB and 10-KSB.”
SEC rule 33-8644, Revisions to Accelerated Filer Definition and Accelerated Deadlines for
Filing Periodic Reports
“We are adopting amendments to the accelerated filing deadlines that apply to periodic reports so
that a “large accelerated filer” (an Exchange Act reporting company with a worldwide market
value of outstanding voting and non-voting common equity held by non-affiliates of $700
million or more) will become subject to a 60-day Form 10-K annual report filing deadline,
beginning with the annual report filed for its first fiscal year ending on or after December 15,
2006. Until then, large accelerated filers will remain subject to a 75-day annual report deadline.
Accelerated filers will continue to file their Form 10-K annual reports under a 75-day deadline,
with no further reduction scheduled to occur under the revised rules. Accelerated filers and large
accelerated filers will continue to file their Form 10-Q quarterly reports under a 40-day deadline,
rather than the 35-day deadline that was scheduled to apply next year under the previously
existing rules. Further, the amendments revise the definition of the term “accelerated filer” to
permit an accelerated filer that has voting and non-voting common equity held by non-affiliates
of less than $50 million to exit accelerated filer status at the end of the fiscal year in which its
equity falls below $50 million and to file its annual report for that year and subsequent periodic
reports on a non-accelerated basis. Finally, the amendments permit a large accelerated filer that
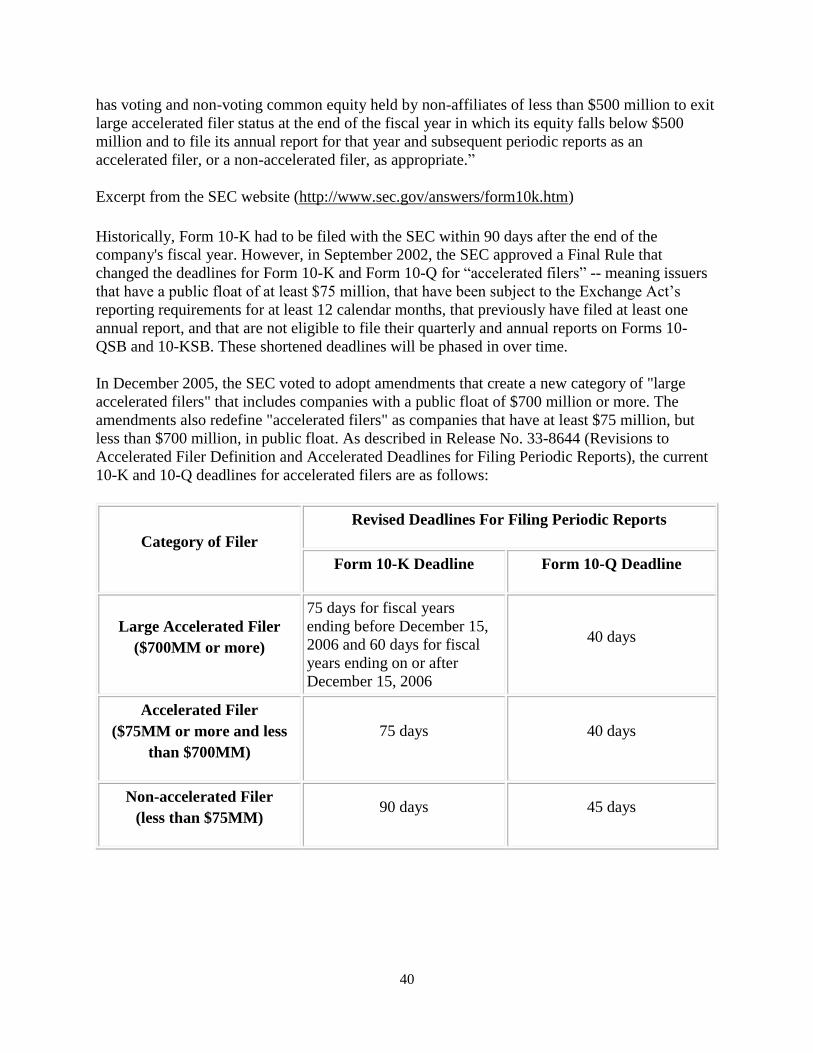
40
has voting and non-voting common equity held by non-affiliates of less than $500 million to exit
large accelerated filer status at the end of the fiscal year in which its equity falls below $500
million and to file its annual report for that year and subsequent periodic reports as an
accelerated filer, or a non-accelerated filer, as appropriate.”
Excerpt from the SEC website (http://www.sec.gov/answers/form10k.htm)
Historically, Form 10-K had to be filed with the SEC within 90 days after the end of the
company's fiscal year. However, in September 2002, the SEC approved a Final Rule that
changed the deadlines for Form 10-K and Form 10-Q for “accelerated filers” -- meaning issuers
that have a public float of at least $75 million, that have been subject to the Exchange Act’s
reporting requirements for at least 12 calendar months, that previously have filed at least one
annual report, and that are not eligible to file their quarterly and annual reports on Forms 10-
QSB and 10-KSB. These shortened deadlines will be phased in over time.
In December 2005, the SEC voted to adopt amendments that create a new category of "large
accelerated filers" that includes companies with a public float of $700 million or more. The
amendments also redefine "accelerated filers" as companies that have at least $75 million, but
less than $700 million, in public float. As described in Release No. 33-8644 (Revisions to
Accelerated Filer Definition and Accelerated Deadlines for Filing Periodic Reports), the current
10-K and 10-Q deadlines for accelerated filers are as follows:
Category of Filer
Revised Deadlines For Filing Periodic Reports
Form 10-K Deadline Form 10-Q Deadline
Large Accelerated Filer
($700MM or more)
75 days for fiscal years
ending before December 15,
2006 and 60 days for fiscal
years ending on or after
December 15, 2006
40 days
Accelerated Filer
($75MM or more and less
than $700MM)
75 days 40 days
Non-accelerated Filer
(less than $75MM) 90 days 45 days
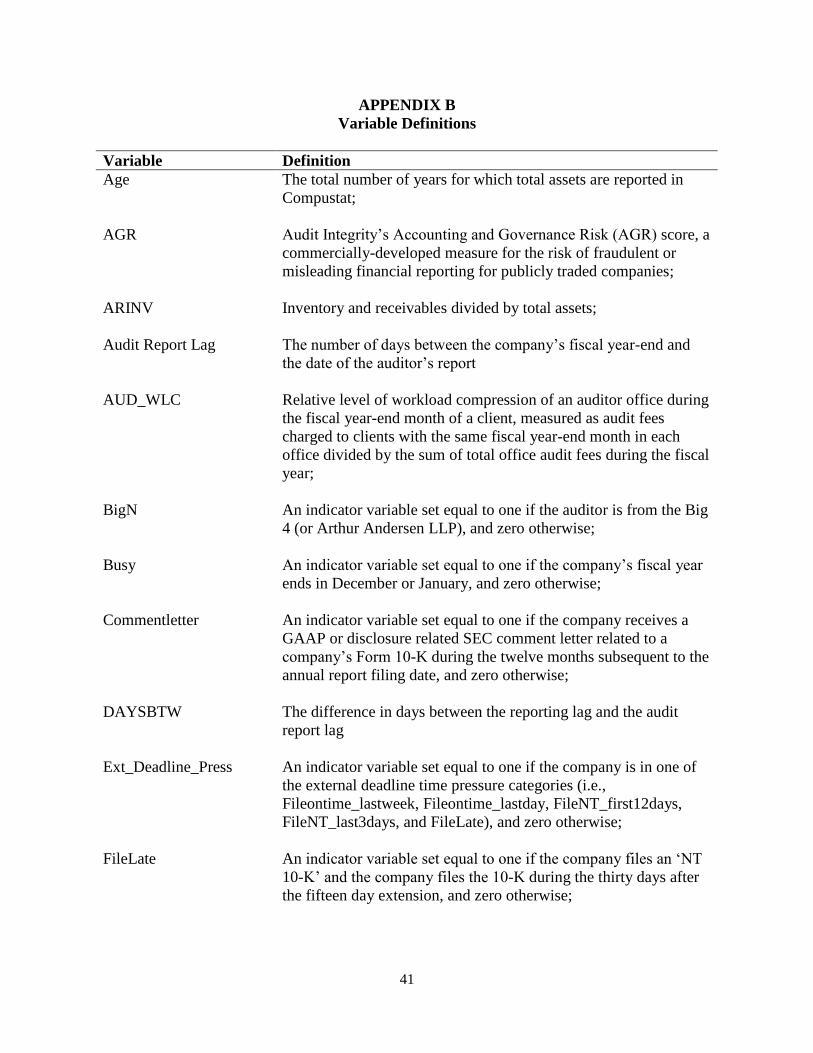
41
APPENDIX B
Variable Definitions
Variable Definition
Age The total number of years for which total assets are reported in
Compustat;
AGR Audit Integrity’s Accounting and Governance Risk (AGR) score, a
commercially-developed measure for the risk of fraudulent or
misleading financial reporting for publicly traded companies;
ARINV Inventory and receivables divided by total assets;
Audit Report Lag The number of days between the company’s fiscal year-end and
the date of the auditor’s report
AUD_WLC Relative level of workload compression of an auditor office during
the fiscal year-end month of a client, measured as audit fees
charged to clients with the same fiscal year-end month in each
office divided by the sum of total office audit fees during the fiscal
year;
BigN An indicator variable set equal to one if the auditor is from the Big
4 (or Arthur Andersen LLP), and zero otherwise;
Busy An indicator variable set equal to one if the company’s fiscal year
ends in December or January, and zero otherwise;
Commentletter An indicator variable set equal to one if the company receives a
GAAP or disclosure related SEC comment letter related to a
company’s Form 10-K during the twelve months subsequent to the
annual report filing date, and zero otherwise;
DAYSBTW The difference in days between the reporting lag and the audit
report lag
Ext_Deadline_Press An indicator variable set equal to one if the company is in one of
the external deadline time pressure categories (i.e.,
Fileontime_lastweek, Fileontime_lastday, FileNT_first12days,
FileNT_last3days, and FileLate), and zero otherwise;
FileLate An indicator variable set equal to one if the company files an ‘NT
10-K’ and the company files the 10-K during the thirty days after
the fifteen day extension, and zero otherwise;
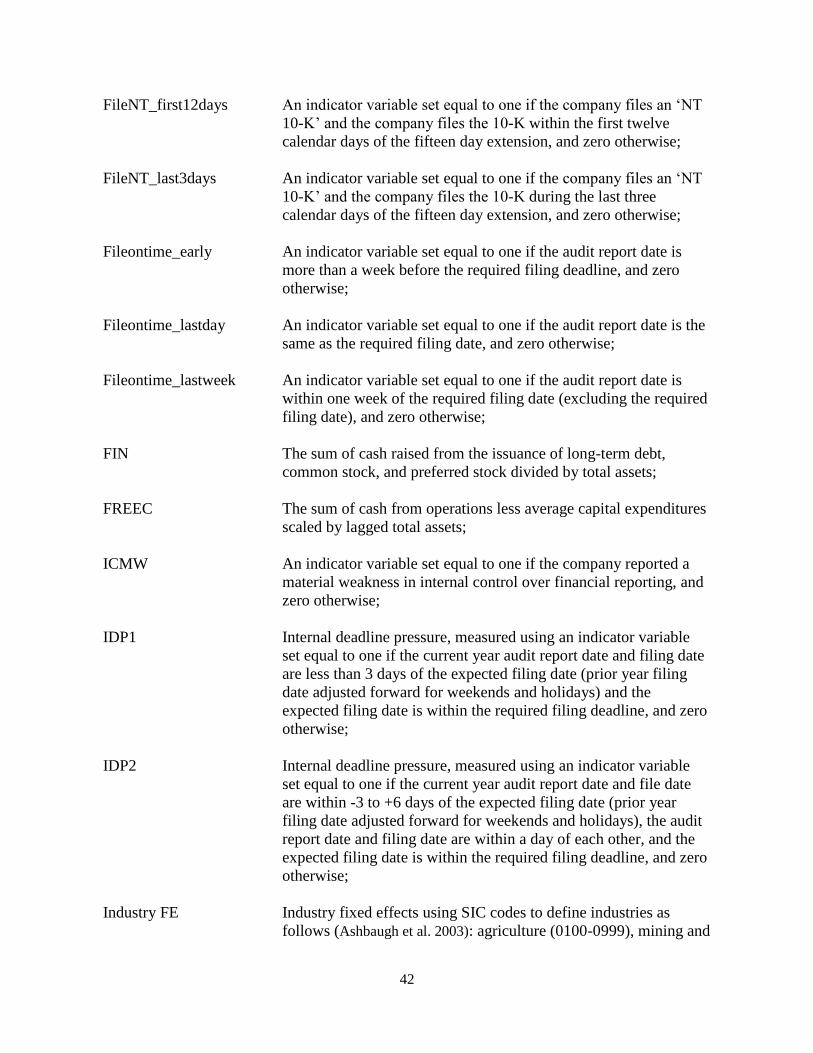
42
FileNT_first12days An indicator variable set equal to one if the company files an ‘NT
10-K’ and the company files the 10-K within the first twelve
calendar days of the fifteen day extension, and zero otherwise;
FileNT_last3days An indicator variable set equal to one if the company files an ‘NT
10-K’ and the company files the 10-K during the last three
calendar days of the fifteen day extension, and zero otherwise;
Fileontime_early An indicator variable set equal to one if the audit report date is
more than a week before the required filing deadline, and zero
otherwise;
Fileontime_lastday An indicator variable set equal to one if the audit report date is the
same as the required filing date, and zero otherwise;
Fileontime_lastweek An indicator variable set equal to one if the audit report date is
within one week of the required filing date (excluding the required
filing date), and zero otherwise;
FIN The sum of cash raised from the issuance of long-term debt,
common stock, and preferred stock divided by total assets;
FREEC The sum of cash from operations less average capital expenditures
scaled by lagged total assets;
ICMW An indicator variable set equal to one if the company reported a
material weakness in internal control over financial reporting, and
zero otherwise;
IDP1 Internal deadline pressure, measured using an indicator variable
set equal to one if the current year audit report date and filing date
are less than 3 days of the expected filing date (prior year filing
date adjusted forward for weekends and holidays) and the
expected filing date is within the required filing deadline, and zero
otherwise;
IDP2 Internal deadline pressure, measured using an indicator variable
set equal to one if the current year audit report date and file date
are within -3 to +6 days of the expected filing date (prior year
filing date adjusted forward for weekends and holidays), the audit
report date and filing date are within a day of each other, and the
expected filing date is within the required filing deadline, and zero
otherwise;
Industry FE Industry fixed effects using SIC codes to define industries as
follows (Ashbaugh et al. 2003): agriculture (0100-0999), mining and
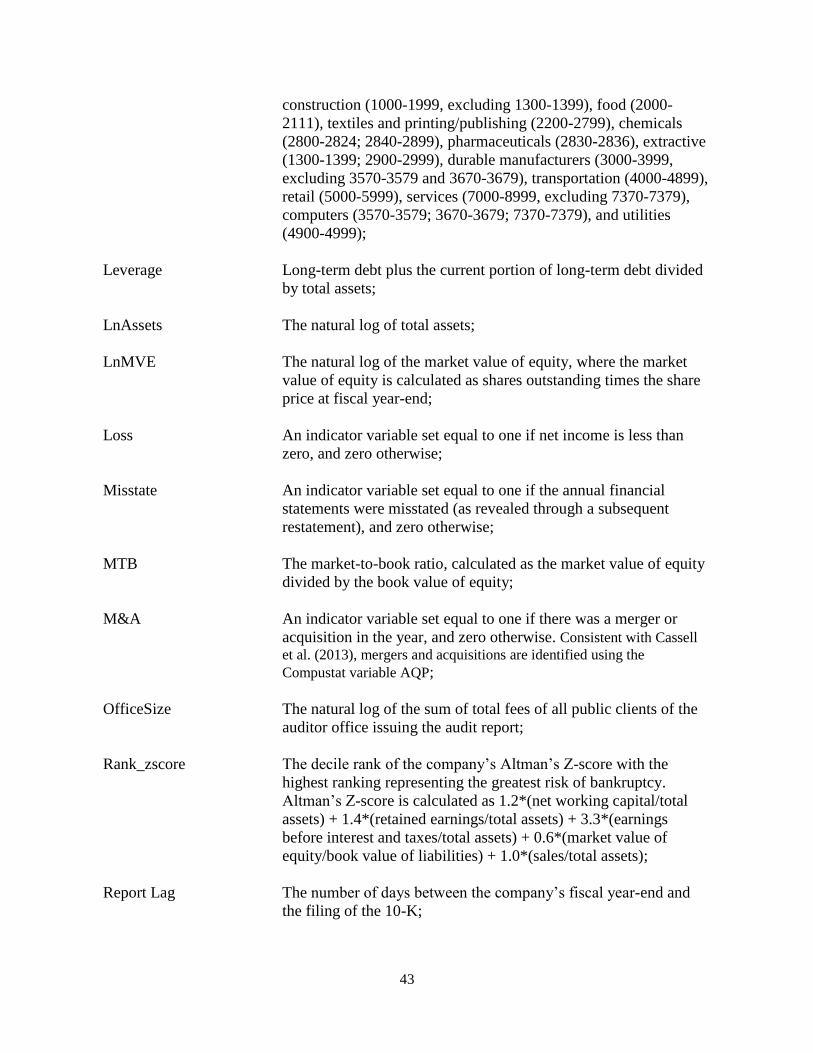
43
construction (1000-1999, excluding 1300-1399), food (2000-
2111), textiles and printing/publishing (2200-2799), chemicals
(2800-2824; 2840-2899), pharmaceuticals (2830-2836), extractive
(1300-1399; 2900-2999), durable manufacturers (3000-3999,
excluding 3570-3579 and 3670-3679), transportation (4000-4899),
retail (5000-5999), services (7000-8999, excluding 7370-7379),
computers (3570-3579; 3670-3679; 7370-7379), and utilities
(4900-4999);
Leverage Long-term debt plus the current portion of long-term debt divided
by total assets;
LnAssets The natural log of total assets;
LnMVE The natural log of the market value of equity, where the market
value of equity is calculated as shares outstanding times the share
price at fiscal year-end;
Loss An indicator variable set equal to one if net income is less than
zero, and zero otherwise;
Misstate An indicator variable set equal to one if the annual financial
statements were misstated (as revealed through a subsequent
restatement), and zero otherwise;
MTB The market-to-book ratio, calculated as the market value of equity
divided by the book value of equity;
M&A An indicator variable set equal to one if there was a merger or
acquisition in the year, and zero otherwise. Consistent with Cassell
et al. (2013), mergers and acquisitions are identified using the
Compustat variable AQP;
OfficeSize The natural log of the sum of total fees of all public clients of the
auditor office issuing the audit report;
Rank_zscore The decile rank of the company’s Altman’s Z-score with the
highest ranking representing the greatest risk of bankruptcy.
Altman’s Z-score is calculated as 1.2*(net working capital/total
assets) + 1.4*(retained earnings/total assets) + 3.3*(earnings
before interest and taxes/total assets) + 0.6*(market value of
equity/book value of liabilities) + 1.0*(sales/total assets);
Report Lag The number of days between the company’s fiscal year-end and
the filing of the 10-K;
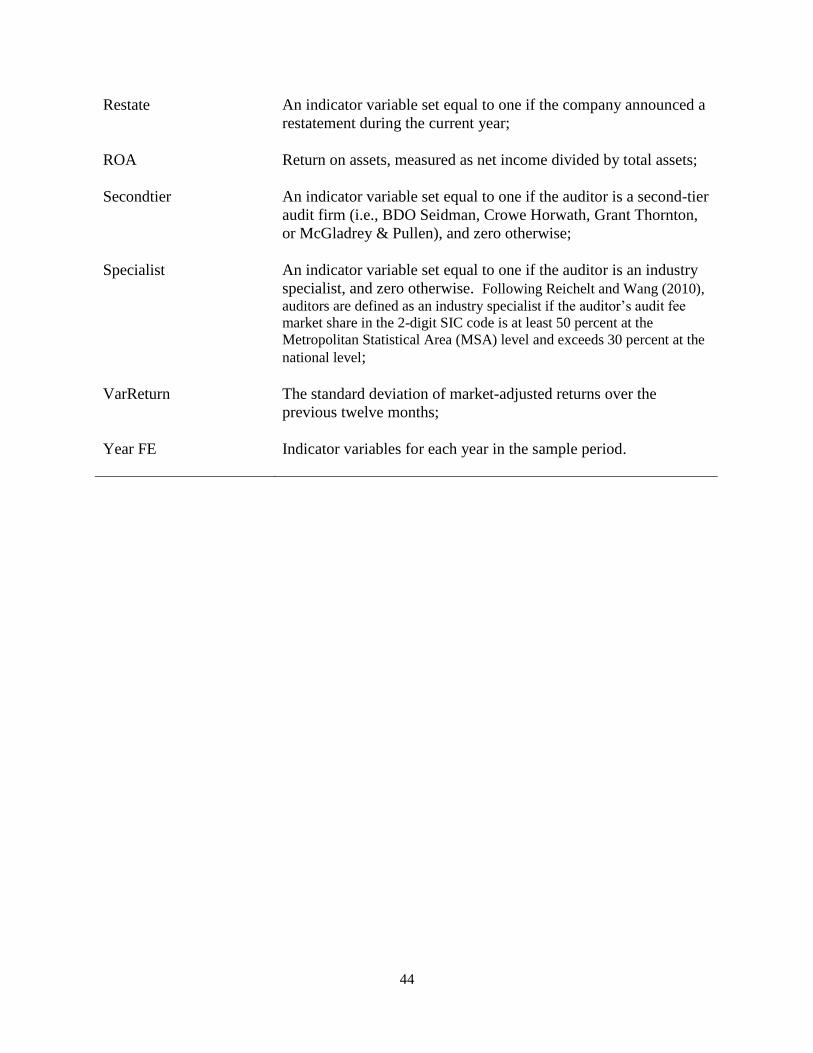
44
Restate An indicator variable set equal to one if the company announced a
restatement during the current year;
ROA Return on assets, measured as net income divided by total assets;
Secondtier An indicator variable set equal to one if the auditor is a second-tier
audit firm (i.e., BDO Seidman, Crowe Horwath, Grant Thornton,
or McGladrey & Pullen), and zero otherwise;
Specialist An indicator variable set equal to one if the auditor is an industry
specialist, and zero otherwise. Following Reichelt and Wang (2010),
auditors are defined as an industry specialist if the auditor’s audit fee
market share in the 2-digit SIC code is at least 50 percent at the
Metropolitan Statistical Area (MSA) level and exceeds 30 percent at the
national level;
VarReturn The standard deviation of market-adjusted returns over the
previous twelve months;
Year FE Indicator variables for each year in the sample period.
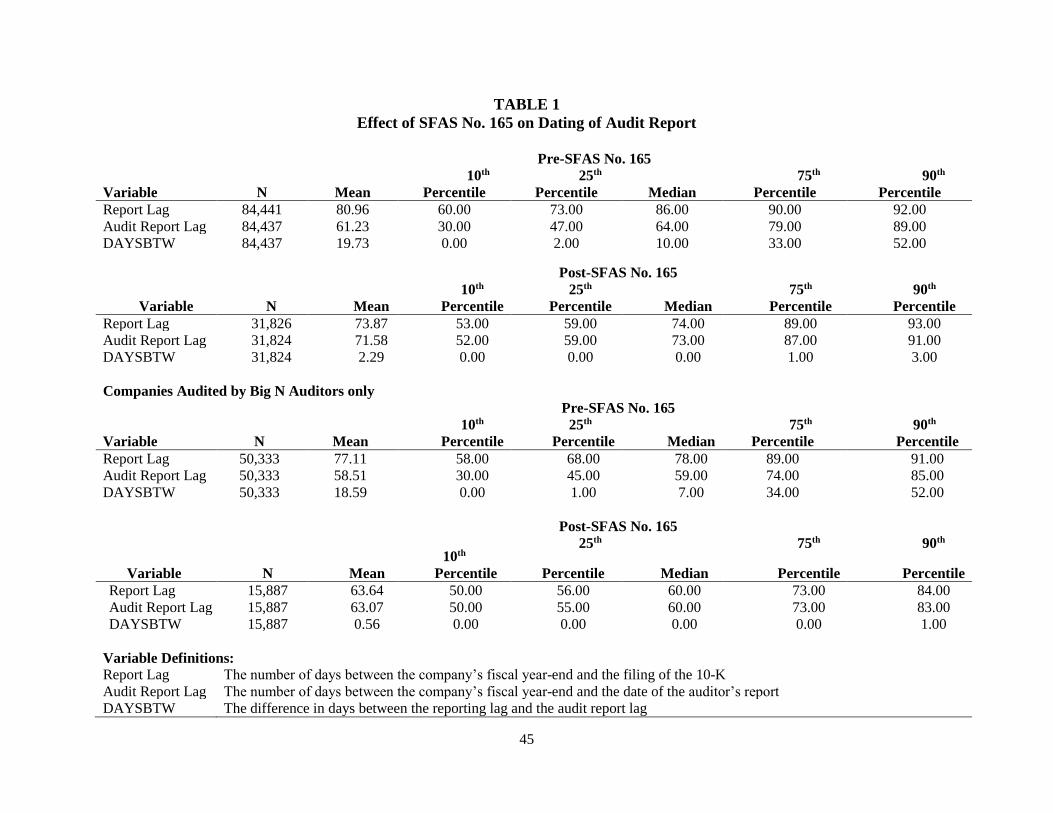
45
TABLE 1
Effect of SFAS No. 165 on Dating of Audit Report
Pre-SFAS No. 165
10th 25th 75th 90th
Variable N Mean Percentile Percentile Median Percentile Percentile
Report Lag 84,441 80.96 60.00 73.00 86.00 90.00 92.00
Audit Report Lag 84,437 61.23 30.00 47.00 64.00 79.00 89.00
DAYSBTW 84,437 19.73 0.00 2.00 10.00 33.00 52.00
Post-SFAS No. 165
10th 25th 75th 90th
Variable N Mean Percentile Percentile Median Percentile Percentile
Report Lag 31,826 73.87 53.00 59.00 74.00 89.00 93.00
Audit Report Lag 31,824 71.58 52.00 59.00 73.00 87.00 91.00
DAYSBTW 31,824 2.29 0.00 0.00 0.00 1.00 3.00
Companies Audited by Big N Auditors only
Pre-SFAS No. 165
10th 25th 75th 90th
Variable N Mean Percentile Percentile Median Percentile Percentile
Report Lag 50,333 77.11 58.00 68.00 78.00 89.00 91.00
Audit Report Lag 50,333 58.51 30.00 45.00 59.00 74.00 85.00
DAYSBTW 50,333 18.59 0.00 1.00 7.00 34.00 52.00
Post-SFAS No. 165
10th
25th 75th 90th
Variable N Mean Percentile Percentile Median Percentile Percentile
Report Lag 15,887 63.64 50.00 56.00 60.00 73.00 84.00
Audit Report Lag 15,887 63.07 50.00 55.00 60.00 73.00 83.00
DAYSBTW 15,887 0.56 0.00 0.00 0.00 0.00 1.00
Variable Definitions:
Report Lag The number of days between the company’s fiscal year-end and the filing of the 10-K
Audit Report Lag The number of days between the company’s fiscal year-end and the date of the auditor’s report
DAYSBTW The difference in days between the reporting lag and the audit report lag
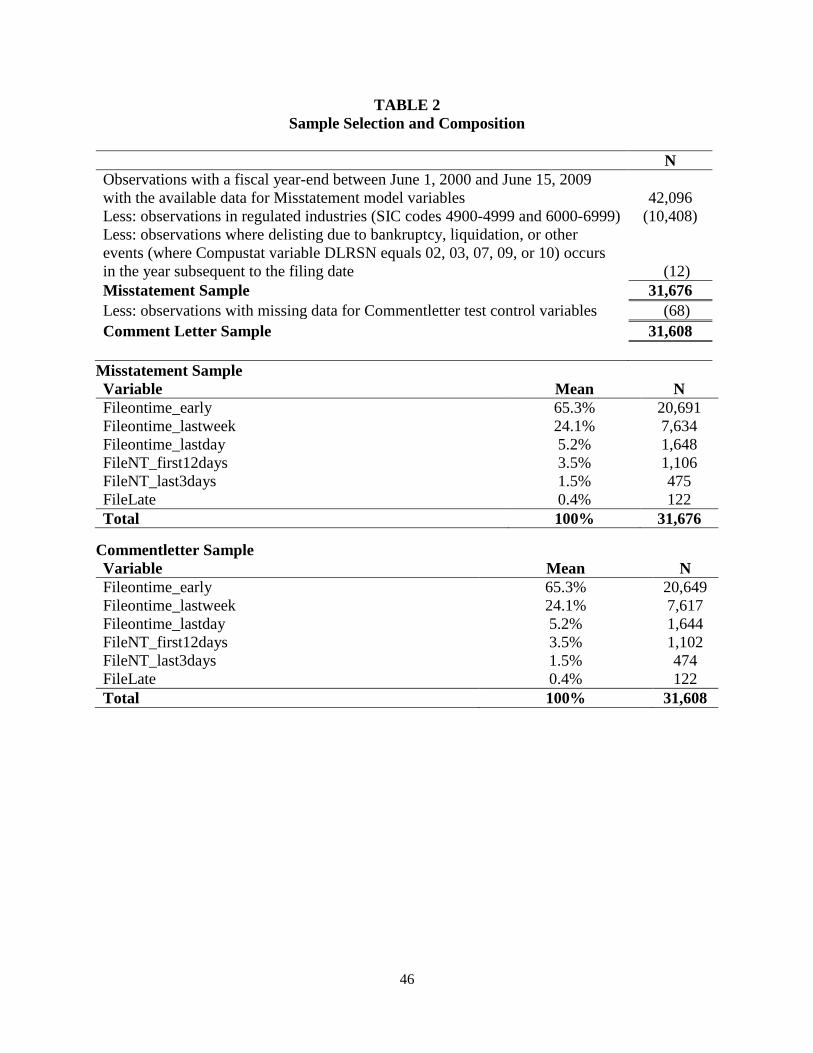
46
TABLE 2
Sample Selection and Composition
N
Observations with a fiscal year-end between June 1, 2000 and June 15, 2009
with the available data for Misstatement model variables
42,096
Less: observations in regulated industries (SIC codes 4900-4999 and 6000-6999) (10,408)
Less: observations where delisting due to bankruptcy, liquidation, or other
events (where Compustat variable DLRSN equals 02, 03, 07, 09, or 10) occurs
in the year subsequent to the filing date
(12)
Misstatement Sample 31,676
Less: observations with missing data for Commentletter test control variables (68)
Comment Letter Sample 31,608
Misstatement Sample
Variable Mean N
Fileontime_early 65.3% 20,691
Fileontime_lastweek 24.1% 7,634
Fileontime_lastday 5.2% 1,648
FileNT_first12days 3.5% 1,106
FileNT_last3days 1.5% 475
FileLate 0.4% 122
Total 100% 31,676
Commentletter Sample
Variable Mean N
Fileontime_early 65.3% 20,649
Fileontime_lastweek 24.1% 7,617
Fileontime_lastday 5.2% 1,644
FileNT_first12days 3.5% 1,102
FileNT_last3days 1.5% 474
FileLate 0.4% 122
Total 100% 31,608
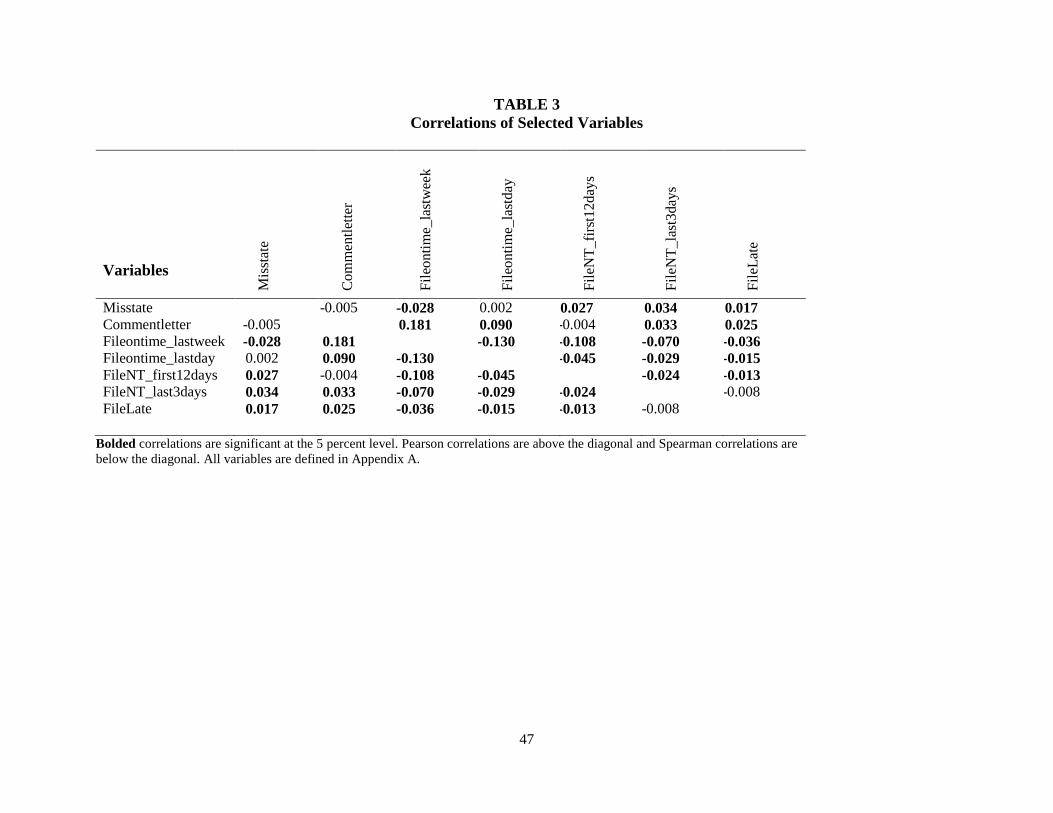
47
TABLE 3
Correlations of Selected Variables
Variables
Mis
stat
e
Com
men
tlet
ter
Fil
eonti
me_
last
wee
k
Fil
eonti
me_
last
day
Fil
eNT
_fi
rst1
2day
s
Fil
eNT
_la
st3day
s
Fil
eLat
e
Misstate -0.005 -0.028 0.002 0.027 0.034 0.017
Commentletter -0.005 0.181 0.090 -0.004 0.033 0.025
Fileontime_lastweek -0.028 0.181 -0.130 -0.108 -0.070 -0.036
Fileontime_lastday 0.002 0.090 -0.130 -0.045 -0.029 -0.015
FileNT_first12days 0.027 -0.004 -0.108 -0.045 -0.024 -0.013
FileNT_last3days 0.034 0.033 -0.070 -0.029 -0.024 -0.008
FileLate 0.017 0.025 -0.036 -0.015 -0.013 -0.008
Bolded correlations are significant at the 5 percent level. Pearson correlations are above the diagonal and Spearman correlations are
below the diagonal. All variables are defined in Appendix A.
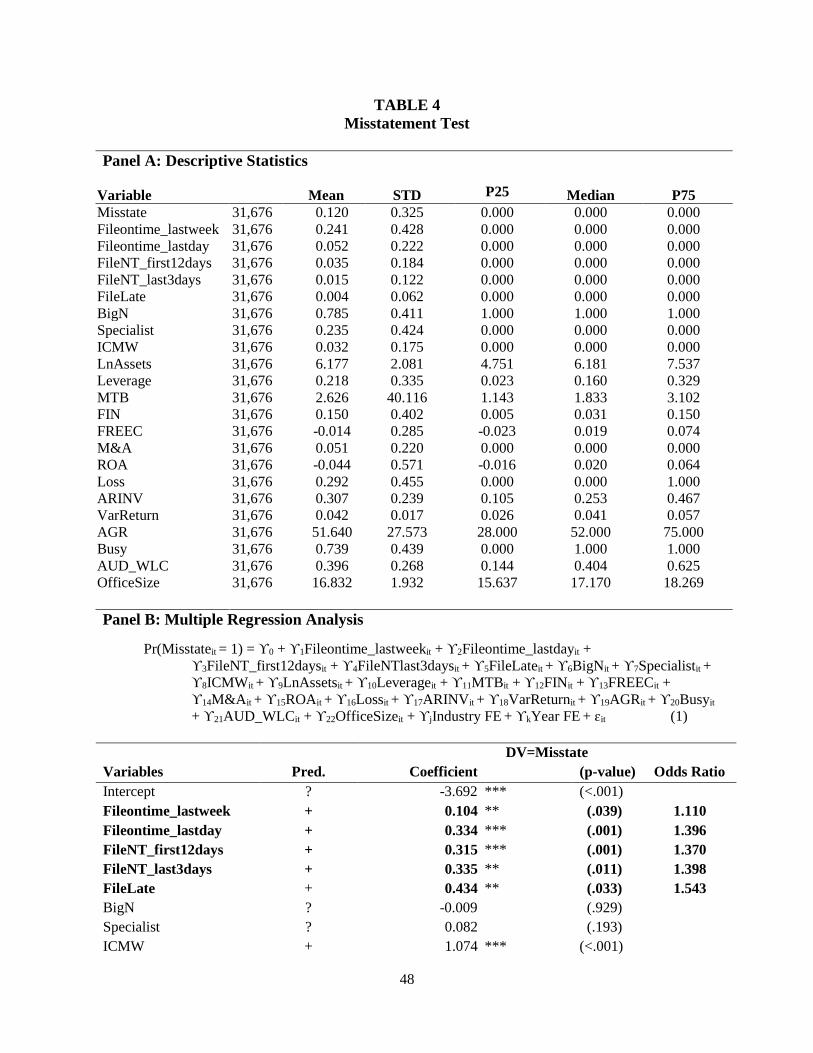
48
TABLE 4
Misstatement Test
Panel A: Descriptive Statistics
Variable
N
Mean
STD P25
Median
P75
Misstate 31,676 0.120 0.325 0.000 0.000 0.000
Fileontime_lastweek 31,676 0.241 0.428 0.000 0.000 0.000
Fileontime_lastday 31,676 0.052 0.222 0.000 0.000 0.000
FileNT_first12days 31,676 0.035 0.184 0.000 0.000 0.000
FileNT_last3days 31,676 0.015 0.122 0.000 0.000 0.000
FileLate 31,676 0.004 0.062 0.000 0.000 0.000
BigN 31,676 0.785 0.411 1.000 1.000 1.000
Specialist 31,676 0.235 0.424 0.000 0.000 0.000
ICMW 31,676 0.032 0.175 0.000 0.000 0.000
LnAssets 31,676 6.177 2.081 4.751 6.181 7.537
Leverage 31,676 0.218 0.335 0.023 0.160 0.329
MTB 31,676 2.626 40.116 1.143 1.833 3.102
FIN 31,676 0.150 0.402 0.005 0.031 0.150
FREEC 31,676 -0.014 0.285 -0.023 0.019 0.074
M&A 31,676 0.051 0.220 0.000 0.000 0.000
ROA 31,676 -0.044 0.571 -0.016 0.020 0.064
Loss 31,676 0.292 0.455 0.000 0.000 1.000
ARINV 31,676 0.307 0.239 0.105 0.253 0.467
VarReturn 31,676 0.042 0.017 0.026 0.041 0.057
AGR 31,676 51.640 27.573 28.000 52.000 75.000
Busy 31,676 0.739 0.439 0.000 1.000 1.000
AUD_WLC 31,676 0.396 0.268 0.144 0.404 0.625
OfficeSize 31,676 16.832 1.932 15.637 17.170 18.269
Panel B: Multiple Regression Analysis
Pr(Misstateit = 1) = ϒ0 + ϒ1Fileontime_lastweekit + ϒ2Fileontime_lastdayit +
ϒ3FileNT_first12daysit + ϒ4FileNTlast3daysit + ϒ5FileLateit + ϒ6BigNit + ϒ7Specialistit +
ϒ8ICMWit + ϒ9LnAssetsit + ϒ10Leverageit + ϒ11MTBit + ϒ12FINit + ϒ13FREECit +
ϒ14M&Ait + ϒ15ROAit + ϒ16Lossit + ϒ17ARINVit + ϒ18VarReturnit + ϒ19AGRit + ϒ20Busyit
+ ϒ21AUD_WLCit + ϒ22OfficeSizeit + ϒjIndustry FE + ϒkYear FE + ɛit (1)
DV=Misstate
Variables Pred. Coefficient (p-value) Odds Ratio
Intercept ? -3.692 *** (<.001)
Fileontime_lastweek + 0.104 ** (.039) 1.110
Fileontime_lastday + 0.334 *** (.001) 1.396
FileNT_first12days + 0.315 *** (.001) 1.370
FileNT_last3days + 0.335 ** (.011) 1.398
FileLate + 0.434 ** (.033) 1.543
BigN ? -0.009 (.929)
Specialist ? 0.082 (.193)
ICMW + 1.074 *** (<.001)
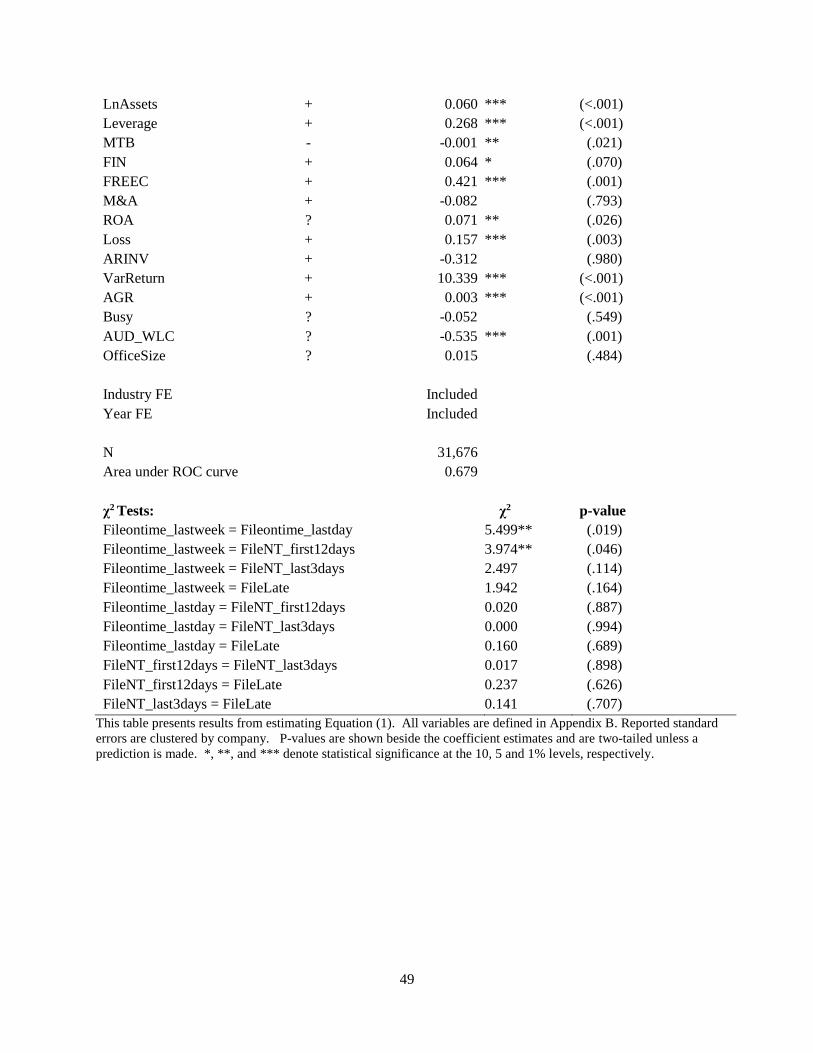
49
LnAssets + 0.060 *** (<.001)
Leverage + 0.268 *** (<.001)
MTB - -0.001 ** (.021)
FIN + 0.064 * (.070)
FREEC + 0.421 *** (.001)
M&A + -0.082 (.793)
ROA ? 0.071 ** (.026)
Loss + 0.157 *** (.003)
ARINV + -0.312 (.980)
VarReturn + 10.339 *** (<.001)
AGR + 0.003 *** (<.001)
Busy ? -0.052 (.549)
AUD_WLC ? -0.535 *** (.001)
OfficeSize ? 0.015 (.484)
Industry FE Included
Year FE Included
N 31,676
Area under ROC curve 0.679
χ2 Tests: χ2 p-value
Fileontime_lastweek = Fileontime_lastday 5.499** (.019)
Fileontime_lastweek = FileNT_first12days 3.974** (.046)
Fileontime_lastweek = FileNT_last3days 2.497 (.114)
Fileontime_lastweek = FileLate 1.942 (.164)
Fileontime_lastday = FileNT_first12days 0.020 (.887)
Fileontime_lastday = FileNT_last3days 0.000 (.994)
Fileontime_lastday = FileLate 0.160 (.689)
FileNT_first12days = FileNT_last3days 0.017 (.898)
FileNT_first12days = FileLate 0.237 (.626)
FileNT_last3days = FileLate 0.141 (.707)
This table presents results from estimating Equation (1). All variables are defined in Appendix B. Reported standard
errors are clustered by company. P-values are shown beside the coefficient estimates and are two-tailed unless a
prediction is made. *, **, and *** denote statistical significance at the 10, 5 and 1% levels, respectively.
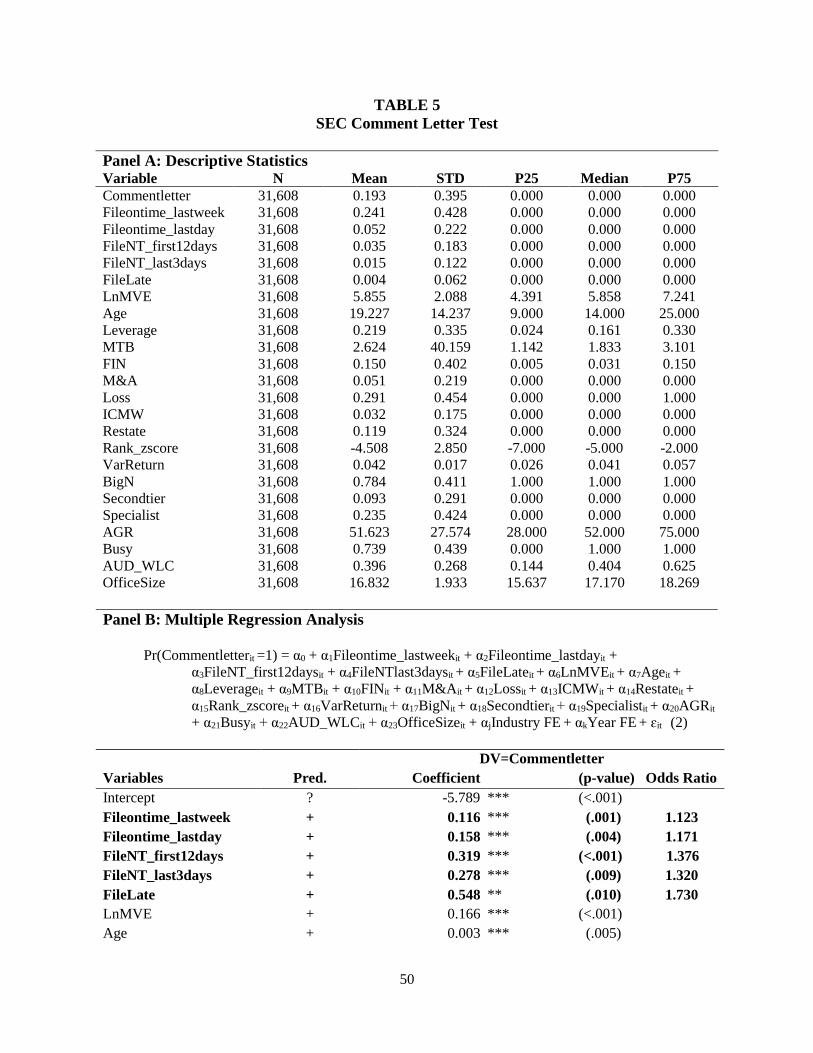
50
TABLE 5
SEC Comment Letter Test
Panel A: Descriptive Statistics Variable N Mean STD P25 Median P75
Commentletter 31,608 0.193 0.395 0.000 0.000 0.000
Fileontime_lastweek 31,608 0.241 0.428 0.000 0.000 0.000
Fileontime_lastday 31,608 0.052 0.222 0.000 0.000 0.000
FileNT_first12days 31,608 0.035 0.183 0.000 0.000 0.000
FileNT_last3days 31,608 0.015 0.122 0.000 0.000 0.000
FileLate 31,608 0.004 0.062 0.000 0.000 0.000
LnMVE 31,608 5.855 2.088 4.391 5.858 7.241
Age 31,608 19.227 14.237 9.000 14.000 25.000
Leverage 31,608 0.219 0.335 0.024 0.161 0.330
MTB 31,608 2.624 40.159 1.142 1.833 3.101
FIN 31,608 0.150 0.402 0.005 0.031 0.150
M&A 31,608 0.051 0.219 0.000 0.000 0.000
Loss 31,608 0.291 0.454 0.000 0.000 1.000
ICMW 31,608 0.032 0.175 0.000 0.000 0.000
Restate 31,608 0.119 0.324 0.000 0.000 0.000
Rank_zscore 31,608 -4.508 2.850 -7.000 -5.000 -2.000
VarReturn 31,608 0.042 0.017 0.026 0.041 0.057
BigN 31,608 0.784 0.411 1.000 1.000 1.000
Secondtier 31,608 0.093 0.291 0.000 0.000 0.000
Specialist 31,608 0.235 0.424 0.000 0.000 0.000
AGR 31,608 51.623 27.574 28.000 52.000 75.000
Busy 31,608 0.739 0.439 0.000 1.000 1.000
AUD_WLC 31,608 0.396 0.268 0.144 0.404 0.625
OfficeSize 31,608 16.832 1.933 15.637 17.170 18.269
Panel B: Multiple Regression Analysis
Pr(Commentletterit =1) = α0 + α1Fileontime_lastweekit + α2Fileontime_lastdayit +
α3FileNT_first12daysit + α4FileNTlast3daysit + α5FileLateit + α6LnMVEit + α7Ageit +
α8Leverageit + α9MTBit + α10FINit + α11M&Ait + α12Lossit + α13ICMWit + α14Restateit +
α15Rank_zscoreit + α16VarReturnit + α17BigNit + α18Secondtierit + α19Specialistit + α20AGRit
+ α21Busyit + α22AUD_WLCit + α23OfficeSizeit + αjIndustry FE + αkYear FE + ɛit (2)
DV=Commentletter
Variables Pred. Coefficient (p-value) Odds Ratio
Intercept ? -5.789 *** (<.001)
Fileontime_lastweek + 0.116 *** (.001) 1.123
Fileontime_lastday + 0.158 *** (.004) 1.171
FileNT_first12days + 0.319 *** (<.001) 1.376
FileNT_last3days + 0.278 *** (.009) 1.320
FileLate + 0.548 ** (.010) 1.730
LnMVE + 0.166 *** (<.001)
Age + 0.003 *** (.005)
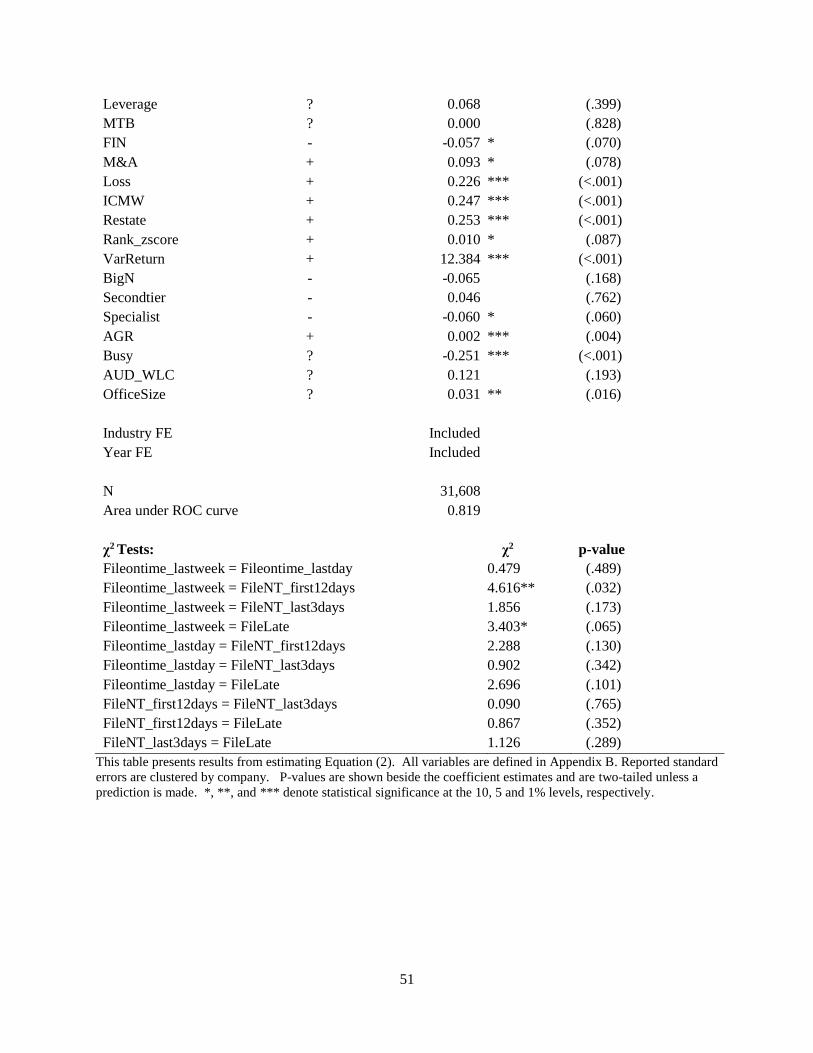
51
Leverage ? 0.068 (.399)
MTB ? 0.000 (.828)
FIN - -0.057 * (.070)
M&A + 0.093 * (.078)
Loss + 0.226 *** (<.001)
ICMW + 0.247 *** (<.001)
Restate + 0.253 *** (<.001)
Rank_zscore + 0.010 * (.087)
VarReturn + 12.384 *** (<.001)
BigN - -0.065 (.168)
Secondtier - 0.046 (.762)
Specialist - -0.060 * (.060)
AGR + 0.002 *** (.004)
Busy ? -0.251 *** (<.001)
AUD_WLC ? 0.121 (.193)
OfficeSize ? 0.031 ** (.016)
Industry FE Included
Year FE Included
N 31,608
Area under ROC curve 0.819
χ2 Tests: χ2 p-value
Fileontime_lastweek = Fileontime_lastday 0.479 (.489)
Fileontime_lastweek = FileNT_first12days 4.616** (.032)
Fileontime_lastweek = FileNT_last3days 1.856 (.173)
Fileontime_lastweek = FileLate 3.403* (.065)
Fileontime_lastday = FileNT_first12days 2.288 (.130)
Fileontime_lastday = FileNT_last3days 0.902 (.342)
Fileontime_lastday = FileLate 2.696 (.101)
FileNT_first12days = FileNT_last3days 0.090 (.765)
FileNT_first12days = FileLate 0.867 (.352)
FileNT_last3days = FileLate 1.126 (.289)
This table presents results from estimating Equation (2). All variables are defined in Appendix B. Reported standard
errors are clustered by company. P-values are shown beside the coefficient estimates and are two-tailed unless a
prediction is made. *, **, and *** denote statistical significance at the 10, 5 and 1% levels, respectively.
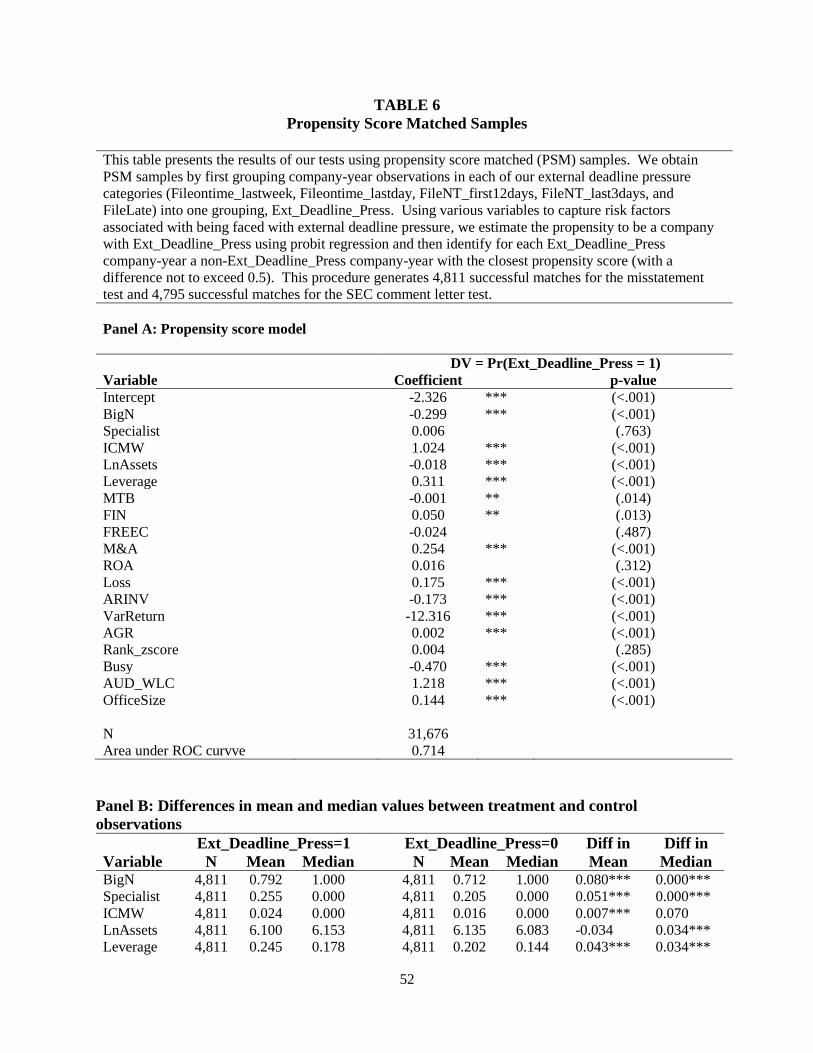
52
TABLE 6
Propensity Score Matched Samples
This table presents the results of our tests using propensity score matched (PSM) samples. We obtain
PSM samples by first grouping company-year observations in each of our external deadline pressure
categories (Fileontime_lastweek, Fileontime_lastday, FileNT_first12days, FileNT_last3days, and
FileLate) into one grouping, Ext_Deadline_Press. Using various variables to capture risk factors
associated with being faced with external deadline pressure, we estimate the propensity to be a company
with Ext_Deadline_Press using probit regression and then identify for each Ext_Deadline_Press
company-year a non-Ext_Deadline_Press company-year with the closest propensity score (with a
difference not to exceed 0.5). This procedure generates 4,811 successful matches for the misstatement
test and 4,795 successful matches for the SEC comment letter test.
Panel A: Propensity score model
DV = Pr(Ext_Deadline_Press = 1)
Variable Coefficient p-value
Intercept -2.326 *** (<.001)
BigN -0.299 *** (<.001)
Specialist 0.006 (.763)
ICMW 1.024 *** (<.001)
LnAssets -0.018 *** (<.001)
Leverage 0.311 *** (<.001)
MTB -0.001 ** (.014)
FIN 0.050 ** (.013)
FREEC -0.024 (.487)
M&A 0.254 *** (<.001)
ROA 0.016 (.312)
Loss 0.175 *** (<.001)
ARINV -0.173 *** (<.001)
VarReturn -12.316 *** (<.001)
AGR 0.002 *** (<.001)
Rank_zscore 0.004 (.285)
Busy -0.470 *** (<.001)
AUD_WLC 1.218 *** (<.001)
OfficeSize 0.144 *** (<.001)
N 31,676
Area under ROC curvve 0.714
Panel B: Differences in mean and median values between treatment and control
observations
Ext_Deadline_Press=1 Ext_Deadline_Press=0 Diff in Diff in
Variable N Mean Median N Mean Median Mean Median BigN 4,811 0.792 1.000 4,811 0.712 1.000 0.080*** 0.000***
Specialist 4,811 0.255 0.000 4,811 0.205 0.000 0.051*** 0.000***
ICMW 4,811 0.024 0.000 4,811 0.016 0.000 0.007*** 0.070
LnAssets 4,811 6.100 6.153 4,811 6.135 6.083 -0.034 0.034***
Leverage 4,811 0.245 0.178 4,811 0.202 0.144 0.043*** 0.034***
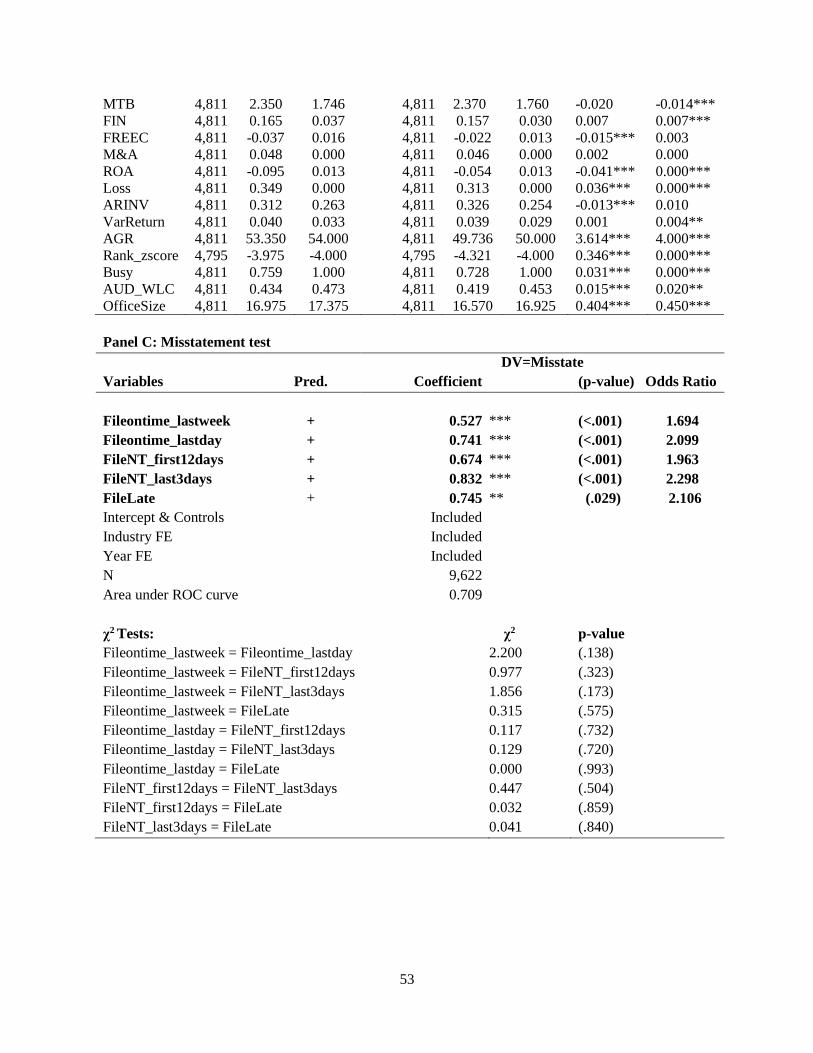
53
MTB 4,811 2.350 1.746 4,811 2.370 1.760 -0.020 -0.014***
FIN 4,811 0.165 0.037 4,811 0.157 0.030 0.007 0.007***
FREEC 4,811 -0.037 0.016 4,811 -0.022 0.013 -0.015*** 0.003
M&A 4,811 0.048 0.000 4,811 0.046 0.000 0.002 0.000
ROA 4,811 -0.095 0.013 4,811 -0.054 0.013 -0.041*** 0.000***
Loss 4,811 0.349 0.000 4,811 0.313 0.000 0.036*** 0.000***
ARINV 4,811 0.312 0.263 4,811 0.326 0.254 -0.013*** 0.010
VarReturn 4,811 0.040 0.033 4,811 0.039 0.029 0.001 0.004**
AGR 4,811 53.350 54.000 4,811 49.736 50.000 3.614*** 4.000***
Rank_zscore 4,795 -3.975 -4.000 4,795 -4.321 -4.000 0.346*** 0.000***
Busy 4,811 0.759 1.000 4,811 0.728 1.000 0.031*** 0.000***
AUD_WLC 4,811 0.434 0.473 4,811 0.419 0.453 0.015*** 0.020**
OfficeSize 4,811 16.975 17.375 4,811 16.570 16.925 0.404*** 0.450***
Panel C: Misstatement test
DV=Misstate
Variables Pred. Coefficient (p-value) Odds Ratio
Fileontime_lastweek + 0.527 *** (<.001) 1.694
Fileontime_lastday + 0.741 *** (<.001) 2.099
FileNT_first12days + 0.674 *** (<.001) 1.963
FileNT_last3days + 0.832 *** (<.001) 2.298
FileLate + 0.745 ** (.029) 2.106
Intercept & Controls Included
Industry FE Included
Year FE Included
N 9,622
Area under ROC curve 0.709
χ2 Tests: χ2 p-value
Fileontime_lastweek = Fileontime_lastday 2.200 (.138)
Fileontime_lastweek = FileNT_first12days 0.977 (.323)
Fileontime_lastweek = FileNT_last3days 1.856 (.173)
Fileontime_lastweek = FileLate 0.315 (.575)
Fileontime_lastday = FileNT_first12days 0.117 (.732)
Fileontime_lastday = FileNT_last3days 0.129 (.720)
Fileontime_lastday = FileLate 0.000 (.993)
FileNT_first12days = FileNT_last3days 0.447 (.504)
FileNT_first12days = FileLate 0.032 (.859)
FileNT_last3days = FileLate 0.041 (.840)
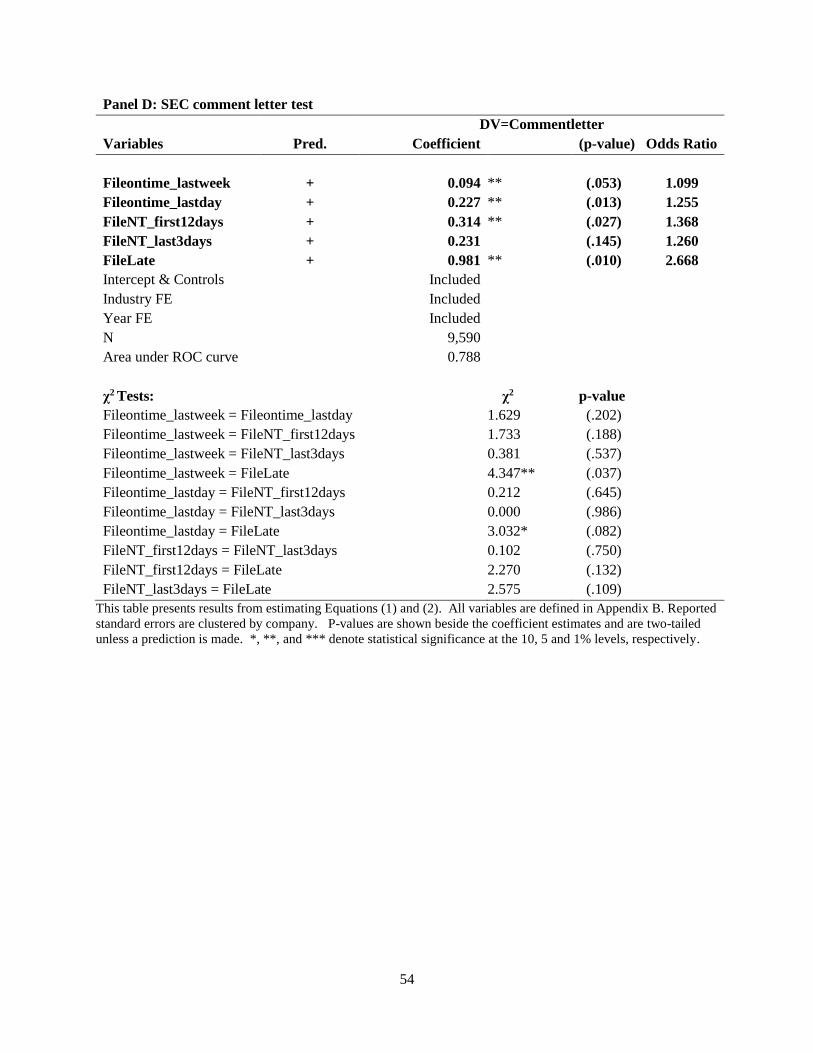
54
Panel D: SEC comment letter test
DV=Commentletter
Variables Pred. Coefficient (p-value) Odds Ratio
Fileontime_lastweek + 0.094 ** (.053) 1.099
Fileontime_lastday + 0.227 ** (.013) 1.255
FileNT_first12days + 0.314 ** (.027) 1.368
FileNT_last3days + 0.231 (.145) 1.260
FileLate + 0.981 ** (.010) 2.668
Intercept & Controls Included
Industry FE Included
Year FE Included
N 9,590
Area under ROC curve 0.788
χ2 Tests: χ2 p-value
Fileontime_lastweek = Fileontime_lastday 1.629 (.202)
Fileontime_lastweek = FileNT_first12days 1.733 (.188)
Fileontime_lastweek = FileNT_last3days 0.381 (.537)
Fileontime_lastweek = FileLate 4.347** (.037)
Fileontime_lastday = FileNT_first12days 0.212 (.645)
Fileontime_lastday = FileNT_last3days 0.000 (.986)
Fileontime_lastday = FileLate 3.032* (.082)
FileNT_first12days = FileNT_last3days 0.102 (.750)
FileNT_first12days = FileLate 2.270 (.132)
FileNT_last3days = FileLate 2.575 (.109)
This table presents results from estimating Equations (1) and (2). All variables are defined in Appendix B. Reported
standard errors are clustered by company. P-values are shown beside the coefficient estimates and are two-tailed
unless a prediction is made. *, **, and *** denote statistical significance at the 10, 5 and 1% levels, respectively.
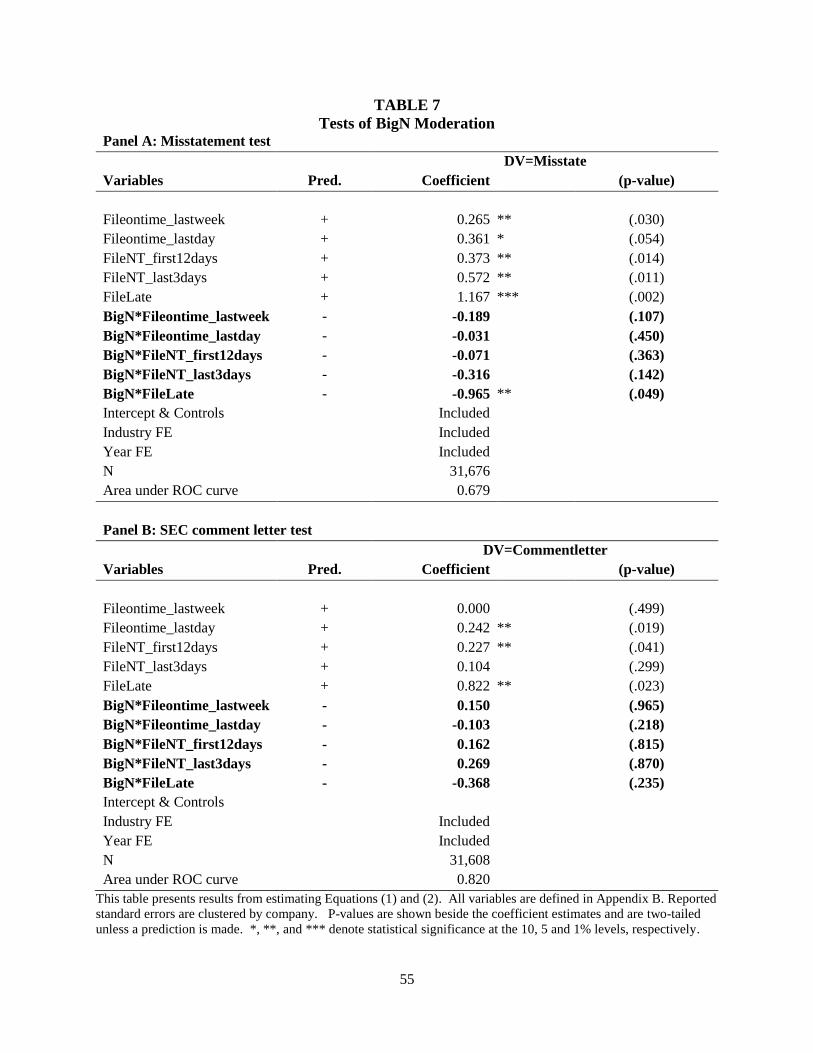
55
TABLE 7
Tests of BigN Moderation Panel A: Misstatement test
DV=Misstate
Variables Pred. Coefficient (p-value)
Fileontime_lastweek + 0.265 ** (.030)
Fileontime_lastday + 0.361 * (.054)
FileNT_first12days + 0.373 ** (.014)
FileNT_last3days + 0.572 ** (.011)
FileLate + 1.167 *** (.002)
BigN*Fileontime_lastweek - -0.189 (.107)
BigN*Fileontime_lastday - -0.031 (.450)
BigN*FileNT_first12days - -0.071 (.363)
BigN*FileNT_last3days - -0.316 (.142)
BigN*FileLate - -0.965 ** (.049)
Intercept & Controls Included
Industry FE Included
Year FE Included
N 31,676
Area under ROC curve 0.679
Panel B: SEC comment letter test
DV=Commentletter
Variables Pred. Coefficient (p-value)
Fileontime_lastweek + 0.000 (.499)
Fileontime_lastday + 0.242 ** (.019)
FileNT_first12days + 0.227 ** (.041)
FileNT_last3days + 0.104 (.299)
FileLate + 0.822 ** (.023)
BigN*Fileontime_lastweek - 0.150 (.965)
BigN*Fileontime_lastday - -0.103 (.218)
BigN*FileNT_first12days - 0.162 (.815)
BigN*FileNT_last3days - 0.269 (.870)
BigN*FileLate - -0.368 (.235)
Intercept & Controls
Industry FE Included
Year FE Included
N 31,608
Area under ROC curve 0.820
This table presents results from estimating Equations (1) and (2). All variables are defined in Appendix B. Reported
standard errors are clustered by company. P-values are shown beside the coefficient estimates and are two-tailed
unless a prediction is made. *, **, and *** denote statistical significance at the 10, 5 and 1% levels, respectively.
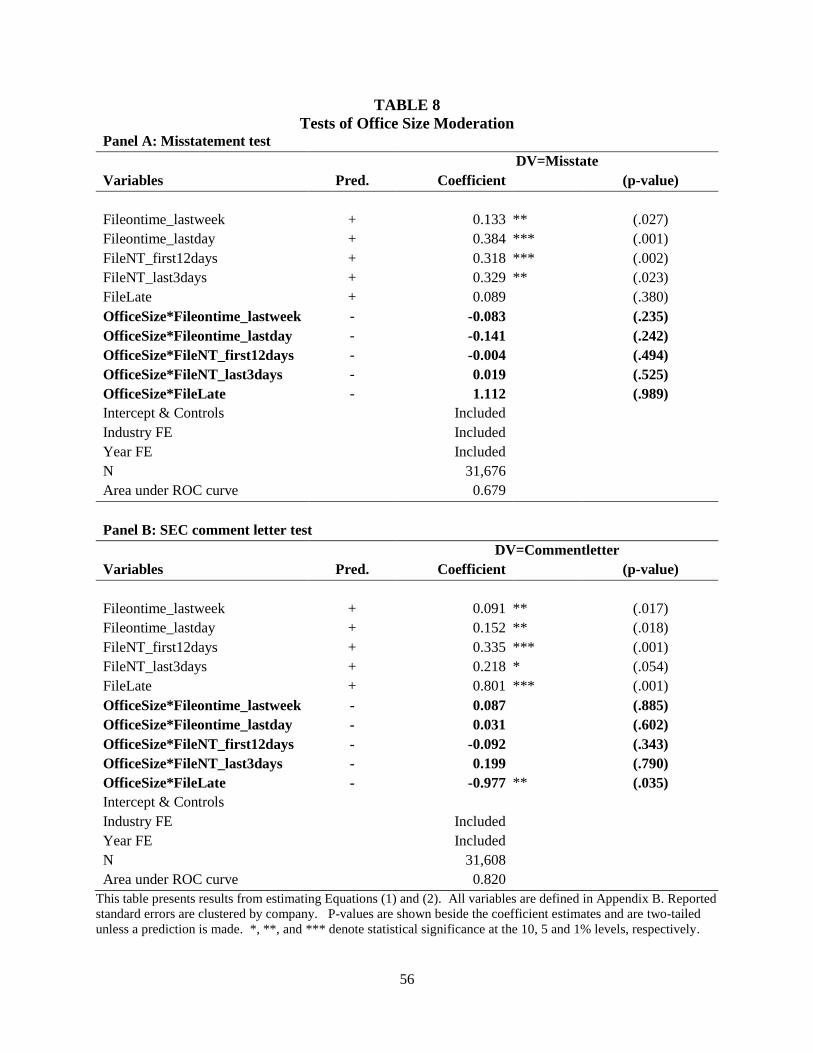
56
TABLE 8
Tests of Office Size Moderation Panel A: Misstatement test
DV=Misstate
Variables Pred. Coefficient (p-value)
Fileontime_lastweek + 0.133 ** (.027)
Fileontime_lastday + 0.384 *** (.001)
FileNT_first12days + 0.318 *** (.002)
FileNT_last3days + 0.329 ** (.023)
FileLate + 0.089 (.380)
OfficeSize*Fileontime_lastweek - -0.083 (.235)
OfficeSize*Fileontime_lastday - -0.141 (.242)
OfficeSize*FileNT_first12days - -0.004 (.494)
OfficeSize*FileNT_last3days - 0.019 (.525)
OfficeSize*FileLate - 1.112 (.989)
Intercept & Controls Included
Industry FE Included
Year FE Included
N 31,676
Area under ROC curve 0.679
Panel B: SEC comment letter test
DV=Commentletter
Variables Pred. Coefficient (p-value)
Fileontime_lastweek + 0.091 ** (.017)
Fileontime_lastday + 0.152 ** (.018)
FileNT_first12days + 0.335 *** (.001)
FileNT_last3days + 0.218 * (.054)
FileLate + 0.801 *** (.001)
OfficeSize*Fileontime_lastweek - 0.087 (.885)
OfficeSize*Fileontime_lastday - 0.031 (.602)
OfficeSize*FileNT_first12days - -0.092 (.343)
OfficeSize*FileNT_last3days - 0.199 (.790)
OfficeSize*FileLate - -0.977 ** (.035)
Intercept & Controls
Industry FE Included
Year FE Included
N 31,608
Area under ROC curve 0.820
This table presents results from estimating Equations (1) and (2). All variables are defined in Appendix B. Reported
standard errors are clustered by company. P-values are shown beside the coefficient estimates and are two-tailed
unless a prediction is made. *, **, and *** denote statistical significance at the 10, 5 and 1% levels, respectively.
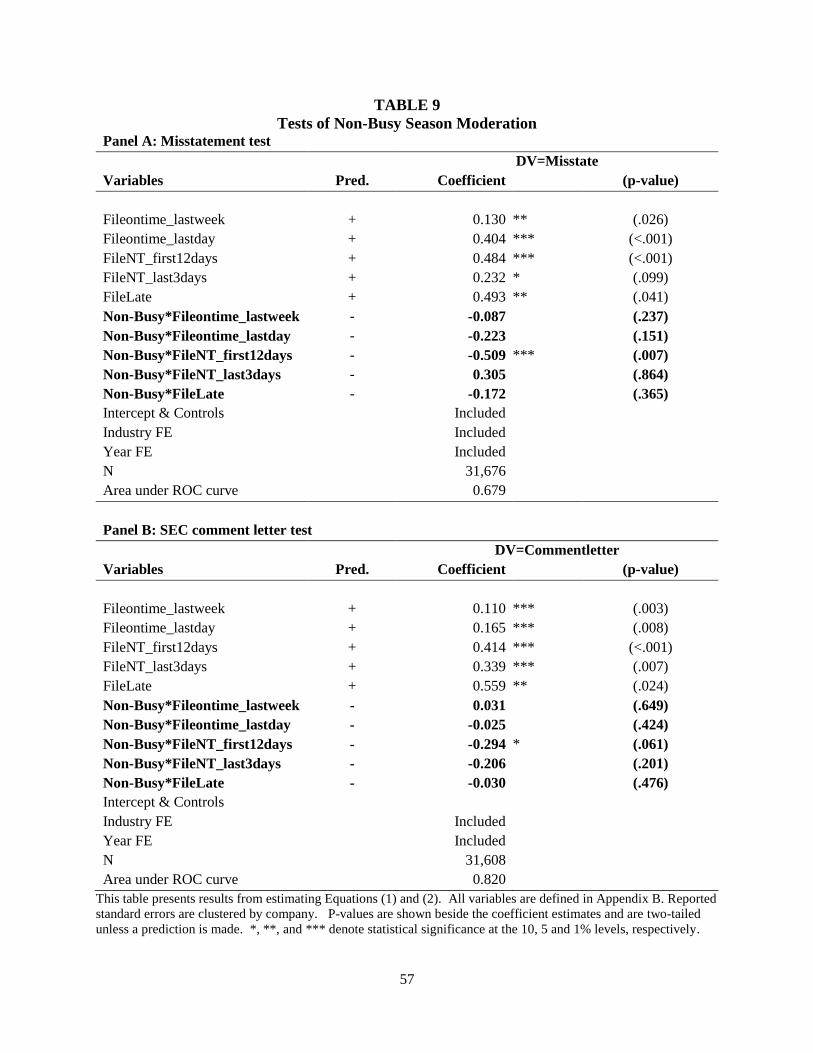
57
TABLE 9
Tests of Non-Busy Season Moderation Panel A: Misstatement test
DV=Misstate
Variables Pred. Coefficient (p-value)
Fileontime_lastweek + 0.130 ** (.026)
Fileontime_lastday + 0.404 *** (<.001)
FileNT_first12days + 0.484 *** (<.001)
FileNT_last3days + 0.232 * (.099)
FileLate + 0.493 ** (.041)
Non-Busy*Fileontime_lastweek - -0.087 (.237)
Non-Busy*Fileontime_lastday - -0.223 (.151)
Non-Busy*FileNT_first12days - -0.509 *** (.007)
Non-Busy*FileNT_last3days - 0.305 (.864)
Non-Busy*FileLate - -0.172 (.365)
Intercept & Controls Included
Industry FE Included
Year FE Included
N 31,676
Area under ROC curve 0.679
Panel B: SEC comment letter test
DV=Commentletter
Variables Pred. Coefficient (p-value)
Fileontime_lastweek + 0.110 *** (.003)
Fileontime_lastday + 0.165 *** (.008)
FileNT_first12days + 0.414 *** (<.001)
FileNT_last3days + 0.339 *** (.007)
FileLate + 0.559 ** (.024)
Non-Busy*Fileontime_lastweek - 0.031 (.649)
Non-Busy*Fileontime_lastday - -0.025 (.424)
Non-Busy*FileNT_first12days - -0.294 * (.061)
Non-Busy*FileNT_last3days - -0.206 (.201)
Non-Busy*FileLate - -0.030 (.476)
Intercept & Controls
Industry FE Included
Year FE Included
N 31,608
Area under ROC curve 0.820
This table presents results from estimating Equations (1) and (2). All variables are defined in Appendix B. Reported
standard errors are clustered by company. P-values are shown beside the coefficient estimates and are two-tailed
unless a prediction is made. *, **, and *** denote statistical significance at the 10, 5 and 1% levels, respectively.
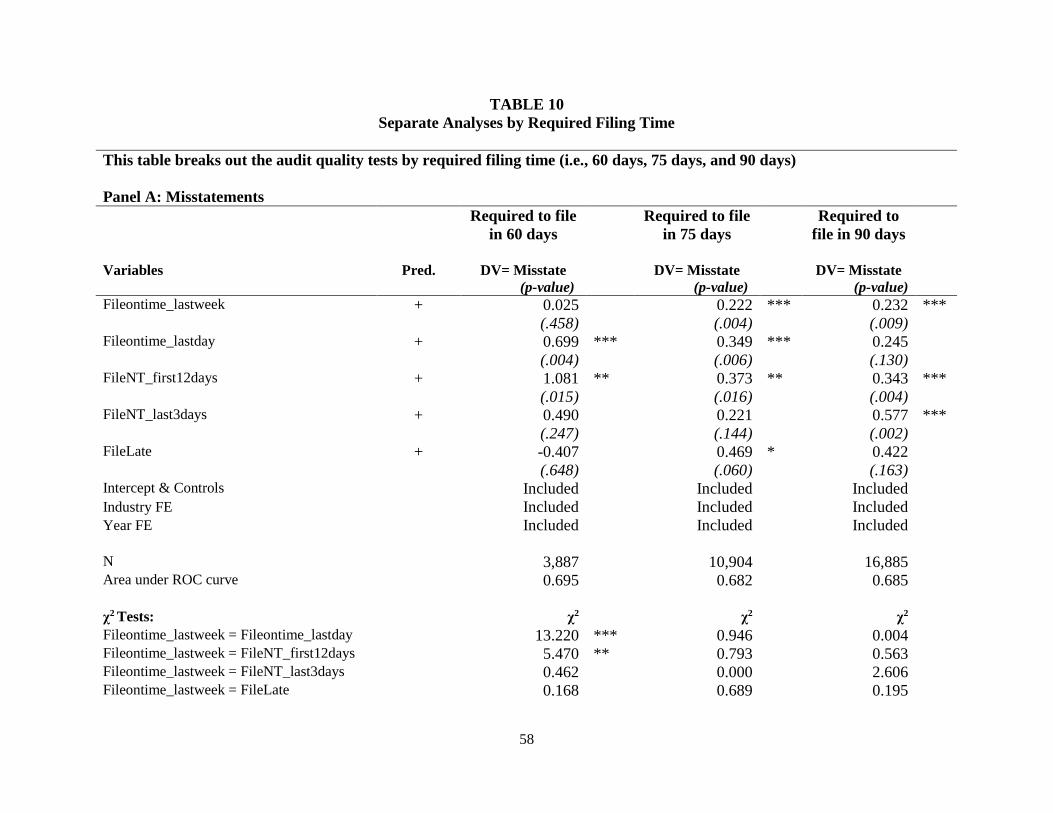
58
TABLE 10
Separate Analyses by Required Filing Time
This table breaks out the audit quality tests by required filing time (i.e., 60 days, 75 days, and 90 days)
Panel A: Misstatements
Required to file
in 60 days
Required to file
in 75 days
Required to
file in 90 days
Variables Pred. DV= Misstate
(p-value) DV= Misstate
(p-value) DV= Misstate
(p-value)
Fileontime_lastweek + 0.025 0.222 *** 0.232 *** (.458) (.004) (.009) Fileontime_lastday + 0.699 *** 0.349 *** 0.245 (.004) (.006) (.130) FileNT_first12days + 1.081 ** 0.373 ** 0.343 *** (.015) (.016) (.004) FileNT_last3days + 0.490 0.221 0.577 *** (.247) (.144) (.002) FileLate + -0.407 0.469 * 0.422 (.648) (.060) (.163) Intercept & Controls Included Included Included Industry FE Included Included Included Year FE Included Included Included
N 3,887 10,904 16,885 Area under ROC curve 0.695 0.682 0.685
χ2 Tests: χ2 χ2 χ2 Fileontime_lastweek = Fileontime_lastday 13.220 *** 0.946 0.004 Fileontime_lastweek = FileNT_first12days 5.470 ** 0.793 0.563 Fileontime_lastweek = FileNT_last3days 0.462 0.000 2.606 Fileontime_lastweek = FileLate 0.168 0.689 0.195
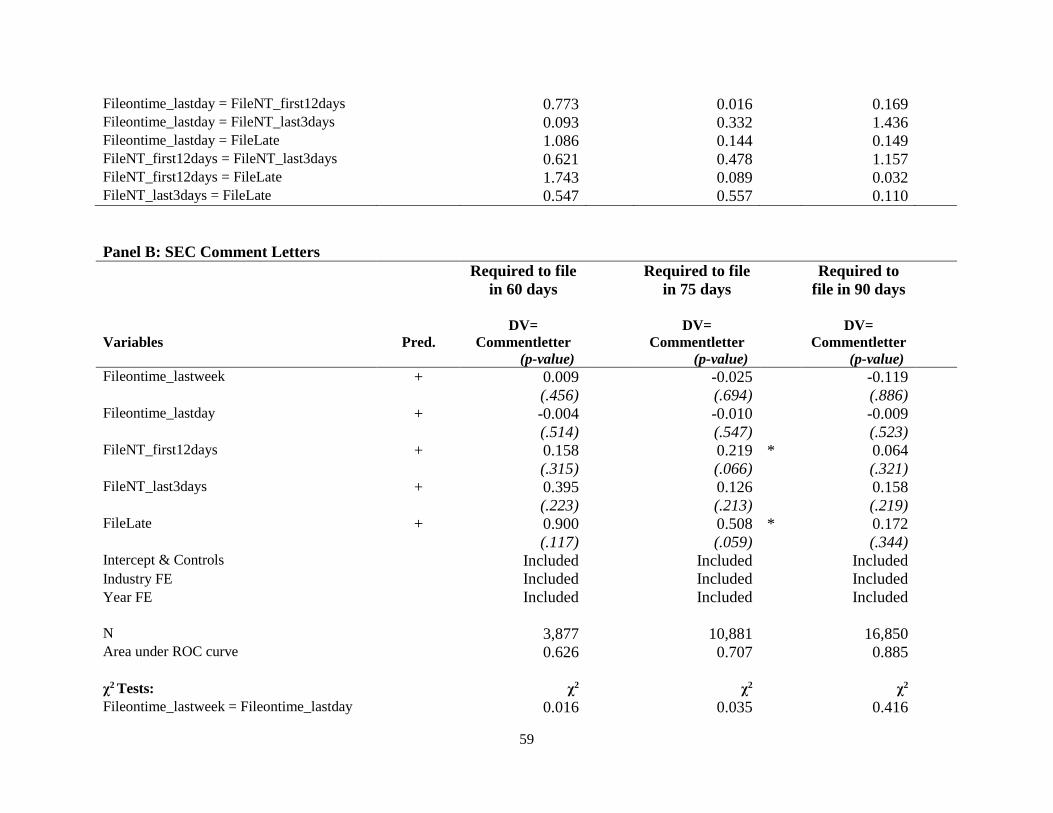
59
Fileontime_lastday = FileNT_first12days 0.773 0.016 0.169 Fileontime_lastday = FileNT_last3days 0.093 0.332 1.436 Fileontime_lastday = FileLate 1.086 0.144 0.149 FileNT_first12days = FileNT_last3days 0.621 0.478 1.157 FileNT_first12days = FileLate 1.743 0.089 0.032 FileNT_last3days = FileLate 0.547 0.557 0.110
Panel B: SEC Comment Letters
Required to file
in 60 days
Required to file
in 75 days
Required to
file in 90 days
Variables
Pred. DV=
Commentletter
(p-value)
DV=
Commentletter
(p-value)
DV=
Commentletter
(p-value)
Fileontime_lastweek + 0.009 -0.025 -0.119 (.456) (.694) (.886) Fileontime_lastday + -0.004 -0.010 -0.009 (.514) (.547) (.523) FileNT_first12days + 0.158 0.219 * 0.064 (.315) (.066) (.321) FileNT_last3days + 0.395 0.126 0.158 (.223) (.213) (.219) FileLate + 0.900 0.508 * 0.172 (.117) (.059) (.344) Intercept & Controls Included Included Included Industry FE Included Included Included Year FE Included Included Included
N 3,877 10,881 16,850 Area under ROC curve 0.626 0.707 0.885
χ2 Tests: χ2 χ2 χ2 Fileontime_lastweek = Fileontime_lastday 0.016 0.035 0.416
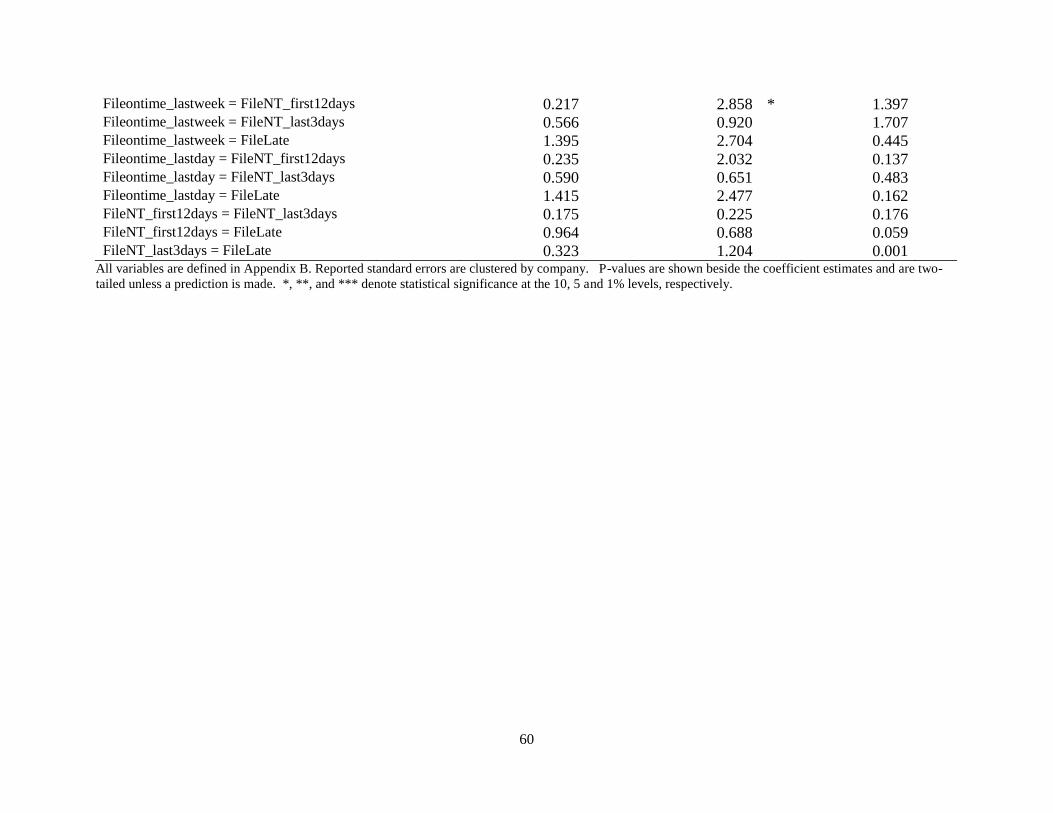
60
Fileontime_lastweek = FileNT_first12days 0.217 2.858 * 1.397 Fileontime_lastweek = FileNT_last3days 0.566 0.920 1.707 Fileontime_lastweek = FileLate 1.395 2.704 0.445 Fileontime_lastday = FileNT_first12days 0.235 2.032 0.137 Fileontime_lastday = FileNT_last3days 0.590 0.651 0.483 Fileontime_lastday = FileLate 1.415 2.477 0.162 FileNT_first12days = FileNT_last3days 0.175 0.225 0.176 FileNT_first12days = FileLate 0.964 0.688 0.059 FileNT_last3days = FileLate 0.323 1.204 0.001
All variables are defined in Appendix B. Reported standard errors are clustered by company. P-values are shown beside the coefficient estimates and are two-
tailed unless a prediction is made. *, **, and *** denote statistical significance at the 10, 5 and 1% levels, respectively.
![Wing-Wake Interaction and its Proper Orthogonal Decomposition … · the immersed body are imposed through a ―ghost-cell‖ procedure [19]. The pressure Poisson equation is solved](https://img.pdfslide.net/doc/110x75/5ff93f632a17be0d0738282c/wing-wake-interaction-and-its-proper-orthogonal-decomposition-the-immersed-body.jpg)