Embed Size (px)
Citation preview
E M E R G E N C Y M E D I C A L S E R V I C E S / O R I G I N A L R E S E A R C H
1 0 0 A N N A L S O F E M E R G E N C Y M E D I C I N E 4 3 : 1 J A N U A R Y 2 0 0 4
Marc Eckstein, MDLinda S. Chan, PhD
From the Department ofEmergency Medicine (Eckstein,Chan) and the Departments ofPediatrics and Surgery (Chan),Keck School of Medicine of theUniversity of Southern Cali-fornia; Los Angeles County +University of Southern Califor-nia Medical Center; and the LosAngeles Fire Department(Eckstein), Los Angeles, CA.
0196-0644/$30.00
Copyright © 2004 by the AmericanCollege of Emergency Physicians.
doi:10.1016/mem.2004.410
The Effect of Emergency Department Crowding
on Paramedic Ambulance Availability
Study objective: We determine the effect of emergency department (ED) crowdingon paramedic ambulance availability.
Methods: This was a prospective longitudinal study from April 2001 through March2002 in Los Angeles, CA. All incidents in which a Los Angeles Fire Department ambu-lance was out of service for more than 15 minutes while waiting to transfer a patientbecause of the lack of open ED beds were captured and analyzed. Data included thetotal time each ambulance was out of service and the hospital where paramedicswere waiting for an open gurney. Analysis was performed to determine weekly andseasonal variations and preponderance at various hospitals.
Results: There were a total of 21,240 incidents in which ambulances were out ofservice while waiting to transfer their patients to an open ED gurney, which accountedfor 1 of every 8 transports. Of these, 8.4% were in excess of 1 hour. The median wait-ing time per incident was 27 minutes, with an interquartile range of 20 to 40. Therewas a statistically significant difference in the monthly number of out-of-service inci-dents during the study (P<.0001), with the highest levels during the winter (Januarythrough March).
Conclusion: ED crowding has resulted in delays for paramedics waiting to transferpatients. This decrease in ambulance availability may have a significant effect onemergency medical services systems’ abilities to provide timely response.
[Ann Emerg Med. 2004;43:100-105.]
I N T R O D U C T I O N
Emergency department (ED) crowding and diminishing inpatient capacity have re-ceived a great deal of attention in the medical literature and the lay press as a nation-wide problem.1-5 When paramedics transport a patient to a crowded ED, they areoften confronted with the unavailability of an empty ED gurney. The paramedics mustwait in the ED with their patient on the ambulance stretcher until an ED gurney be-comes available. These waits can vary from only a few minutes to several hours.During this time, the paramedic ambulance is out of service to respond to additionalcalls. When multiple ambulances are out of service, there is a potentially significantnegative effect on the ability to provide emergency medical services (EMS) to thecommunity.
A M B U L A N C E A V A I L A B I L I T Y Eckstein & Chan
J A N U A R Y 2 0 0 4 4 3 : 1 A N N A L S O F E M E R G E N C Y M E D I C I N E 1 0 1
minutes. This transfer includes unloading the patientfrom the ambulance, moving the ambulance stretcherinside the ED, giving the report to the triage nurse, trans-ferring the patient to an ED gurney, completing paper-work, and preparing the equipment for the next run.
Ambulance crews are required to notify the dispatchcenter if they will be unavailable for another responsefor longer than 15 minutes for any reason. However, firedepartment dispatchers must code not only the elapsedtime in the ED but also the reason for the delay. Causesfor these delays may include the need to decontaminatethe ambulance after a critical patient, an equipmentmalfunction, an extenuating circumstance such as aninvestigation about patient care, or a delay because ofthe unavailability of an open gurney in the ED. Firedepartment dispatchers enter the time that the ambu-lance becomes unavailable and the reason (code) forthis delay in the ED, which is then captured in the dis-patch computer system. The computer automaticallycaptures the time the ambulance becomes available forthe next call when paramedics update their status ontheir mobile data terminal.
Unless a patient requires a specialized tertiary carefacility (eg, trauma center, pediatric critical care cen-ter), he or she is typically transported to the closest,most appropriate ED.7 If that ED is on diversion, thenparamedics can transport to an alternate facility if it canbe reached within 15 minutes by using lights and sirens.If there are no “open” EDs within this time, paramedicambulances must transport to the closest facility, regard-less of its diversion status.
According to the policies set by the Los AngelesCounty Department of Health Services, a hospital mayrequest ambulance diversion because of ED saturation ifED resources are fully committed and are not immedi-ately available for additional incoming patients trans-ported by advanced life support units, which may be dueto an excessive volume of ED patients or a lack of avail-able inpatient beds for ED patients awaiting admission.8
When paramedics transport to an ED that is alreadyon diversion, there may not be an open gurney to whichthe patient may be transferred. Paramedics must thenwait with their patient until a gurney becomes avail-able. Once this elapsed time exceeds 15 minutes, para-medics must notify dispatch that the ambulance is outof service and they are unable to respond to additionalcalls until further notice.
From April 2001 through March 2002, each incidentof an ambulance being out of service because of the un-availability of an open ED gurney was prospectively
This study describes the effect of ED crowding onparamedic ambulance availability. Causes of the prob-lem and strategies to mitigate this issue are discussed.
M A T E R I A L S A N D M E T H O D S
The Los Angeles Fire Department provides EMS for the3.8 million residents of the nation’s second-largest city.6
It has 67 advanced life support ambulances and 31 basiclife support ambulances that responded to approxi-mately 270,000 EMS calls in 2002, of which 172,981(64%) resulted in patient transport to area hospitals. Ofthese transports, 131,000 (75%) are transported byadvanced life support ambulances (staffed by 2 fire-fighter/paramedics). The remainder of patients aretransported by basic life support ambulances, which arestaffed by 2 firefighter/emergency medical technicians(EMTs). Paramedic units tend to transport more seri-ously ill patients, unless an emergency medical techni-cian ambulance is unavailable to transport patientsrequiring only basic life support.
Los Angeles Fire Department ambulances transportpatients to 59 EDs in the greater Los Angeles area. Thecomputer system that displays the diversion status ofeach hospital is displayed on the mobile data terminalthat is present on every ambulance, which allows para-medics to determine the diversion status of each hospi-tal at all times.
When an ambulance transports a patient to an ED, thecrew is expected to transfer care of the patient within 15
Capsule Summary
What is already known on this topicAlthough anecdotally emergency department (ED) crowding isbelieved to affect ambulance usage and ability, this has not beenwell documented in large systems.
What question this study addressedHow often paramedic ambulances in Los Angeles were out ofservice for 15 minutes or more while waiting for an open gurneyfor an emergency medical services (EMS) patient who had arrivedin the ED.
What this study adds to our knowledgeIn 1 year, there were 21,240 such delays; 12.5% of all transports.The frequency of delay varied markedly by hospital. The mediandelay was 27 minutes, and 8% of the delays were 1 hour or longer.
How this might change clinical practiceIn this metropolitan area, delayed transfer of EMS patients to EDcare due to crowding was frequent and took a sizable proportionof EMS units out of service at any given time.
A M B U L A N C E A V A I L A B I L I T Y Eckstein & Chan
1 0 2 A N N A L S O F E M E R G E N C Y M E D I C I N E 4 3 : 1 J A N U A R Y 2 0 0 4
(The BMDP Statistical Software, Inc., Los Angeles, CA)was used for all statistical analysis.
Approval for the study was granted by the institu-tional review board of the University of SouthernCalifornia.
R E S U L T S
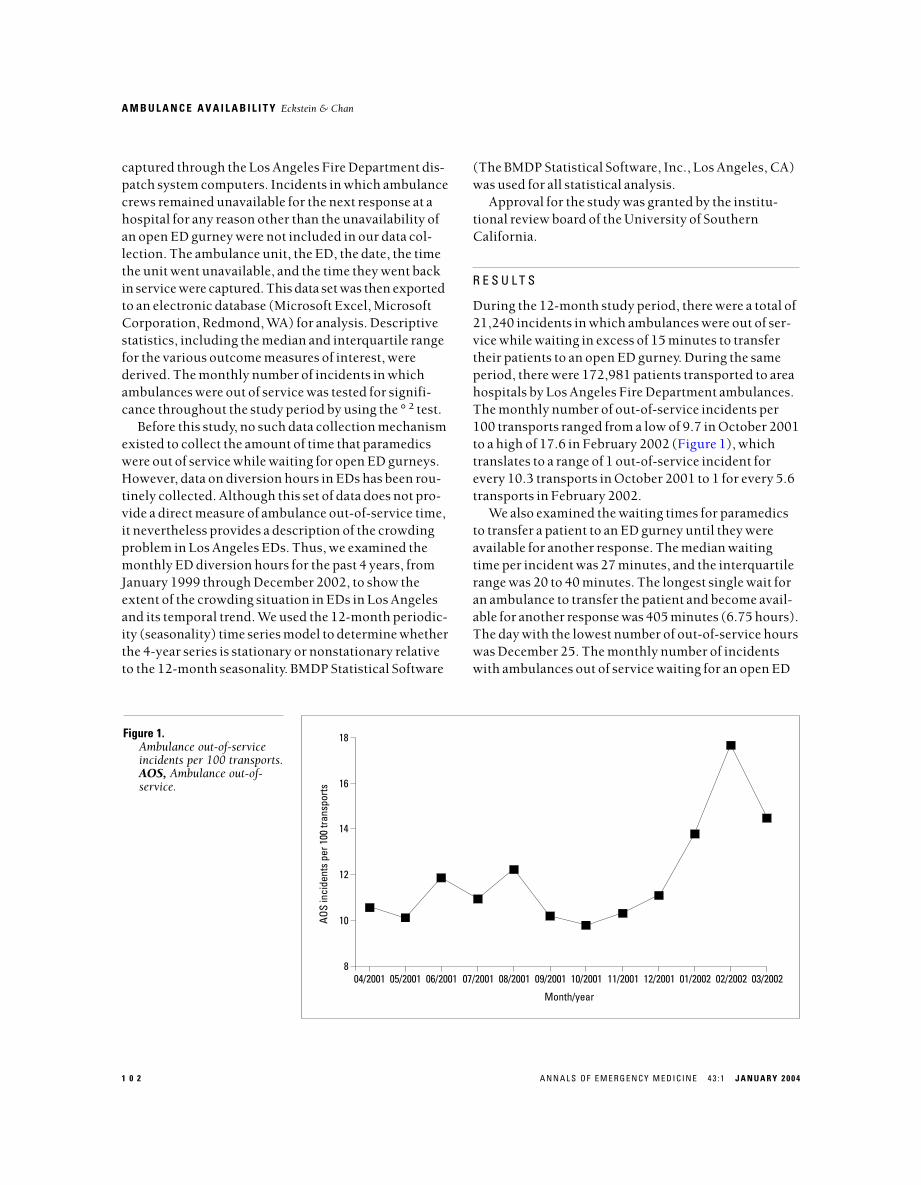
During the 12-month study period, there were a total of21,240 incidents in which ambulances were out of ser-vice while waiting in excess of 15 minutes to transfertheir patients to an open ED gurney. During the sameperiod, there were 172,981 patients transported to areahospitals by Los Angeles Fire Department ambulances.The monthly number of out-of-service incidents per100 transports ranged from a low of 9.7 in October 2001to a high of 17.6 in February 2002 (Figure 1), whichtranslates to a range of 1 out-of-service incident forevery 10.3 transports in October 2001 to 1 for every 5.6transports in February 2002.
We also examined the waiting times for paramedicsto transfer a patient to an ED gurney until they wereavailable for another response. The median waitingtime per incident was 27 minutes, and the interquartilerange was 20 to 40 minutes. The longest single wait foran ambulance to transfer the patient and become avail-able for another response was 405 minutes (6.75 hours).The day with the lowest number of out-of-service hourswas December 25. The monthly number of incidentswith ambulances out of service waiting for an open ED
captured through the Los Angeles Fire Department dis-patch system computers. Incidents in which ambulancecrews remained unavailable for the next response at ahospital for any reason other than the unavailability ofan open ED gurney were not included in our data col-lection. The ambulance unit, the ED, the date, the timethe unit went unavailable, and the time they went backin service were captured. This data set was then exportedto an electronic database (Microsoft Excel, MicrosoftCorporation, Redmond, WA) for analysis. Descriptivestatistics, including the median and interquartile rangefor the various outcome measures of interest, werederived. The monthly number of incidents in whichambulances were out of service was tested for signifi-cance throughout the study period by using the °2 test.
Before this study, no such data collection mechanismexisted to collect the amount of time that paramedicswere out of service while waiting for open ED gurneys.However, data on diversion hours in EDs has been rou-tinely collected. Although this set of data does not pro-vide a direct measure of ambulance out-of-service time,it nevertheless provides a description of the crowdingproblem in Los Angeles EDs. Thus, we examined themonthly ED diversion hours for the past 4 years, fromJanuary 1999 through December 2002, to show theextent of the crowding situation in EDs in Los Angelesand its temporal trend. We used the 12-month periodic-ity (seasonality) time series model to determine whetherthe 4-year series is stationary or nonstationary relativeto the 12-month seasonality. BMDP Statistical Software
18
16
14
12
10
804/2001 05/2001 06/2001 07/2001 08/2001 09/2001 10/2001 11/2001 12/2001 01/2002 02/2002 03/2002
Month/year
AOS
inci
dent
s pe
r 100
tran
spor
ts
Figure 1.Ambulance out-of-serviceincidents per 100 transports.AOS, Ambulance out-of-service.
A M B U L A N C E A V A I L A B I L I T Y Eckstein & Chan
J A N U A R Y 2 0 0 4 4 3 : 1 A N N A L S O F E M E R G E N C Y M E D I C I N E 1 0 3
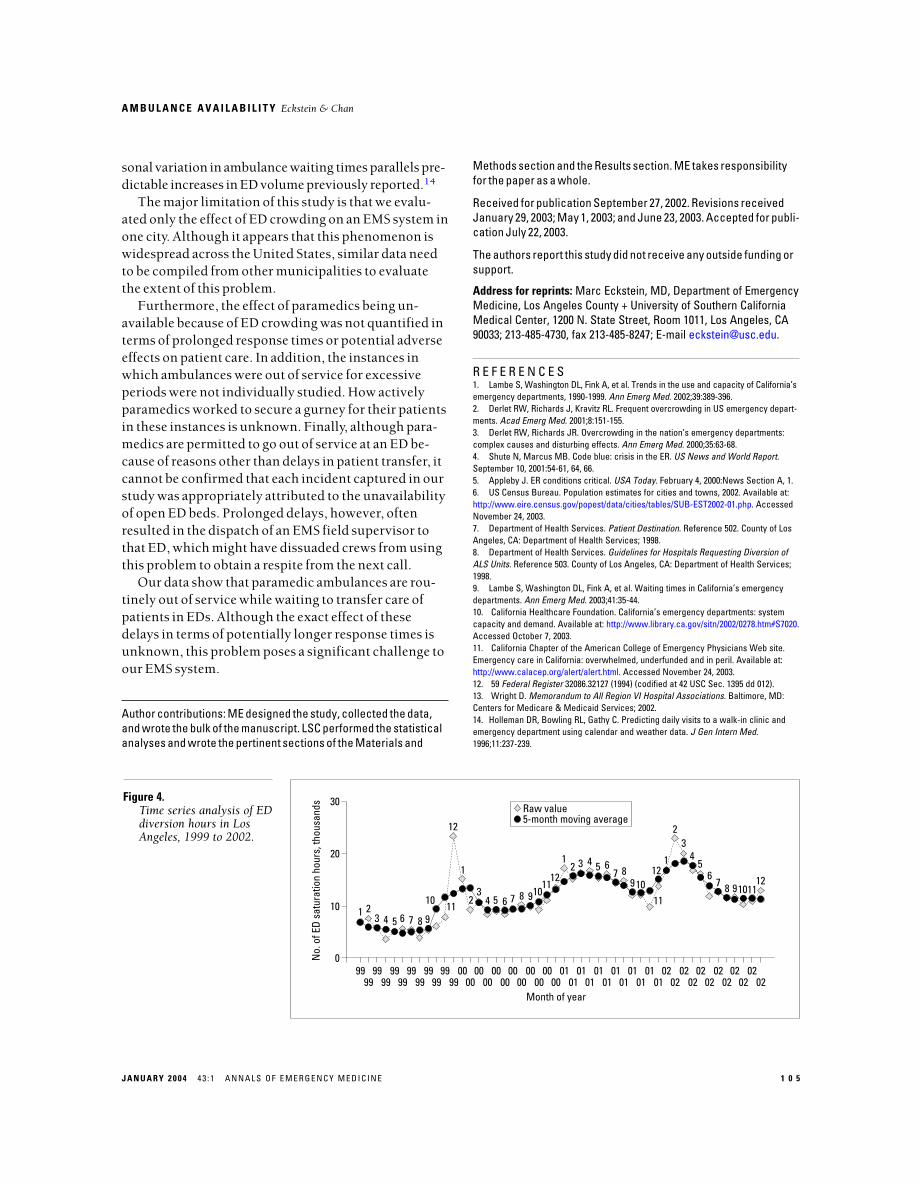
Figure 4 shows the pattern of ED diversion hoursover the past 4 years in Los Angeles from 1999 through2002. Analysis of the mean of the series indicated that itis a nonstationary series with a significant increasingtrend (P<.0001) over the 4-year period.
D I S C U S S I O N
A recent study from California EDs found that patientswaited an average of almost 1 hour before being treatedby a physician.9 Our data show that similar delays nowexist for paramedics to transfer care of their patients,having to wait for an open ED gurney.
Although hospitals accounting for the longest peri-ods of out-of-service time were concentrated in some ofthe most densely populated areas of the city, transfer ofcare delays occurred across all areas of Los Angeles,which demonstrates that it is not isolated to inner-cityhospitals or large teaching hospitals. The resultantnumber of times that ambulances must respond intothese areas to cover for the ambulances waiting in EDsis likely to be significant and crosses the entire socio-economic spectrum.
Citizens might assume that if there is an ambulancein their neighborhood fire station, it is available to re-spond in case of a medical emergency. However, ourdata show that this is often not the case, not because ofparamedics responding to another call but because ofhaving to wait in an ED for an open bed, sometimes forseveral hours.
gurney was significantly different throughout the studyperiod (P<.0001), with the highest levels during thewinter (January through March).
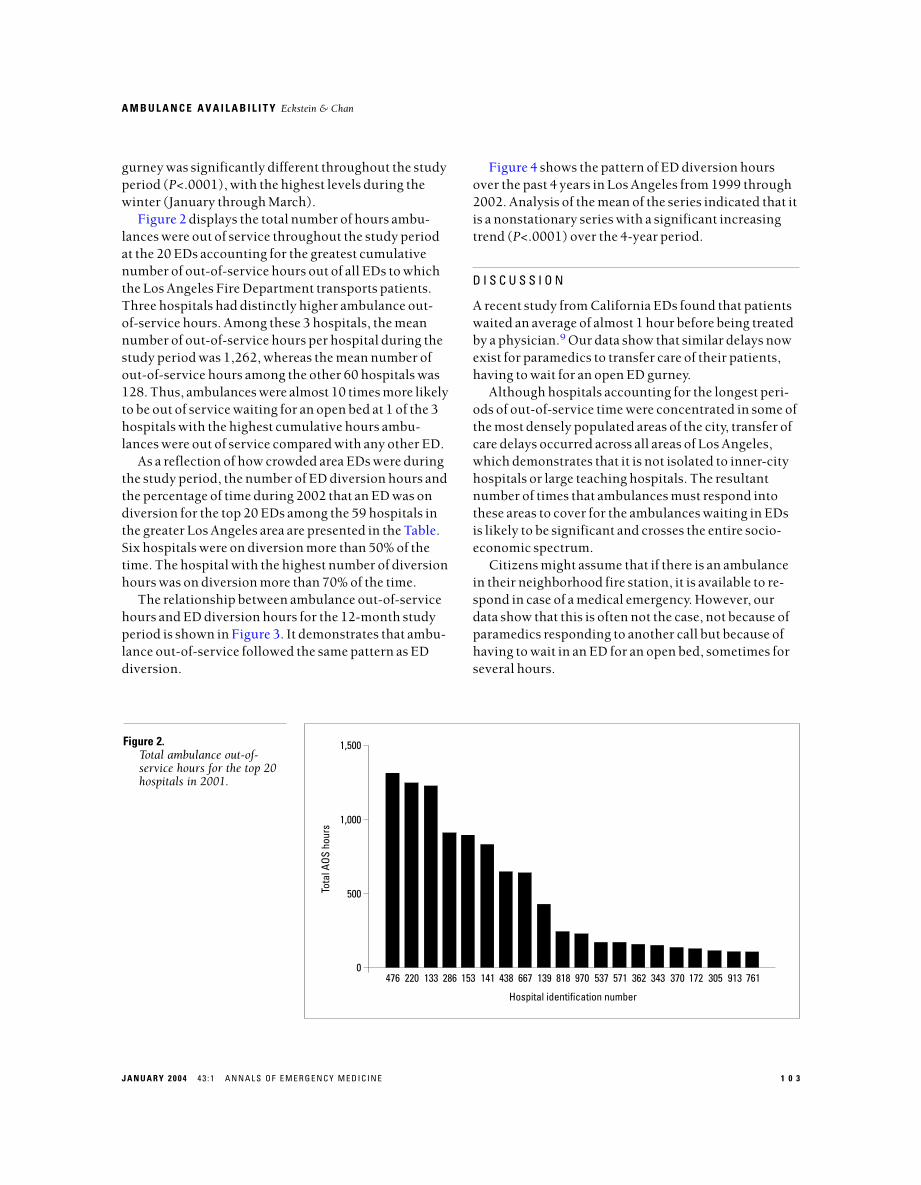
Figure 2 displays the total number of hours ambu-lances were out of service throughout the study periodat the 20 EDs accounting for the greatest cumulativenumber of out-of-service hours out of all EDs to whichthe Los Angeles Fire Department transports patients.Three hospitals had distinctly higher ambulance out-of-service hours. Among these 3 hospitals, the meannumber of out-of-service hours per hospital during thestudy period was 1,262, whereas the mean number ofout-of-service hours among the other 60 hospitals was128. Thus, ambulances were almost 10 times more likelyto be out of service waiting for an open bed at 1 of the 3hospitals with the highest cumulative hours ambu-lances were out of service compared with any other ED.
As a reflection of how crowded area EDs were duringthe study period, the number of ED diversion hours andthe percentage of time during 2002 that an ED was ondiversion for the top 20 EDs among the 59 hospitals inthe greater Los Angeles area are presented in the Table.Six hospitals were on diversion more than 50% of thetime. The hospital with the highest number of diversionhours was on diversion more than 70% of the time.
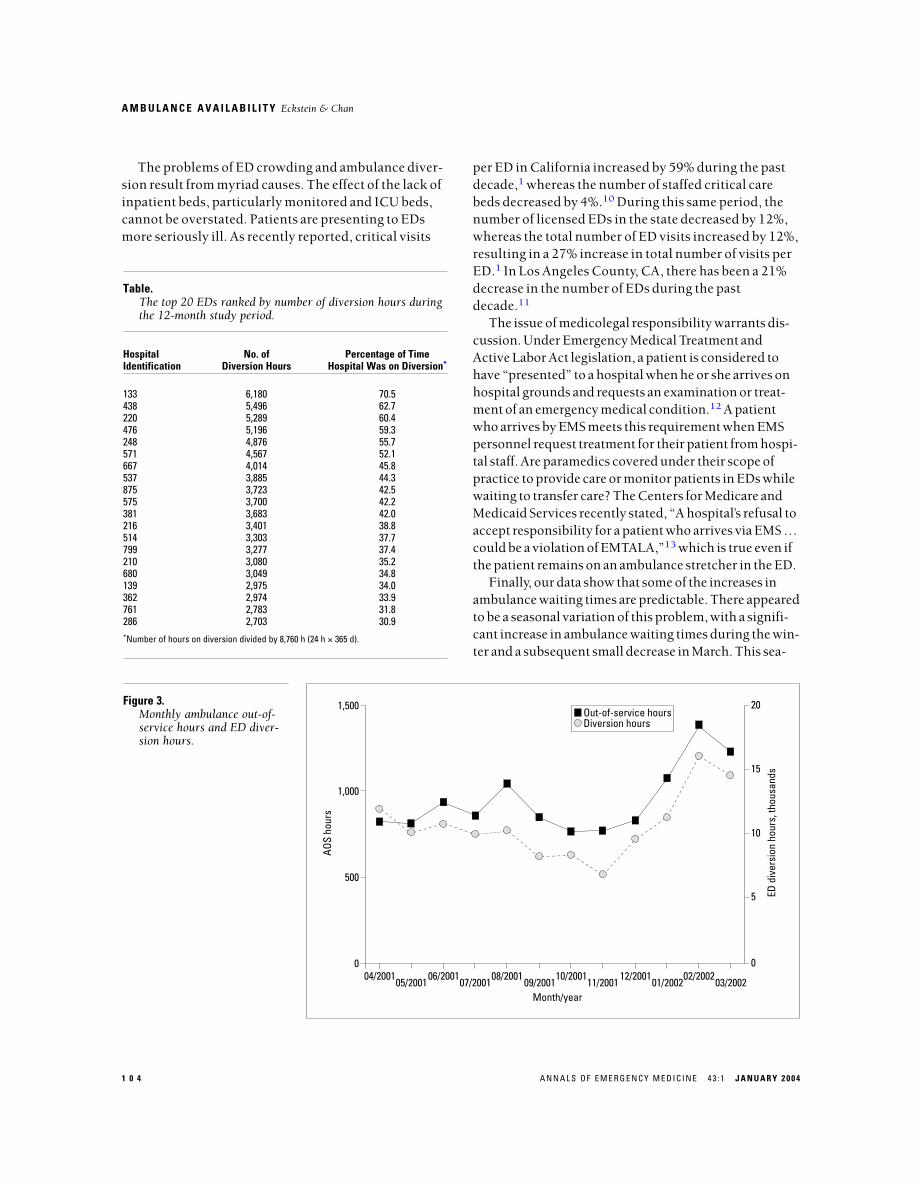
The relationship between ambulance out-of-servicehours and ED diversion hours for the 12-month studyperiod is shown in Figure 3. It demonstrates that ambu-lance out-of-service followed the same pattern as EDdiversion.
1,500
1,000
500
0476
Hospital identification number
Tota
l AOS
hou
rs
220 133 286 153 141 438 667 139 818 970 537 571 362 343 370 172 305 913 761
Figure 2.Total ambulance out-of-service hours for the top 20hospitals in 2001.
A M B U L A N C E A V A I L A B I L I T Y Eckstein & Chan
1 0 4 A N N A L S O F E M E R G E N C Y M E D I C I N E 4 3 : 1 J A N U A R Y 2 0 0 4
per ED in California increased by 59% during the pastdecade,1 whereas the number of staffed critical carebeds decreased by 4%.10 During this same period, thenumber of licensed EDs in the state decreased by 12%,whereas the total number of ED visits increased by 12%,resulting in a 27% increase in total number of visits perED.1 In Los Angeles County, CA, there has been a 21%decrease in the number of EDs during the pastdecade.11
The issue of medicolegal responsibility warrants dis-cussion. Under Emergency Medical Treatment andActive Labor Act legislation, a patient is considered tohave “presented” to a hospital when he or she arrives onhospital grounds and requests an examination or treat-ment of an emergency medical condition.12 A patientwho arrives by EMS meets this requirement when EMSpersonnel request treatment for their patient from hospi-tal staff. Are paramedics covered under their scope ofpractice to provide care or monitor patients in EDs whilewaiting to transfer care? The Centers for Medicare andMedicaid Services recently stated, “A hospital’s refusal toaccept responsibility for a patient who arrives via EMS …could be a violation of EMTALA,”13 which is true even ifthe patient remains on an ambulance stretcher in the ED.
Finally, our data show that some of the increases inambulance waiting times are predictable. There appearedto be a seasonal variation of this problem, with a signifi-cant increase in ambulance waiting times during the win-ter and a subsequent small decrease in March. This sea-
The problems of ED crowding and ambulance diver-sion result from myriad causes. The effect of the lack ofinpatient beds, particularly monitored and ICU beds,cannot be overstated. Patients are presenting to EDsmore seriously ill. As recently reported, critical visits
Table.The top 20 EDs ranked by number of diversion hours duringthe 12-month study period.
Hospital No. of Percentage of TimeIdentification Diversion Hours Hospital Was on Diversion*
133 6,180 70.5438 5,496 62.7220 5,289 60.4476 5,196 59.3248 4,876 55.7571 4,567 52.1667 4,014 45.8537 3,885 44.3875 3,723 42.5575 3,700 42.2381 3,683 42.0216 3,401 38.8514 3,303 37.7799 3,277 37.4210 3,080 35.2680 3,049 34.8139 2,975 34.0362 2,974 33.9761 2,783 31.8286 2,703 30.9*Number of hours on diversion divided by 8,760 h (24 h × 365 d).
1,500
1,000
500
004/2001
AOS
hour
s
5
10
15
20
05/200106/2001
07/200108/2001
09/200110/2001
11/200112/2001
01/200202/2002
03/2002
0
ED d
iver
sion
hou
rs, t
hous
ands
Out-of-service hoursDiversion hours
Month/year
Figure 3.Monthly ambulance out-of-service hours and ED diver-sion hours.
A M B U L A N C E A V A I L A B I L I T Y Eckstein & Chan
J A N U A R Y 2 0 0 4 4 3 : 1 A N N A L S O F E M E R G E N C Y M E D I C I N E 1 0 5
Methods section and the Results section. ME takes responsibilityfor the paper as a whole.
Received for publication September 27, 2002. Revisions receivedJanuary 29, 2003; May 1, 2003; and June 23, 2003. Accepted for publi-cation July 22, 2003.
The authors report this study did not receive any outside funding orsupport.
Address for reprints: Marc Eckstein, MD, Department of EmergencyMedicine, Los Angeles County + University of Southern CaliforniaMedical Center, 1200 N. State Street, Room 1011, Los Angeles, CA90033; 213-485-4730, fax 213-485-8247; E-mail [email protected].
R E F E R E N C E S1. Lambe S, Washington DL, Fink A, et al. Trends in the use and capacity of California’semergency departments, 1990-1999. Ann Emerg Med. 2002;39:389-396.2. Derlet RW, Richards J, Kravitz RL. Frequent overcrowding in US emergency depart-ments. Acad Emerg Med. 2001;8:151-155.3. Derlet RW, Richards JR. Overcrowding in the nation’s emergency departments:complex causes and disturbing effects. Ann Emerg Med. 2000;35:63-68.4. Shute N, Marcus MB. Code blue: crisis in the ER. US News and World Report.September 10, 2001:54-61, 64, 66.5. Appleby J. ER conditions critical. USA Today. February 4, 2000:News Section A, 1.6. US Census Bureau. Population estimates for cities and towns, 2002. Available at:http://www.eire.census.gov/popest/data/cities/tables/SUB-EST2002-01.php. AccessedNovember 24, 2003.7. Department of Health Services. Patient Destination. Reference 502. County of LosAngeles, CA: Department of Health Services; 1998.8. Department of Health Services. Guidelines for Hospitals Requesting Diversion ofALS Units. Reference 503. County of Los Angeles, CA: Department of Health Services;1998.9. Lambe S, Washington DL, Fink A, et al. Waiting times in California’s emergencydepartments. Ann Emerg Med. 2003;41:35-44.10. California Healthcare Foundation. California’s emergency departments: systemcapacity and demand. Available at: http://www.library.ca.gov/sitn/2002/0278.htm#S7020.Accessed October 7, 2003.11. California Chapter of the American College of Emergency Physicians Web site.Emergency care in California: overwhelmed, underfunded and in peril. Available at:http://www.calacep.org/alert/alert.html. Accessed November 24, 2003.12. 59 Federal Register 32086.32127 (1994) (codified at 42 USC Sec. 1395 dd 012). 13. Wright D. Memorandum to All Region VI Hospital Associations. Baltimore, MD:Centers for Medicare & Medicaid Services; 2002.14. Holleman DR, Bowling RL, Gathy C. Predicting daily visits to a walk-in clinic andemergency department using calendar and weather data. J Gen Intern Med.1996;11:237-239.
sonal variation in ambulance waiting times parallels pre-dictable increases in ED volume previously reported.14
The major limitation of this study is that we evalu-ated only the effect of ED crowding on an EMS system inone city. Although it appears that this phenomenon iswidespread across the United States, similar data needto be compiled from other municipalities to evaluatethe extent of this problem.
Furthermore, the effect of paramedics being un-available because of ED crowding was not quantified interms of prolonged response times or potential adverseeffects on patient care. In addition, the instances inwhich ambulances were out of service for excessiveperiods were not individually studied. How activelyparamedics worked to secure a gurney for their patientsin these instances is unknown. Finally, although para-medics are permitted to go out of service at an ED be-cause of reasons other than delays in patient transfer, itcannot be confirmed that each incident captured in ourstudy was appropriately attributed to the unavailabilityof open ED beds. Prolonged delays, however, oftenresulted in the dispatch of an EMS field supervisor tothat ED, which might have dissuaded crews from usingthis problem to obtain a respite from the next call.
Our data show that paramedic ambulances are rou-tinely out of service while waiting to transfer care ofpatients in EDs. Although the exact effect of thesedelays in terms of potentially longer response times isunknown, this problem poses a significant challenge toour EMS system.
Author contributions: ME designed the study, collected the data,and wrote the bulk of the manuscript. LSC performed the statisticalanalyses and wrote the pertinent sections of the Materials and
30
20
10
099
No.
of E
D sa
tura
tion
hour
s, th
ousa
nds
Raw value5-month moving average
9999
9999
9999
9999
9999
9900
0000
0000
0000
0000
0000
0001
0101
0101
0101
0101
0101
0102
0202
0202
0202
0202
0202
02
1 23 5 6 7 84 9
10 11
12
1
23
4 5 6 7 8 91011
12
12 3 4 5 6
7 8910
11
121
23
45
67 8 91011
12
Month of year
Figure 4.Time series analysis of EDdiversion hours in LosAngeles, 1999 to 2002.