Embed Size (px)
Citation preview
The Effect of Emergency DepartmentCrowding on Patient Satisfaction forAdmitted PatientsJesse M. Pines, MD, MBA, MSCE, Sanjay Iyer, Maureen Disbot, RN, MSN, CCRN,Judd E. Hollander, MD, Frances S. Shofer, PhD, Elizabeth M. Datner, MD
AbstractObjectives: The objective was to study the association between factors related to emergency department(ED) crowding and patient satisfaction.
Methods: The authors performed a retrospective cohort study of all patients admitted through the EDwho completed Press-Ganey patient satisfaction surveys over a 2-year period at a single academiccenter. Ordinal and binary logistic regression was used to study the association between validated EDcrowding factors (such as hallway placement, waiting times, and boarding times) and patient satisfactionwith both ED care and assessment of satisfaction with the overall hospitalization.
Results: A total of 1,501 hospitalizations for 1,469 patients were studied. ED hallway use was broadlypredictive of a lower likelihood of recommending the ED to others, lower overall ED satisfaction, andlower overall satisfaction with the hospitalization (p < 0.05). Prolonged ED boarding times and pro-longed treatment times were also predictive of lower ED satisfaction and lower satisfaction with theoverall hospitalization (p < 0.05). Measures of ED crowding and ED waiting times predicted ED satisfac-tion (p < 0.05), but were not predictive of satisfaction with the overall hospitalization.
Conclusions: A poor ED service experience as measured by ED hallway use and prolonged boardingtime after admission are adversely associated with ED satisfaction and predict lower satisfaction withthe entire hospitalization. Efforts to decrease ED boarding and crowding might improve patientsatisfaction.
ACADEMIC EMERGENCY MEDICINE 2008; 15:825–831 ª 2008 by the Society for Academic EmergencyMedicine
Keywords: emergency department crowding, overcrowding, patient satisfaction, hallway, boarding,crowding
P atient satisfaction data are used by emergencydepartment (ED) administrators to track aggre-gate data over time, study interventions, assess
individual physician performance, and construct finan-cial incentive plans.1,2 A recent study identified sixelements of emergency care associated with poor satis-faction: 1) not receiving help when needed, 2) a poorly
explained problem, 3) not being told about waiting times,4) not being told when to resume normal activities, 5) nothaving test results explained, and 6) not understandingwhen to return to the ED.3,4 While many elements ofsatisfaction are under provider control, many elementsof ED care are difficult for an individual provider toimprove, such as waiting time, boarding time, use ofhallway treatment space, and overall levels of EDcrowding that might reduce staff availability and impedeancillary services such as radiology and laboratoryresults.5–11
Despite the challenges of obtaining reliable and validdata, measurement of patient satisfaction is recognizedby providers and regulators as vital to quality assuranceand improvement.12,13 Satisfied patients are more likelyto be compliant with their medications, return forcontinuing medical care, and communicate more effec-tively with their physicians.14–16 Patient satisfactionitself has been proposed as a measure of quality andhas been proposed for use in pay-for-performance
ª 2008 by the Society for Academic Emergency Medicine ISSN 1069-6563doi: 10.1111/j.1553-2712.2008.00200.x PII ISSN 1069-6563583 825
From the Department of Emergency Medicine (JMP, JEH, FSS,EMM), the Center for Clinical Epidemiology and Biostatistics(JMP), University of Pennsylvania School of Medicine (SI),Philadelphia, PA; the Department of Clinical Effectiveness andQuality Improvement, University of Pennsylvania Healthsystem(MD), Philadelphia, PA; and The Leonard Davis Institute ofHealth Economics, University of Pennsylvania (JMP), Philadel-phia, PA.Received March 8, 2008; revisions received May 10 and June 2,2008; accepted June 5, 2008.Address for correspondence and reprints: Jesse M. Pines, MD,MBA, MSCE; e-mail: [email protected].
programs.17,18 The Institute of Medicine’s ‘‘Crossing theQuality Chasm’’ report calls for the measurement of sixdimensions of the patient experience: safety, effective-ness, patient-centeredness, timeliness, efficiency, andequity.19
There are many commercially available and internallydeveloped instruments that are used to generate dataon patient satisfaction. Press-Ganey surveys are com-mercially available instruments that are commonly usedto measure patient satisfaction in the ED. A paucity ofstudies have assessed the relationship between EDcrowding and ED patient satisfaction data derived fromthe Press-Ganey surveys.20,21 No studies, to our knowl-edge, have assessed the relationship between ED satis-faction and overall hospital satisfaction. The goals ofthis study were to explore the relationship between EDcrowding factors and patient satisfaction, as assessedby Press-Ganey surveys.
METHODS
Study Design and PopulationWe performed a retrospective cohort study of all adultpatients 18 years and older who were admitted fromthe ED from July 1, 2006, to June 30, 2007, and com-pleted Press-Ganey patient satisfaction surveys. Thestudy was performed in a large, urban, tertiary-careED, and hospital. The ED has a 4-year residency pro-gram and the hospital has a wide array of residencyand fellowship programs. The ED has 25 individualpatient rooms and 15 additional hallway treatmentareas. There is also an attached eight-bed clinical deci-sion unit. The hospital has 725 inpatient beds and admitsabout 40,000 patients per year (ED, direct admis-sions, and transfers). The hospital was designated amagnet hospital by the American Nurses CredentialingCenter in 2007, which is given for excellence in nursingcare (http://www.nursecredentialing.org/). The ED andhospital serves the local community and also serves asa tertiary care referral center for specialty patients.During the study period, annual ED visits ranged from55,000 57,000 per year. This study was approved by theinstitutional review board.
Survey Content and AdministrationPatient satisfaction surveys used in this study werethose of Press-Ganey (Press-Ganey Associates, SouthBend, IN; see Data Supplement, available as support-ing information in the online version of this paper;reproduced with permission from Press-Ganey).According to the Press-Ganey website (http://www.pressganey.com/), commercially used surveyshave been tested and are both reliable and valid.22
Press-Ganey mails surveys to a random sample ofapproximately 40% of patients after their hospitaliza-tion. Surveys are not sent to mothers with fetaldemise, to patients with repeat visits within 90 days,or to patients who died in the hospital. The surveyqueried satisfaction in both the ED and the inpatientarea. For the ED portion, a total of five questionswere asked that included elements of satisfaction withregistration, nursing staff, physician staff, explanationregarding delays, and an overall recommendation
about the ED. Of these five questions, raw data wereavailable for three of the five. The reason for missingdata for the two questions (A.1 and A.3; Data Supple-ment) was unknown. Questions for which data wereavailable included the questions on nursing care (A.2),whether delays were explained (A.4), and whether thepatient would recommend the ED to others (A.5). Eachquestion was scored on a 5-point Likert scale where 1was very poor and 5 was very good.
The primary outcome for ED satisfaction is an ordi-nal variable defined as the degree to which a patientwould recommend the ED to others on a 5-pointscale. This was chosen as the primary outcomebecause this was the only general question about theED in the survey, and we felt that this reflected thebest measure of the patients’ overall satisfaction.Because of the missing data on two questions, wedefined our secondary outcome as the average scoreon the three remaining questions. Where data wasincomplete for one of the questions, the compositeED score was determined by averaging the two avail-able scores. Where there were two questions missing,we used the answer to the available question as thesecondary outcome. Less than 15% of observationscontained less than three of the questions. Therewere no observations with zero answers to thesequestions, and no missing data were imputed.Because the data were highly skewed, we chose todichotomize the secondary outcome to permit the useof logistic regression analysis. We specifically chosethe median as the cut-point because it allowed a bal-anced distribution of high and low scores and corre-sponded to the average of ‘‘good’’ or ‘‘very good’’ onthe three questions.
For inpatient satisfaction, we used three questions asthe primary outcomes: 1) an assessment of the overallstaff coordination, 2) whether the patients would rec-ommend the hospital to others, and 3) the overallassessment of the hospital care. These three questionswere scored on a 5-point Likert scale from very poor(1) to very good (5). The study cohort was composed ofthe 1,501 patients who were admitted through the ED,discharged alive, and answered one or more of thequestions about the ED. The 1,501 visits represent aresponse rate of approximately 15%. Due to repeatedsampling in the database, there were 1,469 uniquepatients.
For each of the patients who were included in thestudy cohort, we used our electronic medical record,EMTrac (University of Pennsylvania, Philadelphia, PA),to record age, race, gender, day of week, time ofday, month, and year of service as well as informationabout whether they were initially placed in a hallwaytreatment space, waiting times, and administrative mea-sures of ED crowding.
Measures of ED crowding had two separate per-spectives: the patient and the ED. From the perspec-tive of the patient, we extracted waiting room times,ED boarding time, ED treatment time, and if thepatient was initially placed in a hallway treatmentspace. Hallway care was defined to have occurredwhen a patient was transferred from the waitingroom to a hallway treatment space or was triaged in
826 Pines et al. • ED CROWDING AND PATIENT SATISFACTION
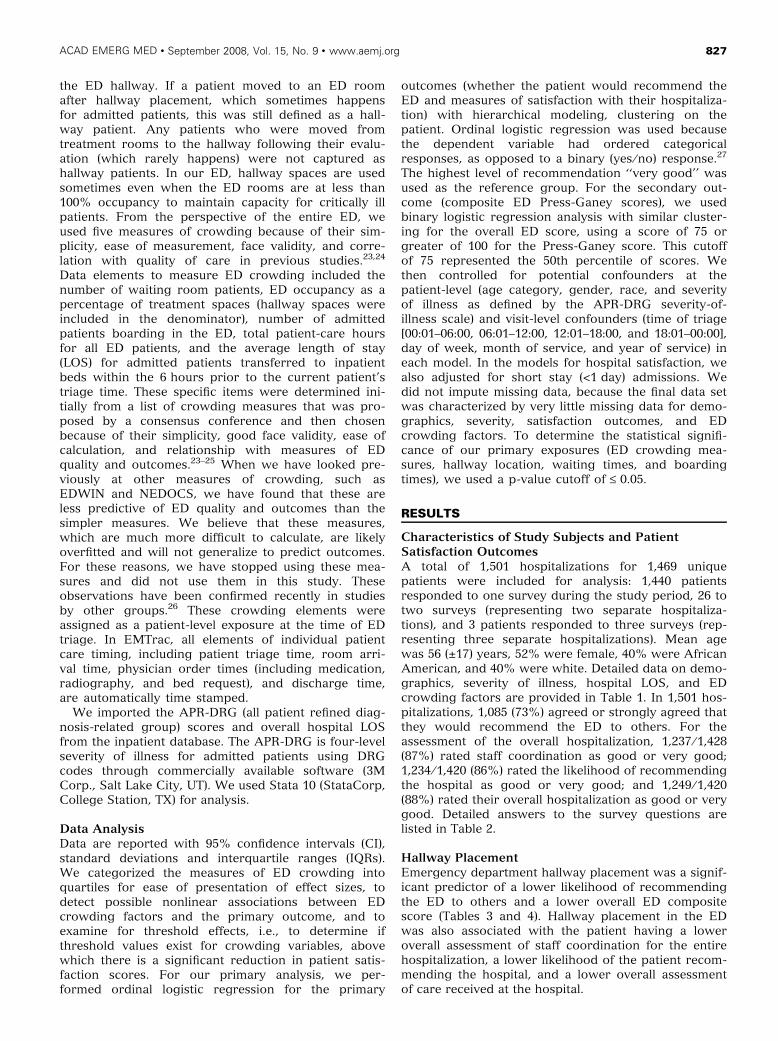
the ED hallway. If a patient moved to an ED roomafter hallway placement, which sometimes happensfor admitted patients, this was still defined as a hall-way patient. Any patients who were moved fromtreatment rooms to the hallway following their evalu-ation (which rarely happens) were not captured ashallway patients. In our ED, hallway spaces are usedsometimes even when the ED rooms are at less than100% occupancy to maintain capacity for critically illpatients. From the perspective of the entire ED, weused five measures of crowding because of their sim-plicity, ease of measurement, face validity, and corre-lation with quality of care in previous studies.23,24
Data elements to measure ED crowding included thenumber of waiting room patients, ED occupancy as apercentage of treatment spaces (hallway spaces wereincluded in the denominator), number of admittedpatients boarding in the ED, total patient-care hoursfor all ED patients, and the average length of stay(LOS) for admitted patients transferred to inpatientbeds within the 6 hours prior to the current patient’striage time. These specific items were determined ini-tially from a list of crowding measures that was pro-posed by a consensus conference and then chosenbecause of their simplicity, good face validity, ease ofcalculation, and relationship with measures of EDquality and outcomes.23–25 When we have looked pre-viously at other measures of crowding, such asEDWIN and NEDOCS, we have found that these areless predictive of ED quality and outcomes than thesimpler measures. We believe that these measures,which are much more difficult to calculate, are likelyoverfitted and will not generalize to predict outcomes.For these reasons, we have stopped using these mea-sures and did not use them in this study. Theseobservations have been confirmed recently in studiesby other groups.26 These crowding elements wereassigned as a patient-level exposure at the time of EDtriage. In EMTrac, all elements of individual patientcare timing, including patient triage time, room arri-val time, physician order times (including medication,radiography, and bed request), and discharge time,are automatically time stamped.
We imported the APR-DRG (all patient refined diag-nosis-related group) scores and overall hospital LOSfrom the inpatient database. The APR-DRG is four-levelseverity of illness for admitted patients using DRGcodes through commercially available software (3MCorp., Salt Lake City, UT). We used Stata 10 (StataCorp,College Station, TX) for analysis.
Data AnalysisData are reported with 95% confidence intervals (CI),standard deviations and interquartile ranges (IQRs).We categorized the measures of ED crowding intoquartiles for ease of presentation of effect sizes, todetect possible nonlinear associations between EDcrowding factors and the primary outcome, and toexamine for threshold effects, i.e., to determine ifthreshold values exist for crowding variables, abovewhich there is a significant reduction in patient satis-faction scores. For our primary analysis, we per-formed ordinal logistic regression for the primary
outcomes (whether the patient would recommend theED and measures of satisfaction with their hospitaliza-tion) with hierarchical modeling, clustering on thepatient. Ordinal logistic regression was used becausethe dependent variable had ordered categoricalresponses, as opposed to a binary (yes ⁄ no) response.27
The highest level of recommendation ‘‘very good’’ wasused as the reference group. For the secondary out-come (composite ED Press-Ganey scores), we usedbinary logistic regression analysis with similar cluster-ing for the overall ED score, using a score of 75 orgreater of 100 for the Press-Ganey score. This cutoffof 75 represented the 50th percentile of scores. Wethen controlled for potential confounders at thepatient-level (age category, gender, race, and severityof illness as defined by the APR-DRG severity-of-illness scale) and visit-level confounders (time of triage[00:01–06:00, 06:01–12:00, 12:01–18:00, and 18:01–00:00],day of week, month of service, and year of service) ineach model. In the models for hospital satisfaction, wealso adjusted for short stay (<1 day) admissions. Wedid not impute missing data, because the final data setwas characterized by very little missing data for demo-graphics, severity, satisfaction outcomes, and EDcrowding factors. To determine the statistical signifi-cance of our primary exposures (ED crowding mea-sures, hallway location, waiting times, and boardingtimes), we used a p-value cutoff of £ 0.05.
RESULTS
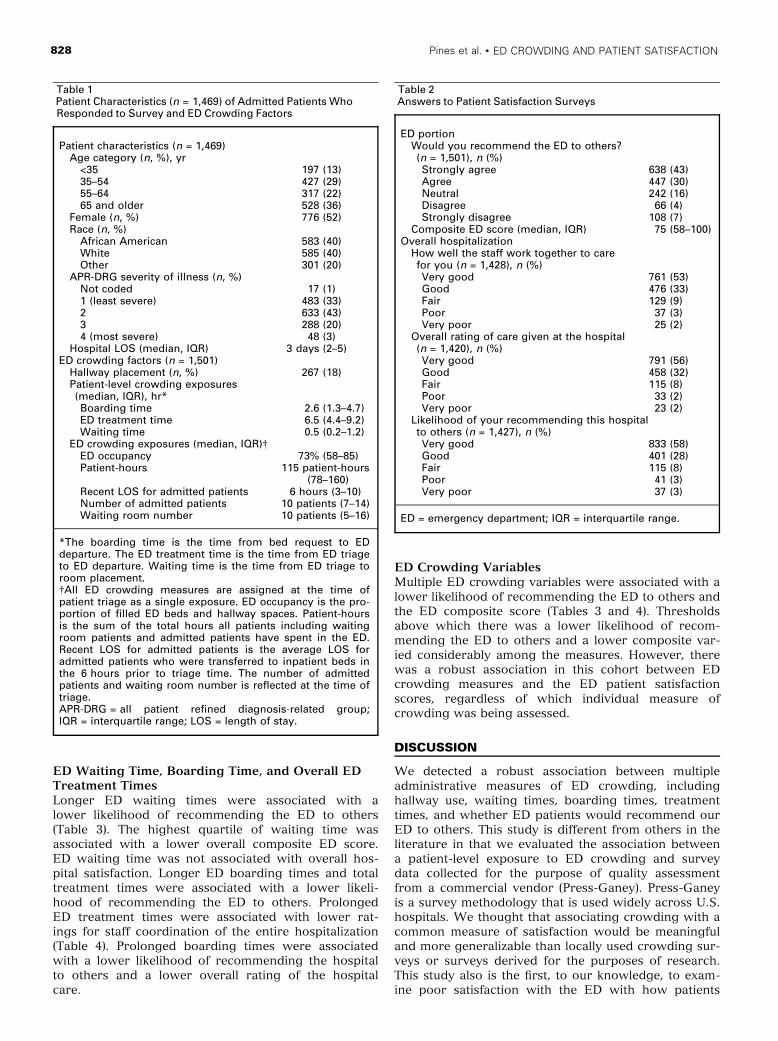
Characteristics of Study Subjects and PatientSatisfaction OutcomesA total of 1,501 hospitalizations for 1,469 uniquepatients were included for analysis: 1,440 patientsresponded to one survey during the study period, 26 totwo surveys (representing two separate hospitaliza-tions), and 3 patients responded to three surveys (rep-resenting three separate hospitalizations). Mean agewas 56 (±17) years, 52% were female, 40% were AfricanAmerican, and 40% were white. Detailed data on demo-graphics, severity of illness, hospital LOS, and EDcrowding factors are provided in Table 1. In 1,501 hos-pitalizations, 1,085 (73%) agreed or strongly agreed thatthey would recommend the ED to others. For theassessment of the overall hospitalization, 1,237 ⁄ 1,428(87%) rated staff coordination as good or very good;1,234 ⁄ 1,420 (86%) rated the likelihood of recommendingthe hospital as good or very good; and 1,249 ⁄ 1,420(88%) rated their overall hospitalization as good or verygood. Detailed answers to the survey questions arelisted in Table 2.
Hallway PlacementEmergency department hallway placement was a signif-icant predictor of a lower likelihood of recommendingthe ED to others and a lower overall ED compositescore (Tables 3 and 4). Hallway placement in the EDwas also associated with the patient having a loweroverall assessment of staff coordination for the entirehospitalization, a lower likelihood of the patient recom-mending the hospital, and a lower overall assessmentof care received at the hospital.
ACAD EMERG MED • September 2008, Vol. 15, No. 9 • www.aemj.org 827
ED Waiting Time, Boarding Time, and Overall EDTreatment TimesLonger ED waiting times were associated with alower likelihood of recommending the ED to others(Table 3). The highest quartile of waiting time wasassociated with a lower overall composite ED score.ED waiting time was not associated with overall hos-pital satisfaction. Longer ED boarding times and totaltreatment times were associated with a lower likeli-hood of recommending the ED to others. ProlongedED treatment times were associated with lower rat-ings for staff coordination of the entire hospitalization(Table 4). Prolonged boarding times were associatedwith a lower likelihood of recommending the hospitalto others and a lower overall rating of the hospitalcare.
ED Crowding VariablesMultiple ED crowding variables were associated with alower likelihood of recommending the ED to others andthe ED composite score (Tables 3 and 4). Thresholdsabove which there was a lower likelihood of recom-mending the ED to others and a lower composite var-ied considerably among the measures. However, therewas a robust association in this cohort between EDcrowding measures and the ED patient satisfactionscores, regardless of which individual measure ofcrowding was being assessed.
DISCUSSION
We detected a robust association between multipleadministrative measures of ED crowding, includinghallway use, waiting times, boarding times, treatmenttimes, and whether ED patients would recommend ourED to others. This study is different from others in theliterature in that we evaluated the association betweena patient-level exposure to ED crowding and surveydata collected for the purpose of quality assessmentfrom a commercial vendor (Press-Ganey). Press-Ganeyis a survey methodology that is used widely across U.S.hospitals. We thought that associating crowding with acommon measure of satisfaction would be meaningfuland more generalizable than locally used crowding sur-veys or surveys derived for the purposes of research.This study also is the first, to our knowledge, to exam-ine poor satisfaction with the ED with how patients
Table 1Patient Characteristics (n = 1,469) of Admitted Patients WhoResponded to Survey and ED Crowding Factors
Patient characteristics (n = 1,469)Age category (n, %), yr
<35 197 (13)35–54 427 (29)55–64 317 (22)65 and older 528 (36)
Female (n, %) 776 (52)Race (n, %)
African American 583 (40)White 585 (40)Other 301 (20)
APR-DRG severity of illness (n, %)Not coded 17 (1)1 (least severe) 483 (33)2 633 (43)3 288 (20)4 (most severe) 48 (3)
Hospital LOS (median, IQR) 3 days (2–5)ED crowding factors (n = 1,501)
Hallway placement (n, %) 267 (18)Patient-level crowding exposures(median, IQR), hr*Boarding time 2.6 (1.3–4.7)ED treatment time 6.5 (4.4–9.2)Waiting time 0.5 (0.2–1.2)
ED crowding exposures (median, IQR)�ED occupancy 73% (58–85)Patient-hours 115 patient-hours
(78–160)Recent LOS for admitted patients 6 hours (3–10)Number of admitted patients 10 patients (7–14)Waiting room number 10 patients (5–16)
*The boarding time is the time from bed request to EDdeparture. The ED treatment time is the time from ED triageto ED departure. Waiting time is the time from ED triage toroom placement.�All ED crowding measures are assigned at the time ofpatient triage as a single exposure. ED occupancy is the pro-portion of filled ED beds and hallway spaces. Patient-hoursis the sum of the total hours all patients including waitingroom patients and admitted patients have spent in the ED.Recent LOS for admitted patients is the average LOS foradmitted patients who were transferred to inpatient beds inthe 6 hours prior to triage time. The number of admittedpatients and waiting room number is reflected at the time oftriage.APR-DRG = all patient refined diagnosis-related group;IQR = interquartile range; LOS = length of stay.
Table 2Answers to Patient Satisfaction Surveys
ED portionWould you recommend the ED to others?(n = 1,501), n (%)Strongly agree 638 (43)Agree 447 (30)Neutral 242 (16)Disagree 66 (4)Strongly disagree 108 (7)
Composite ED score (median, IQR) 75 (58–100)Overall hospitalization
How well the staff work together to carefor you (n = 1,428), n (%)Very good 761 (53)Good 476 (33)Fair 129 (9)Poor 37 (3)Very poor 25 (2)
Overall rating of care given at the hospital(n = 1,420), n (%)Very good 791 (56)Good 458 (32)Fair 115 (8)Poor 33 (2)Very poor 23 (2)
Likelihood of your recommending this hospitalto others (n = 1,427), n (%)Very good 833 (58)Good 401 (28)Fair 115 (8)Poor 41 (3)Very poor 37 (3)
ED = emergency department; IQR = interquartile range.
828 Pines et al. • ED CROWDING AND PATIENT SATISFACTION
assess their entire hospitalization. Specifically, EDboarding and placement in a hallway bed were ele-ments of ED care that were predictive of a lower like-lihood of recommending not just the ED, but thehospital to others. Because service problems are associ-ated with negative assessments of the hospital and maylead to a lower willingness to return, hospitals shouldconsider eliminating the practice of boarding patientsfor long periods of time in the ED. Given that patientsactually prefer inpatient hallway to ED hallways, rapidtransfer of patients out of the ED into inpatient hall-ways may maximize overall satisfaction.28 Overallmeasures of ED crowding were predictive of ED satis-faction, although most were not predictive of overallhospital satisfaction. Patients may view ED crowding asindicative of isolated ED service, while ED boardingand being placed in a hallway is more reflective of ahospital’s service policies.
Certain measures of ED crowding were predictive ofED satisfaction and overall hospital satisfaction, whileothers were not. At the ED level, all measured crowd-ing measures predicted lower ED satisfaction at thehighest quartiles, while some measures were predictiveat the second and third quartiles. Specifically, occu-pancy, patient-hours, and number of admitted patientswere predictive at these lower levels. It is possible thatthese measures may be more sensitive measurementsof the resource availability to ensure that the ED care isperceived as high-quality and free from discomfort bythe patient.
For overall hospital satisfaction, prolonged ED treat-ment times predicted a lower likelihood of patients
believing the staff was working well together, as didhallway bed placement, while boarding timeapproached significance. Treatment time and overallprocessing time for admitted patients are certainly mea-sures of staff coordination. They may accurately mea-sure how patients perceive that the hospital respondedto their emergency illness to rapidly diagnose them andmake room for them in the hospital. Similarly, the likeli-hood of recommending the hospital to others and over-all hospital care assessment was predicted by not onlyED boarding time, but also some measures of EDcrowding, such as patient-hours and recent LOS foradmitted patients, which is an indirect measure of EDboarding. These results indicate that ED boarding andcrowding in itself are important factors in not just howpatients perceive their ED stay, but their entire hospi-talization. Specifically, high boarding times werebroadly predictive of lower satisfaction, where board-ing beyond 4.7 hours (the highest quartile) was associ-ated with a lower likelihood of being satisfied in the EDand the hospital.
Patient satisfaction is an important endpoint and acentral goal of medical care.19 From a marketingstandpoint, satisfaction is important because it allowsorganizations to maintain market share by generatingrepeat business through word-of-mouth referrals.Given the robust association between ED waitingtimes, boarding times, and quality of care, we wouldrecommend that hospital administrators and accredita-tion committees such as the Joint Commission con-sider using waiting and boarding times as routinequality indicators.29,30
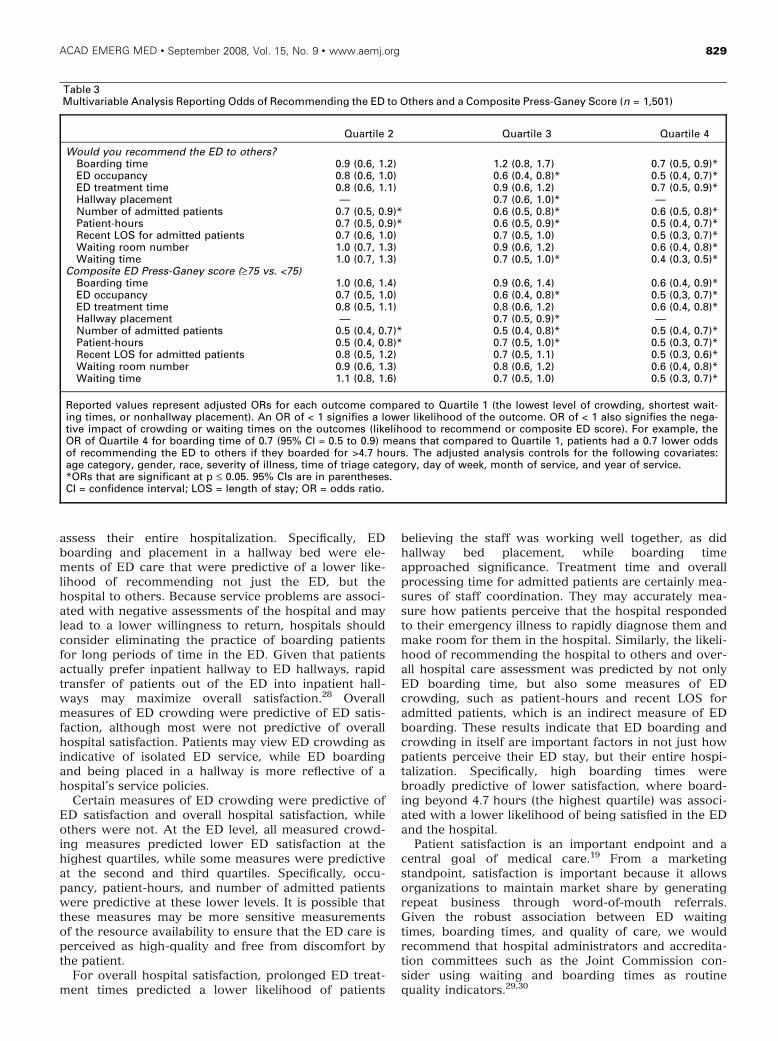
Table 3Multivariable Analysis Reporting Odds of Recommending the ED to Others and a Composite Press-Ganey Score (n = 1,501)
Quartile 2 Quartile 3 Quartile 4
Would you recommend the ED to others?Boarding time 0.9 (0.6, 1.2) 1.2 (0.8, 1.7) 0.7 (0.5, 0.9)*ED occupancy 0.8 (0.6, 1.0) 0.6 (0.4, 0.8)* 0.5 (0.4, 0.7)*ED treatment time 0.8 (0.6, 1.1) 0.9 (0.6, 1.2) 0.7 (0.5, 0.9)*Hallway placement — 0.7 (0.6, 1.0)* —Number of admitted patients 0.7 (0.5, 0.9)* 0.6 (0.5, 0.8)* 0.6 (0.5, 0.8)*Patient-hours 0.7 (0.5, 0.9)* 0.6 (0.5, 0.9)* 0.5 (0.4, 0.7)*Recent LOS for admitted patients 0.7 (0.6, 1.0) 0.7 (0.5, 1.0) 0.5 (0.3, 0.7)*Waiting room number 1.0 (0.7, 1.3) 0.9 (0.6, 1.2) 0.6 (0.4, 0.8)*Waiting time 1.0 (0.7, 1.3) 0.7 (0.5, 1.0)* 0.4 (0.3, 0.5)*
Composite ED Press-Ganey score (‡75 vs. <75)Boarding time 1.0 (0.6, 1.4) 0.9 (0.6, 1.4) 0.6 (0.4, 0.9)*ED occupancy 0.7 (0.5, 1.0) 0.6 (0.4, 0.8)* 0.5 (0.3, 0.7)*ED treatment time 0.8 (0.5, 1.1) 0.8 (0.6, 1.2) 0.6 (0.4, 0.8)*Hallway placement — 0.7 (0.5, 0.9)* —Number of admitted patients 0.5 (0.4, 0.7)* 0.5 (0.4, 0.8)* 0.5 (0.4, 0.7)*Patient-hours 0.5 (0.4, 0.8)* 0.7 (0.5, 1.0)* 0.5 (0.3, 0.7)*Recent LOS for admitted patients 0.8 (0.5, 1.2) 0.7 (0.5, 1.1) 0.5 (0.3, 0.6)*Waiting room number 0.9 (0.6, 1.3) 0.8 (0.6, 1.2) 0.6 (0.4, 0.8)*Waiting time 1.1 (0.8, 1.6) 0.7 (0.5, 1.0) 0.5 (0.3, 0.7)*
Reported values represent adjusted ORs for each outcome compared to Quartile 1 (the lowest level of crowding, shortest wait-ing times, or nonhallway placement). An OR of < 1 signifies a lower likelihood of the outcome. OR of < 1 also signifies the nega-tive impact of crowding or waiting times on the outcomes (likelihood to recommend or composite ED score). For example, theOR of Quartile 4 for boarding time of 0.7 (95% CI = 0.5 to 0.9) means that compared to Quartile 1, patients had a 0.7 lower oddsof recommending the ED to others if they boarded for >4.7 hours. The adjusted analysis controls for the following covariates:age category, gender, race, severity of illness, time of triage category, day of week, month of service, and year of service.*ORs that are significant at p £ 0.05. 95% CIs are in parentheses.CI = confidence interval; LOS = length of stay; OR = odds ratio.
ACAD EMERG MED • September 2008, Vol. 15, No. 9 • www.aemj.org 829
LIMITATIONS
A central limitation of this study is the low responserate typical of Press-Ganey instruments. However, the15% response rate during the study period appearsto be typical of ED Press-Ganey surveys, which islower than that for direct admissions or transfers.Some studies reporting satisfaction data have devel-oped their own instruments and have higher responserates.3,4,7,9 However, this study used Press-Ganeydata, which is limited by the response rate, but maybe more generalizable because this instrument iswidely used. This study was also limited because onlythree of five of the ED questions were available inthe raw data. The assessment of the emergencyphysician was not available to us. This was also a sin-gle-center study, which limits generalizability. Anadditional limitation is that the crowding exposurewas calculated at the triage time, which may notreflect the overall exposure to crowding over thepatients’ entire ED stay.
CONCLUSIONS
Emergency department waiting times and ED crowdingare associated with a higher likelihood of reporting
lower ED patient satisfaction scores, while hallwayplacement status in ED and long periods of boardingafter admission are associated with lower ED satisfac-tion and lower overall assessment of the hospital care,coordination, and likelihood of recommending the hos-pital to others. Efforts to reduce ED crowding mayimprove patient satisfaction in the ED and satisfactionwith overall hospital care.
The authors acknowledge the following people for all their help infacilitating this project: Michael Anderson, Stacey Hoffman, PaulJunker, and Chris Boedec.
References
1. Agency for Healthcare Research and Quality.National Quality Measures Clearinghouse. Availableat: http://www.qualitymeasures.ahrq.gov/summary/summary.aspx?ss=1&doc_id=415. Accessed Feb 6,2008.
2. Zun LS, Moss D. Bonus ⁄ incentive programs toincrease physician productivity in academicemergency medicine. Am J Emerg Med. 1996;14:334–6.
3. Sun BC, Adams J, Orav EJ, Rucker DW, BrennanTA, Burstin HR. Determinants of patient satisfaction
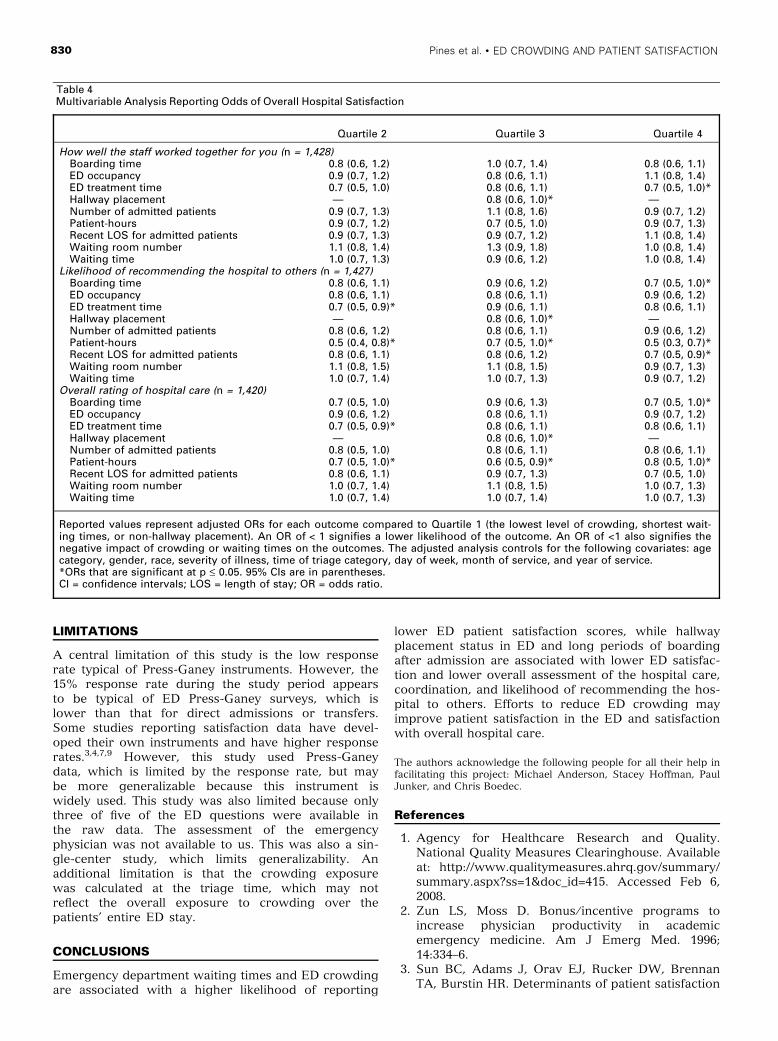
Table 4Multivariable Analysis Reporting Odds of Overall Hospital Satisfaction
Quartile 2 Quartile 3 Quartile 4
How well the staff worked together for you (n = 1,428)Boarding time 0.8 (0.6, 1.2) 1.0 (0.7, 1.4) 0.8 (0.6, 1.1)ED occupancy 0.9 (0.7, 1.2) 0.8 (0.6, 1.1) 1.1 (0.8, 1.4)ED treatment time 0.7 (0.5, 1.0) 0.8 (0.6, 1.1) 0.7 (0.5, 1.0)*Hallway placement — 0.8 (0.6, 1.0)* —Number of admitted patients 0.9 (0.7, 1.3) 1.1 (0.8, 1.6) 0.9 (0.7, 1.2)Patient-hours 0.9 (0.7, 1.2) 0.7 (0.5, 1.0) 0.9 (0.7, 1.3)Recent LOS for admitted patients 0.9 (0.7, 1.3) 0.9 (0.7, 1.2) 1.1 (0.8, 1.4)Waiting room number 1.1 (0.8, 1.4) 1.3 (0.9, 1.8) 1.0 (0.8, 1.4)Waiting time 1.0 (0.7, 1.3) 0.9 (0.6, 1.2) 1.0 (0.8, 1.4)
Likelihood of recommending the hospital to others (n = 1,427)Boarding time 0.8 (0.6, 1.1) 0.9 (0.6, 1.2) 0.7 (0.5, 1.0)*ED occupancy 0.8 (0.6, 1.1) 0.8 (0.6, 1.1) 0.9 (0.6, 1.2)ED treatment time 0.7 (0.5, 0.9)* 0.9 (0.6, 1.1) 0.8 (0.6, 1.1)Hallway placement — 0.8 (0.6, 1.0)* —Number of admitted patients 0.8 (0.6, 1.2) 0.8 (0.6, 1.1) 0.9 (0.6, 1.2)Patient-hours 0.5 (0.4, 0.8)* 0.7 (0.5, 1.0)* 0.5 (0.3, 0.7)*Recent LOS for admitted patients 0.8 (0.6, 1.1) 0.8 (0.6, 1.2) 0.7 (0.5, 0.9)*Waiting room number 1.1 (0.8, 1.5) 1.1 (0.8, 1.5) 0.9 (0.7, 1.3)Waiting time 1.0 (0.7, 1.4) 1.0 (0.7, 1.3) 0.9 (0.7, 1.2)
Overall rating of hospital care (n = 1,420)Boarding time 0.7 (0.5, 1.0) 0.9 (0.6, 1.3) 0.7 (0.5, 1.0)*ED occupancy 0.9 (0.6, 1.2) 0.8 (0.6, 1.1) 0.9 (0.7, 1.2)ED treatment time 0.7 (0.5, 0.9)* 0.8 (0.6, 1.1) 0.8 (0.6, 1.1)Hallway placement — 0.8 (0.6, 1.0)* —Number of admitted patients 0.8 (0.5, 1.0) 0.8 (0.6, 1.1) 0.8 (0.6, 1.1)Patient-hours 0.7 (0.5, 1.0)* 0.6 (0.5, 0.9)* 0.8 (0.5, 1.0)*Recent LOS for admitted patients 0.8 (0.6, 1.1) 0.9 (0.7, 1.3) 0.7 (0.5, 1.0)Waiting room number 1.0 (0.7, 1.4) 1.1 (0.8, 1.5) 1.0 (0.7, 1.3)Waiting time 1.0 (0.7, 1.4) 1.0 (0.7, 1.4) 1.0 (0.7, 1.3)
Reported values represent adjusted ORs for each outcome compared to Quartile 1 (the lowest level of crowding, shortest wait-ing times, or non-hallway placement). An OR of < 1 signifies a lower likelihood of the outcome. An OR of <1 also signifies thenegative impact of crowding or waiting times on the outcomes. The adjusted analysis controls for the following covariates: agecategory, gender, race, severity of illness, time of triage category, day of week, month of service, and year of service.*ORs that are significant at p £ 0.05. 95% CIs are in parentheses.CI = confidence intervals; LOS = length of stay; OR = odds ratio.
830 Pines et al. • ED CROWDING AND PATIENT SATISFACTION
and willingness to return with emergency care. AnnEmerg Med. 2000; 35:426–34.
4. Sun BC, Adams JG, Burstin HR. Validating a modelof patient satisfaction with emergency care. AnnEmerg Med. 2001; 38:527–32.
5. Bursch B, Beezy J, Shaw R. Emergency departmentsatisfaction: what matters most? Ann Emerg Med.1993; 22:586–91.
6. Derlet RW, Richards JR. Overcrowding in thenation’s emergency departments: complex causesand disturbing effects. Ann Emerg Med. 2000;35:63–8.
7. Goldwag R, Berg A, Yuval D, Benbassat J. Predic-tors of patient dissatisfaction with emergency care.Isr Med Assoc J. 2002; 4:603–6.
8. Nerney MP, Chin MH, Jin L, et al. Factors associ-ated with older patients’ satisfaction with care in aninner-city emergency department. Ann Emerg Med.2001; 38:140–5.
9. Taylor D, Kennedy MP, Virtue E, McDonald G. Amultifaceted intervention improves patient satisfac-tion and perceptions of emergency departmentcare. Int J Qual Health Care. 2006; 18:238–45.
10. Patterson J, Dutterer L, Rutt M, Marsteller K,Jacoby J, Heller M. Bridging orders and a dedicatedadmission nurse decreases emergency departmentturnaround times while increasing patient satisfac-tion. Ann Emerg Med. 2007; 50:35152.
11. Vieth TL, Rhodes KV. The effect of crowding onaccess and quality in an academic ED. Am J EmergMed. 2006; 24:787–94.
12. Ross CK, Sinacore JM, Steward CA. A comparativestudy of seven measures of patient satisfaction.Med Care. 1995; 33:392–406.
13. Brown AD, Sandoval GA, Levinton C, Blackstien-Hirsch P. Developing an efficient model to selectemergency department patient satisfaction improve-ment strategies. Ann Emerg Med. 2004; 46:3–10.
14. Ley P. Satisfaction, compliance, and communica-tion. Br J Clin Psychol. 1982; 21:241–54.
15. Kincey J, Bradshaw P, Ley P. Patients’ satisfactionand reported acceptance of advice in general prac-tice. J R Coll General Practice. 1975; 25:558–66.
16. Armstrong SR. Effect of a general practitioner’sconsulting style on patients’ satisfaction: a con-trolled study. BMJ. 1990; 301:968–70.
17. Goldfield N, Lamb V, Manton K, Vertrees J. Stan-dardize concepts, not tools for quality improve-ment. J Ambul Care Manage. 2007; 30:116–9.
18. Smith JE, Fisher DL, Endorf-Olson JJ. Integratingpatient satisfaction into performance measurementto meet improvement challenges 2000. Jt Comm JQual Patient Saf. 2000; 26:277–86.
19. Corrigan JM, Donaldson MS, Kohn LT, et al. Cross-ing the Quality Chasm. A New Health System forthe 21st Century. Washington, DC: Institute of
Medicine, National Academy of Sciences, NationalAcademy Press, 2001.
20. Cochrane D, Mandell M, Mylod D. The impact ofpatient location, crowding, and length of stay onpress Ganey emergency department patient satis-faction scores. Ann Emerg Med. 1998; 32:S58.
21. Hall MF, Press I. Keys to patient satisfaction in theemergency department: results of a multiple facilitystudy. Hosp Health Serv Adm. 1996; 41:515–32.
22. Press-Ganey Associates. Survey Development.Available at: http://www.pressganey.com/cs/surveys_and_reports/survey_development. Accessed Feb 5,2008.
23. Pines JM, Hollander JE. Emergency departmentcrowding is associated with poor care for patientswith severe pain. Ann Emerg Med. 2008; 51:1–5.
24. Pines JM, Localio AR, Hollander JE, et al. Theimpact of emergency department crowding mea-sures on time to antibiotics for patients with com-munity-acquired pneumonia. Ann Emerg Med.2007; 50:510–6.
25. Welch S, Augustine J, Camargo CA Jr, Reese C.Emergency department performance measures andbenchmarking summit. Acad Emerg Med. 2006;13:1074–80.
26. McCarthy ML, Aronsky D, Jones ID, et al. Theemergency department occupancy rate: a simplemeasure of emergency department crowding? AnnEmerg Med. 2008; 51:15–24.
27. Bender R, Grouven U. Ordinal logistic regression inmedical research. J R Coll Physicians Lond. 1997;3:546–51.
28. Garson C, Hollander JE, Rhodes KV, Shofer FS,Baxt WG, Pines JM. Emergency department patientpreferences for boarding locations when hospitalsare at full capacity. Ann Emerg Med. 2008; 51:9–12.
29. Cairns CB, Garrison HG, Hedges JR, Schriger DL,Valenzuela TD. Development of new methods toassess the outcomes of emergency care. AcadEmerg Med. 1998; 5:157–61.
30. Boudreaux ED, Mandry CV, Wood K. Patient satis-faction data as a quality indicator: a tale of twoemergency departments. Acad Emerg Med. 2003;10:261–8.
Supporting Information
The following supporting information is available in theonline version of this paper:
Data Supplement S1. Inpatient surveyThe document is in PDF format.Please note: Wiley Periodicals Inc. are not responsi-
ble for the content or functionality of any supportinginformation supplied by the authors. Any queries (otherthan missing material) should be directed to the corre-sponding author for the article.
ACAD EMERG MED • September 2008, Vol. 15, No. 9 • www.aemj.org 831