Embed Size (px)
Citation preview
This article was downloaded by [York University Libraries]On 12 November 2014 At 1250Publisher Taylor amp FrancisInforma Ltd Registered in England and Wales Registered Number 1072954 Registered officeMortimer House 37-41 Mortimer Street London W1T 3JH UK
The Progressive Fish-CulturistPublication details including instructions for authors and subscriptioninformationhttpwwwtandfonlinecomloiuzpf20
The Effect of Grading on the Total WeightGained by Brown TroutEarl A Pyle aa Bureau of Sport Fisheries and Wildlife Cortland New York USAPublished online 09 Jan 2011
To cite this article Earl A Pyle (1964) The Effect of Grading on the Total Weight Gained by Brown Trout TheProgressive Fish-Culturist 262 70-75 DOI 1015771548-8659(1964)26[70TEOGOT]20CO2
To link to this article httpdxdoiorg1015771548-8659(1964)26[70TEOGOT]20CO2
PLEASE SCROLL DOWN FOR ARTICLE
Taylor amp Francis makes every effort to ensure the accuracy of all the information (the ldquoContentrdquo)contained in the publications on our platform However Taylor amp Francis our agents and ourlicensors make no representations or warranties whatsoever as to the accuracy completeness orsuitability for any purpose of the Content Any opinions and views expressed in this publication arethe opinions and views of the authors and are not the views of or endorsed by Taylor amp FrancisThe accuracy of the Content should not be relied upon and should be independently verified withprimary sources of information Taylor and Francis shall not be liable for any losses actions claimsproceedings demands costs expenses damages and other liabilities whatsoever or howsoevercaused arising directly or indirectly in connection with in relation to or arising out of the use of theContent
This article may be used for research teaching and private study purposes Any substantialor systematic reproduction redistribution reselling loan sub-licensing systematic supply ordistribution in any form to anyone is expressly forbidden Terms amp Conditions of access and use canbe found at httpwwwtandfonlinecompageterms-and-conditions
THE EFFECT OF GRADING ON THE TOTAL
WEIGHT GAINED BY BROWN TROUT
Earl A Pyle Bureau of Sport Fisheries and Wildlife
Cortland New York
THE PRACTICE OF GRADING TROUT IN FISH HATCHERIES is justified by one or more of the following reasons Grading will produce uniform-sized trout permitting increased accuracy in sampling procedures within the hatchery it will allow the distribution of trout of specific sizes needed to meet certain management requirements it will increase growth among smaller trout after their removal from a mixed-size population and it will reduce cannibalism in certain species of trout
Brown (1946a 1946b) wrote that spe- cific growth rates of brown trout (Salmo trutta) fry and 2-year-olds were increased or decreased depending on their size in relation to the other members of the popu- lation she presented evidence that the growth rate of small individuals will in- crease when they are removed from a mixed-size population Brown postulated a hierarchy effect similar to the peck order among small chickens
Experiments that were conducted in 1960 by the Cortland workers failed to show significant differences in attained weights of graded and ungraded groups of brook trout Salvelinus fontinaIts (Pyle et al 1961) Separation by size failed to increase weight gains and neither canni- balism nor size dominance exerted a
measurable effect
The Cortland workers concluded that it
was necessary to alter experimental pro- cedures to take cannibalism into account
when using brown trout for nutritional
studies (Phillips et al 1954) Grading brown trout might be effective in increas- ing production by reducing cannibalism regardless of the presence or absence of hierarchies To test this assumption experiments were conducted to compare weights gained by graded with weights gained by ungraded groups of brown trout
Method
The methods used were similar to
those described previously for grading experiments with brook trout (Pyle et al 1961) Also in the present experiments the effect of cannibalism was measured by replicated hand counts at the beginning and termination of the experiments
The experiments were conducted for 20 weeks
At the end of 10 weeks the graded trout were regraded into three size groups small medium and large The source of each graded trough of fish was recorded to allow identification during the later re- combining of their weights for comparison with the weights of ungraded trout Also each of the ungraded trout populations was divided into two troughs to prevent over- crowding and the source of the fish in each trough was recorded for later re- combining of the weights
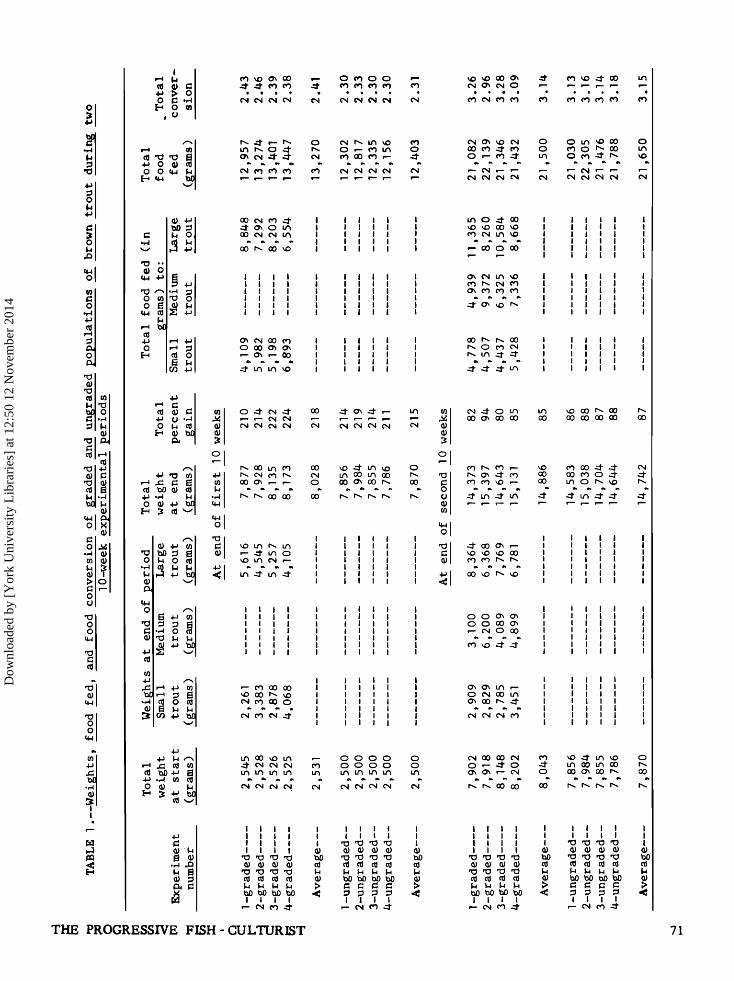
The weights of the graded groups of fish were recombined at the end of 10 and
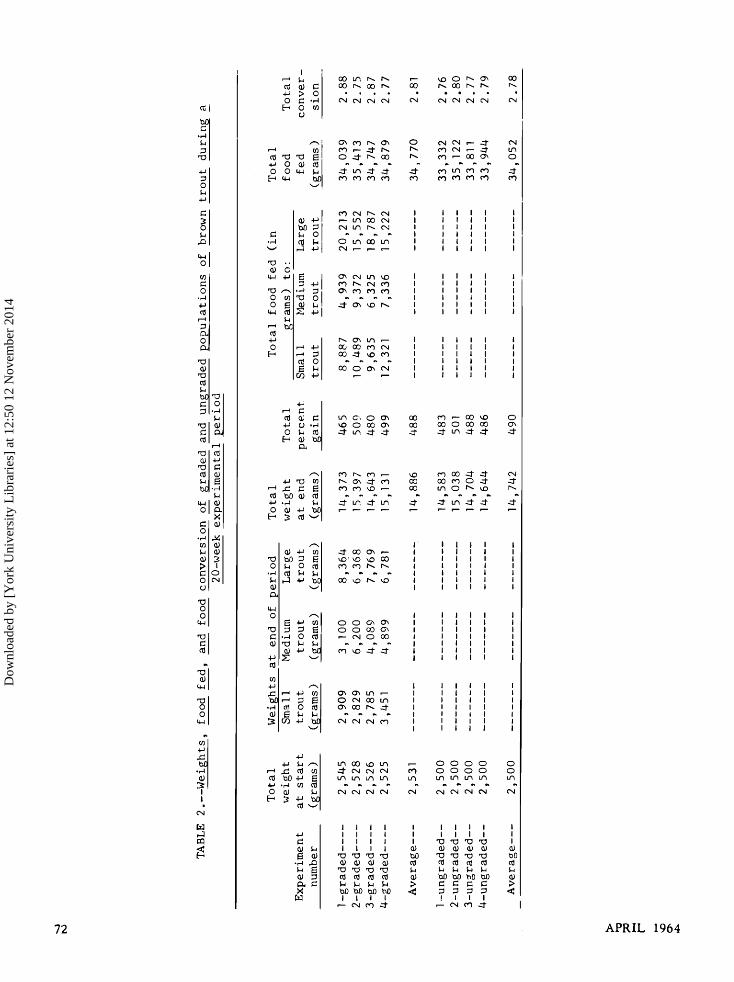
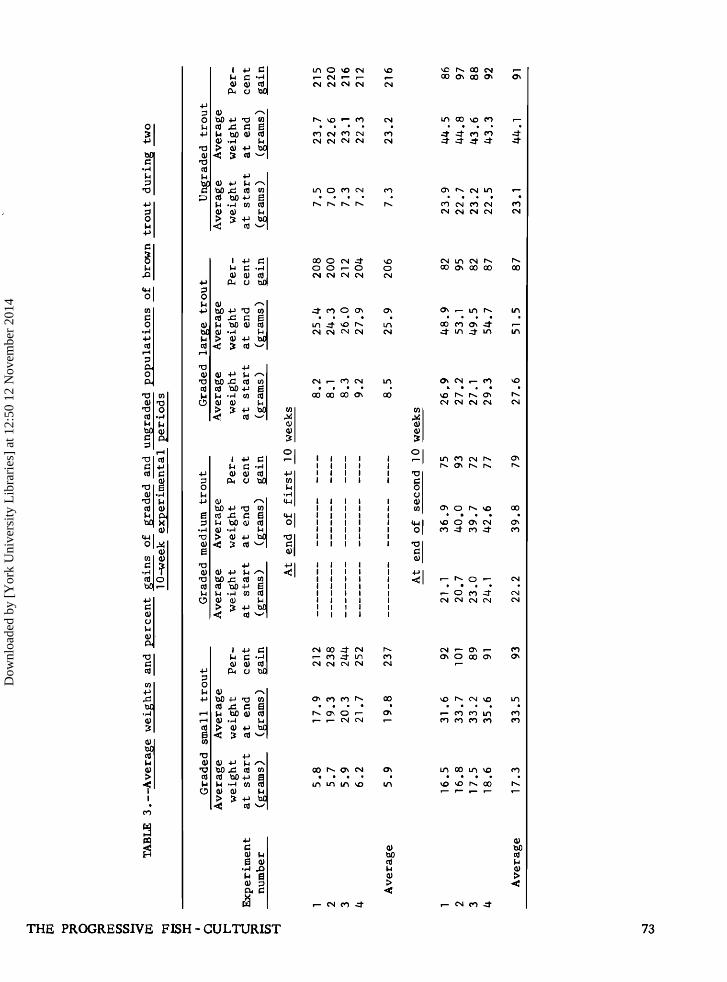
20 weeks (table 1) and for the total 20 weeks (table 2) The growth rates are shown in table 3 the observed mortalities
70 APRIL 1964
Dow
nloa
ded
by [
Yor
k U
nive
rsity
Lib
rari
es]
at 1
250
12
Nov
embe
r 20
14
o obull
lill IIi 11il IIii
Illl
obulloo
copylee
I I i I i i I I I I I I I I i I I I I I
II1 Illl IIII
oooo oooo
iiii iiii
o o
i I I
eeee
ubull o bull a0
bull- bull0 o bull0
ci -1- o Ln
o o obull obull o o 00 obull bull- ofrac12 o 00
o o
I I I
I I I I i I I I i I I I i i I i I i i I
I I I
THE PROGRESSIVE FISH- CULTURIST 71
Dow
nloa
ded
by [
Yor
k U
nive
rsity
Lib
rari
es]
at 1
250
12
Nov
embe
r 20
14
o co co
oobull oobull3bull
I I I
oooo oooo
o o
I I I
bO
72 APRIL 1964
Dow
nloa
ded
by [
Yor
k U
nive
rsity
Lib
rari
es]
at 1
250
12
Nov
embe
r 20
14
eeee
IIII
bull IIII bull IIII
eeee
bull0bull
leee
THE PROGRESSIVE FSH - CULTURIST 73
Dow
nloa
ded
by [
Yor
k U
nive
rsity
Lib
rari
es]
at 1
250
12
Nov
embe
r 20
14
in table 4 and the estimated and actual numbers of fish present at the termi- nation of the experiment in table 5
The significance of all compari- sons was established by analysis of variance
Dis cussion
In these experiments grading did not increase the total weight gained by brown trout or the efficiency of their utilization of food
Results suggest that the graded fish gained more weight during the first 10 weeks and the ungraded groups of fish gained more during the second 10 weeks (table 1) These differences
are not significant at the 5-percent level A summary of the data for the entire 20-week experiment (table 2) shows the similarity of the gains of the graded and ungraded trout
The food conversions were nearly identical for the graded and ungraded groups (tables 1 and 2) The amounts fed were derived from the tables of
Deuel and his co-workers (1952)for each size group of trout The total amounts fed to both the graded and the ungraded groups of trout are remark- ably similar and since these amounts were determined independently of each other they must be considered further confirmation of the validity of these feeding tables
The small graded fish apparently grew faster than the large graded fish and the ungraded fish (table 3) The ungraded fish seemed to grow at a faster rate than the large graded fish Contrary to expectations the medium- size trout seemed to be the slowest-
growing of all groups a phenomenon that was also true in the study with brook trout Our experiments do not have sufficient precision to establish these differences as significant
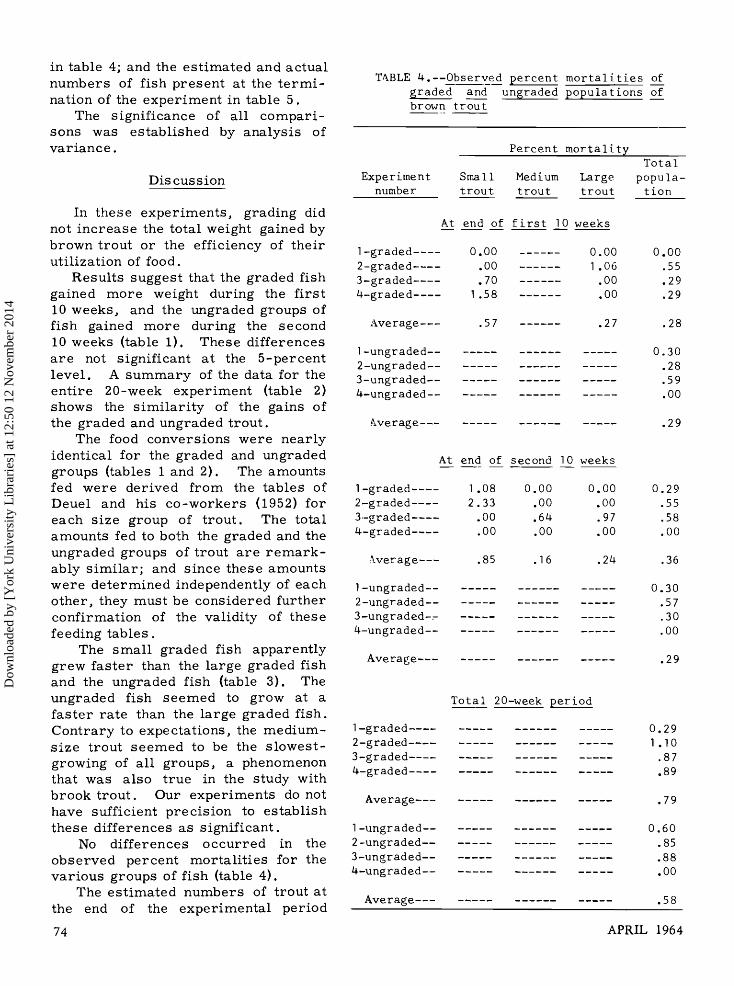
No differences occurred in the
observed percent mortalities for the various groups of fish (table 4)
The estimated numbers of trout at
the end of the experimental period
TABLE 4--Observed percent mortalities of graded and ungraded populations o__f brown trout
Percent mortality Total
Experiment Small Medium Large popula- number trout trout trout tion
At end of first ]0 weeks
]-graded 000 000 000 2-graded 00 ]06 55 3-graded 70 00 29 4-graded ]58 00 29
Average--- 57 27 28
]-ungraded-- 030 2-ungraded-- 28 3-ungraded-- 59 bull-ungraded-- 00
Average 29
At end of second ]0 weeks
]-graded ]08 000 000 029 2-graded 233 00 00 55 3-graded 00 64 97 58 bull-graded 00 00 00 00
Average--- 85 ]6 24 36
]-ungraded-- 030 2-ungraded-- 57 3-ungraded-bull 30 bull-ungraded-- 00
Average--- 29
Total 20-week period
]-graded 029 2-graded ]]0 3-graded 87 4-graded 89
Average--- 79
]-ungraded 060 2-ungraded-- 85 3-ungraded-- 88 bull-ungraded-- 00
Average--- 58
74 APRIL 1964
Dow
nloa
ded
by [
Yor
k U
nive
rsity
Lib
rari
es]
at 1
250
12
Nov
embe
r 20
14
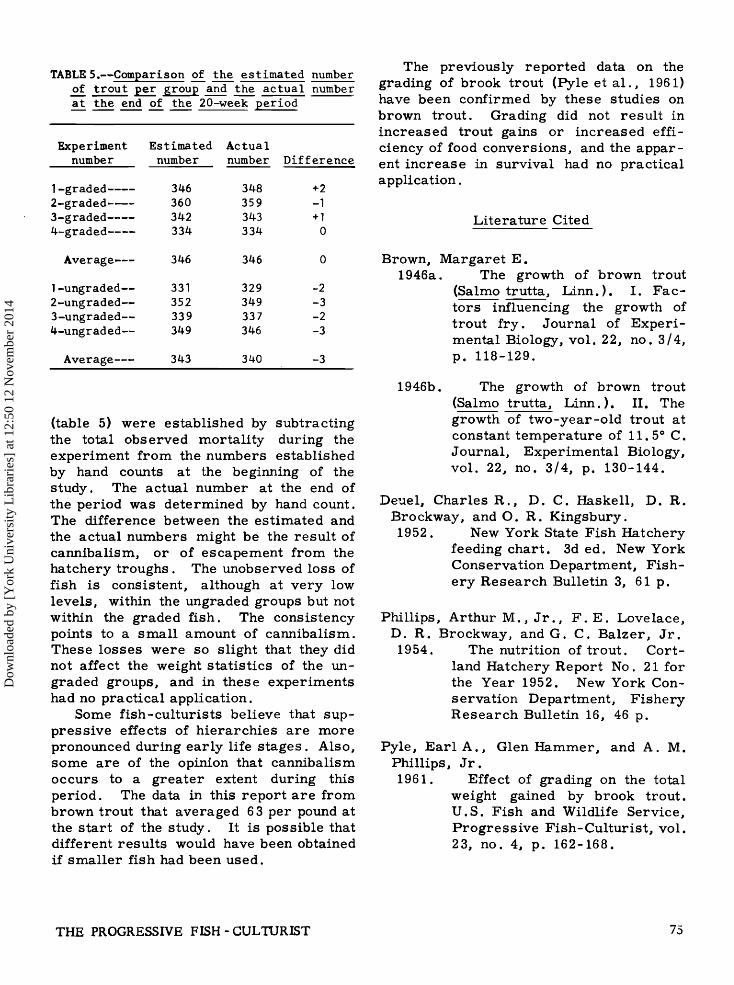
TABLES--Comparison of the estimated number of trout per group and the actual number a__t th__e end o__f th__e 20-week period
Experiment number
Estimated Actual
number number Difference
]-graded 346 348 +2 2-graded---- 360 359 -1 3-graded 342 343 +] 4-graded 334 334 0
Average--- 346 346 0
1-ungraded-- 331 329 -2 2-ungraded-- 352 349 -3 3-ungraded-- 339 337 -2 4-ungraded-- 349 346 -3
Average--- 343 340 -3
(table 5) were established by subtracting the total observed mortality during the experiment from the numbers established by hand counts at the beginning of the study The actual number at the end of the period was determined by hand count The difference between the estimated and
the actual numbers might be the result of cannibalism or of escapement from the hatchery troughs The unobserved loss of fish is consistent although at very low levels within the ungraded groups but not within the graded fish The consistency points to a small amount of cannibalism These losses were so slight that they did not affect the weight statistics of the un- graded groups and in these experiments had no practical application
Some fish-culturists believe that sup- pressire effects of hierarchies are more pronounced during early life stages Also some are of the opinion that cannibalism occurs to a greater extent during this period The data in this report are from brown trout that averaged 63 per pound at the start of the study It is possible that different results would have been obtained
if smaller fish had been used
The previously reported data on the grading of brook trout (Pyle et al 1961) have been confirmed by these studies on brown trout Grading did not result in increased trout gains or increased effi- ciency of food conversions and the appar- ent increase in survival had no practical application
Literature Cited
Brown Margaret E 1946a The growth of brown trout
(Salmo trutta Linn) I Fac- tors influencing the growth of trout fry Journal of Experi- mental Biology vol 22 no 34 p 118-129
1946b The growth of brown trout (Salmo trutta Linn) II The growth of two-year-old trout at constant temperature of 115 oslash C Journal Experimental Biology vol 22 no 34 p 130-144
Deuel Charles R D C Haskell D R Brockway and O R Kingsbury 1952 New York State Fish Hatchery
feeding chart 3d ed New York Conservation Department Fish- ery Research Bulletin 3 61 p
Phillips Arthur M Jr FE Lovelace D R Brockway and G C Balzer Jr
1954 The nutrition of trout Cort-
land Hatchery Report No 21 for the Year 1952 New York Con-
servation Department Fishery Research Bulletin 16 46 p
Pyle Earl A Glen Hammer and A M Phillips Jr 1961 Effect of grading on the total
weight gained by brook trout US Fish and Wildlife Service Progressive Fish-Culturist vol 23 no 4 p 162-168
THE PROGRESSIVE FISH - CULTURIST 75
Dow
nloa
ded
by [
Yor
k U
nive
rsity
Lib
rari
es]
at 1
250
12
Nov
embe
r 20
14
THE EFFECT OF GRADING ON THE TOTAL
WEIGHT GAINED BY BROWN TROUT
Earl A Pyle Bureau of Sport Fisheries and Wildlife
Cortland New York
THE PRACTICE OF GRADING TROUT IN FISH HATCHERIES is justified by one or more of the following reasons Grading will produce uniform-sized trout permitting increased accuracy in sampling procedures within the hatchery it will allow the distribution of trout of specific sizes needed to meet certain management requirements it will increase growth among smaller trout after their removal from a mixed-size population and it will reduce cannibalism in certain species of trout
Brown (1946a 1946b) wrote that spe- cific growth rates of brown trout (Salmo trutta) fry and 2-year-olds were increased or decreased depending on their size in relation to the other members of the popu- lation she presented evidence that the growth rate of small individuals will in- crease when they are removed from a mixed-size population Brown postulated a hierarchy effect similar to the peck order among small chickens
Experiments that were conducted in 1960 by the Cortland workers failed to show significant differences in attained weights of graded and ungraded groups of brook trout Salvelinus fontinaIts (Pyle et al 1961) Separation by size failed to increase weight gains and neither canni- balism nor size dominance exerted a
measurable effect
The Cortland workers concluded that it
was necessary to alter experimental pro- cedures to take cannibalism into account
when using brown trout for nutritional
studies (Phillips et al 1954) Grading brown trout might be effective in increas- ing production by reducing cannibalism regardless of the presence or absence of hierarchies To test this assumption experiments were conducted to compare weights gained by graded with weights gained by ungraded groups of brown trout
Method
The methods used were similar to
those described previously for grading experiments with brook trout (Pyle et al 1961) Also in the present experiments the effect of cannibalism was measured by replicated hand counts at the beginning and termination of the experiments
The experiments were conducted for 20 weeks
At the end of 10 weeks the graded trout were regraded into three size groups small medium and large The source of each graded trough of fish was recorded to allow identification during the later re- combining of their weights for comparison with the weights of ungraded trout Also each of the ungraded trout populations was divided into two troughs to prevent over- crowding and the source of the fish in each trough was recorded for later re- combining of the weights
The weights of the graded groups of fish were recombined at the end of 10 and
20 weeks (table 1) and for the total 20 weeks (table 2) The growth rates are shown in table 3 the observed mortalities
70 APRIL 1964
Dow
nloa
ded
by [
Yor
k U
nive
rsity
Lib
rari
es]
at 1
250
12
Nov
embe
r 20
14
o obull
lill IIi 11il IIii
Illl
obulloo
copylee
I I i I i i I I I I I I I I i I I I I I
II1 Illl IIII
oooo oooo
iiii iiii
o o
i I I
eeee
ubull o bull a0
bull- bull0 o bull0
ci -1- o Ln
o o obull obull o o 00 obull bull- ofrac12 o 00
o o
I I I
I I I I i I I I i I I I i i I i I i i I
I I I
THE PROGRESSIVE FISH- CULTURIST 71
Dow
nloa
ded
by [
Yor
k U
nive
rsity
Lib
rari
es]
at 1
250
12
Nov
embe
r 20
14
o co co
oobull oobull3bull
I I I
oooo oooo
o o
I I I
bO
72 APRIL 1964
Dow
nloa
ded
by [
Yor
k U
nive
rsity
Lib
rari
es]
at 1
250
12
Nov
embe
r 20
14
eeee
IIII
bull IIII bull IIII
eeee
bull0bull
leee
THE PROGRESSIVE FSH - CULTURIST 73
Dow
nloa
ded
by [
Yor
k U
nive
rsity
Lib
rari
es]
at 1
250
12
Nov
embe
r 20
14
in table 4 and the estimated and actual numbers of fish present at the termi- nation of the experiment in table 5
The significance of all compari- sons was established by analysis of variance
Dis cussion
In these experiments grading did not increase the total weight gained by brown trout or the efficiency of their utilization of food
Results suggest that the graded fish gained more weight during the first 10 weeks and the ungraded groups of fish gained more during the second 10 weeks (table 1) These differences
are not significant at the 5-percent level A summary of the data for the entire 20-week experiment (table 2) shows the similarity of the gains of the graded and ungraded trout
The food conversions were nearly identical for the graded and ungraded groups (tables 1 and 2) The amounts fed were derived from the tables of
Deuel and his co-workers (1952)for each size group of trout The total amounts fed to both the graded and the ungraded groups of trout are remark- ably similar and since these amounts were determined independently of each other they must be considered further confirmation of the validity of these feeding tables
The small graded fish apparently grew faster than the large graded fish and the ungraded fish (table 3) The ungraded fish seemed to grow at a faster rate than the large graded fish Contrary to expectations the medium- size trout seemed to be the slowest-
growing of all groups a phenomenon that was also true in the study with brook trout Our experiments do not have sufficient precision to establish these differences as significant
No differences occurred in the
observed percent mortalities for the various groups of fish (table 4)
The estimated numbers of trout at
the end of the experimental period
TABLE 4--Observed percent mortalities of graded and ungraded populations o__f brown trout
Percent mortality Total
Experiment Small Medium Large popula- number trout trout trout tion
At end of first ]0 weeks
]-graded 000 000 000 2-graded 00 ]06 55 3-graded 70 00 29 4-graded ]58 00 29
Average--- 57 27 28
]-ungraded-- 030 2-ungraded-- 28 3-ungraded-- 59 bull-ungraded-- 00
Average 29
At end of second ]0 weeks
]-graded ]08 000 000 029 2-graded 233 00 00 55 3-graded 00 64 97 58 bull-graded 00 00 00 00
Average--- 85 ]6 24 36
]-ungraded-- 030 2-ungraded-- 57 3-ungraded-bull 30 bull-ungraded-- 00
Average--- 29
Total 20-week period
]-graded 029 2-graded ]]0 3-graded 87 4-graded 89
Average--- 79
]-ungraded 060 2-ungraded-- 85 3-ungraded-- 88 bull-ungraded-- 00
Average--- 58
74 APRIL 1964
Dow
nloa
ded
by [
Yor
k U
nive
rsity
Lib
rari
es]
at 1
250
12
Nov
embe
r 20
14
TABLES--Comparison of the estimated number of trout per group and the actual number a__t th__e end o__f th__e 20-week period
Experiment number
Estimated Actual
number number Difference
]-graded 346 348 +2 2-graded---- 360 359 -1 3-graded 342 343 +] 4-graded 334 334 0
Average--- 346 346 0
1-ungraded-- 331 329 -2 2-ungraded-- 352 349 -3 3-ungraded-- 339 337 -2 4-ungraded-- 349 346 -3
Average--- 343 340 -3
(table 5) were established by subtracting the total observed mortality during the experiment from the numbers established by hand counts at the beginning of the study The actual number at the end of the period was determined by hand count The difference between the estimated and
the actual numbers might be the result of cannibalism or of escapement from the hatchery troughs The unobserved loss of fish is consistent although at very low levels within the ungraded groups but not within the graded fish The consistency points to a small amount of cannibalism These losses were so slight that they did not affect the weight statistics of the un- graded groups and in these experiments had no practical application
Some fish-culturists believe that sup- pressire effects of hierarchies are more pronounced during early life stages Also some are of the opinion that cannibalism occurs to a greater extent during this period The data in this report are from brown trout that averaged 63 per pound at the start of the study It is possible that different results would have been obtained
if smaller fish had been used
The previously reported data on the grading of brook trout (Pyle et al 1961) have been confirmed by these studies on brown trout Grading did not result in increased trout gains or increased effi- ciency of food conversions and the appar- ent increase in survival had no practical application
Literature Cited
Brown Margaret E 1946a The growth of brown trout
(Salmo trutta Linn) I Fac- tors influencing the growth of trout fry Journal of Experi- mental Biology vol 22 no 34 p 118-129
1946b The growth of brown trout (Salmo trutta Linn) II The growth of two-year-old trout at constant temperature of 115 oslash C Journal Experimental Biology vol 22 no 34 p 130-144
Deuel Charles R D C Haskell D R Brockway and O R Kingsbury 1952 New York State Fish Hatchery
feeding chart 3d ed New York Conservation Department Fish- ery Research Bulletin 3 61 p
Phillips Arthur M Jr FE Lovelace D R Brockway and G C Balzer Jr
1954 The nutrition of trout Cort-
land Hatchery Report No 21 for the Year 1952 New York Con-
servation Department Fishery Research Bulletin 16 46 p
Pyle Earl A Glen Hammer and A M Phillips Jr 1961 Effect of grading on the total
weight gained by brook trout US Fish and Wildlife Service Progressive Fish-Culturist vol 23 no 4 p 162-168
THE PROGRESSIVE FISH - CULTURIST 75
Dow
nloa
ded
by [
Yor
k U
nive
rsity
Lib
rari
es]
at 1
250
12
Nov
embe
r 20
14
eeee
IIII
bull IIII bull IIII
eeee
bull0bull
leee
THE PROGRESSIVE FSH - CULTURIST 73
Dow
nloa
ded
by [
Yor
k U
nive
rsity
Lib
rari
es]
at 1
250
12
Nov
embe
r 20
14
in table 4 and the estimated and actual numbers of fish present at the termi- nation of the experiment in table 5
The significance of all compari- sons was established by analysis of variance
Dis cussion
In these experiments grading did not increase the total weight gained by brown trout or the efficiency of their utilization of food
Results suggest that the graded fish gained more weight during the first 10 weeks and the ungraded groups of fish gained more during the second 10 weeks (table 1) These differences
are not significant at the 5-percent level A summary of the data for the entire 20-week experiment (table 2) shows the similarity of the gains of the graded and ungraded trout
The food conversions were nearly identical for the graded and ungraded groups (tables 1 and 2) The amounts fed were derived from the tables of
Deuel and his co-workers (1952)for each size group of trout The total amounts fed to both the graded and the ungraded groups of trout are remark- ably similar and since these amounts were determined independently of each other they must be considered further confirmation of the validity of these feeding tables
The small graded fish apparently grew faster than the large graded fish and the ungraded fish (table 3) The ungraded fish seemed to grow at a faster rate than the large graded fish Contrary to expectations the medium- size trout seemed to be the slowest-
growing of all groups a phenomenon that was also true in the study with brook trout Our experiments do not have sufficient precision to establish these differences as significant
No differences occurred in the
observed percent mortalities for the various groups of fish (table 4)
The estimated numbers of trout at
the end of the experimental period
TABLE 4--Observed percent mortalities of graded and ungraded populations o__f brown trout
Percent mortality Total
Experiment Small Medium Large popula- number trout trout trout tion
At end of first ]0 weeks
]-graded 000 000 000 2-graded 00 ]06 55 3-graded 70 00 29 4-graded ]58 00 29
Average--- 57 27 28
]-ungraded-- 030 2-ungraded-- 28 3-ungraded-- 59 bull-ungraded-- 00
Average 29
At end of second ]0 weeks
]-graded ]08 000 000 029 2-graded 233 00 00 55 3-graded 00 64 97 58 bull-graded 00 00 00 00
Average--- 85 ]6 24 36
]-ungraded-- 030 2-ungraded-- 57 3-ungraded-bull 30 bull-ungraded-- 00
Average--- 29
Total 20-week period
]-graded 029 2-graded ]]0 3-graded 87 4-graded 89
Average--- 79
]-ungraded 060 2-ungraded-- 85 3-ungraded-- 88 bull-ungraded-- 00
Average--- 58
74 APRIL 1964
Dow
nloa
ded
by [
Yor
k U
nive
rsity
Lib
rari
es]
at 1
250
12
Nov
embe
r 20
14
TABLES--Comparison of the estimated number of trout per group and the actual number a__t th__e end o__f th__e 20-week period
Experiment number
Estimated Actual
number number Difference
]-graded 346 348 +2 2-graded---- 360 359 -1 3-graded 342 343 +] 4-graded 334 334 0
Average--- 346 346 0
1-ungraded-- 331 329 -2 2-ungraded-- 352 349 -3 3-ungraded-- 339 337 -2 4-ungraded-- 349 346 -3
Average--- 343 340 -3
(table 5) were established by subtracting the total observed mortality during the experiment from the numbers established by hand counts at the beginning of the study The actual number at the end of the period was determined by hand count The difference between the estimated and
the actual numbers might be the result of cannibalism or of escapement from the hatchery troughs The unobserved loss of fish is consistent although at very low levels within the ungraded groups but not within the graded fish The consistency points to a small amount of cannibalism These losses were so slight that they did not affect the weight statistics of the un- graded groups and in these experiments had no practical application
Some fish-culturists believe that sup- pressire effects of hierarchies are more pronounced during early life stages Also some are of the opinion that cannibalism occurs to a greater extent during this period The data in this report are from brown trout that averaged 63 per pound at the start of the study It is possible that different results would have been obtained
if smaller fish had been used
The previously reported data on the grading of brook trout (Pyle et al 1961) have been confirmed by these studies on brown trout Grading did not result in increased trout gains or increased effi- ciency of food conversions and the appar- ent increase in survival had no practical application
Literature Cited
Brown Margaret E 1946a The growth of brown trout
(Salmo trutta Linn) I Fac- tors influencing the growth of trout fry Journal of Experi- mental Biology vol 22 no 34 p 118-129
1946b The growth of brown trout (Salmo trutta Linn) II The growth of two-year-old trout at constant temperature of 115 oslash C Journal Experimental Biology vol 22 no 34 p 130-144
Deuel Charles R D C Haskell D R Brockway and O R Kingsbury 1952 New York State Fish Hatchery
feeding chart 3d ed New York Conservation Department Fish- ery Research Bulletin 3 61 p
Phillips Arthur M Jr FE Lovelace D R Brockway and G C Balzer Jr
1954 The nutrition of trout Cort-
land Hatchery Report No 21 for the Year 1952 New York Con-
servation Department Fishery Research Bulletin 16 46 p
Pyle Earl A Glen Hammer and A M Phillips Jr 1961 Effect of grading on the total
weight gained by brook trout US Fish and Wildlife Service Progressive Fish-Culturist vol 23 no 4 p 162-168
THE PROGRESSIVE FISH - CULTURIST 75
Dow
nloa
ded
by [
Yor
k U
nive
rsity
Lib
rari
es]
at 1
250
12
Nov
embe
r 20
14