Embed Size (px)
Citation preview
BioOne sees sustainable scholarly publishing as an inherently collaborative enterprise connecting authors, nonprofitpublishers, academic institutions, research libraries, and research funders in the common goal of maximizing access tocritical research.
The Effect of Growth Rate, Age, and Chestnut Blight onAmerican Chestnut MortalityAuthor(s): David L. Reynolds and Katie L. BurkeSource: Castanea, 76(2):129-139. 2011.Published By: Southern Appalachian Botanical SocietyDOI: http://dx.doi.org/10.2179/10-035.1URL: http://www.bioone.org/doi/full/10.2179/10-035.1
BioOne (www.bioone.org) is a nonprofit, online aggregation of core research in thebiological, ecological, and environmental sciences. BioOne provides a sustainable onlineplatform for over 170 journals and books published by nonprofit societies, associations,museums, institutions, and presses.
Your use of this PDF, the BioOne Web site, and all posted and associated contentindicates your acceptance of BioOne’s Terms of Use, available at www.bioone.org/page/terms_of_use.
Usage of BioOne content is strictly limited to personal, educational, and non-commercialuse. Commercial inquiries or rights and permissions requests should be directed to theindividual publisher as copyright holder.
The Effect of Growth Rate, Age, and ChestnutBlight on American Chestnut Mortality
David L. Reynolds1,2 and Katie L. Burke1*1Department of Biology, University of Virginia, Charlottesville, Virginia 22904
2Department of Biological and Agricultural Engineering, University of Georgia,Athens, Georgia 30602
ABSTRACT The factors affecting tree mortality have a significant impact on forestdynamics. Trees experience numerous biotic and abiotic stresses, and allocation of availableresources can determine tree survival in different conditions. Recent studies support anintraspecific relationship between radial growth rate and longevity. This study investigates theexistence of such a relationship in the American chestnut [Castanea dentata (Marsh.) Borkh.]across a landscape in southwestern Virginia. Growth rate and age at death were measured onbasal cross sections of recently dead American chestnuts. The relationships between growthrate and age at death and between growth rate and chestnut blight presence were analyzed.Average growth rate during the first 10 years of growth and age at death were correlated;chestnuts with fast early growth died younger than chestnuts with slow early growth.Additionally, we found that the average growth rate during the last 10 years of growth was asignificant predictor of blight infection at death. Our results provide further support for a linkbetween radial growth rates and longevity within species. Our results also support previousfindings that relate radial growth rates to blight susceptibility, possibly due to tradeoffs inresource allocation to growth versus defense. This study emphasizes the impact of life historyon mortality in a tree hosting a pathogen and could inform forest management practices forchestnut conservation in the face of potential mortality from blight infection.
INTRODUCTION Identifying the manyunderlying factors contributing to tree deathis challenging (Franklin et al. 1987, Shugart1987, Waring 1987). In general, early succes-sional species that have high growth ratestend to die younger than late-successional,slow-growing species on the same sites (Baz-zaz 1979, Loehle 1988, Orwig and Abrams1994, Black et al. 2008). Recent studies haverevealed an inverse relationship betweenradial growth rate and longevity betweentrees of the same species, such that trees withlower radial growth rates appear to attain ahigher age at death in comparison to fastergrowing trees of the same species (Black et al.2008, Bigler and Veblen 2009).
The American chestnut, [Castanea dentata
(Marsh.) Borkh.], was once a common dom-inant canopy species in eastern deciduous
forests, but following the introduction ofthe chestnut blight, [Cryphonectria parasitica
(Murr.) Barr.] in 1904, chestnut growth hasbeen limited to the understory (Fei et al.2007). Because the blight infects stems notroots, chestnuts have escaped rapid extinctionby continually re-sprouting from the rootcollar after an infected stem dies (Davelosand Jarosz 2004). The shade-tolerant chestnutsprouts grow in the understory but seldomreach sexual maturity before blight infection.Thus, a cycle of re-sprouting followed byblight-related death characterizes the persist-ing chestnut populations (Schwadron 1995).Populations of chestnut are known to bedeclining since chestnut blight introduction(Parker et al. 1993, Gaston and Fuller 2008,Elliott and Swank 2008), but the dynamics ofthis tree’s mortality are not well understood(Stilwell et al. 2003, Milo 2009, Burke 2011).
There is evidence that chestnuts that growfast are more likely to die from blight
*email address: [email protected]
Received August 17, 2010; Accepted February 15, 2011.
CASTANEA 76(2): 129–139. JUNE 2011
129
infection than chestnuts that grow moreslowly, which are likely to die from other causes(Milo 2009). Larger growth increments in thelast 15 years prior to death were exhibited inrecently dead chestnuts showing symptoms ofthe chestnut blight. This suggests that a trade-off may exist: slow-growing chestnuts mayavoid infection but be more susceptible todeath from competition for light. Likewise,faster-growing chestnuts may compete for lightbetter, but increased growth rates may increasesusceptibility to the chestnut blight (Milo2009). Previous studies were done on a smallspatial scale in a single stand, likely withsimilar habitat conditions, and investigationacross a landscape is needed in order tocorroborate these findings as widespread.
We examine the relationship betweengrowth rate and stem longevity in the Ameri-can chestnut, a tree of importance to forestconservation in North America. The purpose ofthis study was to investigate chestnut radialgrowth rates in relation to longevity and blightpresence. Specific questions were: 1) Is growthrate correlated with age at death? 2) Wherechestnuts have high radial growth rates, doesthe blight appear to be the cause of death, orare they dying more often due to other causes?
MATERIALS AND METHODS The studyoccurred in Craig and Giles counties (37u129
380N to 37u22950N; 80u26910W to 80u39920W),located in the Appalachian mountains ofsouthwest Virginia, within the natural rangeof C. dentata (Sargent 1922). Throughout standunits of, or private lands adjacent to, JeffersonNational Forest, circular 0.04 ha plots wereregularly spaced either 150 or 300 m apartdepending on the size of the stand unit. Withinthese plots, all dead chestnuts which reached atleast breast height (1.4 m) were recorded andcut in cross section as close to the base of thetree stem as possible. Only dead chestnuts withbark still attached were sampled to ensure anaccurate measurement of age at death.
Growth Rate and LongevityCross sections of the dead chestnuts in eachplot were prepared using a band saw andprogressively finer grits of sandpaper: 80, 180,320, 400, and 600. Annual growth incrementson each cross section were measured to thenearest 0.01 mm (Velmex stage, Acu-Riteencoder, and Metronics readout from Velmex,
Bloomfield, New York; and Measure J2X V4from Voortech Consulting, Holderness, NewHampshire). For each increment, the distancebetween the beginning point of the early woodand the end point of the late wood constitutedone year of tree growth. Two radii were markedon each cross section, and, whenever possible,the two radii were 90u apart to capture growthdifferences within the sample. If the initial tworadii did not agree on age at death, thenanother radius was chosen until two radiiproduced a consistent age at death. For thechestnuts that survived at least 10 years, theaverage growth rate (mm/year) during the firstand last 10 years was determined.
Blight PresencePresence of blight on the dead chestnut stemwas noted through visual inspection of thechestnut prior to sampling, observing cankers,or orange pustules on the stem (McEwan et al.2006), which can persist on dead chestnutsthrough saprophytic growth for at least twoyears after tree death (Prospero et al. 2006).
Statistical AnalysisFor all analyses, growth rates of the two radiiwithin a tree’s cross section were averaged,avoiding pseudoreplication. The average first10 years of growth, average last 10 years ofgrowth, and age at death were each trans-formed by taking the natural logarithm.
The relationship between growth rate in thefirst 10 years and age at death was analyzedusing a linear regression (PROC REG; SAS,version 9.1.3, SAS Institute, Cary, NorthCarolina).
A logistic regression was performed on blightpresence at death as the outcome and twogrowth predictors, mean first 10 years of growthand mean last 10 years of growth, using PROCGLIMMIX with a binary distribution and logitlink function in SAS 9.1.3 (SAS Institute, Cary,North Carolina). Plot was included as a randomeffect in the model to avoid potential autocor-relation between trees that were from the sameplot. The optimization technique used was theSAS 9.1 default, Dual Quasi-Newton.
RESULTS Data from 76 trees across 34 plotswere available for analysis. A total of ten treesamples were excluded from analysis: twobecause cross sections had pre-sampling dam-age that obscured growth patterns, four be-
130 CASTANEA VOL. 76
cause they did not survive at least 10 years, andfour because they were identified as outliers (z-score . 3.29) in either age at death or growthrate during the first or last 10 years of growth.
Growth Rate and LongevityAmong chestnut samples the mean growthrate during the first 10 years ranged from 0.23–1.3 mm/year with an overall mean of 0.64 mm/year among the 76 trees. The mean growth rateduring the last 10 years ranged from 0.14–2.4 mm/year with an overall mean of 0.56 mm/year among the 76 trees. Age at death amongtrees ranged from 10 to 67 years with an overallmean of 31 years among the 76 trees.
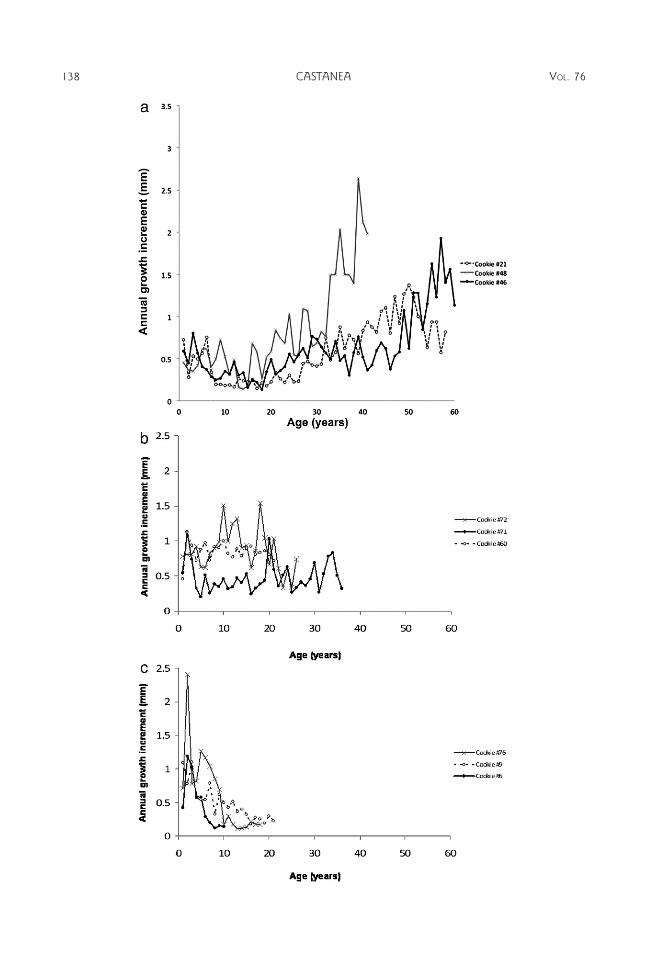
We could not standardize our ring incre-ment data to remove age-related growthtrends by adjusting each ring increment widthfor the increasing volume of a stem as a treegrows. To standardize ring increment widths,one must assume constant tree height growtheach year. Because the chestnuts we sampledgrew in understory conditions, they did notgrow an equal amount in height eachgrowing season. Furthermore, for canopytrees, a negative exponential relationship isusually observed when plotting ring incre-ment versus age (Speer 2010), but the ringincrement versus age plots for the chestnutswe sampled did not consistently follow anegative exponential relationship (See Ap-pendix A). No salient growth pattern emerged
among the tree samples, so we could notstandardize our ring increment widths.
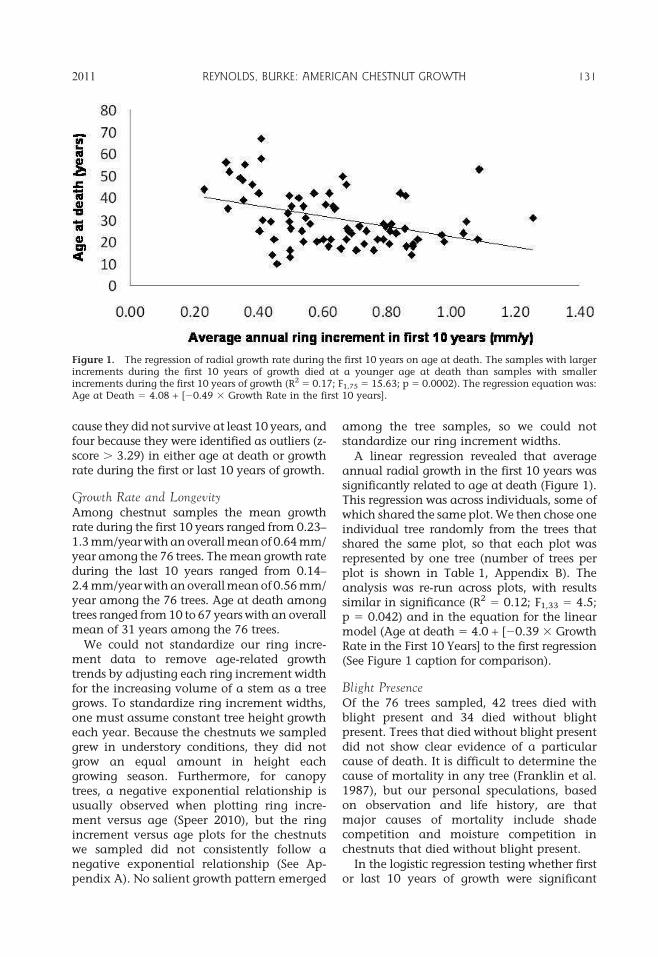
A linear regression revealed that averageannual radial growth in the first 10 years wassignificantly related to age at death (Figure 1).This regression was across individuals, some ofwhich shared the same plot. We then chose oneindividual tree randomly from the trees thatshared the same plot, so that each plot wasrepresented by one tree (number of trees perplot is shown in Table 1, Appendix B). Theanalysis was re-run across plots, with resultssimilar in significance (R2 5 0.12; F1,33 5 4.5;p 5 0.042) and in the equation for the linearmodel (Age at death 5 4.0 + [20.39 3 GrowthRate in the First 10 Years] to the first regression(See Figure 1 caption for comparison).
Blight PresenceOf the 76 trees sampled, 42 trees died withblight present and 34 died without blightpresent. Trees that died without blight presentdid not show clear evidence of a particularcause of death. It is difficult to determine thecause of mortality in any tree (Franklin et al.1987), but our personal speculations, basedon observation and life history, are thatmajor causes of mortality include shadecompetition and moisture competition inchestnuts that died without blight present.
In the logistic regression testing whether firstor last 10 years of growth were significant
Figure 1. The regression of radial growth rate during the first 10 years on age at death. The samples with largerincrements during the first 10 years of growth died at a younger age at death than samples with smallerincrements during the first 10 years of growth (R2 5 0.17; F1,75 5 15.63; p 5 0.0002). The regression equation was:Age at Death 5 4.08 + [20.49 3 Growth Rate in the first 10 years].
2011 REYNOLDS, BURKE: AMERICAN CHESTNUT GROWTH 131
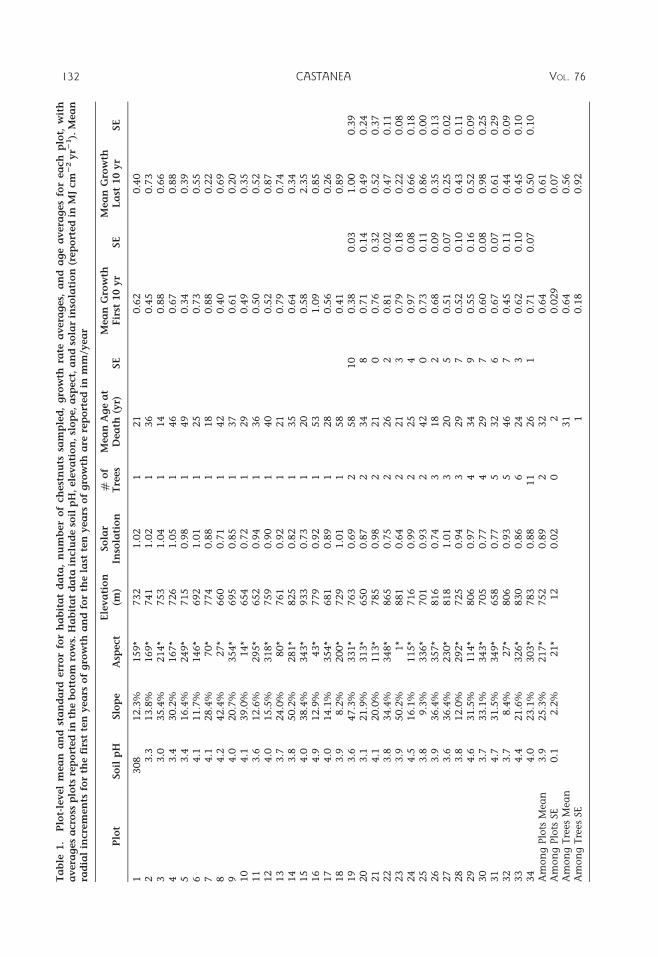
Ta
ble
1.
Plo
t-le
vel
mea
na
nd
sta
nd
ard
err
or
for
ha
bit
at
da
ta,
nu
mb
er
of
chest
nu
tssa
mp
led
,g
row
thra
tea
vera
ges,
an
da
ge
avera
ges
for
ea
chp
lot,
wit
ha
vera
ges
acro
ssp
lots
rep
ort
ed
inth
eb
ott
om
row
s.H
ab
ita
td
ata
incl
ud
eso
ilp
H,ele
va
tio
n,
slo
pe,
asp
ect
,a
nd
sola
rin
sola
tio
n(r
ep
ort
ed
inM
Jcm
22
yr2
1).
Mea
nra
dia
lin
crem
en
tsfo
rth
efi
rst
ten
yea
rso
fg
row
tha
nd
for
the
last
ten
yea
rso
fg
row
tha
rere
po
rted
inm
m/y
ea
r
Plo
tSo
ilp
HSlo
pe
Asp
ect
Ele
va
tio
n(m
)So
lar
Inso
lati
on
#o
fT
rees
Mea
nA
ge
at
Dea
th(y
r)SE
Mea
nG
row
thFir
st10
yr
SE
Mea
nG
row
thL
ast
10
yr
SE
1308
12.3
%159*
732
1.0
21
21
0.6
20.4
02
3.3
13.8
%169*
741
1.0
21
36
0.4
50.7
33
3.0
35.4
%214*
753
1.0
41
14
0.8
80.6
64
3.4
30.2
%167*
726
1.0
51
46
0.6
70.8
85
3.4
16.4
%249*
715
0.9
81
49
0.3
40.3
96
4.1
11.7
%146*
692
1.0
11
25
0.7
30.5
57
4.1
28.4
%70*
774
0.8
81
18
0.8
80.2
28
4.2
42.4
%27*
660
0.7
11
42
0.4
00.6
99
4.0
20.7
%354*
695
0.8
51
37
0.6
10.2
010
4.1
39.0
%14*
654
0.7
21
29
0.4
90.3
511
3.6
12.6
%295*
652
0.9
41
36
0.5
00.5
212
4.0
15.5
%318*
759
0.9
01
40
0.5
20.8
713
3.7
24.0
%80*
761
0.9
21
21
0.7
90.7
414
3.8
50.2
%281*
825
0.8
21
35
0.6
40.3
415
4.0
38.4
%343*
933
0.7
31
20
0.5
82.3
516
4.9
12.9
%43*
779
0.9
21
53
1.0
90.8
517
4.0
14.1
%354*
681
0.8
91
28
0.5
60.2
618
3.9
8.2
%200*
729
1.0
11
58
0.4
10.8
919
3.6
47.3
%331*
763
0.6
92
58
10
0.3
80.0
31.0
00.3
920
3.1
21.9
%313*
650
0.8
72
34
80.7
10.1
40.4
90.2
421
4.1
20.0
%113*
785
0.9
82
21
00.7
60.3
20.5
20.3
722
3.8
34.4
%348*
865
0.7
52
26
20.8
10.0
20.4
70.1
123
3.9
50.2
%1*
881
0.6
42
21
30.7
90.1
80.2
20.0
824
4.5
16.1
%115*
716
0.9
92
25
40.9
70.0
80.6
60.1
825
3.8
9.3
%336*
701
0.9
32
42
00.7
30.1
10.8
60.0
026
3.9
36.4
%357*
816
0.7
43
18
20.6
80.0
90.3
50.1
327
3.6
36.4
%230*
818
1.0
13
20
50.5
10.0
70.2
50.0
228
3.8
12.0
%292*
725
0.9
43
29
70.5
20.1
00.4
30.1
129
4.6
31.5
%114*
806
0.9
74
34
90.5
50.1
60.5
20.0
930
3.7
33.1
%343*
705
0.7
74
29
70.6
00.0
80.9
80.2
531
4.7
31.5
%349*
658
0.7
75
32
60.6
70.0
70.6
10.2
932
3.7
8.4
%27*
806
0.9
35
46
70.4
50.1
10.4
40.0
933
4.4
21.6
%326*
830
0.8
66
24
30.6
20.1
00.4
50.1
034
4.0
23.1
%303*
783
0.8
811
26
10.7
10.0
70.5
00.1
0A
mon
gPlo
tsM
ean
3.9
25.3
%217*
752
0.8
92
32
0.6
40.6
1A
mon
gPlo
tsSE
0.1
2.2
%21*
12
0.0
20
20.0
29
0.0
7A
mon
gT
rees
Mea
n31
0.6
40.5
6A
mon
gT
rees
SE1
0.1
80.9
2
132 CASTANEA VOL. 76
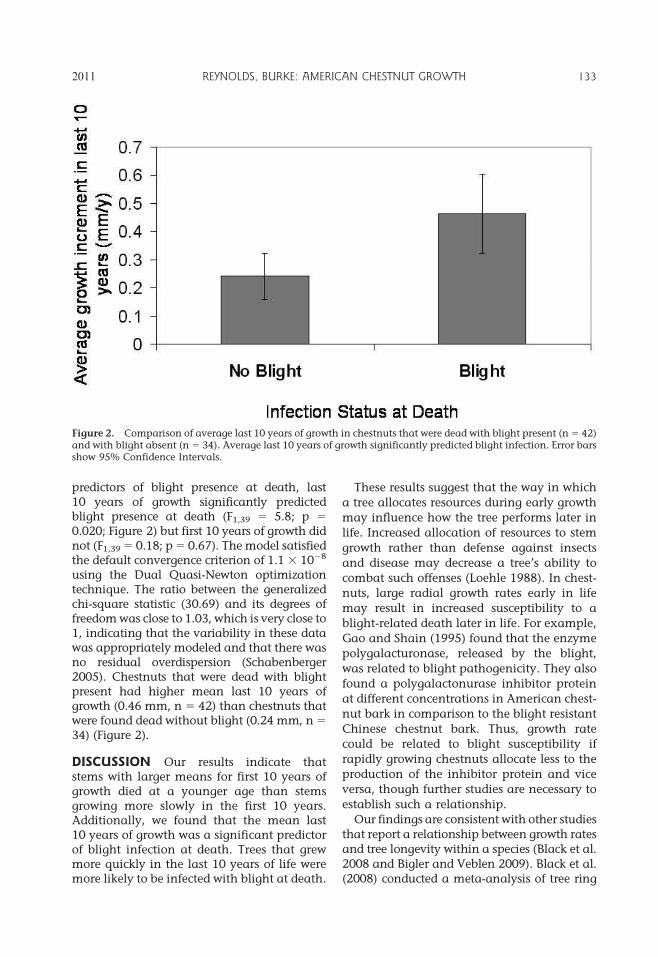
predictors of blight presence at death, last10 years of growth significantly predictedblight presence at death (F1,39 5 5.8; p 5
0.020; Figure 2) but first 10 years of growth didnot (F1,39 5 0.18; p 5 0.67). The model satisfiedthe default convergence criterion of 1.1 3 1028
using the Dual Quasi-Newton optimizationtechnique. The ratio between the generalizedchi-square statistic (30.69) and its degrees offreedom was close to 1.03, which is very close to1, indicating that the variability in these datawas appropriately modeled and that there wasno residual overdispersion (Schabenberger2005). Chestnuts that were dead with blightpresent had higher mean last 10 years ofgrowth (0.46 mm, n 5 42) than chestnuts thatwere found dead without blight (0.24 mm, n 5
34) (Figure 2).
DISCUSSION Our results indicate thatstems with larger means for first 10 years ofgrowth died at a younger age than stemsgrowing more slowly in the first 10 years.Additionally, we found that the mean last10 years of growth was a significant predictorof blight infection at death. Trees that grewmore quickly in the last 10 years of life weremore likely to be infected with blight at death.
These results suggest that the way in which
a tree allocates resources during early growth
may influence how the tree performs later in
life. Increased allocation of resources to stem
growth rather than defense against insects
and disease may decrease a tree’s ability to
combat such offenses (Loehle 1988). In chest-
nuts, large radial growth rates early in life
may result in increased susceptibility to a
blight-related death later in life. For example,
Gao and Shain (1995) found that the enzyme
polygalacturonase, released by the blight,
was related to blight pathogenicity. They also
found a polygalactonurase inhibitor protein
at different concentrations in American chest-
nut bark in comparison to the blight resistant
Chinese chestnut bark. Thus, growth rate
could be related to blight susceptibility if
rapidly growing chestnuts allocate less to the
production of the inhibitor protein and vice
versa, though further studies are necessary to
establish such a relationship.
Our findings are consistent with other studiesthat report a relationship between growth ratesand tree longevity within a species (Black et al.2008 and Bigler and Veblen 2009). Black et al.(2008) conducted a meta-analysis of tree ring
Figure 2. Comparison of average last 10 years of growth in chestnuts that were dead with blight present (n 5 42)and with blight absent (n 5 34). Average last 10 years of growth significantly predicted blight infection. Error barsshow 95% Confidence Intervals.
2011 REYNOLDS, BURKE: AMERICAN CHESTNUT GROWTH 133
data from four North American tree species:Tsuga canadensis (L.) Carr., Quercus alba L.,Pinus ponderosa Douglas ex C.Lawson, andPseudotsuga menziesii (Mirb.) Franco. In eachspecies, they found that growth rate wasnegatively correlated with longevity. Biglerand Veblen (2009) performed a similar studyon three conifers in subalpine forests: Abies
lasiocarpa (Hook.) Nutt., Picea engelmannii Parryex Engelm., and Picea abies (L.) H. Karst. Biglerand Veblen (2009) found that fast early growthup to the age of 50 years was negativelycorrelated with longevity. The authors of bothstudies suggest differential resource allocationto growth and defense in rapidly growing treesversus slowly growing trees could involvetradeoffs that could explain differences inlongevity within a species.
Our finding that the mean last 10 years ofgrowth was a significant predictor of blightpresence at death are consistent with findingsby Milo (2009), confirming that this phenom-enon is widespread across stands in thisregion. As Milo (2009) and Hebard (1982)have suggested, perhaps the blight infectsfaster growing chestnuts because fastergrowth creates a larger potential area onwhich blight spores can germinate and moreentry points in the stem for the spores.
Our findings suggest not only that fastgrowth early in life decreases longevity, butthat fast growth at any time may decreaselongevity in chestnuts due to an increasedsusceptibility to the blight. Accordingly, onemight expect chestnuts growing faster early inlife to both die sooner and suffer from ablight-related death more often in compari-son to chestnuts with slower radial growthrates early in life. Based on our data however,trees dying without blight symptoms did notsignificantly differ from trees dying with blightsymptoms present in longevity (27 6 4 yearsand 33 6 4 years [mean 6 2 SE], respectively)nor in average radial growth rate during thefirst 10 years (0.62 6 0.07 mm/year and 0.65 6
0.07 mm/year [mean 6 2 SE], respectively).Perhaps early growth rates in chestnuts do nogreatly affect blight susceptibility, but haveother effects not directly related to the blight,such as defense against insects or deer grazing,that affect a tree’s longevity.
The inability to meet the assumptionsnecessary to standardize our tree increment
widths to an estimated growth curve, couldhave influenced our results. Generally, den-drochronological studies of canopy trees ad-just ring increment widths for the effect of anincreasing circumference on the yearly radialincrement measurements. However, since wesampled almost exclusively small understorychestnuts with an average basal diameter of3.5 6 0.4 cm (mean 6 2 SE), it is not likelythat our results were greatly impacted by notstandardizing increment widths. Measure-ments of average growth rates during the first10 years probably would not have changedmuch if we were able to standardize ourgrowth rates to a negative exponential curve,since the stem diameter is relatively smallduring the first 10 years of growth. Measure-ments of average growth rates during the last10 years may have been affected, such that thereported measurements of growth rates maybe smaller than the actual growth rates,because a tree putting on the same volumeannually to an increasing circumference willhave progressively smaller increments. Be-cause the chestnuts that died with and withoutblight present on average had similar basaldiameters (4.0 6 0.6 cm and 2.9 6 0.6 cm[mean 6 2 SE], respectively), adjustments tomeasurements of growth rates during the last10 years most likely would have been similarfor chestnuts that died with and without blightpresent. As such, not standardizing these datadid not greatly influence our finding that fastergrowth during the last 10 years of life increasesthe probability of a blight-related death.
Chestnut growth and chestnut blight infec-tion are likely affected by the chestnut’s habitat,and the effects of habitat conditions may causeinteresting dynamics between chestnut blightand chestnut growth. For example, habitatconditions where the fungus can flourish maydiffer from habitat conditions where understorychestnuts grow well. We assessed how thehabitat variables soil pH, slope, aspect, andelevation were correlated with the variation ingrowth rate between plots but did not find thatthese variables were significantly correlated (SeeAppendix B). Thus, we showed that the rela-tionships between first ten years of radialgrowth and longevity and between last tenyears of radial growth and death from chestnutblight were not specific to certain habitats butrather widespread across habitats varying in
134 CASTANEA VOL. 76
soil pH, elevation, slope, and aspect. Futurestudies could analyze the effect of soil moistureand canopy density on growth rate and longev-ity. Water availability is related to sporeproduction, and it appears that chestnut pop-ulations are being shifted to sites with relativelylow moisture content (Stevens 1917, Russell1987, Griffin 1989, Stephenson et al. 1991).Due to its shade tolerance (Wang et al. 2006)and to its potential for rapid growth, chestnutscan compete well in the understory when lightbecomes available (McEwan et al. 2006). Shade,which is higher on sites with high canopydensity, affects chestnut abundance and per-haps susceptibility to or transmission of chest-nut blight (Griffin et al. 1991, Burke 2011), andperhaps affects growth rate and longevity aswell. By comparing radial growth rates, longev-ity, and blight presence of chestnuts across sitesthat vary in habitat, understanding of interac-tions among chestnut growth rate, mortality,and blight infection will improve.
In addition to the potential for a betterunderstanding of host-pathogen interactions,this study could shed light on other tree-diseasesystems, such as Dutch elm disease [Ophios-
toma ulmi (Buisman) Nannf.], sudden oakdeath (Phytophthora ramorum Werres, de Cock,& In’t Veld), and beech bark disease (Crypto-
coccus fagisuga Lind. and Nectria spp.), if arelationship exists between growth rates anddisease susceptibility. As temperatures, nitro-gen deposition, precipitation, and CO2 concen-trations increase, changes in radial growthrates of tree species could affect disease andherbivore susceptibility by altering resourceallocation (Spiecker et al. 1996, Ryan et al.2008, as cited by Bigler and Veblen 2009). Thisstudy could also have implications for blight-resistant chestnut reintroductions or conserva-tion of wild chestnuts by establishing theimportance of considering life history whenmanaging to prevent disease.
Further studies are necessary in order tounderstand the mechanisms underlying ourfindings. For example, we do not know theextent to which trees growing at different ratesdiffer in their allocation of resources to defense.Additional questions remain, such as how thechestnut blight performs in different environ-ments and how that may relate to chestnutgrowth rates. In order to manage forests forchestnut conservation and restoration, deter-
mining the effects of life history, resourceallocation, and sprouting ability on chestnutmortality is important. Tree growth rates arean important factor to consider when predict-ing tree death or considering causation of treedeath. Life history can inform the manage-ment and conservation of declining tree speciesby identifying patterns of growth history intrees infected by pathogens.
ACKNOWLEDGMENTS We are extremelygrateful to Henry Wilbur for his advice onexperimental design and analysis. We thankVirginia Seamster and Julia Reis for theirrevisions of this paper. We thank Ruby Siegelfor her help in the field. We are grateful forfunding from University of Virginia, Moun-tain Lake Biological Station, and the SamuelMiller Fund. We appreciate the use of facilitiesfrom the Virginia Division of Forestry.
LITERATURE CITEDBazzaz, F.A. 1979. The physiological ecology
of plant succession. Annu. Rev. Ecol. Syst.10:351–371.
Bigler, C. and T.T. Veblen. 2009. Increased earlygrowth rates decrease longevities of conifersin subalpine forests. Oikos 118:1130–1138.
Black, B.A., J.J. Colbert, and N. Pederson.2008. Relationships between radial growthrates and lifespan within North Americantree species. Ecoscience 15:349–357.
Burke, K.L. 2011. The effects of logging anddisease on American chestnut. Forest Ecol.Manage. 261:1027–1033.
Davelos, A.L. and A.M. Jarosz. 2004. Demog-raphy of American chestnut populations:effects of a pathogen and a hyperparasite.J. Ecol. 92:675–685.
Elliott, K.J. and W.T. Swank. 2008. Long-termchanges in forest composition and diversityfollowing early logging (1919–23) and thedecline of American chestnut (Castanea
dentata). Plant Ecol. 197:155–172.
Fei, S., J. Schibig, and M. Vance. 2007. Spatialhabitat modeling of American chestnut atMammoth Cave National Park. Forest Ecol.Manage. 252:201–207.
Franklin, J.F., H.H. Shugart, and M.E. Har-mon. 1987. Tree death as an ecologicalprocess. BioScience 37:550–555.
2011 REYNOLDS, BURKE: AMERICAN CHESTNUT GROWTH 135
Gao, S. and L. Shain. 1995. Activity ofpolygalacturonase produced by Cryphonec-
tria parasitica in chestnut bark and itsinhibition by extracts from American andChinese chestnut. Physiol. Molec. PlantPathol. 46:199–213.
Gaston, K.J. and R.A. Fuller. 2008. Common-ness, population depletion, and conserva-tion biology. Trends Ecol. Evol. 23:14–19.
Griffin, G.J. 1989. Incidence of chestnut blightand survival of American chestnut in forestclearcut and neighboring understory sites.Plant Disease 73:123–127.
Griffin, G.J., H.C. Smith, A. Dietz, and J.R.Elkins. 1991. Importance of hardwoodcompetition to American chestnut survival,growth, and blight development in forestclearcuts. Can. J. Bot. 69:1804–1809.
Hebard, F.V. 1982. Biology of virulent andhypovirulent Endothia parasitica on Ameri-can chestnut (Castanea dentata). Ph.D.Dissertation, Virginia Polytechnic Institute,Blacksburg, Virginia.
Loehle, C. 1988. Tree life history strategies:the role of defenses. Can. J. Forest Res.18:209–222.
McCune, B. and D. Keon. 2002. Equations forpotential direct incident radiation and heatload. J. Veg. Sci. 13:603–606.
McEwan, R.W., C.H. Keiffer, and B.C.McCarthy. 2006. Dendroecology of Ameri-can chestnut in a disjunct stand of oak-chestnut forest. Can. J. Forest Res. 36:1–11.
Milo, A.M. 2009. The spatial and temporaldynamics of American chestnut growth andinfection by chestnut blight. M.S. thesis, Uni-versity of Virginia, Charlottesville, Virginia.
Orwig, D. and M.D. Abrams. 1994. Contrastingradial growth and canopy recruitment pat-terns in Liriodendron tulipifera and Nyssa
sylvatica: gap obligate versus gap facultativetree species. Can. J. Forest Res. 24:2141–2149.
Parker, G.G., S.M. Hill, and L.A. Kuehnel. 1993.Decline of understory American chestnut(Castanea dentata) in a Southern Appala-chian forest. Can. J. Forest Res. 23:259–265.
Prospero, S., M. Conedera, U. Heiniger, and D.Rigling. 2006. Saprophytic activity andsporulation of Cryphonectria parasitica on
dead chestnut wood in forests with natural-ly established hypovirulence. Phytopathol-ogy 96:1337–1344.
Russell, E.W.B. 1987. Pre-blight distribution ofCastanea dentata (Marsh.) Borkh. B. TorreyBot. Club 114:183–190.
Ryan, M.G., S.R. Archer, R.A. Birdsey, C.N.Dahm, L.S. Heath, J.A. Hicke, D.Y. Hollinger,T.E. Huxman, G.S. Okin, R. Oren, J.T.Randerson, and W.H. Schlesinger. 2008.Land resources. p. 75–120. In: The effects ofclimate change on agriculture, land resourc-es, water resources, and biodiversity. A reportby the United States Climate Change ScienceProgram and the Subcommittee on GlobalChange Research. Washington, D.C.
Sargent, C.S. 1922. Manual of the trees ofNorth America. Houghton Mifflin, NewYork, New York.
SAS Institute Inc. 2002–03. Version 9.1.3. SASInstitute Inc., Cary, North Carolina.
SAS Institute Inc. 2009. SAS/STATH 9.2User’ s Guide, 2nd ed. SAS Institute Inc.,Cary, North Carolina.
Schabenberger, O. 2005. Introducing theGLIMMIX procedure for generalized linearmixed models. Paper 196-30. Proceedings ofthe 30th Annual SAS Users Group Interna-tion (SUGI) Conference. SAS Institute Inc,Cary, North Carolina.
Schwadron, P.A. 1995. Distribution and per-sistence of American chestnut sprouts,Castanea dentate (Marsh.) Borkh., in North-eastern Ohio woodlands. Ohio J. Sci.95:281–288.
Shugart, H.H. 1987. Dynamic ecosystemconsequences of tree birth and death pat-terns. Bioscience 37:596–602.
Speer, J.H. 2010. Fundamentals in tree ringresearch. University of Arizona, Tucson,Arizona.
Spiecker, H., K. Mielikainen, M. Kohl, and J.Skovsgaard. 1996. Growth trends in Euro-pean forests: studies from 12 countries.Springer-Verlag, New York, New York.
Stephenson, S.L., H.S. Adams, and M.L. Lip-ford. 1991. The present distribution of chest-nut in the upland forest communities ofVirginia. Bull. Torrey Bot. Club 118:24–32.
136 CASTANEA VOL. 76
Stevens, N.E. 1917. The influence of certainclimatic factors on the development ofEndothia parasitica (Murr.) And. Amer. J.Bot. 4:1–32.
Stilwell, K.L., H.M. Wilbur, C.R. Werth, andD.R. Taylor. 2003. Heterozygote advantagein the American chestnut, Castanea dentata
(Fagaceae). Amer. J. Bot. 90:207–213.
Wang, G.G., W.L. Bauerle, and B.T. Mudder.2006. Effects of light acclimation of thephotosynthesis, growth, and biomass allo-cation in American chestnut (Castanea
dentata) seedlings. Forest Ecol. Manage.226:173–180.
Waring, R.H. 1987. Characteristics of treespredisposed to die. Bioscience 37:569–574.
APPENDIX A. CHESTNUT RADIALGROWTH PATTERNS
In dendrochronological measurements, treering increments may become smaller as thecircumference of the tree increases, even thoughthe same volume is added to the tree each year.Thus, tree ring chronologies are often standard-ized by assuming a negative exponentialrelationship of tree ring increment with time(Speer 2010). However, this method of standard-ization assumes a constant growth in heighteach year. We did not find a negative exponen-tial relationship to be consistent throughout thetrees samples (Appendix, Figure 1). Becausethese trees were confined to the understory, itmakes sense that their growth in height was notconstant from year to year but rather dependedon canopy gap dynamics. Hence, we did notstandardize our tree ring chronology.
APPENDIX B. ANALYSIS OF THE EFFECTSOF HABITAT ON GROWTH RATE
INTRODUCTION The purpose of this anal-ysis was to assess whether there were signif-icant differences in radial growth rate withinand between plots and whether variation inhabitat explained the variation betweenplots. Chestnut is generally not found onbasic, limestone-based soils (Russell 1987).Further, slope, aspect, and elevation havebeen shown to influence chestnut’s presenceand abundance (Stephenson et al. 1991,Burke 2011). Thus, we hypothesized that thesevariables would affect chestnut’s growth rate.
METHODS Habitat conditions were mea-sured at each 0.04 ha circular plot. Soil to adepth of 10 cm was taken from each of the fourcardinal directions, 5.5 m from the plot center,in order to determine the plot’s average soil pH.From the center of each plot, slope wasmeasured with an Abney level, aspect wasmeasured with a compass, and elevation wasmeasured with a handheld GPS allowed toaverage for 10 minutes. The slope and aspect ofeach plot were used to calculate the directincident solar insolation, following equation 2in McCune and Keon (2002). Direct incidentsolar insolation provided a measurement of theamount of solar radiation radiating perpen-dicular to the surface of each plot over a giventime at a given latitude.
Variation in mean first 10 years of growthand in mean last 10 years of growth amongtrees within a plot and among plots were eachanalyzed in an ANOVA using SAS 9.1.3 (SASInstitute, Cary, North Carolina). The soil pHmeasured from soil samples, solar insolationcalculated from slope and aspect, and eleva-tion of each plot were then compared towithin-plot means of annual increments inthe first and in last 10 years of growth in acanonical correlation using SAS 9.1.3 (SASInstitute, Cary, North Carolina). Canonicalcorrelation does not make the assumptionthat the predictor variables are independent;since variables describing the same habitatare often correlated, we deemed this analysisappropriate for our dataset.
RESULTS Mean annual increment in thefirst 10 years of growth was significantlydifferent among trees within each plot(F42,75 5 26.8; p , 0.0001) and among plots(F33,75 5 25.8; p , 0.0001). Mean annualincrement in the last 10 years of growth alsovaried significantly among trees within eachplot (F42,75, 5 15.7; p , 0.0001) and amongplots (F33,75 5 13.7; p , 0.0001).
Plots varied in habitat characteristics (Ta-ble 1). Among the plots, soil pH ranged from3.0–4.9 with a mean of 3.9. Slope ranged from8.2–50.2% with a mean of 25.3%. Aspectvaried across all ordinal directions with arange from 1u–357u. Solar insolation rangedfrom 0.64–1.05 MJ cm22 yr21 with a mean of0.89 MJ cm22 yr21. Elevation of plots sampledranged from 650–933 m with a mean of752 m.
2011 REYNOLDS, BURKE: AMERICAN CHESTNUT GROWTH 137
138 CASTANEA VOL. 76

The microhabitat variables measured (soilpH, solar insolation, and elevation) could notexplain the differences among plots in acanonical correlation because neither of thetwo canonical variates calculated were signif-icant (F6,58 5 1.1; p 5 0.36 and F2,30 5 0.81;
p 5 0.46). The F-values reported are approx-imated using Wilks’ Lambda, which is calcu-lated as (1- canonical correlatiion2) and isused to test the null hypothesis that thecanonical correlations are zero (SAS Institute,Inc. 2009).
r
Figure 1. Chestnut growth trends. Each increment was measured for one year of growth starting from the firstyear of growth to the last full year of growth. a) Three representative samples of chestnuts with small incrementsearly, which increase over time. b) Relatively constant increments over time. c) Decrease in increments over time.
2011 REYNOLDS, BURKE: AMERICAN CHESTNUT GROWTH 139