Embed Size (px)
Citation preview
South African Journal of Industrial Engineering December 2016 Vol 27(4), pp 203-214
203
THE EFFECT OF SCOPE DEFINITION ON INFRASTRUCTURE PROJECTS: A CASE IN MALAWI’S PUBLIC AND PRIVATE IMPLEMENTING AGENCIES
R.K. Banda Jr.1# & L. Pretorius1*
ARTICLE INFO
Article details Submitted by authors 12 May 2016 Accepted for publication 25 Oct 2016 Available online 6 Dec 2016 Contact details * Corresponding author [email protected] Author affiliations 1 Department of Engineering and
Technology Management, University of Pretoria, South Africa
# The author was enrolled for a
Master of Project Management (MPM) degree in the Graduate School of Technology Management, University of Pretoria
DOI http://dx.doi.org/10.7166/27-4-1562
ABSTRACT
This research was carried out to determine the effect of scope definition on public building projects that are implemented by project implementing agencies (PIAs) in Malawi. The research sought to investigate the relationship between the level of scope definition and the corresponding performance of infrastructure projects. The study demonstrated the correlation between the level of project scope definition and the success of infrastructure projects. A project scope definition tool called the ‘project definition rating index’ (PDRI) was used in this research to measure the level of project scope definition. The research concluded that there is a significant direct correlation between scope definition and the corresponding performance of the sampled infrastructure projects in Malawi’s PIAs. Projects that were well-defined tended to exhibit good project performance indicators, while those that were poorly-defined tended to exhibit poor project performance indicators.
OPSOMMING
Hierdie navorsing is uitgevoer om die effek wat omvang definisie het op openbare bouprojekte wat deur projek uitvoering agentskappe (PIA) in Malawi geïmplementeer word, te bepaal. Die navorsing poog om die verhouding tussen die vlak van omvang definisie en die ooreenstemmende prestasie van infrastruktuur-projekte te ondersoek. Die studie toon verder die korrelasie tussen die vlak van die projek omvang definisie en die sukses van infrastruktuurprojekte. ’n Projek omvang definisie instrument genoem ‘Project Definition Rating Index’ (PDRI) is in hierdie navorsing gebruik om die vlak van die projek omvang definisie te meet. Die navorsing se gevolgtrekking is dat daar ’n beduidende direkte korrelasie tussen omvang definisie en die ooreenstemmende prestasie van die tersaaklike groep infrastruktuurprojekte in die PIA van Malawi is. Projekte wat goed gedefinieer is was geneig om goeie projek prestasie-aanwysers te toon, terwyl diegene wat swak gedefinieer is geneig was om swak projek prestasie-aanwysers te toon.
1 INTRODUCTION
A well-defined project scope enables successful completion of a project within the planned time, budget, and quality parameters. In the field of project management, scope definition is carried out during the pre-planning phase, which is a period that requires investing a substantial amount of time
204
and resources in activities leading to the final investment decision. This effort is proven to be an effective way of increasing the chances of project success while significantly decreasing the risks that could arise during project implementation [23]. It is also prudent, especially in public infrastructure projects, to include the time for this pre-planning in the overall duration of a project. This can also assist in managing public delivery time expectations and thus, in some sense, even positively influence project success. Project pre-planning efforts focus on defining a project in enough detail to increase the visibility of what needs to be accomplished to meet the requirements of the beneficiaries of project deliverables. At the same time, care is taken not to spend too much time on defining the project, since quick service or product delivery is required by the end-users. It is believed that projects that have a well-defined scope during pre-planning are less likely to encounter surprises such as scope creep, schedule slippages, cost overruns, and poor quality of deliverables [16]. By defining a project thoroughly, all likely risks are identified and proactive action can then be taken either to reduce the likelihood of the occurrence, or to reduce the impact, of the risk if it occurs. Project scope definition is therefore recognised as a risk management technique. If, on the other hand, it is recognised that the project has somehow been poorly defined in pre-planning, one could possibly allow sufficient contingencies — a measure also considered in fast-track projects. This line of thought has, however, not been considered in detail in this paper. The use of formal risk analysis techniques is gaining popularity in many industries, including construction. In the United States of America, for example, the use of risk analysis techniques is mandatory in the defence, offshore and nuclear industries [12]. Risk analysis techniques are also used in the building and civil engineering industries. In Malawi, infrastructure projects are implemented by project implementing agencies (PIAs), which include government ministries and departments, statutory corporations, and non-governmental organisations (NGOs) that are involved in procuring and implementing infrastructure projects. Traditionally these PIAs carry out the tasks of planning, procuring, and project implementation using in-house resources, but current trends show that most PIAs are outsourcing some of these processes to improve service delivery. Even although outsourcing is currently preferred in most PIAs, a number of infrastructure projects are still not efficiently managed, and issues of scope creep, cost overruns, schedule slippage, and poor quality infrastructure are not uncommon. A baseline survey conducted in Malawi In 2010 under the construction sector transparency initiative (CoST) on sample projects from five subsectors of the construction industry revealed an average of 197 per cent schedule slippage, and a corresponding 68 per cent cost overrun. This study presents findings on the extent of scope definition in public infrastructure projects in Malawi during the early planning stages. This is presented in Section 1 of the paper. The study mainly used the standard categories and elements laid down in the project definition rating index (PDRI) tool to measure the level of project definition, and how risk management is integrated during pre-planning in each PIA. Elements of this are discussed in Section 2. It also identifies some of the best practices in the area of risk management that are being implemented by the PIAs, and highlights the challenges that contribute to inadequate implementation of effective risk management plans in Malawi. Some of these issues are addressed in Sections 3 and 4 on the research method and the empirical results from questionnaires and interviews conducted with PIAs in Malawi.
1.1 Main objective of the research
The main objective of this research is to determine whether the detail of scope definition has a significant impact on the performance of infrastructure projects that are implemented by Malawi’s PIAs.
1.2 Research hypothesis
The hypothesis for the research presented in this paper may be stated as: “The level of project scope definition by Malawi’s PIAs during project pre-planning is inadequate effectively to address risks associated with time, cost, and quality on infrastructure projects”. This hypothesis is based on the general impression among project managers in Malawi about the level of project scope definition, and on the outcome of the baseline study under the CoST initiative conducted in 2010. It is, however, recognised that often, when projects fail, contingency and slack
205
do not match the level of the project scope definition. However, this effect is not addressed in this paper (as previously mentioned).
To test the above hypothesis, the research investigated 12 infrastructure projects from the five PIAs that were targeted in the study to measure the level of correlation between the extent of project scope definition and the resultant adherence of the projects to the predetermined budget, schedule, and quality attributes.
2 CONCEPTUAL METHOD
2.1 The project definition rating index (PDRI)
The key to achieving a successful project pre-planning process is the development of a project scope definition package [8]. Project scope definition is the process of defining projects and preparing them for execution. In the mid 1990s, the Construction Industry Institute (CII) conducted research on the development of a useful tool to measure the level of project definition. This tool was called the project definition rating index (PDRI), and it is used to calculate a representative score of the level of project scope definition. The PDRI tool was initially developed for industrial projects such as chemical and power plants, oil refineries, and heavy manufacturing. The PDRI tool developed by the CII for industrial projects contained 70 elements, divided into three main sections that were further subdivided into 15 categories. The elements were assigned a pre-defined weighting score; the overall score represented the extent of project definition, with a lower score indicating better project definition and predicting the chance of project success [25]. Based on the success that the PDRI tool had in industrial projects, project managers and planners in the building industry wanted the tool to be customised for building projects. In response to their call, the CII funded a project that synthesised the PDRI tool to be applicable to building projects [25]. The project was completed in 1999, and the outcome was a customised PDRI tool for building projects that comprised 64 elements divided into three main sections with a total of eleven categories. Each of the 64 elements was assigned a weighting based on its perceived level of importance and its potential influence on the success of the project. To obtain realistic weightings for each of the elements, experts in the building industry were widely consulted through a number of workshop sessions. Based on the final weightings, a score sheet with a maximum score of 1000 points was developed. Six levels of definition were developed for each element, with each level being assigned a specific weighting. This study borrowed the concept of project scope definition through the use of a standardised tool — the PDRI in this instance. The rationale for using the PDRI was to have a standardised basis for assessing the relationship between the level of scope definition and project performance. By rating the level of scope definition of each sampled project, the study was able to draw comparisons with performance indicators, and analyse the relationships and the correlations. The research adopted the PDRI tool for building projects to assess the scope definition of the sample projects from the five PIAs. To determine the level of scope definition of each of the sampled projects, an assessment was made by rating the applicable elements of the PDRI tool. The corresponding PDRI score was analysed against its project performance, to determine how scope definition influences project performance. To rate the level of scope definition of a project, each of the elements is rated on a scale from ‘0’ to ‘5’. Where the element is not applicable to the project, a rating of 0 is indicated. On an increasing scale of rating, 1 represents complete definition, with 5 representing incomplete and poor definition. The elemental scores represent the corresponding weighting of each level of definition. The more well-defined an element (lower on the scale of 1-5), the less the weighted score for that element. The total weighted score for the 64 elements represents the level of definition of the project; thus the lower the total weighted score (out of 1000), the more well-defined the scope of the project,
206
whereas a higher total score represents poor scope definition. The study assessed recently-completed sample projects for their level of scope definition during pre-planning. The corresponding total PDRI scores were then compared with the corresponding project performance indicators to determine the correlation.
2.2 Project performance and success parameters
This research set out to test the validity of the hypothesis by adopting the PDRI tool to measure the correlation between the level of project scope definition and the corresponding project success indicators. Project success can be defined in three ways: (i) meeting predetermined time, cost, and quality parameters (otherwise described as project effectiveness), (ii) the quality of the project management process (also referred to as project efficiency), and (iii) satisfying the needs of the stakeholders [3]. Baccarini [3] argues that the first two definitions of project success relate to project management success, while the third definition relates to product success. Baccarini [3] further argues that, although project managers use these success indicators interchangeably, there is a clear difference. A product might be considered a project management failure by professional project managers, while the same product might be considered a success by non-technical beneficiaries and stakeholders [24]. The Sydney Opera House is a typical example of this paradigm. Wit [24] further argues that product success is of greater significance than the project management process. The most successful project is the one that meets product success and project management success considerations. For the purposes of this research, however, the focus was on project management success, which encompasses project effectiveness and efficiency. PMBOK [18] defines project time management in the context of the processes involved to ensure the timely completion of a project. These processes include activity definition, sequencing, duration estimation, schedule development, and control. The processes interact, and the rigour with which project planners conduct these processes during the pre-planning phase determines how the project will perform in terms of time [3]. The time dimension of project success can be measured by presenting the time underrun/overrun as a percentage of the original project timeline [17]. 2.2.1 Cost dimension of project success Cost is another traditional dimension of project success. Cost success can be measured by presenting the cost underrun/overrun as a percentage of the original budget [17]. Project costs are easier to determine when services/activities are outsourced than when they are performed in-house [3]. The traceability of some costs can be a challenge if projects are implemented in-house, and there are some hidden costs that are normally treated as overheads [18]. 2.2.2 Quality dimension of project success The quality of the project can be measured based on whether the project outputs meet the pre-determined technical performance parameters [17]. The project outputs must be attributable to project inputs [18]. Through a systems requirements analysis, end-user requirements are turned into functional requirements, which are further developed into product specifications [6]. These specifications synthesise the raw functional requirements into the project outputs required by the end-users.
2.3 Research model
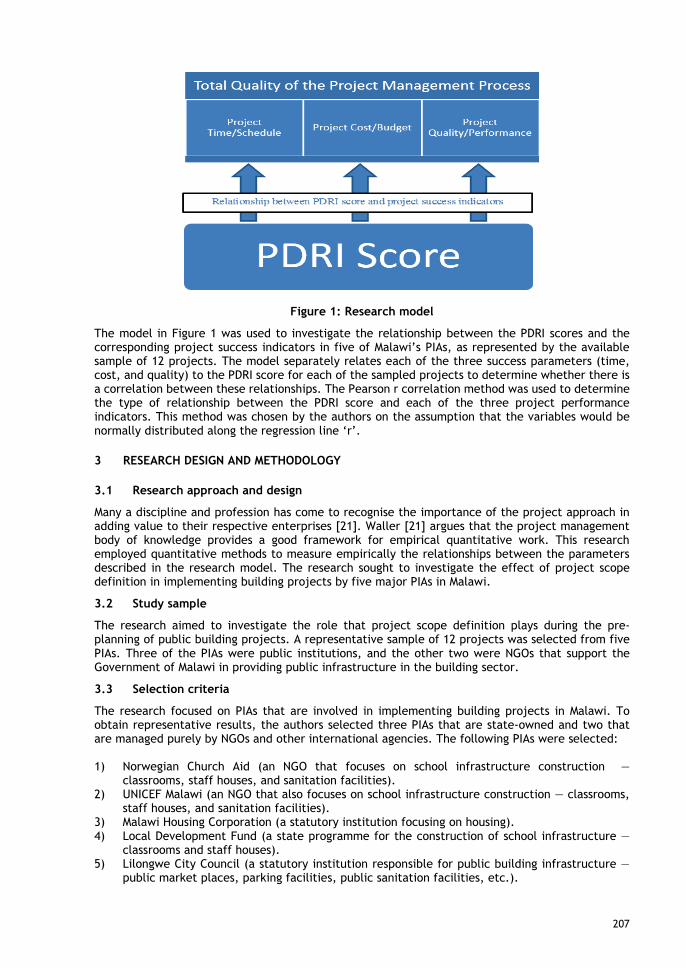
The model developed for this research was based on the intended assessment of the relationship between PDRI scores and the three project success parameters. A diagrammatic representation of the research model is given in Figure 1.
207
Figure 1: Research model
The model in Figure 1 was used to investigate the relationship between the PDRI scores and the corresponding project success indicators in five of Malawi’s PIAs, as represented by the available sample of 12 projects. The model separately relates each of the three success parameters (time, cost, and quality) to the PDRI score for each of the sampled projects to determine whether there is a correlation between these relationships. The Pearson r correlation method was used to determine the type of relationship between the PDRI score and each of the three project performance indicators. This method was chosen by the authors on the assumption that the variables would be normally distributed along the regression line ‘r’.
3 RESEARCH DESIGN AND METHODOLOGY
3.1 Research approach and design
Many a discipline and profession has come to recognise the importance of the project approach in adding value to their respective enterprises [21]. Waller [21] argues that the project management body of knowledge provides a good framework for empirical quantitative work. This research employed quantitative methods to measure empirically the relationships between the parameters described in the research model. The research sought to investigate the effect of project scope definition in implementing building projects by five major PIAs in Malawi.
3.2 Study sample
The research aimed to investigate the role that project scope definition plays during the pre-planning of public building projects. A representative sample of 12 projects was selected from five PIAs. Three of the PIAs were public institutions, and the other two were NGOs that support the Government of Malawi in providing public infrastructure in the building sector.
3.3 Selection criteria
The research focused on PIAs that are involved in implementing building projects in Malawi. To obtain representative results, the authors selected three PIAs that are state-owned and two that are managed purely by NGOs and other international agencies. The following PIAs were selected: 1) Norwegian Church Aid (an NGO that focuses on school infrastructure construction —
classrooms, staff houses, and sanitation facilities). 2) UNICEF Malawi (an NGO that also focuses on school infrastructure construction — classrooms,
staff houses, and sanitation facilities). 3) Malawi Housing Corporation (a statutory institution focusing on housing). 4) Local Development Fund (a state programme for the construction of school infrastructure —
classrooms and staff houses). 5) Lilongwe City Council (a statutory institution responsible for public building infrastructure —
public market places, parking facilities, public sanitation facilities, etc.).
208
The Malawi Public Procurement Act (2003) (MPPA) defines a public PIA as any state-owned institution that is involved in procuring and supplying goods, infrastructure, and services for the benefit of the Malawi public. All such state-owned PIAs are governed by the regulations under the MPPA. However, all other PIAs (those that are not state-owned but perform a similar function) are not bound by the rules and regulations of the MPPA. At least two of the largest projects from each PIA that have recently been completed or are in the final stages of completion were sampled. The approach of the research was to assign a PDRI score to a project, and to measure this total score against the success factors of the project. The selected projects therefore had to be completed, or close to completion, so that the three success factors would already have been determined.
3.4 Data collection
3.4.1 Formulation of variables to measure The research model was meant to measure the relationship between a sampled project’s PDRI score and its corresponding success parameters in terms of time, cost, and quality. The three success parameters were therefore the appropriate variables that were quantified for this purpose. Project success parameters are measured as a percentage of overrun/underrun [3]. The authors therefore defined the three success parameters as follows: 1) Time dimension = Total project duration – Original project duration
Original project duration 2) Cost dimension = Total project Cost – Original project cost
Original project budget 3) Quality dimension = Number of deliverables per specification at original completion date
Total original no. of deliverables In these equations, ‘deliverables’ refer to original deliverables. All three success indicators were calculated on each of the sampled projects. The 64 elements of the PDRI tool were used to measure the degree to which each of the 11 categories was defined at the project pre-planning stage. A scale of 0-5 was used to guide the respondents in rating the level of definition of each element, as described in the standard PDRI tool for building projects. 3.4.2 Data collection approach
Questionnaire A questionnaire was distributed to at least two technical personnel involved in planning, developing, and implementing the sampled projects in each PIA. The rationale was to obtain a representative result on each sampled project so that the calculated PDRI would be as close as possible to reality. Where more than one respondent rated the same project, the average PDRI score was calculated by taking the mean of PDRI scores from the completed questionnaires.
Interviews
Interviews were conducted with technical personnel responsible for project planning and implementation in the PIA, to learn what planning techniques and tools the PIAs use in planning their projects. The interviews were also intended to identify the best practices in use for managing risks associated with infrastructure project implementation.
3.5 Data analysis
The data obtained from the five PIAs were collated and categorized, based on the three success parameters for each of the sampled projects. Scatter plots were created to determine the general correlation between the average PDRI scores and the corresponding success parameters, using the Pearson r correlation method to carry out correlation analysis.
4 RESEARCH RESULTS
4.1 Introduction
This section presents the findings of the research study based on the data collected. It also presents the analysis performed on the findings, with the main objectives providing the basis for the analysis.
209
Note that the fraction PDRI score presented in the graph results was calculated by dividing the individual PDRI score of each project by its respective maximum score. For example, the individual PDRI score for ‘Chiradzulu TTC’, Project 5, was 428; divide this by its maximum score of 987, and the fraction PDRI score of 0.43 is obtained. Similarly, the individual PDRI score for ‘School Blocks at Jenda’, Project 1, was 303; divide this by its maximum score of 990, and a fraction PDRI score of 0.31 is obtained. The variation in the maximum scores for each project is attributable to some of the PDRI elements not being applicable to all projects.
4.2 Key findings from interviews
The main finding of the interviews conducted with at least two project managers at each of the five PIAs where all 12 projects were conducted was that the PDRI tool is not in common use for planning projects in Malawi. Only one (Norwegian Church Aid) of the five PIAs indicated knowledge of the PDRI tool, and had made use of it on one particular project as it was a requirement of the donor. Although the other PIAs did not use the PDRI tool, it was evident that categories 8, 9, 10, and 11 (procurement strategy, deliverables, project control, and project execution plan) of the PDRI tool were the most recognised. It was found that most of the elements under these four categories were well-defined for all infrastructure projects for the five PIAs. This was the case because the MPPA promotes the four categories as best practices in procuring infrastructure works and services. For nine of the 12 sampled projects, the business strategy category was either fully defined, or it had minor deficiencies in the definition. It was also found that category E (building programming) was the least-defined in all five PIAs. Elements such as stacking diagrams, loading/unloading requirements, building finishes, room data sheet, furnishing, and equipment requirements were either poorly-defined or not defined at all. Thus it was evident that, for all five PIAs, there was little focus on the finer finishing details that are critical to the functionality of the buildings. It was found, however, that, in one way or another, all of the PIAs make use of most of the categories defined in the PDRI tool, although they do so without necessarily making use of the PDRI tool itself. All of the project managers in the five PIAs alluded to conducting some level of scope definition during the planning phase of each project, although their efforts varied depending on the size and importance of the project. More scope definition efforts were invested in projects with a relatively higher value. One of the findings from the interviews was that, in general, public PIAs were not very forthcoming in sharing project information for the study. The project managers for the public PIAs involved in this study had to seek clearance at various levels in their respective institutions before they could share the project information. This reluctance to share project information meant that some of the public PIAs were only able to respond to the interview and not to the questionnaire that was provided.
4.3 Key findings from data collected through questionnaires
The following are the key data that were collected through the questionnaires and that provided the basis for calculating the PDRI scores and the key project success parameters: 1) Rating on each of the 64 elements of the PDRI tool for each of the sample projects; 2) Project initial budget (in United States dollars); 3) Final project cost (in United States dollars); 4) Planned project timeline (in months); 5) Actual project duration (in months); 6) Completion percentage of deliverables that meet design specifications by the initially-planned
project completion date. Each sample project was assigned a reference number (between 1-12) based on the order in which the questionnaire was received. Lilongwe City Council (LCC) did not return the questionnaire for their sample projects; Malawi Housing Corporation (MHC) did not return questionnaires for their two sample projects, but did contribute to the data gathered from the interviews conducted by the first author. Both the MHC and the LCC attributed the inability to return questionnaires to inadequate time to get the required clearances to share public project data on the sampled projects. Refer also to the previous discussion on the basis for calculating the fraction PDRI scores, henceforth named PDRI scores used to present results in the next section.
210
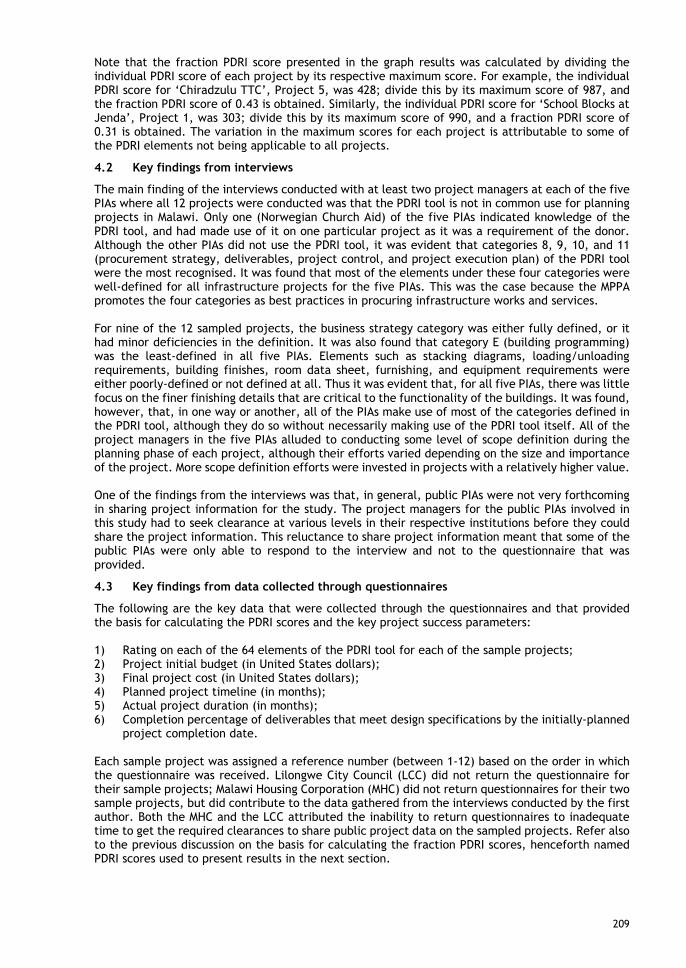
4.3.1 PDRI in relation to cost overrun/underrun The first relationship that was investigated was that between PDRI scores and the corresponding cost overrun/underruns. A scatter chart was plotted to show the general layout of the coordinates and to analyse whether there was any clear correlation. Figure 2 presents the scatter plot for the PDRI vs cost overrun/underrun relationship.
Figure 2: PDRI vs Cost Overrun/Underrun Correlation
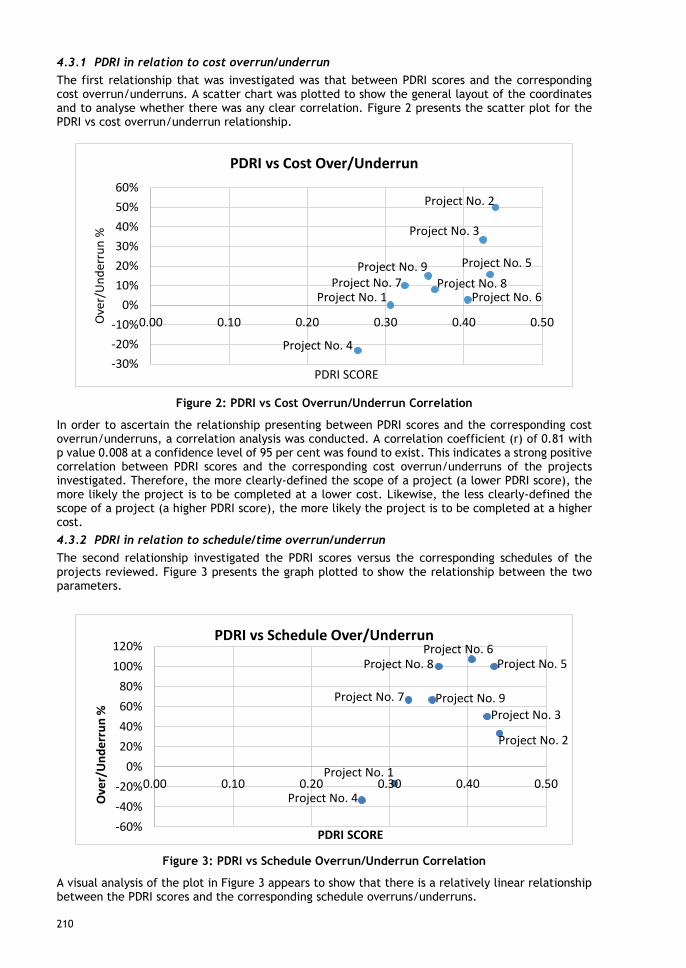
In order to ascertain the relationship presenting between PDRI scores and the corresponding cost overrun/underruns, a correlation analysis was conducted. A correlation coefficient (r) of 0.81 with p value 0.008 at a confidence level of 95 per cent was found to exist. This indicates a strong positive correlation between PDRI scores and the corresponding cost overrun/underruns of the projects investigated. Therefore, the more clearly-defined the scope of a project (a lower PDRI score), the more likely the project is to be completed at a lower cost. Likewise, the less clearly-defined the scope of a project (a higher PDRI score), the more likely the project is to be completed at a higher cost. 4.3.2 PDRI in relation to schedule/time overrun/underrun The second relationship investigated the PDRI scores versus the corresponding schedules of the projects reviewed. Figure 3 presents the graph plotted to show the relationship between the two parameters.
Figure 3: PDRI vs Schedule Overrun/Underrun Correlation
A visual analysis of the plot in Figure 3 appears to show that there is a relatively linear relationship between the PDRI scores and the corresponding schedule overruns/underruns.
Project No. 1
Project No. 2
Project No. 8Project No. 9
Project No. 3
Project No. 4
Project No. 5
Project No. 6Project No. 7
-30%-20%-10%
0%10%20%30%40%50%60%
0.00 0.10 0.20 0.30 0.40 0.50Ove
r/U
nder
run
%
PDRI SCORE
PDRI vs Cost Over/Underrun
Project No. 1
Project No. 2
Project No. 8
Project No. 9Project No. 3
Project No. 4
Project No. 5Project No. 6
Project No. 7
-60%-40%-20%
0%20%40%60%80%
100%120%
0.00 0.10 0.20 0.30 0.40 0.50
Ove
r/U
nder
run
%
PDRI SCORE
PDRI vs Schedule Over/Underrun
211
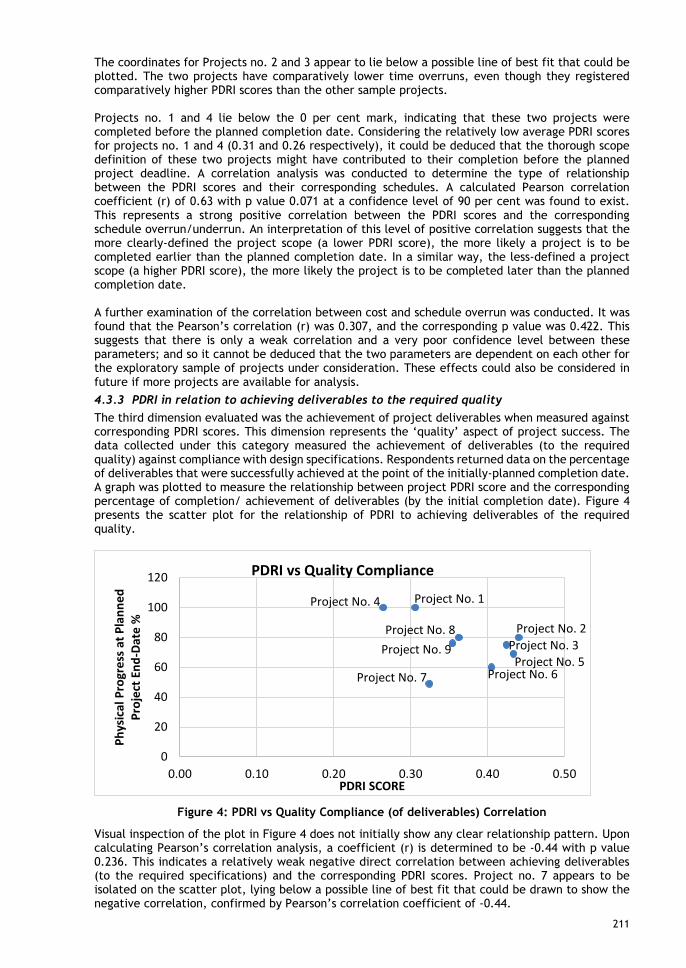
The coordinates for Projects no. 2 and 3 appear to lie below a possible line of best fit that could be plotted. The two projects have comparatively lower time overruns, even though they registered comparatively higher PDRI scores than the other sample projects. Projects no. 1 and 4 lie below the 0 per cent mark, indicating that these two projects were completed before the planned completion date. Considering the relatively low average PDRI scores for projects no. 1 and 4 (0.31 and 0.26 respectively), it could be deduced that the thorough scope definition of these two projects might have contributed to their completion before the planned project deadline. A correlation analysis was conducted to determine the type of relationship between the PDRI scores and their corresponding schedules. A calculated Pearson correlation coefficient (r) of 0.63 with p value 0.071 at a confidence level of 90 per cent was found to exist. This represents a strong positive correlation between the PDRI scores and the corresponding schedule overrun/underrun. An interpretation of this level of positive correlation suggests that the more clearly-defined the project scope (a lower PDRI score), the more likely a project is to be completed earlier than the planned completion date. In a similar way, the less-defined a project scope (a higher PDRI score), the more likely the project is to be completed later than the planned completion date. A further examination of the correlation between cost and schedule overrun was conducted. It was found that the Pearson’s correlation (r) was 0.307, and the corresponding p value was 0.422. This suggests that there is only a weak correlation and a very poor confidence level between these parameters; and so it cannot be deduced that the two parameters are dependent on each other for the exploratory sample of projects under consideration. These effects could also be considered in future if more projects are available for analysis. 4.3.3 PDRI in relation to achieving deliverables to the required quality The third dimension evaluated was the achievement of project deliverables when measured against corresponding PDRI scores. This dimension represents the ‘quality’ aspect of project success. The data collected under this category measured the achievement of deliverables (to the required quality) against compliance with design specifications. Respondents returned data on the percentage of deliverables that were successfully achieved at the point of the initially-planned completion date. A graph was plotted to measure the relationship between project PDRI score and the corresponding percentage of completion/ achievement of deliverables (by the initial completion date). Figure 4 presents the scatter plot for the relationship of PDRI to achieving deliverables of the required quality.
Figure 4: PDRI vs Quality Compliance (of deliverables) Correlation
Visual inspection of the plot in Figure 4 does not initially show any clear relationship pattern. Upon calculating Pearson’s correlation analysis, a coefficient (r) is determined to be -0.44 with p value 0.236. This indicates a relatively weak negative direct correlation between achieving deliverables (to the required specifications) and the corresponding PDRI scores. Project no. 7 appears to be isolated on the scatter plot, lying below a possible line of best fit that could be drawn to show the negative correlation, confirmed by Pearson’s correlation coefficient of -0.44.
Project No. 1
Project No. 2Project No. 8Project No. 9 Project No. 3
Project No. 4
Project No. 5Project No. 6Project No. 7
0
20
40
60
80
100
120
0.00 0.10 0.20 0.30 0.40 0.50
Phys
ical
Pro
gres
s at
Pla
nned
Pr
ojec
t End
-Dat
e %
PDRI SCORE
PDRI vs Quality Compliance
212
To test the reliability of this correlation, a trial correlation was conducted on eight of the sample projects (excluding project no. 7). The correlation coefficient value was found to be -0.75 with p value 0.0321 at a confidence level of 95 per cent. This shows a strong negative correlation. Although project no. 7 registered a low average PDRI score, its achievement of deliverables was relatively poor at the initially-planned project completion date. The project could have been affected by other factors that this study did not explore. Excluding project no. 7 from the analysis of the quality parameter was only for exploratory purposes, to determine the nature of the relationship from the sample of projects under consideration. It is recognised that a bigger sample of projects needs to be considered in future research to extend the research findings. The interpretation of this negative correlation would be that the less clearly-defined a project scope, the more likely the project is to fail to achieve completion of the deliverables (to the required specifications) by the initially-set project completion date. Likewise, the more comprehensively defined a project scope, the less likely the project is to fail to achieve completion of deliverables (to the required specifications) at the point of the initially-planned project completion.
5 CONCLUSIONS AND RECOMMENDATIONS
5.1 Assessment of achievement of objective
This study set out to determine the effect that project scope definition has on pre-planning efforts in Malawi’s infrastructure PIAs. The research also intended to assess the overall impact of pre-planning efforts on project performance, measuring project success based on cost, time, and quality achieved by the projects. The key objective was to determine whether the detail of scope definition has a significant impact on the performance of infrastructure projects that are implemented by Malawi’s PIAs. The study found that there is an adequate level of knowledge and understanding in the area of project scope definition and risk management within PIAs in Malawi. This is because the personnel responsible for managing infrastructure projects have the required qualifications in the area of procurement of works and services; most of them are certified project managers. Even though there is adequate understanding of the importance of project scope definition among Malawi’s PIAs, it was found that implementation of a comprehensive scope definition exercise is limited. Limited attention is given to comprehensive scope definition in the run-up preparatory activities to implementation of the projects. As a consequence, 78 per cent of the projects sampled had change orders (works variations) ranging between three and 50 per cent. Based on the performance of the projects that were sampled, only 22 per cent met all three project success parameters — i.e., they were completed within budget and the planned project duration, and their deliverables met the quality requirements. This shows that the current project pre-planning efforts are not effective, as evidenced by 78 per cent of the project sample not being able to satisfy any of the three project success parameters. Some PIAs alluded to other factors that affect successful implementation of projects, such as: 1) Contractors’ lack of adequate technical, equipment, and financial capacity to complete the
works successfully within the predetermined time, cost, and quality requirements; 2) Organisational bureaucracy and lengthy payment processes, leading to constant interruptions
to the progress of works; and 3) Unfriendly economic conditions, with inflation constantly driving up the cost of the main
construction materials. This poses a challenge to contract management, as works contracts have constantly to be revised to cushion the effect of the rising cost of materials.
All three factors, however, relate to project pre-planning, since selection of the right contractors, streamlining of internal payment processes, and financial forecasting are some of the best practices that the PIAs should implement to counter the adverse effects that might arise as a result of not addressing these potential risk areas during the project pre-planning phase. With proper risk planning, appropriate measures can be put in place to ensure that the right contractors are engaged, that adequate lead times for payments are observed, and that project costs take price fluctuations into account.
213
The PDRI tool is not used by any of the five PIAs involved in the study. However, there is a good level of compliance with the provisions (elements) of the PDRI tool, since the PIAs adhere to universally-accepted standards of project management, such as PRINCE 2. Scope definition and risk management are thus regarded highly by Malawi’s PIAs, even though, in practice, the principles might not be implemented in their entirety. From the analysis of the nine projects sampled, it is evident that the extent of scope definition has a bearing on project performance. The overall interpretation of the data collected is that the majority of the projects analysed performed poorly in terms of meeting the cost, time, and quality constraints as a result of poor definition of the project scope during the project pre-planning phase. The hypothesis that “The level of project scope definition by Malawi’s PIAs during project pre-planning is inadequate effectively to address risks associated with time, cost, and quality on infrastructure projects” is accepted for exploratory purposes, with p values below 0.075 for all correlations presented and discussed in section 4.3.
5.2 Key observations and research limitations/challenges
The main observation from the study was that project scope definition is performed by Malawi’s infrastructure PIAs, although not to the level of detail prescribed in the PDRI tool. There is a need for Malawi’s PIAs to incorporate other important considerations in to their scope definition, such as owner philosophy, which considers maintenance and reliability issues — factors that are largely ignored by Malawi’s PIAs. Another key observation relates to the perception that Malawi’s PIAs have about risk management in infrastructure project implementation. There appears to be a general consensus among the project managers of the five PIAs involved in the study that project pre-planning and scope definition are critical to achieving project success. In spite of this, the PIAs do not have a systematic project definition framework that addresses all known risks, most of which recur during new infrastructure projects. The main challenge that the study faced was the limited literature on project pre-planning and scope definition on infrastructure projects in Malawi. This is largely because there has been little research in this area in the Malawian context. This study therefore provides a basis on which further studies of infrastructure project pre-planning and scope definition in the Malawian context can be based. The effects of further contingencies on possible poor planning in these phases could also be included. The second key challenge that the study faced was the limitation in obtaining data from two of the five targeted institutions — the Malawi Housing Corporation and Lilongwe City Council. These are public PIAs with a relatively lengthy process for obtaining authorisation to share project information. The researcher was therefore unable to obtain the required data in time to finalise the study. Data on three of the targeted sample projects could therefore not be obtained and analysed.
5.3 Recommendations
This study recommends further research into the factors that influence insufficient scope definition and comprehensive project pre-planning in Malawi’s infrastructure PIAs, including the effects of contingencies on possible poor planning in these phases. One of the issues arising from the interviews with the project managers of the five PIAs involved in the study was that there is often pressure to award work contracts within a specific limited time, as a result of various external factors. There is thus usually limited time devoted to project pre-planning and scope definition, due to pressure to ‘break ground’. Both internal and external factors are likely to influence this phenomenon. There is thus a need to conduct a detailed study of this, because these factors influence, to a large extent, the available time for detailed project pre-planning and scope definition.
REFERENCES
[1] Griffith, A. F. & Gibson, G. E. 2001. Alignment during preproject planning. Journal of Management in Engineering, 71, pp. 69-76.
[2] Arditi, D. & Gunaydin, H. M. 1997. Total Quality Management in the Construction Process. International Journal of Project Management, 15(4), pp. 235-243.
[3] Baccarini, D., 1999. The Logical Framework Method for Defining Project Success. Project Management Journal, 40(4), pp. 25-32.
[4] Banda, H. 2010. Baseline Study for the Construction Sector Transparency Initiative in Malawi, Lilongwe: National Construction Industry Council of Malawi.
[5] Bingham, E., 2010. Development of the Project Definition Rating Index (PDRI), Arizona: Arizona State University.
[6] Blanchard, B., 2008. Systems Engineering Management. 4th ed. New Jersey: John Wiley.
214
[7] Chileshe, N. & John Kikwasi, G. (2014) ‘Critical success factors for implementation of risk assessment and management practices within the Tanzanian construction industry’, Engineering, Construction and Architectural Management, 21(3), pp. 291–319.
[8] Cho, C. S., & Gibson, G. E. (2001). Building project scope definition using project definition rating index. Journal of Architectural Engineering, 7(4), pp. 115-125.
[9] Flyvbjerg, B. 2009. Delusion and Deception in Large Infrastructure Projects: Two Models for Explaining and Preventing Executive Disaster, s.l.: California Management Review, 51(2), pp. 170-193.
[10] Frimpong, Y., Oluwoye, J. & Crawford, L. 2003. Causes of Delay and Cost Overruns in Construction of Groundwater Projects in Developing Countries: Ghana as a Case Study. International Journal of Project Management, 21, pp. 321-326.
[11] Dumont, P. R., Gibson, G. E. & Fish, J. R. 1997. Scope Management Using Project Definition Rating Index. Journal of Management in Engineering, 13(5), pp. 54-60.
[12] Guo, W. 2004. Development of a Framework for Preliminary Risk Analaysis in Transportation Projects, Master Thesis: Worcester Polytechnic Institute.
[13] Prabhakar, P. G. 2008. What is Project Success: A Literature Review. International Journal of Business & Management, 3(9), pp. 3-10.
[14] Kululanga, G. & Kuotcha, W. 2010. Measuring Project Risk Management Process for Construction Contractors with Statement Indicators Linked to Numerical Scores. Engineering, Construction and Architectural Management, 17(4), pp. 336-352.
[15] Mohamed, A. H. 1997. Total Quality Management in Construction Projects: Roles of Clients Project Managers. Jurnal Teknologi, 27, pp. 23-36.
[16] Morris, P. 2005. Managing the Front End: How Project Manager Shape Business Strategy & Manage Project Definition. Edinburgh, INDECO Management Solutions, pp. 2-8.
[17] Morris, P. & Hough, G. H. 1988. An Anatomy of Major Project: A Study of the Reality of Project Management. Ontario: Wiley.
[18] PMBOK. 2000. A Guide to Project Management Body of Knowledge. Pennsylvania: Project Management Institute, Inc..
[19] Standards Australia Committee QR-008. 2003. Quality Management Systems-Guidelines for Quality Management in Projects. Sydney: Standards Australia International Ltd..
[20] Steyn, H., 2008. Project Management A Multi-Disciplinary Approach 3rd Edition. Pretoria: s.n. FPM Publishing.
[21] Waller, L. G. & Johnson, S. 2013. Enhancing the Field Moment of Quantitative Research with Tools & Techniques from the Project Management Body of Knowledge: A Primer. American International Journal of Contemporary Research, 3(11), pp. 30-38.
[22] Wang, Y. R. 2002. Applying the PDRI in Project Risk Management, PhD Thesis, Texas: The University of Texas at Austin.
[23] Weijde, G. A. 2008. Front-End Loading in the Oil and Gas industry; Torwards a Fit Front End Development Phase, s.l.: Delft University of Technology.
[24] Wit, A. D. 1988. Measurement of Project Success, Oslo: Butterworth & Co.. [25] Wang, Y. R. & Gibson, G. E. 2008. A Study of Preproject Planning & Project Success Using Ann & Regression
Models. Proc The 25th International Symposium on Automation and Robotics in Construction, Vilnius, Institute of Internet and Intelligent Tchnologies, pp. 688-696.