Embed Size (px)
Citation preview
The Effectiveness of Online Advertising: Consumer’s Perceptions of Ads on Facebook, Twitter and YouTube
Bohdan Pikas
Niagara University
Gabi Sorrentino Niagara University
The growth of Internet usage has created a platform for businesses to attract and retain customers. While online advertising strategies are used by many businesses, the effectiveness of these methods being used can be debated. This study will provide an analysis of online advertising and its effectiveness. A study was conducted to test the consumer’s perception of online advertising on the popular social webpages: Facebook, YouTube and Twitter. Steps were also taken to test a possible gender difference when it comes to consumer’s receptiveness to online advertising on these sites. INTRODUCTION
In 2012, there were 245,203,319 internet users in the United States. This means 78.1% of the American population is on the web (New Media TrendWatch). Many of these users are spending their time on the Internet visiting the most popular social networking sites of today. A study was conducted to test American’s perception of online advertising on the popular web pages Face book, YouTube and Twitter. If online advertising strategies are formulated correctly, marketers can target this large segment of Americans who are spending a significant of time on the Internet and the popular social webpages of today. LITERATURE REVIEW
Today adults of all ages are accessing their favorite websites using their tablets, smartphones, and computers. For some time the Internet has been popular with younger Americans, but research shows that this trend is evolving. Generation X (ages 31 to 44) and Younger Baby Boomers (ages 45 to 54) are beginning to spend a significant amount of time online(Indvik).In fact in 2011 it was reported that 65% of adults use social networking sites (Madden & Zickuhr).
Social networking sites are defined as “web-based services that allow individuals to (1) construct a public or semi-public profile within a bounded system, (2) articulate a list of other users with whom they share a connection, and (3) view and traverse their list of connections and those made by others within the system” (Boyd& Ellison, 2007, p. 211). The three most popular social networking sites of today are Facebook, YouTube and Twitter. Each of these webpages can be accessed through a consumer’s tablet, smartphone, and/or computer.
70 Journal of Applied Business and Economics vol. 16(4) 2014
Accounting for 7.07% of all American web traffic, Facebook is the most visited website in the United States (Dougherty, 2010). There are over one billion Facebook users worldwide. In the United States, there are currently 159,646,460 active users on this social webpage (Rezab). In April of 2013, there were 618 million active users and 680 million mobile users. On average there were 2.7 billion “likes” daily and 240 billion photos uploaded daily in April (Smith C).
With over 200 million users, Twitter also earns a spot as one of the most popular social websites of today. Twitter is a social networking/micro blogging site that attracts over 35 million users to its website monthly (Nielson, 2013). It is also reported that 27 million users access the site through their mobile phone’s Twitter application (Nielson, 2013).
After pulling in 124,073,000 unique users in January, YouTube was identified by Nielsen as the Top Entertainment brand of 2013 (Nielson, 2013). YouTube is defined as a video sharing website, but is more recently positioning itself as a social networking webpage. YouTube has many of the social features that Facebook and Twitter users have access. Similar to Facebook and Twitter, YouTube users have the ability to comment on media, upload media, share media, and be exposed to real time updates. YouTube users also have the ability to rate and “favorite” videos they view. YouTube account holders can subscribe to different channels just as a Facebook user could “like” a page or a Twitter user could “follow” another person or company. In April 2013, YouTube had 1 billion unique monthly visitors (McCue, 2013).This statistic illustrates the popularity and usage of this social networking page.
Consumer’s usage of Facebook, Twitter and YouTube has caught the attention of many businesses. Out of the all the Fortune 500 companies 365 (73%) have created a Twitter account, 330 (66%) have an active Facebook account and 309 (62%) have a YouTube account (Berkman, 2013). While many businesses have an online presence, they may not be effectively communicating with their target market. MOTIVATIONS FOR USING FACEBOOK, YOUTUBE, AND TWITTER
In order to develop a successful online advertising strategy using Facebook, YouTube, and Twitter, marketers must question what makes these web pages so popular. Research proves that the main motivators for using these web pages are driven by consumer’s need to build and nurture social relationships.
It is reported that adults ages 18-65+ use social networking to staying in touch with current friends, family members and old friends they have lost touch with (Smith, A). Another market research publication reports that consumers ranging from 18 to 25 years old use Facebook as an outlet to (1) voyeuristically peer into others’ lives, (2) to create a distinctive identity for themselves, and (3) to act on their inner narcissistic tendencies (Sashittal, Sriramach and Ramurthy, Hodis, 2012, p. 1). These findings support the notion that consumers spend time on Facebook, YouTube and Twitter due to their need for social capital. Social capital is defined as “the benefits [consumers] receive from our social relationships” (Lin, 1999). Similar research reports “the major motives for using social network sites [include] – seeking friends, social support, entertainment, information, and convenience” (Kim, Y., Sohn, D., & Choi, S.). The key word in this report is “seeking” which suggests that customers are taking the initiative and may want the authority to choose what they are exposed to in an online environment.
Seth Godin speaks about this marketing strategy when he writes, “By talking only to volunteers, Permission Marketing guarantees that consumers pay more attention to the marketing message. It serves both consumers and marketers in a symbolic exchange” (Godin, 1999). Godin further explains this strategy when he states, “Permission Marketing is the privilege (not the right) of delivering anticipated, personal and relevant messages to people who actually want to get them. It recognizes the new power of the best consumers to ignore marketing. It realizes that treating people with respect is the best way to earn their attention” (Goden). Consumers are constantly surrounded by intrusive advertising, but this does not guarantee the target market is paying attention. Permission Marketing suggests that instead of forcing an audience to view your company’s ads ask them if they would like to be exposed to the information.
Some social media web sites have honed in on these Permission Marketing tactics. For example, consumers have the ability to “like” a page on Facebook and the option to “follow” a company on
Journal of Applied Business and Economics vol. 16(4) 2014 71
Twitter. These techniques allow the consumer to choose whether or not they would like to be exposed to information, marketing and other online advertising techniques. These less intrusive strategies could prove to be more effective.
It can be argued that there is not a positive relationship between an annoying and ineffective advertisement, but the general consensus is that social web pages such as Facebook, Twitter and YouTube are not the place for an annoying and intrusive marketing strategy. Because Facebook, YouTube and Twitter are very social web pages it is argued that these web pages require unique strategies. Mikołaj Jan Piskorski writes about the difference between digital a social strategies. After analyzing 60 companies that attempted to enter the online social platform this scholar reports, “What the poorly performing companies shared was that they merely imported their digital strategies into social environments by broadcasting commercial messages or seeking customer feedback. Customers reject such overtures because their main goal on the platforms is to connect with other people, not with companies” (Piskorski, 2011). Based on this information, businesses may need to learn how to become a part of the conversation to connect with their target audience.
Scholars Pashkevich, Dorai-raj, Kellar, and Zigmond would agree with Piskorski and the notions of Permission Marketing. They write, “Giving users the choice to view (or not view) may actually increase this advertising effectiveness by engaging users in the advertising process. In this way, empowering users to choose the advertisements they watch online need not come at the cost of advertiser value but actually appears to serve the interests of advertisers, content owners and users” (Pashkevich, Dorai-Raj, Kellar, Zigmond, 2012).Many scholars and business professionals agree that by engaging consumers one can increase the effectiveness of their advertisements. But in the world of pop ups and banner ads it does not seem as though marketers are getting the hint. In order to gauge whether businesses ought to implement a social strategy marketers need to understand and evaluate consumer’s opinions towards online advertisements. RESEARCH AND QUESTIONNAIRE ANALYSIS
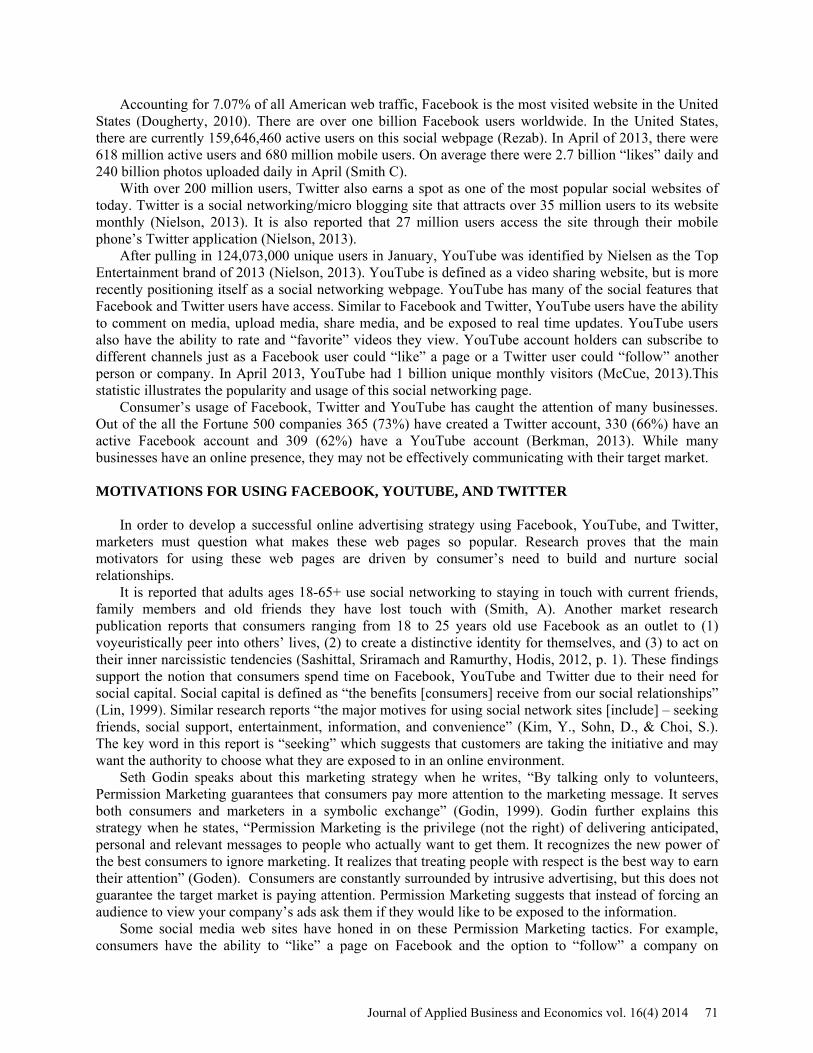
In order to obtain data on this topic, a questionnaire was developed. The following charts and analytical results represent the questions contained in the survey regarding online advertising techniques. The questionnaire was conducted randomly and anonymously in order to get an unbiased and representative sample. From the population, a sample of 388 useable responses were completed of which 64.4% were female and 36.6% were male. Within the sample, a variety of academic majors and professional occupations of all ages were represented. The results reported in this paper will represent a significance level of .05 level and greater. In order to test the assumption that Americans spend a lot of time online, respondents were asked “In a typical day, how much time do you spend on the Internet?” (see FIGURE 1 and 2).
FIGURE 1 TIME SPENT ON INTERNET DAILY
7% 21% 44%
24% 3% 0%
10% 20% 30% 40% 50%
7 + Hours 5-6 Hours 3-4 Hours 1-2 Hours Less than 1 hour % o
f Res
pond
ents
Hours Per Day
72 Journal of Applied Business and Economics vol. 16(4) 2014
44% of the survey respondents stated they spent 3-4 hours per day online. The results of the survey identified that the majority of respondents spend 12.5-16.67% of their day surfing the web.
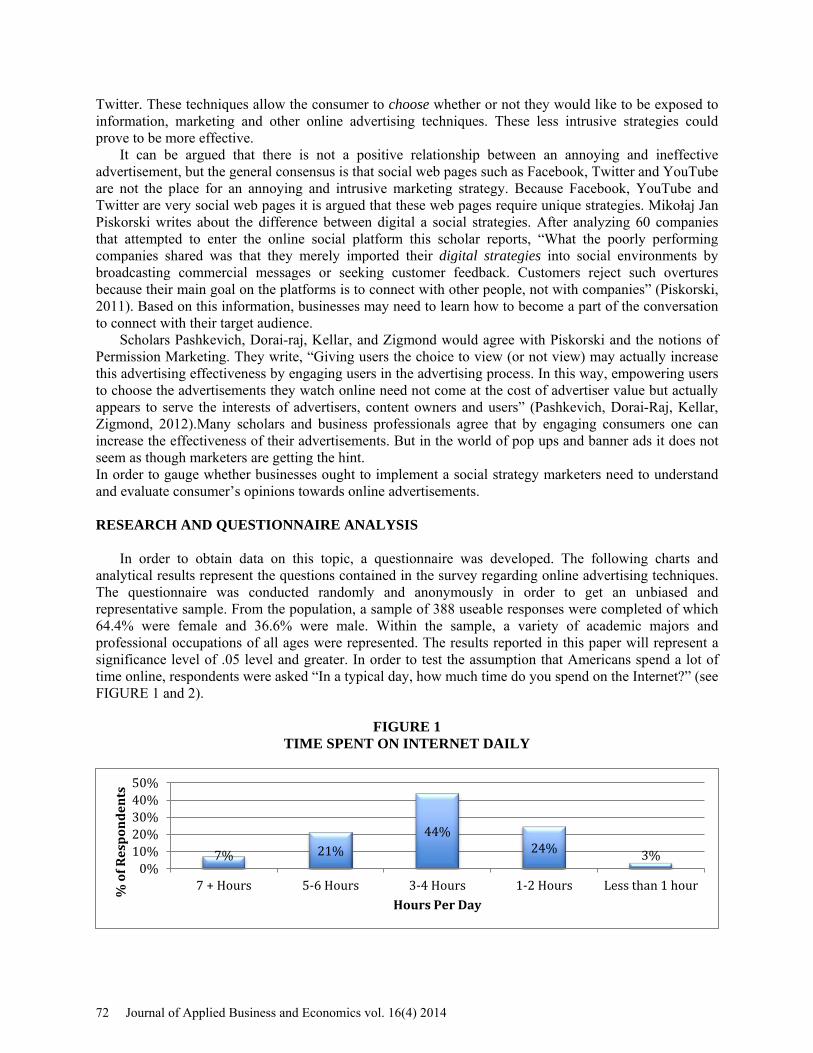
FIGURE 2 TIME SPENT ON THE INTERNET DAILY
The relationship between respondent’s gender and amount of time spent online daily is not significant (see FIGURE 2). There was only 1% difference between men and women who identified they spend less than one hour, 1-2 hours, and 7+ hours per day on the web. There was only a 6% difference between men and women within the 3-4 hour category and an 8% difference within the 5-6 hour category. Based on respondents’ feedback, it is apparent that men and women spend similar amounts of time on the Internet per day.
To identify how much of respondent’s time spent online was spent visiting the social networking sites Facebook, Twitter and YouTube respondents were asked, “In a typical day about how much time do you spend on the following web pages?” Visual representation of the responses is illustrated in Figures 3, 4, and 5.
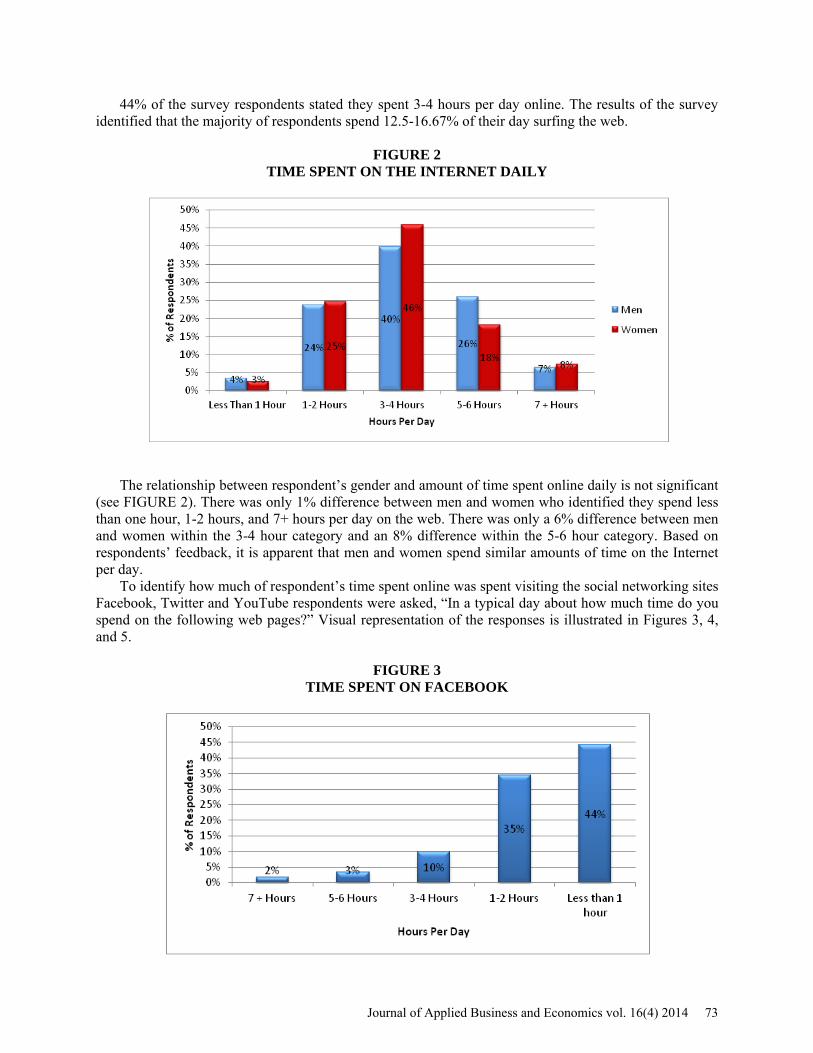
FIGURE 3 TIME SPENT ON FACEBOOK
Journal of Applied Business and Economics vol. 16(4) 2014 73
94% of respondents stated they had a Facebook account. Of those respondents, who use Facebook spend 4 hours or less on this social networking webpage per day.
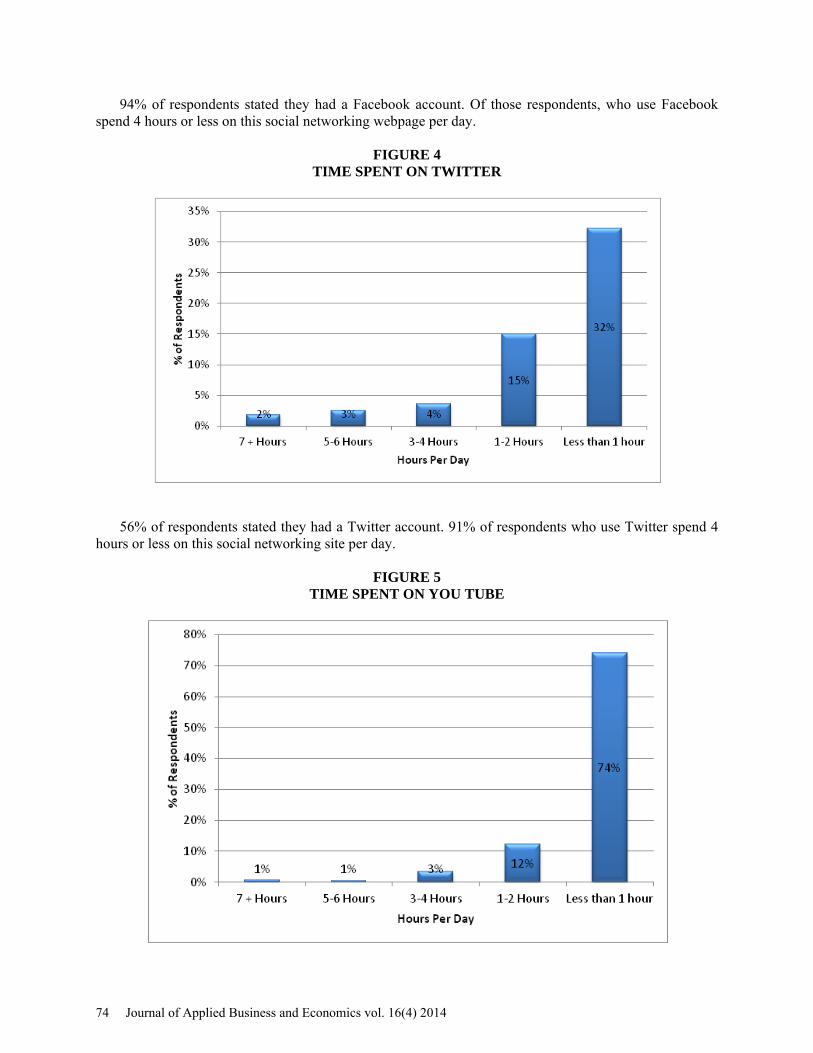
FIGURE 4 TIME SPENT ON TWITTER
56% of respondents stated they had a Twitter account. 91% of respondents who use Twitter spend 4
hours or less on this social networking site per day.
FIGURE 5 TIME SPENT ON YOU TUBE
74 Journal of Applied Business and Economics vol. 16(4) 2014
91% of respondents stated that they accessed YouTube daily. 97% of respondents who access YouTube spend 4 or less hours on this website per day. Based on the findings it can be concluded that the majority of respondents spend less than one hour of their time on each of the social networking sites daily.
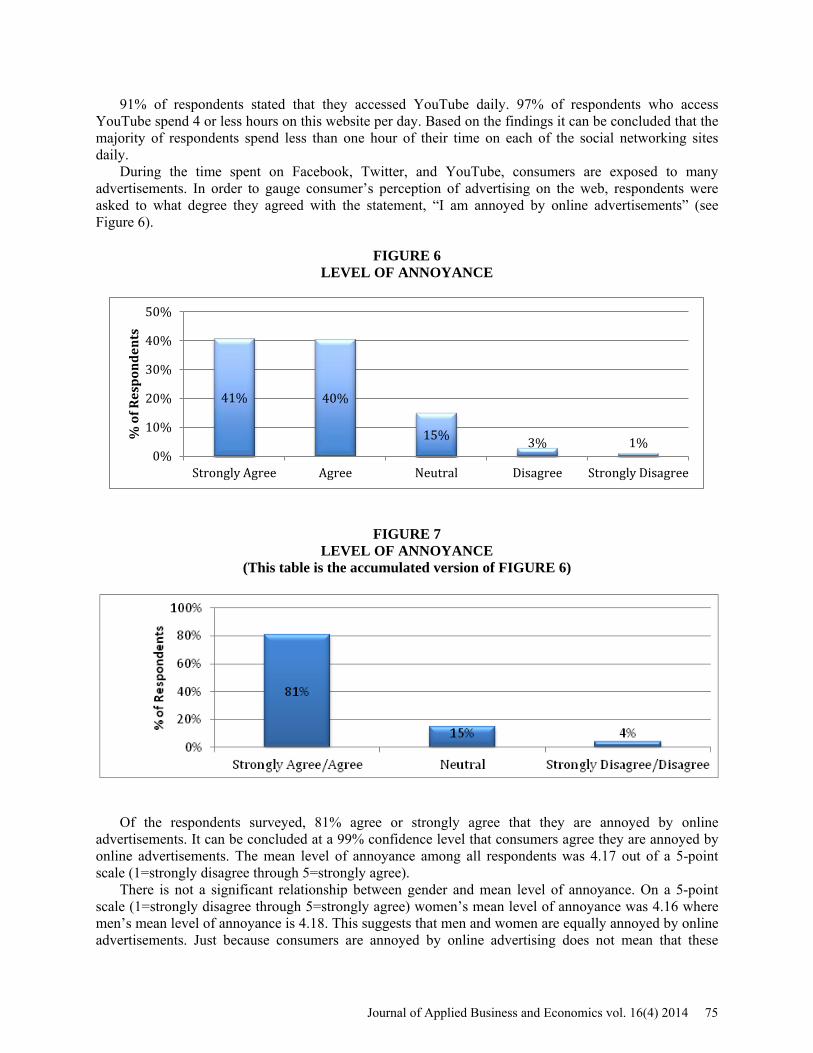
During the time spent on Facebook, Twitter, and YouTube, consumers are exposed to many advertisements. In order to gauge consumer’s perception of advertising on the web, respondents were asked to what degree they agreed with the statement, “I am annoyed by online advertisements” (see Figure 6).
FIGURE 6 LEVEL OF ANNOYANCE
FIGURE 7 LEVEL OF ANNOYANCE
(This table is the accumulated version of FIGURE 6)
Of the respondents surveyed, 81% agree or strongly agree that they are annoyed by online advertisements. It can be concluded at a 99% confidence level that consumers agree they are annoyed by online advertisements. The mean level of annoyance among all respondents was 4.17 out of a 5-point scale (1=strongly disagree through 5=strongly agree).
There is not a significant relationship between gender and mean level of annoyance. On a 5-point scale (1=strongly disagree through 5=strongly agree) women’s mean level of annoyance was 4.16 where men’s mean level of annoyance is 4.18. This suggests that men and women are equally annoyed by online advertisements. Just because consumers are annoyed by online advertising does not mean that these
41% 40%
15% 3% 1% 0%
10%
20%
30%
40%
50%
Strongly Agree Agree Neutral Disagree Strongly Disagree
% o
f Res
pond
ents
Journal of Applied Business and Economics vol. 16(4) 2014 75
marketing techniques are not effective. For this reason, additional questions were asked to test consumer’s receptiveness to online advertising techniques used on Facebook, YouTube and Twitter.
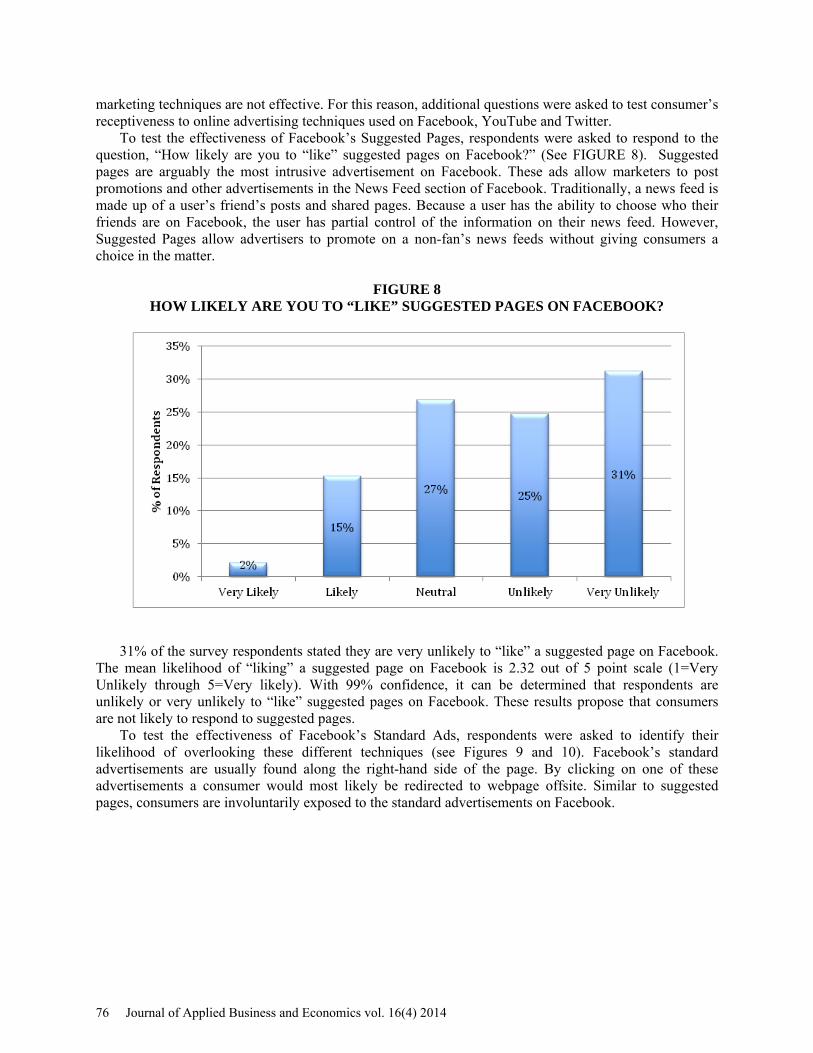
To test the effectiveness of Facebook’s Suggested Pages, respondents were asked to respond to the question, “How likely are you to “like” suggested pages on Facebook?” (See FIGURE 8). Suggested pages are arguably the most intrusive advertisement on Facebook. These ads allow marketers to post promotions and other advertisements in the News Feed section of Facebook. Traditionally, a news feed is made up of a user’s friend’s posts and shared pages. Because a user has the ability to choose who their friends are on Facebook, the user has partial control of the information on their news feed. However, Suggested Pages allow advertisers to promote on a non-fan’s news feeds without giving consumers a choice in the matter.
FIGURE 8 HOW LIKELY ARE YOU TO “LIKE” SUGGESTED PAGES ON FACEBOOK?
31% of the survey respondents stated they are very unlikely to “like” a suggested page on Facebook. The mean likelihood of “liking” a suggested page on Facebook is 2.32 out of 5 point scale (1=Very Unlikely through 5=Very likely). With 99% confidence, it can be determined that respondents are unlikely or very unlikely to “like” suggested pages on Facebook. These results propose that consumers are not likely to respond to suggested pages.
To test the effectiveness of Facebook’s Standard Ads, respondents were asked to identify their likelihood of overlooking these different techniques (see Figures 9 and 10). Facebook’s standard advertisements are usually found along the right-hand side of the page. By clicking on one of these advertisements a consumer would most likely be redirected to webpage offsite. Similar to suggested pages, consumers are involuntarily exposed to the standard advertisements on Facebook.
76 Journal of Applied Business and Economics vol. 16(4) 2014
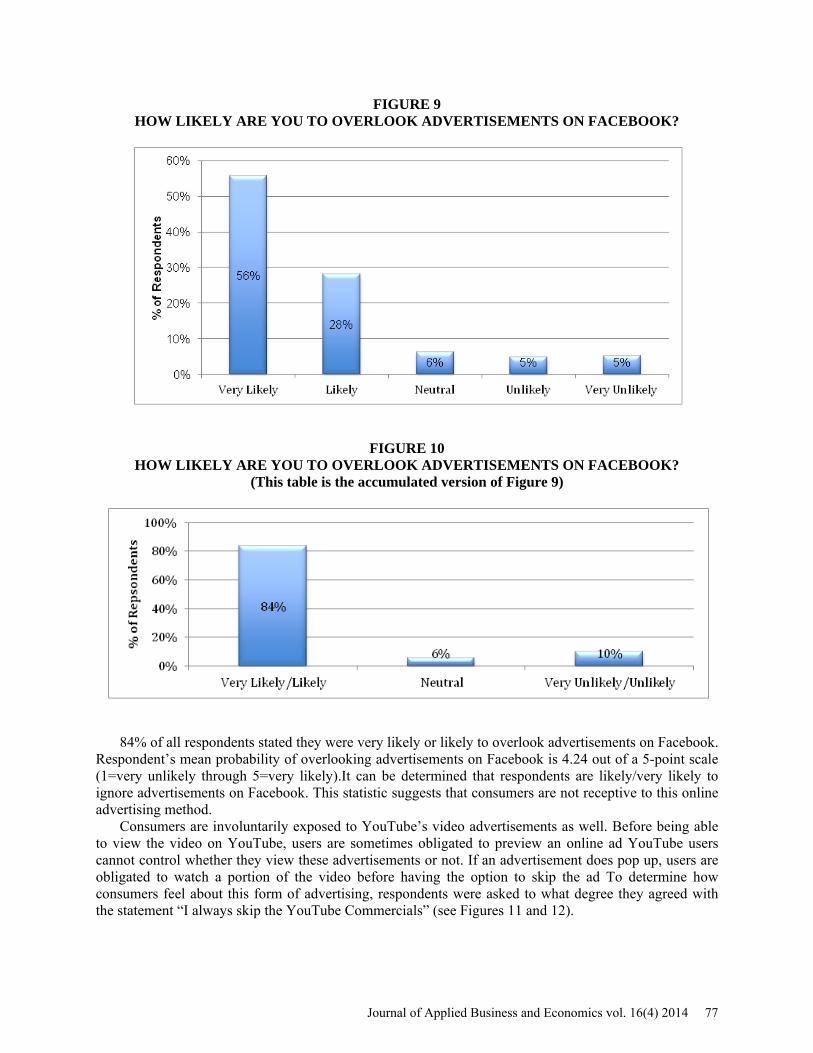
FIGURE 9 HOW LIKELY ARE YOU TO OVERLOOK ADVERTISEMENTS ON FACEBOOK?
FIGURE 10 HOW LIKELY ARE YOU TO OVERLOOK ADVERTISEMENTS ON FACEBOOK?
(This table is the accumulated version of Figure 9)
84% of all respondents stated they were very likely or likely to overlook advertisements on Facebook. Respondent’s mean probability of overlooking advertisements on Facebook is 4.24 out of a 5-point scale (1=very unlikely through 5=very likely).It can be determined that respondents are likely/very likely to ignore advertisements on Facebook. This statistic suggests that consumers are not receptive to this online advertising method.
Consumers are involuntarily exposed to YouTube’s video advertisements as well. Before being able to view the video on YouTube, users are sometimes obligated to preview an online ad YouTube users cannot control whether they view these advertisements or not. If an advertisement does pop up, users are obligated to watch a portion of the video before having the option to skip the ad To determine how consumers feel about this form of advertising, respondents were asked to what degree they agreed with the statement “I always skip the YouTube Commercials” (see Figures 11 and 12).
Journal of Applied Business and Economics vol. 16(4) 2014 77
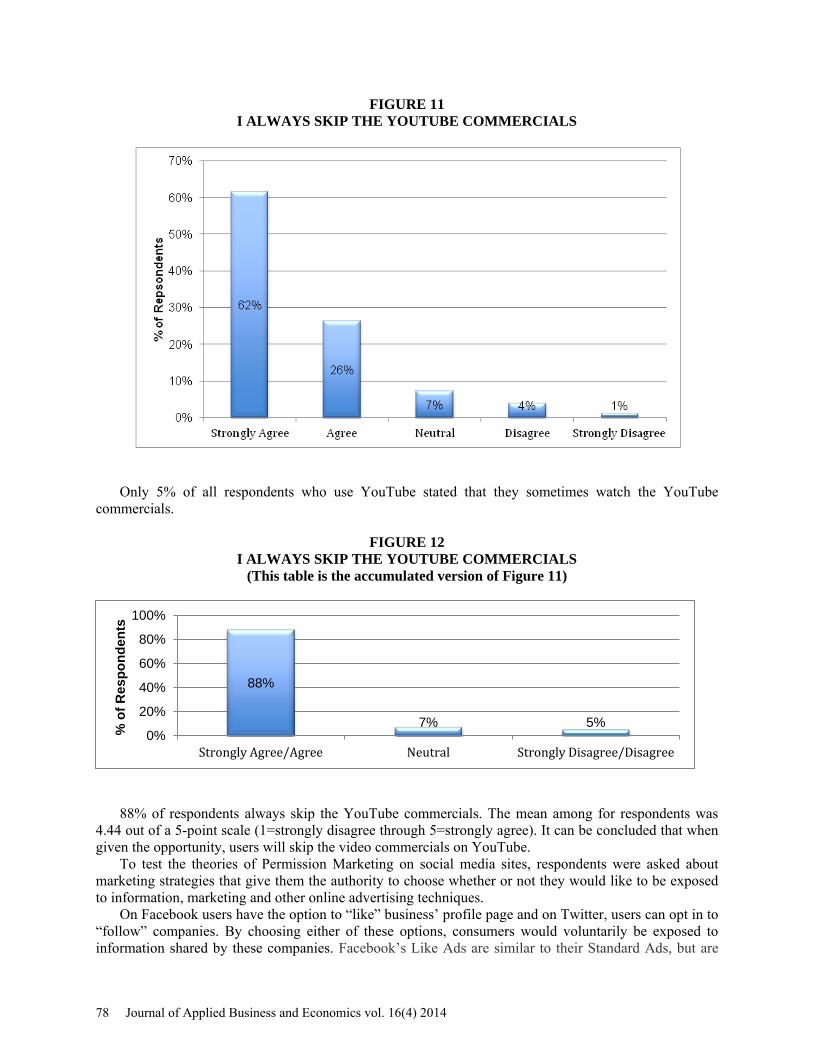
FIGURE 11 I ALWAYS SKIP THE YOUTUBE COMMERCIALS
Only 5% of all respondents who use YouTube stated that they sometimes watch the YouTube
commercials.
FIGURE 12 I ALWAYS SKIP THE YOUTUBE COMMERCIALS
(This table is the accumulated version of Figure 11)
88% of respondents always skip the YouTube commercials. The mean among for respondents was 4.44 out of a 5-point scale (1=strongly disagree through 5=strongly agree). It can be concluded that when given the opportunity, users will skip the video commercials on YouTube.
To test the theories of Permission Marketing on social media sites, respondents were asked about marketing strategies that give them the authority to choose whether or not they would like to be exposed to information, marketing and other online advertising techniques.
On Facebook users have the option to “like” business’ profile page and on Twitter, users can opt in to “follow” companies. By choosing either of these options, consumers would voluntarily be exposed to information shared by these companies. Facebook’s Like Ads are similar to their Standard Ads, but are
88%
7% 5% 0%
20%
40%
60%
80%
100%
Strongly Agree/Agree Neutral Strongly Disagree/Disagree
% o
f Res
pond
ents
78 Journal of Applied Business and Economics vol. 16(4) 2014
designed to drive traffic to a Facebook Page. If a consumer “likes” a company on Facebook, the consumer also gives the company permission to share information that will be seen in a user’s news feed. Similar to Facebook, if a user follows a company on Twitter, that company’s tweets will be seen in the Twitter feed.
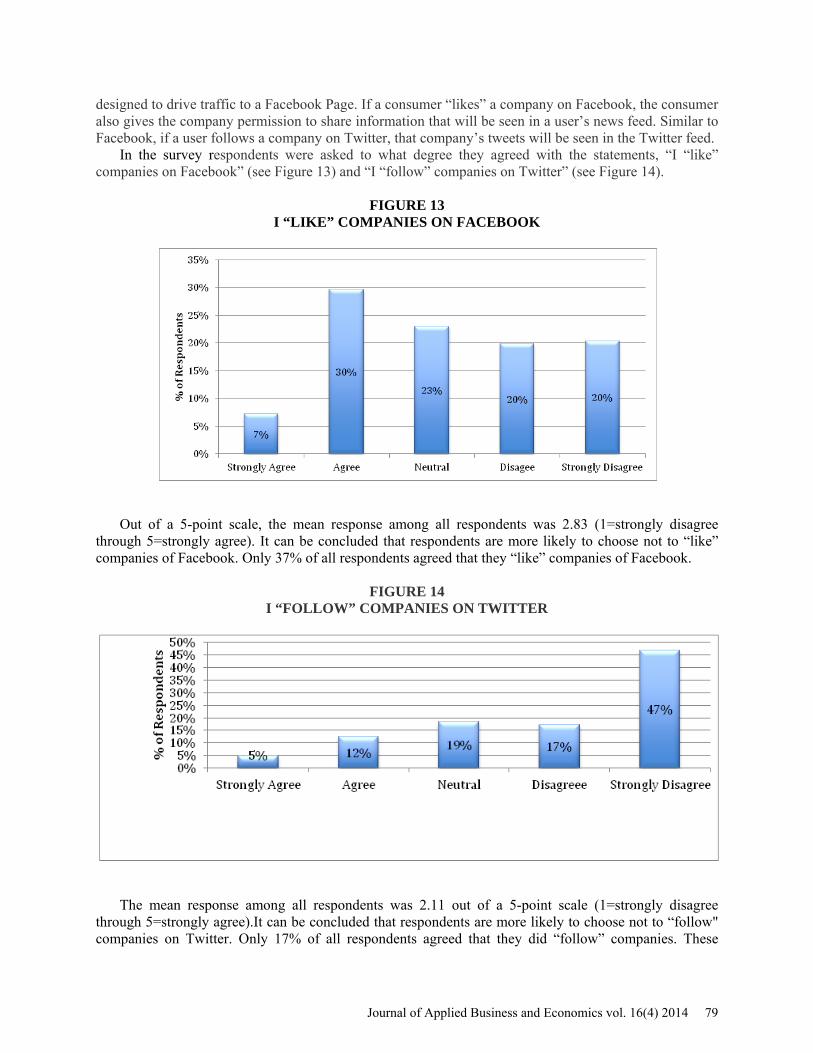
In the survey respondents were asked to what degree they agreed with the statements, “I “like” companies on Facebook” (see Figure 13) and “I “follow” companies on Twitter” (see Figure 14).
FIGURE 13 I “LIKE” COMPANIES ON FACEBOOK
Out of a 5-point scale, the mean response among all respondents was 2.83 (1=strongly disagree
through 5=strongly agree). It can be concluded that respondents are more likely to choose not to “like” companies of Facebook. Only 37% of all respondents agreed that they “like” companies of Facebook.
FIGURE 14
I “FOLLOW” COMPANIES ON TWITTER
The mean response among all respondents was 2.11 out of a 5-point scale (1=strongly disagree through 5=strongly agree).It can be concluded that respondents are more likely to choose not to “follow" companies on Twitter. Only 17% of all respondents agreed that they did “follow” companies. These
Journal of Applied Business and Economics vol. 16(4) 2014 79
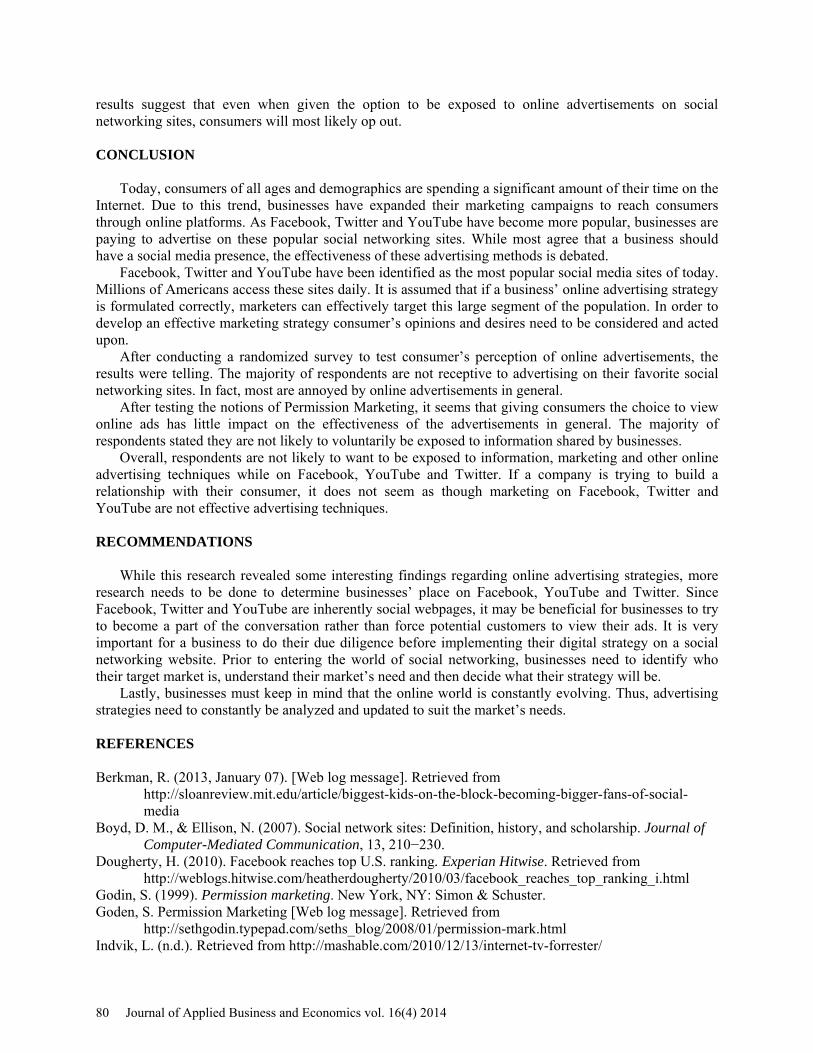
results suggest that even when given the option to be exposed to online advertisements on social networking sites, consumers will most likely op out. CONCLUSION
Today, consumers of all ages and demographics are spending a significant amount of their time on the Internet. Due to this trend, businesses have expanded their marketing campaigns to reach consumers through online platforms. As Facebook, Twitter and YouTube have become more popular, businesses are paying to advertise on these popular social networking sites. While most agree that a business should have a social media presence, the effectiveness of these advertising methods is debated.
Facebook, Twitter and YouTube have been identified as the most popular social media sites of today. Millions of Americans access these sites daily. It is assumed that if a business’ online advertising strategy is formulated correctly, marketers can effectively target this large segment of the population. In order to develop an effective marketing strategy consumer’s opinions and desires need to be considered and acted upon.
After conducting a randomized survey to test consumer’s perception of online advertisements, the results were telling. The majority of respondents are not receptive to advertising on their favorite social networking sites. In fact, most are annoyed by online advertisements in general.
After testing the notions of Permission Marketing, it seems that giving consumers the choice to view online ads has little impact on the effectiveness of the advertisements in general. The majority of respondents stated they are not likely to voluntarily be exposed to information shared by businesses.
Overall, respondents are not likely to want to be exposed to information, marketing and other online advertising techniques while on Facebook, YouTube and Twitter. If a company is trying to build a relationship with their consumer, it does not seem as though marketing on Facebook, Twitter and YouTube are not effective advertising techniques.
RECOMMENDATIONS
While this research revealed some interesting findings regarding online advertising strategies, more research needs to be done to determine businesses’ place on Facebook, YouTube and Twitter. Since Facebook, Twitter and YouTube are inherently social webpages, it may be beneficial for businesses to try to become a part of the conversation rather than force potential customers to view their ads. It is very important for a business to do their due diligence before implementing their digital strategy on a social networking website. Prior to entering the world of social networking, businesses need to identify who their target market is, understand their market’s need and then decide what their strategy will be.
Lastly, businesses must keep in mind that the online world is constantly evolving. Thus, advertising strategies need to constantly be analyzed and updated to suit the market’s needs. REFERENCES Berkman, R. (2013, January 07). [Web log message]. Retrieved from
http://sloanreview.mit.edu/article/biggest-kids-on-the-block-becoming-bigger-fans-of-social-media
Boyd, D. M., & Ellison, N. (2007). Social network sites: Definition, history, and scholarship. Journal of Computer-Mediated Communication, 13, 210−230.
Dougherty, H. (2010). Facebook reaches top U.S. ranking. Experian Hitwise. Retrieved from http://weblogs.hitwise.com/heatherdougherty/2010/03/facebook_reaches_top_ranking_i.html
Godin, S. (1999). Permission marketing. New York, NY: Simon & Schuster. Goden, S. Permission Marketing [Web log message]. Retrieved from
http://sethgodin.typepad.com/seths_blog/2008/01/permission-mark.html Indvik, L. (n.d.). Retrieved from http://mashable.com/2010/12/13/internet-tv-forrester/
80 Journal of Applied Business and Economics vol. 16(4) 2014
Kim, Y., Sohn, D., & Choi, S. Cultural difference in motivations for using social network sites: A comparative study of American and Korean college students. Computers in Human Behavior. 2011;27(1):365-372.
Lin, N. (1999). Building a network theory of social capital. Connections, 22, 28−51. Madden, M., & Zickuhr, K. (n.d.). Retrieved from http://pewinternet.org/Reports/2011/Social-
Networking-Sites.aspx McCue, T. (2013, May 02). Youtube claims victory over TV: Battle won with one billion visitors per
month. Retrieved from http://www.forbes.com/sites/tjmccue/2013/05/02/youtube-claims-victory-over-tv-battle-won-with-one-billion-visitors-per-month/
New Media TrendWatch. (n.d.). Retrieved from http://www.newmediatrendwatch.com/markets-by-country/17-usa/123-demographics
Nielsen. (2013, January 03). January 2013: Top U.S. entertainment sites and web brands. Retrieved from http://www.nielsen.com/us/en/newswire/2013/january-2013--top-U-S--entertainment-sites-and-web-brands.html
Pashkevich, M., Dorai-Raj, S., Kellar, M., & Zigmond, D. (2012). Empowering Online Advertisements by Empowering Viewers with the Right to Choose The Relative Effectiveness of Shippable Video Advertisements on YouTube. Journal Of Advertising Research, 52(4), 451-457.
Piskorski, M. J. (2011, November).Social strategies that work. Retrieved from http://hbr.org/2011/11/social-strategies-that-work/
Rezab, J. (n.d.). Retrieved from http://www.socialbakers.com/facebook-statistics/ Smith, A. (n.d.). Retrieved from http://www.pewinternet.org/Reports/2011/Why-Americans-Use-Social-
Media/Main-report.aspx Smith, C. (n.d.). Retrieved from http://expandedramblings.com/index.php/by-the-numbers-17-amazing-
facebook-stats/
Journal of Applied Business and Economics vol. 16(4) 2014 81