Embed Size (px)
Citation preview

The Effects of Dietary Calcium and Enzyme Supplementation on the Occurrence of Necrotic Enteritis
Diego Moreira Paiva
Dissertation submitted to the faculty of the Virginia Polytechnic Institute and State
University in partial fulfillment of the requirements for the degree of
Doctor of Philosophy In
Animal and Poultry Sciences
Audrey P. McElroy Rami A. Dalloul Frank W. Pierson
Carrie L. Walk David E. Gerrard
December 4th, 2012
Blacksburg, VA
Keywords: necrotic enteritis, calcium, phytase, poultry
The Effects of Dietary Calcium and Enzyme Supplementation on the Occurrence of Necrotic Enteritis
Diego Moreira Paiva
Abstract
Diet composition and nutrient balance can have a critical impact on intestinal
integrity during exposure to enteric pathogens. Researchers have extensively reported
benefits on nutrient availability and broiler performance as a consequence of the impact of
phytase supplementation. However, the poultry industry has little information on the effects
of phytase supplementation in disease settings. The objective of these studies was to evaluate
phytase supplementation impact on bird performance, intestinal morphology and pH, nutrient
digestibility and bone mineralization during necrotic enteritis (NE). In each experiment,
Cobb 500 broilers were obtained from a commercial hatchery and housed in floor pens at the
Virginia Tech Turkey Research Center. Birds were placed on used litter from a previous
flock that had presented clinical signs of NE. Broilers were fed non-medicated diets
formulated to meet NRC (1994) nutrient requirements, except for calcium and phosphorus. In
the first experiment, birds began exhibiting clinical signs of NE on d 9, and elevated NE-
associated mortality persisted until d 26. Mortality was influenced by the main effects of
dietary Ca or phytase. Dietary Ca supplemented at 0.9% or 1000 FTU/kg of phytase
increased mortality compared to 0.6% Ca or 0 FTU/kg phytase, respectively, from d 0 to 19.
Feed intake (FI) and feed conversion (FC) were affected by Ca x P interaction. From d 0 to
19, birds fed 0.9% Ca and 0.3% available P (avP) had decreased FI and improved FC
compared to birds fed 0.9% Ca and 0.45% avP, while FI and FC were similar in birds fed
diets with 0.6% Ca, regardless of avP level. Calcium x P x phytase interaction influenced
iii
BW or BWG from d 0-12. In general, birds fed 0.9% Ca and 0.45% avP with phytase were
heavier compared to birds fed 0.6% Ca, 0.45% avP, and phytase. Calcium at 0.9% increased
gizzard (d 19) and jejunum (d 12) pH. Dietary Ca supplemented at 0.9%, avP supplemented
at 0.45%, and 1,000 FTU/kg phytase significantly increased tibia ash weight compared to
0.6% Ca, 0.3% avP, and 0 FTU/kg phytase, respectively, on d 12. A 3-way interaction was
observed on d 35 for tibia ash percentage; birds fed 0.9% Ca and 0.45% avP had a significant
increase in tibia ash percentage, regardless of phytase supplementation. A 3-way interaction
was also observed for Ca and P digestibility on d 35. Phytase supplementation significantly
increased Ca digestibility regardless of Ca and P levels of the diets. In addition, diets
containing 0.6% Ca and 1,000 FTU/Kg of phytase resulted in a significant increase in P
digestibility, regardless of P levels. In the second experiment, birds also began exhibiting
clinical signs of NE on d 9, and elevated NE-associated mortality persisted until the end of
the trial (d 21). Mortality was significantly affected by an interaction between Ca source and
Ca levels. Significantly higher mortality was observed when animals were fed 0.9% Ca diets
formulated with calcified seaweed from d 0-21 compared to 0.6% Ca diets (regardless of Ca
source). From d 0-7, birds fed 0.6% Ca in diets supplemented with phytase had heavier BW
than the other treatments regardless of Ca source. From d 0-14 and 0-21, animals fed diets
with calcified seaweed had significantly higher FC than animals fed diets with limestone. On
d 21, the gizzard of birds fed 0.9% Ca was significantly less acidic than the gizzard of birds
fed 0.6% Ca. In conclusion, reducing dietary levels of Ca associated with phytase
supplementation improved bird performance and nutrient digestibility. In addition, these
experiments indicate that Ca is an important dietary factor in the pathogenesis of NE.
iv
Acknowledgements
I could not start these acknowledgements without first thanking God. God, thank you
for directing my steps. I truly believe you had this PhD planned before I was born, even the
necrotic enteritis outbreaks. Thank you Dr. Audrey McElroy for listening to God and
offering me a position in your program. Thank you for answering my phone calls when the
flocks broke with necrotic enteritis and assuring me that good data would come out of it.
Thanks for listening to my opinions about my research and advising me with my crazy
experimental designs. Dr. Frank Pierson, Dr. Rami Dalloul, and Dr. Carrie Walk, I thank you
for assisting me throughout my program. Thank you Dr. Pierson for encouraging me to think
simple while I was busy over analyzing my research. Thank you Dr. Dalloul for our soccer
conversations and for always pushing me to excel in my program. Dr. Carrie Walk, you
probably caused me more headaches than anyone else in my committee, but you’ve
challenged me and I thank you for that. I would like to thank all of my committee for being
an integral part of this research. I appreciate your investment in my life and I will carry with
me the ways you have shaped me professionally.
I would also like to thank the great team of fellow students I had the extraordinary
opportunity to work with: Gina, Jen, Hannah, Chasity, Lindsay and Sungwon. Christa and
Dale, thank you for your enormous assistance in executing my research trials, as well as for
the long sampling and feed mixing days. It was an honor to collaborate with all of you, learn
from you, complain with you, and annoy Dr. McElroy together during sampling days to
request Outback blooming onions and Olive Garden.
Probably the people that are most relieved that I am finishing my PhD are my family.
My parents, Fatima and Francisco, I am sorry that 5 years ago I dropped a bomb at the dinner
v
table saying I was getting my Masters at Auburn, AL – USA. I know it has not been easy for
you and it has not been for me either. But your support meant everything and I am very
grateful that you are my parents. Tatiana and Patricia, thank you for always being so
supportive and for being there for our parents when I was not. Last but not least, thank you
Hollie. You are the craziest of them all as you chose to be married to me. And I thank you for
the great gift that you are in my life. I feel very inadequate and out of words to express my
true gratitude to you, my dear family. I love you all very much.
vi
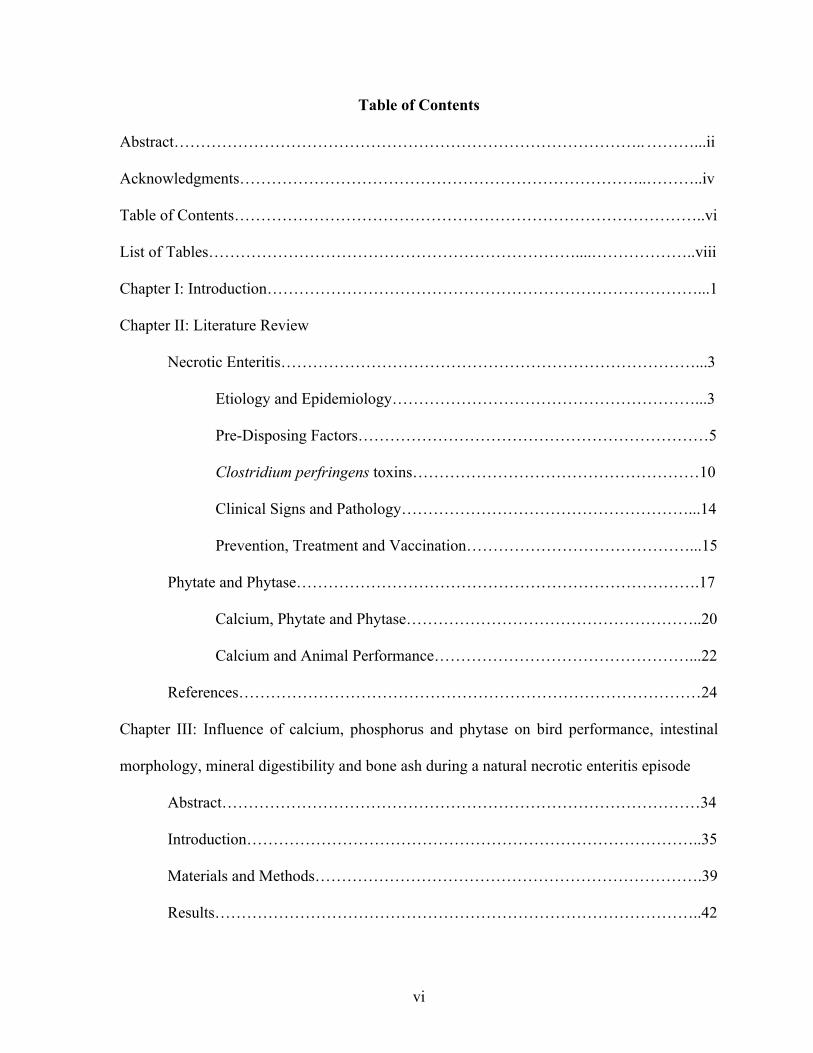
Table of Contents
Abstract…………………………………………………………………………….. ………...ii
Acknowledgments………………………………………………………………….. ………..iv
Table of Contents……………………………………………………………………………..vi
List of Tables……………………………………………………………....………………..viii
Chapter I: Introduction………………………………………………………………………...1
Chapter II: Literature Review
Necrotic Enteritis……………………………………………………………………...3
Etiology and Epidemiology…………………………………………………...3
Pre-Disposing Factors…………………………………………………………5
Clostridium perfringens toxins………………………………………………10
Clinical Signs and Pathology………………………………………………...14
Prevention, Treatment and Vaccination……………………………………...15
Phytate and Phytase………………………………………………………………….17
Calcium, Phytate and Phytase………………………………………………..20
Calcium and Animal Performance…………………………………………...22
References……………………………………………………………………………24
Chapter III: Influence of calcium, phosphorus and phytase on bird performance, intestinal
morphology, mineral digestibility and bone ash during a natural necrotic enteritis episode
Abstract………………………………………………………………………………34
Introduction…………………………………………………………………………..35
Materials and Methods……………………………………………………………….39
Results………………………………………………………………………………..42
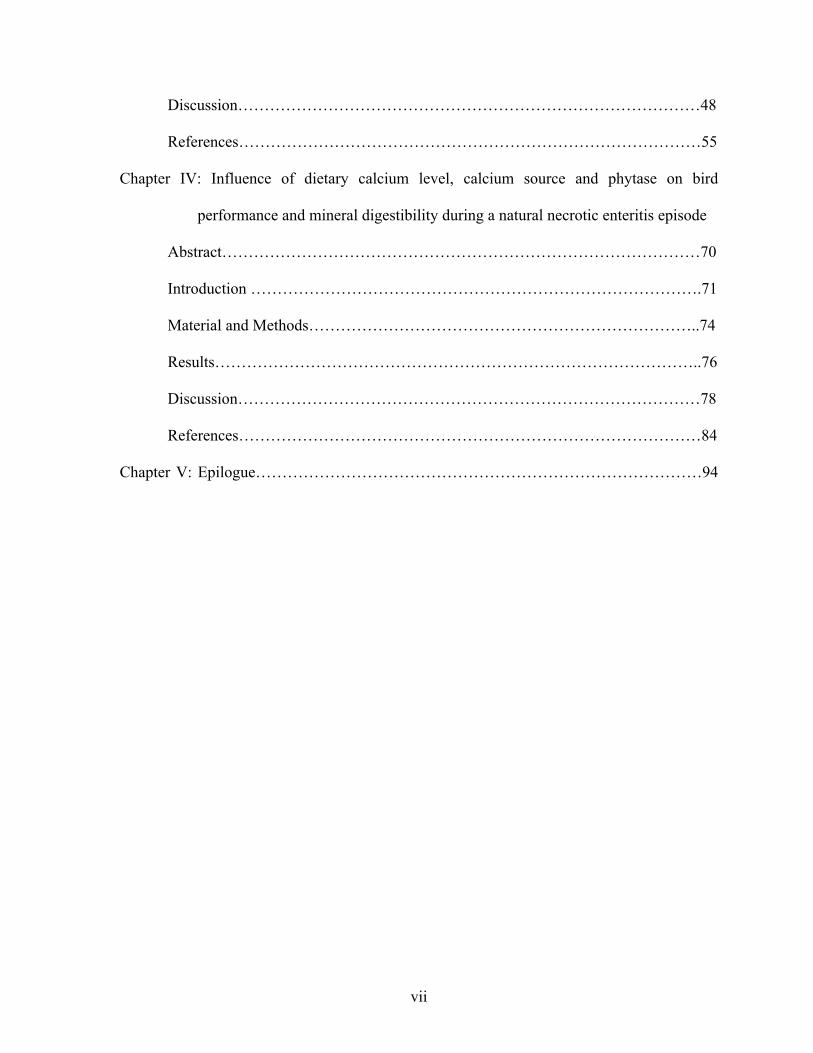
vii
Discussion……………………………………………………………………………48
References……………………………………………………………………………55
Chapter IV: Influence of dietary calcium level, calcium source and phytase on bird
performance and mineral digestibility during a natural necrotic enteritis episode
Abstract………………………………………………………………………………70
Introduction ………………………………………………………………………….71
Material and Methods………………………………………………………………..74
Results………………………………………………………………………………..76
Discussion……………………………………………………………………………78
References……………………………………………………………………………84
Chapter V: Epilogue…………………………………………………………………………94
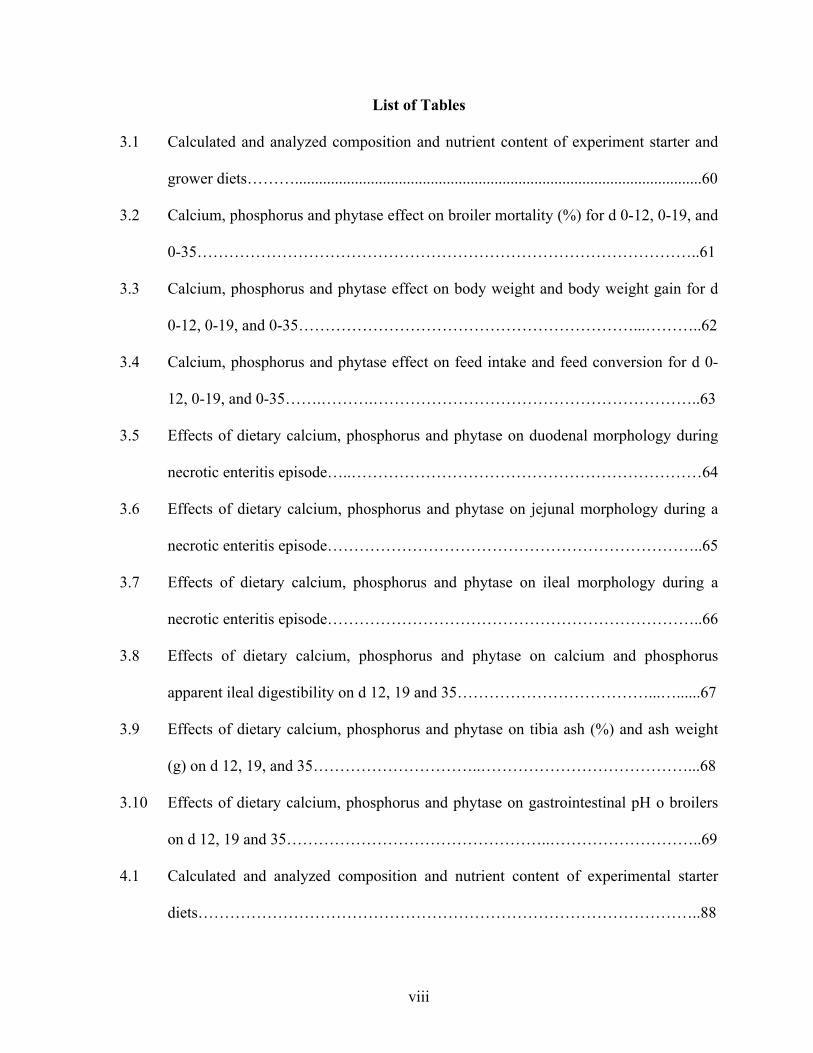
viii
List of Tables
3.1 Calculated and analyzed composition and nutrient content of experiment starter and
grower diets………......................................................................................................60
3.2 Calcium, phosphorus and phytase effect on broiler mortality (%) for d 0-12, 0-19, and
0-35…………………………………………………………………………………..61
3.3 Calcium, phosphorus and phytase effect on body weight and body weight gain for d
0-12, 0-19, and 0-35………………………………………………………...………..62
3.4 Calcium, phosphorus and phytase effect on feed intake and feed conversion for d 0-
12, 0-19, and 0-35…….……….……………………………………………………..63
3.5 Effects of dietary calcium, phosphorus and phytase on duodenal morphology during
necrotic enteritis episode…..…………………………………………………………64
3.6 Effects of dietary calcium, phosphorus and phytase on jejunal morphology during a
necrotic enteritis episode……………………………………………………………..65
3.7 Effects of dietary calcium, phosphorus and phytase on ileal morphology during a
necrotic enteritis episode……………………………………………………………..66
3.8 Effects of dietary calcium, phosphorus and phytase on calcium and phosphorus
apparent ileal digestibility on d 12, 19 and 35………………………………...…......67
3.9 Effects of dietary calcium, phosphorus and phytase on tibia ash (%) and ash weight
(g) on d 12, 19, and 35…………………………..…………………………………...68
3.10 Effects of dietary calcium, phosphorus and phytase on gastrointestinal pH o broilers
on d 12, 19 and 35…………………………………………..………………………..69
4.1 Calculated and analyzed composition and nutrient content of experimental starter
diets…………………………………………………………………………………..88
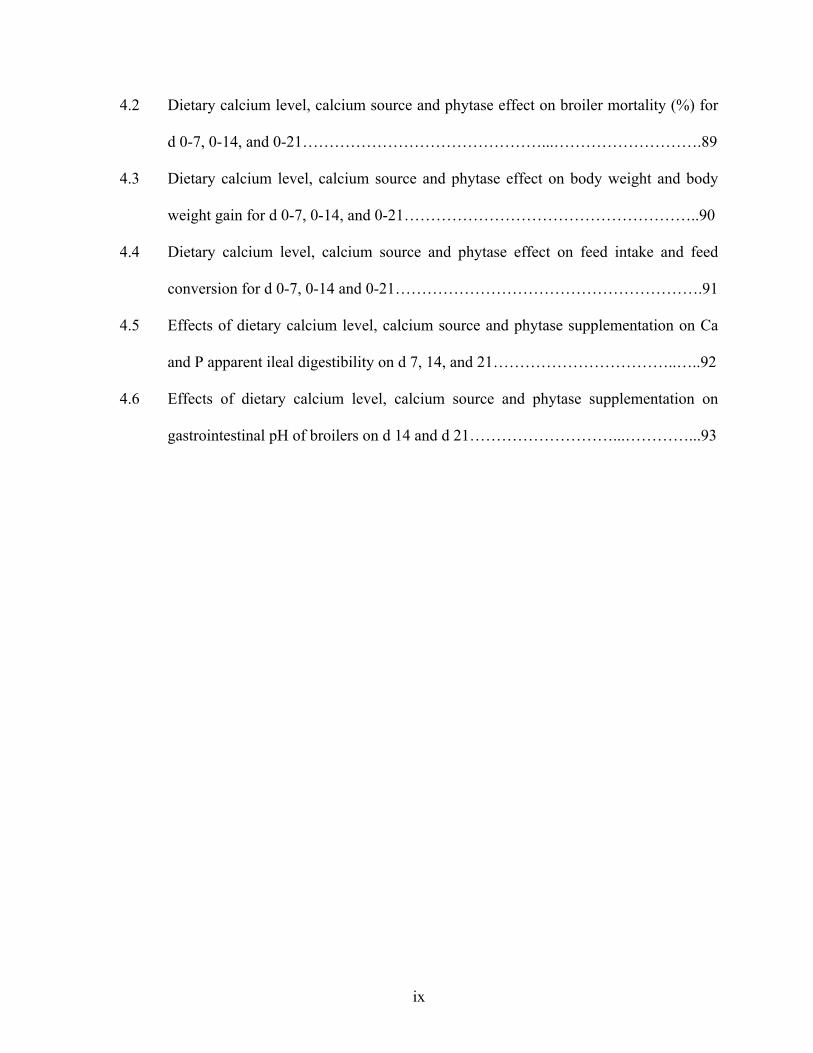
ix
4.2 Dietary calcium level, calcium source and phytase effect on broiler mortality (%) for
d 0-7, 0-14, and 0-21………………………………………...……………………….89
4.3 Dietary calcium level, calcium source and phytase effect on body weight and body
weight gain for d 0-7, 0-14, and 0-21………………………………………………..90
4.4 Dietary calcium level, calcium source and phytase effect on feed intake and feed
conversion for d 0-7, 0-14 and 0-21………………………………………………….91
4.5 Effects of dietary calcium level, calcium source and phytase supplementation on Ca
and P apparent ileal digestibility on d 7, 14, and 21……………………………..…..92
4.6 Effects of dietary calcium level, calcium source and phytase supplementation on
gastrointestinal pH of broilers on d 14 and d 21………………………...…………...93
1
Chapter I: Introduction
In sight of new market demands concerning the decreased use of growth promoters
and anticoccidial drugs in feed formulations, the poultry industry has been trying to reduce or
eliminate the inclusion of sub-therapeutic doses of antimicrobials into feed. Formulating diets
for its effects on gastrointestinal health is becoming a reality for poultry nutritionists. In
addition, nutritionists realized that maintenance and enhancement of gut health is essential
for animal performance when antimicrobials are not allowed in feed.
Necrotic enteritis has reemerged as an important disease of poultry in recent years.
The reduction in the use of sub-therapeutical doses of antimicrobials in poultry feeds has
been attributed as one of the mains causes of the increasing incidence of necrotic enteritis in
commercial poultry. Mortality due to necrotic enteritis is extremely high (1% daily
mortality), which results in great economical losses. Economic losses due to necrotic enteritis
are not only associated with high mortality, but also associated with decreases in bird
performance and feed efficiency. Animals that survive necrotic enteritis outbreaks usually
have a reduced ability to digest and absorb nutrients due to extensive damage to the mucosal
lining.
The gastrointestinal system is not only the major site for nutrient digestion and
absorption, but also works as the largest immunological organ in the animal, protecting the
host against pathogens. The gastrointestinal tract ecosystem is very susceptible to dietary
composition. Feed additives, such as enzymes, probiotics and prebiotics, can alter intestinal
microbiota and ultimately impact bird performance and animals’ susceptibility to diseases.
Exogenous enzymes are added to poultry feed with the objective to improve nutrient
availability and digestibility, which ultimately results in improvements in bird performance.
2
The mechanisms in which these enzymes improve bird performance have been extensively
researched in healthy birds. However, limited literature is available in regards to how animals
respond to disease challenges when they are being supplemented with exogenous phytases.
Therefore, it is essential to research the impact of enzyme supplementation and nutrient
balance in disease settings.
3
Chapter II: Literature Review
Necrotic Enteritis
Necrotic enteritis (NE) is an enterotoxaemia of poultry with an important economic
impact on poultry production. It has been estimated that NE costs the poultry industry US $2
billion globally, as a result of reduction in bird performance and disease treatment (Van der
Sluis, 2000; McReynolds et al., 2004). The reduction in bird performance is not only
associated with impaired growth rate and feed conversion (FC) during production, but also
with increased condemnation rates in broilers due to hepatitis at the processing plant
(Immerseel et al., 2004; Opengart, 2008).
In the past, the use of antimicrobial growth promoters (AGP) in poultry feed helped
controll NE in poultry flocks (Williams, 2005; Lee et al., 2012). However, NE has reemerged
as a significant problem in poultry production, likely as a result of national and international
policies that ban or limit the use of AGP in poultry feeds (Williams, 2005; Opengart, 2008;
Cooper and Songer, 2009). In addition, consumers’ preferences have had a large impact on
animal production, and the push for poultry production with less medication in poultry diets
have also had a significant impact on the increase in the incidence of NE in the past few
years (Cooper and Songer, 2009).
Etiology and Epidemiology
Clostridium perfringens (types A and C) is the etiological agent associated with NE
(Opengart, 2008). C. perfringens is a Gram-positive, rod-shaped, anaerobic encapsulated
4
bacterium that causes a broad spectrum of human and veterinary diseases (Smith, 1992;
McClane, 2001; Wrigley, 2001). C. perfringens differs from many other clostridia in being
nonmotile, reducing nitrate, and carrying out a stormy fermentation of lactose in milk
(Setlow and Johnson, 2001; Wrigley, 2001). C. perfringens also ferments glucose, fructose,
galactose, inositol, maltose, mannose, starch and sucrose. The fermentation products include
acetic and butyric acids with or without butanol (Smith, 1992). C. perfringens will grow over
a wide pH range varying from 5.5 to 8.5, while optimum growth of this bacterium occurs at
pH 6 to 7 (McClane, 2001; Setlow and Johnson, 2001). The virulence of C. perfringens
largely results from its prolific toxin-producing ability. The classification scheme for C.
perfringens assigns isolates to one of the five types (A-E) depending upon their ability to
express one or all four “typing” toxins (alpha, beta, epsilon, and iota) (Smith, 1992;
McClane, 2001; Wrigley, 2001).
C. perfringens has a wide distribution being isolated from the intestine of warm
blooded animals, and a variety of environments such as soil, water and feed (Smith, 1992;
Immerseel et al., 2004). Colonization in the intestines of poultry may happen as early as day-
of-hatch in the hatcheries. In fact, Craven et al. (2001) were able to isolate C. perfringens
from eggshell fragments, chicken fluff, and paper pads in commercial broiler hatcheries.
Given that C. perfringens is a naturally occurring bacterium in the intestinal environment of
poultry, disease development is dependant on other predisposing factors that will be
discussed later in this review.
Although chickens from 2 weeks to 6 months are susceptible to NE, incidence varies
greatly according to type of bird and raising conditions. Most NE outbreaks in broiler flocks
raised on litter are reported between the 2nd and 5th week of age (Williams, 2005; Opengart,
5
2008; Timbermont et al., 2011). On the other hand, NE outbreaks in commercial layers raised
in floor pen settings have been reported between 3 to 6 months of age (Opengart, 2008).
Mortality rates associated to NE in broilers are often between 2 and 10%, however rates as
high as 50% have been reported (McDevitt et al., 2006; Lee et al., 2011).
Pre-disposing Factors
C. perfringens is naturally occurring bacterium in the intestines of warm blooded
animals, and its presence itself is not a determining factor for disease development.
Therefore, pre-disposing factors that could lead to an outgrowth of C. perfringens are crucial
to NE onset and development. Several different factors have been identified as pre-disposing
factors for NE: diets, immune status and stress, intestinal physiopathology, and coccidiosis.
Dietary factors. Several different dietary components may favor C. perfringens
growth, and consequently NE onset and development. The type of cereal used in poultry diets
was identified as one of these components. Research has shown that the use of diets
formulated using cereals (barley, rye, oats and wheat) containing high levels of indigestible,
water-soluble, non-starch polysaccharides (NSP) predispose birds to NE (Branton et al.,
1987; Riddell and Kong, 1992). While the mechanism in which NSP predisposes birds to NE
is not clear, the impact that NSP have on bird performance, nutrient digestibility and digesta
viscosity has been extensively reported. Complex carbohydrates are known to have a
negative impact on bird performance (Antoniou et al., 1981; Hesselman and Aman, 1986).
The reduction in performance can be associated with a decrease in nutrient digestibility of
several nutrients such as amino acids, fat and cholesterol, and decreased dry matter retention
6
(Hesselman and Aman, 1986; Ward and Marquardt, 1987; Fengler and Marquardt, 1988).
These nutrients then become available to microbial attack in the lower small intestine, and
could potentially change the type and balance of intestinal microbiota (Fengler and
Marquardt, 1988; Langhout et al., 1999).
Jia et al. (2009) reported that digesta viscosity was greater in birds consuming diets
containing high levels of NSP. The increase in digesta viscosity due to NSP has been
associated with an increase in mucous secretion (Langhout et al., 1999) and an increase in
water binding capacity by complex carbohydrates (Antoniou et al., 1981; Fengler and
Marquardt, 1988). High digesta viscosity impairs nutrient digestion by interfering with the
interaction between digestive enzymes and their substrates, and impeding nutrient uptake in
the gastrointestinal tract (Antoniou et al., 1981; Hesselman and Aman, 1986; Fengler and
Marquardt, 1988). As a result, an influx of undigested nutrients enters the distal segments of
the small intestine increasing microbial growth. High digesta viscosity is also related to an
increase in mucous secretion (Langhout et al., 1999). This nutrient rich environment favors
C. perfringens over other bacterial species, as this bacterium is known to have mucolytic
activity and a short generation time (Deplancke et al., 2002; Collier et al., 2003, 2008).
Dietary protein levels and protein source are also dietary factors that can pre-dispose
birds to the development of NE. Protein rich diets result in a high concentration of protein in
the gastrointestinal tract that will serve as substrate for microbial growth (Timbermont et al.,
2011). In addition, in the small intestine, proteins are degraded to nitrogenous compounds
(ammonia and amines) that not only increase intestinal pH (high pKa of nitrogenous
compounds), but also favor the proliferation of pathogenic bacteria, including C. perfringens
(Smith, 1965; McDevitt et al., 2006). Evidence suggests that protein source is more
7
important than the protein levels in the diet itself. High inclusion levels of animal protein
sources (fishmeal, meat and bone meal) are usually associated with an increase in the
incidence of NE in broilers (Drew et al., 2004). Timbermont et al. (2011) hypothesized that
animal protein sources would have higher levels of indigestible protein that would reach the
ceca and serve as substrate for C. perfringens. Another possibility is that the amino acid
balance (specially methionine and glycine) in these feed ingredients would ultimately favor
C. perfringens growth in the ceca, leading to NE (Drew et al., 2004; Williams, 2005).
However, it is still unclear why high inclusion levels of animal protein in the diet of broilers
results in an increase in the prevalence of NE.
Depending on diet composition (especially cereal type), feed form (mash vs. pellet)
may also influence the incidence of NE (Branton et al., 1987; McDevitt et al., 2006). Branton
et al. (1987) reported that birds fed diets in the mash form were associated with higher
mortality due to NE. This might be due to the fact that the feed particles in mash diets are
smaller. Smaller particles are not only more easily digested by birds’ digestive enzymes, but
also by microbial populations in the ceca (Immerseel et al., 2004; Cooper and Songer, 2009).
Additionally, when birds are fed mash diets, and increase in digesta viscosity is usually
observed. The effects of digesta viscosity in the incidence of NE will be discussed further in
this chapter.
Immune Status and Stress. Immunosupression predisposes animals to NE because
the factors that usually lead to immunosupression likely alter the intestinal environment and
the intestinal microbial population (McDevitt et al., 2006; Timbermont et al., 2011).
Infections with pathogens that lead to immunosupression (Eimeria spp., infectious bursal

8
disease virus (IBDV), chick anemia virus, and Marek’s disease virus) have been reported to
predispose chickens to NE (McReynolds et al., 2004; Lee et al., 2011). In a NE disease
model study, McReynolds et al. (2004) reported that birds infected with IBDV often have
secondary infections with C. perfringens. Stress has probably the same immunosuppressive
effects of the aforementioned pathogens. Environmental (heat or cold stress) and managerial
(feed changes, litter conditions, stocking density, vaccination programs) stressors have been
shown to cause immunosupression, predisposing animals to disease (McReynolds et al.,
2004; McDevitt et al., 2006; Tsiouris et al., 2009).
Intestinal Physiopathology. When intestinal conditions are not favorable, even
highly virulent C. perfringens strains fail to produce disease. However, there are some
intestinal physiopathological circumstances that favor the development of NE, such as
intestinal stasis, gastrointestinal pH, and damage to the intestinal mucosa (Williams, 2005;
Cooper and Songer, 2009; Lee et al., 2011). When intestinal motility is reduced (i.e.
increased digesta viscosity) feed passage is delayed. This increases nutrient availability to the
microbial population in the gastrointestinal tract, allowing C. perfringens to outgrow other
species (Williams, 2005). Associated with an increase in nutrient availability, an increase in
transit time also means a reduction in microbial flushing from the gastrointestinal tract, which
increases the opportunity of pathogens to proliferate, colonize and cause disease.
Intestinal acidity can also have an impact on NE onset. Higher intestinal pH can
predispose birds to develop NE, since C. perfringens growth is inhibited in more acidic
intestines (Kmet et al., 1993). Damage of the intestinal mucosa is another condition that
predisposes broilers to develop NE. This predisposition is likely a combination of effects
9
such as changes in intestinal pH, excess nutrient in the gastrointestinal tract (birds are usually
unable to digest and absorb nutrients), leakage of plasma proteins and growth factors to the
intestinal environment, and loss of intestinal integrity. These factors will be discussed in
more detail further in the coccidiosis section of this chapter.
Coccidiosis. Although coccidiosis appears to be the most studied pre-disposing factor
of NE, it is still the one we understand the least. Coccidiosis in chickens is usually caused by
the association of two or more species of Eimeria: E. acervulina, E. brunetti, E. maxima, E.
mitis, E. necatrix, E. praecox and E. tenella (McDougald, 2008). Coccidia oocysts are
ubiquitous in areas where poultry are raised allowing this parasite to cycle and remain in the
environment (Williams, 2005). The Eimeria sp. life cycle is complex and involves stages
inside and outside of the host. Once inside the host, the cycle consists of extracellular and
intracellular phases, and sexual and asexual reproduction. Coccidiosis infection occurs via
the fecal-oral route. Excreted oocysts are dependent on moisture and oxygen to sporulate and
become infective. Animals ingest sporulated oocysts that excystates and release individual
sporozoites into the intestinal lumen. Sporozoites invade the enterocytes and form
trophozoites. Trophozoites undergo nuclear divisions forming immature meronts. Inside the
meronts, schizonts reproduce asexualy (multiple fission) forming merozoites. Mature
meronts rupture the host enterocyte releasing the merozoites in the intestinal lumen, which
undergo differentiation stages of merogony. Merezoites invade enterocytes and develop into
microgamonts or macrogamonts. Microgamonts undergo multiple divisions until they
become microgametes (flagellated), and macrogamonts develop into a macrogamete.
Microgametes rupture the enterocyte in which they were developing and invade the
10
enterocyte that contains a macrogamete. Microgametes fertilize the macrogamete, and the
oocyst wall is formed. Following oocyst maturation, the enterocyte ruptures releasing oocysts
in the intestinal lumen, which will be excreted in the environment.
The consequence of the Eimeria cycle described above is extensive damage to the
intestinal mucosa. The intestinal lumen then becomes rich with plasma proteins, which are
themselves rich in amino acids, growth factors and vitamins that serve as substrate for
clostridial growth (Immerseel et al., 2004; Williams, 2005; Timbermont et al., 2011). In
addition, digestibility of nutrients is reduced due to extensive gastrointestinal damage, which
may substantially increase nutrient availability for C. perfringens (Lillehoj and Trout, 1996;
Williams, 2005). In addition, coccidiosis induces a local T cell-mediated inflammatory
response that increases mucin (and mucous) production (Lillehoj and Trout, 1996; Collier et
al., 2008). The increase in mucous production ultimately favors C. perfringens growth due to
its mucolytic ability (Collier et al., 2003, 2008).
Clostridium perfringens Toxins
C. perfringens are extra-cellular pathogens, thus its virulence is mostly associated
with its ability to produce toxins. C. perfringens can produce up to seventeen toxic or
potentially toxic exoproteins (Songer, 1996). The species is divided into types (A, B, C, D,
and E) according to the production of four major toxins: alpha, beta, epsilon, and iota. Type
A comprises the strains that produce alpha-toxin, type B as strains that produce alpha, beta,
and epsilon toxins, type C as strains that produce alpha and beta toxins, type D as strains that
produce alpha and epsilon toxins, and type E as strains that produce alpha and iota toxins
11
(Songer, 1996; Petit et al., 2009). Since only C. perfringens types A and C are associated
with NE, only alpha and netB toxins will be discussed in this review.
Alpha-toxin. Alpha-toxin is a zinc-dependent phospholipase sphingomyelinase C,
and is encoded by the Plc gene (Guillouard et al., 1997; Titball et al., 1999; Cooper and
Songer, 2009). Alpha-toxin is organized in two distinct domains: the N-terminal region (247
residues), that carries the active site required for phospholipid hydrolysis; and the C-terminal
region (123 residues) that carries the lipid-binding site (Guillouard et al., 1997; Petit et al.,
1999). Alpha-toxin requires zinc for substrate hydrolysis (Guillouard et al., 1997; Titball et
al., 1999; McDevitt et al., 2006). In addition to zinc, alpha-toxin also depends on Ca for full
activity. Calcium ions are essential for the binding of alpha-toxin to lipid films (Moreau et
al., 1988; Petit et al., 1999; Titball et al., 1999). High Ca concentrations are required for
optimal enzymatic activity with physiological substrates (Guillouard et al., 1997; Sakurai et
al., 2004). Alpha-toxin has been shown to be cytotoxic leading to cell lysis of erythrocytes,
phagocytes, fibroblasts, platelets, leukocytes, endothelial cells, and myocytes (Songer, 1996;
Guillouard et al., 1997).
Alpha-toxin hydrolyses phospholipids and promotes cellular membrane
disorganization. In vivo, the cellular substrates for alpha-toxin are phosphatidylcholine and
sphingonyelin, which are both components of the cellular membrane of epithelial cells in the
gastrointestinal system (Titball et al., 1999; McDevitt et al., 2006). The mechanism of
membrane recognition is a complex event. This mechanism involves a Ca mediated
phospholipid recognition, where Ca ions are partially coordinated by acidic amino acid side
chains of alpha-toxin, and partially by phosphate groups or membrane phsopholipids (Titball
12
et al., 1999). Hydrolysis of cell membrane phospholipds results in the formation of
diacylglycerol, following an activation of protein kinase C, and consequent activation of
arachidonic acid cascade (Petit et al., 1999; Sakurai et al., 2004; McDevitt et al., 2006). The
outcome of the activation of the arachidonic acid cascade is the synthesis of inflammatory
mediators (leukotrienes, tromboxane, platelet-agglutinating factor, and prostacyclin), which
cause blood vessel contraction, platelet aggregation, myocardial dysfunction, leading to acute
death (Petit et al., 1999; Immerseel et al., 2004; Sakurai et al., 2004).
Alpha-toxin has been indicated as the main virulence mediator for NE in poultry. Al-
Sheikhly and Truscott (1976) were able to successfully reproduce NE in birds infused
intraduodenally with bacteria-free crude toxin. Another indication of alpha-toxin
participation in NE pathogenesis is that C. perfringens isolates from broilers with NE
significantly produces more alpha-toxin than isolates from broilers without NE (Hofshagen
and Stenwig, 1992). Studies of broilers’ immune response to NE also suggest that alpha-
toxin is an important virulence factor in the pathogenesis of NE. Broilers afflicted with NE
have significantly lower antibody levels against alpha-toxin than healthy controls (Lovland et
al., 2004; Lee et al., 2012). Higher levels of toxin-reactive antibodies in healthy chickens
when compared to chickens with NE symptoms, indicate that these antibodies may protect
birds from developing NE.
The role of alpha-toxin in producing NE in broilers is a very controversial topic.
Interpretation of early results can be disputed because most of the studies which reported
alpha-toxin as the main virulence factor in the pathogenesis of NE used crude supernatant
instead of purified alpha-toxin (Al-Sheikhly and Truscott,1976; Hofshagen and Stenwig,
1992). Conclusions of these studies were based on alpha-toxin being the most dominant
13
protein present in crude supernatants, and did not consider the presence of other toxins in
crude supernatants that might be collaborating or even responsible for the development of
NE (Immerseel et al., 2009). The most convincing evidence that alpha-toxin is not the main
virulence mediator in the development of NE comes from Keyburn et al. (2006) study where
an alpha-toxin negative mutant of a C. perfringens strain from an NE outbreak was still able
to produce NE in broilers. Other factors of NE pathogenesis also indicate that alpha-toxin is
not the main virulence factor of NE. One of the hallmarks of NE in broilers is granulocyte
migration from the tissue to the intestinal lumen (Olkowski et al., 2006). This inflammatory
reaction is very different from the leukostasis and lack of inflammatory response induced by
alpha-toxin in gas gangrene (Bryan et al., 2006), indicating that NE lesions are probably
mediated by toxins other than alpha-toxin.
NetB toxin. NetB is a pore-forming toxin, with similarity to C. perfringens beta-toxin
(38% identity), C. perfringens gamma-toxin (40% identity), Staphylococcus aureus alpha-
hemolysin (30% identity), and S. aureus gamma-toxin (23% identity) (Keyburn et al., 2010).
These toxins form pores in the cellular membrane causing an influx of ions (Ca, Na, Cl, etc)
that eventually lead to osmotic cell lysis. There is strong evidence showing that netB is an
essential virulence mediator for the development of NE. Initial screening of poultry NE
isolates found that the majority of the isolates (77%) were netB positive (Keyburn et al.,
2008 and 2010). In addition, non-necrotic enteritis C. perfringens isolates were analyzed for
the presence of the netB gene, and most of these isolates (91.2%) were found to be netB
negative (Keyburn et al., 2010). Keyburn et al. (2008) reported that C. perfringens netB
knock out isolates were not able to cause NE, while the original netB positive isolates were
14
able to cause disease. Therefore, although there is a clear association between netB and NE
development, since not all C. perfringens isolates from NE outbreaks were netB positive,
there may be other virulence factors that play an important role in the onset and development
of NE. The presence of netB gene in isolates from healthy birds also suggests that netB’s
presence is not sufficient to cause disease, which reveals the importance of pre-disposing
factors for the development of NE.
Clinical Signs and Pathology
Necrotic enteritis clinical signs are common to enteritis in general: depression,
anorexia, diarrhea, dehydration, and ruffled feathers (Immerseel et al., 2004; Opengart, 2008;
Cooper and Songer. 2009). The classic acute form of NE is characterized by a sudden
increase in flock mortality without any warning clinical signs (Immerseel et al., 2004;
Timbermont et al., 2011). The subclinical form of NE is usually mild with no clinical signs
or peak mortality. Most of the time, only an overall reduction in bird performance is
observed (Hofshagen and Stenwig, 1992; Immerseel et al., 2004). Performance losses are
associated with chronic intestinal mucosal damage resulting in poor nutrient digestion and
absorption, reduced body weight gain (BWG), and increased feed conversion (FC) ratio
(Immerseel et al., 2004; Timbermont et al., 2011). In cases of sub-clinical NE, an increase in
liver condemnations at the processing plant is often observed due to cholangiohepatitis
(Immerseel et al., 2004; Timbermont et al., 2011). Therefore, the subclinical form of NE is
harder to diagnose and birds are not treated, resulting in greater economic losses
(Timbermont et al., 2011).
15
Macroscopic lesions are usually restricted to the jejunum and ileum, but may extend
to the duodenum and ceca (Opengart, 2008; Cooper and Songer, 2009; Timbermont et al.,
2011). The small intestine is usually distended and filled with gas; intestinal walls are thin
and friable (Opengart, 2008; Timbermont et al., 2011). There is necrosis of the intestinal
mucosa and presence of a green to yellow diphtheritic membrane that is adherent to the
mucosa (Opengart, 2008).
Histopathology reveals a severe inflammatory response to C. perfringens.
Inflammatory infiltrate is characterized by the presence of heterophils, lymphocytes,
macrophages, and plasma cells (Olkowski et al., 2006; Timbermont et al., 2011). Diffuse
and severe coagulative necrosis of the mucosa is also observed (Olkowski et al., 2006;
Timbermont et al., 2011). Masses of tissue fragments, necrotic cells, cell debris and bacterial
colonies comprise the diphteric membrane characteristic of NE (Olkowski et al., 2006;
Timbermont et al., 2011). Blood vessel congestion can be observed in the lamina propria and
submucosa.
Prevention, Treatment and Vaccination
Necrotic enteritis prevention is usually associated with management practices that
minimize the effects of the pre-disposing factors that contribute to disease development.
Removing dietary ingredients that may lead to NE, such as fish meal, oats, barley and rye,
has been a noteworthy solution in reducing NE incidence (Cooper and Songer, 2009). The
use of AGP in feed has also played an important role in the control of NE. The introduction
of AGP in the diet assists with coccidiosis management, and modifies the intestinal microbial
populations, which both result in a reduction in the incidence of NE (Immerseel et al., 2004;
16
Cooper and Songer, 2009). However, government bans, bacterial resistance to antimicrobials,
and consumers’ preferences regarding a medication-free final product have pushed the
poultry industry towards reducing the use of AGP in poultry feed (Immerseel et al., 2004;
Williams, 2005; Opengart, 2008). Other methods used to control coccidiosis, such as
vaccination, may also have an indirect impact in reducing the incidence of NE (Immerseel et
al., 2004).
The reduction in the use of antimicrobials in poultry diets resulted in an increase of
antibiotics used in treatment of flocks with NE. Necrotic enteritis has been treated by
administering lincomycin, bacitracin, oxytetracycline, penicillin, and tylosin in water
(Opengart, 2008; Cooper and Songer, 2009). Bacitracin, lincomycin, virginiamycin,
penicillin, avoparcin, and nitrovin can also be used in the feed to treat NE (Opengart, 2008;
Cooper and Songer, 2009).
Vaccination studies as an effective method of NE prevention show inconsistent
results. Most vaccination efforts have been directed to producing toxoid vaccines by using
culture supernatant, which alpha-toxin is the major component (Immerseel et al., 2009;
Keyburn et al., 2010; Lee et al., 2012). However, findings suggesting that alpha-toxin might
not be the main virulence factor in the pathogenesis of NE, could explain why vaccination
trials have been so inconsistent with results. There is strong evidence suggesting that netB
could be used as a toxoid and offer a better protection (Keyburn et al., 2010; Lee et al.,
2012). Though, since netB has been recently discovered, further studies on its mechanism of
action and of immune response induction need to be performed before major advances can be
made.
17
Phytate and Phytase
Phytate (myo-inositol hexakiphosphate) is a naturally occurring molecule in grains
and seeds, and it is the main organic source of P in animal feedstuffs of plant origin
(Sebastian et al., 1996b; Tamim et al., 2004; Selle et al., 2009). In addition to its role in P
storage, phytate may also function as an antioxidant in seeds binding to iron, and preventing
the combination of free iron and unsaturated fatty acids (Mullaney et al., 2000). Phytate is
found in most vegetable feed ingredients at concentrations from 5-25g/kg (Cowieson et al.,
2011). However, P bound to phytate is not available for absorption unless it is released from
the inositol ring (Sandberg et al., 1993; Tamim et al., 2004). Researchers estimate that from
60 to 80% of the P present in seeds and grains is in the form of phytate phosphorus (PP)
(Pirgozliev et al., 2007; Manangi and Coon, 2008). Phytate is usually chelated to dietary
minerals such as manganese, sodium, potassium and Ca (Tamim et al., 2004; Selle et al.,
2009; Powell et al., 2011). Other molecules such as small peptides, amino acids and sugars
can also be indirectly bound to phytate by their association with the previously mentioned
minerals (Tamim et al., 2004). Since minerals (especially divalent cations) and other
nutrients (small peptides, amino acids, sugars) bind to phytate, the presence of high levels of
phytate in the diet is usually related to reduced nutrient availability and absorption, which
usually results in poor bird performance (Sebastian et al., 1996a,b; Tamim et al., 2004; Selle
et al., 2009).
In order to minimize the detrimental effects of phytate, phytase supplementation has
been largely used by poultry nutritionists since 1991 when formulating diets for broilers
(Bedford, 2003). Phytases are phosphatases that hydrolyze phosphate from phytate
18
(Sebastian et al., 1996a; Tamim et al., 2004). There are two classes of commercial phytases
that differ in the first phosphate group on the phytate molecule that undergoes phytase attack.
The 3-phytases attack the carbon in the third position, whereas 6-phytases attack the carbon
in the sixth position (Rutherfurd et al., 2012). Exogenous microbial phytases are mainly
active in the stomach of pigs and forestomach of poultry (crop, proventriculus, and gizzard).
The acidic pH of these organs increase phytate solubility, making phytate more susceptible to
phytase attack (Selle et al., 2009).
Dietary PP is unavailable for the bird unless released from the inositol ring of phytate
by endogenous or supplemented phytases (Sandberg et al., 1993). The use of phytase to
hydrolyze phytate is well established, and has been extensively reviewed in the literature
(Selle and Ravindran, 2007). Benefits from phytase supplementation are not restricted to
improvements in P digestibility and absorption, but also include improvements in FC, BW
and BWG, as well as nutrient utilization and bone mineralization in broilers (Cowieson et al.,
2004, 2006). Performance improvements associated with phytase supplementation are
consequent to the release of minerals from the phytate-mineral complex, the utilization of
inositol by animals, and increased carbohydrate and protein digestibility (Sebastian et al.,
1996a).
Improvements in bird performance are not only associated with greater P availability.
Research has shown that diet supplementation with exogenous phytases improves birds’
ability to metabolize protein and energy through the release of amino acids, small peptides
and carbohydrates that are indirectly bound to the phytate molecule (Ravindran et al., 1995;
Cowieson et al., 2006; Cowieson et al., 2011). In addition, nutrient release does not seem to
be the only mechanism in which phytase supplementation improves bird performance. It has
19
been shown that the ingestion of phytic acid can negatively influence amino acid, energy and
mineral excretion by broilers (Cowieson et al., 2004). The mechanisms by which phytate
ingestion alters gastrointestinal physiology are not completely understood, however it seems
to involve the reactive nature of phytic acid and the electrostatic aggregation of dietary
protein in the gastric phase of digestion (Cowieson et al., 2009; Selle et al., 2009). Also, high
phytate levels in the diet are known to increase endogenous losses by interacting with
endogenous enzymes or gastrointestinal mucin, increasing the excretion of endogenous
amino acids and minerals (Cowieson et al., 2004).
The beneficial effects of phytase supplementation are likely to be a direct
consequence to the negative effects of phytate, which are mediated by a reduction in
endogenous losses, and improvements in the digestion, absorption and retention of nutrients.
However, there are also indirect benefits from phytase supplementation that go beyond
animal performance. Phosphorus in chicken litter is a major pollutant subject to strict
governmental regulations. Phosphorus pollution is a hazard to aquatic ecosystems because P
is the primary cause of eutrophication in fresh-water reserves (Selle et al., 2009). Fecal P
consists of undigested portions of phytate-bound, and nonphytate P from plant sources,
undigested portions of P from animal by-products and mineral supplements, and available P
that exceeded animals’ needs (Waldroup, 1999). Since phytase improves P availability,
poultry nutritionists are able to formulate diets supplemented with lower levels of inorganic
P, which reduces the P concentration in poultry litter by up to 30% (Perney et al., 1993;
Ferguson et al., 1998; Salarmoini et al., 2008). Another approach to reducing dietary P levels,
and minimizing excreted P is to develop grains that have reduced levels of phytate
(Waldroup, 1999).
20
It is estimated that over half of the pig and poultry diets formulated worldwide are
supplemented with an exogenous source of phytase (Bedford, 2003; Selle et al., 2009).
However, less than 35% of phytate within broiler diets is hydrolyzed by phytase as measured
by ileal disappearance (Powell et al., 2011). The incomplete hydrolysis of phytate offers the
opportunity to evaluate how different ingredients used in broiler diets affect phytase
efficiency, and Ca appears to be a major nutrient that affects phytase efficacy.
Calcium, Phytate and Phytase
Calcium is the most abundant mineral (by mass) in most animals, making its
requirement higher than any other mineral. Therefore, Ca is a major mineral to be
supplemented in the diet of many production animals by the use of inorganic sources
(Sebastian et al., 1996b). The most recent published guidelines for nutrient requirements for
poultry (NRC, 1994) suggest that the Ca requirements for growing broilers are 1.0% from d 0
to 21, 0.9% from d 21 to 42, and 0.80% from d 42 to 56. However, the experiments used to
determine Ca requirement for broilers were not conducted with the supplementation of
phytase in the diet (NRC, 1994).
Calcium must be soluble in the intestinal lumen in order to be absorbed. Calcium
solubility in the intestine is closely related to small intestinal pH (around 6.0). When pH is
close to neutral, phytate forms mineral chelates that are highly insoluble (Sebastian et al.,
1996b; Tamim et al., 2004; Plumstead et al., 2008). In addition, a high ratio of dietary Ca to
P reduces the digestibility and absorption of Ca and P due to increased precipitation of Ca-P
complexes (Plumstead et al., 2008; Selle et al., 2009). Selle et al. (2000) have reported that
maximum insolubility of phytate-mineral chelates occurs between pH of 4 and 7. Calcium is
21
one of the divalent cations with lowest affinity for phytate. However, since Ca is the mineral
added in highest concentrations to poultry diets, it has a greater impact on forming mineral-
phytate chelates than other dietary minerals, making both, Ca and P, unavailable for
absorption (Sebastian et al., 1996b; Maenz et al., 1999; Tamim et al., 2004). The phytate
molecule can carry up to twelve negative charges, thus having the potential to chelate six Ca
atoms (Selle et al., 2009). Therefore, phytase supplementation improves digestibility,
absorption and retention of Ca, which is consequent to the release of Ca from Ca-phytate
complexes (Sebastian et al., 1996a; Selle et al., 2009; Rutherfurd et al., 2012).
Calcium source has also a significant impact on Ca-phytate precipitation in the
gastrointestinal tract of poultry. Limestone, the most commonly used source of Ca in poultry
diets, tends to increase digesta pH along the gastrointestinal tract due to its extremely high
acid binding capacity (Shafey et al., 1991; Lawlor et al., 2005; Selle et al., 2009). The
increase in digesta pH reduces the solubility of Ca and phytate, which tend to form
complexes that precipitate and become unavailable for the bird (Sebastian et al., 1996b;
Tamim et al., 2004; Plumstead et al., 2008).
Several authors have reported that elevated levels of Ca in the diet decreased phytase
efficacy (Applegate et al., 2003; Tamim et al., 2004; Yan et al., 2006). Applegate et al.
(2003) reported that a dietary Ca level commonly used in broiler diets (0.9%) resulted in a
reduced intestinal phytase activity and reduced apparent ileal PP hydrolysis compared with
lower Ca level (0.4%). A high Ca and total P (tP) ratio appeared to exacerbate this effect, by
increasing the formation of mineral-chelate complexes and decreasing phytase activity (Qian
et al., 1997; Tamim et al., 2004; Selle et al., 2009). Therefore, it has been postulated that high
levels of Ca, and high Ca:P ratios have a negative impact on phytase efficacy in poultry diets.
22
Poultry possess effective phytase/phosphatases activity in the intestinal mucosa,
blood, and liver, and can readily dephosphorylate phytate (Maenz et al., 1999; Cowieson et
al., 2011). However, phytases can only hydrolyze phosphate groups from the inositol ring
when phytate is in solution (Wise, 1983). As previously mentioned, mineral-phytate chelates
are most insoluble between pH 4 and 7. Therefore, in the small intestine, mineral-phytate
complexes tend to precipitate, becoming unavailable to phytase activity. Thus, the problem
with phytate digestion is not a lack of compatible endogenous enzymes but poor substrate
solubility in the small intestine. This effect is increased when high amounts of Ca are present
(Tamim et al., 2004; Cowieson et al., 2011). Shafey et al. (1991) reported that increased
dietary Ca and available P (avP) levels reduced the proportion of soluble minerals and
thereby further decreased the availability of these minerals due to higher precipitation of
mineral-phytate complexes. This effect was confirmed by Maenz et al. (1999) when they
introduced a phytate competitor (EDTA) in broiler diets. The addition of EDTA prevented
the inhibitory effect of Ca in phytate hydrolysis. In summary, this effect is described as
precipitation of Ca-phytate complexes due to high availability of Ca (in high Ca diets) in the
intestinal lumen (pH around 6), because when the substrate precipitates, the enzyme
(phytase) cannot hydrolyze it.
Calcium and Animal Performance
In the past, since inorganic sources of Ca and P were inexpensive when compared to
other mineral sources, little effort was made to determine the exact Ca and P requirements in
broiler diets (Selle et al., 2009; Powell et al., 2011). Therefore, the poultry industry still
utilizes NRC (1994) standards for Ca to formulate broiler diets. Calcium and phosphorus are
23
usually supplemented in poultry diets by the inclusion of limestone, dicalcium phosphate,
and meat-and-bone meal (where permitted). Inorganic sources of Ca and P are escalating in
price, and the cost of supplementing diets with exogenous phytases is decreasing (Selle et al.,
2009). In addition, inorganic sources of Ca and P reserves are not renewable, and their
depletion can be delayed by reducing the inclusion levels of Ca and P in animal feed
(Mullaney et al., 2000; Selle et al., 2009).
Benefits from supplementing broiler diets with lower levels of Ca are supported by
performance results. Anderson et al. (1984) reported that BWG, FC, and bone ash were all
significantly reduced by increasing dietary Ca from regular industry standards (0.9%) to
1.5% in the diet. Sebastian et al. (1996) were the first to challenge NRC (1994)
recommended Ca levels in diets supplemented with phytase. In their study, efficacy of
supplemental phytase was significantly affected by dietary Ca levels, and the optimal growth
performance, and retention of P and Ca were achieved at the lowest level of dietary Ca tested
(0.6%). Selle et al. (2009) reported that over a 30-day feeding period, high levels of Ca
depressed BWG (32%), FI (16.2%), and FC (18.8%) in pigs receiving phytase in the diets.
Benefits from phytase supplementation in nutrient digestibility and bird performance
have been extensively reported in the literature. However little information on the effects of
enzyme supplementation during disease is available. Additionally, the introduction of new
feed additives to poultry diets in the past 20 years, such as exogenous enzymes, significantly
impacted nutrient availability and digestibility. However, nutrient requirements for poultry
have not been revisited since the last NRC (1994) was published. Thus, the poultry industry
needs to re-evaluate nutrient requirements, and research the influence of these new feed
additives during disease.
24
REFERENCES
Al-Sheikhly, F., and R.B. Truscott. 1976. The pathology of necrotic enteritis of chickens
following infusion of crude toxins of Clostridium perfringens into the duodenum.
Avian Dis. 21:241-255.
Anderson, J.O., D.C. Dobson, and O.K. Jack. 1984. Effect of particle size of the calcium
source on performance of broiler chicks fed diets with different calcium and
phosphorus levels. Poult. Sci. 63:311-316.
Antoniou, T., R.R. Marquardt, and P.E. Cansfield. 1981. Isolation, partial characterization,
and antinutritional activity of a factor in rye grain. J. Agric. Food Chem. 29:1240-
1247.
Applegate, T. J., R. Angel, and H. L. Classen. 2003. Effect of dietary calcium, 25-
hydroxychoecalciferol or bird strain on small intestinal phytase activity in broiler
chickens. Poult. Sci. 82:1140-1148.
Bedford, M. 2003. New enzyme technologies for poultry feeds. Br. Poult. Sci. 44:S14-S16.
Branton, S.L., F.N. Reece, and W.M. Hagler Jr. 1987. Influence on a wheat diet on mortality
of broiler chickens associated with necrotic enteritis. Poult. Sci. 66:1326-1330.
Bryan, A.E., C.R. Bayer, M.J. Adalpe, R.J. Wallace, R.W. Titball, and D.L. Stevens. 2006.
Clostridium perfringens phospholipase C-induced platelet/leukocyte interactions
impede neutrophil diapedesis. J. Med. Microbiol. 55:495-504.
Collier, C.T., C.L. Hofacre, A.M. Payne, D.B. Anderson, P. Kaiser, R.I. Mackie, and H.R.
Gaskins. 2008. Coccidia induced mucogenesis promotes the onset of necrotic enteritis
by supporting Clostridium perfringens growth. Vet. Immunol. 122:104-115.
25
Collier, C.T., J.D. Klis, B. Deplancke, D.B. Anderson, and H.R. Gaskins. 2003. Effects of
tylosin on bacterial mucolysis, Clostridium perfringens colonization, and intestinal
barrier function in a chick model of necrotic enteritis. Antimicrob. Agents
Chemother. 47:3311-3317.
Cooper, K.K. and J.G. Songer. 2009. Necrotic enteritis in chickens: a paradigm of enteric
infection by Clostridium perfringens type A. Anaerobe 15:55-60.
Cowieson, A.J., P. Wilcock, and M.R. Bedford. 2011. Super-dosing effects of phytase in
poultry and other monogastrics. Worlds Poult. Sci. J. 67:225-235.
Cowieson, A.J., M.R. Bedford, P.H. Selle, and V. Ravindran. 2009. Phytate and microbial
phytase: implications for endogenous nitrogen losses and nutrient availability. Worlds
Poult. Sci. J. 65:401-417.
Cowieson, A.J., T. Acamovic, and M.R. Bedford. 2006. Supplementation of corn-soy- based
diets with an Escherichia coli derived phytase:effects on broiler chick performance
and the digestibility of amino acids and metabolizability of minerals and energy.
Poult. Sci. 85:1389-1397.
Cowieson, A.J., T. Acamovic, and M.R. Bedford. 2004. The effect of phytase and phytate on
endogenous losses from broiler chickens. Br. Poult. Sci. 45:101-108.
Craven, S.E., N.A. Cox, N.J. Stern, and J.M Mauldin. 2001. Prevalence of Clostridium
perfringens in commercial broiler hatcheries. Avian Dis. 45:1050-1053.
Deplancke,B., O. Vidal, D. Ganessunker, S. Donovan, R. Mackie, and H. Gaskins. 2002.
Selective growth of mucolytic bacteria including Clostridium perfringens in a
neonatal piglet model of total parenteral nutrition. Am. J. Clin. Nutr. 76:1117-1125.
26
Drew, M.D., N.A. Syed, B.G. Goldade, B. Laarveld, and A.G. van Kessel. 2004. Effects of
dietary protein source and levels on intestinal populations of Clostridium perfringens
in broiler chickens. Poult. Sci. 83:414-420.
Fengler, A., and R.R. Marquardt. 1988. Water-soluble pentosans from rye: II. Effects on rate
of dialysis and on the retention of nutrients by the chick. Cereal Chem. 65:298-302.
Ferguson, N.S., R.S. Gates, J.L. Taraba, A.H. Cantor, A.J. Pescatore, M.L. Straw, M.J. Ford,
and D.J. Burnham. 1998. The effect of dietary protein and phosphorus on ammonia
concentration and litter composition in broilers. Poult. Sci. 77:1085-1093.
Guillouard, I., P.M. Alzari, B. Saliou, and S. Cole. 1997. The carboxy-terminal C2-like
domain of the alpha-toxin from Clostridium perfringens mediates calcium-dependent
membrane recognition. Mol. Microbiol. 26:867-876.
Hesselman, K., and P. Aman. 1986. The effect of B-glucanase on the utilization of starch and
nitrogen by broiler chickens fed on barley of low or high viscosity. Anim. Feed Sci.
Technol. 15:83-93.
Hofshagen, M., and H. Stenwig. 1992. Toxin production by Clostridium perfringens isolated
from broiler chickens and capercaillies with and without necrotizing enteritis. Avian
Dis. 36:837-843.
Immerseel, F.V., J.I. Rood, R. Moore, and R. Titball. 2009. Rethinking our understanding of
the pathogenesis of necrotic enteritis in chickens. Trends Microbiol. 17:32-36
Immerseel, F.V., J.D. Buck, F. Pasmans, G. Huyghebaert, F. Haesebrouck, and R. Ducatelle.
2004. Clostridium perfringens in poultry: an emerging threat for animal and public
health. Avian Pathol. 33:537-549.
27
Jia,W., B. A. Slominski, H. L. Bruce, G. Blank, G. Crow, and O. Jones. 2009. Effects of diet
type and enzyme addition on growth performance and gut health of broiler chickens
during subclinical Clostridium perfringens challenge. Poult. Sci. 88:132-140.
Keyburn, A.L., T. L. Bannam, R. J. Moore, and J. I. Rood. 2010. NetB, a pore-forming toxin
from necrotic enteritis strains of C. perfringens. Toxins 2:1913-1927.
Keyburn, A.L., J.D. Boyce, P. Vaz, T. Bannam, M. Ford, D. Parker, A.Rubbo, J. Rood, and
R.J. Moore. 2008. NetB, a new toxin that is associated with avian necrotic enteritis
caused by Clostridium perfringens. Plos Pathog. 4:01-11.
Keyburn, A.L., S. Sheedy, M. Ford, M. Williamson, M. Awad, J. Rood, and R.J. Moore.
2006. Alpha-toxin of Clostridium perfringens is not an essential virulence factor in
necrotic enteritis in chickens. Infect. Immun. 74:6496-6500.
Kmet, V., M. Stachova, R. Nemcova, Z. Jonecova, and A. Laukova. 1993. The interaction of
intestinal microflora with avian enteric pathogens. Acta Veterinaria 62:S87-S89.
Langhout, D.J., J.B. Schutte, P.V. Leeuwen, J. Wiebenga, and S. Tamminga. 1999. Effect of
dietary high and low mthylated citrus pectin on the activity of the ileal microflora and
morphology of the small intestinal wall of broiler chicks. Br. Poult. Sci. 40:340-347.
Lawlor, P.G., P.B. Lynch, P.J. Caffrey, J.J O’Reilly, and M.K. O’Connel. 2005.
Measurements of the acid-binding capacity of ingredients used in pig diets. Irish Vet.
J. 58:447-452.
Lee, K.W., H.S. Lillehoj, M.S. Park, S.I. Jang, G.D. Ritter, Y.H. Hong, W. Jeong, H.Y
Jeoung, D.J. An, and E.P. Lillehoj. 2012. Clostridium perfringens alpha-toxin and
netB toxin antibodies and their possible role in protection against necrotic enteritis
and gangrenous dermatitis in broiler chickens. Avian Dis. 56:230-233.
28
Lee, K.W., H.S. Lillehoj, W. Jeong, H.Y. Jeoung, and D.J. An. 2011. Avian necrotic
enteritis: experimental models, host immunity, pathogenesis, risk factors, and vaccine
development. Poult. Sci. 90:1381-1390.
Lillejoh, H., and J. Trout. 1996. Avian gut-associated lymphoid tissues and intestinal immune
responses to Eimeria parasites. Clin. Microbiol. Rev. 9:349-360.
Lovland, A., M. Kaldhusdal, K. Redhead, E. Skjerve, and A. Lillehaug. Maternal vaccination
against subclinical necrotic enteritis in broilers. Avian Pathol. 33:83-92.
Maenz,D.D., C. M. Engele-Schan, R. W. Newkirk, and H. L. Classen. 1999. The effect of
minerals and mineral chelators on the formation of phytase resistant and phytase-
susceptible forms of phytic acid in solution of canola mean. Anim. Feed Sci. Technol.
81:177-192.
Manangi, M. K. and C. N. Coon. 2008. Phytate phosphorus hydrolysis in broilers in response
to dietary phytase, calcium, and phosphorus concentrations. Poult. Sci. 87:1577-1586.
McClane, B. 2001. Clostridium perfringens. Pages 351 – 372 in Food microbiology:
fundamentals and frontiers. 2nd edition. Doyle, M. P., L. R. Beuchat and T. J.
Montville (eds.). ASM Press: Washington DC.
McCuaig, L. W., M. I. Davis, and I. Motzok. 1972. Intestinal alkaline phosphatases and
phytase of chicks: effect of dietary magnesium, calcium, phosphorus and thyroactive
casein. Poult. Sci. 51:526-530.
McDevitt, R.M., J.D. Brooker, T. Acamovic, and N.H.C. Sparks. 2006. Necrotic enteritis: a
continuing challenge for the poultry industry. World’s Poult. Sci. J. 62:221-247.
29
McDougald, L. 2008. Protozoal infections. Pages 974-990 in Diseases of Poultry. 12th
edition. Y. M. Saif, A. M. Fadly, J. R. Glisson, L. McDougald, L. K. Nolan, and D. E.
Swayne ed. Wiley-Blackwell Publishing, Ames, IA.
McReynolds, J.L., J. A. Byrd, R. C. Anderson, R. W. Moore, T. S. Edrington, K. J.
Genovese, T. L. Poole, L. F. Kubena, and D. J. Nisbet. 2004. Evaluation of
immunosupressants and dietary mechanisms in an experimental disease model for
necrotic enteritis. Poult. Sci. 83:1948-1952.
Moreau,H. G. Pieroni, C. Jolivet-Reynaud, J.E. Alouf, and R. Verger. 1988. A new kinetic
approach for studying phospholipase C (Clostridium perfringens alpha-toxin) activity
on phospholipid monolayers. Biochemistry 27:2319-2323.
Mullaney, E.J., C.B. Daly, and A.H.J. Ullah. 2000. Advances in phytase research. Adv. Appl.
Microbiol. 47:157-199.
National Research Council. 1994. Nutrient requirements of poultry. 9th rev. ed. National
Academy Press, Washington, DC.
Olkowski, A.A., C. Wojnarowicz, M. Chirino-Tejo, M.D. Drew. 2006.Responses of broiler
chickens orally challenged with Clostridium perfringens isolated from field cases of
necrotic enteritis. Res. Vet. Sci. 81:99-108.
Opengart., K. 2008. Necrotic enteritis. Pages 872-877 in Diseases of Poultry. 12th edition. Y.
M. Saif, A. M. Fadly, J. R. Glisson, L. McDougald, L. K. Nolan, and D. E. Swayne
ed. Wiley-Blackwell Publishing, Ames, IA.
Perney, K.M., A. H. Cantor, M.L. Straw, and K.L. Herkelman. 1993. The effect of dietary
phytase on the growth performance and phosphorus utilization of broiler chicks.
Poult. Sci. 72:2106-2121.
30
Petit, L., M. Gibert, and M.R. Popoff. 1999. Clostridium perfringens: toxinotype and
genotype. Trends Microbiol. 7:104-110.
Pirgozliev, V., O. Oduguwa, T. Acamovic, and M. R. Bedford. 2007. Diets containing
Escherichia coli-derived phytase on young chickens and turkeys: Effects on
performance, metabolizable energy, endogenous secretions, and intestinal
morphology. Poult. Sci. 86:705-713.
Plumstead, P. W., A. B. Leytem, R. O. Maguire, J. W. Spears, P. Kwanyuen, and J. Brake.
2008. Interaction of calcium and phytate in broiler diets.1. Effects on apparent
prececal digestibility and retention of phosphorus. Poult. Sci. 87:449-458.
Powell, S., T. D. Bidner, and L. L. Southern. 2011. Phytase supplementation improved
growth performance and bone characteristics in broilers fed varying levels of dietary
calcium. Poult. Sci. 90:604-608.
Qian, H., E. T. Kornegay, and D. M. Denbow. 1997. Utilization of phytate phosphorus and
calcium as influenced by microbial phytase, cholecalciferol and the calcium:total
phosphorus ratio in broiler diets. Poult. Sci. 76:37-46.
Ravindran, V., W.L. Bryden, and E.T. Kornegay. 1995. Phytates: occurrence, bioavailability
and implications in poultry nutrition. Poult. Avian Biol. Rev. 6:125-143.
Riddel, C, and X.M. Kong. 1992. The influence of diet on necrotic enteritis in broiler
chickens. Avian Dis. 36:499-503.
Rutherfurd, S.M., T.K. Chung, D.V. Thomas, M.L. Zou, and P.J. Moughan. 2012. Effect of a
novel phytase on growth performance, apparent metabolizable energy, and the
availability of minerals and amino acids in a low-phosphorus corn-soybean meal diet
for broilers. Poult. Sci. 91:1118-1127.
31
Salarmoini, M., G.L. Campbell, B.G. Rossnagel, and V. Raboy. 2008. Nutrient retention and
growth performance of chicks given low-phytate conventional or hull-less barleys.
Br. Poult. Sci. 49:321-328.
Sandberg, A. S., T. Larsen, and B. Sandstrom. 1993. High dietary calcium levels decrease
colonic phytate degradation in pigs. J. Nutr. 123:559-566.
Sakurai, J., M. Nagahama, and M. Oda. 2004. Clostridium perfringens alpha-
toxin:characterization and mode of action. J. Biochem. 136:569-574.
Sebastian, S., S. P. Touchburn, E. R. Chavez, and P. C. Lague. 1996 a. The effects of
supplemental microbial phytase on the performance and utilization of dietary
calcium, phosphorus, copper and zinc in broiler chickens fed corn-soybean meal
diets. Poult. Sci. 75:729-736.
Sebastian, S., S. P. Touchburn, E. R. Chavez, and P. C. Lague. 1996 b. Efficacy of
supplemental microbial phytase at different dietary calcium levels on growth
performance and mineral utilization of broiler chickens. Poult. Sci. 75:1516-1523.
Selle, P. H., A. J. Cowieson, and V. Ravindran. 2009. Consequences of calcium interaction
with phytate and phytase for poultry and pigs. Livest. Sci. 124:126-141.
Selle, P. H., and V. Ravindran. 2007. Microbial phytase in poultry nutrition. A review. Anim.
Feed Sci. Technol. 135:1-41.
Selle, P.H., V. Ravindran, R. A. Caldwell, and W. L. Bryden. 2000. Phytate and phytase:
consequences of protein utilization. Nutr. Res. Rev. 13:255-278.
Setlow, P., and E. A. Johnson. 2001. Spores and their significance. Pages 33 – 70 in Food
microbiology: fundamentals and frontiers. 2nd edition. Doyle, M. P., L. R. Beuchat
and T. J. Montville (eds.). ASM Press: Washington DC.
32
Shafey, T. M., M. W. McDonald, and J. G. Dingle. 1991. The effects of dietary calcium and
available phosphorus concentration on digesta pH and on the availability of iron,
calcium, magnesium and zinc from the intestinal content of meat chickens. Br. Poult.
Sci. 32:185-194.
Smith, L. D. S. 1992. The genus Clostridium - medical. Pages 1867-1878 in The Prokaryotes
: a handbook on the biology of bacteria: ecophysiology, isolation, identification,
applications, Vol II. 2nd ed. Balows, A., H. G. Truper, M. Dworkin, W. Harder and K.
Schleifer(eds.). Springer-Verlag New York Inc: New York, NY.
Songer, J.G. 1996. Clostridial enteric diseases of domestic animals. Clin. Microbiol. Rev.
9:216-234.
Tamim, N. M., R. Angel, and M. Christman. 2004. Influence of dietary calcium and phytase
on phytate phosphorus hydrolysis in broiler chickens. Poult. Sci. 83:1358-1367.
Timbermont, L., F. Haesebrouck, R. Ducatelle, and F.V. Immerseel. 2011. Necrotic enteritis
in broilers: an updated review on the pathogenesis. Avian Pathol. 40:341-347.
Titball, R., C. Naylor, and A. Basak. 1999. The Clostridium perfringens alpha-toxin.
Anaerobe 5:51-64.
Tsiouris, V., I. Georgopoulu, C. Batzious, N. Papaioannou, P. Fortomaris, and R. Ducatelle.
2009. Effects of heat stress on the pathogenesis of necrotic enteritis in broiler
chickens. Pages 149-153 in Proc. 2nd Mediterranean Summit of World’s Poult. Sci.
Assoc., Antalaya, Turkey.
Van der Sluis, W. 2000 Clostridial enteritis is an often underestimated problem. World’s
Poult. Sci. J. 16:42-43.
33
Waldroup, P.W. 1999. Nutritional approaches to reducing phosphorus excretion by poultry.
Poult. Sci. 78:683-691.
Walk, C., A. J. Cowieson, J. C. Remus, C. L. Novak, and A. P. McElroy. 2011. Effects of
dietary enzymes on performance and intestinal goblet cell number of broilers exposed
to a live coccidia oocyst vaccine. Poult. Sci. 90:91-98.
Ward, A.T., and R.R. Marquardt. 1987. Antinutritional activity of a water-soluble pentosan-
rich fraction form rye grain. Poult. Sci. 66:1665-1674.
Williams, R. B. 2005. Intercurrent coccidiosis and necrotic enteritis of chickens: rational,
integrated disease management by maintenance of gut integrity. Avian Pathol.
34:159-180.
Wise, A. 1983. Dietary factors determining the biological activities of phytase. Nutr. Abstr.
Rev. 53:791-806.
Wrigley, D. M. 2001. Clostridium perfringens. Pages 139 – 168 in Foodborne disease
handbook. Vol I: Bacterial pathogens. 2nd edition. Hui, H. Y., M. D. Pierson and J. R.
Gorham (eds.). Marcel Dekker Inc.: New York, NY.
Yan, F., J. H. Kersey, C. A. Fritts, and P. W. Waldroup. 2006. Effect of phytase
supplementation on the calcium requirement of broiler chicks. Int. J. Poult. Sci.
5:112-120.
34
Chapter III: Influence of calcium, phosphorus and phytase on bird performance,
intestinal morphology, mineral digestibility and bone ash during a natural necrotic
enteritis episode
ABSTRACT
Diet composition and nutrient balance have a critical impact on intestinal integrity during
exposure to enteric pathogens. The objective of this study was to evaluate dietary Ca, P, and
phytase on performance, intestinal morphology, bone ash, and Ca and P digestibility during a
necrotic enteritis (NE) outbreak. Day-old, Cobb 500 male broilers were weighed and
randomized into 8 treatment groups (9 pens/treatment; 32 birds/pen). The 35 d trial was
designed as a 2 x 2 x 2 factorial, which included 2 levels (0.6% and 0.9%) of a highly soluble
Ca source, 2 levels of available P (0.3% and 0.45%), and 2 levels of an E. coli phytase (0 and
1,000 FTU/kg). Birds were placed on litter from a previous flock that exhibited clinical signs
of NE. Birds and feed were weighed on d 12, 19 and 35, and body weight (BW), BW gain
(BWG), feed intake (FI), and feed conversion (FC) were calculated for each of these periods
and cumulatively. Mortality was recorded daily, and pH of the gizzard, duodenum and
jejunum was measured, and tibias and ileal digesta were collected. Birds began exhibiting
clinical signs of NE on d 9 and elevated NE-associated mortality persisted until d 26. Dietary
Ca supplemented at 0.9% or 1000 FTU/kg phytase significantly increased mortality
compared to 0.6% Ca or 0 FTU/kg phytase, respectively. FI and FC were affected by a Ca x
P interaction. From d 0-19, birds fed diets with 0.9% Ca and 0.3% avP had decreased FI and
improved FC compared to birds fed 0.9% Ca and 0.45% avP, while FI and FC were similar
in birds fed diets with 0.6% Ca regardless of P level. Calcium x P x phytase influenced BW
or BWG from d 0-12. In general, birds fed 0.9% Ca and 0.45% avP with phytase were
35
heavier compared to birds fed 0.6% Ca, 0.45% avP, and phytase. Calcium at 0.9% increased
gizzard (d 19) and jejunum (d 12) pH. Dietary Ca supplemented at 0.9%, P supplemented at
0.45%, and 1,000 FTU/kg phytase significantly increased tibia ash weight compared to 0.6%
Ca, 0.3% avP, and 0 FTU/kg phytase, respectively, on d 12. Tibia ash % was influenced by a
3-way interaction on d 35; birds fed diets supplemented with 0.9% Ca and 0.45% avP had a
significant increase in tibia ash percentage, regardless of phytase supplementation. A 3-way
interaction was also observed for Ca and P digestibility on d 35. Phytase supplementation
significantly increased Ca digestibility regardless of Ca and P levels of the diets. In addition,
diets containing 0.6% Ca and 1,000 FTU/kg of phytase resulted in a significant increase in P
digestibility, regardless of P levels. The results suggest a high level of soluble Ca in the diet
may influence NE associated mortality. In addition, bird performance was affected by
interactions of Ca, P and phytase during the exposure to C. perfringens and subsequent NE
outbreak. Results showed improvements in Ca and P digestibility in birds fed lower dietary
levels of Ca and P and phytase, which was likely consequent to improved performance when
feeding lower Ca diets during the NE episode.
INTRODUCTION
Necrotic enteritis (NE) is an important enterotoxemia that affects poultry and is
caused by Clostridium perfringens types A and C (Wages and Opengart, 2003; Williams,
2005). Although the pathogenesis of NE is still not completely understood, alpha toxin is
considered to be one of the main contributors to lesion formation associated with the disease
(Cooper and Songer, 2009; Lee et al., 2011). The alpha toxin is a phospholipase that acts on
the enterocyte membrane causing extensive damage to the intestinal lining and inducing a
severe inflammatory response (Titball et al., 1999; Immerseel et al., 2004; Sakurai et al.,
36
2004). However, the participation of the alpha toxin in disease production is a controversial
topic, since NE can be reproduced by inoculating birds with C. perfringens isolates that do
not produce alpha toxin (Keyburn et al., 2006). NetB is another toxin that has been associated
with NE. NetB is a toxin that forms pores in the cellular membrane causing an influx of ions
(Ca, Na, Cl, etc) that eventually lead to osmotic cell lysis (Keyburn et al., 2010).
Damaged intestinal mucosa, which is unable to digest and absorb nutrients, is one of
the hallmarks of NE. Therefore, performance losses can be associated with a reduction in
feed conversion (FC), feed intake (FI), body weight (BW) and body weight gain (BWG). It
has been estimated that losses in performance, treatment, prevention and control of the
disease cost the poultry industry approximately 2 billion dollars annually (Cooper and
Songer, 2009; Lee et al., 2011). The use of growth promoting antibiotics in poultry feed has
helped control this disease in commercial production settings (Immerseel et al., 2004).
However, with impending antimicrobial bans, and consumer preferences for medication free
production systems, the incidence of NE has significantly increased over the last few years
(Williams, 2005).
Pre-disposing factors for NE development are extremely important, given that C.
perfringens is a naturally occurring bacterium in the intestinal tract of poultry. Several
factors have been identified that influence the onset of NE including: coccidiosis (Williams,
2005), dietary crude protein level and source (Drew et al., 2004; Palliyeguru et al., 2010),
and high dietary Ca (Titball et al., 1999). These factors usually favor disease onset by
producing intestinal lesions and promoting clostridial growth in the gut. One of the
predisposing factors identified in the past is excess Ca in the diet, but the mechanism by
which Ca favors C. perfringens is unknown. However, it is believed that excess Ca may
37
increase intestinal pH (Selle et al., 2009; Walk et al., 2012b) and favor C. perfringens growth
in a more neutral environment (Wages and Opengart, 2003; Williams, 2005). Additionally,
Ca is required for the synthesis and activity of the alpha toxin, and excess dietary Ca may
exacerbate damage to the intestinal lining (Titball et al., 1999) during a C. perfringens
outbreak.
The most recent published guidelines for nutrient requirements for poultry (NRC,
1994) suggest that the Ca requirement for growing broilers is 1.0% from d 0 to 21, 0.9%
from d 21 to 42, and 0.8% from d 42 to 56. However, the experiments used to determine Ca
requirement for broilers were not conducted with the supplementation of phytase in the diet
(NRC, 1994). In the intestinal lumen, Ca must be soluble in order to be absorbed. Phytate
can precipitate with Ca, particularly at conditions within the small intestine, creating
insoluble Ca-phytate complexes (Selle et al., 2009). Phytate is a naturally occurring anti-
nutrient in plants, with the highest concentration found in grains and seeds (Tamim et al.,
2004). When pH is close to neutrality, phytate forms mineral chelates that are highly
insoluble (Sebastian et al., 1996; Tamim et al., 2004; Selle et al., 2009) and maximum
insolubility of phytate-mineral chelates occurs between pH 4 and 7 (Wise and Gilburt, 1981).
Calcium is one of the divalent cations with lowest affinity for phytate (Tamim et al., 2004).
However, since Ca is the mineral added at the highest concentration in poultry diets, it has a
greater impact on forming phytate-mineral chelates due to its plentiful availability in the
intestinal environment (Sebastian et al., 1996; Maenz et al., 1999; Selle et al., 2009), making
both Ca and P unavailable for absorption.
In order to minimize the detrimental effects of phytate, phytases have been used by
poultry nutritionists since 1991 to formulate diets for broilers (Bedford, 2003). Phytase is a
38
phosphatase that hydrolyzes the phosphate groups from the inositol ring of phytate (Tamim
et al., 2004). As phytase hydrolyzes phytate, it increases nutrient availability and
digestibility, which results in improved bird performance (Cowieson et al., 2006). Several
authors have reported that elevated levels of Ca in the diet decreased phytase efficacy
(Applegate et al., 2003; Tamim et al., 2004; Yan et al., 2006; Plumstead et al., 2008).
Applegate and collaborators (2003) reported that a dietary Ca level commonly used in broiler
diets (0.9%) resulted in a reduced intestinal phytase activity and apparent ileal phytate
phosphorus hydrolysis compared with a lower level of Ca (0.4%). A high Ca to total P ratio
appeared to exacerbate this effect, by increasing the formation of mineral-chelate complexes
and decreasing phytase activity (Qian et al., 1997; Tamim et al., 2004).
Benefits from formulating broiler diets with lower levels of Ca are indicated by
improvements in performance of healthy birds. Sebastian et al. (1996) were one of the first
groups to challenge the NRC (1994) recommended Ca levels in diets supplemented with
phytase. In their study, efficacy of supplemental phytase was significantly affected by
dietary Ca levels, and the optimal growth performance and retention of P and Ca was
achieved at the lowest level of dietary Ca tested (0.6% total Ca). Similar performance
benefits were observed by several other authors (Tamim et al., 2004; Selle et al., 2009;
Powell et al., 2011). Considering the improved performance with lower Ca levels and the
proposed involvement of Ca in NE pathogenesis, we designed an experiment to evaluate the
effects of dietary Ca, P and phytase levels on broiler performance, gastrointestinal
morphology, mineral digestibility and bone mineralization during a natural NE outbreak.
39
MATERIALS AND METHODS
Animals and Animal Husbandry
Cobb 500 male broilers (n = 2,304) were acquired from a commercial hatchery and
placed on used litter from a previous flock that had presented clinical signs of NE. Prior to
the start of this trial, litter was removed from each pen and mixed together. Mixed litter was
equally distributed to pens, and fresh pine shavings were layered on top of the mixed used
litter. At day-of-hatch, birds were randomized, weighed by pen, and placed into floor pens
relative to the different treatment groups from d 0 to 35. Feed and water were administered
ad libitum throughout the study. The birds were housed in an environmentally controlled
building under a lighting program recommended for Cobb 500 broilers.
Experimental Diets
Diets were formulated to meet or exceed NRC (1994) recommended nutrient levels,
with the exception for Ca and P. Experimental diets constituted of a 2 x 2 x 2 factorial
design with 2 total Ca levels (0.9% or 0.6%), 2 levels of available P (avP; 0.45% or 0.3%),
and 2 levels of phytase (0 or 1,000 FTU/kg). Each dietary treatment was replicated by 9 pens
(n=32 birds per pen). The phytase used was an Escherichia coli 6-phytase expressed in
Trichoderma reesei with an expected activity of 5,000 FTU/g (Quantum Blue, AB Vista
Feed Ingredients, Marlborough UK). Calcium was supplemented in the diets as a
combination of dicalcium phosphate and a highly soluble calcified marine seaweed (Vistacal,
AB Vista Feed Ingredients, Marlborough, UK). Diets were analyzed for Ca, total P, and
recovered phytase activity, and results were comparable to formulated diets (Table 1). Birds
were fed crumbled starter diets from d 0-19 and pelleted grower diets from d 19-35.
40
Animal Performance
On d 12, 19, and 35, birds and feed were weighed by pen to calculate average BW,
BWG, FI, and FC for the periods of d 0-12, d 0-19, and d 0-35. Mortality was recorded daily
and used to adjust FI and FC according to bird days.
Intestinal Morphology
On d 12, 19, and 35, tissue samples from the duodenum, jejunum and ileum from 1
bird per pen (n=9 per treatment) were collected for villus height and crypt depth
measurement. Intestinal segments of approximately one inch were rinsed using phosphate
buffered saline and fixed in 10% neutral buffered formalin. Each intestinal segment was cut
into five pieces, stored in 70% ethanol, processed, embedded in paraffin, and mounted on
slides. Slides were then stained using hematoxylin eosyn protocol (Luna, 1968). A total of
three cross-sections per slide and four measurements per cross-section were evaluated for
villus height and crypt depth. Cross-sections were evaluated using a bright-field microscope,
and measurements were made using NIS-Elements 3.0 software (Nikon Instruments Inc.,
Melville, NY).
Ca and P Digestibility
On d 12 (n=6 birds/pen), 19 (n=5 birds/pen), and 35 (n=5 birds/pen), birds were
sacrificed by cervical dislocation, and ileal digesta (defined as Meckel’s diverticulum to the
ileal cecal junction) was sampled, pooled per pen, and frozen at -80°C. Frozen digesta
samples were freeze dried and ground (mm screen) prior to mineral analysis. Diet and digesta
samples were wet ashed using nitric and perchloric acids. Phosphorus was determined by the
alkalimeter ammonium molybdate method, and color intensity was read using a
spectrophotometer measuring absorbance at 410 nm (AOAC International, 2000). Calcium
41
was determined using flame atomic absorption spectroscopy (AOAC International, 2000).
Titanium oxide was added to the experimental diets as an indigestible marker, and was
determined using a colorimetric method previously described by Short et al. (1996). All
samples (Ca, P and titanium) were assayed in duplicates. Calcium and P apparent illeal
digestibility (AID) was calculated using the following equation:
AID = [(nutrient/TiO2)diet - (nutrient/TiO2)ileum ]/ (nutrient/TiO2)diet
Bone Ash
On d 12, 19, and 35, left tibias from 3 birds/pen were collected, and kept frozen
(-20°C) with flesh intact until further analysis. Before analysis, bones were cleaned of all
adherent tissue, wrapped in cheese-cloth, and dried at 100°C for 24 h. Using a Soxhlet
extraction apparatus, fat was extracted from bones for 48 h in ethyl ether. Fat-extracted tibias
were oven dried at 100°C for 24 h, then ashed at 600°C in a muffle furnace for 24 h for bone
ash determination (weight and percentage).
pH
On d 12, 19, and 35, 2 birds/pen of average BW were killed to obtain measurements
of pH from the gizzard, duodenum, and jejunum. Following cervical dislocation, pH
measurements were obtained directly from the digesta contents in the lumen using a digital
pH meter (Mettler-Toledo, Columbus, OH) and spear-tip electrode (Sensorex, Garden Grove,
CA). The pH values from each gastrointestinal section/bird were then pooled to obtain a
mean pH value/pen.
Statistical Analysis
Data were analyzed as a 2 x 2 x 2 factorial using the fit model platform in JMP 9.0
(SAS Institute Inc., Cary, NC) and means were separated using Tukey’s honestly significant
42
difference test. Pen served as the experimental unit for performance measurements, nutrient
digestibility, and gastrointestinal pH, and bird was the experimental unit for histological
measurements. Data were analyzed for main effects (Ca, P, and phytase) and for the
interaction of main effects. Statistical significance was accepted at P < 0.05. P-values of
mortality data are reported as squared arcsine transformed percent mortality data.
RESULTS
Performance
The flock first presented clinical signs of NE on d 9 and no signs of NE were
observed after d 26. Broilers fed diets supplemented with phytase had significantly higher
mortality than broilers fed diets not supplemented with phytase for all periods (Table 2). In
addition, birds fed diets containing industry standard levels of Ca (0.9%) presented
significantly higher mortality than birds fed lower levels of Ca (0.6%) from d 0-19 and 0-35
but no effect of Ca was reported from d 0-12 (Table 2). Mortality was not influenced by
dietary levels of P, regardless of feeding period, and no interactions were seen.
A 3-way interaction (Ca x P x phytase) occurred for BW and BWG from d 0-12
(Table 3). There was no difference in BW or BWG when birds were fed 0.45% avP with or
without phytase, regardless of Ca level. However, when diets were formulated with 0.3%
avP, supplementation with phytase significantly improved BW and BWG compared to diets
without phytase (Table 3). Additionally, 0.9% Ca, 0.45% avP, and phytase diets significantly
improved BW and BWG compared to those with 0.6% Ca, 0.45% avP, and phytase, while
responses were similar across Ca levels with all other treatments (Table 3). No differences in
BW or BWG were observed from d 0-19 or d 0-35.
43
A 2-way interaction (Ca x P) was observed for FI from d 0-12 and d 0-19 (Table 4).
In these feeding periods, when broilers were fed 0.9% Ca diets, P was a limiting nutrient for
FI. The same effect was not observed for broilers fed 0.6% Ca diets, where no differences in
FI were observed between broilers fed 0.3 or 0.45% avP in the diet. No differences in FI
related to P levels were observed from d 0-35. Phytase had no effect on FI for the different
feeding periods.
Feed conversion was significantly affected by Ca or phytase from d 0-12, but P had
no effect during that period (Table 4). A six-point improvement in FC was observed for
broilers fed diets supplemented with phytase compared to no phytase supplementation, and a
two-point improvement in FC was observed for birds fed 0.9% Ca diets compared to birds
fed 0.6% Ca diets. A 2-way interaction between Ca and P occurred for FC from d 0-19.
When birds were fed 0.6% Ca diets, FC was similar regardless of P levels (0.3 or 0.45%);
however, when birds were fed 0.9% Ca diets, broilers fed 0.3% avP were significantly more
efficient than those fed 0.45% avP. Phytase supplementation had no significant impact on FC
from d 0-19 or d 0-35.
Histology
Duodenum. On d 12, dietary levels of Ca influenced villus height (VH) and crypt
depth (CD) in the duodenum. Villi were significantly longer and crypts were significantly
shallower when birds were fed 0.6% Ca diets compared to birds fed 0.9% Ca diets (Table 5).
Villus height to crypt depth ratio (VCR) was influenced by a Ca x P interaction. Broilers fed
0.6% Ca and 0.45% avP diets had significantly greater VCR than those fed 0.9% Ca diets,
regardless of P levels (Table 5).
44
On d 19, VH was not influenced by Ca, P, or phytase. However, a 3-way interaction
of Ca, P, and phytase influenced CD and VCR. Broilers fed 0.9% Ca had significantly deeper
crypts than those fed 0.6% Ca, regardless of P levels or phytase supplementation (Table 5),
with the exception of those fed 0.6% Ca and 0.3% avP diets that were not supplemented with
phytase. Within the 0.6% or 0.9% Ca dietary treatments, VCR was similar regardless of P
levels or phytase supplementation. VCR was also similar between the 0.6% and 0.9% Ca
diets, with the exception of the birds fed 0.6% Ca, 0.3% avP with phytase and 0.6% Ca,
0.45% avP without phytase, which had significantly higher VCR than those respective P and
phytase groups fed 0.9% Ca (Table 5).
On d 35, birds fed diets supplemented with phytase had significantly shorter villi
compared to birds fed diets without phytase (Table 5). Broilers fed 0.9% Ca diets had
significantly deeper crypts than broilers fed 0.6% Ca diets, as did those fed 0.3% avP
compared to those fed 0.45% avP diets. A 2-way interaction of Ca and P influenced VCR.
Broilers fed 0.6% Ca and 0.45% avP diets had significantly higher VCR than those fed 0.6%
Ca and 0.3% avP diets, while there was no difference between these groups when birds were
fed 0.9% Ca diets (Table 5).
Jejunum. On d 12, no significant differences in VH, CD or VCR in the jejunum were
observed among the different treatments (Table 6). However, on d 19, a 3-way interaction
between Ca, P, and phytase influenced CD and VCR (Table 6). Similar to results in the
duodenum, broilers fed 0.9% Ca had significantly deeper crypts than broilers fed 0.6% Ca,
except when they were fed 0.6% Ca and 0.3% avP diets that were not supplemented with
phytase. The VCR was similar between P levels with or without phytase within the dietary
45
Ca levels, with the exception of a difference between birds fed 0.6% Ca and 0.3% avP where
phytase inclusion resulted in a larger VCR is compared to no phytase inclusion (Table 6).
On d 35, VH was significantly influenced by phytase supplementation. Villi of birds
fed diets not supplemented with phytase were significantly longer than villi of birds fed diets
supplemented with phytase. A Ca x P interaction significantly affected CD on d 35; whereas
feeding 0.9% Ca and 0.45% avP diets resulted in significantly deeper crypts than birds fed
0.6% Ca 0.45% avP diets. In addition, 0.6% Ca diets resulted in greater VCR than 0.9% Ca
diets.
Ileum. On d 12 in the ileum, broilers fed diets supplemented with phytase had
significantly longer villi than those fed diets not supplemented with phytase (Table 7). Also,
feeding 0.45% avP diets resulted in significantly greater VCR than 0.3% avP diets. No
differences in CD were observed in the ileum on d 12.
On d 19, dietary levels of Ca significantly affected ileal CD. Broilers fed 0.6% Ca
diets had significantly shallower crypts than those fed 0.9% Ca diets (Table 7). A Ca x P
interaction significantly influenced VCR on d 19. Broilers fed 0.6% Ca and 0.45% avP diets
had significantly greater VCR than broilers fed 0.9% Ca diets regardless of P levels (Table
7). No significant differences in ileal VH were observed among different treatments on d 19.
On d 35, a Ca x phytase interaction significantly affected VH and CD (Table 7).
When diets were not supplemented with phytase, broilers fed 0.6% Ca diets had significantly
higher villi than those fed 0.9% Ca. However, feeding 0.6% Ca diets supplemented with
phytase resulted in significantly shallower crypts than broilers fed diets not supplemented
with phytase, regardless of Ca levels. Dietary levels of P and phytase supplementation had a
significant impact on VCR. Broilers fed 0.45% avP had significantly greater VCR than
46
broilers fed 0.3% avP in the diet, and broilers fed diets supplemented with phytase had
significantly greater VCR than those fed diets not supplemented with phytase.
Ca and P Digestibility
On all three sampling days, phytase supplementation in 0.6% Ca diets significantly
improved P digestibility regardless of P levels in the diet when compared to the diets not
supplemented with phytase (Table 8). However, when diets were formulated with 0.9% Ca,
improvements from phytase supplementation were not as consistent. On d 12, phytase
supplementation had no effect on P digestibility in diets with 0.9% Ca and 0.45% avP (Table
8). On d 19 and 35, no differences in P digestibility were seen with phytase supplementation
in broilers fed diets with 0.9% Ca and 0.3% avP.
On d 12, an interaction of P and phytase influenced Ca digestibility. Phytase
supplementation to 0.3% avP diets significantly improved Ca digestibility, but a similar
improvement was not seen in diets with 0.45% avP with phytase supplementation (Table 8).
On d 12 and 19, a Ca and phytase interaction influenced Ca digestibility (Table 8). On both
days, Ca digestibility was significantly lower when broilers were fed 0.6% Ca diets without
phytase compared to those with phytase. In contrast, phytase supplementation did not
improve Ca digestibility when broilers were fed 0.9% Ca. On d 35, a 3-way interaction (Ca,
P and phytase) influenced Ca digestibility. When birds were fed 0.6% Ca diets, phytase
supplementation resulted in significantly higher Ca digestibility when diets contained 0.3%
avP, but phytase supplementation did not resulted in any difference when diets were
formulated with 0.45% avP. In contrast, when diets were formulated with 0.9% Ca, phytase
supplementation significantly improved Ca digestibility with the 0.45% avP diets, but not
with the 0.3% avP diets.
47
Tibia Ash
On d 12, no interactions influenced tibia ash weight or percentage. However, Ca and
phytase independently significantly affected tibia ash. Broilers fed 0.9% Ca diets had greater
ash weight and ash percentage when compared to broilers fed 0.6% Ca diets (Table 9). In
addition, phytase supplementation significantly improved ash weight on d 12, but not ash
percentage. On d 19, Ca, P or phytase had no effect on tibia ash or tibia ash weight. A 3-way
interaction (Ca, P and phytase) influenced tibia ash percentage on d 35. Maximum tibia ash
percentage was observed when birds were fed 0.9% Ca and 0.45% avP in the diets,
regardless of phytase supplementation. Phytase supplementation improved tibia ash
percentage in broilers fed 0.9% Ca and 0.3% avP. However, the improvements on tibia ash
percentage from phytase supplementation were not observed with the 0.9% Ca and 0.45%
avP diets, or any 0.6% Ca diets. On d 35, tibia ash weight was influenced only by dietary
levels of Ca with 0.9% Ca in the diet resulting in significantly greater tibia ash weight than
0.6% Ca in the diet.
pH
The gizzard of broilers fed 0.6% Ca diets was significantly more acidic than the
gizzard of broilers fed 0.9% Ca on d 19 (Table 10). Phytase supplementation increased
gizzard pH on d 35. Phosphorus had no impact on gizzard pH, regardless of the day.
Dietary Ca or phytase had no impact on duodenal pH regardless of sampling day.
However, on d 35, the duodenum of broilers fed diets formulated with 0.3% avP was
significantly more acidic than the duodenum of broilers fed 0.45% avP diets (Table 10).
48
The jejunum of birds fed 0.6% Ca diets was significantly more acidic on d 12 and 35
than the jejunum of birds fed 0.9% Ca diets (Table 10). Phosphorus or phytase had no effect
on jejunal pH regardless of sampling day.
DISCUSSION
Dietary Ca or phytase had a significant impact on mortality due to NE. Dietary Ca
levels might be affecting mortality by two different mechanisms. The first mechanism is that
Ca levels affect intestinal pH, especially jejunal pH. In this study, on d 12 and 35, feeding
broilers 0.9% Ca diets increased jejunal pH. Previous research showed that increasing dietary
levels of Ca in the diet significantly increased small intestine pH (Shaffey et al., 1991; Walk
et al., 2012b). This increase in pH due to Ca supplementation likely creates a more favorable
environment for clostridial growth (Williams, 2005). Therefore, standard industry level of Ca
in the diet (0.9%) might be increasing mortality due to NE by favoring clostridial growth as a
consequence to changes in lower intestine pH.
The second mechanism relates to alpha-toxin and netB synthesis and activity. Alpha-
toxin is a phospholipase C sphingomyelinase that is mineral dependant. The catalytic site of
the alpha-helical amino-terminal part of alpha toxin is zinc dependent (Guillouard et al.,
1997). However, the beta-sandwich carboxy-terminal part is homologous to eukaryotic C2
domains, which are involved in membrane interaction and phospholipid binding through a
Ca-dependent mechanism (Guillouard et al., 1997; Petit et al., 1999). Possibly, birds fed
0.9% Ca had increased mortality as a result of an increased activity of alpha-toxin. NetB
activity may also be influenced by the industry standard dietary Ca levels. NetB causes cell
lysis by creating pores in the cell membrane resulting in an influx of Ca ions to the cytoplasm
(Keyburn et al., 2010). In addition to promoting cell lysis through an osmotic imbalance, the
49
Ca influx caused by netB may also lead to a special type of programmed cell death. Kennedy
et al. (2009) reported that the pore-forming alpha-toxin of C. septicum forms Ca permeable
pores, which increase intracellular Ca. What was surprising about their findings was the fact
that the Ca influx did not induce apoptosis. Instead, the Ca influx induced a cascade of events
consistent with programmed necrosis since it was associated with calpain activation and
release of cathepsins from lysosomes. In addition, they also observed deregulation of
mitochondrial activity leading to an increase in reactive oxygen species and dramatically
decreasing ATP levels (Kennedy et al., 2009). These findings strongly suggest that cellular
death from pore-forming toxins is related to a programmed cellular necrosis.
Histology data from this trial strongly support these mechanisms leading to a higher
mortality associated with NE in broilers fed 0.9% Ca in the diet. Generally, higher levels of
Ca in the intestinal lumen led to decreases in VH and VCR, and increases in CD, especially
on d 19, which was the peak of NE outbreak. This suggests that higher levels of Ca in the
intestinal lumen exacerbates the damage to the intestinal lining during NE episodes. The
increase in Ca concentration is not only associated with higher dietary levels of Ca. Even
when feeding broilers lower levels of Ca, an increase in the inflammatory response
(supported by increased CD and decreased VH and VCR) was observed, which was probably
related to phytase supplementation. In diets without phytase, Ca tends to bind to the phytate
molecule. Birds cannot absorb phytate bound Ca, which accumulates in the intestinal lumen,
and consequently has a negative impact on intestinal morphology.
Histology data from this trial also indicated that phytase supplementation might have
a negative impact on intestinal morphology, but the negative impact may be dependant on the
pathophysiological state of the bird. Exogenous phytases release nutrients from the phytate
50
molecule regardless of the birds’ health status. When the bird is healthy, nutrients released
from the phytate molecule can be promptly digested and absorbed. However, when broilers’
ability to digest and absorb nutrients is compromised, the nutrients released from the phytate
molecule by phytase will be available to enteric pathogens. An increase in nutrient
availability to these enteric pathogens will likely favor the colonization of the intestinal
environment by undesirable microbial populations. Imbalance in the microbial population
usually results in enteric disease, which is consistent with these histological findings.
Increased mortality due to phytase supplementation is also likely secondary to an
increase in nutrient availability for C. perfringens. Intestinal damage promoted by factors
other than NE, such as coccidiosis, negatively influence the birds’ ability to utilize nutrients
making them available to be utilized by microorganisms in the gastrointestinal tract
(including C. perfringens). As previously described, once phytase releases nutrients from the
phytate molecule, phytase serves as a nutrient delivery system. Nutrients not utilized by the
bird become readily available to microorganisms in the intestines. This nutrient shuttle
promotes unbalanced growth of C. perfringens, resulting in higher mortality due to NE in
birds fed diets supplemented with phytase.
Differences in BW and BWG were observed in the initial phase of the growout
period. More important than the levels of Ca and P alone is the relationship between them.
Optimal BW and BWG were obtained when their ratio was maintained at 2:1, and as long as
the Ca:P ratio (2:1) was respected there were no differences in BWG between birds fed lower
levels of Ca and birds fed higher levels of Ca.
Performance benefits of phytase supplementation have been exhaustively reported by
previous research (Ravindran et al., 1995; Selle et al., 2009; Rutherfurd et al., 2012). The
51
importance of phytase supplementation becomes more evident when lower levels of Ca and P
are used in the diets. In this study, improvements in animal performance and nutrient
digestibility consequent to feeding broilers 0.6% Ca were only observed when these diets
were supplemented with phytase. Additionally, in this trial when broilers were fed 0.6% Ca
diets not supplemented with phytase, the worst BW, BWG and mineral digestibility were
observed. Results from this trial also indicate that phytase supplementation is essential when
using highly soluble Ca sources. Otherwise, most of the supplemented Ca binds to phytate,
forming mineral-phytate chelates that readily precipitate and become unavailable for
digestion and absorption (Plumstead et al., 2008; Selle et al., 2009). It is not surprising that
after d 19 no differences in bird performance were observed. NE causes extensive damage to
intestinal mucosa, which results in birds that are unable to digest and absorb nutrients.
Phytase supplementation improved P digestibility. Optimal P digestibility was
observed when feeding birds low levels of Ca in diets supplemented with phytase, regardless
of P levels. The reduction in P digestibility observed when birds were fed 0.9% was probably
consequent to excess Ca binding to P and precipitating. When Ca and P precipitate, they
become unavailable for digestion and absorption. This effect is exacerbated in the absence of
phytase, since excess Ca tends to form mineral-phytate chelates that precipitate in the
intestinal environment and become unavailable for the bird (Sebastian et al., 1996; Tamim et
al., 2004; Plumstead et al., 2008). In addition, when broilers were fed 0.6% Ca diets in the
absence of phytase, a reduction in P digestibility was observed. This could be attributed to
the Ca source used in this experiment. Calcium was supplemented using calcified seaweed
that has higher solubility than regular sources of Ca in pHs close to neutrality (Walk et al.,
52
2012a). In the absence of phytase, available Ca from calcified marine seaweed binds to
phytate reducing Ca and P availability to the bird.
Similar to P digestibility, phytase supplementation improved Ca digestibility.
Improvements in Ca digestibility by phytase supplementation were more evident when lower
levels of Ca and P were used in the diet. This probably results from the absence of excess
mineral that would compensate for Ca and P bound to the phytate molecule. Results from this
trial support the fact that phytase supplementation is especially important when feeding
broilers low levels of Ca in the diet. Once again, when feeding highly soluble sources of Ca,
in the absence of phytase, Ca binds to phytate and becomes unavailable for the bird. The
improvements in Ca digestibility due to feeding lower levels of Ca in the diet may also be
attributed to an increase in phytase activity. Tamim et al. (2004) reported significant
decreases in phytase activity with increasing levels of Ca concentration.
Reports on the influence of dietary Ca on gastrointestinal pH are inconsistent, which
is probably due to variability in gastrointestinal pH of broilers. The pH is highly influenced
by physiological state. Fasting is one of the factors that affect physiological state, which
consequently affects gastrointestinal pH (Winget et al., 1962; Ford, 1974). During sampling,
selecting birds that are on the same physiological state is not logistically possible, which
would cause variation. In this trial, dietary Ca levels significantly affected gastrointestinal pH
of broilers. The gizzard and jejunum of birds fed 0.6% Ca were significantly more acidic
than the same gastrointestinal segments of birds fed standard levels of Ca in the diet. Walk et
al. (2012b) reported the same effects of Ca on gizzard pH, but they did not observe
differences in jejunal pH. Phytase supplementation also had a significant impact on raising
gizzard pH. Walk et. al (2012b) reported the same effect on gizzard pH, and attributed this
53
effect to a reduction in the electrolyte balance due to phytate. When phytate chelates
nutrients from the diet it creates a more acidic environment in the gastrointestinal tract.
Higher mineral content in the diet resulted in increased ash weight and ash
percentage. However, no signs of impaired skeletal development were observed in this flock
among different treatments. A hypothesis for the increase in bone ash is that broilers utilize
excess mineral from the diet for storage and not development. That would mean that the
actual mineral requirement for appropriate skeletal development is lower than what has been
suggested by NRC (1994). Bradbury et al. (2012) reported that feeding birds lower levels of
Ca (0.77%) improved their leg strength. Leg health was accessed by the latency-to-lie test
which is highly correlated with gait scores. Therefore, although a significant decrease in bone
ash was observed when feeding birds low levels of Ca in the diet, it does not necessarily
mean a reduction in bone health, or impairment in skeletal development.
No differences in bone mineralization on d 19 were observed, which could be
consequent to reduced digestibility due to extensive mucosal damage. The lack of differences
in bone ash on d 19 may also support the idea that excess mineral in the diet results in
mineral storage. During disease there is a shift in nutrient partitioning that prioritizes keeping
the animal alive. Therefore, mineral storage is not a priority at that point and excess mineral
is directed to other physiological activities such as immune response.
An overall reduction in Ca and P digestibility was observed on d 19. This reduction in
Ca and P digestibility could be explained by the destruction of the intestinal lining during
NE, which impairs nutrient digestion and absorption (Immerseel et al., 2004; Timbermont et
al., 2011). However, Ca and P digestibility was improved when birds were fed lower levels
of Ca and P in the diets, and diets were supplemented with phytase (regardless of
54
physiological state). Therefore, feeding broilers lower levels of Ca and P might be extremely
advantageous under a nutrient utilization perspective during NE outbreaks. Histology data
from this trial indicated that less damage to the intestinal mucosa was observed when feeding
broilers lower mineral levels in the diet, which would ultimately result in improvements in
nutrient utilization.
In conclusion, this trial showed the importance of Ca supplementation as a factor in
NE pathogenesis. Lower levels of Ca in the diet ultimately resulted in reduced mortality. In
addition, birds fed diets containing lower levels of Ca and P performed equally to birds fed
industry standard levels of Ca and P. Improvements in Ca and P digestibility may be
attributed to a reduction in indigestible mineral in the intestinal lumen due to mineral
precipitation. In addition, improvements in mineral digestibility may also be correlated to a
healthier small intestine that would be more able to digest and absorb nutrients when birds
are fed lower levels of mineral in the diet. The improvement in intestinal health due to a
reduction in mineral contents of the diet is probably related to the involvement of Ca in the
pathogenesis of NE, which was reflected in bird mortality. Benefits of diets formulated with
lower levels of Ca and P are not restricted to bird performance. They can be extended to
improvements in other aspects of poultry production such as waste management, which
would benefit growers when trying to meet environmental regulations.
55
REFERENCES
AOAC International. 2000. Official Methods of Analysis. 17th Ed. Assoc. Off. Anal. Chem.,
Arlington, D.C.
Applegate, T. J., R. Angel, and H. L. Classen. 2003. Effect of dietary calcium, 25-
hydroxychoecalciferol or bird strain on small intestinal phytase activity in broiler
chickens. Poult. Sci. 82:1140-1148.
Bradbury, E. J., S. J. Wilkinson, G. M. Cronin, C. L. Walk, and A. J. Cowieson. 2012. The effect
of marine calcium source on broiler leg integrity. Aust. Poult. Sci. Symp. 85-88.
Bedford, M. R. 2003. New enzyme technologies for poultry feeds. Br. Poult. Sci. 44 (Suppl.),
S14-S16.
Cooper, K. K., and J. G. Songer. 2009. Necrotic enteritis in chickens: a paradigm of enteric
infection by Clostridium perfringens type A. Anaerobe. 15:55-60.
Cowieson, A. J., T. Acamovic and M. R. Bedford. 2006. Supplementation of corn-soy- based
diets with an Escherichia coli derived phytase:effects on broiler chick performance and
the digestibility of amino acids and metabolizability of minerals and energy. Poult. Sci.
85:1389-1397.
Drew, M. D., N. A. Syed, B. G. Goldade, B. Laarveld, and A. G. Van Kessel. 2004. Effects of
dietary protein source and level on intestinal populations of Clostridium perfringens in
broiler chickens. Poult. Sci. 83:414-420.
Ford, D. J. 1974. The effect of the microflora on gastrointestinal pH in the chick. Br. Poult. Sci.
15:131-140.
56
Guillouard, I., P. M. Alzari, B. Saliou, and S. T. Cole. 1997. The carboxyl-terminal C2-like
domain of the !-toxin from Clostridium perfringens mediates calcium-dependent
membrane recognition. Mol. Microbiol. 26:867-876.
Immerseel, F. V., J. Buck, F. Pasmans, G. Huyghebaert, F. Haesebrouk, and R. Ducatelle. 2004.
Clostridium perfringens in poultry: an emerging threat for animal and public health. Avian
Pathol. 33:537-549.
Kennedy, C. L., D. J. Smith, D. Lyras, A. Chakravorty, and J.I. Rood. 2009. Programmed cellular
necrosis mediated by the pore-forming alpha-toxin from Clostridium septicum. PLoS
Pathog. 5:e1000516.
Keyburn, A.L., T. L. Bannam, R. J. Moore, and J. I. Rood. 2010. NetB, a pore-forming toxin
from necrotic enteritis strains of C. perfringens. Toxins 2:1913-1927.
Keyburn, A. L., S. A. Sheedy, M. E. Ford, M. M. Williamsson, M. M. Awad, J. I. Rood, and R. J.
Moore. 2006. Alpha-toxin of Clostridium perfringens is not an essential virulence factor
in necrotic enteritis in chickens. Infect. Immun. 74:6496-6500.
Lee, K. W., H. S. Lillehoj, W. Jeong, H. Y. Jeoung, and D. J. An. 2011. Avian necrotic enteritis:
experimental models, host immunity, pathogenesis, risk factors, and vaccine development.
Poult. Sci. 90:1381-1390.
Lawlor, P.G., P.B. Lynch, P.J. Caffrey, J.J O’Reilly, and M.K. O’Connel. 2005. Measurements of
the acid-binding capacity of ingredients used in pig diets. Irish Vet. J. 58:447-452.
Luna, L. G. 1968. Histologic staining methods of the Armed Forces Institute of Patholgy. 3rd ed.
MCGraw-Hill Book Co., New York, NY.
Maenz, D. D., C. M. Engele-Schan, R. W. Newkirk, and H. L. Classen. 1999. The effect of
minerals and mineral chelators on the formation of phytase resistant and phytase-
57
susceptible forms of phytic acid in solution of canola meal. Anim. Feed Sci. Technol.
81:177-192.
National Research Council. 1994. Nutrient requirements of poultry. 9th rev. ed. National
Academy Press, Washington, DC.
Palliyeguru, M. W. C. D., S. P. Rose, and A. M. Mackenzie. 2010. Effect of dietary protein
concentrates on the incidence of subclinical necrotic enteritis and growth performance of
broiler chickens. Poult. Sci. 89:34-43.
Petit, L., M. Gibert, and M. R. Popoff. 1999. Clostridium perfringens: toxinotype and genotype.
Trends Microbiol. 7:104-110.
Plumstead, P. W., A. B. Leytem, R. O. Maguire, J. W. Spears, P. Kwanyuen, and J. Brake. 2008.
Interaction of calcium and phytate in broiler diets 1. Effects on apparent prececal
digestibility and retention of phosphorus. Poult. Sci. 87:449-458.
Powell, S., T. D. Bidner, and L. L. Southern. 2011. Phytase supplementation improved growth
performance and bone characteristics in broilers fed varying levels of dietary calcium.
Poult. Sci. 90:604-608.
Qian, H., E. T. Kornegay, and D. M. Denbow. 1997. Utilization of phytate phosphorus and
calcium as influenced by microbial phytase, cholecalciferol and the calcium:total
phosphorus ratio in broiler diets. Poul. Sci. 76:37-46.
Ravindran, V., W. L. Bryden, and E. T. Kornegay. 1995. Phytates: occurrence, bioavailability and
implications in poultry nutrition. Poult. Avian Biol. Rev. 6:125-143.
Rutherfurd, S. M., T. K. Chung, D. V. Thomas, M. L. Zou, and P. J. Moughan. 2012. Effect of a
novel phytase on growth performance, apparent metabolizable energy, and the availability
58
of minerals and amino acids in a low-phosphorus corn-soybean meal diet for broilers.
Poult. Sci. 91:1118-1127.
Sakurai, J., M. Nagahama, and M. Oda. 2004. Clostridium perfringens alpha-toxin:
characterization and mode of action. J. Biochem. 136:569-574.
Sebastian, S., S. P. Touchburn, E. R. Chavez, and P. C. Lague. 1996. Efficacy of supplemental
microbial phytase at different dietary calcium levels on growth performance and mineral
utilization of broiler chickens. Poult. Sci. 75:1516-1523.
Selle, P. H., A. J. Cowieson, and V. Ravindran. 2009. Consequences of calcium interactions with
phytate and phytase for poultry and pigs. Livestock Sci. 124:126-141.
Shaffey, T. M., M. W. McDonald, and J. G. Dingle. 1991. Effects of dietary calcium and
available phosphorus concentration on digesta pH and on the availability of calcium, iron,
magnesium, and zinc from the intestinal contents of meat chickens. Br. Poult. Sci. 32:185-
194.
Short, F. J., P. Gordon, J. Wiseman, and K. N. Boorman. 1996. Determination of titanium dioxide
added as an inert marker in chicken digestibility studies. Anim. Feed Sci. Technol.
59:215-221.
Tamim, N. M., R. Angel, and M. Christman. 2004. Influence of dietary calcium and phytase on
phytate phosphorus hydrolysis in broiler chickens. Poult. Sci. 83:1358-1367.
Titball, R. W., C. E. Naylor, and A. K. Basak. 1999. The Clostridium perfringens !-toxin.
Anaerobe. 5:51-64.
Timbermont, L., F. Haesebrouck, R. Ducatelle, and F.V. Immerseel. 2011. Necrotic enteritis in
broilers: an updated review on the pathogenesis. Avian Pathol. 40:341-347.
59
Wages, D. P, and K. Opengart. 2003. Necrotic Enteritis. Pages 781-785 in Diseases of Poultry.
ed. Y.M. Saif, H. J. Barnes, J. R. Glisson, A. M. Fadly, L. R. McDougald and D. E.
Swayne. 11th ed. Iowa State Press, Ames, IA.
Walk, C. L., E. K. Addo-Chidie, M. R. Bedford, and O. Adeola. 2012a. Evaluation of a highly
soluble calcium source and phytase in the diets of broiler chickens. Poult. Sci. 91:2255-
2263.
Walk, C. L., M. R. Bedford, and A. P. McElroy. 2012b. Influence of limestone and phytase on
broiler performance, gastrointestinal pH, and apparent ileal nutrient digestibility. Poult.
Sci. 91:1371-1378.
Williams, R. B. 2005. Intercurrent coccidiosis and necrotic enteritis of chickens: rational,
integrated disease management by maintenance of gut integrity. Avian Pathol. 34:159-
180.
Winget, C. M., G. C. Ashton, and A. J. Cawley. 1962. Changes in gastrointestinal pH associated
with fasting in the laying hen. Poult. Sci. 41:1115-1120.
Wise, A., and D. J. Gilburt. 1981. Binding of cadmium and lead to the calcium-phytate complex
in vitro. Toxicol. Lett. 9:45-50.
Yan, F., J. H. Kersey, C. A. Fritts, and P. W. Waldroup. 2006. Effect of phytase supplementation
on the calcium requirement of broiler chicks. Int. J. Poult. Sci. 5:112-120.
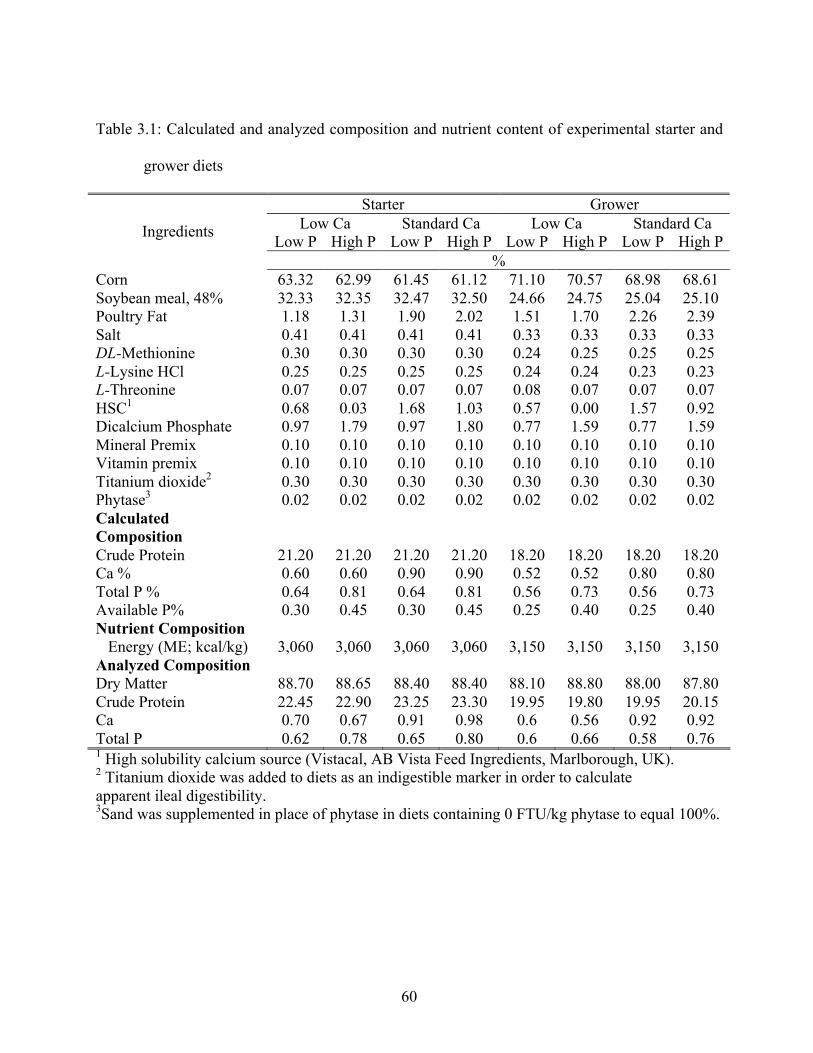
60
Table 3.1: Calculated and analyzed composition and nutrient content of experimental starter and
grower diets
Starter Grower Low Ca Standard Ca Low Ca Standard Ca
Low P High P Low P High P Low P High P Low P High P Ingredients
% Corn 63.32 62.99 61.45 61.12 71.10 70.57 68.98 68.61 Soybean meal, 48% 32.33 32.35 32.47 32.50 24.66 24.75 25.04 25.10 Poultry Fat 1.18 1.31 1.90 2.02 1.51 1.70 2.26 2.39 Salt 0.41 0.41 0.41 0.41 0.33 0.33 0.33 0.33 DL-Methionine 0.30 0.30 0.30 0.30 0.24 0.25 0.25 0.25 L-Lysine HCl 0.25 0.25 0.25 0.25 0.24 0.24 0.23 0.23 L-Threonine 0.07 0.07 0.07 0.07 0.08 0.07 0.07 0.07 HSC1 0.68 0.03 1.68 1.03 0.57 0.00 1.57 0.92 Dicalcium Phosphate 0.97 1.79 0.97 1.80 0.77 1.59 0.77 1.59 Mineral Premix 0.10 0.10 0.10 0.10 0.10 0.10 0.10 0.10 Vitamin premix 0.10 0.10 0.10 0.10 0.10 0.10 0.10 0.10 Titanium dioxide2 0.30 0.30 0.30 0.30 0.30 0.30 0.30 0.30 Phytase3 0.02 0.02 0.02 0.02 0.02 0.02 0.02 0.02 Calculated Composition
Crude Protein 21.20 21.20 21.20 21.20 18.20 18.20 18.20 18.20 Ca % 0.60 0.60 0.90 0.90 0.52 0.52 0.80 0.80 Total P % 0.64 0.81 0.64 0.81 0.56 0.73 0.56 0.73 Available P% 0.30 0.45 0.30 0.45 0.25 0.40 0.25 0.40 Nutrient Composition
Energy (ME; kcal/kg) 3,060 3,060 3,060 3,060 3,150 3,150 3,150 3,150 Analyzed Composition Dry Matter 88.70 88.65 88.40 88.40 88.10 88.80 88.00 87.80 Crude Protein 22.45 22.90 23.25 23.30 19.95 19.80 19.95 20.15 Ca 0.70 0.67 0.91 0.98 0.6 0.56 0.92 0.92 Total P 0.62 0.78 0.65 0.80 0.6 0.66 0.58 0.76 1 High solubility calcium source (Vistacal, AB Vista Feed Ingredients, Marlborough, UK). 2 Titanium dioxide was added to diets as an indigestible marker in order to calculate apparent ileal digestibility. 3Sand was supplemented in place of phytase in diets containing 0 FTU/kg phytase to equal 100%.
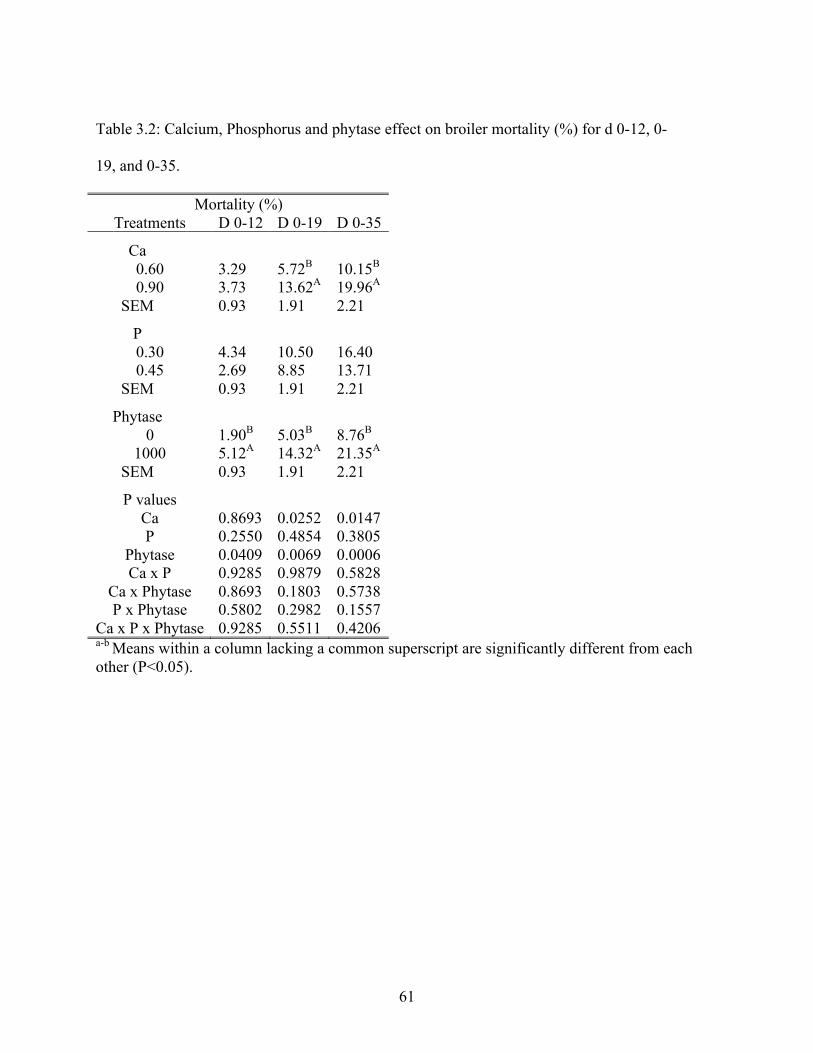
61
Table 3.2: Calcium, Phosphorus and phytase effect on broiler mortality (%) for d 0-12, 0-
19, and 0-35.
Mortality (%) Treatments D 0-12 D 0-19 D 0-35
Ca 0.60 3.29 5.72B 10.15B 0.90 3.73 13.62A 19.96A
SEM 0.93 1.91 2.21 P 0.30 4.34 10.50 16.40 0.45 2.69 8.85 13.71
SEM 0.93 1.91 2.21 Phytase 0 1.90B 5.03B 8.76B 1000 5.12A 14.32A 21.35A
SEM 0.93 1.91 2.21 P values
Ca 0.8693 0.0252 0.0147 P 0.2550 0.4854 0.3805
Phytase 0.0409 0.0069 0.0006 Ca x P 0.9285 0.9879 0.5828
Ca x Phytase 0.8693 0.1803 0.5738 P x Phytase 0.5802 0.2982 0.1557
Ca x P x Phytase 0.9285 0.5511 0.4206 a-b Means within a column lacking a common superscript are significantly different from each other (P<0.05).
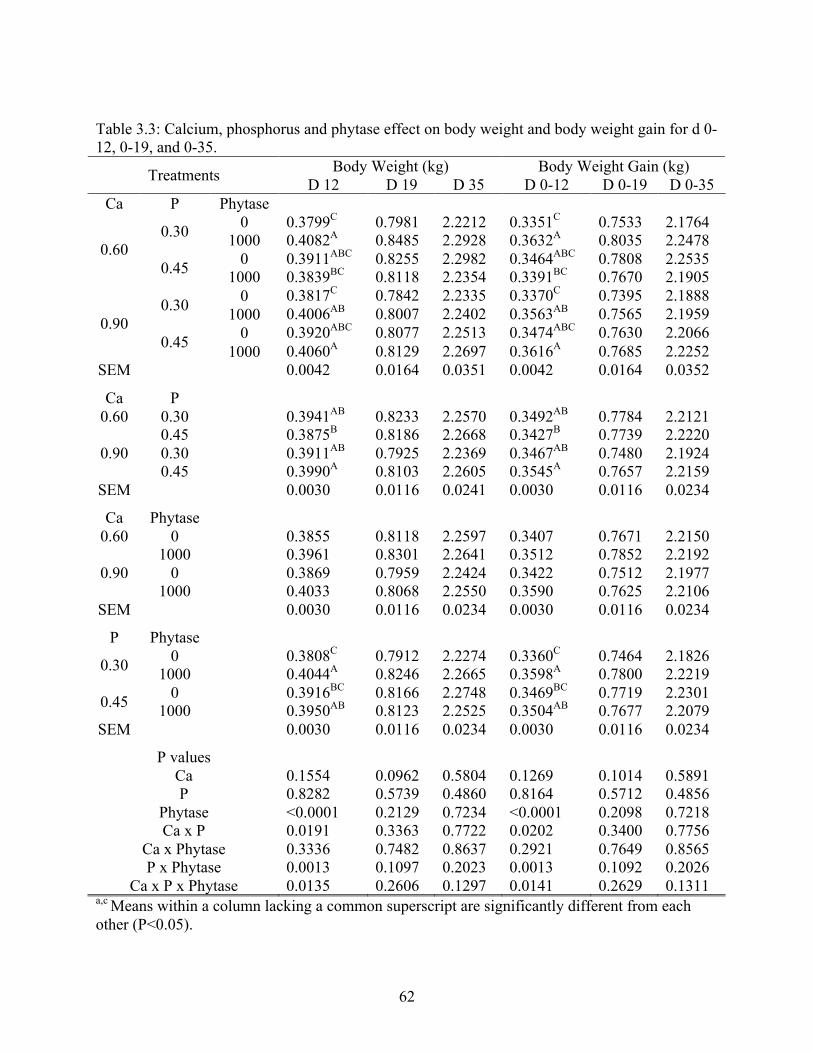
62
Table 3.3: Calcium, phosphorus and phytase effect on body weight and body weight gain for d 0-12, 0-19, and 0-35.
Body Weight (kg) Body Weight Gain (kg) Treatments D 12 D 19 D 35 D 0-12 D 0-19 D 0-35 Ca P Phytase
0 0.3799C 0.7981 2.2212 0.3351C 0.7533 2.1764 0.30 1000 0.4082A 0.8485 2.2928 0.3632A 0.8035 2.2478 0 0.3911ABC 0.8255 2.2982 0.3464ABC 0.7808 2.2535 0.60
0.45 1000 0.3839BC 0.8118 2.2354 0.3391BC 0.7670 2.1905 0 0.3817C 0.7842 2.2335 0.3370C 0.7395 2.1888 0.30 1000 0.4006AB 0.8007 2.2402 0.3563AB 0.7565 2.1959 0 0.3920ABC 0.8077 2.2513 0.3474ABC 0.7630 2.2066 0.90
0.45 1000 0.4060A 0.8129 2.2697 0.3616A 0.7685 2.2252 SEM 0.0042 0.0164 0.0351 0.0042 0.0164 0.0352
Ca P 0.60 0.30 0.3941AB 0.8233 2.2570 0.3492AB 0.7784 2.2121
0.45 0.3875B 0.8186 2.2668 0.3427B 0.7739 2.2220 0.90 0.30 0.3911AB 0.7925 2.2369 0.3467AB 0.7480 2.1924
0.45 0.3990A 0.8103 2.2605 0.3545A 0.7657 2.2159 SEM 0.0030 0.0116 0.0241 0.0030 0.0116 0.0234
Ca Phytase 0.60 0 0.3855 0.8118 2.2597 0.3407 0.7671 2.2150
1000 0.3961 0.8301 2.2641 0.3512 0.7852 2.2192 0.90 0 0.3869 0.7959 2.2424 0.3422 0.7512 2.1977
1000 0.4033 0.8068 2.2550 0.3590 0.7625 2.2106 SEM 0.0030 0.0116 0.0234 0.0030 0.0116 0.0234
P Phytase 0 0.3808C 0.7912 2.2274 0.3360C 0.7464 2.1826 0.30 1000 0.4044A 0.8246 2.2665 0.3598A 0.7800 2.2219 0 0.3916BC 0.8166 2.2748 0.3469BC 0.7719 2.2301 0.45 1000 0.3950AB 0.8123 2.2525 0.3504AB 0.7677 2.2079
SEM 0.0030 0.0116 0.0234 0.0030 0.0116 0.0234 P values
Ca 0.1554 0.0962 0.5804 0.1269 0.1014 0.5891 P 0.8282 0.5739 0.4860 0.8164 0.5712 0.4856
Phytase <0.0001 0.2129 0.7234 <0.0001 0.2098 0.7218 Ca x P 0.0191 0.3363 0.7722 0.0202 0.3400 0.7756
Ca x Phytase 0.3336 0.7482 0.8637 0.2921 0.7649 0.8565 P x Phytase 0.0013 0.1097 0.2023 0.0013 0.1092 0.2026
Ca x P x Phytase 0.0135 0.2606 0.1297 0.0141 0.2629 0.1311 a,c Means within a column lacking a common superscript are significantly different from each other (P<0.05).
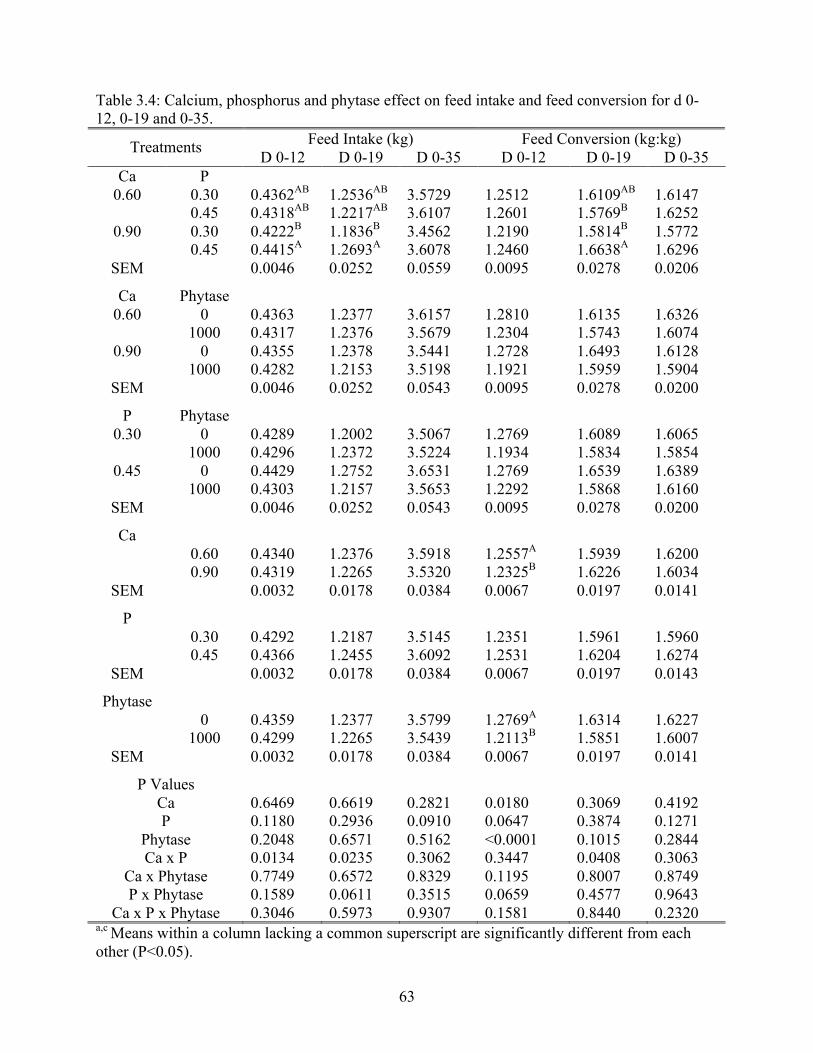
63
Table 3.4: Calcium, phosphorus and phytase effect on feed intake and feed conversion for d 0-12, 0-19 and 0-35.
Feed Intake (kg) Feed Conversion (kg:kg) Treatments D 0-12 D 0-19 D 0-35 D 0-12 D 0-19 D 0-35 Ca P
0.60 0.30 0.4362AB 1.2536AB 3.5729 1.2512 1.6109AB 1.6147 0.45 0.4318AB 1.2217AB 3.6107 1.2601 1.5769B 1.6252
0.90 0.30 0.4222B 1.1836B 3.4562 1.2190 1.5814B 1.5772 0.45 0.4415A 1.2693A 3.6078 1.2460 1.6638A 1.6296
SEM 0.0046 0.0252 0.0559 0.0095 0.0278 0.0206 Ca Phytase
0.60 0 0.4363 1.2377 3.6157 1.2810 1.6135 1.6326 1000 0.4317 1.2376 3.5679 1.2304 1.5743 1.6074
0.90 0 0.4355 1.2378 3.5441 1.2728 1.6493 1.6128 1000 0.4282 1.2153 3.5198 1.1921 1.5959 1.5904
SEM 0.0046 0.0252 0.0543 0.0095 0.0278 0.0200 P Phytase
0.30 0 0.4289 1.2002 3.5067 1.2769 1.6089 1.6065 1000 0.4296 1.2372 3.5224 1.1934 1.5834 1.5854
0.45 0 0.4429 1.2752 3.6531 1.2769 1.6539 1.6389 1000 0.4303 1.2157 3.5653 1.2292 1.5868 1.6160
SEM 0.0046 0.0252 0.0543 0.0095 0.0278 0.0200 Ca 0.60 0.4340 1.2376 3.5918 1.2557A 1.5939 1.6200 0.90 0.4319 1.2265 3.5320 1.2325B 1.6226 1.6034
SEM 0.0032 0.0178 0.0384 0.0067 0.0197 0.0141 P 0.30 0.4292 1.2187 3.5145 1.2351 1.5961 1.5960 0.45 0.4366 1.2455 3.6092 1.2531 1.6204 1.6274
SEM 0.0032 0.0178 0.0384 0.0067 0.0197 0.0143 Phytase 0 0.4359 1.2377 3.5799 1.2769A 1.6314 1.6227 1000 0.4299 1.2265 3.5439 1.2113B 1.5851 1.6007
SEM 0.0032 0.0178 0.0384 0.0067 0.0197 0.0141 P Values
Ca 0.6469 0.6619 0.2821 0.0180 0.3069 0.4192 P 0.1180 0.2936 0.0910 0.0647 0.3874 0.1271
Phytase 0.2048 0.6571 0.5162 <0.0001 0.1015 0.2844 Ca x P 0.0134 0.0235 0.3062 0.3447 0.0408 0.3063
Ca x Phytase 0.7749 0.6572 0.8329 0.1195 0.8007 0.8749 P x Phytase 0.1589 0.0611 0.3515 0.0659 0.4577 0.9643
Ca x P x Phytase 0.3046 0.5973 0.9307 0.1581 0.8440 0.2320 a,c Means within a column lacking a common superscript are significantly different from each other (P<0.05).
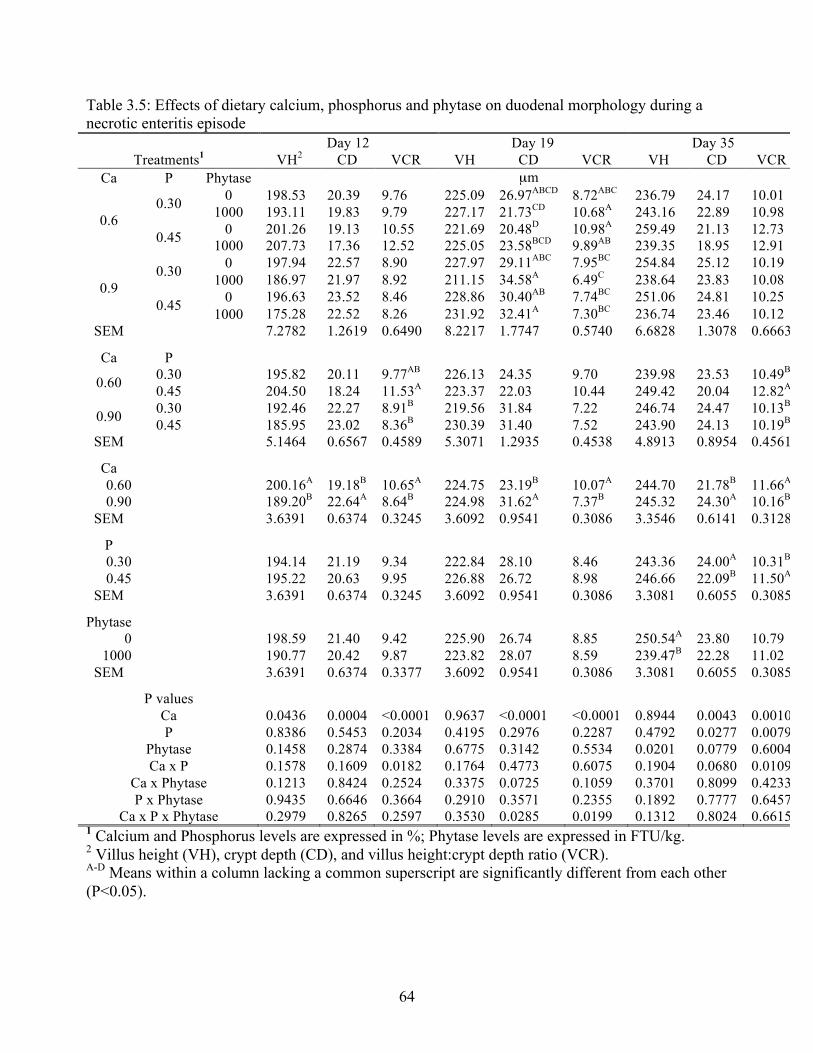
64
Table 3.5: Effects of dietary calcium, phosphorus and phytase on duodenal morphology during a necrotic enteritis episode
Day 12 Day 19 Day 35 Treatments1 VH2 CD VCR VH CD VCR VH CD VCR
Ca P Phytase µm 0 198.53 20.39 9.76 225.09 26.97ABCD 8.72ABC 236.79 24.17 10.01 0.30 1000 193.11 19.83 9.79 227.17 21.73CD 10.68A 243.16 22.89 10.98 0 201.26 19.13 10.55 221.69 20.48D 10.98A 259.49 21.13 12.73 0.6
0.45 1000 207.73 17.36 12.52 225.05 23.58BCD 9.89AB 239.35 18.95 12.91 0 197.94 22.57 8.90 227.97 29.11ABC 7.95BC 254.84 25.12 10.19 0.30 1000 186.97 21.97 8.92 211.15 34.58A 6.49C 238.64 23.83 10.08 0 196.63 23.52 8.46 228.86 30.40AB 7.74BC 251.06 24.81 10.25 0.9
0.45 1000 175.28 22.52 8.26 231.92 32.41A 7.30BC 236.74 23.46 10.12 SEM 7.2782 1.2619 0.6490 8.2217 1.7747 0.5740 6.6828 1.3078 0.6663
Ca P
0.30 195.82 20.11 9.77AB 226.13 24.35 9.70 239.98 23.53 10.49B 0.60 0.45 204.50 18.24 11.53A 223.37 22.03 10.44 249.42 20.04 12.82A 0.30 192.46 22.27 8.91B 219.56 31.84 7.22 246.74 24.47 10.13B 0.90 0.45 185.95 23.02 8.36B 230.39 31.40 7.52 243.90 24.13 10.19B
SEM 5.1464 0.6567 0.4589 5.3071 1.2935 0.4538 4.8913 0.8954 0.4561
Ca 0.60 200.16A 19.18B 10.65A 224.75 23.19B 10.07A 244.70 21.78B 11.66A 0.90 189.20B 22.64A 8.64B 224.98 31.62A 7.37B 245.32 24.30A 10.16B
SEM 3.6391 0.6374 0.3245 3.6092 0.9541 0.3086 3.3546 0.6141 0.3128
P 0.30 194.14 21.19 9.34 222.84 28.10 8.46 243.36 24.00A 10.31B 0.45 195.22 20.63 9.95 226.88 26.72 8.98 246.66 22.09B 11.50A
SEM 3.6391 0.6374 0.3245 3.6092 0.9541 0.3086 3.3081 0.6055 0.3085
Phytase 0 198.59 21.40 9.42 225.90 26.74 8.85 250.54A 23.80 10.79
1000 190.77 20.42 9.87 223.82 28.07 8.59 239.47B 22.28 11.02 SEM 3.6391 0.6374 0.3377 3.6092 0.9541 0.3086 3.3081 0.6055 0.3085
P values
Ca 0.0436 0.0004 <0.0001 0.9637 <0.0001 <0.0001 0.8944 0.0043 0.0010 P 0.8386 0.5453 0.2034 0.4195 0.2976 0.2287 0.4792 0.0277 0.0079
Phytase 0.1458 0.2874 0.3384 0.6775 0.3142 0.5534 0.0201 0.0779 0.6004 Ca x P 0.1578 0.1609 0.0182 0.1764 0.4773 0.6075 0.1904 0.0680 0.0109
Ca x Phytase 0.1213 0.8424 0.2524 0.3375 0.0725 0.1059 0.3701 0.8099 0.4233 P x Phytase 0.9435 0.6646 0.3664 0.2910 0.3571 0.2355 0.1892 0.7777 0.6457
Ca x P x Phytase 0.2979 0.8265 0.2597 0.3530 0.0285 0.0199 0.1312 0.8024 0.6615 1 Calcium and Phosphorus levels are expressed in %; Phytase levels are expressed in FTU/kg. 2 Villus height (VH), crypt depth (CD), and villus height:crypt depth ratio (VCR). A-D Means within a column lacking a common superscript are significantly different from each other (P<0.05).
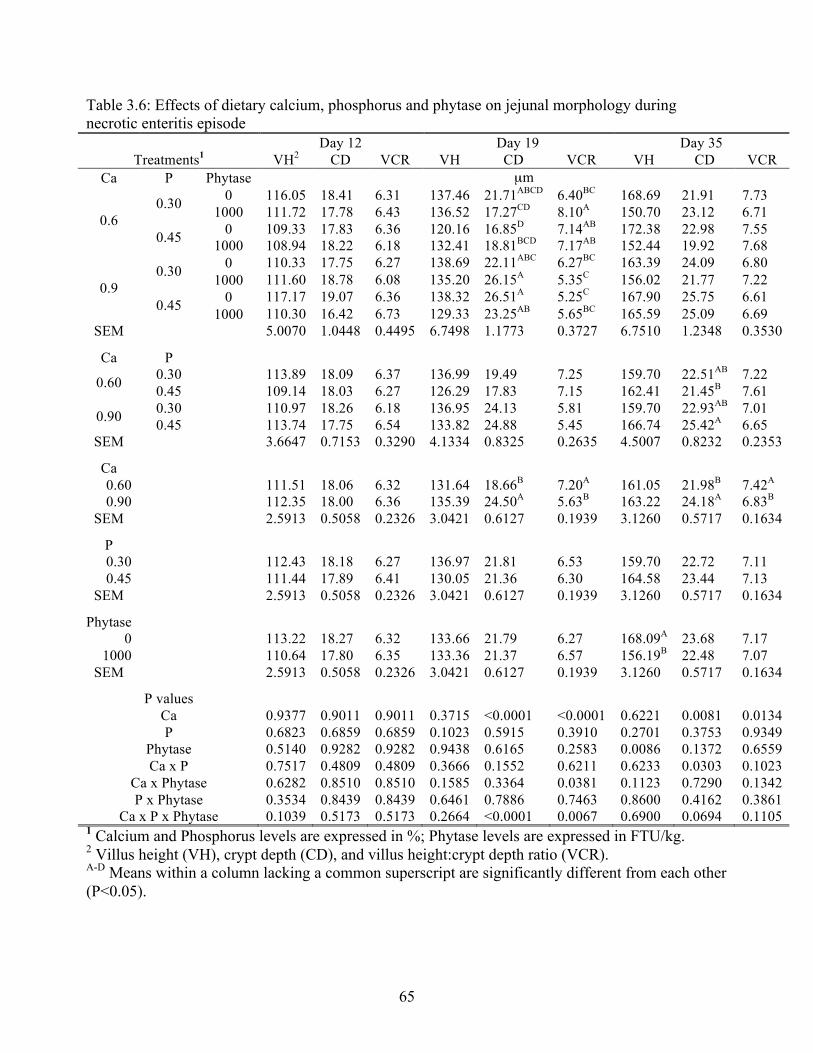
65
Table 3.6: Effects of dietary calcium, phosphorus and phytase on jejunal morphology during necrotic enteritis episode
Day 12 Day 19 Day 35 Treatments1 VH2 CD VCR VH CD VCR VH CD VCR
Ca P Phytase µm 0 116.05 18.41 6.31 137.46 21.71ABCD 6.40BC 168.69 21.91 7.73 0.30 1000 111.72 17.78 6.43 136.52 17.27CD 8.10A 150.70 23.12 6.71 0 109.33 17.83 6.36 120.16 16.85D 7.14AB 172.38 22.98 7.55 0.6
0.45 1000 108.94 18.22 6.18 132.41 18.81BCD 7.17AB 152.44 19.92 7.68 0 110.33 17.75 6.27 138.69 22.11ABC 6.27BC 163.39 24.09 6.80 0.30 1000 111.60 18.78 6.08 135.20 26.15A 5.35C 156.02 21.77 7.22 0 117.17 19.07 6.36 138.32 26.51A 5.25C 167.90 25.75 6.61 0.9
0.45 1000 110.30 16.42 6.73 129.33 23.25AB 5.65BC 165.59 25.09 6.69 SEM 5.0070 1.0448 0.4495 6.7498 1.1773 0.3727 6.7510 1.2348 0.3530
Ca P
0.30 113.89 18.09 6.37 136.99 19.49 7.25 159.70 22.51AB 7.22 0.60 0.45 109.14 18.03 6.27 126.29 17.83 7.15 162.41 21.45B 7.61 0.30 110.97 18.26 6.18 136.95 24.13 5.81 159.70 22.93AB 7.01 0.90 0.45 113.74 17.75 6.54 133.82 24.88 5.45 166.74 25.42A 6.65
SEM 3.6647 0.7153 0.3290 4.1334 0.8325 0.2635 4.5007 0.8232 0.2353
Ca 0.60 111.51 18.06 6.32 131.64 18.66B 7.20A 161.05 21.98B 7.42A 0.90 112.35 18.00 6.36 135.39 24.50A 5.63B 163.22 24.18A 6.83B
SEM 2.5913 0.5058 0.2326 3.0421 0.6127 0.1939 3.1260 0.5717 0.1634
P 0.30 112.43 18.18 6.27 136.97 21.81 6.53 159.70 22.72 7.11 0.45 111.44 17.89 6.41 130.05 21.36 6.30 164.58 23.44 7.13
SEM 2.5913 0.5058 0.2326 3.0421 0.6127 0.1939 3.1260 0.5717 0.1634
Phytase 0 113.22 18.27 6.32 133.66 21.79 6.27 168.09A 23.68 7.17
1000 110.64 17.80 6.35 133.36 21.37 6.57 156.19B 22.48 7.07 SEM 2.5913 0.5058 0.2326 3.0421 0.6127 0.1939 3.1260 0.5717 0.1634
P values
Ca 0.9377 0.9011 0.9011 0.3715 <0.0001 <0.0001 0.6221 0.0081 0.0134 P 0.6823 0.6859 0.6859 0.1023 0.5915 0.3910 0.2701 0.3753 0.9349
Phytase 0.5140 0.9282 0.9282 0.9438 0.6165 0.2583 0.0086 0.1372 0.6559 Ca x P 0.7517 0.4809 0.4809 0.3666 0.1552 0.6211 0.6233 0.0303 0.1023
Ca x Phytase 0.6282 0.8510 0.8510 0.1585 0.3364 0.0381 0.1123 0.7290 0.1342 P x Phytase 0.3534 0.8439 0.8439 0.6461 0.7886 0.7463 0.8600 0.4162 0.3861
Ca x P x Phytase 0.1039 0.5173 0.5173 0.2664 <0.0001 0.0067 0.6900 0.0694 0.1105 1 Calcium and Phosphorus levels are expressed in %; Phytase levels are expressed in FTU/kg. 2 Villus height (VH), crypt depth (CD), and villus height:crypt depth ratio (VCR). A-D Means within a column lacking a common superscript are significantly different from each other (P<0.05).
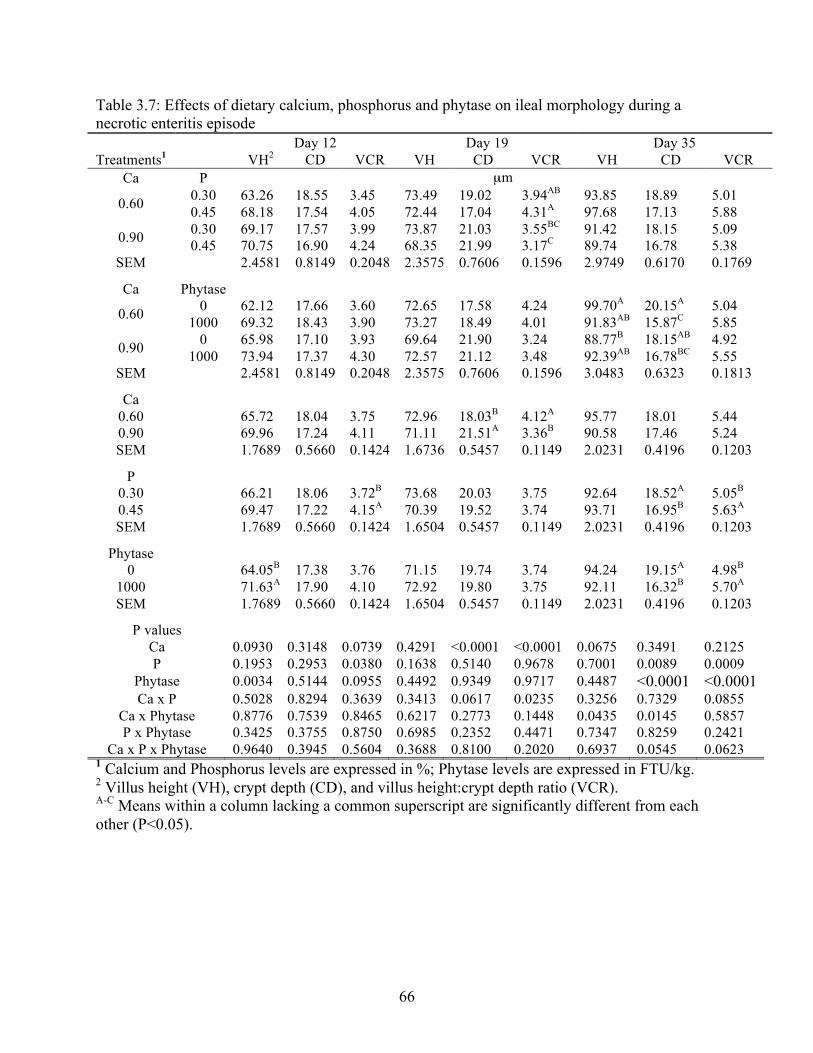
66
Table 3.7: Effects of dietary calcium, phosphorus and phytase on ileal morphology during a necrotic enteritis episode
Day 12 Day 19 Day 35 Treatments1 VH2 CD VCR VH CD VCR VH CD VCR
Ca P µm 0.30 63.26 18.55 3.45 73.49 19.02 3.94AB 93.85 18.89 5.01 0.60 0.45 68.18 17.54 4.05 72.44 17.04 4.31A 97.68 17.13 5.88 0.30 69.17 17.57 3.99 73.87 21.03 3.55BC 91.42 18.15 5.09 0.90 0.45 70.75 16.90 4.24 68.35 21.99 3.17C 89.74 16.78 5.38
SEM 2.4581 0.8149 0.2048 2.3575 0.7606 0.1596 2.9749 0.6170 0.1769
Ca Phytase 0 62.12 17.66 3.60 72.65 17.58 4.24 99.70A 20.15A 5.04 0.60 1000 69.32 18.43 3.90 73.27 18.49 4.01 91.83AB 15.87C 5.85 0 65.98 17.10 3.93 69.64 21.90 3.24 88.77B 18.15AB 4.92 0.90 1000 73.94 17.37 4.30 72.57 21.12 3.48 92.39AB 16.78BC 5.55
SEM 2.4581 0.8149 0.2048 2.3575 0.7606 0.1596 3.0483 0.6323 0.1813
Ca 0.60 65.72 18.04 3.75 72.96 18.03B 4.12A 95.77 18.01 5.44 0.90 69.96 17.24 4.11 71.11 21.51A 3.36B 90.58 17.46 5.24 SEM 1.7689 0.5660 0.1424 1.6736 0.5457 0.1149 2.0231 0.4196 0.1203
P
0.30 66.21 18.06 3.72B 73.68 20.03 3.75 92.64 18.52A 5.05B 0.45 69.47 17.22 4.15A 70.39 19.52 3.74 93.71 16.95B 5.63A SEM 1.7689 0.5660 0.1424 1.6504 0.5457 0.1149 2.0231 0.4196 0.1203
Phytase
0 64.05B 17.38 3.76 71.15 19.74 3.74 94.24 19.15A 4.98B 1000 71.63A 17.90 4.10 72.92 19.80 3.75 92.11 16.32B 5.70A SEM 1.7689 0.5660 0.1424 1.6504 0.5457 0.1149 2.0231 0.4196 0.1203
P values
Ca 0.0930 0.3148 0.0739 0.4291 <0.0001 <0.0001 0.0675 0.3491 0.2125 P 0.1953 0.2953 0.0380 0.1638 0.5140 0.9678 0.7001 0.0089 0.0009
Phytase 0.0034 0.5144 0.0955 0.4492 0.9349 0.9717 0.4487 <0.0001 <0.0001 Ca x P 0.5028 0.8294 0.3639 0.3413 0.0617 0.0235 0.3256 0.7329 0.0855
Ca x Phytase 0.8776 0.7539 0.8465 0.6217 0.2773 0.1448 0.0435 0.0145 0.5857 P x Phytase 0.3425 0.3755 0.8750 0.6985 0.2352 0.4471 0.7347 0.8259 0.2421
Ca x P x Phytase 0.9640 0.3945 0.5604 0.3688 0.8100 0.2020 0.6937 0.0545 0.0623 1 Calcium and Phosphorus levels are expressed in %; Phytase levels are expressed in FTU/kg. 2 Villus height (VH), crypt depth (CD), and villus height:crypt depth ratio (VCR). A-C Means within a column lacking a common superscript are significantly different from each other (P<0.05).
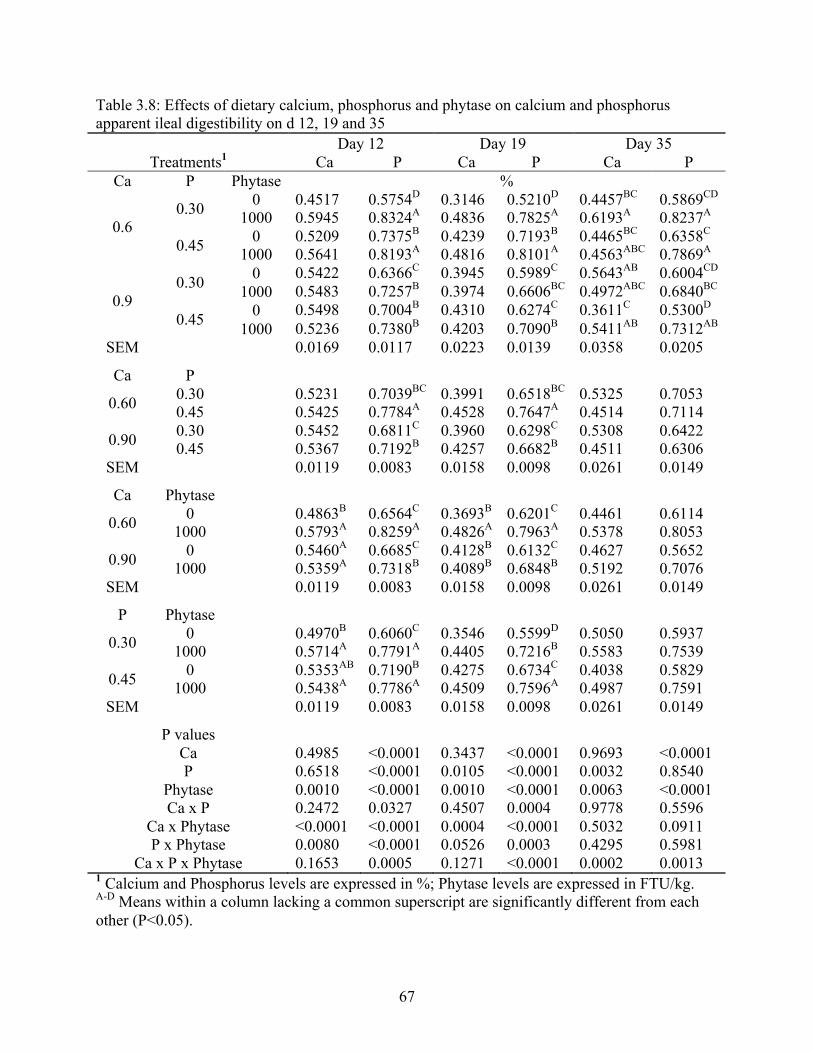
67
Table 3.8: Effects of dietary calcium, phosphorus and phytase on calcium and phosphorus apparent ileal digestibility on d 12, 19 and 35
Day 12 Day 19 Day 35 Treatments1 Ca P Ca P Ca P
Ca P Phytase % 0 0.4517 0.5754D 0.3146 0.5210D 0.4457BC 0.5869CD 0.30 1000 0.5945 0.8324A 0.4836 0.7825A 0.6193A 0.8237A 0 0.5209 0.7375B 0.4239 0.7193B 0.4465BC 0.6358C 0.6
0.45 1000 0.5641 0.8193A 0.4816 0.8101A 0.4563ABC 0.7869A 0 0.5422 0.6366C 0.3945 0.5989C 0.5643AB 0.6004CD 0.30 1000 0.5483 0.7257B 0.3974 0.6606BC 0.4972ABC 0.6840BC 0 0.5498 0.7004B 0.4310 0.6274C 0.3611C 0.5300D 0.9
0.45 1000 0.5236 0.7380B 0.4203 0.7090B 0.5411AB 0.7312AB SEM 0.0169 0.0117 0.0223 0.0139 0.0358 0.0205
Ca P 0.30 0.5231 0.7039BC 0.3991 0.6518BC 0.5325 0.7053 0.60 0.45 0.5425 0.7784A 0.4528 0.7647A 0.4514 0.7114 0.30 0.5452 0.6811C 0.3960 0.6298C 0.5308 0.6422 0.90 0.45 0.5367 0.7192B 0.4257 0.6682B 0.4511 0.6306
SEM 0.0119 0.0083 0.0158 0.0098 0.0261 0.0149 Ca Phytase
0 0.4863B 0.6564C 0.3693B 0.6201C 0.4461 0.6114 0.60 1000 0.5793A 0.8259A 0.4826A 0.7963A 0.5378 0.8053 0 0.5460A 0.6685C 0.4128B 0.6132C 0.4627 0.5652 0.90 1000 0.5359A 0.7318B 0.4089B 0.6848B 0.5192 0.7076
SEM 0.0119 0.0083 0.0158 0.0098 0.0261 0.0149 P Phytase
0 0.4970B 0.6060C 0.3546 0.5599D 0.5050 0.5937 0.30 1000 0.5714A 0.7791A 0.4405 0.7216B 0.5583 0.7539 0 0.5353AB 0.7190B 0.4275 0.6734C 0.4038 0.5829 0.45 1000 0.5438A 0.7786A 0.4509 0.7596A 0.4987 0.7591
SEM 0.0119 0.0083 0.0158 0.0098 0.0261 0.0149 P values
Ca 0.4985 <0.0001 0.3437 <0.0001 0.9693 <0.0001 P 0.6518 <0.0001 0.0105 <0.0001 0.0032 0.8540
Phytase 0.0010 <0.0001 0.0010 <0.0001 0.0063 <0.0001 Ca x P 0.2472 0.0327 0.4507 0.0004 0.9778 0.5596
Ca x Phytase <0.0001 <0.0001 0.0004 <0.0001 0.5032 0.0911 P x Phytase 0.0080 <0.0001 0.0526 0.0003 0.4295 0.5981
Ca x P x Phytase 0.1653 0.0005 0.1271 <0.0001 0.0002 0.0013 1 Calcium and Phosphorus levels are expressed in %; Phytase levels are expressed in FTU/kg. A-D Means within a column lacking a common superscript are significantly different from each other (P<0.05).
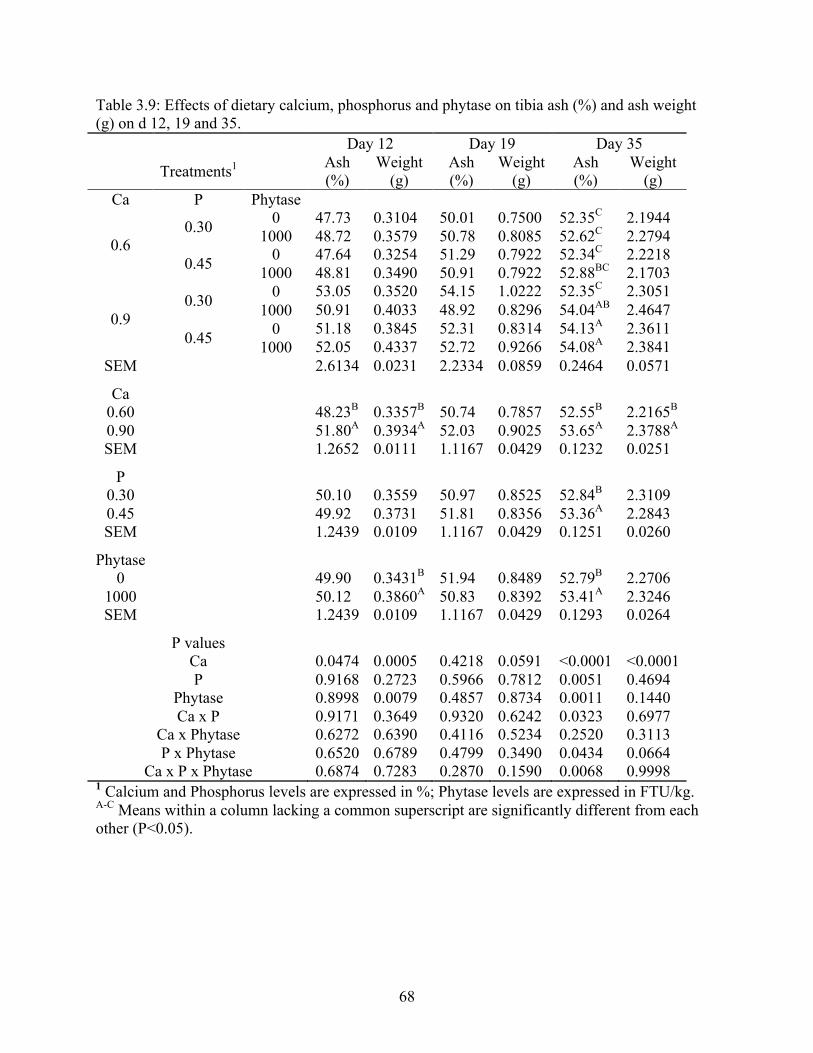
68
Table 3.9: Effects of dietary calcium, phosphorus and phytase on tibia ash (%) and ash weight (g) on d 12, 19 and 35.
Day 12 Day 19 Day 35
Treatments1 Ash (%)
Weight (g)
Ash (%)
Weight (g)
Ash (%)
Weight (g)
Ca P Phytase 0 47.73 0.3104 50.01 0.7500 52.35C 2.1944 0.30 1000 48.72 0.3579 50.78 0.8085 52.62C 2.2794 0 47.64 0.3254 51.29 0.7922 52.34C 2.2218 0.6
0.45 1000 48.81 0.3490 50.91 0.7922 52.88BC 2.1703 0 53.05 0.3520 54.15 1.0222 52.35C 2.3051 0.30 1000 50.91 0.4033 48.92 0.8296 54.04AB 2.4647 0 51.18 0.3845 52.31 0.8314 54.13A 2.3611 0.9
0.45 1000 52.05 0.4337 52.72 0.9266 54.08A 2.3841 SEM 2.6134 0.0231 2.2334 0.0859 0.2464 0.0571
Ca 0.60 48.23B 0.3357B 50.74 0.7857 52.55B 2.2165B 0.90 51.80A 0.3934A 52.03 0.9025 53.65A 2.3788A SEM 1.2652 0.0111 1.1167 0.0429 0.1232 0.0251
P 0.30 50.10 0.3559 50.97 0.8525 52.84B 2.3109 0.45 49.92 0.3731 51.81 0.8356 53.36A 2.2843 SEM 1.2439 0.0109 1.1167 0.0429 0.1251 0.0260
Phytase 0 49.90 0.3431B 51.94 0.8489 52.79B 2.2706
1000 50.12 0.3860A 50.83 0.8392 53.41A 2.3246 SEM 1.2439 0.0109 1.1167 0.0429 0.1293 0.0264
P values Ca 0.0474 0.0005 0.4218 0.0591 <0.0001 <0.0001 P 0.9168 0.2723 0.5966 0.7812 0.0051 0.4694
Phytase 0.8998 0.0079 0.4857 0.8734 0.0011 0.1440 Ca x P 0.9171 0.3649 0.9320 0.6242 0.0323 0.6977
Ca x Phytase 0.6272 0.6390 0.4116 0.5234 0.2520 0.3113 P x Phytase 0.6520 0.6789 0.4799 0.3490 0.0434 0.0664
Ca x P x Phytase 0.6874 0.7283 0.2870 0.1590 0.0068 0.9998 1 Calcium and Phosphorus levels are expressed in %; Phytase levels are expressed in FTU/kg. A-C Means within a column lacking a common superscript are significantly different from each other (P<0.05).
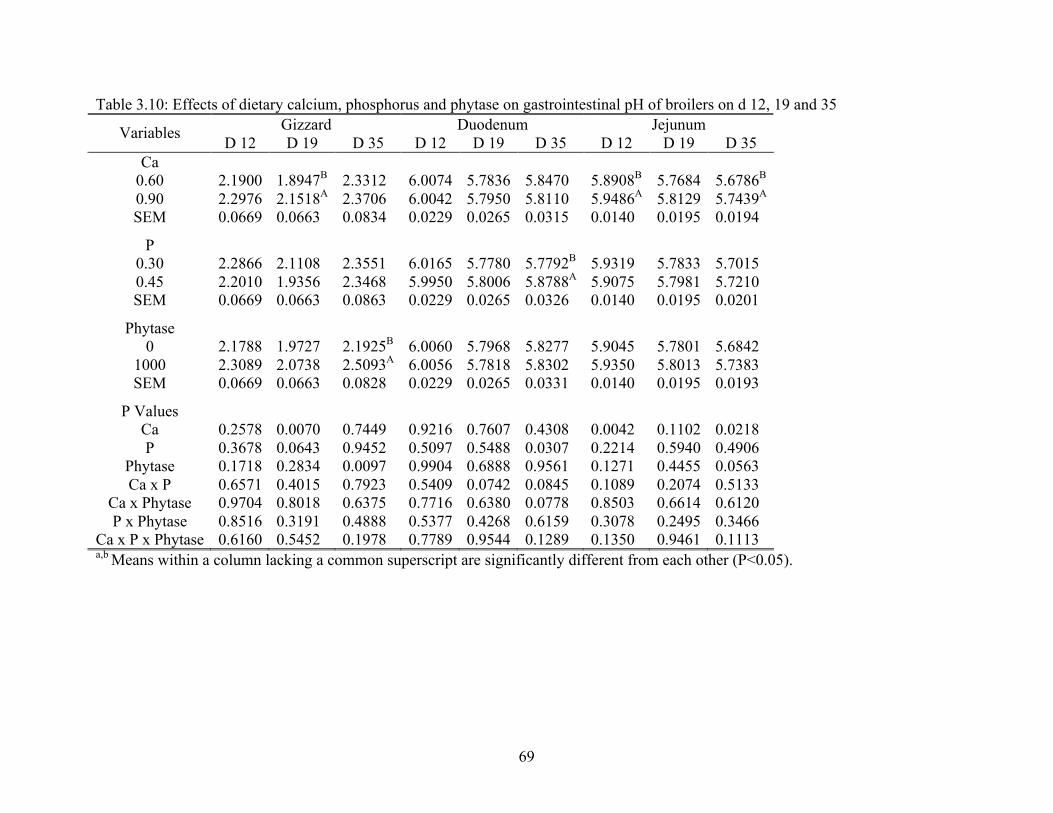
69
Table 3.10: Effects of dietary calcium, phosphorus and phytase on gastrointestinal pH of broilers on d 12, 19 and 35 Gizzard Duodenum Jejunum Variables D 12 D 19 D 35 D 12 D 19 D 35 D 12 D 19 D 35
Ca 0.60 2.1900 1.8947B 2.3312 6.0074 5.7836 5.8470 5.8908B 5.7684 5.6786B 0.90 2.2976 2.1518A 2.3706 6.0042 5.7950 5.8110 5.9486A 5.8129 5.7439A SEM 0.0669 0.0663 0.0834 0.0229 0.0265 0.0315 0.0140 0.0195 0.0194
P 0.30 2.2866 2.1108 2.3551 6.0165 5.7780 5.7792B 5.9319 5.7833 5.7015 0.45 2.2010 1.9356 2.3468 5.9950 5.8006 5.8788A 5.9075 5.7981 5.7210 SEM 0.0669 0.0663 0.0863 0.0229 0.0265 0.0326 0.0140 0.0195 0.0201
Phytase 0 2.1788 1.9727 2.1925B 6.0060 5.7968 5.8277 5.9045 5.7801 5.6842
1000 2.3089 2.0738 2.5093A 6.0056 5.7818 5.8302 5.9350 5.8013 5.7383 SEM 0.0669 0.0663 0.0828 0.0229 0.0265 0.0331 0.0140 0.0195 0.0193
P Values Ca 0.2578 0.0070 0.7449 0.9216 0.7607 0.4308 0.0042 0.1102 0.0218 P 0.3678 0.0643 0.9452 0.5097 0.5488 0.0307 0.2214 0.5940 0.4906
Phytase 0.1718 0.2834 0.0097 0.9904 0.6888 0.9561 0.1271 0.4455 0.0563 Ca x P 0.6571 0.4015 0.7923 0.5409 0.0742 0.0845 0.1089 0.2074 0.5133
Ca x Phytase 0.9704 0.8018 0.6375 0.7716 0.6380 0.0778 0.8503 0.6614 0.6120 P x Phytase 0.8516 0.3191 0.4888 0.5377 0.4268 0.6159 0.3078 0.2495 0.3466
Ca x P x Phytase 0.6160 0.5452 0.1978 0.7789 0.9544 0.1289 0.1350 0.9461 0.1113 a,b Means within a column lacking a common superscript are significantly different from each other (P<0.05).
70
Chapter IV: Influence of dietary calcium level, calcium source and phytase on bird
performance and mineral digestibility during a natural necrotic enteritis episode
ABSTRACT
The poultry industry has little information on the effects of enzyme supplementation in
disease settings. The objective of this study was to determine the influence of Ca source
(highly soluble calcified seaweed and limestone) phytase supplementation, and dietary levels
of Ca on bird performance and mineral digestibility (Ca and P) during a necrotic enteritis
outbreak. Cobb 500 male broilers were weighed and randomized into 8 treatment groups (9
pens/treatment; 30 birds/pen) at day of hatch. The 21 d trial was designed as a 2 x 2 x 2
factorial, which included 2 dietary levels of Ca (0.6% and 0.9%), 2 Ca sources (limestone
and a highly soluble calcified marine seaweed (HSC)), and 2 levels of an E. coli phytase (0
and 1,000 FTU/kg). Birds were placed on used litter from a previous flock that exhibited
clinical signs of NE. Birds and feed were weighed on d 7, 14 and 21, and body weight (BW),
BW gain (BWG), feed intake (FI), and feed conversion (FC) were calculated for each of
these periods and cumulatively. Mortality was recorded daily, and pH of the gizzard and
duodenum were measured on d 7, 14 and 21. Ileal digesta (8 birds/pen) was also collected on
d 7, 14 and 21. Significance is reported at P <0.05. Birds began exhibiting clinical signs of
NE on d 9, and elevated NE-associated mortality persisted until the end of the trial. Mortality
was significantly affected by an interaction between Ca source and Ca levels. Significantly
higher mortality was observed when broilers were fed 0.9% Ca HSC diets when compared to
birds fed 0.6% Ca, regardless of Ca source. Broilers fed 0.6% Ca diets supplemented with
phytase were heavier than the other treatments regardless of Ca source. Broilers fed diets
formulated with HSC had significantly higher FC then broilers fed diets formulated with
71
limestone. The gizzard of broilers fed 0.9% Ca in the diet was significantly less acidic than
the gizzard of broilers fed 0.6% Ca in the diet. Broilers fed 0.6% Ca in diets supplemented
with phytase showed significant improvements in P and Ca digestibility. In conclusion,
greater Ca concentrations in the intestinal lumen had a negative effect on mortality associated
with NE and on bird performance.
INTRODUCTION
True dietary requirements for Ca and P are of ongoing interest to poultry nutritionists.
Diet supplementation with exogenous enzymes, especially phytases, represents a challenge
when trying to establish the ideal dietary levels of Ca and P in the diet. The impacts of
phytase supplementation on poultry performance (BW, BWG, FI and FC) and mineral
digestibility have been extensively reported by several authors (Ravindran et al., 1995; Selle
et al., 2009; Rutherfurd et al., 2012). However, little information exists in the literature in
regards to the impact of phytases on intestinal health and Ca and P requirements during
disease.
The main purpose of phytase supplementation is to increase nutrient availability.
Initially, the supplementation of diets with phytases targeted improvements in P availability
and digestibility (Perney et al., 1993, Selle et al., 2009). However, research has shown that
phytase supplementation also has a significant impact on the availability of other nutrients,
such as proteins and amino acids, minerals, and carbohydrates (Cowieson et al., 2006;
Cowieson et al., 2009).
Calcium must be soluble in the intestinal lumen in order to be absorbed. Calcium
solubility in the intestine is closely related to small intestinal pH (around 6.0) and phytate
concentration. When pH is close to neutral, phytate forms mineral chelates that are highly
72
insoluble (Sebastian et al., 1996; Tamim et al., 2004; Plumstead et al., 2008). In addition, a
high ratio of dietary Ca to P reduces the digestibility and absorption of Ca and P due to
increased precipitation of Ca-P complexes (Plumstead et al., 2008; Selle et al., 2009). Selle et
al. (2000) have reported that maximum insolubility of phytate-mineral chelates occurs
between pH 4 and 7. Calcium is one of the divalent cations with lowest affinity for phytate.
However, since Ca is the mineral added in highest concentrations in poultry diets, it has a
greater impact in forming mineral-phytate chelates than other dietary minerals, making both,
Ca and P, unavailable for absorption (Sebastian et al., 1996; Maenz et al., 1999; Tamim et
al., 2004). Thus, the problem with phytate digestion is not a lack of compatible endogenous
enzymes but poor substrate solubility in the small intestine. This effect is increased when
high amounts of Ca are present (Tamim et al., 2004; Cowieson et al., 2011).
Calcium and phosphorus are usually supplemented in poultry diets by the inclusion of
limestone, dicalcium phosphate, and meat-and-bone meal (where permitted). Inorganic
sources of Ca and P are escalating in price, and the cost of supplementing diets with
exogenous phytases is decreasing (Selle et al., 2009). In addition, inorganic sources of Ca
and P reserves are not renewable, and their depletion can be delayed by reducing the
inclusion levels of Ca and P in animal feed (Mullaney et al., 2000; Selle et al., 2009).
Benefits from supplementing broiler diets with lower levels of Ca are supported by
performance results. Anderson et al. (1984) reported that BWG, FC, and bone ash were all
significantly reduced by increasing dietary Ca from regular industry standards (0.9%) to
1.5% in the diet. Sebastian et al. (1996) were the first to challenge NRC (1994)
recommended Ca levels in diets supplemented with phytase. In their study, efficacy of
supplemental phytase was significantly affected by dietary Ca levels, and the optimal growth
73
performance, and retention of P and Ca was achieved at the lowest level of dietary Ca tested
(0.6%). Selle et al. (2009) reported that over a 30 day feeding period, high levels of Ca
depressed BWG (32%), FI (16.2%), and FC (18.8%) in pigs receiving phytase supplemented
diets.
A healthy intestine is able to digest and absorb nutrients released by phytase from the
phytate molecule resulting in improvements in bird performance. However, when the
gastrointestinal tract is colonized by enteric pathogens, damage to the intestinal lining
impairs function of the intestinal mucosa and birds’ utilization of nutrients, and these
nutrients may become available to enteric pathogens.
One enteric disease of concern for the commercial poultry industry related to
impaired intestinal function is necrotic enteritis (NE). Necrotic enteritis has reemerged in
recent years as an important multifactorial enterotoxemia in poultry. The increasing numbers
in NE outbreaks are likely consequent to attempts to reduce the use of antimicrobials and
coccidiostats in poultry feed by the industry. Clostridium perfringens is the etiological agent
associated with NE. Although the pathogenesis of NE is not completely elucidated, it is
believed that the toxins produced by C. perfringens are lesion production. Researchers
suggest that the most important toxins in the pathogenesis of NE are netB and alpha-toxin.
NetB forms pores in the cellular membrane causing an influx of ions (Ca, Na, Cl, etc) that
eventually lead to osmotic cell lysis (Keyburn et al., 2010). Alpha-toxin is a zinc-dependent
phospholipase sphingomyelinase that hydrolyses phospholipids and promotes cellular
membrane disorganization. In addition to zinc, alpha-toxin also depends on Ca for full
activity. Calcium ions are essential for the binding of alpha-toxin to lipid films (Moreau et
al., 1988; Petit et al., 1999; Titball et al., 1999). Therefore, there is strong evidence
74
suggesting that Ca is involved in the pathogenesis of NE. The objective of this study was to
evaluate the effects of phytase supplementation, Ca sources and Ca levels on animal
performance, gastrointestinal pH, and mineral digestibility during a natural NE outbreak.
MATERIALS AND METHODS
Animals and Animal Husbandry
Cobb 500 male broilers (n = 2,160) were acquired from a commercial hatchery and
placed on used litter from a previous flock that had presented clinical signs of NE. Following
the previous trial, litter was removed from each pen, and mixed in the center of the grower
house. Mixed litter was redistributed to pens, and fresh pine shavings were layered on top of
the mixed used litter. Upon arrival at the Virginia Tech farm, birds were randomized,
weighed by pen, and placed into floor pens relative to the different treatment groups from d 0
to 21. Feed and water were administered ad libitum throughout the study.
Experimental Diets and Animal Performance
Diets were formulated in order to meet or exceed NRC (1994) recommended nutrient
levels, with the exception of Ca and P. Experimental diets constituted of a 2 x 2 x 2 factorial
design with 2 total Ca levels (0.9% and 0.6%), 2 Ca sources (limestone and calcified marine
seaweed), and 2 levels of phytase (0 and 1,000 FTU/kg). Calcium was supplemented in the
diets as a combination of dicalcium phosphate, and highly soluble calcified marine seaweed
(HSC) (Vistacal, AB Vista Feed Ingredients, Marlborough, UK) or limestone. The phytase
used was an Escherichia coli 6-phytase expressed in Trichoderma reesei and contained an
expected activity of 5,000 FTU/g (Quantum Blue, AB Vista Feed Ingredients, Marlborough
UK). Diets were analyzed for Ca, total P and recovered phytase activity, and results were
comparable to formulated diets (Table 1).
75
On d 7, 14, and 21, birds and feed were weighed by pen in order to calculate average
BW, BWG, average FI, and FC. Mortality was recorded daily and used to adjust FI and FC
according to bird days.
Ca and P Digestibility
On d 7 (n=7 birds/pen), 14 (n=6 birds/pen), and 21 (n=6 birds/pen), birds were
euthanized by cervical dislocation, and ileal digesta (defined as Meckel’s diverticulum to the
ileal cecal junction) was sampled. Ileal digesta samples were pooled per pen and frozen
(-80°C) until further analysis. Frozen digesta samples were freeze dried and ground (1mm
screen) prior to mineral analysis. Digesta and diet samples were wet ashed using nitric and
perchloric acids. Phosphorus was determined by the alkalimeter ammonium molybdate
method, and color intensity was read using a spectrophotometer measuring absorbance at 410
nm (AOAC International, 2000). Calcium was determined using flame atomic absorption
spectroscopy (AOAC International, 2000). Titanium dioxide was included in the diets as an
indigestible marker, and it was determined using a colorimetric method previously described
by Short et al. (1996). All samples (Ca, P and titanium) were assayed in duplicates. Calcium
and phosphorus apparent illeal digestibility (AID) was calculate using the following
equation:
AID = [(nutrient/TiO2)diet - (nutrient/TiO2)ileum ]/ (nutrient/TiO2)diet
pH
On d 14 and 21, 2 birds/pen of average BW were euthanized to obtain measurements of pH
from the gizzard and duodenum. From each bird, pH measurements were obtained directly
from the digesta contents in the lumen using a digital pH meter (Mettler-Toledo, Columbus,
76
OH) and spear-tip electrode (Sensorex, Garden Grove, CA). The pH values from each
gastrointestinal section/bird were then pooled to obtain a mean pH value/pen for analysis.
Statistical Analysis
Data were analyzed as a 2 x 2 x 2 factorial using the fit model platform in JMP 9.0
(SAS Institute Inc., Cary, NC), and means were separated using Tukey’s honestly significant
difference test. Pen served as the experimental unit. Data were analyzed for main effects
(Ca, P, and phytase) and for the interaction of main effects. Statistical significance was
accepted at P < 0.05. P-values of mortality data are reported as squared arcsine transformed
percentage mortality data.
RESULTS
Performance
Birds began exhibiting clinical signs of NE on d 9, and elevated NE-associated
mortality persisted until the end of this trial. No significant differences in mortality were
observed on d 0-7 or 0-14 (Table 2). However, from d 0-21 mortality was significantly
affected by a 2-way interaction between Ca source and Ca levels (Table 2). Mortality was
significantly higher when broilers were fed 0.9% HSC diets than broilers fed 0.6% Ca,
regardless of Ca source. Calcium source did not significantly affect mortality when broilers
were fed equivalent levels of Ca in the diet (Table 2).
From d 0-7, a 3-way interaction (Ca level x Ca source x phytase) significantly
affected BW and BWG (Table 3). Broilers fed diets supplemented with phytase were
significantly heavier and gained more weight than broilers fed diets that were not
supplemented with phytase regardless of Ca level or Ca source, with the exception of those
with 0.6% Ca from limestone.
77
From d 0-14 and 0-21, Ca source or phytase supplementation significantly affected
BW and BWG (Tables 3). Broilers fed diets formulated with limestone were significantly
heavier than broilers fed diets formulated with HSC. Broilers fed phytase supplemented diets
were significantly heavier and gained more weight than those on diets without phytase.
Dietary levels of Ca did not affect BW or BWG for the same periods.
A 2-way interaction between Ca level and Ca source significantly affected FI from d
0-7 (Table 4). When broilers were fed diets formulated using HSC as the Ca source, dietary
levels of Ca did not significantly affect FI. However, when limestone was used as the Ca
source, broilers fed 0.6% Ca diets had higher FI than broilers fed 0.9% Ca diets. A 2-way
interaction between Ca levels and phytase also significantly affected FI during the first week
of this trial. A significant decrease in FI was observed when broilers were fed 0.9% Ca diets
without phytase, but no FI difference due to phytase supplementation was observed with
0.6% Ca diets. From d 0-7, no differences in FC were observed. Phytase significantly
increased FI from d 0-14 (Table 4). Broilers fed diets supplemented with phytase consumed
more feed than broilers fed diets that were without supplemental phytase. FI was not
significantly affected from d 0-21. Calcium source had a significant impact on FC from d 0-
14 or 0-21. Diets formulated with limestone as the Ca source resulted in a decrease in FC
when compared to diets formulated with HSC as a Ca source.
Ca and P Digestibility
A 3-way interaction (Ca levels, Ca source and phytase) significantly influenced P and
Ca digestibility on all sampling days. Optimal P digestibility was observed when broilers
were fed 0.6% Ca diets formulated with limestone and supplemented with phytase regardless
of feeding period (Table 5). On d 7, phytase supplementation improved P digestibility in
78
broilers fed 0.6% Ca diets formulated with limestone and 0.9% Ca diets formulated with
HSC, but did not affect P digestibility in the 0.6% Ca diets formulated with HSC or 0.9% Ca
diet formulated with limestone. This improvement by phytase supplementation in the 0.6%
limestone diets was also observed on d 14 and d 21, while it had no effect in other diets
regardless of Ca source or level. Overall, a significant decrease in P digestibility was
observed when broilers were fed 0.9% Ca, regardless of Ca source and phytase
supplementation.
Similar to P digestibility results on d 7, Ca digestibility was improved by phytase
supplementation in the 0.6% Ca diets formulated with limestone and 0.9% Ca diets
formulated with HSC. However, this response was not seen on d 14 and d 21. On d 14,
phytase supplementation only improved Ca digestibility on 0.9% Ca diets formulated with
limestone. On d 21, broilers fed 0.6% Ca diets supplemented with phytase and formulated
with limestone had higher Ca digestibility than those fed 0.9% Ca diets supplemented with
phytase and formulated with limestone. Generally, on d 14 and d 21, 0.6% Ca diets resulted
in improved Ca digestibility, regardless of Ca source or phytase supplementation.
pH
Differences in pH measurements were only seen in the gizzard on d 21 (Table 6). The
gizzard of broilers fed 0.6% Ca diets was significantly more acidic than the gizzard of
broilers fed 0.9% Ca.
DISCUSSION
New regulations concerning antimicrobial use in feeds, and market demand for a
product raised without the aid of growth promoters had a significant impact on the increasing
incidence of NE in commercial broiler houses. In this experiment, broilers were fed non-
79
medicated diets, and high mortality due to NE was observed from d 9 until the end of the trial
(d 21). Higher mortality due to NE was observed when broilers were fed industry standard
levels of Ca (0.9%) in the diet, especially when diets were formulated using HSC. The
complete mechanism by which C. perfringens leads to NE has not been completely
elucidated. C. perfringens is an extra cellular pathogen, thus its virulence is mostly associated
with its ability to produce toxins, such as alpha-toxin and netB (Songer, 1996). Mucosal
damage associated with NE has been correlated with the action of NetB (Keyburn et al.,
2010) and alpha-toxin (Petit et al., 1999; Titball et al., 1999) on the intestinal lining. The
mechanism of membrane recognition by alpha-toxin is a complex event. This mechanism
involves a Ca-mediated phospholipid recognition, which allows alpha-toxin to bind to the
enterocyte cellular-membrane (Titball et al., 1999). NetB also depends on Ca to cause cell
lysis. The netB mode of action involves the formation of pores in the enterocyte membrane,
which results in an influx of ions into the cytoplasm (Keyburn et al., 2010). The influx of
ions into the cell cytoplasm eventually leads to osmotic cell lysis. In addition to osmotic
lysis, another mechanism involving Ca has been suggested that would induce cell death
(Kennedy et al., 2009). Thus, the Ca influx caused by netB may also lead to a special type of
programmed cell death. Kennedy et al. (2009) reported that the alpha-toxin of C. septicum
(pore-forming toxin) forms Ca permeable pores, which increase intracellular Ca. It was
believed that this Ca influx induced a cascade of events consistent with programmed necrosis
since it was associated with calpain activation and release of cathepsins from lysosomes. In
addition, Kennedy et al. (2009) also observed deregulation of mitochondrial activity leading
to an increase in reactive oxygen species and dramatically decreasing ATP levels. The
increase in mortality due to NE observed when broilers were fed 0.9% Ca as compared to
80
0.6% Ca in this trial, in association with other researchers findings in regards to Ca
participation in the mode of action of alpha-toxin and netB, strongly suggest that dietary Ca
level is an important factor in NE pathogenesis. The effect of Ca source also supports this
idea. Since HSC is more soluble than limestone (Walk et al., 2012), formulating diets with
HSC likely increases Ca availability in the intestinal lumen resulting in more extensive
damage to the intestinal mucosa.
In the past, Ca involvement with NE was thought to be associated with an increase in
gastrointestinal pH with high levels of Ca in the diet (Williams, 2005). In theory, the increase
in gastrointestinal pH would favor the proliferation of C. perfringens in the intestinal lumen.
Our data do not suggest that higher mortality when broilers were fed 0.9% Ca in the diet was
the result of pH changes. Changes in gastrointestinal pH were not observed until d 21, which
was well after the initial phase of the NE outbreak. In addition, pH changes were restricted to
the gizzard and not lower in the intestinal tract. Therefore, there is strong indication that Ca
impact on mortality due to NE was most likely associated with toxin activity.
Phytase supplementation improved BW and BWG regardless of Ca source and Ca
levels. Initially, when broilers were fed 0.9% Ca in the diet, phytase supplementation also
increased FI, which partially explains the improvements in BW and BWG. However, after d
14, phytase supplementation did not significantly affect FI. Improvements in BW and BWG
due to phytase supplementation have been reported by other researchers (Cowieson et al.
2004 and 2006; Selle et al., 2009). These improvements have been associated with extra-
phosphoric effects of phytase that result from the release of nutrients, other than P, from the
phytate molecule. When these nutrients are released from the phytate molecule they become
81
available for digestion and absorption, which ultimately results in improvements in animal
performance.
After d 7, Ca source had a significant impact on BW, BWG and FC. When broilers
were fed diets formulated with HSC, a reduction in BW and BWG was observed. Since there
were no differences in FI due to Ca source for the same periods, an increase in FC was
expected. HSC is a much more soluble Ca source than limestone under the same pH (Walk et
al., 2012). Therefore, when broilers are fed diets formulated with HSC, the concentration of
soluble Ca in the intestinal lumen is higher than when broilers are fed diets formulated with
limestone. Walk et al. (2012) did not report significant differences in BW, BWG and FI when
feeding broilers diets formulated with limestone or HSC. This lack of differences in their
study could be consequent to the fact that their birds were not undergoing an intestinal
challenge, and Ca concentrations had no impact on the physiological status of the intestinal
lining. Therefore, the differences observed in broiler performance due to Ca source in this
trial were likely due to the impact of Ca in the pathogenesis of NE. As previously discussed
in this manuscript, high Ca concentrations in the intestinal lumen could have a negative
impact on the mucosal lining during a NE episode as a result of toxin activity. Therefore, the
reduction in BW and BWG may be attributed to the reduction in ability to digest and absorb
nutrients by birds fed diets formulated with HSC. This reduction in the ability to digest and
absorb nutrients was likely due to more severe damage to the intestinal mucosa when broilers
were fed diets formulated with HSC when compared to broilers fed diets formulated with
limestone.
In this experiment, dietary Ca levels significantly impacted P digestibility. A high
ratio of dietary Ca to P reduces the digestibility and absorption of Ca and P due to increased
82
precipitation of Ca-P complexes (Plumstead et al., 2008; Selle et al. 2009). This effect is
more evident when formulating diets using HSC at standard industry levels (0.9% Ca). Since
HSC is more soluble then limestone, there is more Ca in solution that binds to P and
precipitates. Phosphorus digestibility was also impacted by exogenous phytase
supplementation. Improvements in P digestibility due to phytase supplementation result from
phytate P hydrolysis, which releases bound P from the phytate molecule and improves P
availability. Optimal P digestibility was observed when feeding diets formulated with
phytase and 0.6% Ca. This interaction between Ca and P has been described before, and can
be attributed to phytase activity and formation of mineral-phytate chelates. Tamim et al.
(2004) reported that phytase activity is decreased with increasing levels of Ca. Calcium is the
mineral added in highest concentrations in poultry diets. Therefore, Ca has a greater impact
than other dietary minerals in the formation of mineral-phytate chelates (Sebastian et al.,
1996; Tamim et al., 2004). The phytate molecule can carry up to twelve negative charges,
thus having the potential to chelate six Ca atoms (Selle et al., 2009). When Ca forms mineral-
phytate chelates, they precipitate becoming unavailable for digestion and absorption. In
addition, when these complexes precipitate they also become unavailable for phytase attack
and further decreasing P availability.
Calcium digestibility was also impacted by phytase supplementation. As discussed
above, Ca tends to form mineral-phytate chelates that precipitate. Therefore, phytase
supplementation improves P and Ca digestibility by reducing the formation of mineral-
phytate chelates. In addition, improvements in Ca digestibility were observed when broilers
were fed 0.6% Ca in the diet. Similar to P digestibility, excess Ca decreases its digestibility
due to the precipitation of Ca and P. Similar to results of Walk et al. (2012), no differences in
83
Ca digestibility were observed when comparing diets formulated with limestone or HSC,
which was surprising due to the greater solubility of HSC when compared to limestone. Walk
et al. (2012) suggested that in order to observe improvements in Ca digestibility due to Ca
source, further reductions in dietary Ca might be necessary.
In conclusion, Ca appears to be an important factor in NE pathogenesis. Calcium
involvement with NE pathogenesis is likely to be associated with netB and alpha-toxin
activity. Benefits from decreasing dietary levels of Ca are not restricted to bird mortality due
to NE. Feeding lower levels of Ca in the diet also resulted in improvements in bird
performance and mineral digestibility. Therefore, NRC (1994) requirements for Ca and P,
developed prior to widespread use of phytase, are likely to be inaccurate, and the poultry
industry needs to review these requirements especially when supplementing poultry diets
with exogenous phytases.
84
REFERENCES
Anderson, J. O., D. C. Dobson, and O. K. Jack. 1984. Effect of particle size of the calcium
source on performance of broiler chicks fed diets with different calcium and
phosphorus levels. Poult. Sci. 63:311-316.
AOAC International. 2000. Official Methods of Analysis. 17th Ed. Assoc. Off. Anal. Chem.,
Arlington, D.C.
Cowieson, A. J., P. Wilcock, and M. R. Bedford. 2011. Super-dosing effects of phytase in
poultry and other monogastrics. Worlds Poult. Sci. J. 67:225-235.
Cowieson, A. J., M. R. Bedford, P. H. Selle, and V. Ravindran. 2009. Phytate and microbial
phytase: implications for endogenous nitrogen losses and nutrient availability. Worlds
Poult. Sci. J. 65:401-417.
Cowieson, A. J., T. Acamovic, and M. R. Bedford. 2006. Supplementation of corn-soy-
based diets with an Escherichia coli derived phytase:effects on broiler chick
performance and the digestibility of amino acids and metabolizability of minerals and
energy. Poult. Sci. 85:1389-1397.
Cowieson, A. J., T. Acamovic, and M. R. Bedford. 2004. The effect of phytase and phytate
on endogenous losses from broiler chickens. Br. Poult. Sci. 45:101-108.
Kennedy, C. L., D. J. Smith, D. Lyras, A. Chakravorty, and J. I. Rood. 2009. Programmed
cellular necrosis mediated by the pore-forming alpha-toxin from Clostridium
septicum. PloS Pathog. 5:e1000516.
Keyburn, A. L., T. L. Bannam, R. J. Moore, and J. I. Rood. 2010. NetB, a pore-forming toxin
from necrotic enteritis strains of C. perfringens. Toxins 2:1913-1927.
85
Maenz,D. D., C. M. Engele-Schan, R. W. Newkirk, and H. L. Classen. 1999. The effect of
minerals and mineral chelators on the formation of phytase resistant and phytase-
susceptible forms of phytic acid in solution of canola mean. Anim. Feed Sci. Technol.
81:177-192.
Moreau, H. G. Pieroni, C. Jolivet-Reynaud, J. E. Alouf, and R. Verger. 1988. A new kinetic
approach for studying phospholipase C (Clostridium perfringens alpha-toxin) activity
on phospholipid monolayers. Biochemistry 27:2319-2323.
Mullaney, E. J., C. B. Daly, and A. H. J. Ullah. 2000. Advances in phytase research. Adv.
Appl. Microbiol. 47:157-199.
National Research Council. 1994. Nutrient requirements of poultry. 9th rev. ed. National
Academy Press, Washington, DC.
Perney, K. M., A. H. Cantor, M. L. Straw, and K. L. Herkelman. 1993. The effect of dietary
phytase on the growth performance and phosphorus utilization of broiler chicks.
Poult. Sci. 72:2106-2121.
Petit, L., M. Gibert, and M. R. Popoff. 1999. Clostridium perfringens: toxinotype and
genotype. Trends Microbiol. 7:104-110.
Plumstead, P. W., A. B. Leytem, R. O. Maguire, J. W. Spears, P. Kwanyuen, and J. Brake.
2008. Interaction of calcium and phytate in broiler diets 1. Effects on apparent
prececal digestibility and retention of phosphorus. Poult. Sci. 87:449-458.
Ravindran, V., W. L. Bryden, and E. T. Kornegay. 1995. Phytates: occurrence,
bioavailability and implications in poultry nutrition. Poult. Avian Biol. Rev. 6:125-
143.
86
Rutherfurd, S. M., T. K. Chung, D. V. Thomas, M. L. Zou, and P. J. Moughan. 2012. Effect
of a novel phytase on growth performance, apparent metabolizable energy, and the
availability of minerals and amino acids in a low-phosphorus corn-soybean meal diet
for broilers. Poult. Sci. 91:1118-1127.
Sebastian, S., S. P. Touchburn, E. R. Chavez, and P. C. Lague. 1996. Efficacy of
supplemental microbial phytase at different dietary calcium levels on growth
performance and mineral utilization of broiler chickens. Poult. Sci. 75:1516-1523.
Selle, P. H., A. J. Cowieson, and V. Ravindran. 2009. Consequences of calcium interaction
with phytate and phytase for poultry and pigs. Livest. Sci. 124:126-141.
Selle, P. H., V. Ravindran, R. A. Caldwell, and W. L. Bryden. 2000. Phytate and phytase:
consequences of protein utilization. Nutr. Res. Rev. 13:255-278.
Short, F. J., P. Gordon, J. Wiseman, and K. N. Boorman. 1996. Determination of titanium
dioxide added as an inert marker in chicken digestibility studies. Anim. Feed Sci.
Technol. 59:215-221.
Songer, J. G. 1996. Clostridial enteric diseases of domestic animals. Clin. Microbiol. Rev.
9:216-234.
Tamim, N. M., R. Angel, and M. Christman. 2004. Influence of dietary calcium and phytase
on phytate phosphorus hydrolysis in broiler chickens. Poult. Sci. 83:1358-1367.
Titball, R., C. Naylor, and A. Basak. 1999. The Clostridium perfringens alpha-toxin.
Anaerobe 5:51-64.
Walk, C. L., E. K. Addo-Chidie, M. R. Bedford, and O. Adeola. 2012. Evaluation of a highly
soluble calcium source and phytase in the diets of broiler chickens. Poult. Sci.
91:2255-2263.
87
Williams, R. B. 2005. Intercurrent coccidiosis and necrotic enteritis of chickens: rational,
integrated disease management by maintenance of gut integrity. Avian Pathol.
34:159-180.
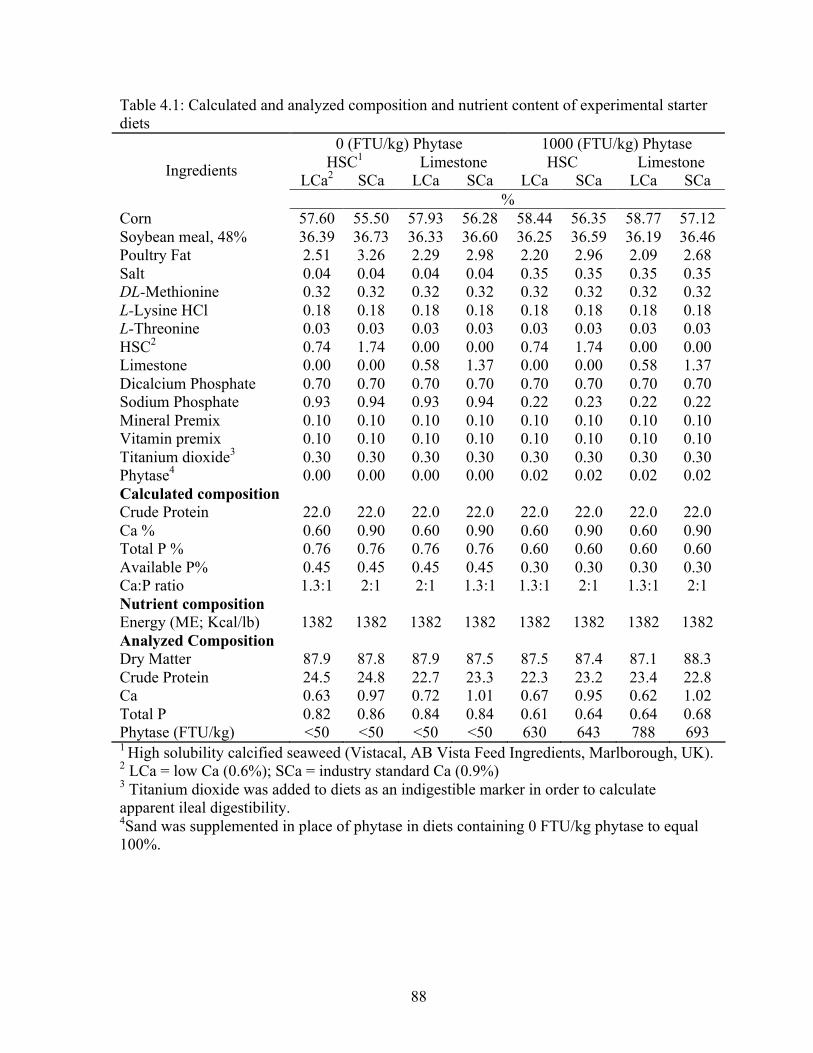
88
Table 4.1: Calculated and analyzed composition and nutrient content of experimental starter diets
0 (FTU/kg) Phytase 1000 (FTU/kg) Phytase HSC1 Limestone HSC Limestone
LCa2 SCa LCa SCa LCa SCa LCa SCa Ingredients
% Corn 57.60 55.50 57.93 56.28 58.44 56.35 58.77 57.12 Soybean meal, 48% 36.39 36.73 36.33 36.60 36.25 36.59 36.19 36.46 Poultry Fat 2.51 3.26 2.29 2.98 2.20 2.96 2.09 2.68 Salt 0.04 0.04 0.04 0.04 0.35 0.35 0.35 0.35 DL-Methionine 0.32 0.32 0.32 0.32 0.32 0.32 0.32 0.32 L-Lysine HCl 0.18 0.18 0.18 0.18 0.18 0.18 0.18 0.18 L-Threonine 0.03 0.03 0.03 0.03 0.03 0.03 0.03 0.03 HSC2 0.74 1.74 0.00 0.00 0.74 1.74 0.00 0.00 Limestone 0.00 0.00 0.58 1.37 0.00 0.00 0.58 1.37 Dicalcium Phosphate 0.70 0.70 0.70 0.70 0.70 0.70 0.70 0.70 Sodium Phosphate 0.93 0.94 0.93 0.94 0.22 0.23 0.22 0.22 Mineral Premix 0.10 0.10 0.10 0.10 0.10 0.10 0.10 0.10 Vitamin premix 0.10 0.10 0.10 0.10 0.10 0.10 0.10 0.10 Titanium dioxide3 0.30 0.30 0.30 0.30 0.30 0.30 0.30 0.30 Phytase4 0.00 0.00 0.00 0.00 0.02 0.02 0.02 0.02 Calculated composition Crude Protein 22.0 22.0 22.0 22.0 22.0 22.0 22.0 22.0 Ca % 0.60 0.90 0.60 0.90 0.60 0.90 0.60 0.90 Total P % 0.76 0.76 0.76 0.76 0.60 0.60 0.60 0.60 Available P% 0.45 0.45 0.45 0.45 0.30 0.30 0.30 0.30 Ca:P ratio 1.3:1 2:1 2:1 1.3:1 1.3:1 2:1 1.3:1 2:1 Nutrient composition Energy (ME; Kcal/lb) 1382 1382 1382 1382 1382 1382 1382 1382 Analyzed Composition Dry Matter 87.9 87.8 87.9 87.5 87.5 87.4 87.1 88.3 Crude Protein 24.5 24.8 22.7 23.3 22.3 23.2 23.4 22.8 Ca 0.63 0.97 0.72 1.01 0.67 0.95 0.62 1.02 Total P 0.82 0.86 0.84 0.84 0.61 0.64 0.64 0.68 Phytase (FTU/kg) <50 <50 <50 <50 630 643 788 693 1 High solubility calcified seaweed (Vistacal, AB Vista Feed Ingredients, Marlborough, UK). 2 LCa = low Ca (0.6%); SCa = industry standard Ca (0.9%) 3 Titanium dioxide was added to diets as an indigestible marker in order to calculate apparent ileal digestibility. 4Sand was supplemented in place of phytase in diets containing 0 FTU/kg phytase to equal 100%.
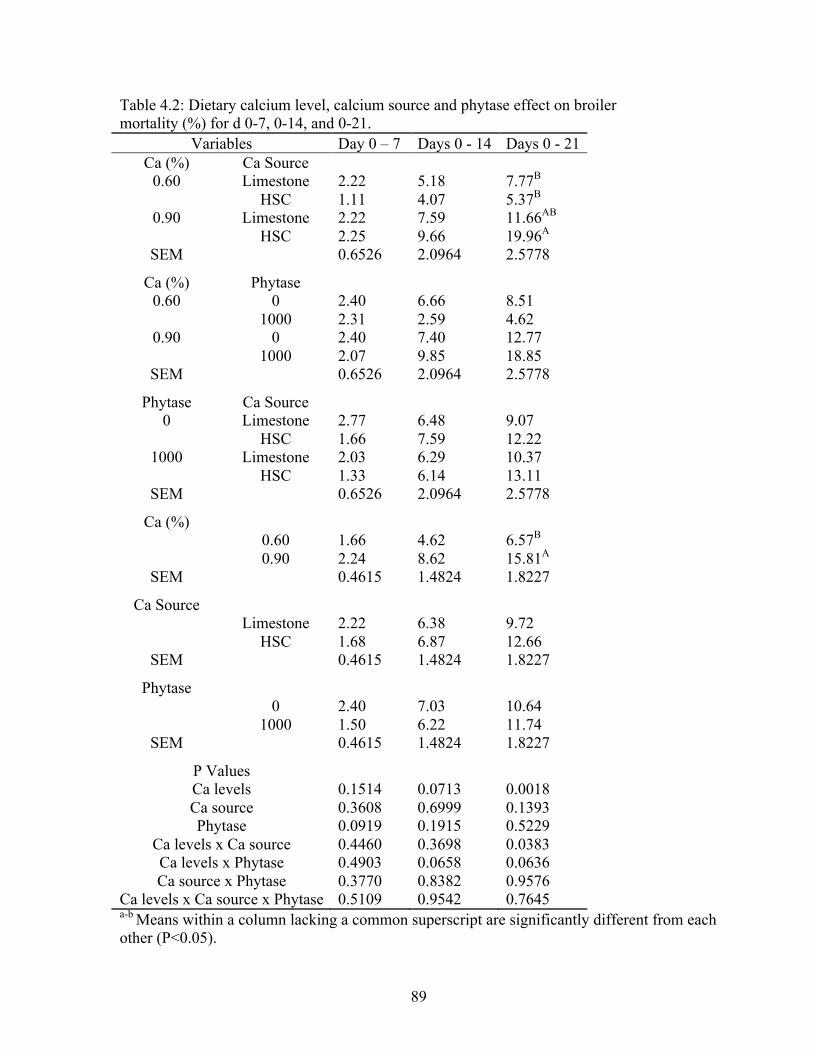
89
Table 4.2: Dietary calcium level, calcium source and phytase effect on broiler mortality (%) for d 0-7, 0-14, and 0-21.
Variables Day 0 – 7 Days 0 - 14 Days 0 - 21 Ca (%) Ca Source
0.60 Limestone 2.22 5.18 7.77B HSC 1.11 4.07 5.37B
0.90 Limestone 2.22 7.59 11.66AB HSC 2.25 9.66 19.96A
SEM 0.6526 2.0964 2.5778 Ca (%) Phytase
0.60 0 2.40 6.66 8.51 1000 2.31 2.59 4.62
0.90 0 2.40 7.40 12.77 1000 2.07 9.85 18.85
SEM 0.6526 2.0964 2.5778 Phytase Ca Source 0 Limestone 2.77 6.48 9.07 HSC 1.66 7.59 12.22
1000 Limestone 2.03 6.29 10.37 HSC 1.33 6.14 13.11
SEM 0.6526 2.0964 2.5778 Ca (%) 0.60 1.66 4.62 6.57B 0.90 2.24 8.62 15.81A
SEM 0.4615 1.4824 1.8227 Ca Source Limestone 2.22 6.38 9.72 HSC 1.68 6.87 12.66
SEM 0.4615 1.4824 1.8227 Phytase 0 2.40 7.03 10.64 1000 1.50 6.22 11.74
SEM 0.4615 1.4824 1.8227 P Values
Ca levels 0.1514 0.0713 0.0018 Ca source 0.3608 0.6999 0.1393 Phytase 0.0919 0.1915 0.5229
Ca levels x Ca source 0.4460 0.3698 0.0383 Ca levels x Phytase 0.4903 0.0658 0.0636 Ca source x Phytase 0.3770 0.8382 0.9576
Ca levels x Ca source x Phytase 0.5109 0.9542 0.7645 a-b Means within a column lacking a common superscript are significantly different from each other (P<0.05).
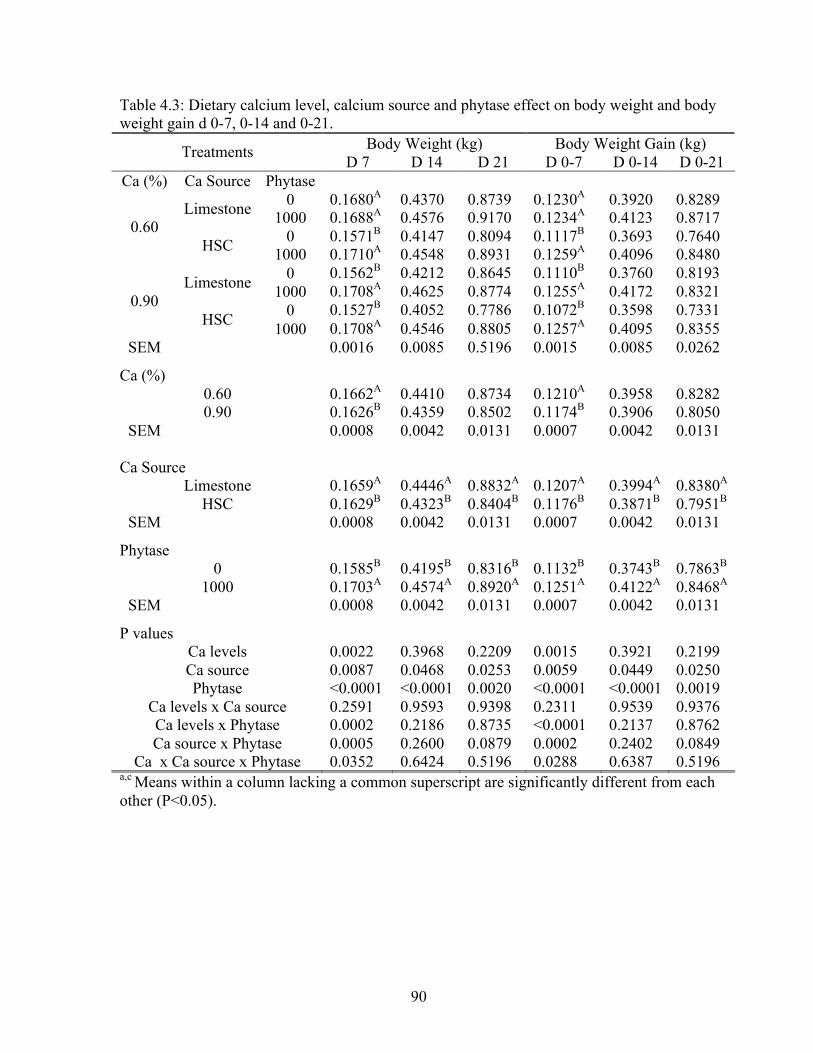
90
Table 4.3: Dietary calcium level, calcium source and phytase effect on body weight and body weight gain d 0-7, 0-14 and 0-21.
Body Weight (kg) Body Weight Gain (kg) Treatments D 7 D 14 D 21 D 0-7 D 0-14 D 0-21 Ca (%) Ca Source Phytase
0 0.1680A 0.4370 0.8739 0.1230A 0.3920 0.8289 Limestone 1000 0.1688A 0.4576 0.9170 0.1234A 0.4123 0.8717 0 0.1571B 0.4147 0.8094 0.1117B 0.3693 0.7640 0.60
HSC 1000 0.1710A 0.4548 0.8931 0.1259A 0.4096 0.8480 0 0.1562B 0.4212 0.8645 0.1110B 0.3760 0.8193 Limestone 1000 0.1708A 0.4625 0.8774 0.1255A 0.4172 0.8321 0 0.1527B 0.4052 0.7786 0.1072B 0.3598 0.7331 0.90
HSC 1000 0.1708A 0.4546 0.8805 0.1257A 0.4095 0.8355 SEM 0.0016 0.0085 0.5196 0.0015 0.0085 0.0262
Ca (%) 0.60 0.1662A 0.4410 0.8734 0.1210A 0.3958 0.8282 0.90 0.1626B 0.4359 0.8502 0.1174B 0.3906 0.8050
SEM 0.0008 0.0042 0.0131 0.0007 0.0042 0.0131
Ca Source Limestone 0.1659A 0.4446A 0.8832A 0.1207A 0.3994A 0.8380A HSC 0.1629B 0.4323B 0.8404B 0.1176B 0.3871B 0.7951B
SEM 0.0008 0.0042 0.0131 0.0007 0.0042 0.0131 Phytase 0 0.1585B 0.4195B 0.8316B 0.1132B 0.3743B 0.7863B 1000 0.1703A 0.4574A 0.8920A 0.1251A 0.4122A 0.8468A
SEM 0.0008 0.0042 0.0131 0.0007 0.0042 0.0131 P values
Ca levels 0.0022 0.3968 0.2209 0.0015 0.3921 0.2199 Ca source 0.0087 0.0468 0.0253 0.0059 0.0449 0.0250 Phytase <0.0001 <0.0001 0.0020 <0.0001 <0.0001 0.0019
Ca levels x Ca source 0.2591 0.9593 0.9398 0.2311 0.9539 0.9376 Ca levels x Phytase 0.0002 0.2186 0.8735 <0.0001 0.2137 0.8762 Ca source x Phytase 0.0005 0.2600 0.0879 0.0002 0.2402 0.0849
Ca x Ca source x Phytase 0.0352 0.6424 0.5196 0.0288 0.6387 0.5196 a,c Means within a column lacking a common superscript are significantly different from each other (P<0.05).
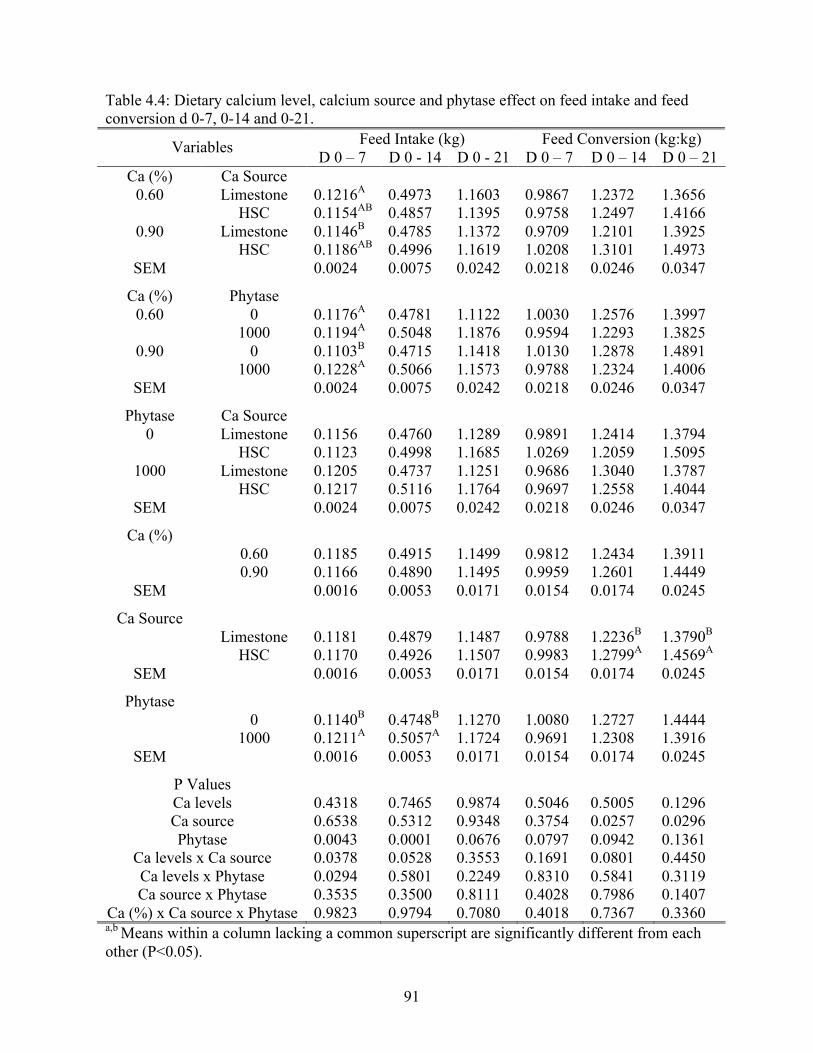
91
Table 4.4: Dietary calcium level, calcium source and phytase effect on feed intake and feed conversion d 0-7, 0-14 and 0-21.
Feed Intake (kg) Feed Conversion (kg:kg) Variables D 0 – 7 D 0 - 14 D 0 - 21 D 0 – 7 D 0 – 14 D 0 – 21 Ca (%) Ca Source
0.60 Limestone 0.1216A 0.4973 1.1603 0.9867 1.2372 1.3656 HSC 0.1154AB 0.4857 1.1395 0.9758 1.2497 1.4166
0.90 Limestone 0.1146B 0.4785 1.1372 0.9709 1.2101 1.3925 HSC 0.1186AB 0.4996 1.1619 1.0208 1.3101 1.4973
SEM 0.0024 0.0075 0.0242 0.0218 0.0246 0.0347 Ca (%) Phytase
0.60 0 0.1176A 0.4781 1.1122 1.0030 1.2576 1.3997 1000 0.1194A 0.5048 1.1876 0.9594 1.2293 1.3825
0.90 0 0.1103B 0.4715 1.1418 1.0130 1.2878 1.4891 1000 0.1228A 0.5066 1.1573 0.9788 1.2324 1.4006
SEM 0.0024 0.0075 0.0242 0.0218 0.0246 0.0347 Phytase Ca Source 0 Limestone 0.1156 0.4760 1.1289 0.9891 1.2414 1.3794 HSC 0.1123 0.4998 1.1685 1.0269 1.2059 1.5095
1000 Limestone 0.1205 0.4737 1.1251 0.9686 1.3040 1.3787 HSC 0.1217 0.5116 1.1764 0.9697 1.2558 1.4044
SEM 0.0024 0.0075 0.0242 0.0218 0.0246 0.0347 Ca (%) 0.60 0.1185 0.4915 1.1499 0.9812 1.2434 1.3911 0.90 0.1166 0.4890 1.1495 0.9959 1.2601 1.4449
SEM 0.0016 0.0053 0.0171 0.0154 0.0174 0.0245 Ca Source Limestone 0.1181 0.4879 1.1487 0.9788 1.2236B 1.3790B HSC 0.1170 0.4926 1.1507 0.9983 1.2799A 1.4569A
SEM 0.0016 0.0053 0.0171 0.0154 0.0174 0.0245 Phytase 0 0.1140B 0.4748B 1.1270 1.0080 1.2727 1.4444 1000 0.1211A 0.5057A 1.1724 0.9691 1.2308 1.3916
SEM 0.0016 0.0053 0.0171 0.0154 0.0174 0.0245 P Values
Ca levels 0.4318 0.7465 0.9874 0.5046 0.5005 0.1296 Ca source 0.6538 0.5312 0.9348 0.3754 0.0257 0.0296 Phytase 0.0043 0.0001 0.0676 0.0797 0.0942 0.1361
Ca levels x Ca source 0.0378 0.0528 0.3553 0.1691 0.0801 0.4450 Ca levels x Phytase 0.0294 0.5801 0.2249 0.8310 0.5841 0.3119 Ca source x Phytase 0.3535 0.3500 0.8111 0.4028 0.7986 0.1407
Ca (%) x Ca source x Phytase 0.9823 0.9794 0.7080 0.4018 0.7367 0.3360 a,b Means within a column lacking a common superscript are significantly different from each other (P<0.05).
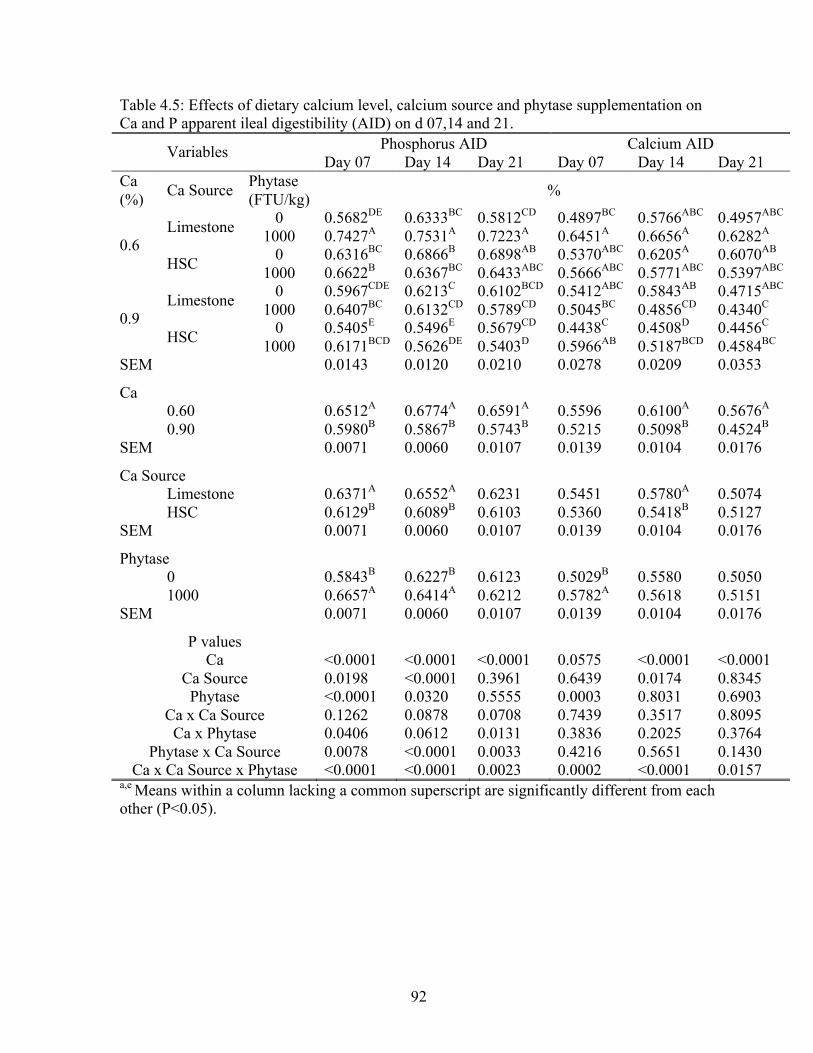
92
Table 4.5: Effects of dietary calcium level, calcium source and phytase supplementation on Ca and P apparent ileal digestibility (AID) on d 07,14 and 21. Phosphorus AID Calcium AID Variables Day 07 Day 14 Day 21 Day 07 Day 14 Day 21 Ca (%) Ca Source Phytase
(FTU/kg) %
0 0.5682DE 0.6333BC 0.5812CD 0.4897BC 0.5766ABC 0.4957ABC Limestone 1000 0.7427A 0.7531A 0.7223A 0.6451A 0.6656A 0.6282A 0 0.6316BC 0.6866B 0.6898AB 0.5370ABC 0.6205A 0.6070AB 0.6
HSC 1000 0.6622B 0.6367BC 0.6433ABC 0.5666ABC 0.5771ABC 0.5397ABC 0 0.5967CDE 0.6213C 0.6102BCD 0.5412ABC 0.5843AB 0.4715ABC Limestone 1000 0.6407BC 0.6132CD 0.5789CD 0.5045BC 0.4856CD 0.4340C 0 0.5405E 0.5496E 0.5679CD 0.4438C 0.4508D 0.4456C 0.9
HSC 1000 0.6171BCD 0.5626DE 0.5403D 0.5966AB 0.5187BCD 0.4584BC SEM 0.0143 0.0120 0.0210 0.0278 0.0209 0.0353 Ca 0.60 0.6512A 0.6774A 0.6591A 0.5596 0.6100A 0.5676A 0.90 0.5980B 0.5867B 0.5743B 0.5215 0.5098B 0.4524B SEM 0.0071 0.0060 0.0107 0.0139 0.0104 0.0176 Ca Source Limestone 0.6371A 0.6552A 0.6231 0.5451 0.5780A 0.5074 HSC 0.6129B 0.6089B 0.6103 0.5360 0.5418B 0.5127 SEM 0.0071 0.0060 0.0107 0.0139 0.0104 0.0176 Phytase 0 0.5843B 0.6227B 0.6123 0.5029B 0.5580 0.5050 1000 0.6657A 0.6414A 0.6212 0.5782A 0.5618 0.5151 SEM 0.0071 0.0060 0.0107 0.0139 0.0104 0.0176 P values
Ca <0.0001 <0.0001 <0.0001 0.0575 <0.0001 <0.0001 Ca Source 0.0198 <0.0001 0.3961 0.6439 0.0174 0.8345
Phytase <0.0001 0.0320 0.5555 0.0003 0.8031 0.6903 Ca x Ca Source 0.1262 0.0878 0.0708 0.7439 0.3517 0.8095
Ca x Phytase 0.0406 0.0612 0.0131 0.3836 0.2025 0.3764 Phytase x Ca Source 0.0078 <0.0001 0.0033 0.4216 0.5651 0.1430
Ca x Ca Source x Phytase <0.0001 <0.0001 0.0023 0.0002 <0.0001 0.0157 a,e Means within a column lacking a common superscript are significantly different from each other (P<0.05).
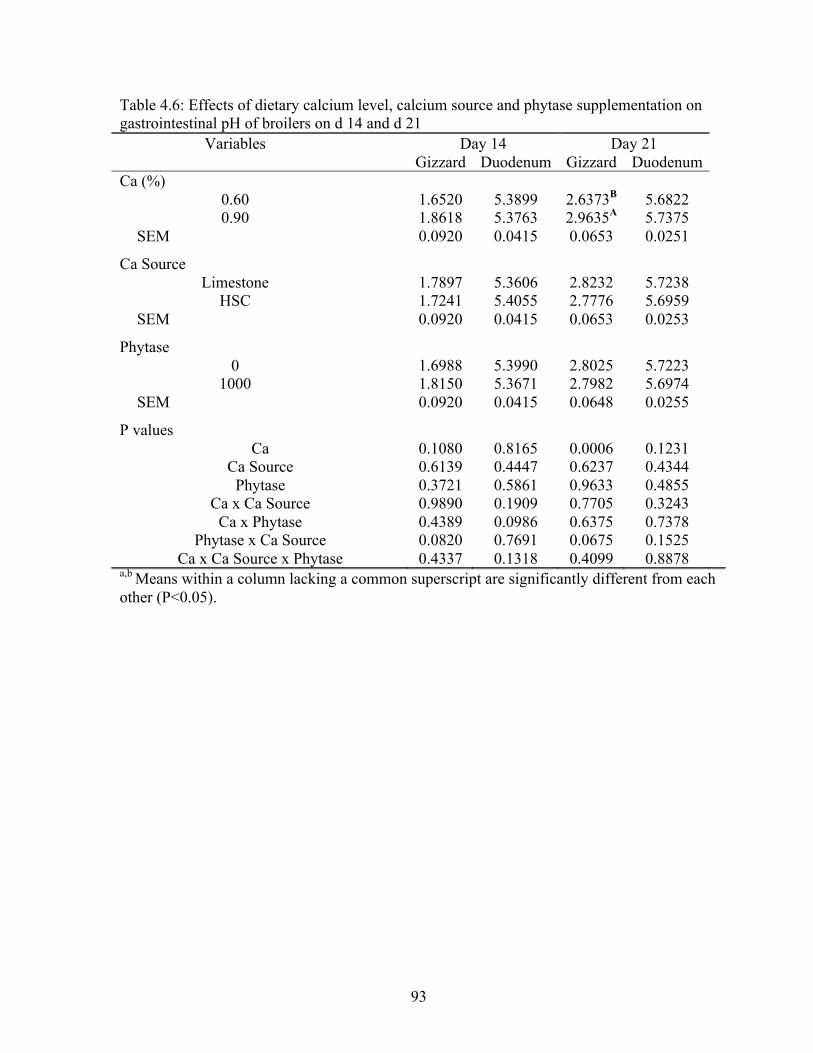
93
Table 4.6: Effects of dietary calcium level, calcium source and phytase supplementation on gastrointestinal pH of broilers on d 14 and d 21
Variables Day 14 Day 21 Gizzard Duodenum Gizzard Duodenum
Ca (%) 0.60 1.6520 5.3899 2.6373B 5.6822 0.90 1.8618 5.3763 2.9635A 5.7375
SEM 0.0920 0.0415 0.0653 0.0251 Ca Source Limestone 1.7897 5.3606 2.8232 5.7238 HSC 1.7241 5.4055 2.7776 5.6959
SEM 0.0920 0.0415 0.0653 0.0253 Phytase 0 1.6988 5.3990 2.8025 5.7223 1000 1.8150 5.3671 2.7982 5.6974
SEM 0.0920 0.0415 0.0648 0.0255 P values
Ca 0.1080 0.8165 0.0006 0.1231 Ca Source 0.6139 0.4447 0.6237 0.4344
Phytase 0.3721 0.5861 0.9633 0.4855 Ca x Ca Source 0.9890 0.1909 0.7705 0.3243
Ca x Phytase 0.4389 0.0986 0.6375 0.7378 Phytase x Ca Source 0.0820 0.7691 0.0675 0.1525
Ca x Ca Source x Phytase 0.4337 0.1318 0.4099 0.8878 a,b Means within a column lacking a common superscript are significantly different from each other (P<0.05).
94
Chapter V: Epilogue
In the past 20 years, several feed additives have been introduced into poultry diets in
order to improve nutrient availability and digestibility. However, poultry nutritionists still use
NRC (1994) nutrient requirements as reference when formulating broiler diets. Phytase
supplementation is probably one of the best examples to illustrate the likely inaccuracy of
nutrient requirements for growing broilers. It has been estimated that at least 50% of poultry
diets are supplemented with exogenous phytases. NRC experiments that were designed to
establish nutrient requirements for growing broilers were not conducted supplementing birds
with exogenous phytases, and yet poultry nutritionists still formulate broiler diets using NRC
(1994) requirements as reference. Therefore, to say that NRC (1994) nutrient requirements
are inaccurate is probably an understatement, and the poultry industry needs to review these
requirements especially when supplementing poultry diets with exogenous phytases.
Benefits from phytase supplementation are evident from improvements in nutrient
digestibility and bird performance. However, little information is available in peered
reviewed literature about the effects of phytase supplementation on gastrointestinal health.
Since exogenous phytases improve nutrient availability, phytases have the likelihood to alter
the dynamics in the intestinal lumen in disease settings. In this dissertation we had the chance
to research some of the consequences of phytase supplementation during a necrotic enteritis
outbreak. Our data revealed that while phytase supplementation still improved nutrient
digestibility, necrotic enteritis masked benefits in bird performance from phytase
supplementation. Results from this trial also suggest that phytase supplementation might be
detrimental to intestinal health, since nutrients released from the phytate molecule may be
utilized by enteric pathogens when animals are unable to digest and absorb these nutrients.
95
Information regarding the effects on phytase supplementation on gastrointestinal
health could be extremely useful for the poultry industry. When supplementing diets with
exogenous phytases, poultry nutritionists are apprehensive with the discrepancy between bird
performance of commercial houses and research trials. These disparities in response are
probably associated with environmental and managerial differences of commercial houses
and experimental settings. During research trials, the environment is more controlled in order
to eliminate external factors that would influence the results. In commercial settings, all these
factors act in association likely resulting in the discrepancies observed. Therefore,
understanding the effects of phytase supplementation in gastrointestinal health could help
identify these differences in responses, and ultimately improve efficacy of phytase
supplementation by addressing these differences.
Further research needs to be conducted to better elucidate the role of calcium in the
pathogenesis of necrotic enteritis. The increase in mortality due to NE observed when
broilers were fed 0.9% Ca as compared to 0.6% Ca in this trial, in association with other
researchers findings in regards to Ca participation in the mode of action of alpha-toxin and
netB, strongly suggest that dietary Ca level is an important factor in NE pathogenesis. It is
necessary to research the mechanisms in which calcium affects toxin activity. In addition,
further research is needed to determine the true nutrient requirements with exogenous
phytase supplementation. Research has revealed several extra-phosphoric benefits from
phytase supplementation. The supplementation of poultry diets with other exogenous
enzymes, such as glucanases, xylanases and proteases, also has an impact in nutrient
requirements. The intestinal lumen is a very dynamic environment giving ample opportunity
for enzymes to interact with nutrients and with each other. Additionally, data from this work

96
supports that exogenous phytases have a significant impact in gastrointestinal health.
Therefore, the impact of enzyme supplementation needs to be further explored.