Embed Size (px)
Citation preview
Minnesota State University, MankatoCornerstone: A Collection of
Scholarly and Creative Works forMinnesota State University,
MankatoAll Theses, Dissertations, and Other CapstoneProjects Theses, Dissertations, and Other Capstone Projects
2017
The Effects of Fiber Orientation and VolumeFraction of Fiber on Mechanical Properties ofAdditively Manufactured Composite MaterialSuresh Chandra KuchipudiMinnesota State University, Mankato
Follow this and additional works at: http://cornerstone.lib.mnsu.edu/etds
Part of the Materials Science and Engineering Commons, and the Mechanical EngineeringCommons
This Thesis is brought to you for free and open access by the Theses, Dissertations, and Other Capstone Projects at Cornerstone: A Collection ofScholarly and Creative Works for Minnesota State University, Mankato. It has been accepted for inclusion in All Theses, Dissertations, and OtherCapstone Projects by an authorized administrator of Cornerstone: A Collection of Scholarly and Creative Works for Minnesota State University,Mankato.
Recommended CitationKuchipudi, Suresh Chandra, "The Effects of Fiber Orientation and Volume Fraction of Fiber on Mechanical Properties of AdditivelyManufactured Composite Material" (2017). All Theses, Dissertations, and Other Capstone Projects. 734.http://cornerstone.lib.mnsu.edu/etds/734
The Effects of Fiber Orientation and Volume Fraction of Fiber on Mechanical Properties of
Additively Manufactured Composite Material
By
Suresh Chandra Kuchipudi
A Thesis Submitted in Partial Fulfillment of the
Requirements for the Degree of
Master of Science
In
Manufacturing Engineering Technology
Minnesota State University, Mankato
Mankato, Minnesota
July 2017

07/17/2017 The effects of Fiber Orientation and Volume Fraction of fiber on mechanical properties of additively manufactured composite material. Suresh Chandra Kuchipudi This thesis has been examined and approved by the following members of the student’s committee.
________________________________ Dr. Kuldeep Agarwal
Advisor and Committee member
________________________________ Dr. Shaheen Ahmed Committee Member
________________________________ Dr. Harry Petersen
Committee Member

i
Acknowledgments
Firstly, I would like to express my deepest gratitude to my advisor Dr. Kuldeep Agarwal, for his
patience, support, valuable guidance, and encouragement throughout the entire journey of my
thesis completion. I whole heartedly thank him for providing me with all required guidance and
support to carry out my research. I am extremely fortunate to have an advisor like him with
extensive knowledge in additive manufacturing encouraged my learning process and successful
completion of my research.
Secondly, I would like to thank the members of my thesis committee, Dr. Shaheen Ahmed and Dr.
Harry Petersen for their valuable discussions and accessibility. I would also like to deeply thank
Dr. Bruce Jones who has helped in the transfer process. Besides, I am thankful to Mr. Kevin Schull
for his valuable help with the instruments during experiments and support in time of trouble and
trusting me to use the equipment. My sincere thanks also goes to my fellow researchers Mr. Girard,
Benoit Anaas for his help with the experiments, Mr. Sai Ram Vangapally and Mr. Keerthi Krishna
Parvathaneni for their guidance in tough times.
Equally, my friend Ms. Sushma Rao Pinninti deserves a special acknowledgment as she has been
responsible for supporting and motivating me. Most importantly, I express my sincere gratitude
and thanks to my parents Mr. Lakshmana Rao Kuchipudi, and Mrs. Baby Suseela Kuchipudi and
my brother Mr. Uday Bhaskar Kuchipudi, who always believed in me and made me who I am
today.
Abstract
Additive manufacturing (AM) also known as 3D printing has tremendous advancements in recent
days with a vast number of applications in industrial, automotive, architecture, consumer projects,
fashion, toys, food, art, etc. Composite materials are widely used in structures with weight as a
critical factor especially in aerospace industry. Recently, additive manufacturing technology, a
rapidly growing innovative technology, has gained lot of importance in making composite
materials. The properties of composite materials depend upon the properties of constituent’s matrix
and fiber. There is lot of research on effect of fiber orientation on mechanical properties of
composite materials made using conventional manufacturing methods. It will be interesting and
relevant to study the relationship between the fiber orientation and fiber volume with mechanical
properties of additively manufactured composite materials. This thesis work presents experimental
investigation of mechanical behavior like tensile strength and fatigue life with variation in fiber
orientation and fiber volume fraction of 3D printed composite materials. The aim is to study the
best combination of volume fraction of fiber and fiber orientation that has better fatigue strength
for additive manufactured composite materials. Using this study, we can decide the type of
orientation and volume percent for desired properties. This study also finds the range of fatigue
limits of 3d printed composite materials.
Keywords: additive manufacturing, composite material, 3d printing, fiber glass, MTS,
nylon, fatigue testing, tensile testing
ii
i
Table of Contents
Acknowledgments................................................................................................................ i
Abstract ............................................................................................................................... ii
Introduction ......................................................................................................................... 1
Literature review ................................................................................................................. 2
Composite Materials ........................................................................................................... 4
Uses of composite materials ........................................................................................... 4
Classification of composites ........................................................................................... 5
Filament winding ........................................................................................................ 8
Compression molding ................................................................................................. 9
Pultrusion .................................................................................................................... 9
Vacuum bag molding .................................................................................................. 9
Vacuum infusion process ............................................................................................ 9
Resin transfer molding .............................................................................................. 10
Volume and mass fraction ............................................................................................. 10
Longitudinal modulus of unidirectional lamina .............................................................11
Additive Manufacturing .................................................................................................... 12
Types of 3d Printing ...................................................................................................... 14
Stereolithography (SLA) ........................................................................................... 15
Digital Light Processing(DLP) ................................................................................. 15
Fused Deposition Modeling (FDM).......................................................................... 15
Selective Laser Sintering (SLS) ................................................................................ 16
Selective laser melting (SLM) .................................................................................. 16
Electronic Beam Melting (EBM) .............................................................................. 17
Laminated Object Manufacturing (LOM) ................................................................ 17
Composite Filament Fabrication ............................................................................... 17
Materials used in additive manufacturing ..................................................................... 18
Polylactic acid (PLA) ................................................................................................ 18
Acrylonitrile Butadiene Styrene (ABS) .................................................................... 18
Nylon (Polyamide) .................................................................................................... 19
Polyethylene Terephthalate, PET (CPE) ................................................................... 19
Metal PLA / Metal ABS ............................................................................................ 19
Carbon fiber .............................................................................................................. 20
Fiber glass ................................................................................................................. 20
Markforged printer ........................................................................................................ 20
Advantages of 3d printing ......................................................................................... 22
Disadvantages of 3d printing .................................................................................... 22
Fatigue............................................................................................................................... 23
Analysis Considerations................................................................................................ 23

Terminology .................................................................................................................. 24
Fatigue failure by time-varying loading ....................................................................... 25
Fatigue failure by time-varying loading ....................................................................... 25
S-N curve ...................................................................................................................... 25
Machine using for fatigue testing ................................................................................. 26
Methodology ..................................................................................................................... 27
Parameters affecting the properties of the 3d Printed composite materials .................. 28
Procedure ...................................................................................................................... 29
Composite preparation .............................................................................................. 29
Randomizing the prints using excel .............................................................................. 31
Printing the test specimen ............................................................................................. 33
Creating Build plate ...................................................................................................... 37
Troubleshooting Prints .................................................................................................. 38
Common Printing Issues ............................................................................................... 39
Plastic burning .......................................................................................................... 39
Fiber residue.............................................................................................................. 39
Warping or Curling ................................................................................................... 39
Plastic stringing ......................................................................................................... 40
Attaching tabs ............................................................................................................... 40
Fatigue experimental testing ......................................................................................... 41

Proportional Gain (P Gain) ........................................................................................... 41
Results and Discussion ..................................................................................................... 45
0D-6F ............................................................................................................................ 46
OD-12F ......................................................................................................................... 46
45D-6F .......................................................................................................................... 47
45D-12F ........................................................................................................................ 48
90D-6F .......................................................................................................................... 48
90D-12F ........................................................................................................................ 50
Conclusion and Future Scope ........................................................................................... 52
References ......................................................................................................................... 53
List of Figures
Figure 1Classification of Composites ............................................................................................. 5
Figure 2 Composite manufacturing using Hand-layout process. .................................................... 8
Figure 3Comparison between 2D printing vs. 3D printing........................................................... 13
Figure 4Schematic diagram of 3d printer working. ...................................................................... 14
Figure 5Fiber glass Spool used in Markforged printer referred from (www.becoming3d.com) .. 20
Figure 6Markforged “Mark Two” printer referred from Markforged.com ................................... 21
Figure 7 S-N Curve Terminology ................................................................................................. 24
Figure 8 Fatigue life curve referred from siemens PLM community ........................................... 25
Figure 9 MTS Machine used for testing ....................................................................................... 27
Figure 10 Cause and effect diagram for understanding mechanical properties of AM parts........ 28
Figure 11 2D View of specimen with tabs attached ...................................................................... 29
Figure 12 Eiger Software Interface ............................................................................................... 34
Figure 13 Internal View of Sample in Eiger Software .................................................................. 34
Figure 14 Fiber orientation inside the sample ............................................................................... 35
Figure 15 Figure time and material usage of each part ................................................................. 36
Figure 16 Figure Internal view layers with fibers ......................................................................... 36
Figure 17 Fig Build page of Eiger software.................................................................................. 37
Figure 18 Printing the random samples Using Markforged Printer .............................................. 38
Figure 19 Failed print caused damage to print bed ....................................................................... 40
Figure 20 Attaching tabs to specimens ......................................................................................... 40
Figure 21 Tuning of MTS machine ............................................................................................... 42
Figure 22 Pressure adjustment for grip ......................................................................................... 42
Figure 23 Input parameters for fatigue testing .............................................................................. 43
Figure 24 MTS software interface during Fatigue testing ............................................................ 44
Figure 25 MTS machine running fatigue testing .......................................................................... 45
Figure 26 S-N curve for 0D-6F ..................................................................................................... 46
Figure 27 S-N curve for 0D-12F ................................................................................................... 46
Figure 28 S-N curve for 45D-6F ................................................................................................... 47
Figure 29 S-N curve for 45D-12F ................................................................................................. 48
Figure 30 S-N curve for 90D-6F ................................................................................................... 49
Figure 31 S-N curve for 90D-12F ................................................................................................. 50
Figure 32 Specimens after the Fatigue testing. 90D on top, 0D in middle, 45 in the bottom ...... 51
Figure 33 Samples tested for fatigue testing. ................................................................................ 51

List of Tables
Table 1 Samples with different configuration ............................................................................... 30
Table 2 Total number of samples to print ..................................................................................... 30
Table 3 Randomizing the experiments .......................................................................................... 31
Table 4 Overall Fatigue Data comparison. ................................................................................... 50
1
Introduction
As additive manufacturing is enhancing constantly, it has become a powerful tool in
creating complex structure and geometries with efficient use of the material in a brief time. Among
all other sectors where additive manufacturing technology user-friendly in medical, automotive,
and aerospace Industries. The main advantage of this technology is its affordability, low volume
production with customized products and diverse applications. Although it has so many advantages,
there is still a lot more to improve in the low-quality production, material affordability, equipment
accuracy, and reliability.
Composite are two or more materials combined so that other materials enhance the
structural properties. for better composite material properties like tensile, fatigue etc., unique type
and quantities of the individual material is selected and combined. Composites have more stiffness
to weight ratio compared to the traditional materials like metal alloys.
The aim of the study the effect of fiber orientation along with volume fraction on the
mechanical properties of additive manufactured composite materials are being studied in detail.
Also, the mechanical properties of additive takes composite materials are being compared to that
of conventional manufactured.
Therefore, in this research study, we tried to experimentally investigate the mechanical
behavior of 3D printed Fiber Glass material by completing tensile and fatigue testing using ASTM
standards.
2
Literature review
Banakar et al. [1] studied the impact of fiber orientation and thickness of laminated polymer
composites on tensile properties. The materials used are bi-woven fiber glass that acts like
reinforcements and epoxy resin as a matrix material that with transfer the load to the stiff fibers
through shear stress. Three different orientation ±30°, ±45°, ±90° and two different thickness 2mm
and 3mm are considered. The specimens are made by using a hand lay-up process. Tensile testing
of these specimens is tested by using UTM machine They came with some conclusions that
specimens with lesser thickness prompt greater ultimate tensile strength regardless of the fiber
orientation. In addition to that, the with 90° orientations will withstand higher loads compared to
other orientations. Furthermore, Young's modulus and thickness are in inversely proportional.
Finally, they concluded that the elongation of the sample is less in the case of 90° and higher in
the case of 30°.
Razzak et al. [2] investigated the effects of volume fraction on fatigue strength of
unsaturated polyester/glass fiber composites. It studies polymeric composites from unsaturated
polyester as a matrix reinforced with glass fiber. Two different volume fractions i.e. ratio of fiber
volume to the composite volume is considered 20% and 40%. The samples were tested for
reinforced with uniform (woven) epoxy-glass fiber and random (continuous fibers). The study
shows both samples with volume fraction 40% has more fatigue strength than the samples with
the volume fraction of 20%. The single sheet with required dimensions are made and then it is cut
to specimens. The instruments used are Alterbending bending fatigue machine. The study also
showed that the samples reinforced with uniform (woven) have fatigue strength more than that for
sample reinforced with random (Continuous fibers).
3
Research done by Kumaresan et al. [3] explored the effects of fiber orientation on
mechanical properties of sisal fiber reinforced epoxy composites. samples made from compression
molding with orientations of 0°, 90° and 45° are tested for mechanical properties. The material
used is Sisal fiber (botanical name Agave sisalana fiber) that was treated with NaOH solution, the
matrix material is an Epoxy resin of the grade LY556. The mechanical properties are studied using
three different experiments namely tensile testing, bending test or Flexural test and impact test.
The mechanical properties like tensile and flexural strength and impact strength are maximum in
case of 90° orientation compared to 0° and 45°. They concluded that the 90° orientation will have
better mechanical properties in this case. In addition,
Research conducted by Jones et al. [4] revealed the effects on material properties of layer-
layer application of pressure for the polymeric parts generated by using additively manufacturing
technology. This study compares the properties of commercial thermoplastic elastomers and
selective laser sintering (SLS). This concludes that the applying pressure increases the mechanical
properties compared to conventional methods. And their future work focusses on perfecting
processing conditions to know the processable range materials using additive manufacturing.
From this literature review, these studies made it straightforward for me to understand
current and future research in the field of additive manufacturing and composites. I realized that
volume fraction and fiber orientation are clearly affecting the mechanical properties of composites.
So, the work in this thesis investigates the effects of the orientation of fibers and volume percent
on additively manufactured composite materials.

4
Composite Materials
Composites are generally a combination of two or more material with different properties
that yield to a new material with properties different and better compared to the original material.
Composite exist in natural and man-made form. Some of the natural composites are wood made
with cellulose and lignin. The bone that is made from calcium phosphate, collagen. Granite made
up of feldspar, mica, and quartz. Some of the man-made composites include concrete made with
sand cement and water, Fiberglass that is a plastic matrix with glass fibers reinforcements. Cement
made with ceramics and metal composites. Although some materials seem like composite they are
not. For example, plastic that has many fillers they do not change the physical properties. Also
metal with impurities does not change physical properties in a noticeable amount.
Uses of composite materials
Now a day's composite has a vast number of applications. Industries like Automotive,
aerospace, sports, transportation, infrastructure, healthcare, heavy machinery, consumer goods,
agriculture equipment, biomedical industry, computers and much more. In aerospace, the parts
need to be lighter, stronger, temperature resistant, and good wear resistant. Some of the
components are elevators, rudders, doors, nose, spoilers, stabilizers etc. in aircraft. Pressure tanks,
fuel tanks, turbo-motor stators, nose in rockets and missiles. Frames, structural parts, and antennae
in satellites. Composites are used to construct Dams, Railway coaches, bridges, ships, boats, trucks,
motor cycles, etc.
5
Classification of composites
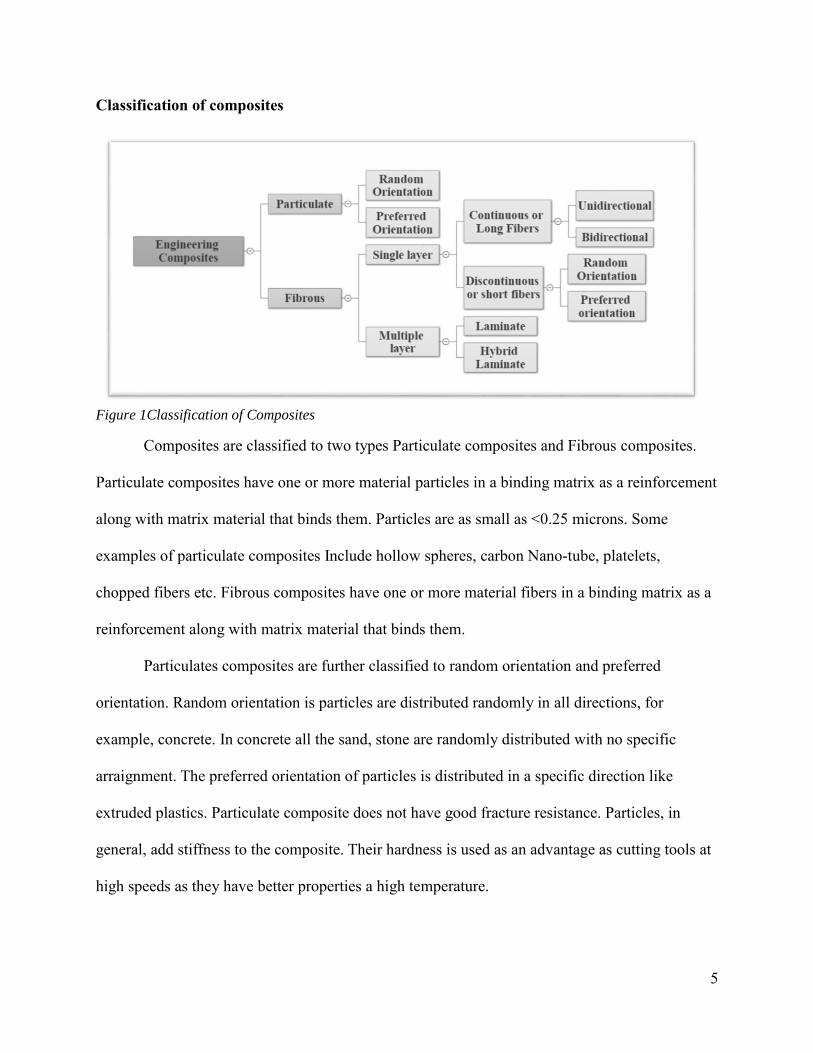
Figure 1Classification of Composites
Composites are classified to two types Particulate composites and Fibrous composites.
Particulate composites have one or more material particles in a binding matrix as a reinforcement
along with matrix material that binds them. Particles are as small as <0.25 microns. Some
examples of particulate composites Include hollow spheres, carbon Nano-tube, platelets,
chopped fibers etc. Fibrous composites have one or more material fibers in a binding matrix as a
reinforcement along with matrix material that binds them.
Particulates composites are further classified to random orientation and preferred
orientation. Random orientation is particles are distributed randomly in all directions, for
example, concrete. In concrete all the sand, stone are randomly distributed with no specific
arraignment. The preferred orientation of particles is distributed in a specific direction like
extruded plastics. Particulate composite does not have good fracture resistance. Particles, in
general, add stiffness to the composite. Their hardness is used as an advantage as cutting tools at
high speeds as they have better properties a high temperature.
6
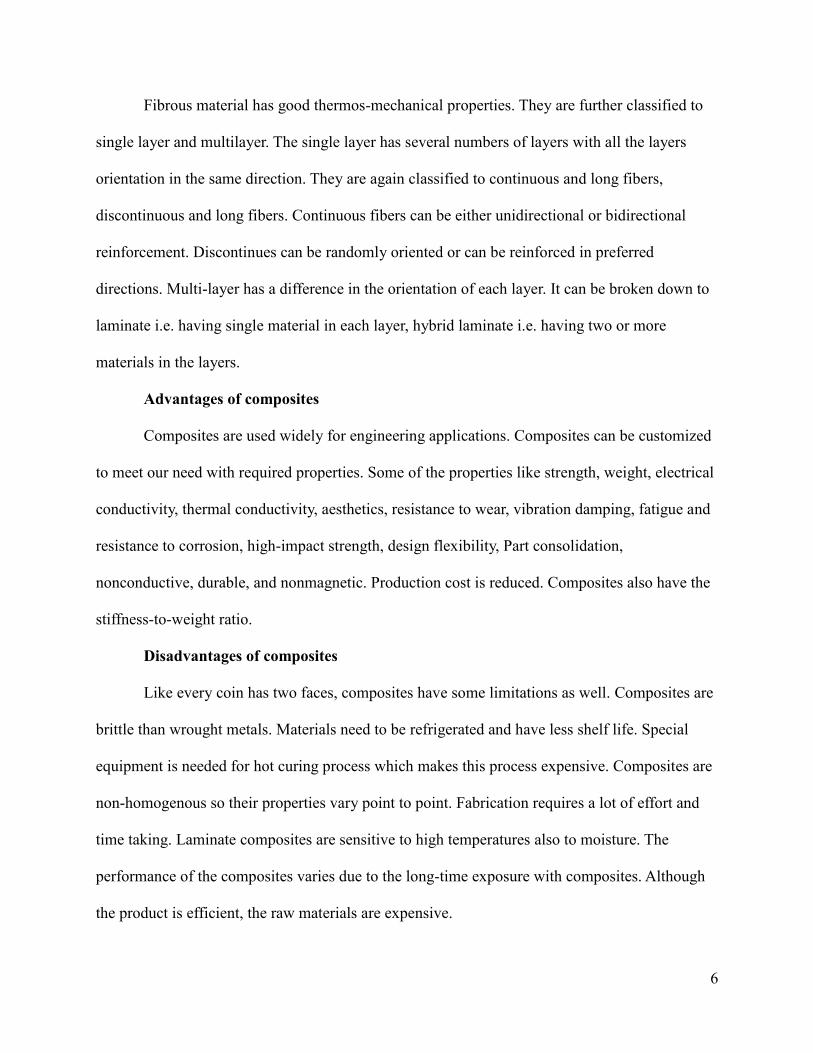
Fibrous material has good thermos-mechanical properties. They are further classified to
single layer and multilayer. The single layer has several numbers of layers with all the layers
orientation in the same direction. They are again classified to continuous and long fibers,
discontinuous and long fibers. Continuous fibers can be either unidirectional or bidirectional
reinforcement. Discontinues can be randomly oriented or can be reinforced in preferred
directions. Multi-layer has a difference in the orientation of each layer. It can be broken down to
laminate i.e. having single material in each layer, hybrid laminate i.e. having two or more
materials in the layers.
Advantages of composites
Composites are used widely for engineering applications. Composites can be customized
to meet our need with required properties. Some of the properties like strength, weight, electrical
conductivity, thermal conductivity, aesthetics, resistance to wear, vibration damping, fatigue and
resistance to corrosion, high-impact strength, design flexibility, Part consolidation,
nonconductive, durable, and nonmagnetic. Production cost is reduced. Composites also have the
stiffness-to-weight ratio.
Disadvantages of composites
Like every coin has two faces, composites have some limitations as well. Composites are
brittle than wrought metals. Materials need to be refrigerated and have less shelf life. Special
equipment is needed for hot curing process which makes this process expensive. Composites are
non-homogenous so their properties vary point to point. Fabrication requires a lot of effort and
time taking. Laminate composites are sensitive to high temperatures also to moisture. The
performance of the composites varies due to the long-time exposure with composites. Although
the product is efficient, the raw materials are expensive.
7
Alloy vs composites
Although alloy and composites hold two more materials combined to obtain required,
there are noticeable differences between them. In alloy, the liquid form of two or more materials
Solute and solvent combined to form a solid solution. And in an alloy, they cannot be
distinguished or separated. Also, the materials do not keep their original properties after forming
an alloy. But in composites, two or more materials can be combined with individual properties.
They can be distinguished after combined. After the matrix is added, the reinforcement is not
dissolved in the matrix and can be found fibers or particles in the matrix of the composites.
Making of composites
Thermoset composites are fabricated using two methods one is "wet-forming" and
another one is "premixes or prepregs". In wet processing, the resin (liquid state) is formed to
needed shape and the application of external heat and pressure will cure it. Some of the processes
include hand layup, bag molding, filament winding, RTM (resin transfer molding), compression
molding, pultrusion.
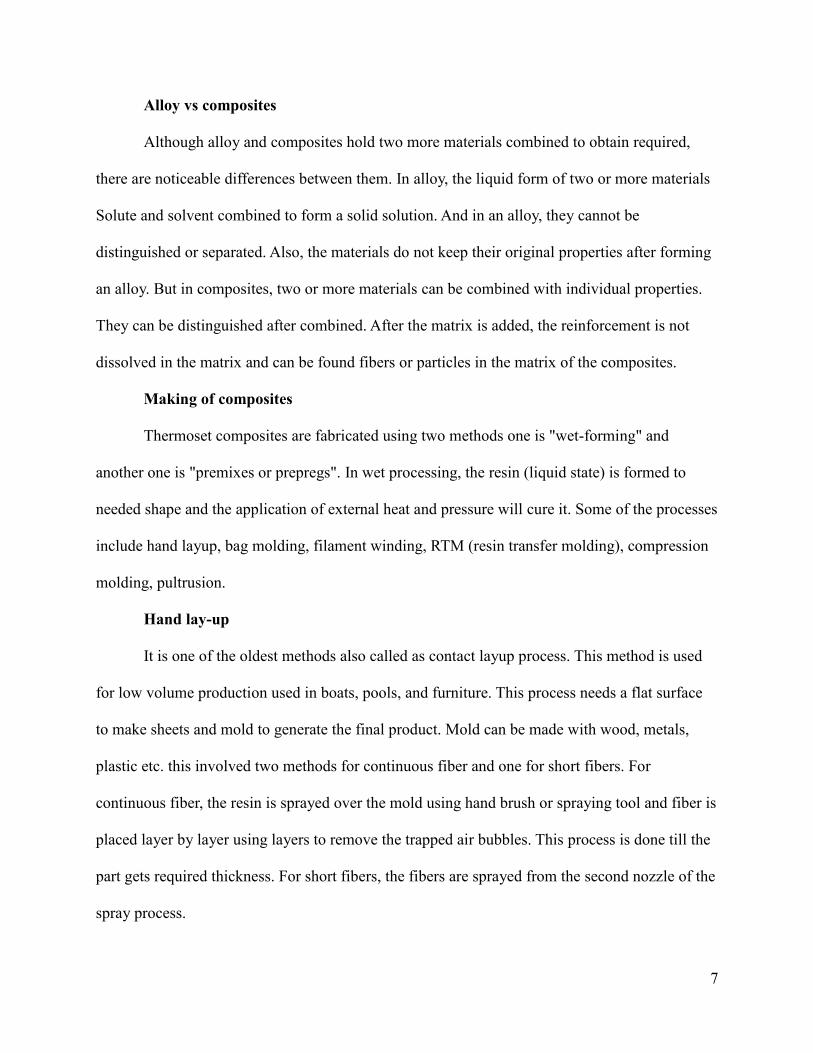
Hand lay-up
It is one of the oldest methods also called as contact layup process. This method is used
for low volume production used in boats, pools, and furniture. This process needs a flat surface
to make sheets and mold to generate the final product. Mold can be made with wood, metals,
plastic etc. this involved two methods for continuous fiber and one for short fibers. For
continuous fiber, the resin is sprayed over the mold using hand brush or spraying tool and fiber is
placed layer by layer using layers to remove the trapped air bubbles. This process is done till the
part gets required thickness. For short fibers, the fibers are sprayed from the second nozzle of the
spray process.
8
Figure 2 Composite manufacturing using Hand-layout process.
Filament winding
It is open molded process uses a rotating mandrel as a mold. This is mainly used to
produce hallow product like cylinders, pipes, pressure vessels and casings. Continuous strands of
fibers are mixed with resins and rolled over the mandrel using a computer guided system in a
pattern making the part to withstand more loads. After the part of required thickness is obtained
it is cured and removed from the mandrel. Filament winding using chopped fibers is called as
hoop chop process. This process can control the fiber orientation and tolerances.
9
Compression molding
Compression molding is used to produce complex at a fast pace of time. The chopped fibers
are combined with resin and mixed thoroughly. Layer is then placed in the molding machine that
is heated. The molds are closed and pressure, as well as temperature, is applied on the part
depending on the size shape and thickness. After the mold is opened and the part can be removed.
Labor cost is less and it produces parts with good surface finish.
Pultrusion
This is a closed continuous process with resulting parts have a similar cross-section. This
is used to make beams, pipe, tubes, fishing roads etc. these products have good structural
properties. Stands of fibers are impregnated with resin then pulled through a steel die so this is
called pultrusion. The steel die sets the shape and adjusts the ratio of fiber to the resin. The die is
heated to cure the composite resin and later they are cut to specified dimension.
Vacuum bag molding
The mold is put under vacuum this removes the trapped air bubbles and atmospheric
pressure is applied on the part compacting it and removing the excess resin. A flexible film of
nylon, PVA or polyethylene is placed over the wet layout. After the edges are sealed the vacuum
is drawn out of the part. This process can produce parts with the uniform degree. Resin rich
problem in traditional methods can be eliminated using this process.
Vacuum infusion process
This closed process is similar to vacuum bag molding but the resin is added after the part
is depressurized so there will not be any extra resin deposition over the part. The resin is
connected to the mold and as the vacuum draws the air, the resin is pulled to all the perforations
10
in the part. This process will reduce the reduction is the emissions compared to open molding
and vacuum bagging.
Resin transfer molding
RTM is an intermediate process of composite production. The mold cavity is arranged
with reinforcement and then the mold is closed and clamped. The resin is injected at high
pressure and the part is left to cure in the mold. This process takes more time if curing is done at
normal temperatures so heating mold are used to increase cycle time and consistency. Any
combination of orientation can be achieved by this method. Reinforcement can be positioned in
3D or 2d orientation.
Volume and mass fraction
The volume fraction and mass fraction of composites have a significant influence on
mechanical properties of the composites. Mass fraction is easy to obtain in the fabrication
process and volume fractions are used for theoretical analysis of composites.
If vm, vf and vc are the volumes of the matrix, fiber, and composite respectively.
where vc= vm + vf,
Volume fraction of matrix is defined by Vm = vm/ vc.
Volume fraction of matrix is defined by Vf = vf / vc.
Also, if mm, mf and mc are the masses of the matrix, fiber, and composite respectively.
where mc= mm + mf,
Mass fraction of the matrix is defined as Mm = mm/ mc.
Mass fraction of the matrix is defined as Mf = mf / mc.
Using the value fraction, the overall density of composites can be calculated.
11
Also, if ρm, ρf, and ρc are the densities of the matrix, fiber, and composite respectively.
Now ρc can be calculated from
mc= mm + mf,
ρc * vc = ρm * vm + ρf * vf
ρc = (ρm * vm + ρf * vf) / vc
ρc = ρm * vm / vc + ρf * vf / vc
ρc = ρm * Vm + ρf * Vf
Longitudinal modulus of unidirectional lamina
Assuming unidirectional composite layers which are uniform and continuous in
mechanical properties and geometry. Assuming there is perfect bonding between the fiber and
matrix, the strain produced in Fiber (εf), Matrix (εm) and Composite (εc) is same.
i.e., εf =εm =εc
If Pc is the total external load applied on the composite this load is shared by matrix (Pm)
and fiber(Pf). Assuming the matrix and fiber behaves elastically, equation for stress in fibers and
matrix are
Stress in Fiber σf = Ef *εf (where Ef is Elastic modulus)
Stress in matrix σm = Em * εm (where Em is Elastic modulus)
Now, if Af and Am are cross-sectional areas of the fibers and matrix respectively.
Pf= Af* σf = Af* Ef *εf and
Pm= Am* σm= Am* Em *εm
We Know that Pc = Pf +Pm
So, we can derive σc = (Vf*Ef + Vm*Em) ∙ ε
and differentiating with strain we can derive Ec = Vf*Ef + Vm*Em.
12
Additive Manufacturing
Additive manufacturing is also called as 3D printing.
Introduction to 3D printers
Additive manufacturing has been improved over the years after the patents of the Stratasys has
expired in the year of 2009. Due to this freedom in design, there is a steep rise in the growth in the
technology advancements. There are technologies that can also print metals using the electron and
laser beam to recreate the component required for the aerospace industry to reduce the weight and
increased. Any object that has a digital form i.e. that is designed using in any 3D design software.
The 3D printer software produces a 3D model in a format Standard Tessellation Language (STL)
can be exported to a printer or through the internet. After that, the design can be sent to the printer
directly. In this process, the product is produced through bonding of earlier layered material.
AM process helping to create an experience product outcome rather than a quick improvement.
By Using AM process we can create a structure and product before making them in mass
production scale. This technology gives a vast number of customization opportunities, with
material customization as well as mechanical properties that are like that of the products generated
by traditional methods.
AM is a type of technology that can reduce the labor cost as well as the material wastage. Once
the product is designed using a design software the only work that needs to do is just to launch the
print in most of the cases. It prints samples and structure within no time. I make the easy to deliver
the goods with design freedom and with complex structures. It is a low-cost manufacturing process
because the operating cost for this machine is low as well the labor required for this machine is far
less compared to other technologies. The skill needed to run these machines are far less compared
to skill set needed to run for other manufacturing processes.
13
Working with 3D Printers
Working with the 3D printer is basically very easy to understand. This process starts with the
design of a CAD model with required design parameters. Once the part is imported into 3D printer
software interface, we need to specify some parameters like temperature, speed, shell thickness,
quality of the product. If the product needs high quality, it generally takes more time for making
the product. Speed is directly proportional to the quality of the product. Temperature is depended
on the material types used for the print. Sometimes there will be two inputs for the printer the
supports are built using the second material and it can be washable. That can produce parts with
good surface finish. It can print the parts that are assembled products.
After the part is imported to the 3d printing interface with all the settings are set, the software will
divide the entire part to layers and create the supports in some cases. Some other changes like scale,
drag, and spin are a feature most often used in any type of the 3d printing interface. More setting
can be found in the advanced settings.
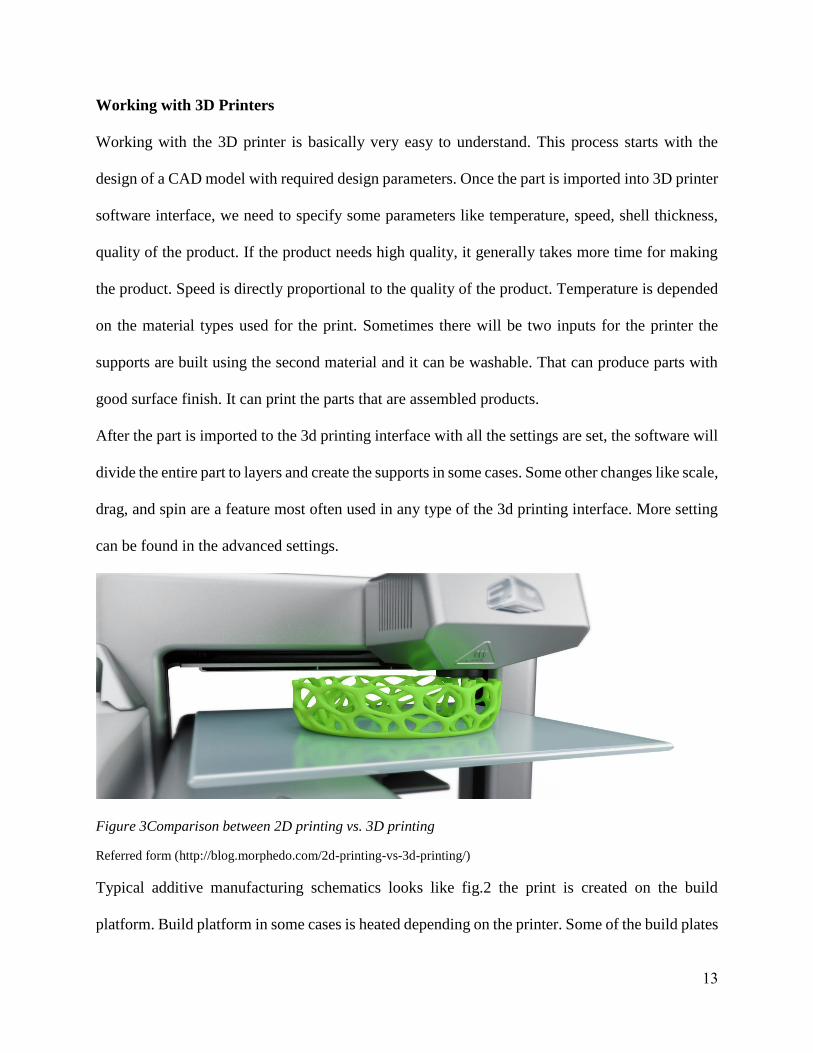
Figure 3Comparison between 2D printing vs. 3D printing
Referred form (http://blog.morphedo.com/2d-printing-vs-3d-printing/)
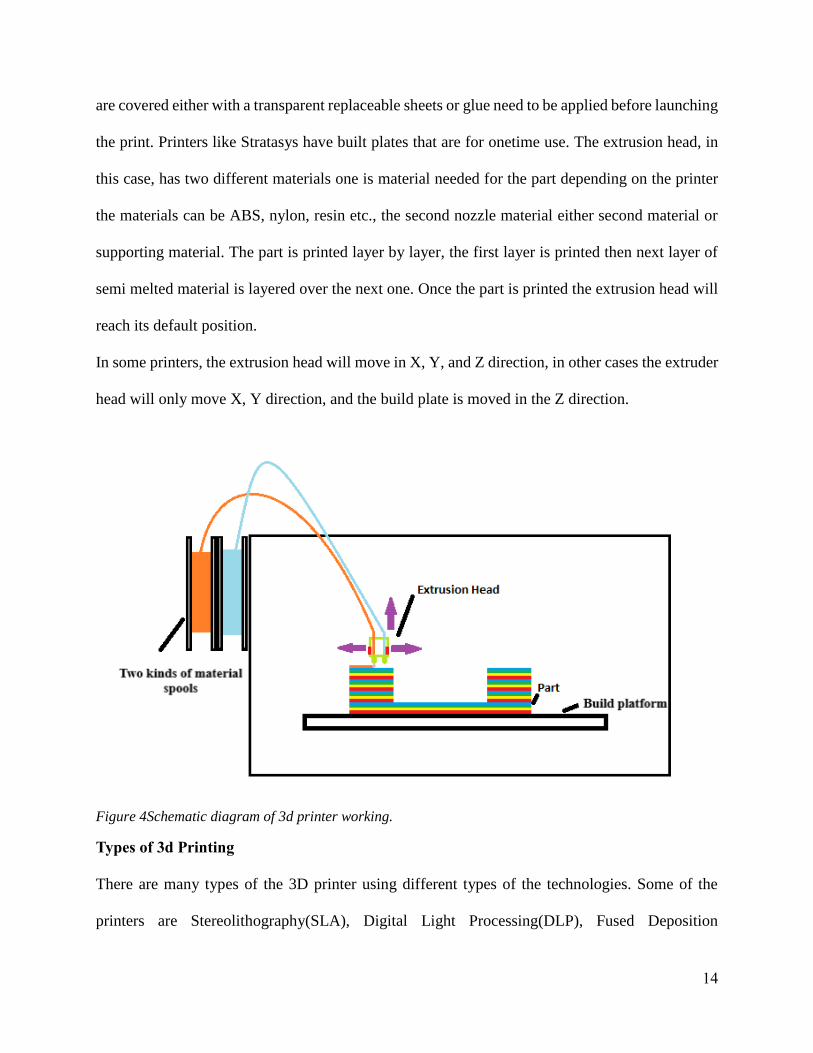
Typical additive manufacturing schematics looks like fig.2 the print is created on the build
platform. Build platform in some cases is heated depending on the printer. Some of the build plates
14
are covered either with a transparent replaceable sheets or glue need to be applied before launching
the print. Printers like Stratasys have built plates that are for onetime use. The extrusion head, in
this case, has two different materials one is material needed for the part depending on the printer
the materials can be ABS, nylon, resin etc., the second nozzle material either second material or
supporting material. The part is printed layer by layer, the first layer is printed then next layer of
semi melted material is layered over the next one. Once the part is printed the extrusion head will
reach its default position.
In some printers, the extrusion head will move in X, Y, and Z direction, in other cases the extruder
head will only move X, Y direction, and the build plate is moved in the Z direction.
Figure 4Schematic diagram of 3d printer working.
Types of 3d Printing
There are many types of the 3D printer using different types of the technologies. Some of the
printers are Stereolithography(SLA), Digital Light Processing(DLP), Fused Deposition
15
Modeling(FDM) or Fused Filament Fabrication(FFF), Selective Laser Sintering (SLS), Electronic
Beam Melting (EBM), Laminated Object Manufacturing (LOM), Robocasting or direct ink
writing(DIW), Selective Laser melting (SLM), Selective Heat Sintering (SHS), Direct Metal Laser
Sintering (DMLS), Directed Energy Deposition etc.,
Stereolithography (SLA)
It is one of the oldest methods and it is still used in someplace nowadays. Charles Hull
patented it in the year 1986. After the required part is converted to STL file from CAD model the
stereo lithography apparatus works using liquid plastic converted to solid part using the laser. The
laser will start to lay the first layer that is 1/10 of a millimeter and waits till the layer harden. later
the print bed lowers by another 1/10 millimeter and the second layer forms by laser. After the part
is completed it should be thoroughly cleaned and placed in the ultraviolet oven to remove the
supports and to obtain the precise model.
Digital Light Processing(DLP)
Working of DLP is like that of Stereolithography. Larry Hornbeck developed this
technology in the year 1987. In this case, the only difference is the source of light. In SLA, the
source of light is a laser but in DLP the source is arc lamps. The liquid resin is hardened using the
large amounts of light that make the process fast. In DLP instead of the bed, the light source will
move in the Z direction to lay the next consecutive layer. The advantage over STL is this process
needs very less material that can lead less cost and less waste.
Fused Deposition Modeling (FDM)
Scott Crump, Stratasys Ltd developed and implemented in the year 1980. Maker bot and
other companies have adopted a nearly similar technology called as Fused Filament Fabrication
(FFF). This is the only technology that can use engineering grade thermoplastic that can, in turn,
16
produce products with excellent chemical, thermal and mechanical properties. This machine prints
layer by layer by heating the thermoplastic material to semi molten state. The process is same as
SLA but instead of the liquid metal, the solid material spool is converted to the semi molten and
then it hardens. The support material is either built with special material that can be dissolved.
When the second layer is layered over the first layer after it sticks to the first layer and hardens.
This technology is used for new product development, prototyping, and in manufacturing
developments. Different kinds of materials can be used like ABS (Acrylonitrile Butadiene Styrene),
PLA (Polylactic acid) while the water-soluble wax and PPSF(polyphenylsulfone) are used for
supporting material.
Selective Laser Sintering (SLS)
This process uses a laser as a power source to make 3D objects. Carl Deckard developed
this technology with the help of his professor Joe Beaman in the year 1980's. The difference
between the SLA and SLS is it uses powdered material instead of the liquid metal to form 3d
objects. At first, the powder is laid flat then the laser will combine the area of the first layer which
was sliced by the software and then the next powder layer is laid then laser combines the next layer
and finally the finished product is produced. This technology is mostly used industries because the
high-power laser used to print which would be expensive. So, this is not generally preferred for a
home printer. Also, the powered is so fine that it should be handled carefully for safety. This
machine can handle materials like nylon, ceramics, glass, aluminum, steel, and silver.
Selective laser melting (SLM)
This process also uses laser and powder as SLS but it's different from that of SLS. In this
process, the powder is melted by a high-powered laser beam and fuses the metallic powder in the
pattern of the first layer. It was developed by Fraunhofer institution ILT in 1995. The fine metallic
17
powder is placed over the build plate and 2D first layer of the part is exposed to high power laser
that melts the powder on the plate, turns into a solid object. After the first layer is laid then the
second layer is after the first layer solidifies. Metals like Stainless-steel, titanium, cobalt chrome,
and aluminum. Complex structure with void and channels can be produced using this method. This
technology is not widely used for home user’s due to the use of lasers.
Electronic Beam Melting (EBM)
This type of technology is used for making metal parts mostly used in medical and
aerospace industry. Arcam AB Inc. develops this technology. This technology is like that of the
SLM but the difference is the instead of laser EBM uses Electron beam. First layer of powder is
heated using the electron beam and after it solidifies the second layer is heated again and so on
until the final part is produced. This process is relatively slow compared to SLM and expensive.
Materials used in this process are pure titanium, Inconel.
Laminated Object Manufacturing (LOM)
California-based company Helisys Inc. develops this technology. In this type of 3D printing
layers of paper, metal or plastic that are adhesive-coated are combined by heat and pressure. the
shape is cut with the help of lasers or computer guided knife. After the 3D printed is completed to
get the required shape some machining is needed. After the first layer is completed then the
platform is moved down and then a new sheet is dragged over the first layer and it is heated and
roller and then cut to shape. The process is continued till the part gets its final shape.
Composite Filament Fabrication
Mark forged device mark one uses this technology. This process is using continuous strand
of fibers as reinforcement instead of using chopped fibers with a thermoplastic matrix. Structures
made from this process has good strength compared to the FFF or FDM. This printer is dual head
18
extrusion, one head is capable of printing CFF and the second one is used to print traditional plastic
filaments like PLA and ABS.
Although there are many technologies in 3D printing, every technology uses the same
concept of layer by layer printing by splicing the part into 2D shape. They either use the liquid,
solid or powder material is used in most of the cases with any other power source to heat the
material to heat up the material and combine.
Materials used in additive manufacturing
Technological advancements improved the 3D printing material usage. Now a day's metals
can also be easily printed with less waste and less man power that will result in low price products.
PLA, ABS, PETG, nylon, TPE, TPU, HIPS, PVA, PET, Metal, lignin, PC polycarbonate, wax,
ASA, PP, POM, PMMA, sandstone, nGen, TPC, PORO-lay, Glow in the dark, FPE etc.
Polylactic acid (PLA)
This material is widely used compared to ABS. This is a biodegradable thermoplastic that
is derived from natural resources like corn starch or sugar cane. This is widely popular for the
reason for this reason and so called green plastic. A widely used in home and classrooms. For this
material, the cooling rate is high so there is needed for the heated bed. Due to its rigidity, the
printed parts are brittle. Melting range of this materials is 180°C – 230°C. Some of the properties
are its durability, flexibility, Brittleness, ideal for small toys, higher prints speeds and thin layers.
They are food safe, user friendly and impact resistance.
Acrylonitrile Butadiene Styrene (ABS)
After PLA, the most popular material is ABS. ABS is a thermoplastic type of material and
it is cheap, durable, slightly flexible. Lego bricks are made with ABS material. It needed higher
temperatures up to 210°C – 250°C which makes the printers fallen a bit. It also needs a heated
19
platform for easy removal of the part from the build plat form. As this not a natural material also
it produces some fumes while printing. these fumes might affect people and pets with breathing
difficulties. Some properties of ABS include its high durability, solubility in acetone, good strength,
and impact resistance. It has some disadvantages need heated bed, no food safe, curling warping
and shrinkage.
Nylon (Polyamide)
This material is widely used in industrial applications. It is cost effective, strong, light, and
flexible, and wear resistant. Nylon is stronger and durable than PLA and ABS and less brittle.
Nylon is used in many applications, like tools, toys, machine parts, containers etc. there is a new
development in nylon Taulman nylon that does not emit fumes and is virtually odorless during
printing. This nylon also has better tensile strength and layer bonding. Some of the advantages
strength, durability, and flexibility. This material can be recycled and few types of nylon can be
used for food grade. Disadvantages are its ability to absorb moister make printing difficult. It has
some shrinkage after cooling.
Polyethylene Terephthalate, PET (CPE)
It has higher strength and flexibility compared to ABS. PET is easy to print and it has a
similar need to that of a PLA substance. PET can be used to make products that need high flexibility
and toughness like phone cases and mechanical parts. Some of the benefits high stiffness, and
lightweight. This material does not need a heating bed.
Metal PLA / Metal ABS
PLA or ABS materials are blended with metals like brass, steel, copper, and bronze.
Although the density of printed part is like PLA or ABS, the parts are different from parts made
from pure PLA or ABS products. Some advantages include unique metallic finish, good for statues,
20
jewelry, and artifacts. These materials have high durability and low flexibility. The products made
using these materials are not food safe.
Carbon fiber
The material has fine strands of carbon fiber. This will give the material with good rigidity,
adhesion, and strength. The nozzles need be of wear resistant because the stand will wear of the
nozzle easily so using material is a bit expensive too but nozzle with wear resistance. This material
is used to make the mechanical parts, shells, and high durability application. This is not food safe
and brittle when flexed.
Fiber glass
Continuous fibers strands are used with matrix material like nylon to give it more strength.
This material has a good weight to strength ratio. Fiber glass does not absorb moister and it has
good dimensional stability.
Figure 5Fiber glass Spool used in Markforged printer referred from (www.becoming3d.com)
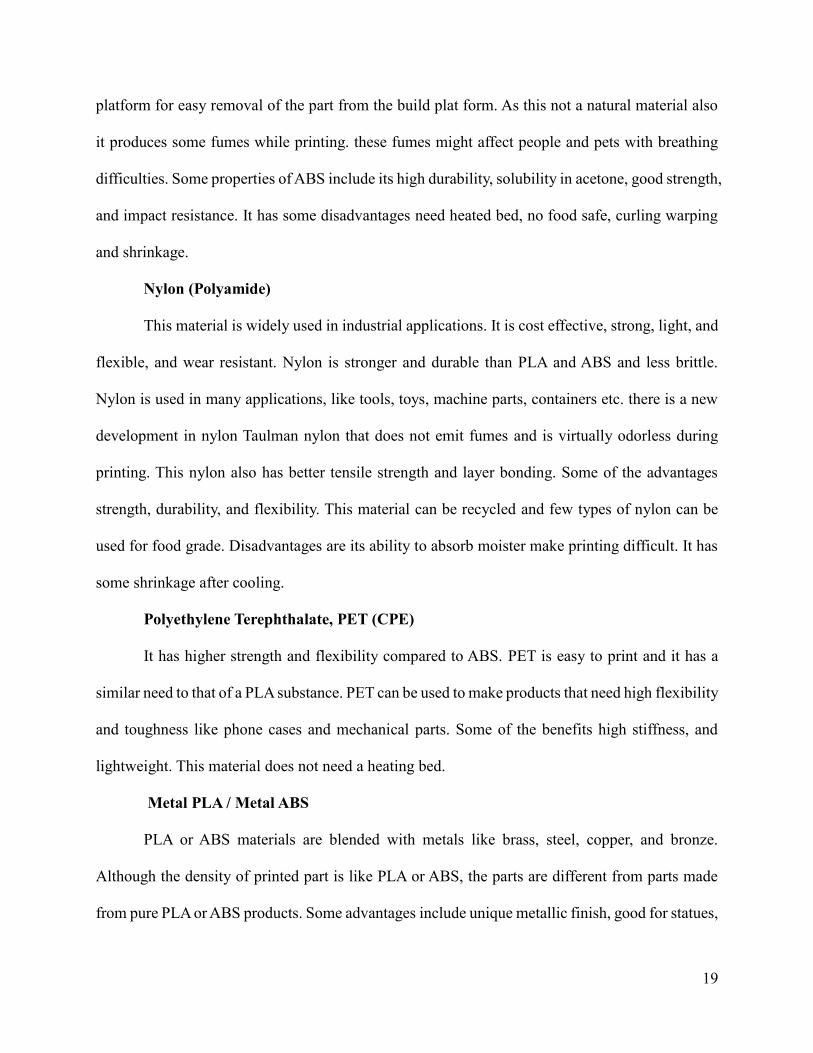
Markforged printer
Mark forged vision is to create real parts within days instead of weeks. Also, able to
create complex parts not by limiting to traditional methods. Markforged printers are capable of
producing composite parts. These parts are stiffer, stronger, and good impact resistance
21
compared to other 3D printers. This printer uses a browser based software make it easy to store
that parts in the cloud and can be accessed from any computer. Also, the status and earlier prints
can be continuously checked using the web based software called Eiger (www.eiger.io). The
products they develop are The Metal X for 3D print metal parts, The Mark X, The Mark Two,
Onyx series.
Mark two printers can create more versatile parts using unique continuous fiber. The
printer can be used with carbon fiber, Kevlar, and fiber glass. One of the limitation is that the part
should at least have the least length from the point it cuts the fiber till the extruder.
Figure 6Markforged “Mark Two” printer referred from Markforged.com
Average price ranges of filaments used in Markforged Printer according to 2017. Carbon
Fiber $1.55/cm3, Kevlar $1.15/cm3, Fiberglass $0.67/cm3, and Nylon $0.22/cm3. Nylon can
be substituted with any other cheap filaments like PLA.
22
Advantages of 3d printing
In this section, we will discuss some of the strategic profitable and technical benefits of
the 3d printing in the competitive world.
The speed of the new part production takes less time than traditional methods whatever
might be the complexity of the 3D design. This technology will make use to get the model in
hours than days or even weeks. It's a single step manufacturing no need of any machining
process and obtained with high efficiency. The cost of making the product is very cheap because
the printer energy consumption is very less and operational cost for this machine is very low.
Material cost for this operation is very less. The labor cost is the biggest advantage because
several numbers of printers can be controlled by one person.
This is used to reduce risk in making the design changes. Even a single change in the
model can be a major impact. This help to prototype the design in no time and understand the
product and can start the process so we can reduce investment in the manufacturing process.
Rapid prototyping. Complexity is not an issue in AM because it splices the 3D part to 2D
so that the edges and curves are produced at higher accuracy. And it has the freedom to
customize the products. It is used for medical industry to produce the parts and items specifically
for a specific purpose. Accessibility of materials and printers has a significant improvement in
past 2-3 years. There is a possibility for new materials by mixing with other materials that can be
very difficult with traditional methods.
Disadvantages of 3d printing
3D printing is a good tool for making the parts in few hours irrespective of the
complexity, but to create large parts with this technology is expensive and not a realistic choice.
Although there are advancements for the development in dimensional accuracy the are cases
23
with accuracy disclaimer for items with small tolerances and accuracy. The initial setup cost of
the machine is high but the making cost of the product is low. Though there no need of high
labor skills there should be enough people to run the machine, like CAD professional. There is
lot of post processing needed for the finished product to get the surface finish. Polishing the 3d
printed part include complexity as well as involves tedious work.
Fatigue
Fatigue will occur due to repeated cyclic loads that result in fluctuating stress. The load
applied to the part may be less that fracture but due to alternating load will break the part over
time. On an average 50 to 90% components fail due to fatigue. This makes fatigue testing necessary
for product development. Some of the factors affecting the fatigue are stress range, geometry,
material, and the environment. Fatigue failure is similar to the behavior of brittle materials even
though the materials have ductile properties. This makes fatigue failure sudden and catastrophic.
Fatigue failure must be taken in to picture for any structure or part that is subjected to time varying
loads. Some of the examples include rotating machinery like pumps, turbines, fans, shafts, pressure
vessels like pipes, values, rivets, vehicles, ships, air crafts, bridges etc.
Analysis Considerations
Before designing any part, some question regarding part usage and applications need to
be answered. What is the Expected number of cycles till final failure. Does the part be designed
for an infinite life time or for a specific time. If the part is designed for an only specified time
what will be the inspection intervals. Some input decisions on which the fatigue results depend
24
are Fatigue Analysis Type, Loading Type, Mean Stress Effects, Multi-axial Stress Correction,
Fatigue Modification Factor.
Loading types, constant amplitude loading in case of minimum and maximum stress
level are constant. In the case of variable amplitude or non-constant amplitude, the stress induced
is always varied with time.
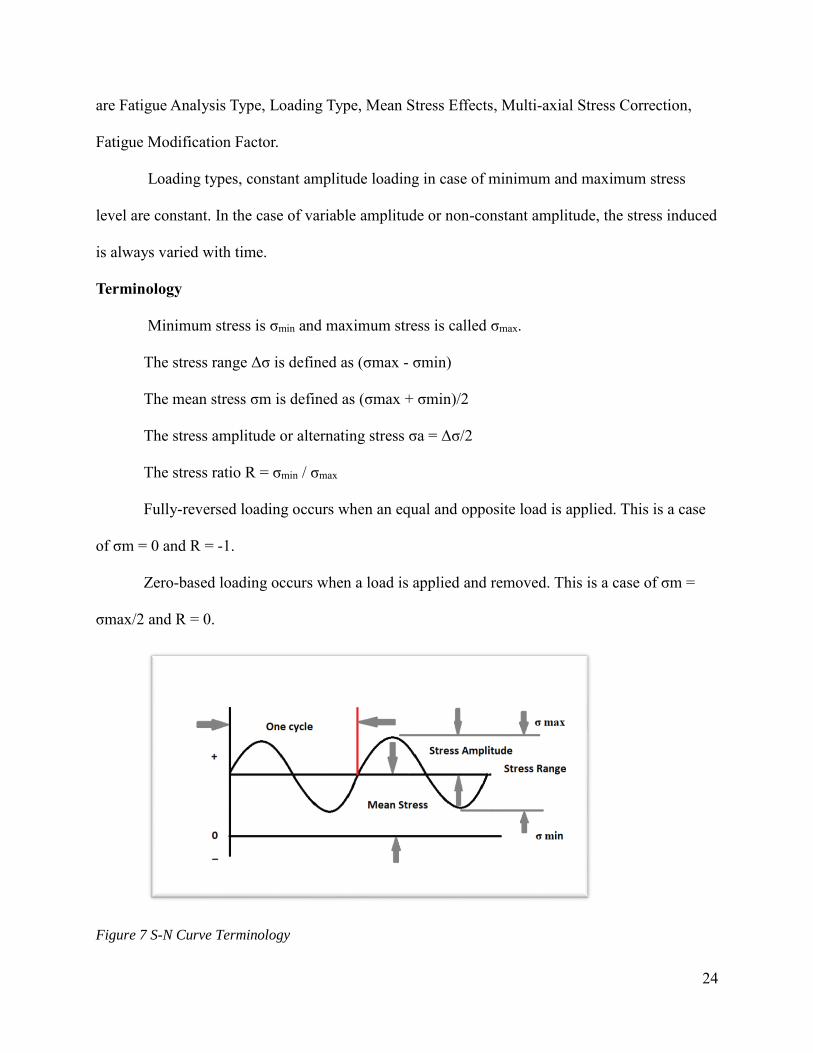
Terminology
Minimum stress is σmin and maximum stress is called σmax.
The stress range Δσ is defined as (σmax - σmin)
The mean stress σm is defined as (σmax + σmin)/2
The stress amplitude or alternating stress σa = Δσ/2
The stress ratio R = σmin / σmax
Fully-reversed loading occurs when an equal and opposite load is applied. This is a case
of σm = 0 and R = -1.
Zero-based loading occurs when a load is applied and removed. This is a case of σm =
σmax/2 and R = 0.
Figure 7 S-N Curve Terminology
25
Fatigue failure by time-varying loading
Fatigue failure by time-varying loading
High cycle fatigue is with low loads and long life (>103 Cycles), this can be commonly
analyzed by using stress-life method (S-N curve), this method predicts a number of cycles
sustained before failure. The failure criteria for this approach is a fracture.
Low cycle fatigue is with high loads and shorter life (<103 Cycles). Fatigue life is
analyzed by using strain-life. Failure criteria for this method is initial crack,
Crack propagation is seen in the case of linear elastic or elastoplastic. The failure criteria
for this method is crack length and fracture. It involves three stages: crack initiation, crack
propagation and crack till critical size.
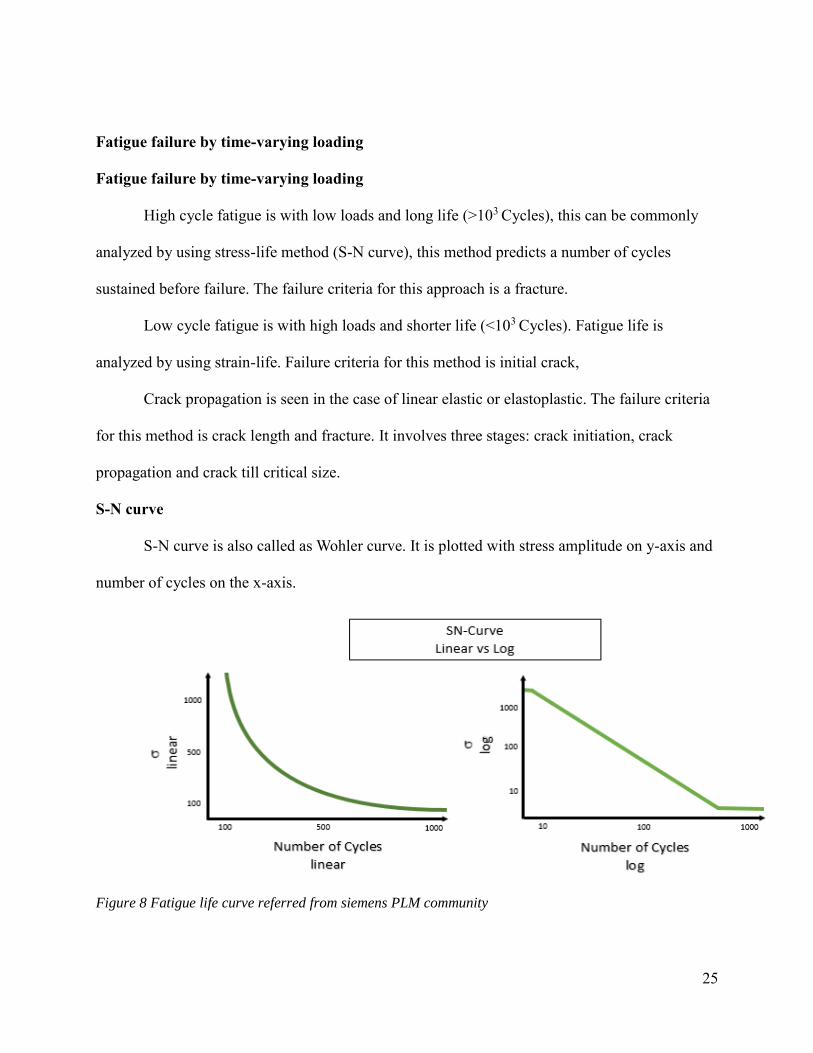
S-N curve
S-N curve is also called as Wohler curve. It is plotted with stress amplitude on y-axis and
number of cycles on the x-axis.
Figure 8 Fatigue life curve referred from siemens PLM community
26
Endurance limit is the stress level at which the material can survive an infinite number of
load cycles. Whereas, Endurance strength limit is the stress level at which the material can
survive a specific number of load cycles. The slope of the log vs log curve is called as K-factor
which was developed by Wohler. With is related to a number of cycles and stress. Wohler line
Life= load -k
Using S-N curve and miner rule we can calculate the damage of the structure or part. This
formula calculates the damage
D=∑𝑛𝑖
𝑁𝑖≤ 1
𝑗
𝑖=1
Where n is a number of cycle for a specific range of amplitude with N as the
corresponding number of cycles for failure for that amplitude.
Machine using for fatigue testing
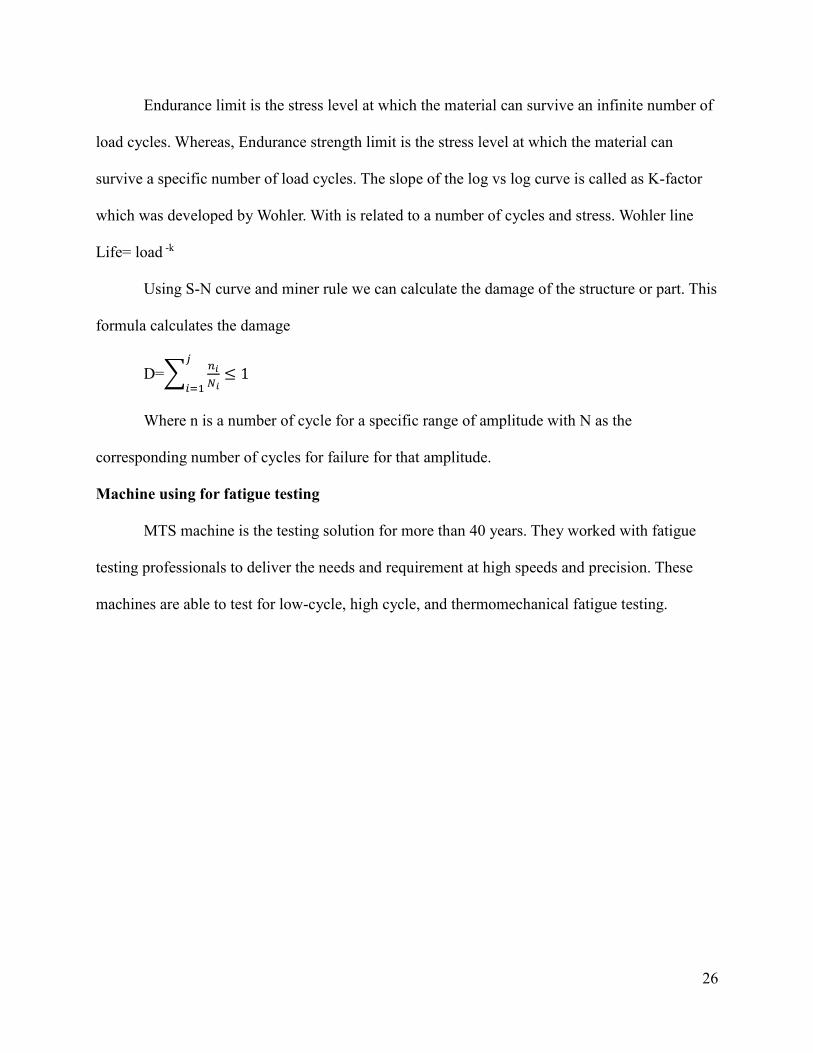
MTS machine is the testing solution for more than 40 years. They worked with fatigue
testing professionals to deliver the needs and requirement at high speeds and precision. These
machines are able to test for low-cycle, high cycle, and thermomechanical fatigue testing.
27
Figure 9 MTS Machine used for testing
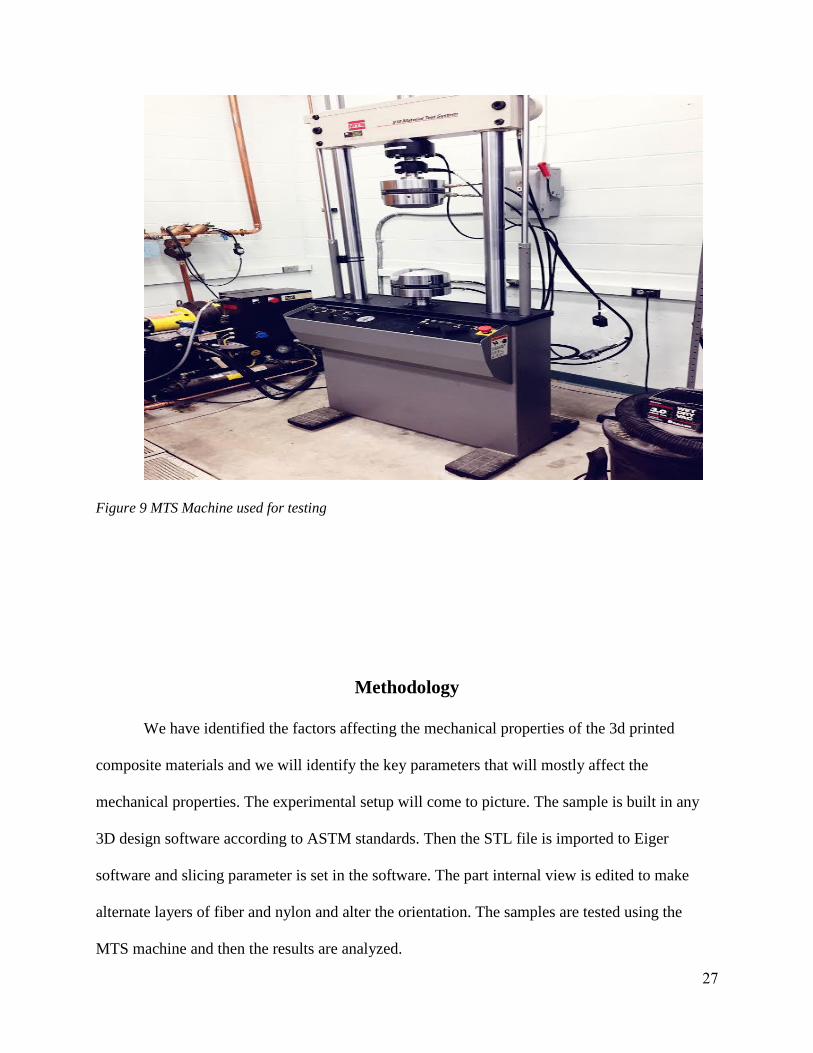
Methodology
We have identified the factors affecting the mechanical properties of the 3d printed
composite materials and we will identify the key parameters that will mostly affect the
mechanical properties. The experimental setup will come to picture. The sample is built in any
3D design software according to ASTM standards. Then the STL file is imported to Eiger
software and slicing parameter is set in the software. The part internal view is edited to make
alternate layers of fiber and nylon and alter the orientation. The samples are tested using the
MTS machine and then the results are analyzed.
28
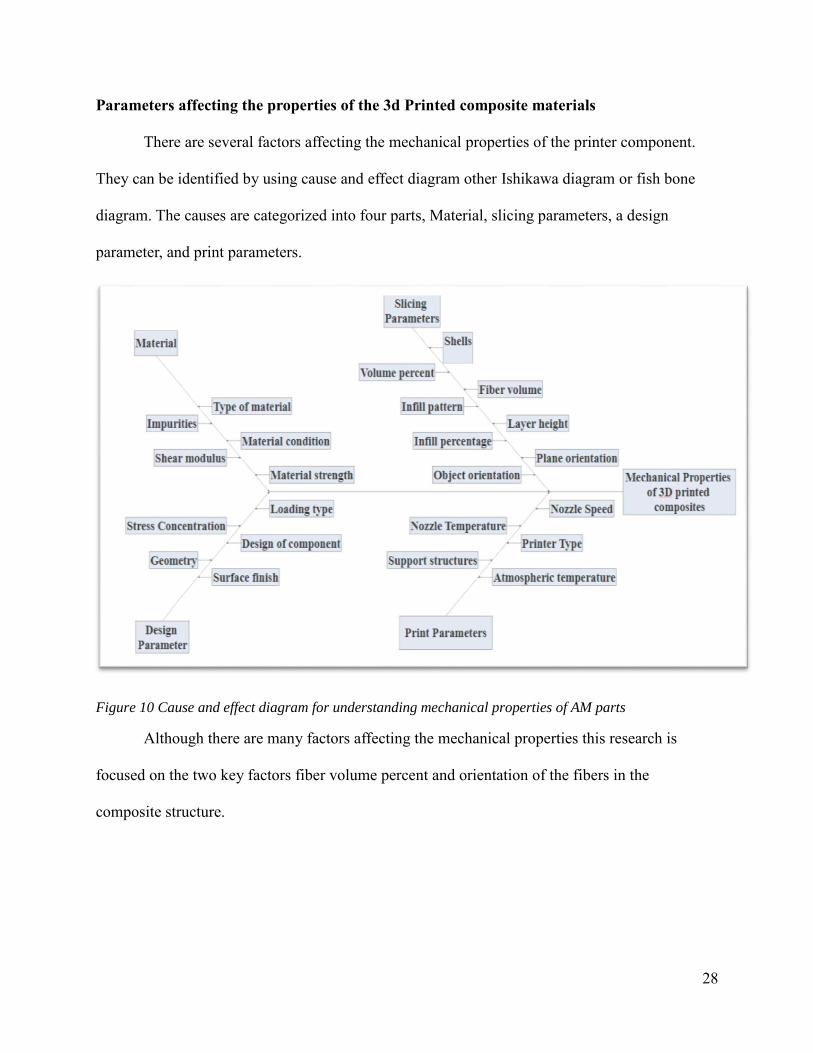
Parameters affecting the properties of the 3d Printed composite materials
There are several factors affecting the mechanical properties of the printer component.
They can be identified by using cause and effect diagram other Ishikawa diagram or fish bone
diagram. The causes are categorized into four parts, Material, slicing parameters, a design
parameter, and print parameters.
Figure 10 Cause and effect diagram for understanding mechanical properties of AM parts
Although there are many factors affecting the mechanical properties this research is
focused on the two key factors fiber volume percent and orientation of the fibers in the
composite structure.
29
Procedure
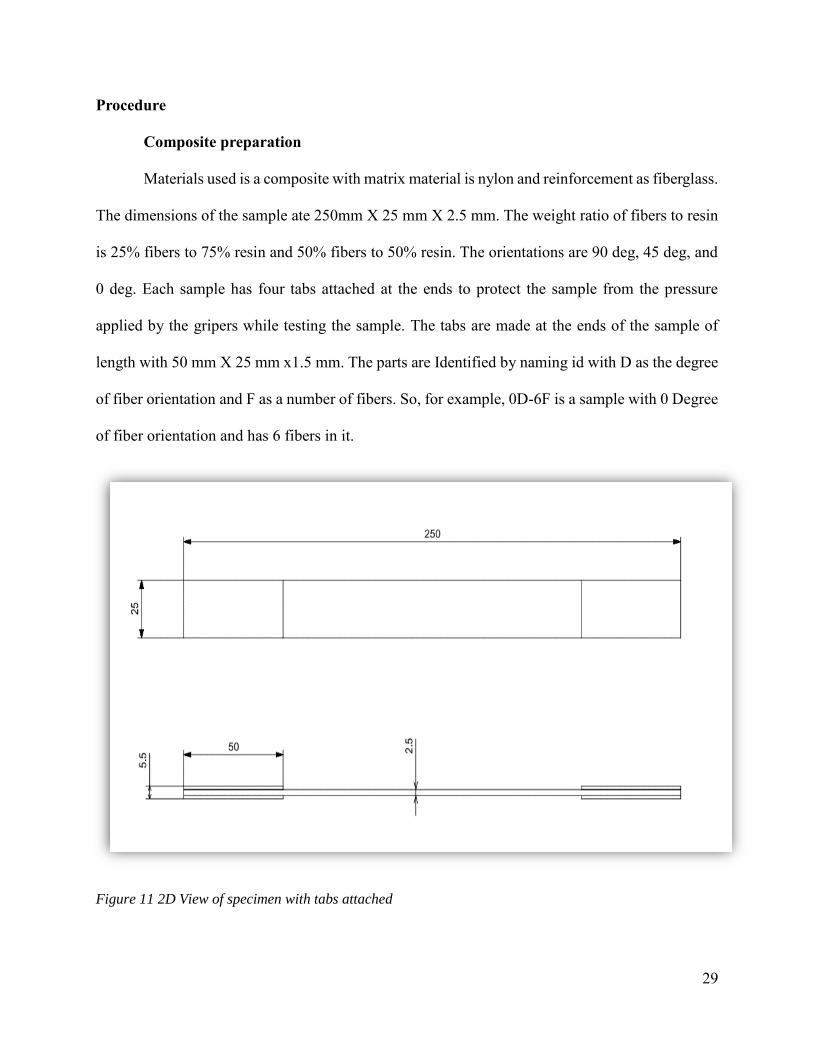
Composite preparation
Materials used is a composite with matrix material is nylon and reinforcement as fiberglass.
The dimensions of the sample ate 250mm X 25 mm X 2.5 mm. The weight ratio of fibers to resin
is 25% fibers to 75% resin and 50% fibers to 50% resin. The orientations are 90 deg, 45 deg, and
0 deg. Each sample has four tabs attached at the ends to protect the sample from the pressure
applied by the gripers while testing the sample. The tabs are made at the ends of the sample of
length with 50 mm X 25 mm x1.5 mm. The parts are Identified by naming id with D as the degree
of fiber orientation and F as a number of fibers. So, for example, 0D-6F is a sample with 0 Degree
of fiber orientation and has 6 fibers in it.
Figure 11 2D View of specimen with tabs attached
30
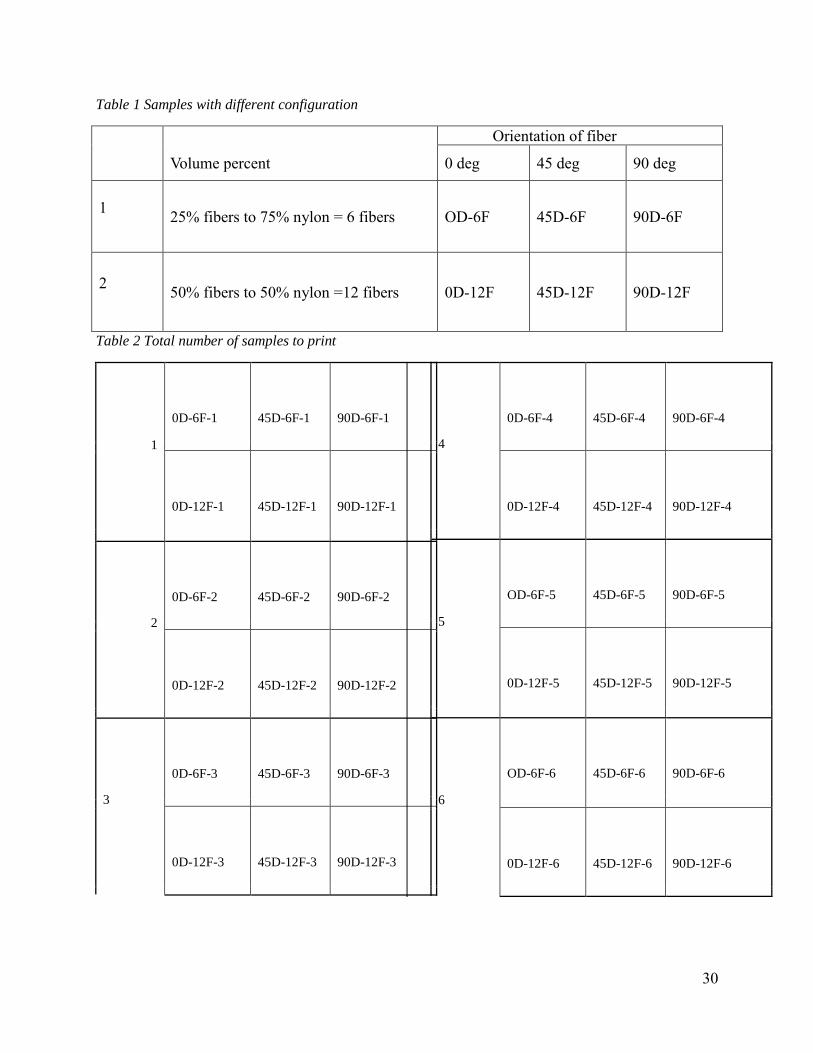
Table 1 Samples with different configuration
Orientation of fiber
Volume percent 0 deg 45 deg 90 deg
1
25% fibers to 75% nylon = 6 fibers OD-6F 45D-6F 90D-6F
2
50% fibers to 50% nylon =12 fibers 0D-12F 45D-12F 90D-12F
Table 2 Total number of samples to print
1
0D-6F-1 45D-6F-1 90D-6F-1
0D-12F-1 45D-12F-1 90D-12F-1
2
0D-6F-2 45D-6F-2 90D-6F-2
0D-12F-2 45D-12F-2 90D-12F-2
3
0D-6F-3 45D-6F-3 90D-6F-3
0D-12F-3 45D-12F-3 90D-12F-3
4
0D-6F-4 45D-6F-4 90D-6F-4
0D-12F-4 45D-12F-4 90D-12F-4
5
OD-6F-5 45D-6F-5 90D-6F-5
0D-12F-5 45D-12F-5 90D-12F-5
6
OD-6F-6 45D-6F-6 90D-6F-6
0D-12F-6 45D-12F-6 90D-12F-6
31
7
OD-6F-7 45D-6F-7 90D-6F-7
0D-12F-7 45D-12F-7 90D-12F-7
8
OD-6F-8 45D-6F-8 90D-6F-8
0D-
12F-8 45D-12F-8 90D-12F-8
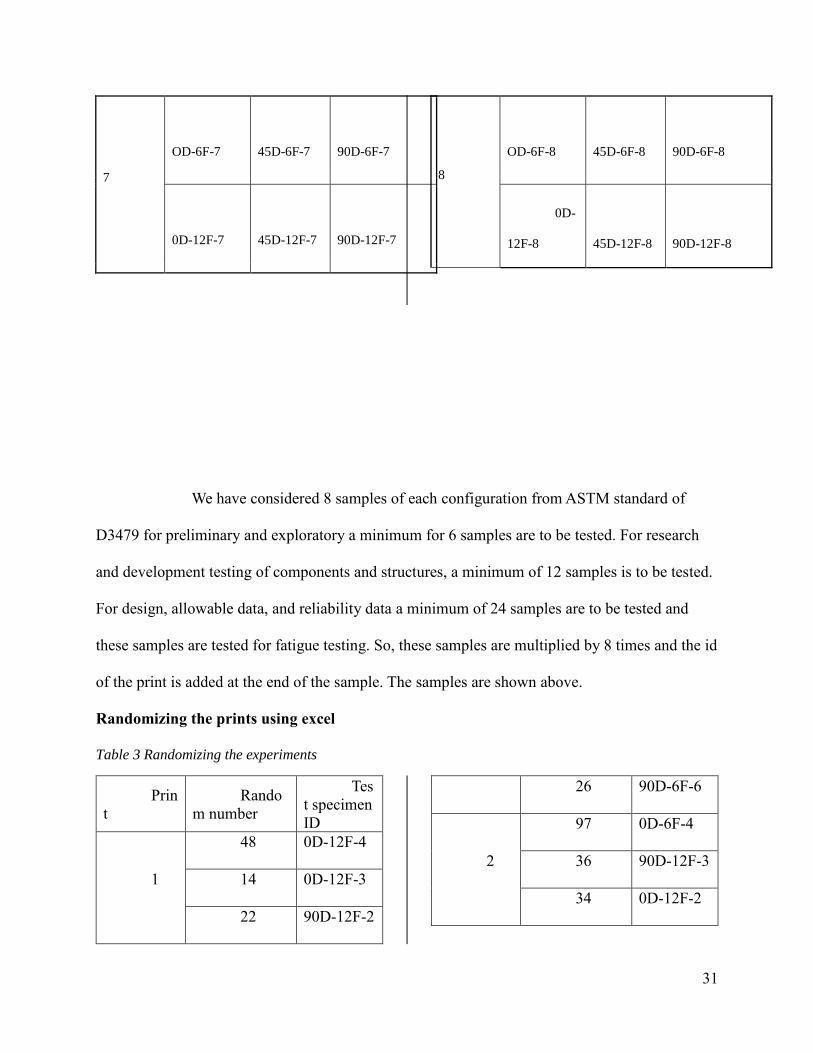
We have considered 8 samples of each configuration from ASTM standard of
D3479 for preliminary and exploratory a minimum for 6 samples are to be tested. For research
and development testing of components and structures, a minimum of 12 samples is to be tested.
For design, allowable data, and reliability data a minimum of 24 samples are to be tested and
these samples are tested for fatigue testing. So, these samples are multiplied by 8 times and the id
of the print is added at the end of the sample. The samples are shown above.
Randomizing the prints using excel
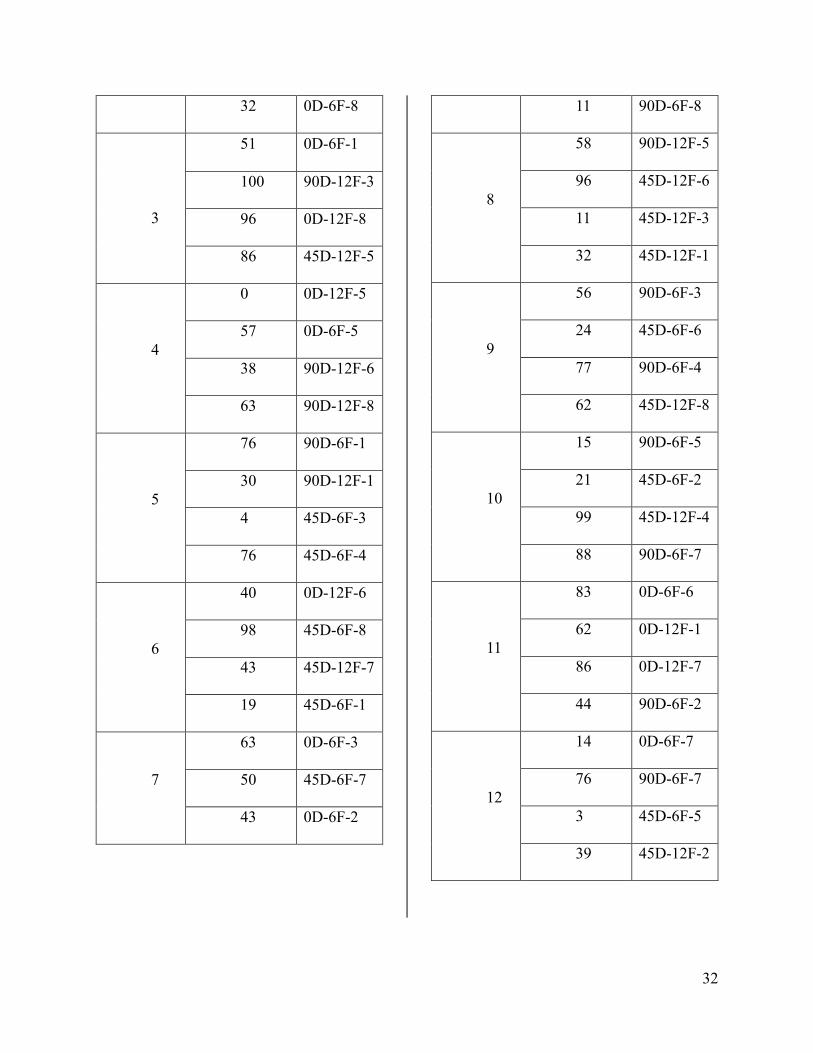
Table 3 Randomizing the experiments
Prin
t
Rando
m number
Tes
t specimen
ID
1
48 0D-12F-4
14 0D-12F-3
22 90D-12F-2
26 90D-6F-6
2
97 0D-6F-4
36 90D-12F-3
34 0D-12F-2
32
32 0D-6F-8
3
51 0D-6F-1
100 90D-12F-3
96 0D-12F-8
86 45D-12F-5
4
0 0D-12F-5
57 0D-6F-5
38 90D-12F-6
63 90D-12F-8
5
76 90D-6F-1
30 90D-12F-1
4 45D-6F-3
76 45D-6F-4
6
40 0D-12F-6
98 45D-6F-8
43 45D-12F-7
19 45D-6F-1
7
63 0D-6F-3
50 45D-6F-7
43 0D-6F-2
11 90D-6F-8
8
58 90D-12F-5
96 45D-12F-6
11 45D-12F-3
32 45D-12F-1
9
56 90D-6F-3
24 45D-6F-6
77 90D-6F-4
62 45D-12F-8
10
15 90D-6F-5
21 45D-6F-2
99 45D-12F-4
88 90D-6F-7
11
83 0D-6F-6
62 0D-12F-1
86 0D-12F-7
44 90D-6F-2
12
14 0D-6F-7
76 90D-6F-7
3 45D-6F-5
39 45D-12F-2
33
Randomizing is very important to make the sample giving the sample equal opportunity
for the samples for being selected. This gives better results in any research and generalization of
the large group. Although there are many methods to randomizing sample we have used a simple
method using excel. The command used is excel Rand () *100 to generate set of 48 random
number and then followed by sorting the set by ascending or descending order to create the
random data set. There can prints that can be printed at a point of time. So, the randomized
samples are separated into Four samples for a print. The random number at present are not in
order as the random numbers update every time in the excel. Samples look like as shown above.
Printing the test specimen
Now, the test specimens are randomized the test specimen of required dimension
mentioned above is imported in to a Markforged 3d composite printer using Eiger software that
is connected to the printer through the internet. The process of splicing take place in the
software. The part is placed on the print bed in the best orientation to reduce any supports. The
test specimen can be scaled and rotated in the software, the default units for importing will be
metric and it can be changed in advanced settings.
Nylon is used as matrix material because it has superior material properties compared to
ABS and PLA. Mark forged developed thermos plastic nylon that does not require any post
curing also has good adhesion to carbon fiber.
34
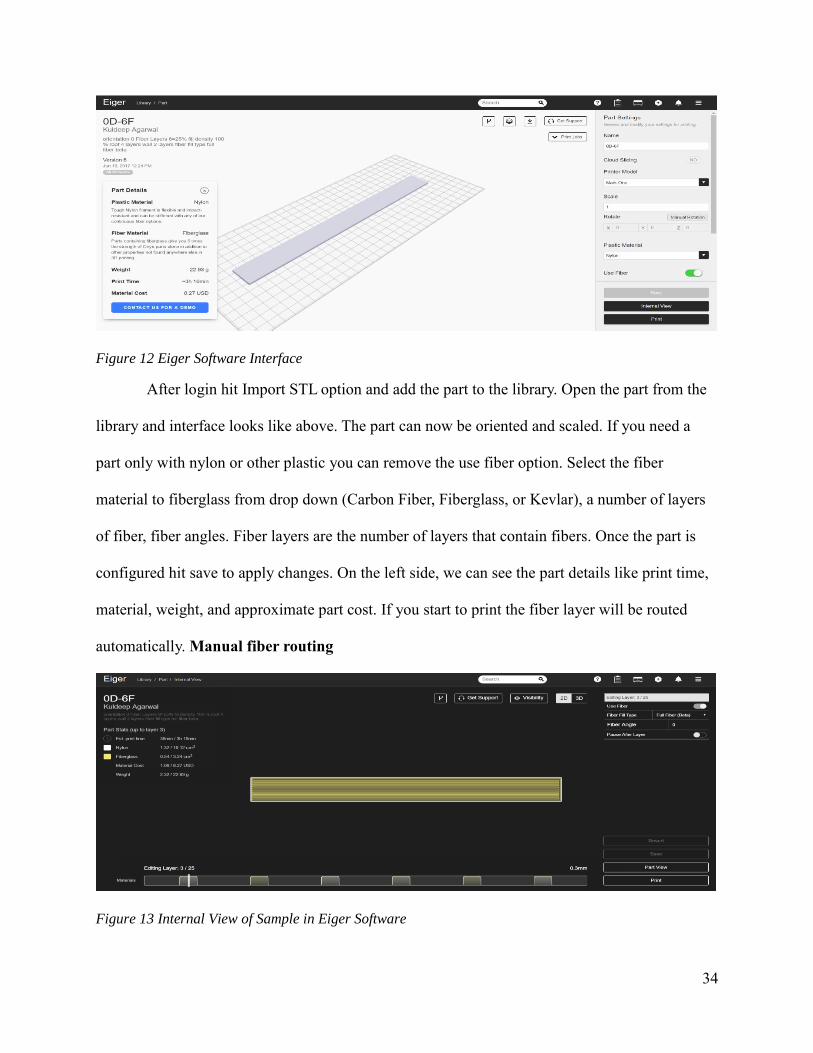
Figure 12 Eiger Software Interface
After login hit Import STL option and add the part to the library. Open the part from the
library and interface looks like above. The part can now be oriented and scaled. If you need a
part only with nylon or other plastic you can remove the use fiber option. Select the fiber
material to fiberglass from drop down (Carbon Fiber, Fiberglass, or Kevlar), a number of layers
of fiber, fiber angles. Fiber layers are the number of layers that contain fibers. Once the part is
configured hit save to apply changes. On the left side, we can see the part details like print time,
material, weight, and approximate part cost. If you start to print the fiber layer will be routed
automatically. Manual fiber routing
Figure 13 Internal View of Sample in Eiger Software
35
Although automatic option does create fiber routing. It is a better option to clearly loot
and rote the fibers according to loading time for good strength. Eiger software allows editing the
part layer by layer. By clicking the internal view, the part shows the fiber sandwich. The internal
view shows the 3D view of the part (default view). The 2D view can view layer by layer of the
part. If we like to add any additional layer we can edit the layer to the fiber by toggle button on
top side right corner. The minimum area size of the layer for the continuous area is 1" square. If
the section is having a smaller area than the layer is automatically filled with Plastic.
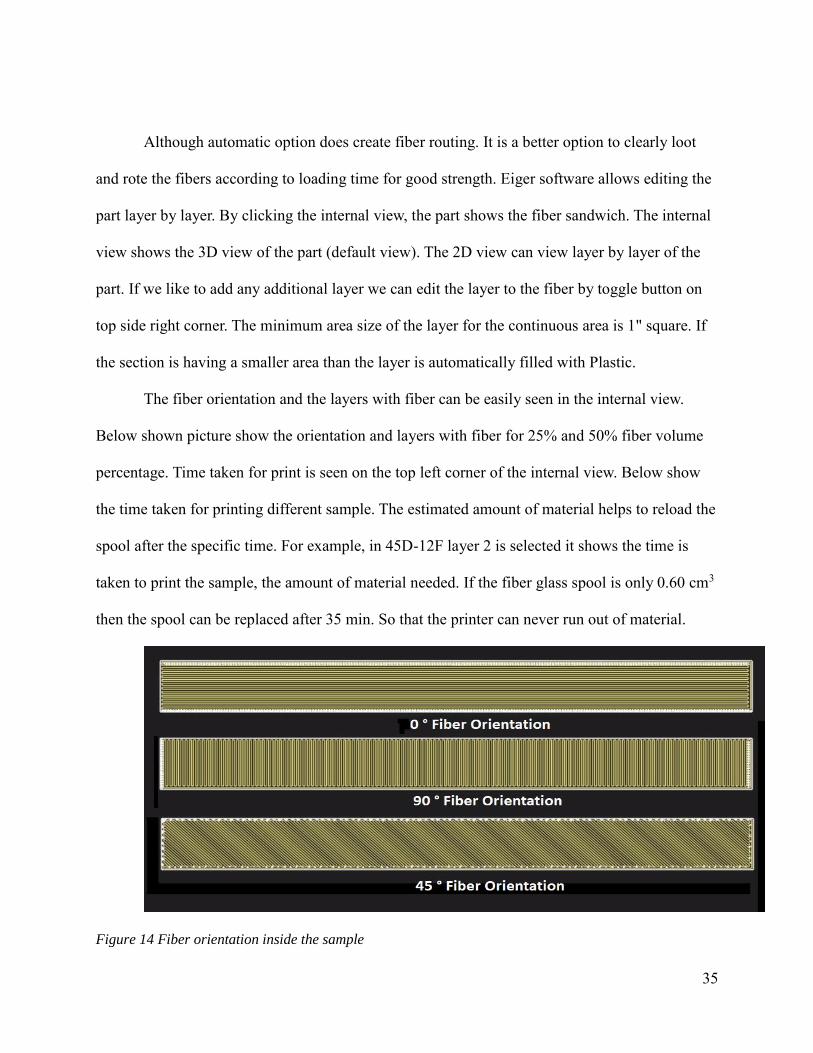
The fiber orientation and the layers with fiber can be easily seen in the internal view.
Below shown picture show the orientation and layers with fiber for 25% and 50% fiber volume
percentage. Time taken for print is seen on the top left corner of the internal view. Below show
the time taken for printing different sample. The estimated amount of material helps to reload the
spool after the specific time. For example, in 45D-12F layer 2 is selected it shows the time is
taken to print the sample, the amount of material needed. If the fiber glass spool is only 0.60 cm3
then the spool can be replaced after 35 min. So that the printer can never run out of material.
Figure 14 Fiber orientation inside the sample
36
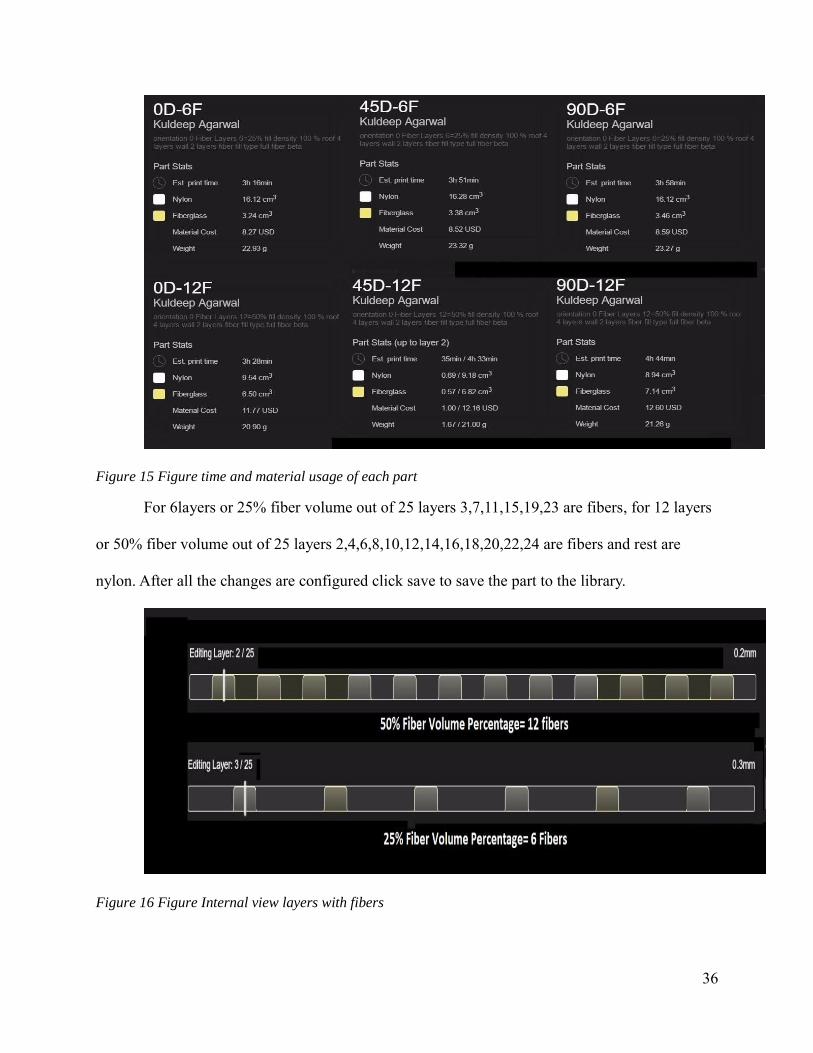
Figure 15 Figure time and material usage of each part
For 6layers or 25% fiber volume out of 25 layers 3,7,11,15,19,23 are fibers, for 12 layers
or 50% fiber volume out of 25 layers 2,4,6,8,10,12,14,16,18,20,22,24 are fibers and rest are
nylon. After all the changes are configured click save to save the part to the library.
Figure 16 Figure Internal view layers with fibers
37
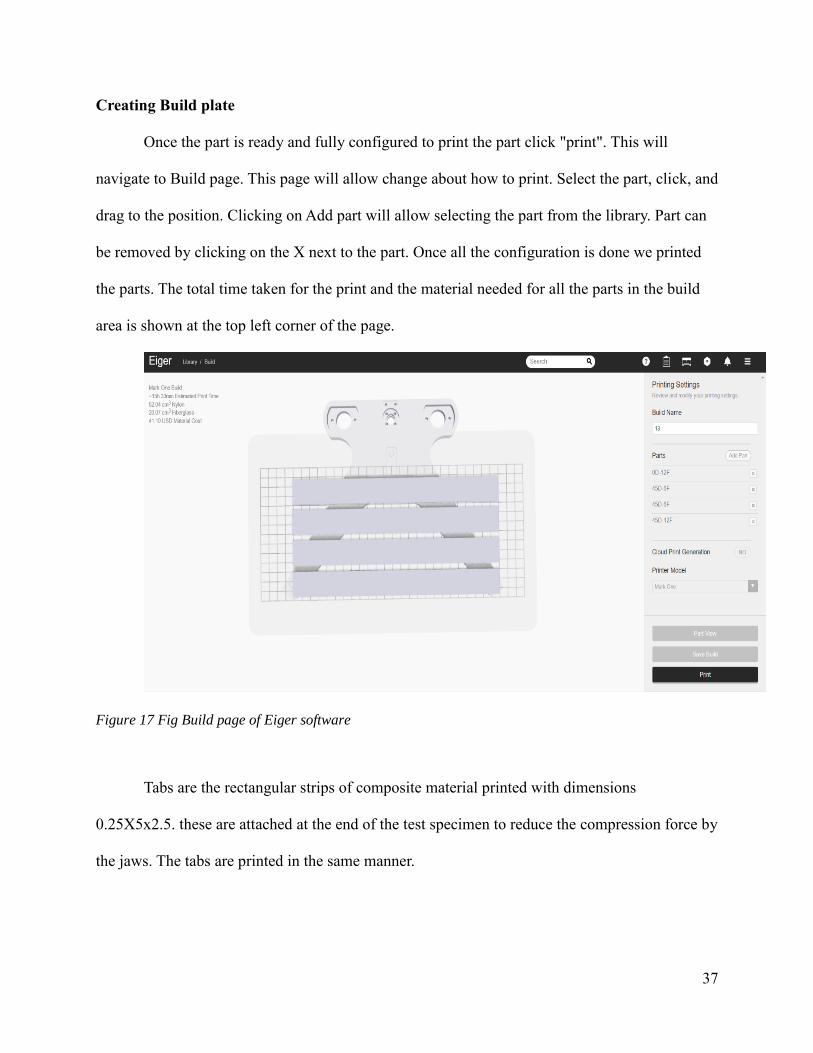
Creating Build plate
Once the part is ready and fully configured to print the part click "print". This will
navigate to Build page. This page will allow change about how to print. Select the part, click, and
drag to the position. Clicking on Add part will allow selecting the part from the library. Part can
be removed by clicking on the X next to the part. Once all the configuration is done we printed
the parts. The total time taken for the print and the material needed for all the parts in the build
area is shown at the top left corner of the page.
Figure 17 Fig Build page of Eiger software
Tabs are the rectangular strips of composite material printed with dimensions
0.25X5x2.5. these are attached at the end of the test specimen to reduce the compression force by
the jaws. The tabs are printed in the same manner.
38
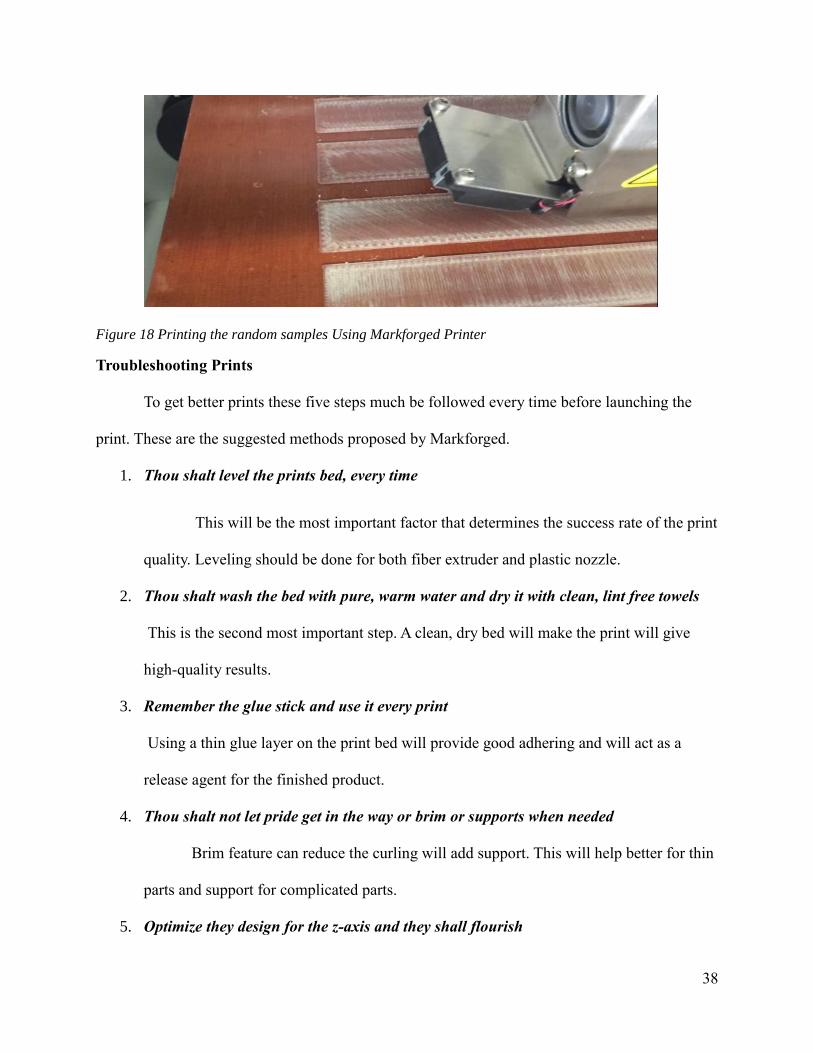
Figure 18 Printing the random samples Using Markforged Printer
Troubleshooting Prints
To get better prints these five steps much be followed every time before launching the
print. These are the suggested methods proposed by Markforged.
1. Thou shalt level the prints bed, every time
This will be the most important factor that determines the success rate of the print
quality. Leveling should be done for both fiber extruder and plastic nozzle.
2. Thou shalt wash the bed with pure, warm water and dry it with clean, lint free towels
This is the second most important step. A clean, dry bed will make the print will give
high-quality results.
3. Remember the glue stick and use it every print
Using a thin glue layer on the print bed will provide good adhering and will act as a
release agent for the finished product.
4. Thou shalt not let pride get in the way or brim or supports when needed
Brim feature can reduce the curling will add support. This will help better for thin
parts and support for complicated parts.
5. Optimize they design for the z-axis and they shall flourish
39
This step looks simple but it often overlooked. The part must be oriented in such a
way that the largest or flat face must be near the build plate. This will give best chances
of success.
Common Printing Issues
There are many printing issues like Plastic under extrusion, Fiber trails, Dislocation,
Plastic Blobs, Fiber offset, Support failed, Plastic stringing, Fiber Residue, Part Adhesion, Plastic
Burning, Fiber missing, Warping, or curling. Among these issues, these are common issues faced
during the printing.
Plastic burning
Brown or black spots are observed on the part with this issue. This issue only affects the
aesthetic look of the part and does not affect the strength of the part. Common causes are poor
bed leveling, wet material, dirty nozzles, part warping.
Fiber residue
Fiber residue is due to the irregular level of fiber nozzle and plastic. This residue often
presents as small blobs of material outside of a part. Common causes are fiber nozzle too high or
print bed too high.
Warping or Curling
It is part peeling of away from the print bed. This happens when plastic cool and
contracts and internal stress in plastic pulls towards itself. As internal forces increase the part is
pulled from the print bed. Common causes are part geometry, Bed leveling, Printing
Environment, plastic material.
40
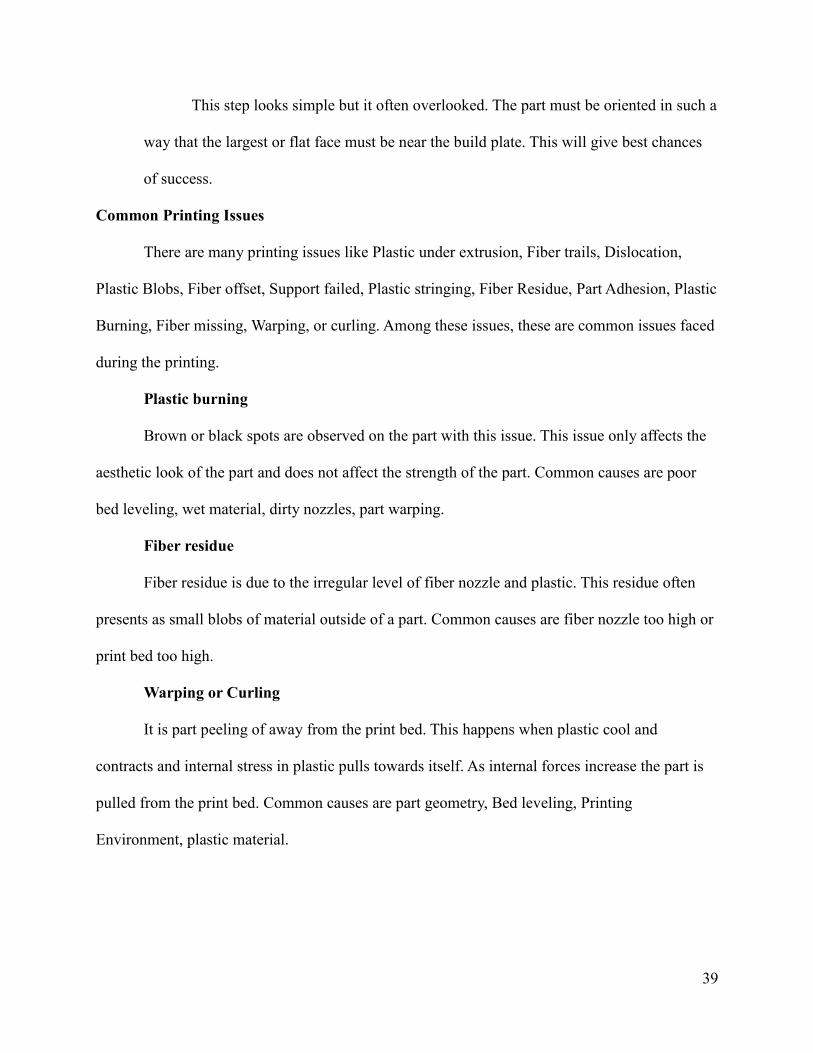
Plastic stringing
Stringing is the deposition of plastic material like fiber residue. This occurs when the
plastic is heated for long period of time. Also, occurs when a new layer is failed to adhere to the
previous layer. Common causes are wet plastic and can be reduced by replacing plastic filament.
Figure 19 Failed print caused damage to print bed
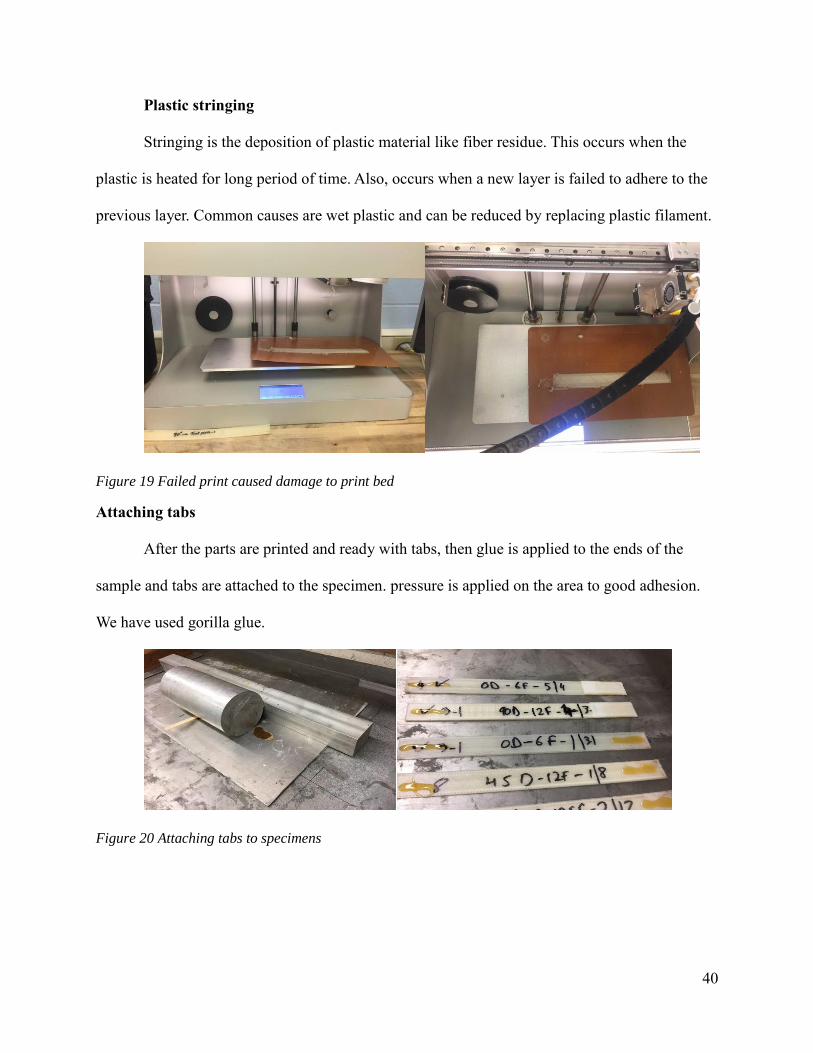
Attaching tabs
After the parts are printed and ready with tabs, then glue is applied to the ends of the
sample and tabs are attached to the specimen. pressure is applied on the area to good adhesion.
We have used gorilla glue.
Figure 20 Attaching tabs to specimens
41
Fatigue experimental testing
A modern servo-hydraulic test system does fatigue testing, we used MTS machine. On
this modern machine, Multiaxial testing is done by using two or more control systems. After the
samples are glued now it’s time for testing. In order to apply the cyclic stress at first, the
Maximum Stress on the specimen should be identified. So, we have done a tensile test on the
part before doing the tensile test on the sample.
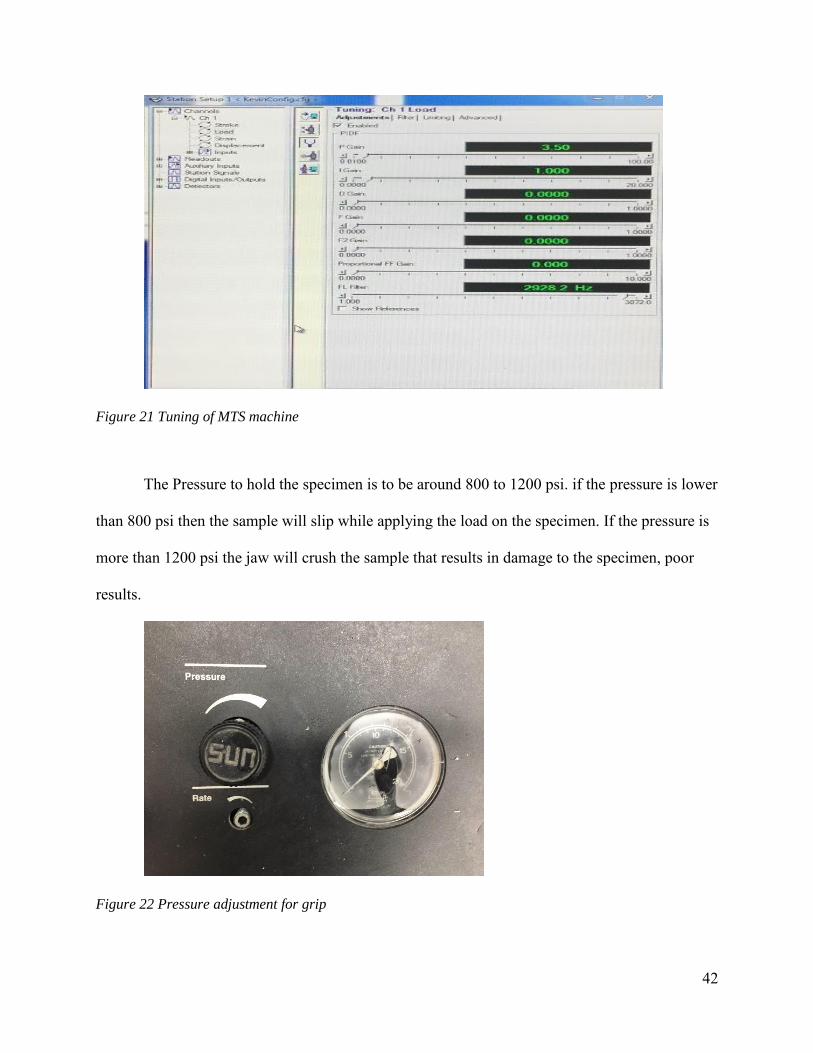
After the tensile testing results are known, to start the fatigue testing first the machine
tuning should be done. Tuning is very important to know how the system respond to the error
between a given test parameters and feedback received. Some more test samples are printed
especially for tuning and tuning is done.
Proportional Gain (P Gain)
It increases the effect of the error signal on the servo valve to improve system response.
Proportion gain is generally used in any tuning. If P Gain is too high the system will make a lot
of sound due to unstable to reach the resulting parameters. If P Gain increase there will decrease
in the error and increases the system response. If P Gain is low then the system will never able to
reach desired parameters. There is no specific P Gain for this test setup. The P Gain will be
initially 2.5 and then slowly increased to 9 till we get the required output. P Gain more than 9 in
the case will make the machine unstable. If initial P Gain is above 6 then the system will apply
shock loads and specimen breaks at once.
42
Figure 21 Tuning of MTS machine
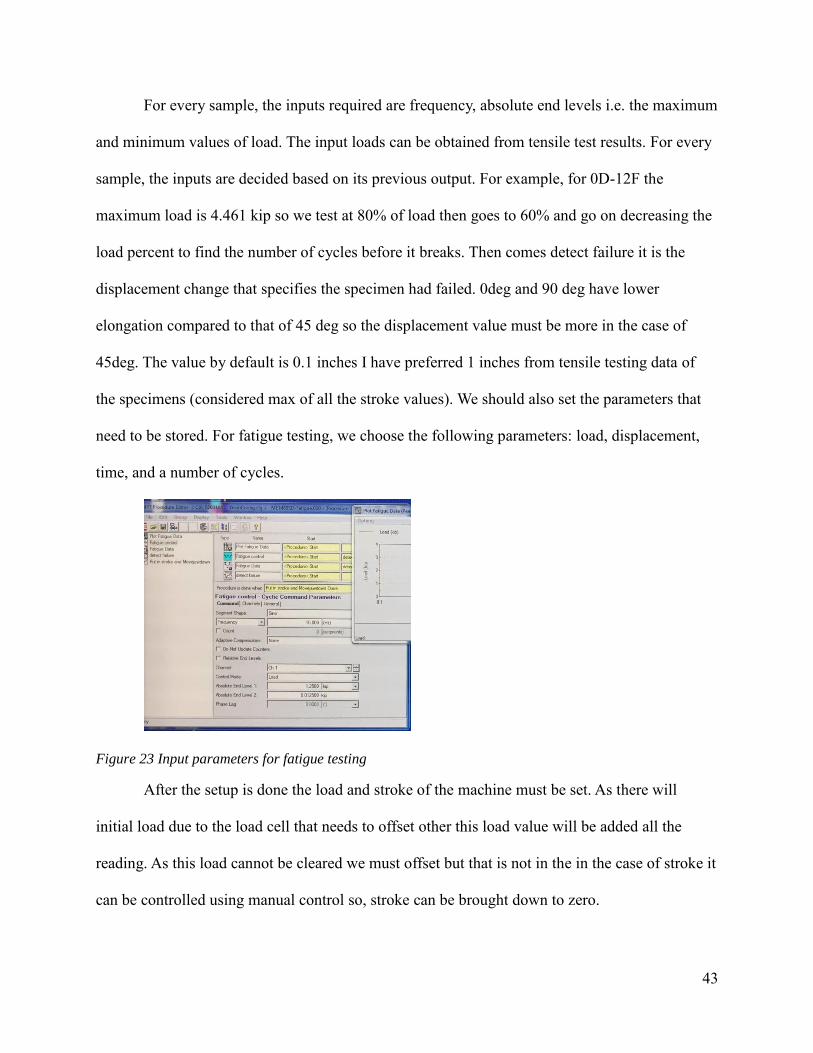
The Pressure to hold the specimen is to be around 800 to 1200 psi. if the pressure is lower
than 800 psi then the sample will slip while applying the load on the specimen. If the pressure is
more than 1200 psi the jaw will crush the sample that results in damage to the specimen, poor
results.
Figure 22 Pressure adjustment for grip
43
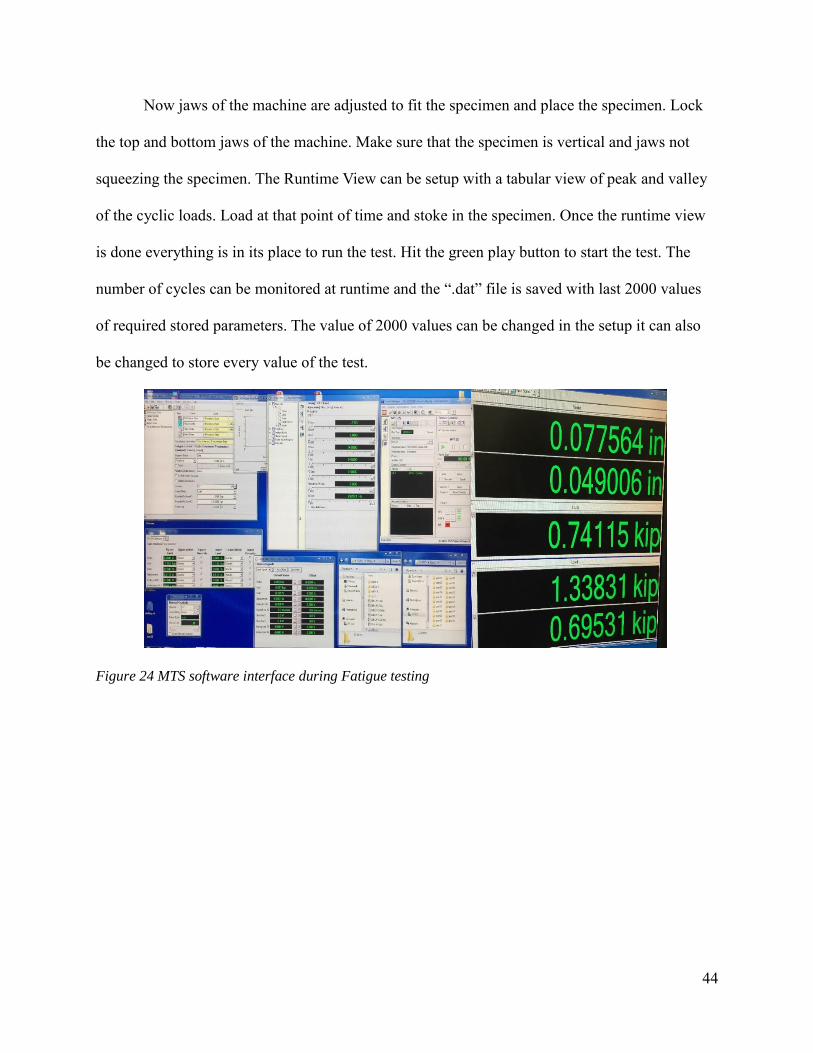
For every sample, the inputs required are frequency, absolute end levels i.e. the maximum
and minimum values of load. The input loads can be obtained from tensile test results. For every
sample, the inputs are decided based on its previous output. For example, for 0D-12F the
maximum load is 4.461 kip so we test at 80% of load then goes to 60% and go on decreasing the
load percent to find the number of cycles before it breaks. Then comes detect failure it is the
displacement change that specifies the specimen had failed. 0deg and 90 deg have lower
elongation compared to that of 45 deg so the displacement value must be more in the case of
45deg. The value by default is 0.1 inches I have preferred 1 inches from tensile testing data of
the specimens (considered max of all the stroke values). We should also set the parameters that
need to be stored. For fatigue testing, we choose the following parameters: load, displacement,
time, and a number of cycles.
Figure 23 Input parameters for fatigue testing
After the setup is done the load and stroke of the machine must be set. As there will
initial load due to the load cell that needs to offset other this load value will be added all the
reading. As this load cannot be cleared we must offset but that is not in the in the case of stroke it
can be controlled using manual control so, stroke can be brought down to zero.
44
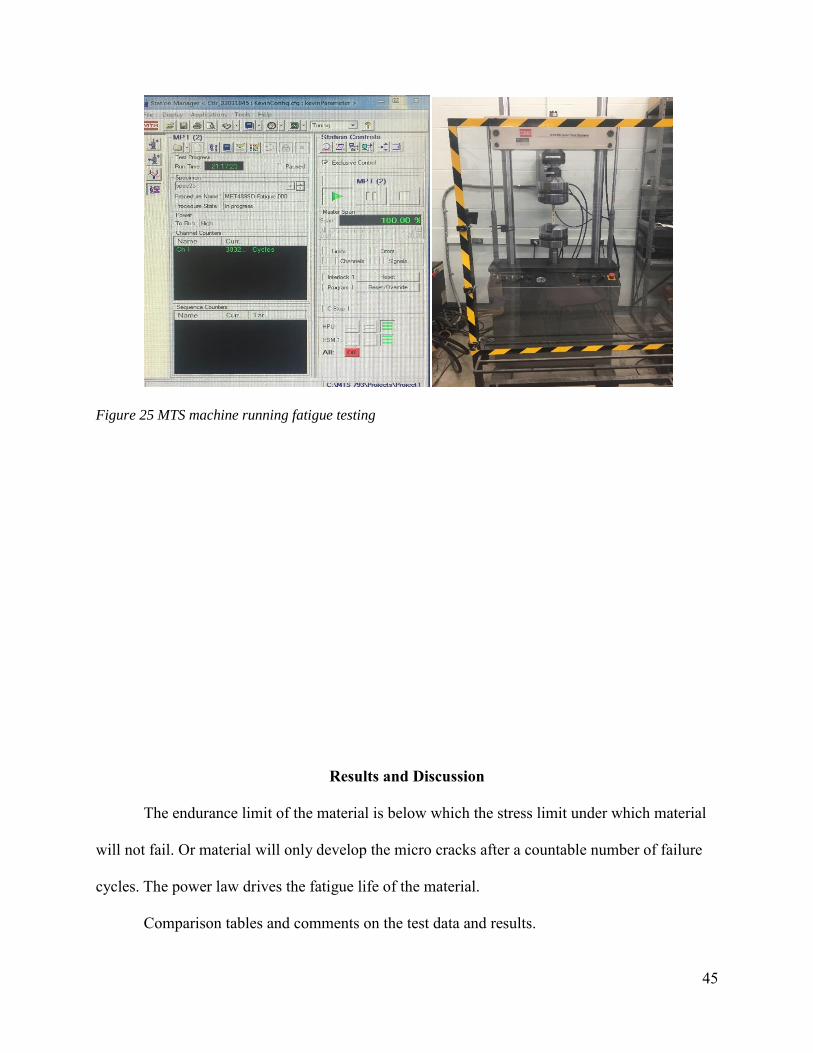
Now jaws of the machine are adjusted to fit the specimen and place the specimen. Lock
the top and bottom jaws of the machine. Make sure that the specimen is vertical and jaws not
squeezing the specimen. The Runtime View can be setup with a tabular view of peak and valley
of the cyclic loads. Load at that point of time and stoke in the specimen. Once the runtime view
is done everything is in its place to run the test. Hit the green play button to start the test. The
number of cycles can be monitored at runtime and the “.dat” file is saved with last 2000 values
of required stored parameters. The value of 2000 values can be changed in the setup it can also
be changed to store every value of the test.
Figure 24 MTS software interface during Fatigue testing
45
Figure 25 MTS machine running fatigue testing
Results and Discussion
The endurance limit of the material is below which the stress limit under which material
will not fail. Or material will only develop the micro cracks after a countable number of failure
cycles. The power law drives the fatigue life of the material.
Comparison tables and comments on the test data and results.
46
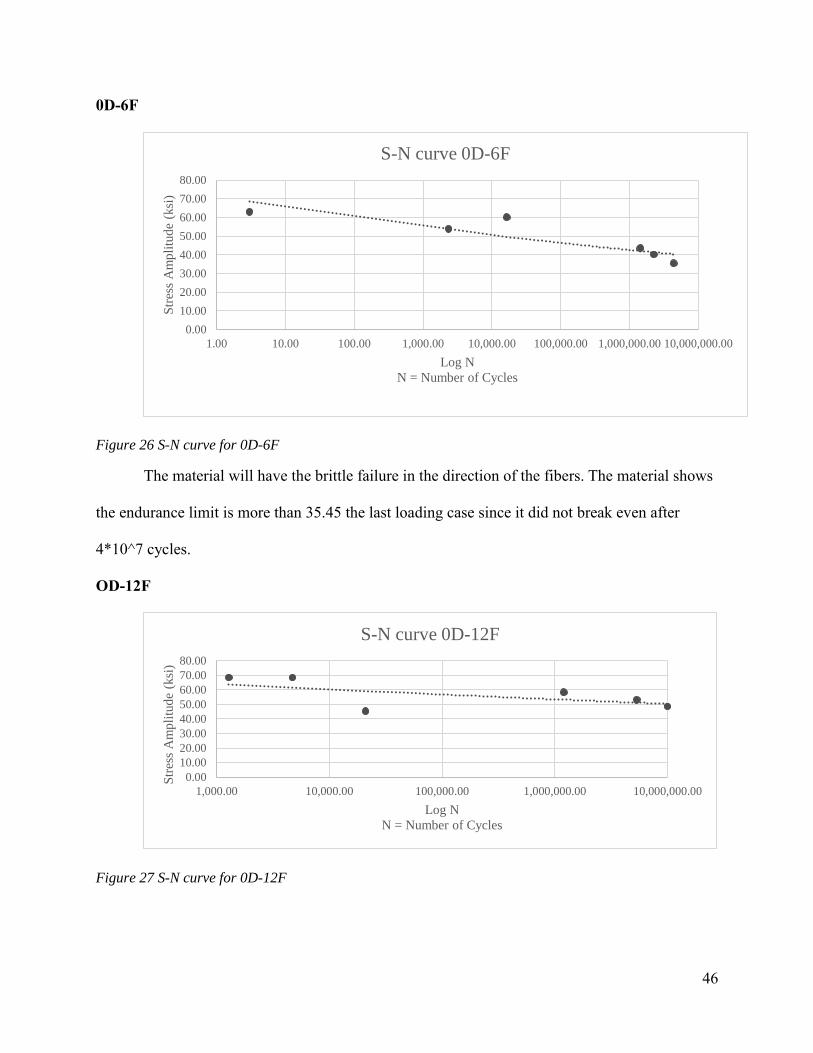
0D-6F
Figure 26 S-N curve for 0D-6F
The material will have the brittle failure in the direction of the fibers. The material shows
the endurance limit is more than 35.45 the last loading case since it did not break even after
4*10^7 cycles.
OD-12F
Figure 27 S-N curve for 0D-12F
0.00
10.00
20.00
30.00
40.00
50.00
60.00
70.00
80.00
1.00 10.00 100.00 1,000.00 10,000.00 100,000.00 1,000,000.00 10,000,000.00
Str
ess
Am
pli
tud
e (k
si)
Log N
N = Number of Cycles
S-N curve 0D-6F
0.00
10.00
20.00
30.00
40.00
50.00
60.00
70.00
80.00
1,000.00 10,000.00 100,000.00 1,000,000.00 10,000,000.00
Str
ess
Am
pli
tud
e (k
si)
Log N
N = Number of Cycles
S-N curve 0D-12F
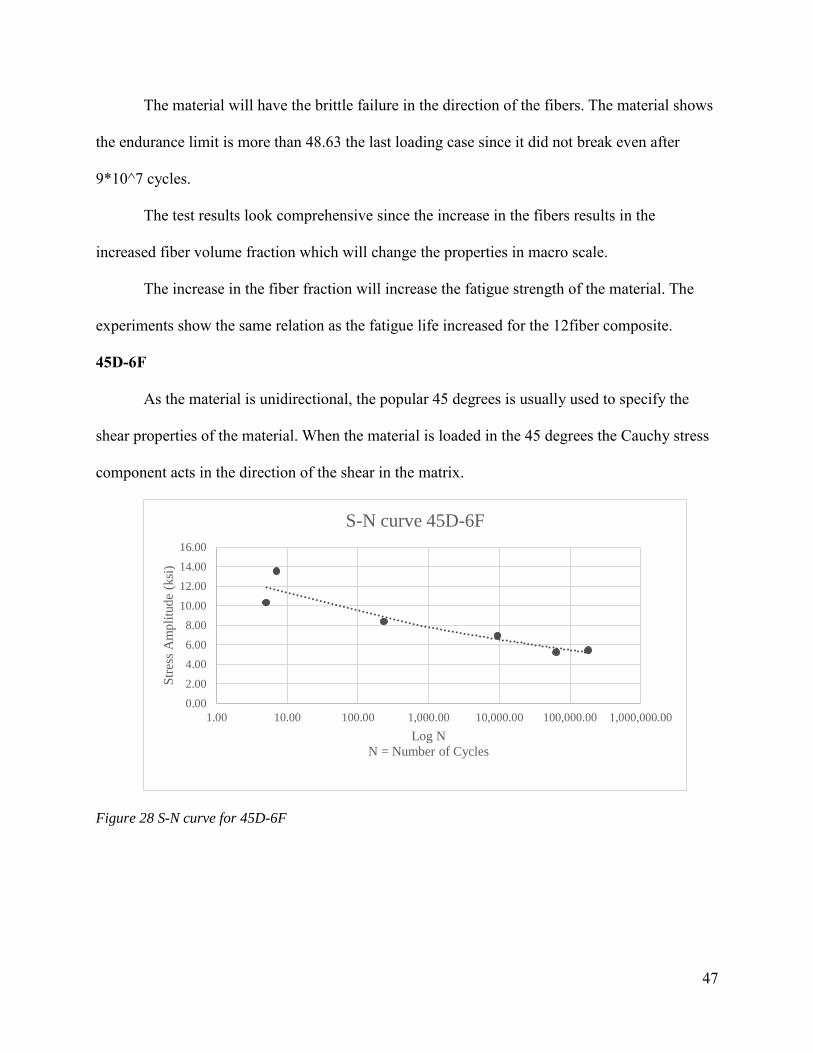
47
The material will have the brittle failure in the direction of the fibers. The material shows
the endurance limit is more than 48.63 the last loading case since it did not break even after
9*10^7 cycles.
The test results look comprehensive since the increase in the fibers results in the
increased fiber volume fraction which will change the properties in macro scale.
The increase in the fiber fraction will increase the fatigue strength of the material. The
experiments show the same relation as the fatigue life increased for the 12fiber composite.
45D-6F
As the material is unidirectional, the popular 45 degrees is usually used to specify the
shear properties of the material. When the material is loaded in the 45 degrees the Cauchy stress
component acts in the direction of the shear in the matrix.
Figure 28 S-N curve for 45D-6F
0.00
2.00
4.00
6.00
8.00
10.00
12.00
14.00
16.00
1.00 10.00 100.00 1,000.00 10,000.00 100,000.00 1,000,000.00
Str
ess
Am
pli
tud
e (k
si)
Log N
N = Number of Cycles
S-N curve 45D-6F
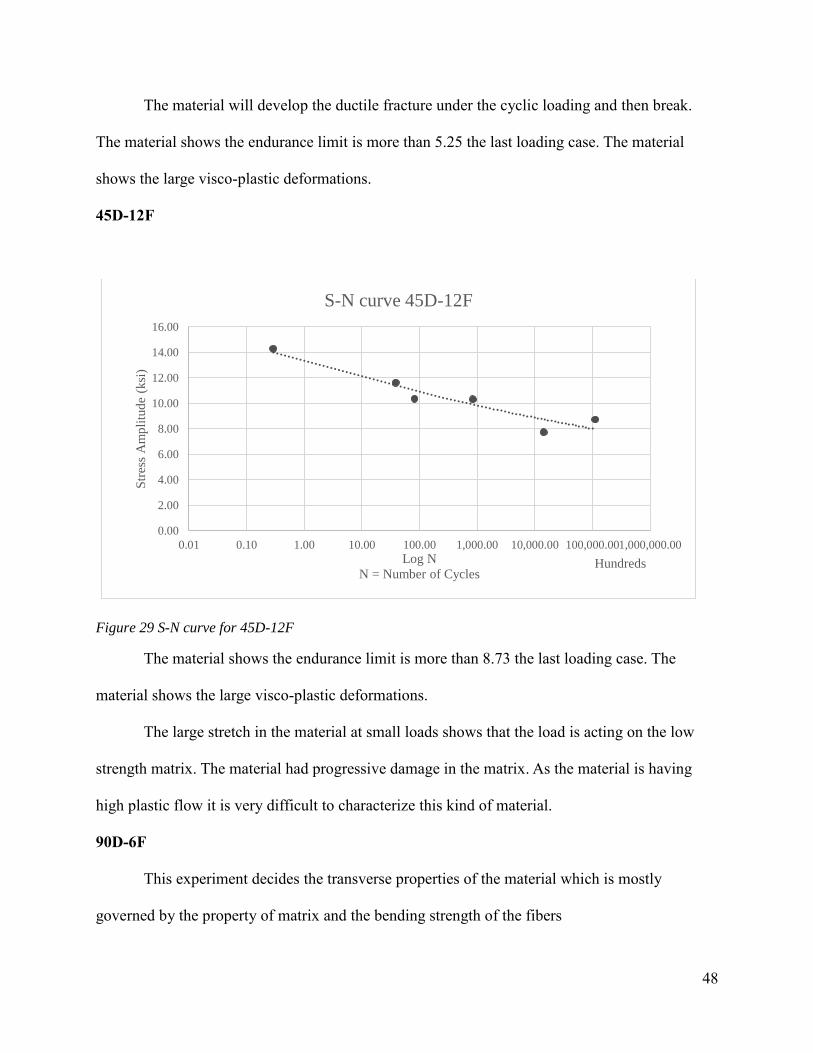
48
The material will develop the ductile fracture under the cyclic loading and then break.
The material shows the endurance limit is more than 5.25 the last loading case. The material
shows the large visco-plastic deformations.
45D-12F
Figure 29 S-N curve for 45D-12F
The material shows the endurance limit is more than 8.73 the last loading case. The
material shows the large visco-plastic deformations.
The large stretch in the material at small loads shows that the load is acting on the low
strength matrix. The material had progressive damage in the matrix. As the material is having
high plastic flow it is very difficult to characterize this kind of material.
90D-6F
This experiment decides the transverse properties of the material which is mostly
governed by the property of matrix and the bending strength of the fibers
0.00
2.00
4.00
6.00
8.00
10.00
12.00
14.00
16.00
0.01 0.10 1.00 10.00 100.00 1,000.00 10,000.00 100,000.001,000,000.00
Str
ess
Am
pli
tud
e (k
si)
Log N
N = Number of CyclesHundreds
S-N curve 45D-12F
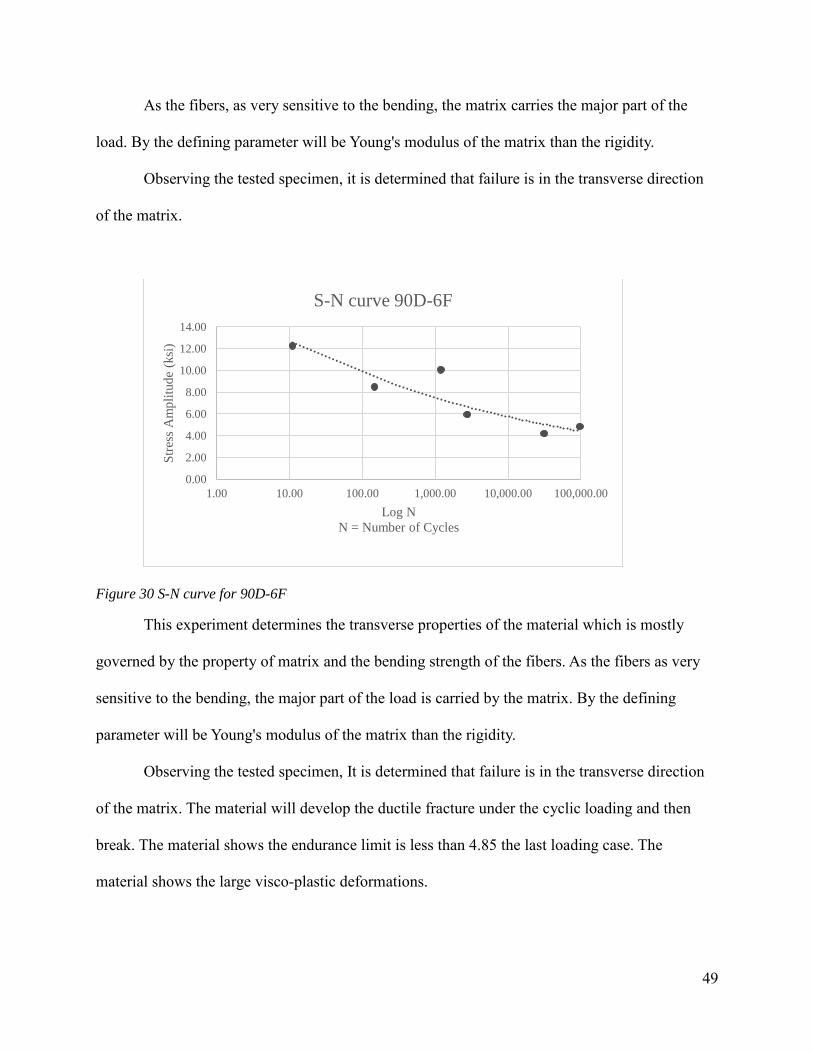
49
As the fibers, as very sensitive to the bending, the matrix carries the major part of the
load. By the defining parameter will be Young's modulus of the matrix than the rigidity.
Observing the tested specimen, it is determined that failure is in the transverse direction
of the matrix.
Figure 30 S-N curve for 90D-6F
This experiment determines the transverse properties of the material which is mostly
governed by the property of matrix and the bending strength of the fibers. As the fibers as very
sensitive to the bending, the major part of the load is carried by the matrix. By the defining
parameter will be Young's modulus of the matrix than the rigidity.
Observing the tested specimen, It is determined that failure is in the transverse direction
of the matrix. The material will develop the ductile fracture under the cyclic loading and then
break. The material shows the endurance limit is less than 4.85 the last loading case. The
material shows the large visco-plastic deformations.
0.00
2.00
4.00
6.00
8.00
10.00
12.00
14.00
1.00 10.00 100.00 1,000.00 10,000.00 100,000.00
Str
ess
Am
pli
tud
e (k
si)
Log N
N = Number of Cycles
S-N curve 90D-6F
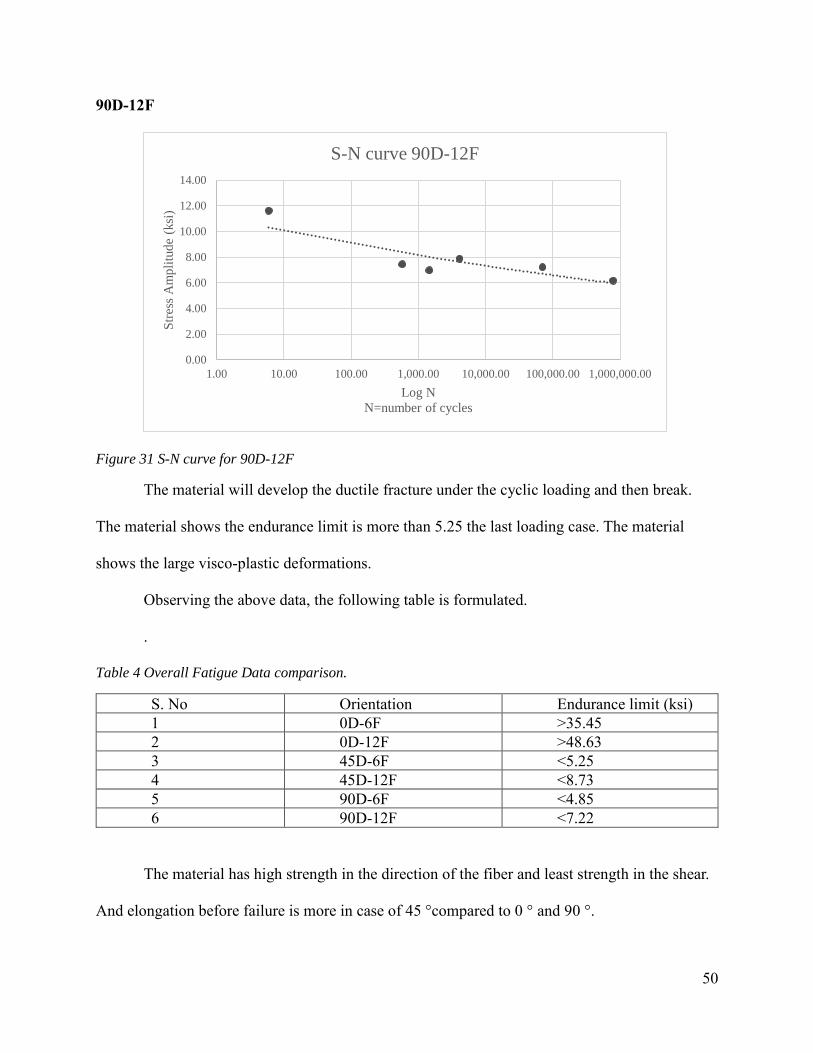
50
90D-12F
Figure 31 S-N curve for 90D-12F
The material will develop the ductile fracture under the cyclic loading and then break.
The material shows the endurance limit is more than 5.25 the last loading case. The material
shows the large visco-plastic deformations.
Observing the above data, the following table is formulated.
.
Table 4 Overall Fatigue Data comparison.
S. No Orientation Endurance limit (ksi)
1 0D-6F >35.45
2 0D-12F >48.63
3 45D-6F <5.25
4 45D-12F <8.73
5 90D-6F <4.85
6 90D-12F <7.22
The material has high strength in the direction of the fiber and least strength in the shear.
And elongation before failure is more in case of 45 °compared to 0 ° and 90 °.
0.00
2.00
4.00
6.00
8.00
10.00
12.00
14.00
1.00 10.00 100.00 1,000.00 10,000.00 100,000.00 1,000,000.00
Str
ess
Am
pli
tud
e (k
si)
Log N
N=number of cycles
S-N curve 90D-12F
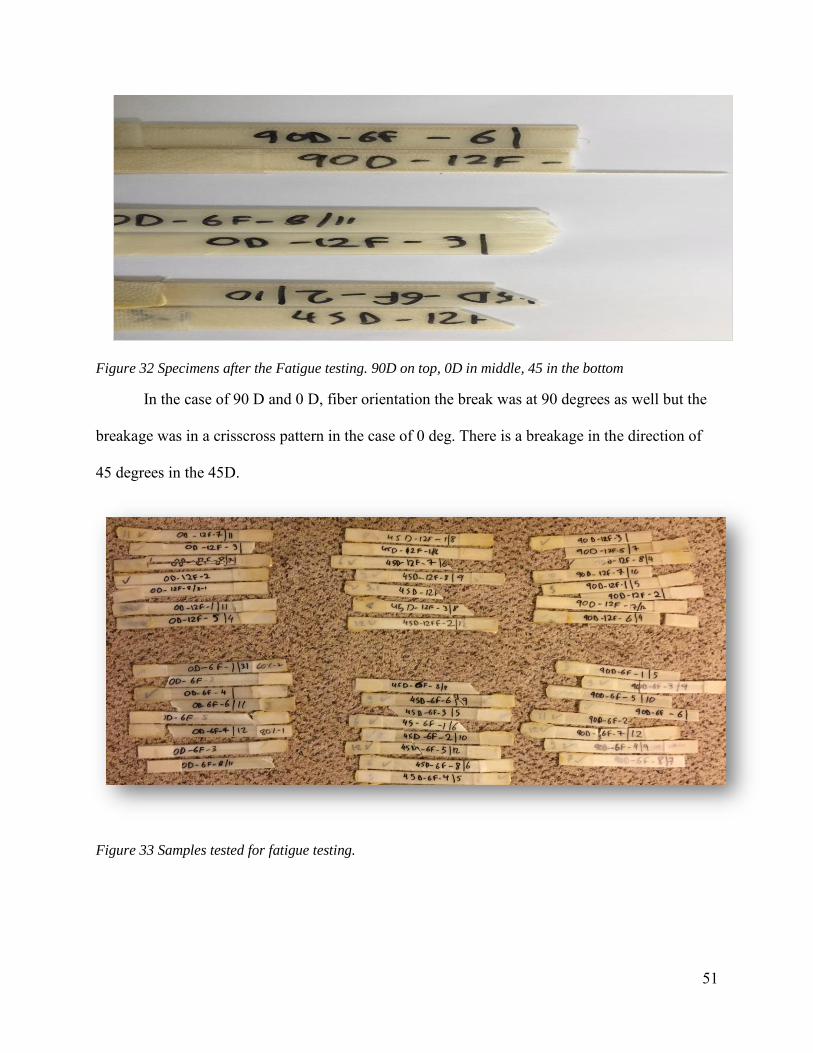
51
Figure 32 Specimens after the Fatigue testing. 90D on top, 0D in middle, 45 in the bottom
In the case of 90 D and 0 D, fiber orientation the break was at 90 degrees as well but the
breakage was in a crisscross pattern in the case of 0 deg. There is a breakage in the direction of
45 degrees in the 45D.
Figure 33 Samples tested for fatigue testing.
0.00
2.00
4.00
6.00
8.00
10.00
12.00
14.00
1.00 10.00 100.00 1,000.00 10,000.00 100,000.00 1,000,000.00
Str
ess
Am
pli
tud
e
Log N
S-N curve 90D-12F
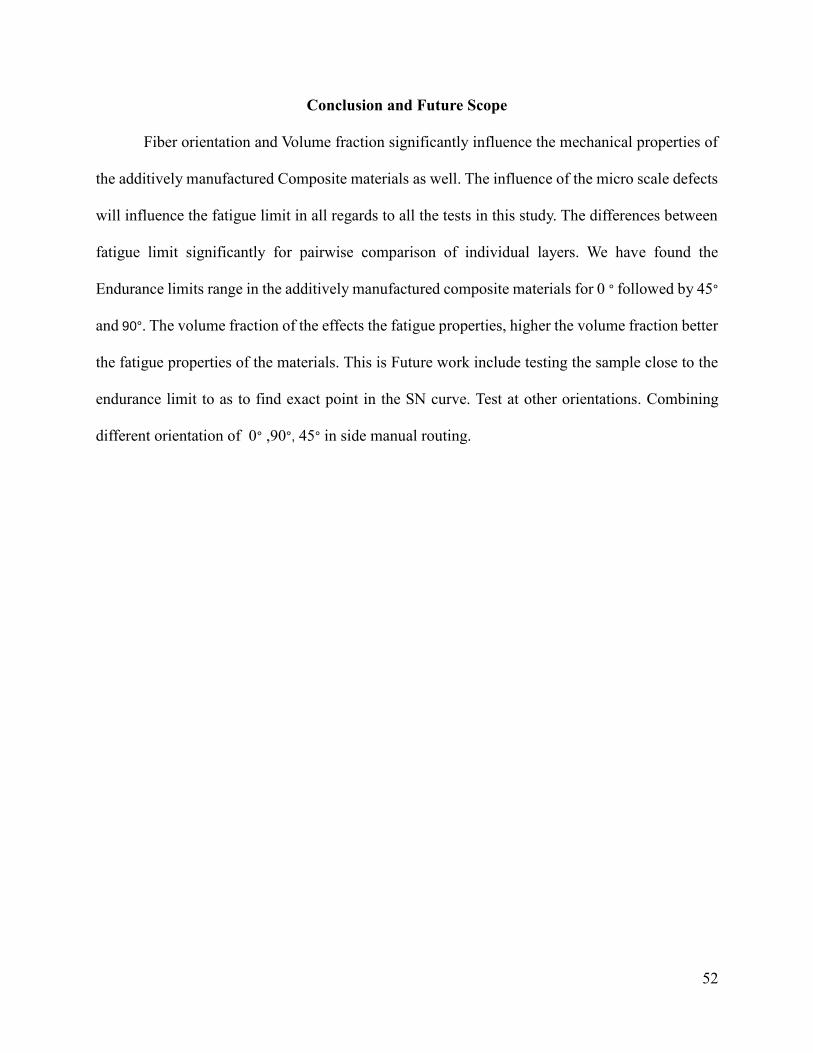
52
Conclusion and Future Scope
Fiber orientation and Volume fraction significantly influence the mechanical properties of
the additively manufactured Composite materials as well. The influence of the micro scale defects
will influence the fatigue limit in all regards to all the tests in this study. The differences between
fatigue limit significantly for pairwise comparison of individual layers. We have found the
Endurance limits range in the additively manufactured composite materials for 0 ° followed by 45°
and 90°. The volume fraction of the effects the fatigue properties, higher the volume fraction better
the fatigue properties of the materials. This is Future work include testing the sample close to the
endurance limit to as to find exact point in the SN curve. Test at other orientations. Combining
different orientation of 0° ,90°, 45° in side manual routing.
53
References
Analysis and Performance of Fiber Composites, Agarwal, B.D. and Broutman, L. J., john Wiley
& Sons.
Mechanics of composite materials, Jones, R. M., Mc‐Graw Hill.
Engineering Mechanics of Composite Materials, Daniel, I. M. and Ishai, O., Oxford University
Press.
Barclift, M. and Williams, C. (2012), Examining variability in the mechanical properties of parts
manufactured via Polyjet direct 3D printing, International Solid Freeform Fabrication
Symposium, Austin, TX
Chen, H. and Zhao, Y.F. (2016), Process parameter optimization for improving surface quality
and manufacturing accuracy of binder jetting additive manufacturing process, Rapid Prototyping
Journal, Vol. 22, Pg. 527-538
Gibson, I., Rosen, D. and Stucker, B. (2015), Additive Manufacturing Technologies, Springer
Science + Business Media
Gibson, R. (2016), Principles of composite material mechanics, CRC Press.
ISO / ASTM52900-15 (2015), Standard Terminology for Additive Manufacturing – General
Principles – Terminology, ASTM International, West Conshohocken, PA
Croccolo, Dario, Massimiliano De Agostinis, and Giorgio Olmi. "Experimental characterization
and analytical modelling of the mechanical behavior of fused deposition processed parts made of
ABSM30." Computational Materials Science 79 (2013): 506-518.
Scheirs. J., 2000, “Compositional and failure analysis of polymers: a practical approach”. John
Wiley & Sons. pp.311-315. Chap.12.
Material science and Engineering by William F smith, Javad Hashemi, Ravi Prakash.
Applied mechanics, fluid and solid mechanics: selected, peer reviewed papers from the 2013
International Conference on Applied Mechanics, Fluid and Solid Mechanics by Tan, Jin
Leigh S.J., Bradley, R.J., Purssell, C.P., Purssell, D.R. and Purssell, D.A. (2012), A simple low
cost conductive composite material for 3D printing of electronic sensors. Plos One, Vol. 7 (11),
Pg. 1-6
3D printing and additive manufacturing: principles and applications by Chua, Chee Kai; Leong,
Kah Fai, 2015, Fourth edition of Rapid prototyping.
54
Title of article,” Website/company/publication name, date of access, URL.
Banakar, Prashanth & K Shivananda, H & Niranjan, H.B.. (2012). Influence of Fiber Orientation
and Thickness on Tensile Properties of Laminated Polymer Composites. Int. J. Pure Appl. Sci.
Technol.. 9. .
Sundus A. Razzak (2013). The effect of volume fraction on the fatigue strength of unsaturated
polyester / glass fiber composite. Iraqi Journal of Physics. Vol.11, No.22, PP. 14-19
Kumaresan. M, Sathish. S and Karthi. N (2015). Effect of Fiber Orientation on Mechanical
Properties of Sisal Fiber Reinforced Epoxy Composites. Journal of Applied Science and
Engineering, Vol. 18, No. 3, pp. 289-294
Jones, Jason B., Wimpenny, David I., Gibbons, Greg J (2015). Additive manufacturing under
pressure
Boivie, K.M. , Karlsen, R. and van der Eijk, C. ( 2006 ), " Material issues of the metal printing
process, MPP ", 17th Solid Freeform Fabrication Symposium, Austin, TX, University of Texas ,
Austin, TX
Basics of 3D printing & Technologies "https://www.3dhubs.com"
Introduction to markforged printers "https://markforged.com/"
Jones, J.B. , Gibbons, G.J. and Wimpenny, D.I. ( 2011 ), Transfer Methods toward Additive
Manufacturing by Electrophotography. IS&T’s NIP27 and Digital Fabrication , Society for
Imaging Science and Technology , Minneapolis, MN, Springfield, VA , pp. 180 - 184 .
An overview of additive manufacturing (3D printing) for microfabrication. Author: Bhushan,
Bharat
Editorial Material: INTRODUCTION in POLYMERS and POLYMER COMPOSITES, vol 22,
issue 8, pp .Author: Broitman, Esteban
Introduction to strength of composite materials. Chapter 9, Interface problems of composite
materials and introduction to micro material design Author: KAGAWA, Yutaka