Embed Size (px)
Citation preview
1
Centre for International Cooperation in Agronomic Research for Development
The emerging countries in Africa south of the Sahara
in the agricultural sector.
Analysis of trade relations
Report 1/6
Author: Candela Saiz Carrasco Coordinators: Jean-Jacques Gabas Vincent Ribier
March 2015
THIS PAPER CONSTITUTES A DRAFT PREVIEW OF THE FINAL REPORT
Technical Centre for Agricultural and Rural Cooperation ACP-EU Cotonou Agreement
A
and Rural Cooperation
2
Contents Preamble: recollection of terms of reference for the CIRAD-CTA study, general structure of the
research, authors .................................................................................................................................... 5
General introduction ............................................................................................................................... 6
I. The development of trade relations between sub-Saharan Africa and the emerging countries
during the period 2000-2013 .................................................................................................................. 7
I.1 A profound change in the shape of sub-Saharan Africa’s trade relations with its partners .......... 7
I.2 Asymmetry in the importance of this international trade ........................................................... 11
I.3 Trade with the emerging countries concentrated on a few countries in SSA .............................. 12
I.4 A strong commercial focus on a few products ............................................................................. 13
I.5 Overview of agricultural trade: modest but significant ............................................................... 14
I.6 Differing situations in different emerging countries .................................................................... 18
II. Detailed analysis of trade relations between each of the emerging countries and Africa south of
the Sahara.............................................................................................................................................. 23
II.1 Total trade for each of the emerging countries .......................................................................... 23
II.1.1 Argentina ............................................................................................................................. 23
II.1.3 China .................................................................................................................................... 27
II.1.4 India ..................................................................................................................................... 29
II.1.5 South Korea.......................................................................................................................... 31
II.1.6 South Africa ......................................................................................................................... 33
II.2 The agricultural trade of each of the emerging countries with sub-Saharan Africa ................... 35
II.2.2 Brazil .................................................................................................................................... 37
II.2.3 China .................................................................................................................................... 39
II.2.4 India ..................................................................................................................................... 41
II.2.6 South Africa ......................................................................................................................... 45
Appendix 1 : Terms of reference ........................................................................................................... 48
Appendix 2: Nomenclature used in the COMTRADE database ............................................................. 49
Appendix 3: Share of each of the emerging countries in total and agricultural trade (imports and
exports) of each of the countries of SSA in 2000 and 2013 .................................................................. 66
3
Graphs
Graph 1 Development of trade with SSA (2000-2013) ............................................................................ 7
Graph 2 Volume of total trade (2013) ..................................................................................................... 9
Graph 3 Total exports and imports (2000-2013) ..................................................................................... 9
Graph 4 Balance of trade (X-M) with sub-Saharan Africa (2013) .......................................................... 10
Graph 5 Development of agricultural trade with SSA (2000-2013) ...................................................... 15
Graph 6 Agricultural exports and imports (2000-2013) ........................................................................ 15
Graph 7 Volume of total agricultural trade (2013) ............................................................................... 17
Graph 8 Agricultural trade balance (2013) ............................................................................................ 18
Graph 9 Argentina’s total trade and trade balance with SSA (2013) .................................................... 23
Graph 10 Argentina’s main partners in sub-Saharan Africa (2013) .................................................... 24
Graph 11 Products traded between Argentina and sub-Saharan Africa (2013) ................................... 24
Graph 12 Brazil’s total trade and trade balance with SSA (2013) ........................................................ 25
Graph 13 Brazil’s main partners in sub-Saharan Africa (2013) ............................................................. 26
Graph 14 Products traded between Brazil and sub-Saharan Africa (2013) .......................................... 26
Graph 15 China’s total trade and trade balance with SSA (2013) ........................................................ 27
Graph 16 China’s main partners in sub-Saharan Africa (2013) ............................................................. 28
Graph 17 Products traded between China and sub-Saharan Africa (2013) ......................................... 28
Graph 18 India’s total trade and trade balance with SSA (2013) ......................................................... 29
Graph 19 India’s main partners in sub-Saharan Africa (2013) .............................................................. 30
Graph 20 Products traded between India and sub-Saharan Africa (2013) .......................................... 30
Graph 21 South Korea’s total trade and trade balance with SSA (2013) ............................................. 31
Graph 22 South Korea’s main partners in sub-Saharan Africa (2013) .................................................. 32
Graph 23 Products traded between South Korea and sub-Saharan Africa (2013) ............................... 32
Graph 24 South Africa’s total trade and trade balance with SSA (2013) ............................................. 33
Graph 25 South Africa’s main partners in sub-Saharan Africa (2013) .................................................. 34
Graph 26 Products traded between South Africa and sub-Saharan Africa (2013) ............................... 34
Graph 27 Argentina’s total agricultural trade and agricultural trade balance with SSA (2013) ........... 35
Graph 28 Argentina’s main agricultural trading partners in sub-Saharan Africa (2013) ...................... 36
Graph 29 Agricultural products traded between Argentina and sub-Saharan Africa (2013) ............... 37
Graph 30 Brazil’s total agricultural trade and agricultural trade balance with SSA (2013) .................. 37
Graph 31 Brazil’s main agricultural trading partners in sub-Saharan Africa (2013) ............................. 38
Graph 32 Agricultural products traded between Brazil and sub-Saharan Africa (2013)....................... 39
Graph 33 China’s total agricultural trade and agricultural trade balance with SSA (2013) .................. 39
Graph 34 China’s main agricultural trading partners in sub-Saharan Africa (2013) ............................. 40
Graph 35 Agricultural products traded between China and sub-Saharan Africa (2013) ...................... 41
Graph 36 India’s total agricultural trade and agricultural trade balance with SSA (2013) ................... 41
Graph 37 India’s main agricultural trading partners in sub-Saharan Africa (2013) .............................. 42
Graph 38 Agricultural products traded between India and sub-Saharan Africa (2013) ....................... 43
Graph 39 South Korea’s total agricultural trade and agricultural trade balance with SSA (2013) ....... 43
Graph 40 South Korea’s main agricultural trading partners in sub-Saharan Africa (2013) .................. 44
Graph 41 Agricultural products traded between South Korea and sub-Saharan Africa (2013) ............ 45
Graph 42 Share of agricultural trade in South Africa’s total trade with SSA (2000-2013) .................... 45
4
Graph 43 South Africa’s total agricultural trade and agricultural trade balance with SSA (2013) ....... 46
Graph 44 South Africa’s main agricultural trading partners in sub-Saharan Africa (2013)................... 47
Graph 45 Agricultural products traded between South Africa and sub-Saharan Africa (2013) ............ 47
Table 1 Average annual growth rate of total exports ............................................................................. 8
Table 2 Average annual growth rate of total imports ............................................................................. 8
Table3 Share of SSA in total exports and imports (2013) ..................................................................... 11
Table 4 Main trading partners in sub-Saharan Africa (2013) ................................................................ 12
Table 5 Main products traded with sub-Saharan Africa (2013) ............................................................ 14
Table 7 Average annual growth rates of agricultural exports to SSA .................................................... 16
Table 8 Average annual growth rates of agricultural imports from SSA ............................................... 17
Table 13 Argentina’s share in the African countries’ total exports and imports .................................. 66
Table 14 Argentina’s share in the African countries’ agricultural exports and imports ....................... 67
Table 15 Brazil’s share in the African countries’ total exports and imports ......................................... 69
Table 16 Brazil’s share in the African countries’ agricultural exports and imports .............................. 70
Table 17 China’s share in the African countries’ total exports and imports ......................................... 71
Table 18 China’s share in the African countries’ agricultural exports and imports .............................. 72
Table 19 India’s share in the African countries’ total exports and imports .......................................... 73
Table 20 India’s share in the African countries’ agricultural exports and imports ............................... 74
Table 21 South Korea’s share in the African countries’ total exports and imports .............................. 75
Table 22 South Korea’s share in the African countries’ agricultural exports and imports ................... 76
Table 23 South Africa’s share in the African countries’ total exports and imports .............................. 77
Table 24 South Africa’s share in the African countries’ agricultural exports and imports ................... 78
5
Preamble: recollection of terms of reference for the CIRAD-CTA study,
general structure of the research, authors
The purpose of this study is detailed in the terms of reference set out in Appendix 1 of this report.
The initial aim is to draw up a map of trade, investment and official development assistance between
the six chosen emerging countries and the countries of Africa south of the Sahara in the agricultural
sector. The emerging countries are South Africa, Argentina, Brazil, China, South Korea and India.
Subsequently, the aim is to analyse the involvement (aid and investments) of China in the agricultural
sector in four countries: Ethiopia, Senegal, Togo and Ivory Coast.
The results of this study of the emerging countries in sub-Saharan Africa in the agricultural sector are
presented in six separate reports:
- Report 1/6: Study of trade relations between the emerging countries and Africa south of the
Sahara
- Report 2/6: Summary of four case studies of China’s involvement in the agricultural sector in
Ivory Coast, Ethiopia, Senegal and Togo.
- Report 3/6: The Chinese presence in the agricultural sector in Ivory Coast
- Report 4/6: The Chinese presence in the agricultural sector in Ethiopia
- Report 5/6: The Chinese presence in the agricultural sector in Senegal
- Report 6/6: The Chinese presence in the agricultural sector in Togo
The research was coordinated by Jean-Jacques Gabas (CIRAD) and Vincent Ribier (CIRAD) with the
support of Candela Saiz Carrasco (Sciences Po Paris) for the trade analysis.
Missions to each country were conducted for the four case studies. The Senegal and Ethiopia case
studies were conducted by Peggy Frey (consultant), the Togo study by Charlotte Francke (GIZ and
Sciences Po Paris) and the Ivory Coast study by Xavier Auregan (Université Paris Ouest).
6
General introduction
This report, the first of the six, analyses the trade of the six chosen emerging countries –
South Africa, Argentina, Brazil, China, South Korea and India – with Africa south of the
Sahara. It is divided into two parts. The first part provides an overview of total and
agricultural trade flows. The second part analyses developments in and the structure of the
trade of each of the emerging countries with Africa south of the Sahara.
The analysed data are taken from the United Nations Comtrade1 database; the agricultural
sector as covered in this study is defined in Appendix 2. Comtrade is the most reliable
international database, despite some limitations: certain types of exchange relating to illegal
trade or intra-company trade are not included in the database.
1 Free access to COMTRADE data on the WITS website:
https://wits.worldbank.org/WITS/WITS/Restricted/Login.aspx?AspxAutoDetectCookieSuppo
rt=1
7
I. The development of trade relations between sub-Saharan Africa and
the emerging countries during the period 2000-2013
I.1 A profound change in the shape of sub-Saharan Africa’s trade relations with its
partners
Analysis of the development of the emerging countries’ total trade and its comparison with
the trade of the ‘traditional powers’ reveals some profound changes that have occurred
since the beginning of the 2000s. These countries’ trade with SSA, which was still at a very
low level at the beginning of the 2000s, has undergone a meteoric rise since then. The
economic and financial crisis of 2008-2009 had clear but time-limited repercussions. The
year 2009 saw a dramatic downturn in trade (in many cases by as much as 20-40%), but the
upward trend began again the following year. Consequently, the rate of growth in trade over
the period is impressive: between 2000 and 2013, China-SSA trade grew twentyfold, and
India-SSA trade thirteenfold.
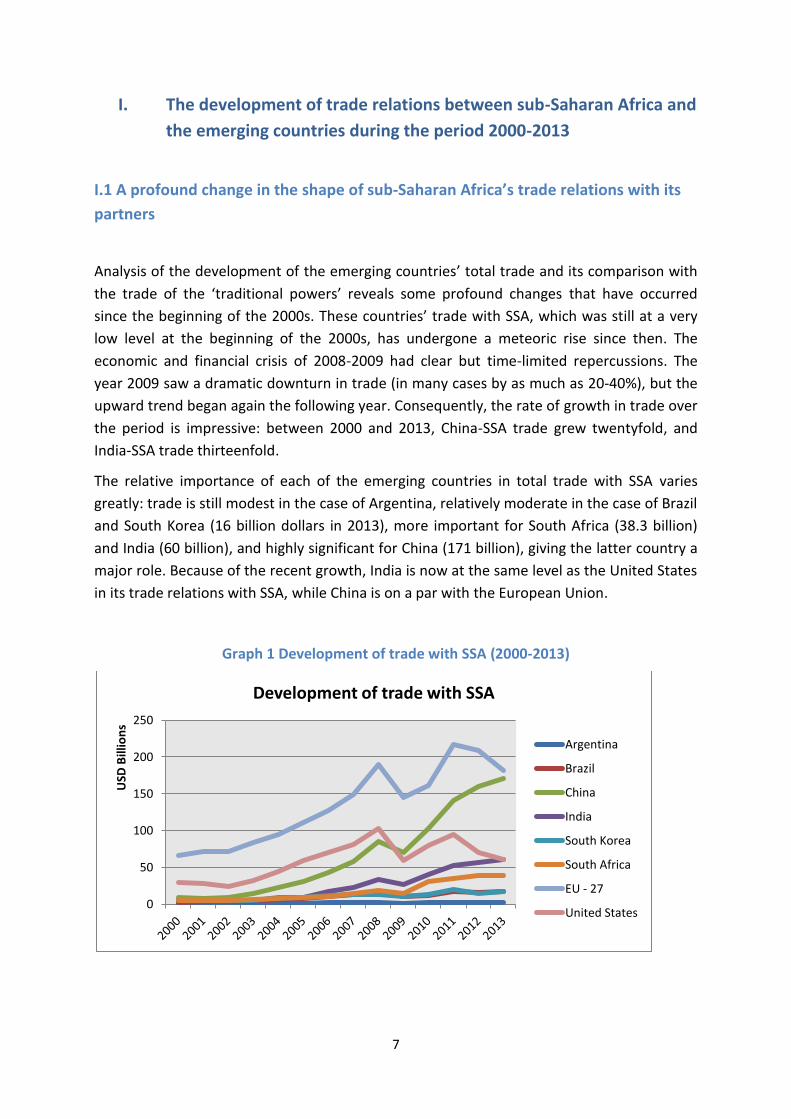
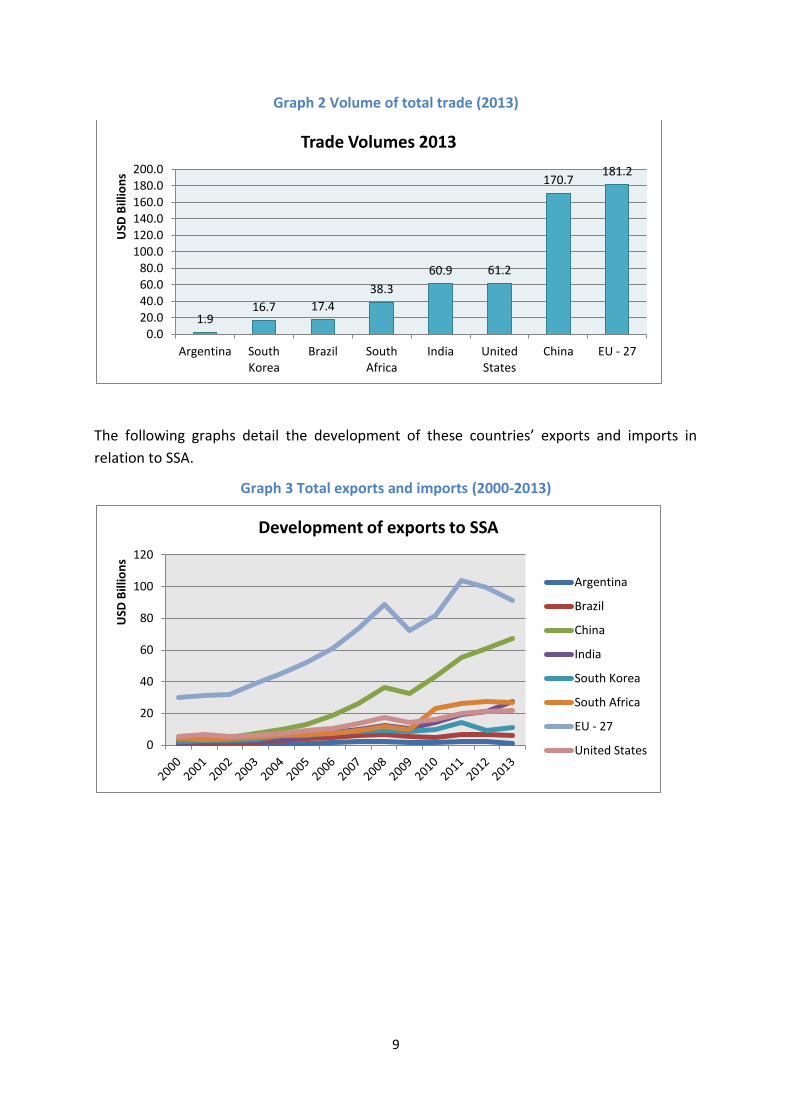
The relative importance of each of the emerging countries in total trade with SSA varies
greatly: trade is still modest in the case of Argentina, relatively moderate in the case of Brazil
and South Korea (16 billion dollars in 2013), more important for South Africa (38.3 billion)
and India (60 billion), and highly significant for China (171 billion), giving the latter country a
major role. Because of the recent growth, India is now at the same level as the United States
in its trade relations with SSA, while China is on a par with the European Union.
Graph 1 Development of trade with SSA (2000-2013)
0
50
100
150
200
250
USD
Bill
ion
s
Development of trade with SSA
Argentina
Brazil
China
India
South Korea
South Africa
EU - 27
United States
8
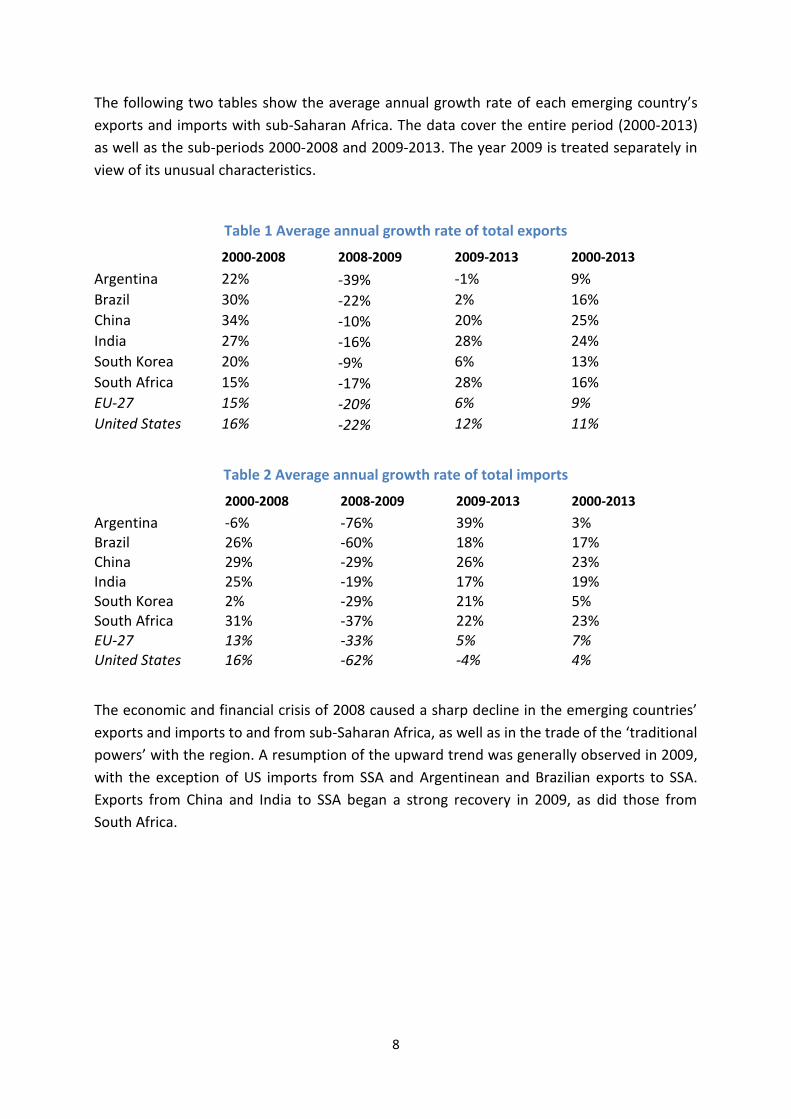
The following two tables show the average annual growth rate of each emerging country’s
exports and imports with sub-Saharan Africa. The data cover the entire period (2000-2013)
as well as the sub-periods 2000-2008 and 2009-2013. The year 2009 is treated separately in
view of its unusual characteristics.
Table 1 Average annual growth rate of total exports
2000-2008 2008-2009 2009-2013 2000-2013
Argentina 22% -39% -1% 9%
Brazil 30% -22% 2% 16%
China 34% -10% 20% 25%
India 27% -16% 28% 24%
South Korea 20% -9% 6% 13%
South Africa 15% -17% 28% 16%
EU-27 15% -20% 6% 9%
United States 16% -22% 12% 11%
Table 2 Average annual growth rate of total imports
2000-2008 2008-2009 2009-2013 2000-2013
Argentina -6% -76% 39% 3% Brazil 26% -60% 18% 17% China 29% -29% 26% 23% India 25% -19% 17% 19% South Korea 2% -29% 21% 5% South Africa 31% -37% 22% 23% EU-27 13% -33% 5% 7% United States 16% -62% -4% 4%
The economic and financial crisis of 2008 caused a sharp decline in the emerging countries’
exports and imports to and from sub-Saharan Africa, as well as in the trade of the ‘traditional
powers’ with the region. A resumption of the upward trend was generally observed in 2009,
with the exception of US imports from SSA and Argentinean and Brazilian exports to SSA.
Exports from China and India to SSA began a strong recovery in 2009, as did those from
South Africa.
9
Graph 2 Volume of total trade (2013)
The following graphs detail the development of these countries’ exports and imports in
relation to SSA.
Graph 3 Total exports and imports (2000-2013)
1.9 16.7 17.4
38.3
60.9 61.2
170.7 181.2
0.0 20.0 40.0 60.0 80.0
100.0 120.0 140.0 160.0 180.0 200.0
Argentina South Korea
Brazil South Africa
India United States
China EU - 27
USD
Bill
ion
s
Trade Volumes 2013
0
20
40
60
80
100
120
USD
Bill
ion
s
Development of exports to SSA
Argentina
Brazil
China
India
South Korea
South Africa
EU - 27
United States
10
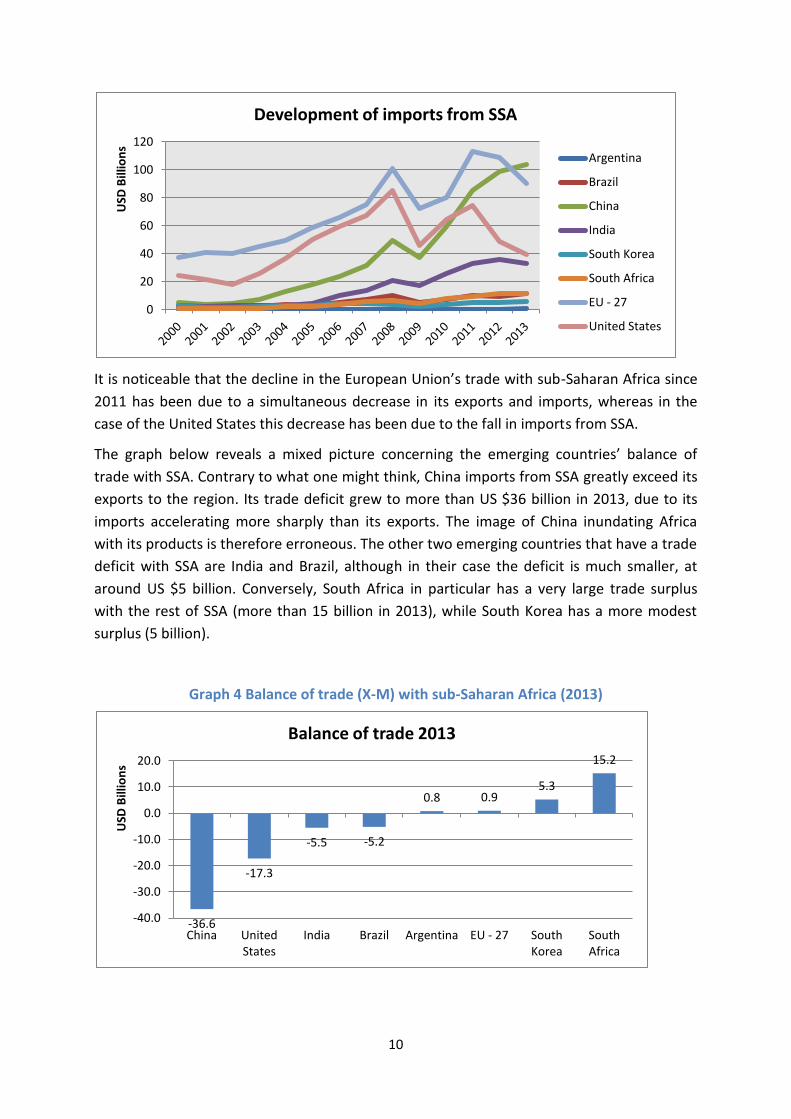
It is noticeable that the decline in the European Union’s trade with sub-Saharan Africa since
2011 has been due to a simultaneous decrease in its exports and imports, whereas in the
case of the United States this decrease has been due to the fall in imports from SSA.
The graph below reveals a mixed picture concerning the emerging countries’ balance of
trade with SSA. Contrary to what one might think, China imports from SSA greatly exceed its
exports to the region. Its trade deficit grew to more than US $36 billion in 2013, due to its
imports accelerating more sharply than its exports. The image of China inundating Africa
with its products is therefore erroneous. The other two emerging countries that have a trade
deficit with SSA are India and Brazil, although in their case the deficit is much smaller, at
around US $5 billion. Conversely, South Africa in particular has a very large trade surplus
with the rest of SSA (more than 15 billion in 2013), while South Korea has a more modest
surplus (5 billion).
Graph 4 Balance of trade (X-M) with sub-Saharan Africa (2013)
0
20
40
60
80
100
120
USD
Bill
ion
s Development of imports from SSA
Argentina
Brazil
China
India
South Korea
South Africa
EU - 27
United States
-36.6
-17.3
-5.5 -5.2
0.8 0.9 5.3
15.2
-40.0
-30.0
-20.0
-10.0
0.0
10.0
20.0
China United States
India Brazil Argentina EU - 27 South Korea
South Africa
USD
Bill
ion
s
Balance of trade 2013
11
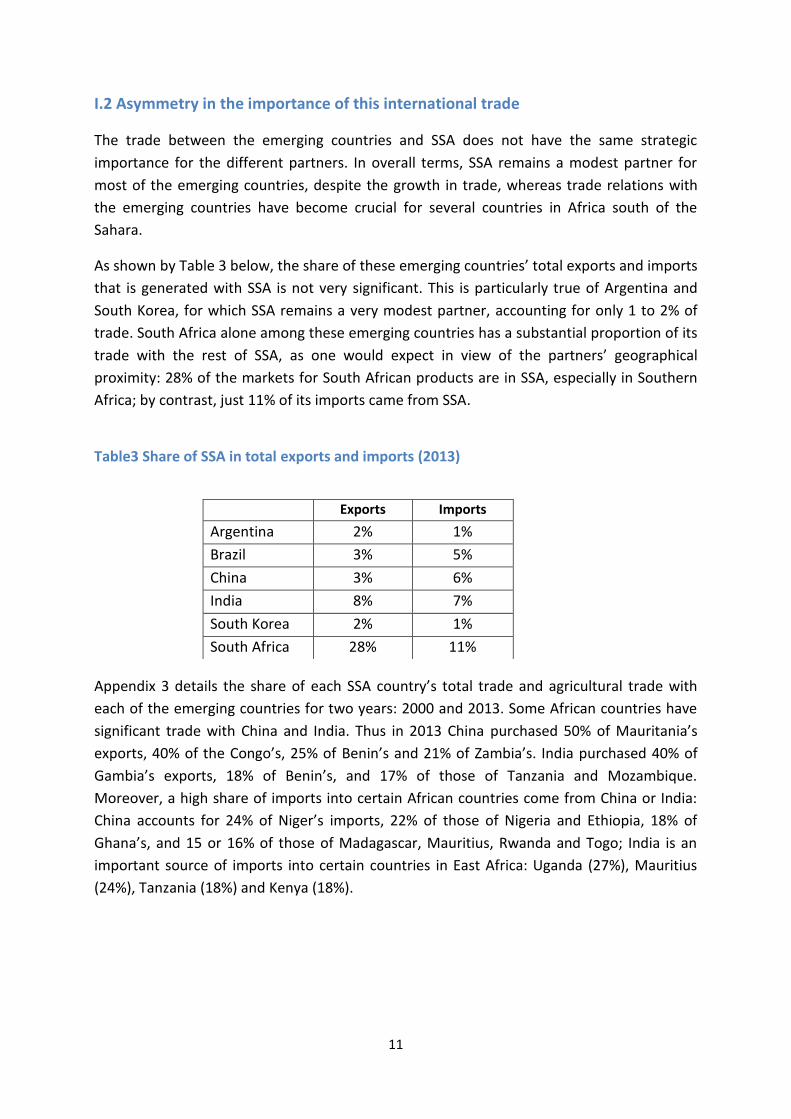
I.2 Asymmetry in the importance of this international trade
The trade between the emerging countries and SSA does not have the same strategic
importance for the different partners. In overall terms, SSA remains a modest partner for
most of the emerging countries, despite the growth in trade, whereas trade relations with
the emerging countries have become crucial for several countries in Africa south of the
Sahara.
As shown by Table 3 below, the share of these emerging countries’ total exports and imports
that is generated with SSA is not very significant. This is particularly true of Argentina and
South Korea, for which SSA remains a very modest partner, accounting for only 1 to 2% of
trade. South Africa alone among these emerging countries has a substantial proportion of its
trade with the rest of SSA, as one would expect in view of the partners’ geographical
proximity: 28% of the markets for South African products are in SSA, especially in Southern
Africa; by contrast, just 11% of its imports came from SSA.
Table3 Share of SSA in total exports and imports (2013)
Appendix 3 details the share of each SSA country’s total trade and agricultural trade with
each of the emerging countries for two years: 2000 and 2013. Some African countries have
significant trade with China and India. Thus in 2013 China purchased 50% of Mauritania’s
exports, 40% of the Congo’s, 25% of Benin’s and 21% of Zambia’s. India purchased 40% of
Gambia’s exports, 18% of Benin’s, and 17% of those of Tanzania and Mozambique.
Moreover, a high share of imports into certain African countries come from China or India:
China accounts for 24% of Niger’s imports, 22% of those of Nigeria and Ethiopia, 18% of
Ghana’s, and 15 or 16% of those of Madagascar, Mauritius, Rwanda and Togo; India is an
important source of imports into certain countries in East Africa: Uganda (27%), Mauritius
(24%), Tanzania (18%) and Kenya (18%).
Exports Imports
Argentina 2% 1%
Brazil 3% 5%
China 3% 6%
India 8% 7%
South Korea 2% 1%
South Africa 28% 11%
12
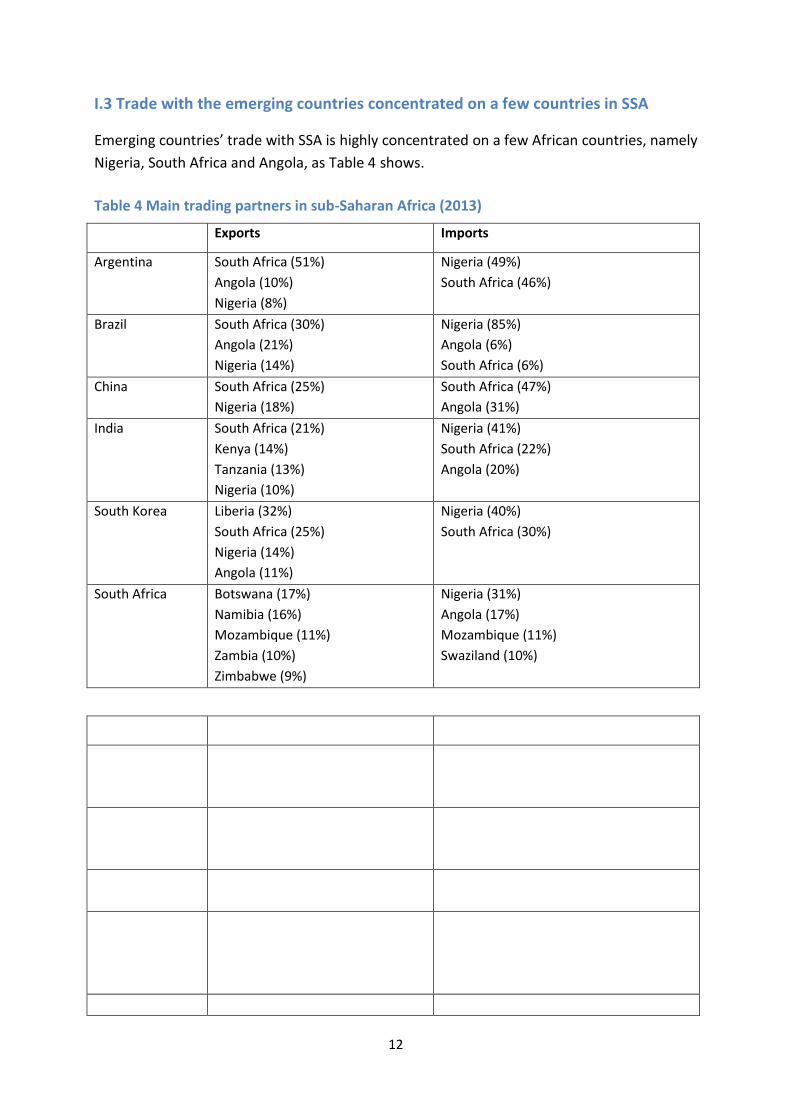
I.3 Trade with the emerging countries concentrated on a few countries in SSA
Emerging countries’ trade with SSA is highly concentrated on a few African countries, namely
Nigeria, South Africa and Angola, as Table 4 shows.
Table 4 Main trading partners in sub-Saharan Africa (2013)
Exports Imports
Argentina South Africa (51%)
Angola (10%)
Nigeria (8%)
Nigeria (49%)
South Africa (46%)
Brazil South Africa (30%)
Angola (21%)
Nigeria (14%)
Nigeria (85%)
Angola (6%)
South Africa (6%)
China South Africa (25%)
Nigeria (18%)
South Africa (47%)
Angola (31%)
India South Africa (21%)
Kenya (14%)
Tanzania (13%)
Nigeria (10%)
Nigeria (41%)
South Africa (22%)
Angola (20%)
South Korea Liberia (32%)
South Africa (25%)
Nigeria (14%)
Angola (11%)
Nigeria (40%)
South Africa (30%)
South Africa Botswana (17%)
Namibia (16%)
Mozambique (11%)
Zambia (10%)
Zimbabwe (9%)
Nigeria (31%)
Angola (17%)
Mozambique (11%)
Swaziland (10%)
13
The geographical concentration is particularly marked for the imports of the emerging
countries, which buy from the countries which are the largest producers of raw materials,
particularly hydrocarbons and minerals:
- Two countries account for nearly 80% of China’s imports from SSA: South Africa
(47%) and Angola (31%);
- Three countries account for 83% of India’s imports: Nigeria (41%), South Africa (22%)
and Angola (20%);
- Nigeria also accounts for 85% of Brazil’s imports, 49% of Argentina’s and 40% of
South Korea’s from SSA;
- South Africa alone has a more diversified pattern of trade, which, however, is
strongly linked with the Southern African countries.
The geographical structure of the emerging countries’ exports is also highly concentrated,
albeit to a lesser degree than their imports:
- South Africa is the main African market for exports from China, India, Brazil and
Argentina;
- Nigeria, which exports much of its hydrocarbons to the emerging countries, is also an
important market for their exports;
- South Africa mainly exports to neighbouring countries, its five main markets being, in
descending order, Botswana, Namibia, Mozambique, Zambia and Zimbabwe.
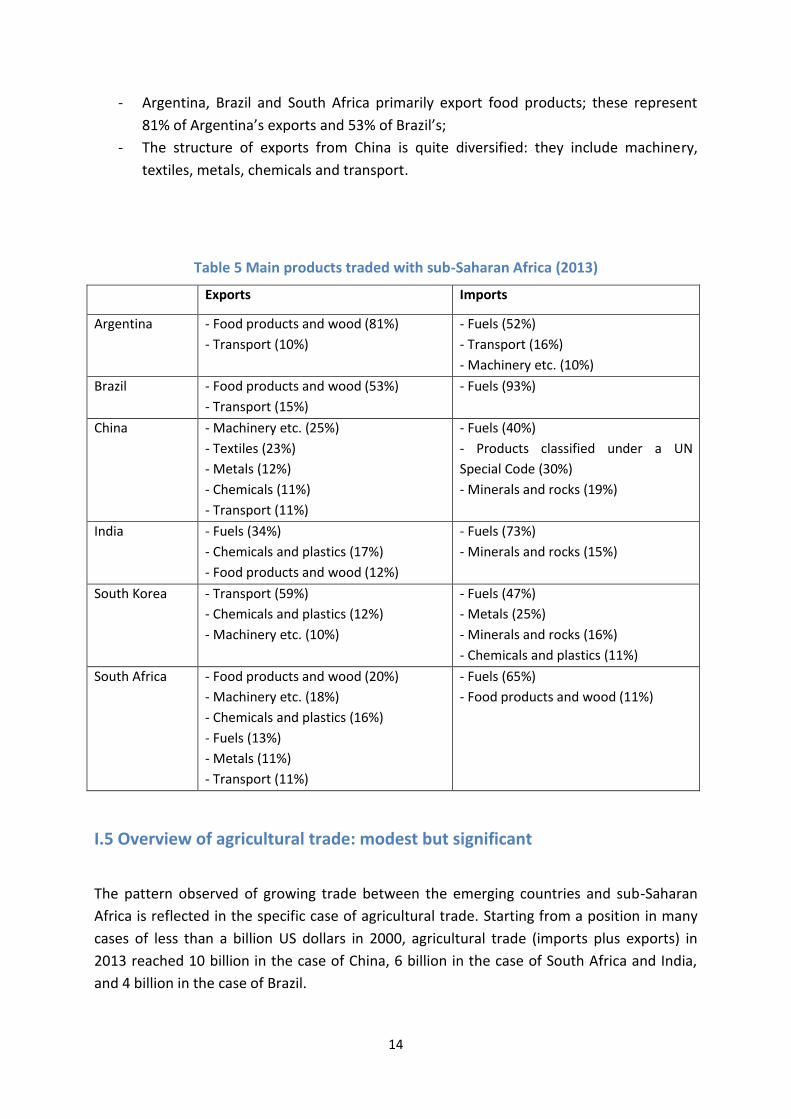
I.4 A strong commercial focus on a few products
The strong geographical concentration is also reflected in terms of the nature of the
products traded between SSA and the emerging countries. SSA remains primarily a supplier
of raw materials: the emerging countries mainly import fuels, which are the largest import
good for each of them; metals, minerals and rocks complete the picture.
The structure of the products exported from the emerging countries to SSA is slightly more
diversified, and varies from country to country:
14
- Argentina, Brazil and South Africa primarily export food products; these represent
81% of Argentina’s exports and 53% of Brazil’s;
- The structure of exports from China is quite diversified: they include machinery,
textiles, metals, chemicals and transport.
Table 5 Main products traded with sub-Saharan Africa (2013)
Exports Imports
Argentina - Food products and wood (81%)
- Transport (10%)
- Fuels (52%)
- Transport (16%)
- Machinery etc. (10%)
Brazil - Food products and wood (53%)
- Transport (15%)
- Fuels (93%)
China - Machinery etc. (25%)
- Textiles (23%)
- Metals (12%)
- Chemicals (11%)
- Transport (11%)
- Fuels (40%)
- Products classified under a UN
Special Code (30%)
- Minerals and rocks (19%)
India - Fuels (34%)
- Chemicals and plastics (17%)
- Food products and wood (12%)
- Fuels (73%)
- Minerals and rocks (15%)
South Korea - Transport (59%)
- Chemicals and plastics (12%)
- Machinery etc. (10%)
- Fuels (47%)
- Metals (25%)
- Minerals and rocks (16%)
- Chemicals and plastics (11%)
South Africa - Food products and wood (20%)
- Machinery etc. (18%)
- Chemicals and plastics (16%)
- Fuels (13%)
- Metals (11%)
- Transport (11%)
- Fuels (65%)
- Food products and wood (11%)
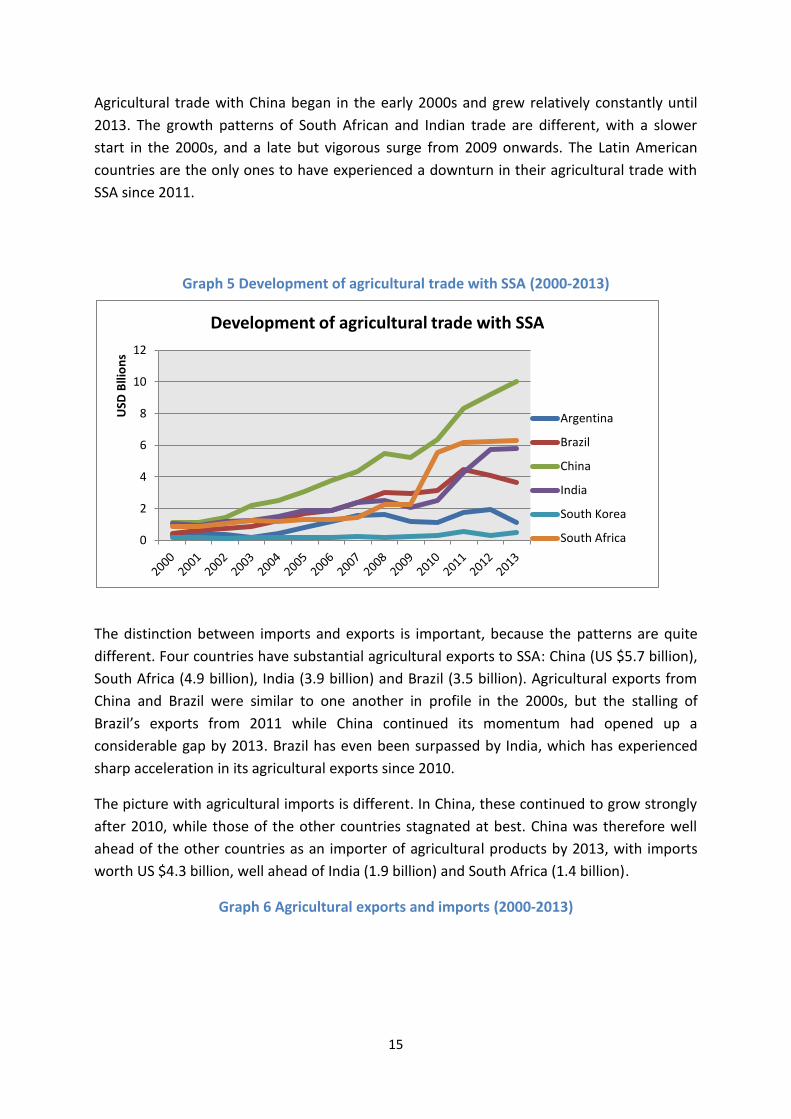
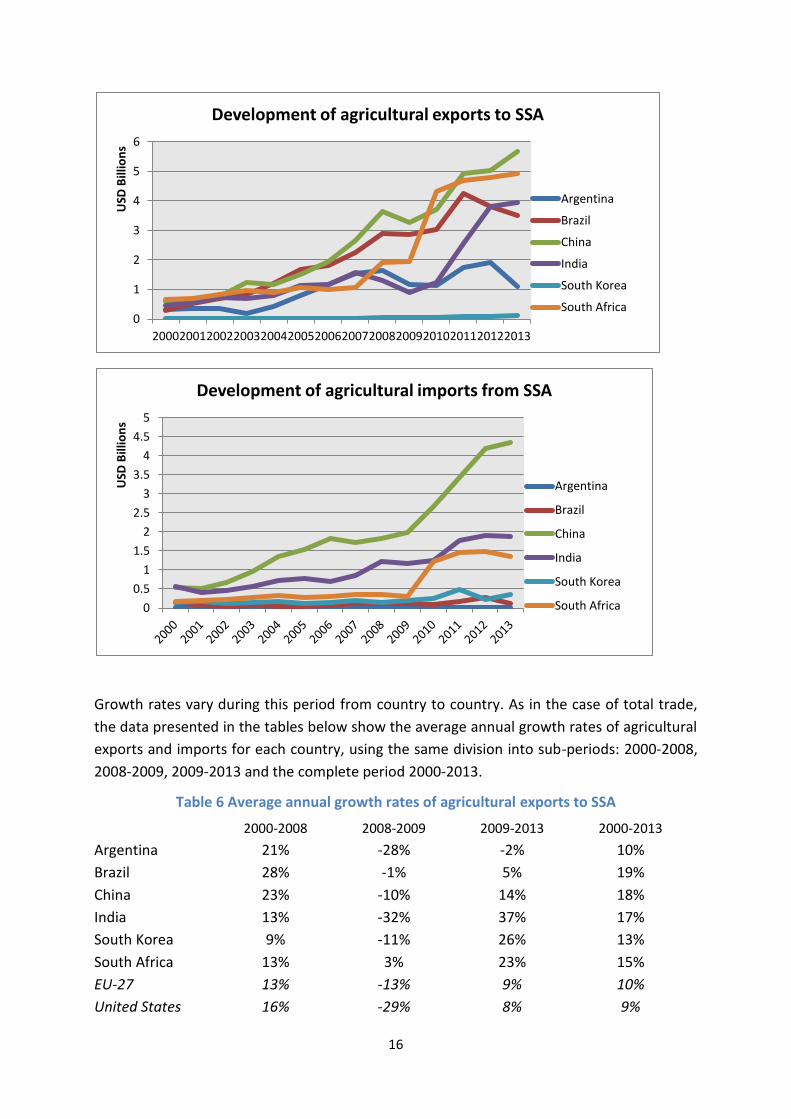
I.5 Overview of agricultural trade: modest but significant
The pattern observed of growing trade between the emerging countries and sub-Saharan
Africa is reflected in the specific case of agricultural trade. Starting from a position in many
cases of less than a billion US dollars in 2000, agricultural trade (imports plus exports) in
2013 reached 10 billion in the case of China, 6 billion in the case of South Africa and India,
and 4 billion in the case of Brazil.
15
Agricultural trade with China began in the early 2000s and grew relatively constantly until
2013. The growth patterns of South African and Indian trade are different, with a slower
start in the 2000s, and a late but vigorous surge from 2009 onwards. The Latin American
countries are the only ones to have experienced a downturn in their agricultural trade with
SSA since 2011.
Graph 5 Development of agricultural trade with SSA (2000-2013)
The distinction between imports and exports is important, because the patterns are quite
different. Four countries have substantial agricultural exports to SSA: China (US $5.7 billion),
South Africa (4.9 billion), India (3.9 billion) and Brazil (3.5 billion). Agricultural exports from
China and Brazil were similar to one another in profile in the 2000s, but the stalling of
Brazil’s exports from 2011 while China continued its momentum had opened up a
considerable gap by 2013. Brazil has even been surpassed by India, which has experienced
sharp acceleration in its agricultural exports since 2010.
The picture with agricultural imports is different. In China, these continued to grow strongly
after 2010, while those of the other countries stagnated at best. China was therefore well
ahead of the other countries as an importer of agricultural products by 2013, with imports
worth US $4.3 billion, well ahead of India (1.9 billion) and South Africa (1.4 billion).
Graph 6 Agricultural exports and imports (2000-2013)
0
2
4
6
8
10
12
USD
Blli
on
s
Development of agricultural trade with SSA
Argentina
Brazil
China
India
South Korea
South Africa
16
Growth rates vary during this period from country to country. As in the case of total trade,
the data presented in the tables below show the average annual growth rates of agricultural
exports and imports for each country, using the same division into sub-periods: 2000-2008,
2008-2009, 2009-2013 and the complete period 2000-2013.
Table 6 Average annual growth rates of agricultural exports to SSA
2000-2008 2008-2009 2009-2013 2000-2013
Argentina 21% -28% -2% 10%
Brazil 28% -1% 5% 19%
China 23% -10% 14% 18%
India 13% -32% 37% 17%
South Korea 9% -11% 26% 13%
South Africa 13% 3% 23% 15%
EU-27 13% -13% 9% 10%
United States 16% -29% 8% 9%
0
1
2
3
4
5
6
2000 2001 2002 2003 2004 2005 2006 2007 2008 2009 2010 2011 2012 2013
USD
Bill
ion
s Development of agricultural exports to SSA
Argentina
Brazil
China
India
South Korea
South Africa
0
0.5
1
1.5
2
2.5
3
3.5
4
4.5
5
USD
Bill
ion
s
Development of agricultural imports from SSA
Argentina
Brazil
China
India
South Korea
South Africa
17
Table 7 Average annual growth rates of agricultural imports from SSA
2000-2008 2008-2009 2009-2013 2000-2013
Argentina 2% 16% 4% 3%
Brazil -3% -3% 1% -1%
China 15% 8% 19% 16%
India 10% -6% 12% 9%
South Korea 2% 21% 15% 7%
South Africa 8% -12% 37% 16%
EU-27 8% -10% -1% 4%
United States 6% -7% 8% 6%
Looking at the development of agricultural exports and imports, similarities and differences
can be observed between the countries. The general trend shows a growth of trade flows for
all the emerging countries, whose trade was at a very low level in the early 2000s.
- In terms of the growth of agricultural exports, a rapid surge in Indian exports can be
seen from 2009: their average annual growth rate increased from 13% during the
period 2000-2008 to an impressive 37% during the period 2009-2013. In comparison,
China’s average annual growth rate was higher in the 2000s (23%), but has tailed off
somewhat since 2009 (14%);
- 2009 marks a break in the pattern of growth in agricultural trade; this phenomenon is
observable for all product categories, though perhaps slightly less pronounced in the
case of agriculture;
- The growth rate of Chinese agricultural imports is greater than that of India for each
of the sub-periods: 15% for China against 10% for India in 2000-2008, and 19%
against 12% in the recent period 2009-2013.
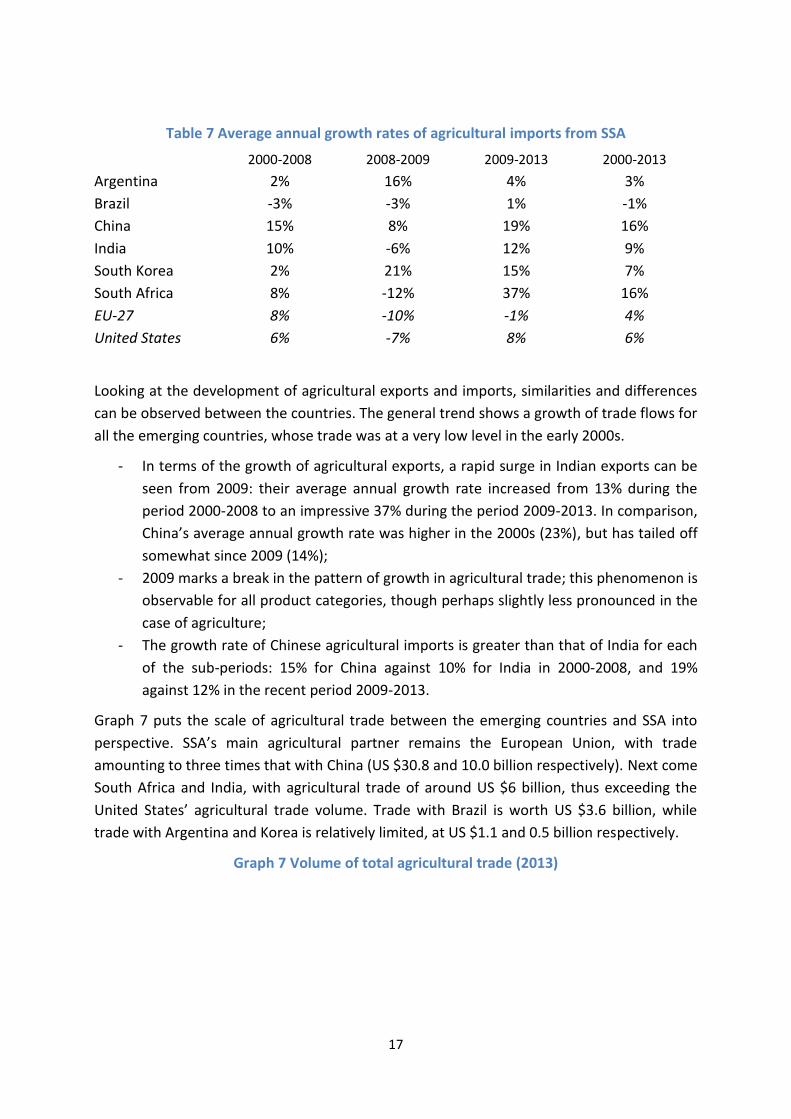
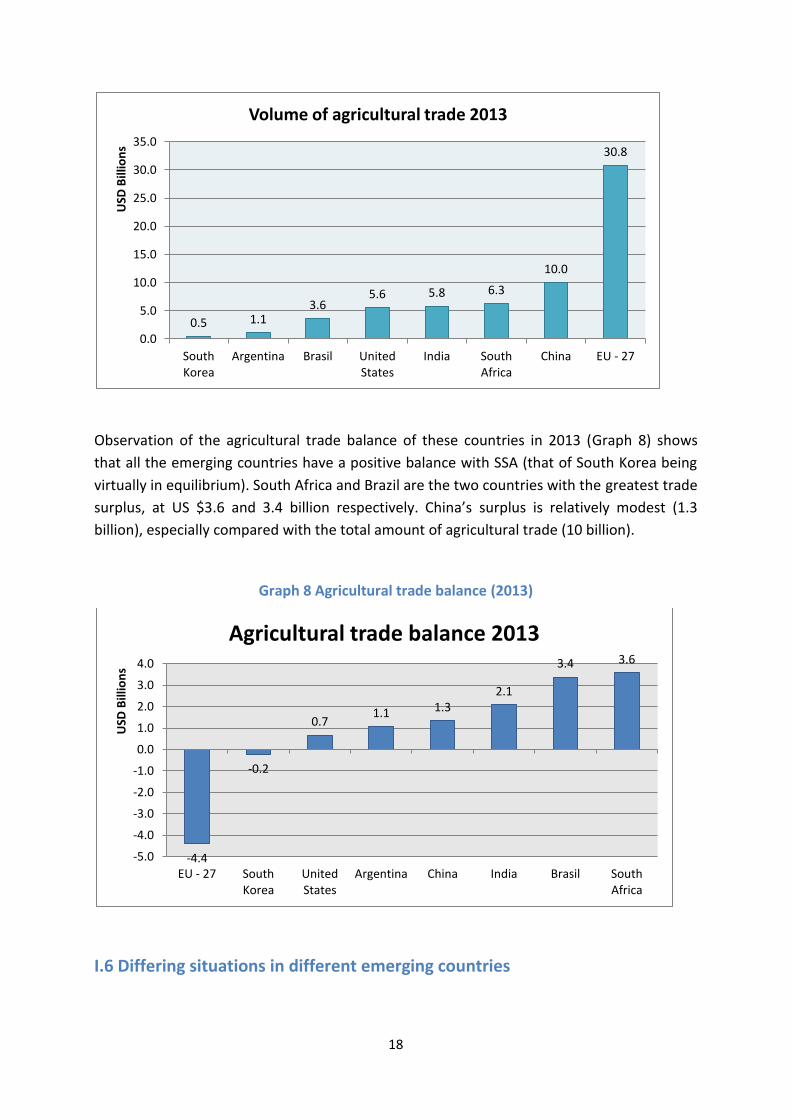
Graph 7 puts the scale of agricultural trade between the emerging countries and SSA into
perspective. SSA’s main agricultural partner remains the European Union, with trade
amounting to three times that with China (US $30.8 and 10.0 billion respectively). Next come
South Africa and India, with agricultural trade of around US $6 billion, thus exceeding the
United States’ agricultural trade volume. Trade with Brazil is worth US $3.6 billion, while
trade with Argentina and Korea is relatively limited, at US $1.1 and 0.5 billion respectively.
Graph 7 Volume of total agricultural trade (2013)
18
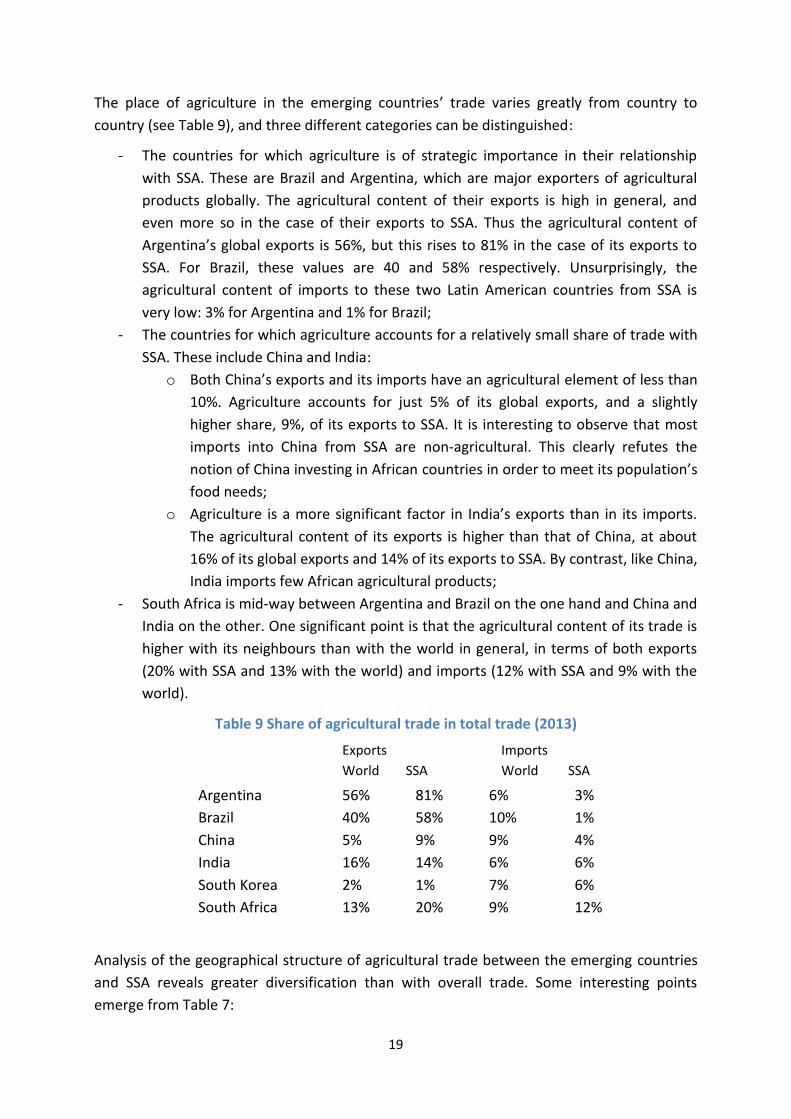
Observation of the agricultural trade balance of these countries in 2013 (Graph 8) shows
that all the emerging countries have a positive balance with SSA (that of South Korea being
virtually in equilibrium). South Africa and Brazil are the two countries with the greatest trade
surplus, at US $3.6 and 3.4 billion respectively. China’s surplus is relatively modest (1.3
billion), especially compared with the total amount of agricultural trade (10 billion).
Graph 8 Agricultural trade balance (2013)
I.6 Differing situations in different emerging countries
0.5 1.1 3.6
5.6 5.8 6.3
10.0
30.8
0.0
5.0
10.0
15.0
20.0
25.0
30.0
35.0
South Korea
Argentina Brasil United States
India South Africa
China EU - 27
USD
Bill
ion
s Volume of agricultural trade 2013
-4.4
-0.2
0.7 1.1 1.3
2.1
3.4 3.6
-5.0
-4.0
-3.0
-2.0
-1.0
0.0
1.0
2.0
3.0
4.0
EU - 27 South Korea
United States
Argentina China India Brasil South Africa
USD
Bill
ion
s
Agricultural trade balance 2013
19
The place of agriculture in the emerging countries’ trade varies greatly from country to
country (see Table 9), and three different categories can be distinguished:
- The countries for which agriculture is of strategic importance in their relationship
with SSA. These are Brazil and Argentina, which are major exporters of agricultural
products globally. The agricultural content of their exports is high in general, and
even more so in the case of their exports to SSA. Thus the agricultural content of
Argentina’s global exports is 56%, but this rises to 81% in the case of its exports to
SSA. For Brazil, these values are 40 and 58% respectively. Unsurprisingly, the
agricultural content of imports to these two Latin American countries from SSA is
very low: 3% for Argentina and 1% for Brazil;
- The countries for which agriculture accounts for a relatively small share of trade with
SSA. These include China and India:
o Both China’s exports and its imports have an agricultural element of less than
10%. Agriculture accounts for just 5% of its global exports, and a slightly
higher share, 9%, of its exports to SSA. It is interesting to observe that most
imports into China from SSA are non-agricultural. This clearly refutes the
notion of China investing in African countries in order to meet its population’s
food needs;
o Agriculture is a more significant factor in India’s exports than in its imports.
The agricultural content of its exports is higher than that of China, at about
16% of its global exports and 14% of its exports to SSA. By contrast, like China,
India imports few African agricultural products;
- South Africa is mid-way between Argentina and Brazil on the one hand and China and
India on the other. One significant point is that the agricultural content of its trade is
higher with its neighbours than with the world in general, in terms of both exports
(20% with SSA and 13% with the world) and imports (12% with SSA and 9% with the
world).
Table 9 Share of agricultural trade in total trade (2013)
Exports
World SSA
Imports
World SSA
Argentina 56% 81% 6% 3%
Brazil 40% 58% 10% 1%
China 5% 9% 9% 4%
India 16% 14% 6% 6%
South Korea 2% 1% 7% 6%
South Africa 13% 20% 9% 12%
Analysis of the geographical structure of agricultural trade between the emerging countries
and SSA reveals greater diversification than with overall trade. Some interesting points
emerge from Table 7:
20
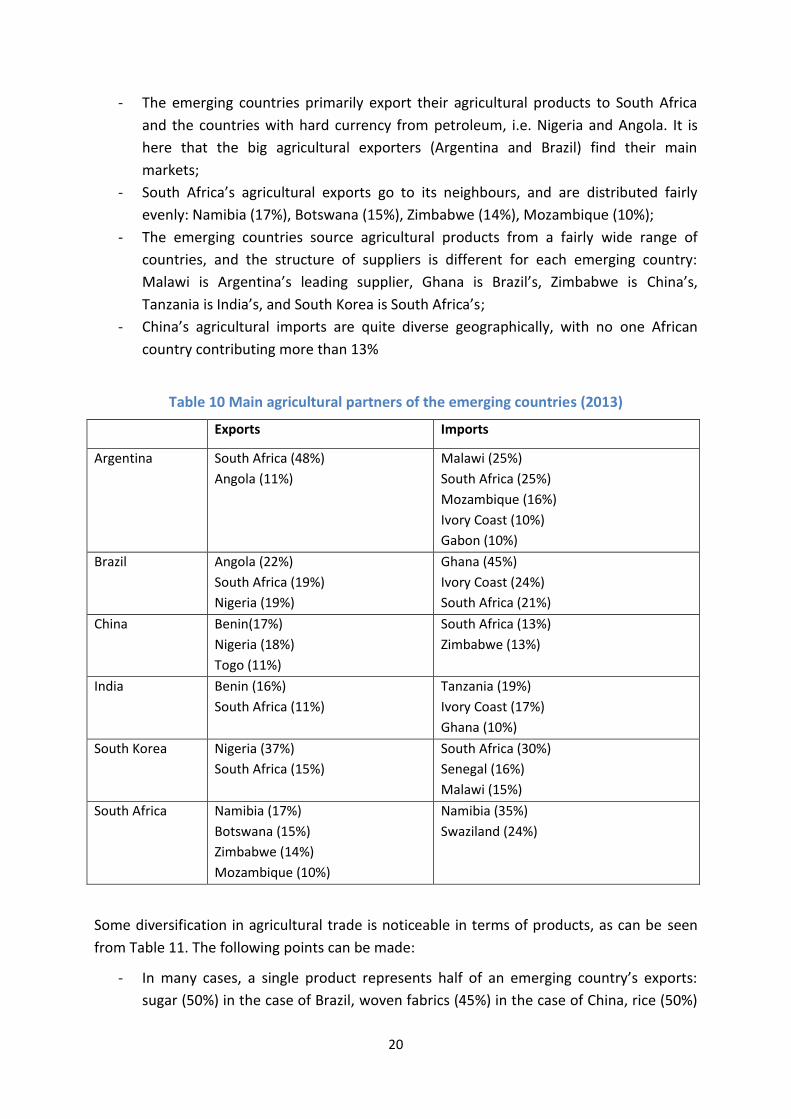
- The emerging countries primarily export their agricultural products to South Africa
and the countries with hard currency from petroleum, i.e. Nigeria and Angola. It is
here that the big agricultural exporters (Argentina and Brazil) find their main
markets;
- South Africa’s agricultural exports go to its neighbours, and are distributed fairly
evenly: Namibia (17%), Botswana (15%), Zimbabwe (14%), Mozambique (10%);
- The emerging countries source agricultural products from a fairly wide range of
countries, and the structure of suppliers is different for each emerging country:
Malawi is Argentina’s leading supplier, Ghana is Brazil’s, Zimbabwe is China’s,
Tanzania is India’s, and South Korea is South Africa’s;
- China’s agricultural imports are quite diverse geographically, with no one African
country contributing more than 13%
Table 10 Main agricultural partners of the emerging countries (2013)
Exports Imports
Argentina South Africa (48%)
Angola (11%)
Malawi (25%)
South Africa (25%)
Mozambique (16%)
Ivory Coast (10%)
Gabon (10%)
Brazil Angola (22%)
South Africa (19%)
Nigeria (19%)
Ghana (45%)
Ivory Coast (24%)
South Africa (21%)
China Benin(17%)
Nigeria (18%)
Togo (11%)
South Africa (13%)
Zimbabwe (13%)
India Benin (16%)
South Africa (11%)
Tanzania (19%)
Ivory Coast (17%)
Ghana (10%)
South Korea Nigeria (37%)
South Africa (15%)
South Africa (30%)
Senegal (16%)
Malawi (15%)
South Africa Namibia (17%)
Botswana (15%)
Zimbabwe (14%)
Mozambique (10%)
Namibia (35%)
Swaziland (24%)
Some diversification in agricultural trade is noticeable in terms of products, as can be seen
from Table 11. The following points can be made:
- In many cases, a single product represents half of an emerging country’s exports:
sugar (50%) in the case of Brazil, woven fabrics (45%) in the case of China, rice (50%)
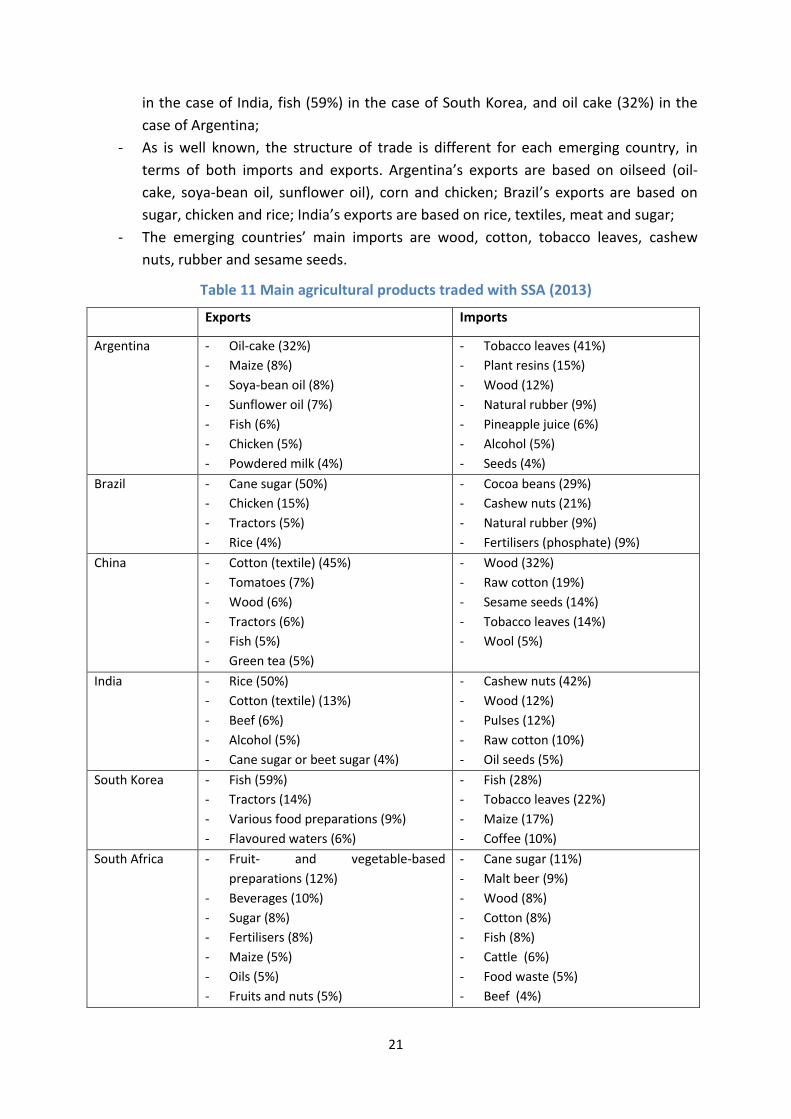
21
in the case of India, fish (59%) in the case of South Korea, and oil cake (32%) in the
case of Argentina;
- As is well known, the structure of trade is different for each emerging country, in
terms of both imports and exports. Argentina’s exports are based on oilseed (oil-
cake, soya-bean oil, sunflower oil), corn and chicken; Brazil’s exports are based on
sugar, chicken and rice; India’s exports are based on rice, textiles, meat and sugar;
- The emerging countries’ main imports are wood, cotton, tobacco leaves, cashew
nuts, rubber and sesame seeds.
Table 11 Main agricultural products traded with SSA (2013)
Exports Imports
Argentina - Oil-cake (32%)
- Maize (8%)
- Soya-bean oil (8%)
- Sunflower oil (7%)
- Fish (6%)
- Chicken (5%)
- Powdered milk (4%)
- Tobacco leaves (41%)
- Plant resins (15%)
- Wood (12%)
- Natural rubber (9%)
- Pineapple juice (6%)
- Alcohol (5%)
- Seeds (4%)
Brazil - Cane sugar (50%)
- Chicken (15%)
- Tractors (5%)
- Rice (4%)
- Cocoa beans (29%)
- Cashew nuts (21%)
- Natural rubber (9%)
- Fertilisers (phosphate) (9%)
China - Cotton (textile) (45%)
- Tomatoes (7%)
- Wood (6%)
- Tractors (6%)
- Fish (5%)
- Green tea (5%)
- Wood (32%)
- Raw cotton (19%)
- Sesame seeds (14%)
- Tobacco leaves (14%)
- Wool (5%)
India - Rice (50%)
- Cotton (textile) (13%)
- Beef (6%)
- Alcohol (5%)
- Cane sugar or beet sugar (4%)
- Cashew nuts (42%)
- Wood (12%)
- Pulses (12%)
- Raw cotton (10%)
- Oil seeds (5%)
South Korea - Fish (59%)
- Tractors (14%)
- Various food preparations (9%)
- Flavoured waters (6%)
- Fish (28%)
- Tobacco leaves (22%)
- Maize (17%)
- Coffee (10%)
South Africa - Fruit- and vegetable-based
preparations (12%)
- Beverages (10%)
- Sugar (8%)
- Fertilisers (8%)
- Maize (5%)
- Oils (5%)
- Fruits and nuts (5%)
- Cane sugar (11%)
- Malt beer (9%)
- Wood (8%)
- Cotton (8%)
- Fish (8%)
- Cattle (6%)
- Food waste (5%)
- Beef (4%)
22
- Food products of animal origin (5%)
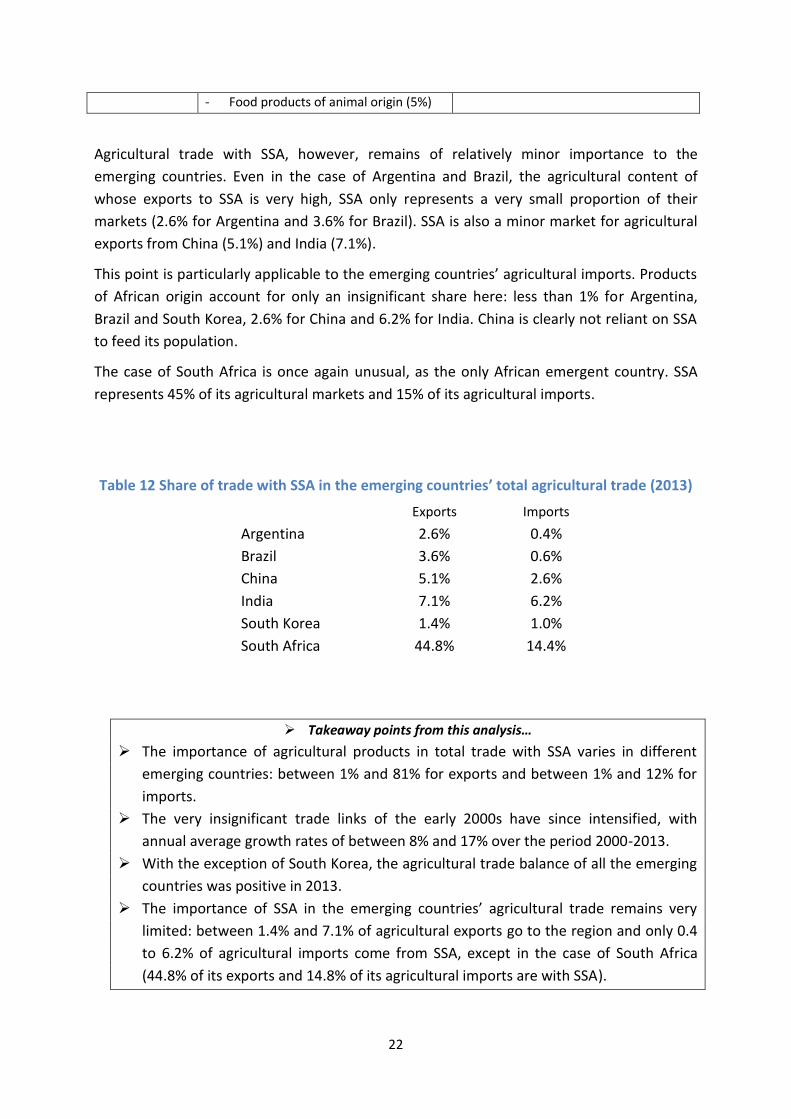
Agricultural trade with SSA, however, remains of relatively minor importance to the
emerging countries. Even in the case of Argentina and Brazil, the agricultural content of
whose exports to SSA is very high, SSA only represents a very small proportion of their
markets (2.6% for Argentina and 3.6% for Brazil). SSA is also a minor market for agricultural
exports from China (5.1%) and India (7.1%).
This point is particularly applicable to the emerging countries’ agricultural imports. Products
of African origin account for only an insignificant share here: less than 1% for Argentina,
Brazil and South Korea, 2.6% for China and 6.2% for India. China is clearly not reliant on SSA
to feed its population.
The case of South Africa is once again unusual, as the only African emergent country. SSA
represents 45% of its agricultural markets and 15% of its agricultural imports.
Table 12 Share of trade with SSA in the emerging countries’ total agricultural trade (2013)
Exports Imports
Argentina 2.6% 0.4%
Brazil 3.6% 0.6%
China 5.1% 2.6%
India 7.1% 6.2%
South Korea 1.4% 1.0%
South Africa 44.8% 14.4%
Takeaway points from this analysis…
The importance of agricultural products in total trade with SSA varies in different
emerging countries: between 1% and 81% for exports and between 1% and 12% for
imports.
The very insignificant trade links of the early 2000s have since intensified, with
annual average growth rates of between 8% and 17% over the period 2000-2013.
With the exception of South Korea, the agricultural trade balance of all the emerging
countries was positive in 2013.
The importance of SSA in the emerging countries’ agricultural trade remains very
limited: between 1.4% and 7.1% of agricultural exports go to the region and only 0.4
to 6.2% of agricultural imports come from SSA, except in the case of South Africa
(44.8% of its exports and 14.8% of its agricultural imports are with SSA).
23
II. Detailed analysis of trade relations between each of the emerging
countries and Africa south of the Sahara
This second section discusses each of the emerging countries separately, looking at its total trade
relations (II.1) and its agricultural trade (II.2) with Africa south of the Sahara.
II.1 Total trade for each of the emerging countries
II.1.1 Argentina
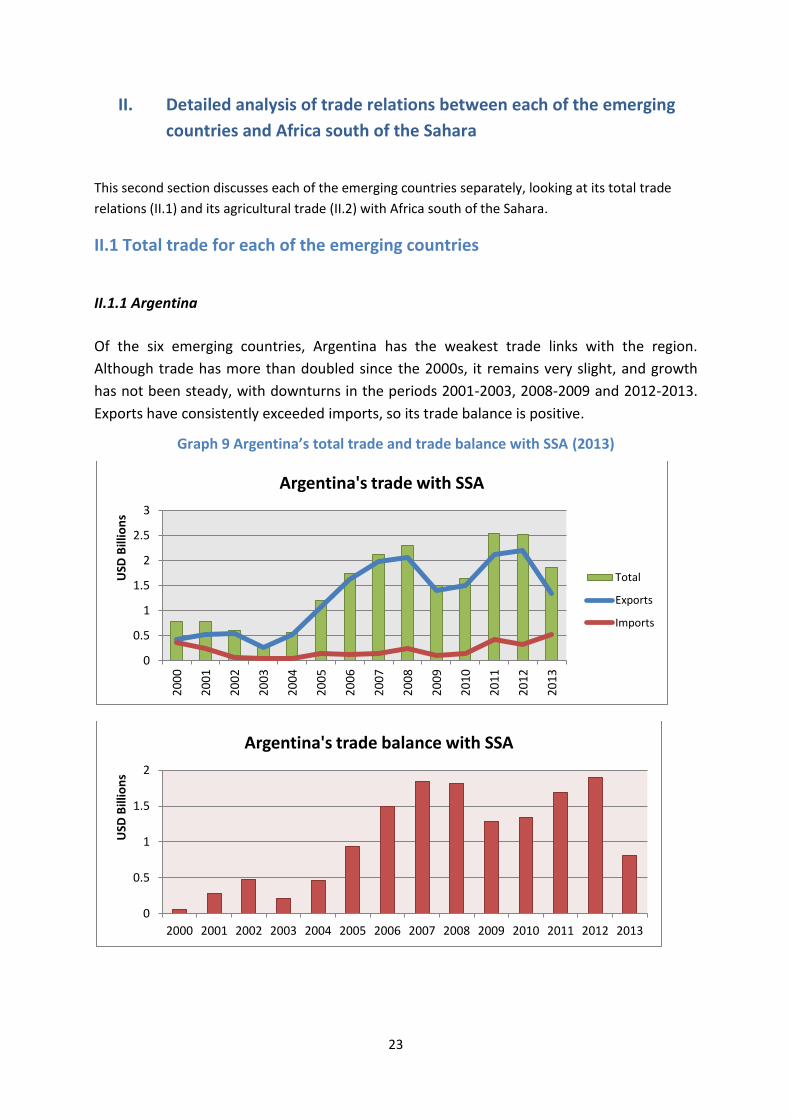
Of the six emerging countries, Argentina has the weakest trade links with the region.
Although trade has more than doubled since the 2000s, it remains very slight, and growth
has not been steady, with downturns in the periods 2001-2003, 2008-2009 and 2012-2013.
Exports have consistently exceeded imports, so its trade balance is positive.
Graph 9 Argentina’s total trade and trade balance with SSA (2013)
0
0.5
1
1.5
2
2.5
3
20
00
20
01
20
02
20
03
20
04
20
05
20
06
20
07
20
08
20
09
20
10
20
11
20
12
20
13
USD
Bill
ion
s
Argentina's trade with SSA
Total
Exports
Imports
0
0.5
1
1.5
2
2000 2001 2002 2003 2004 2005 2006 2007 2008 2009 2010 2011 2012 2013
USD
Bill
ion
s
Argentina's trade balance with SSA
24
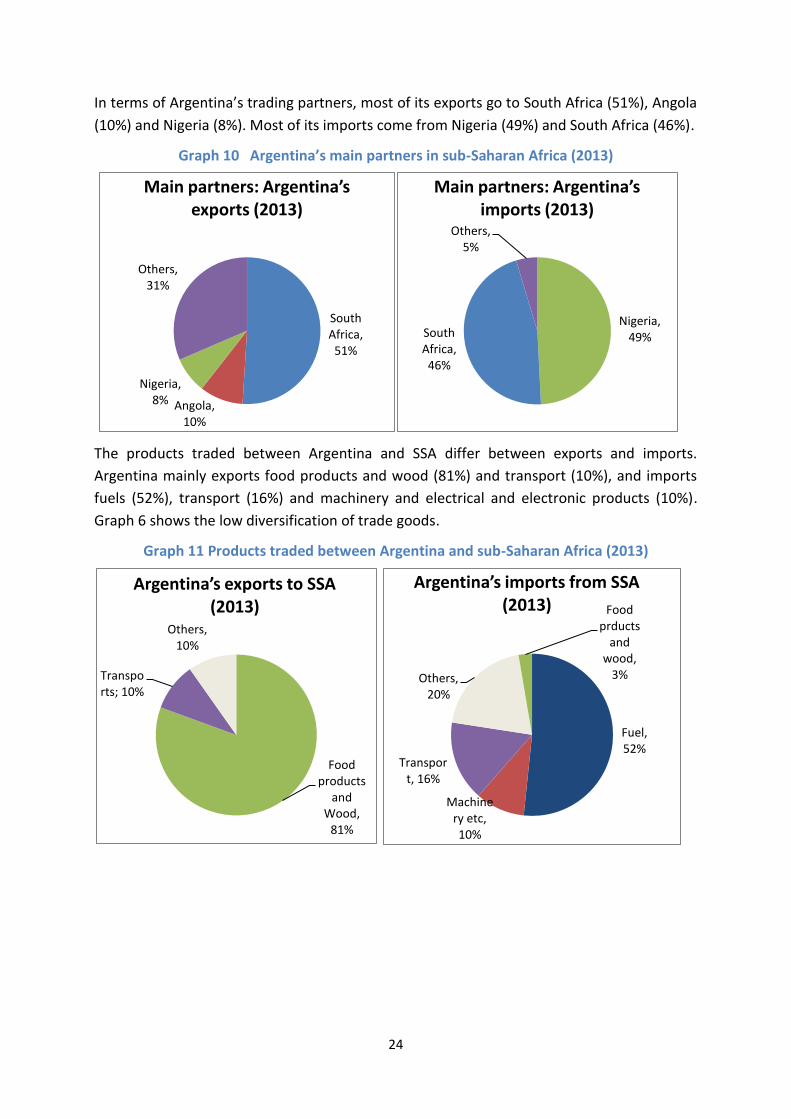
In terms of Argentina’s trading partners, most of its exports go to South Africa (51%), Angola
(10%) and Nigeria (8%). Most of its imports come from Nigeria (49%) and South Africa (46%).
Graph 10 Argentina’s main partners in sub-Saharan Africa (2013)
The products traded between Argentina and SSA differ between exports and imports.
Argentina mainly exports food products and wood (81%) and transport (10%), and imports
fuels (52%), transport (16%) and machinery and electrical and electronic products (10%).
Graph 6 shows the low diversification of trade goods.
Graph 11 Products traded between Argentina and sub-Saharan Africa (2013)
South Africa, 51%
Angola, 10%
Nigeria, 8%
Others, 31%
Main partners: Argentina’s exports (2013)
Nigeria, 49% South
Africa, 46%
Others, 5%
Main partners: Argentina’s imports (2013)
Food products
and Wood,
81%
Transports; 10%
Others, 10%
Argentina’s exports to SSA (2013)
Fuel, 52%
Machinery etc, 10%
Transport, 16%
Others, 20%
Food prducts
and wood,
3%
Argentina’s imports from SSA (2013)
25
II.1.2 Brazil
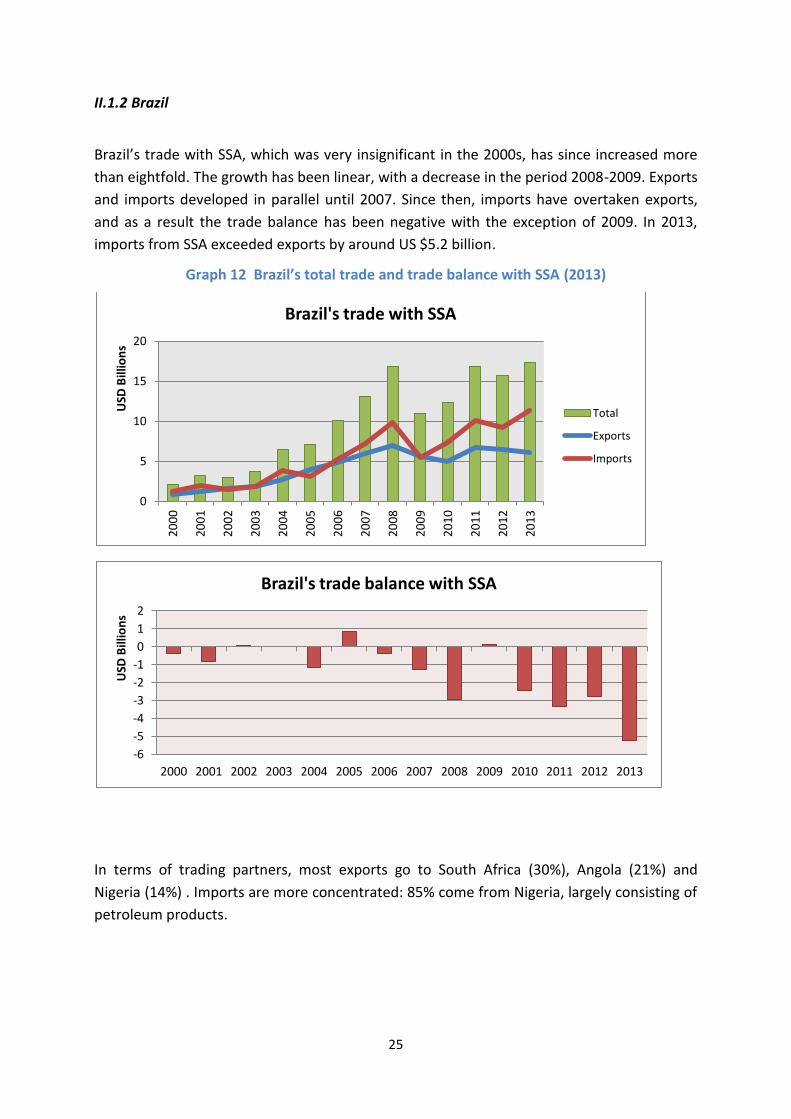
Brazil’s trade with SSA, which was very insignificant in the 2000s, has since increased more
than eightfold. The growth has been linear, with a decrease in the period 2008-2009. Exports
and imports developed in parallel until 2007. Since then, imports have overtaken exports,
and as a result the trade balance has been negative with the exception of 2009. In 2013,
imports from SSA exceeded exports by around US $5.2 billion.
Graph 12 Brazil’s total trade and trade balance with SSA (2013)
In terms of trading partners, most exports go to South Africa (30%), Angola (21%) and
Nigeria (14%) . Imports are more concentrated: 85% come from Nigeria, largely consisting of
petroleum products.
0
5
10
15
20
20
00
20
01
20
02
20
03
20
04
20
05
20
06
20
07
20
08
20
09
20
10
20
11
20
12
20
13
USD
Bill
ion
s
Brazil's trade with SSA
Total
Exports
Imports
-6
-5
-4
-3
-2
-1
0
1
2
2000 2001 2002 2003 2004 2005 2006 2007 2008 2009 2010 2011 2012 2013
USD
Bill
ion
s
Brazil's trade balance with SSA
26
Graph 13 Brazil’s main partners in sub-Saharan Africa (2013)
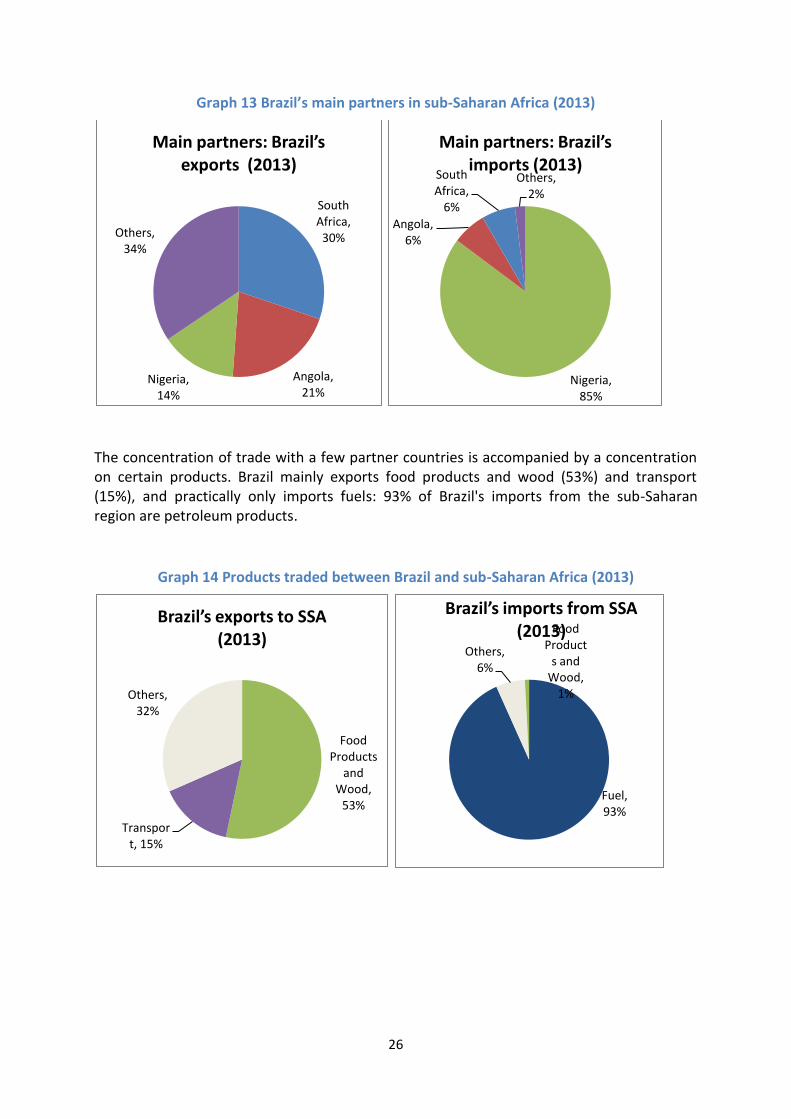
The concentration of trade with a few partner countries is accompanied by a concentration on certain products. Brazil mainly exports food products and wood (53%) and transport (15%), and practically only imports fuels: 93% of Brazil's imports from the sub-Saharan region are petroleum products.
Graph 14 Products traded between Brazil and sub-Saharan Africa (2013)
South Africa, 30%
Angola, 21%
Nigeria, 14%
Others, 34%
Main partners: Brazil’s exports (2013)
Nigeria, 85%
Angola, 6%
South Africa,
6%
Others, 2%
Main partners: Brazil’s imports (2013)
Food Products
and Wood,
53%
Transport, 15%
Others, 32%
Brazil’s exports to SSA (2013)
Fuel, 93%
Others, 6%
Food Product
s and Wood,
1%
Brazil’s imports from SSA (2013)
27
II.1.3 China
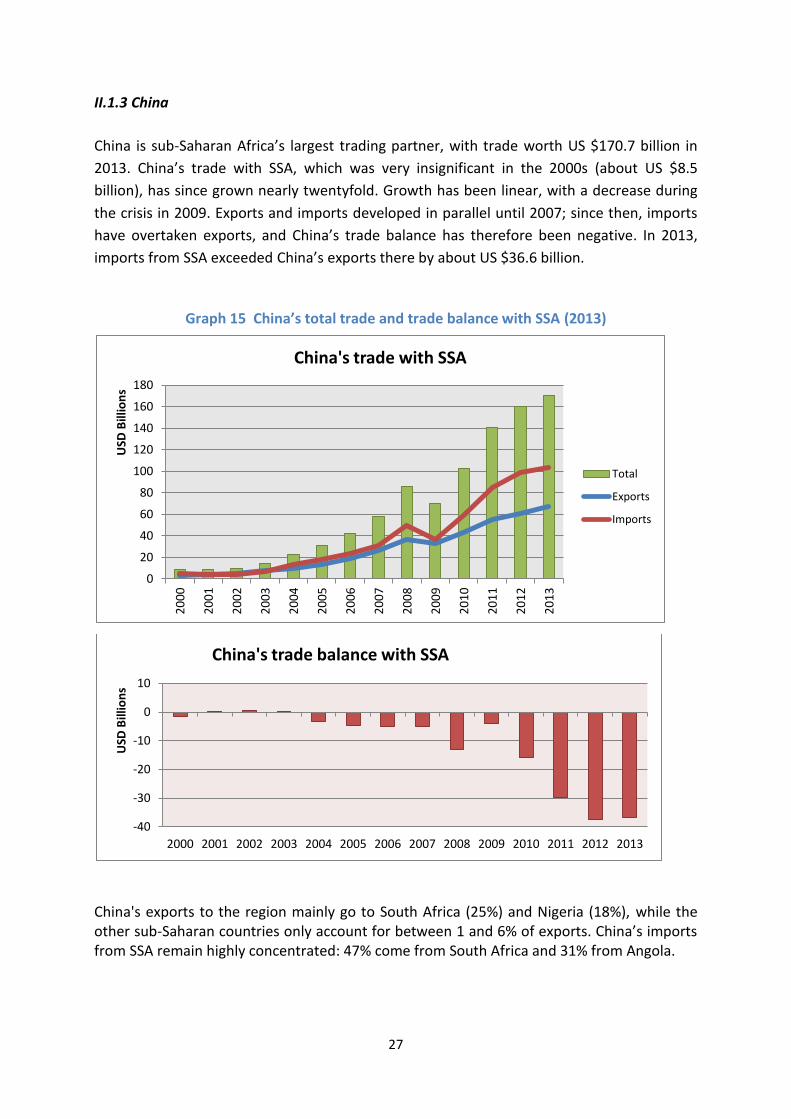
China is sub-Saharan Africa’s largest trading partner, with trade worth US $170.7 billion in
2013. China’s trade with SSA, which was very insignificant in the 2000s (about US $8.5
billion), has since grown nearly twentyfold. Growth has been linear, with a decrease during
the crisis in 2009. Exports and imports developed in parallel until 2007; since then, imports
have overtaken exports, and China’s trade balance has therefore been negative. In 2013,
imports from SSA exceeded China’s exports there by about US $36.6 billion.
Graph 15 China’s total trade and trade balance with SSA (2013)
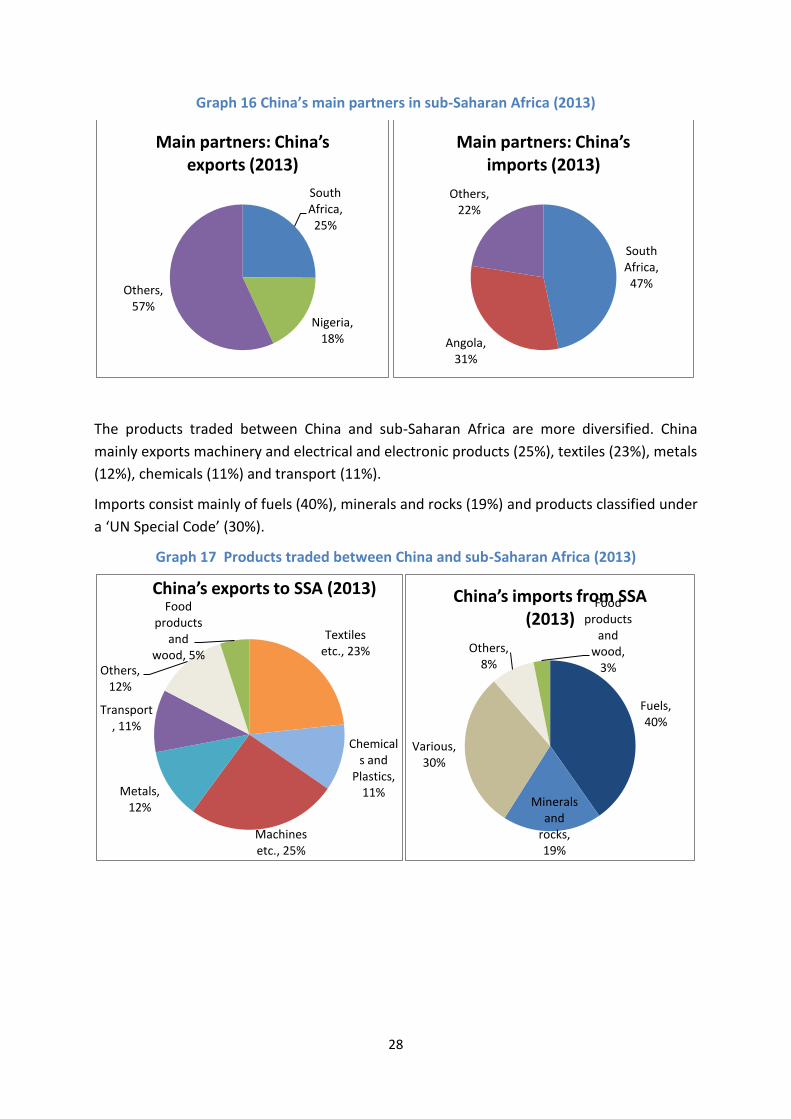
China's exports to the region mainly go to South Africa (25%) and Nigeria (18%), while the other sub-Saharan countries only account for between 1 and 6% of exports. China’s imports from SSA remain highly concentrated: 47% come from South Africa and 31% from Angola.
0
20
40
60
80
100
120
140
160
180
20
00
20
01
20
02
20
03
20
04
20
05
20
06
20
07
20
08
20
09
20
10
20
11
20
12
20
13
USD
Bill
ion
s
China's trade with SSA
Total
Exports
Imports
-40
-30
-20
-10
0
10
2000 2001 2002 2003 2004 2005 2006 2007 2008 2009 2010 2011 2012 2013
USD
Bill
ion
s
China's trade balance with SSA
28
Graph 16 China’s main partners in sub-Saharan Africa (2013)
The products traded between China and sub-Saharan Africa are more diversified. China
mainly exports machinery and electrical and electronic products (25%), textiles (23%), metals
(12%), chemicals (11%) and transport (11%).
Imports consist mainly of fuels (40%), minerals and rocks (19%) and products classified under
a ‘UN Special Code’ (30%).
Graph 17 Products traded between China and sub-Saharan Africa (2013)
South Africa, 25%
Nigeria, 18%
Others, 57%
Main partners: China’s exports (2013)
South Africa, 47%
Angola, 31%
Others, 22%
Main partners: China’s imports (2013)
Textiles etc., 23%
Chemicals and
Plastics, 11%
Machines etc., 25%
Metals, 12%
Transport, 11%
Others, 12%
Food products
and wood, 5%
China’s exports to SSA (2013)
Fuels, 40%
Minerals and
rocks, 19%
Various, 30%
Others, 8%
Food products
and wood,
3%
China’s imports from SSA (2013)
29
II.1.4 India
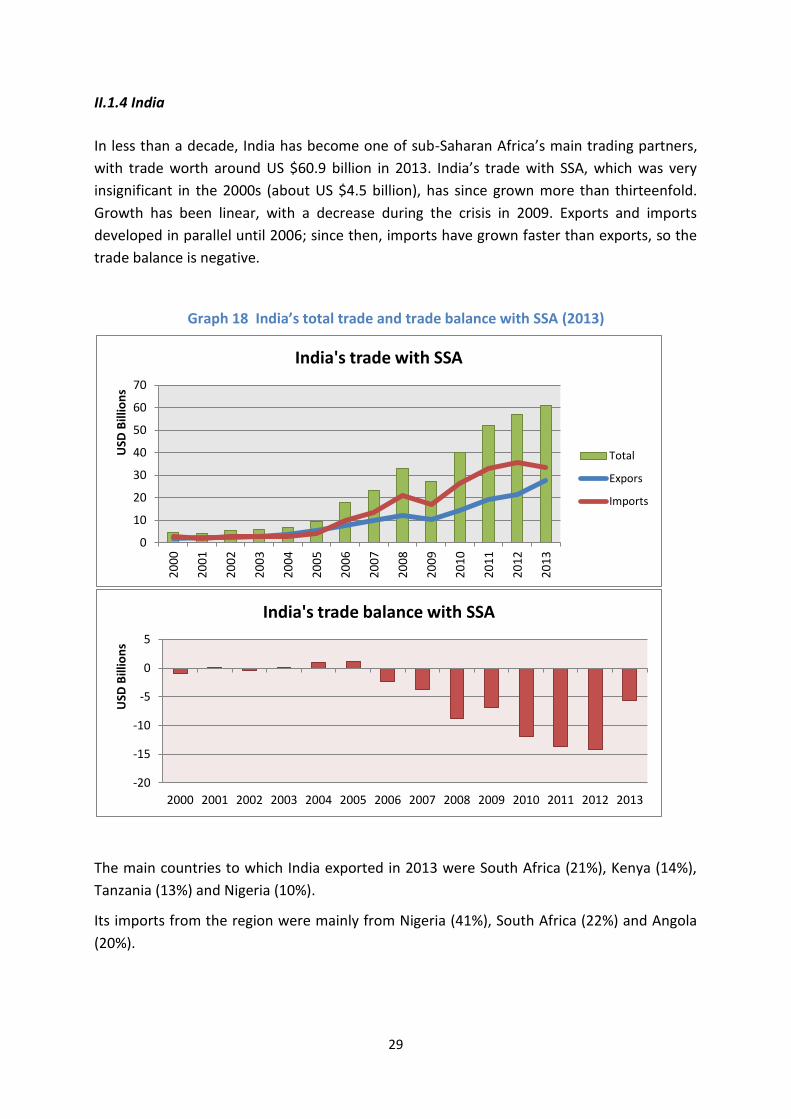
In less than a decade, India has become one of sub-Saharan Africa’s main trading partners,
with trade worth around US $60.9 billion in 2013. India’s trade with SSA, which was very
insignificant in the 2000s (about US $4.5 billion), has since grown more than thirteenfold.
Growth has been linear, with a decrease during the crisis in 2009. Exports and imports
developed in parallel until 2006; since then, imports have grown faster than exports, so the
trade balance is negative.
Graph 18 India’s total trade and trade balance with SSA (2013)
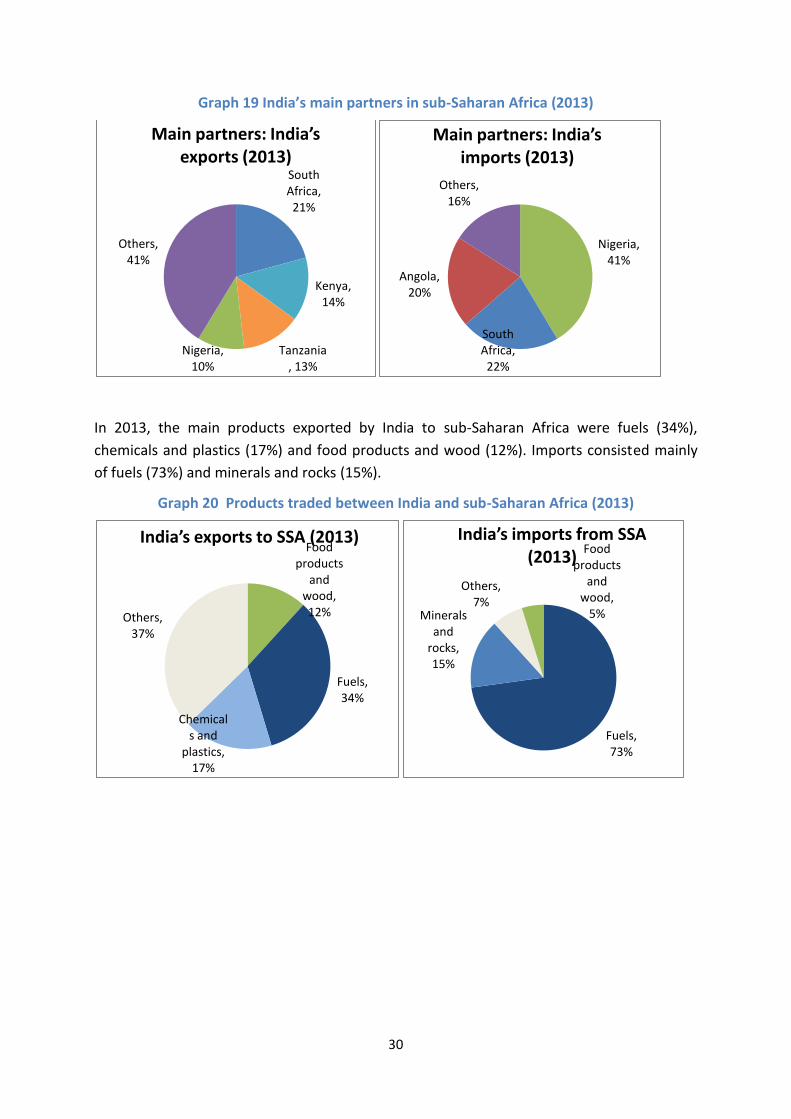
The main countries to which India exported in 2013 were South Africa (21%), Kenya (14%),
Tanzania (13%) and Nigeria (10%).
Its imports from the region were mainly from Nigeria (41%), South Africa (22%) and Angola
(20%).
0
10
20
30
40
50
60
70
20
00
20
01
20
02
20
03
20
04
20
05
20
06
20
07
20
08
20
09
20
10
20
11
20
12
20
13
USD
Bill
ion
s
India's trade with SSA
Total
Expors
Imports
-20
-15
-10
-5
0
5
2000 2001 2002 2003 2004 2005 2006 2007 2008 2009 2010 2011 2012 2013
USD
Bill
ion
s
India's trade balance with SSA
30
Graph 19 India’s main partners in sub-Saharan Africa (2013)
In 2013, the main products exported by India to sub-Saharan Africa were fuels (34%),
chemicals and plastics (17%) and food products and wood (12%). Imports consisted mainly
of fuels (73%) and minerals and rocks (15%).
Graph 20 Products traded between India and sub-Saharan Africa (2013)
South Africa, 21%
Kenya, 14%
Tanzania, 13%
Nigeria, 10%
Others, 41%
Main partners: India’s exports (2013)
Nigeria, 41%
South Africa, 22%
Angola, 20%
Others, 16%
Main partners: India’s imports (2013)
Food products
and wood, 12%
Fuels, 34%
Chemicals and
plastics, 17%
Others, 37%
India’s exports to SSA (2013)
Fuels, 73%
Minerals and
rocks, 15%
Others, 7%
Food products
and wood,
5%
India’s imports from SSA (2013)
31
II.1.5 South Korea
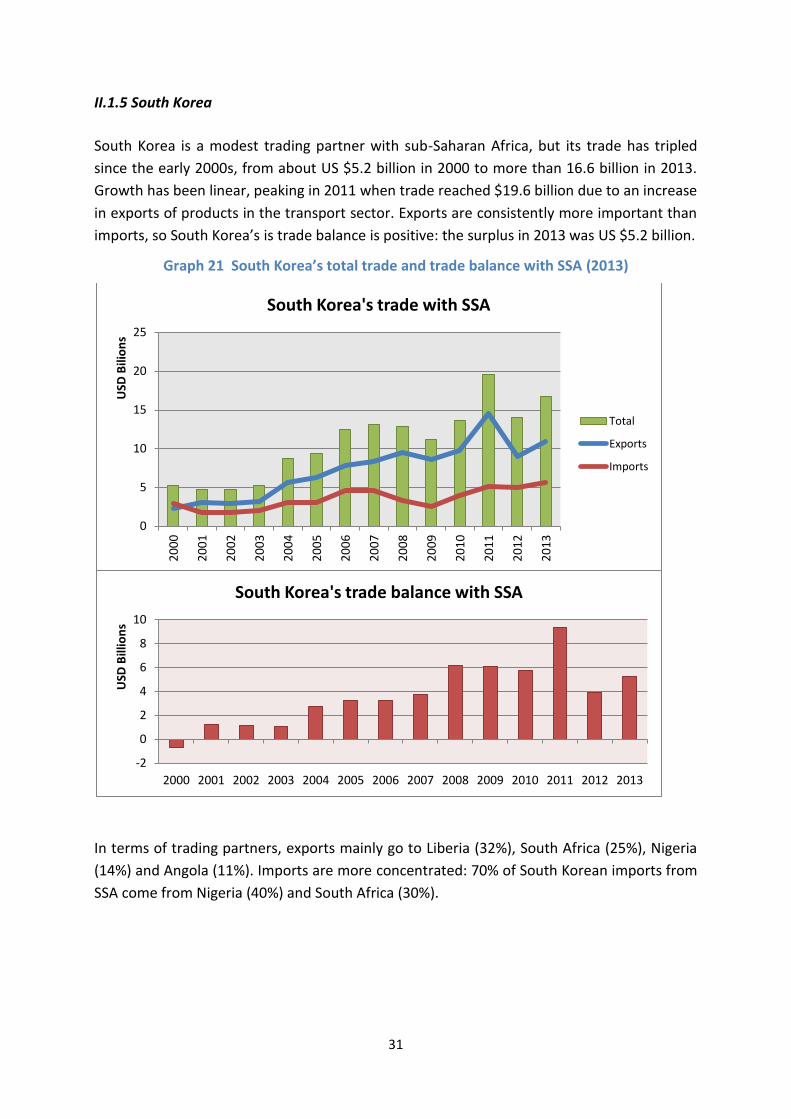
South Korea is a modest trading partner with sub-Saharan Africa, but its trade has tripled
since the early 2000s, from about US $5.2 billion in 2000 to more than 16.6 billion in 2013.
Growth has been linear, peaking in 2011 when trade reached $19.6 billion due to an increase
in exports of products in the transport sector. Exports are consistently more important than
imports, so South Korea’s is trade balance is positive: the surplus in 2013 was US $5.2 billion.
Graph 21 South Korea’s total trade and trade balance with SSA (2013)
In terms of trading partners, exports mainly go to Liberia (32%), South Africa (25%), Nigeria
(14%) and Angola (11%). Imports are more concentrated: 70% of South Korean imports from
SSA come from Nigeria (40%) and South Africa (30%).
0
5
10
15
20
25
20
00
20
01
20
02
20
03
20
04
20
05
20
06
20
07
20
08
20
09
20
10
20
11
20
12
20
13
USD
Bili
on
s
South Korea's trade with SSA
Total
Exports
Imports
-2
0
2
4
6
8
10
2000 2001 2002 2003 2004 2005 2006 2007 2008 2009 2010 2011 2012 2013
USD
Bill
ion
s
South Korea's trade balance with SSA
32
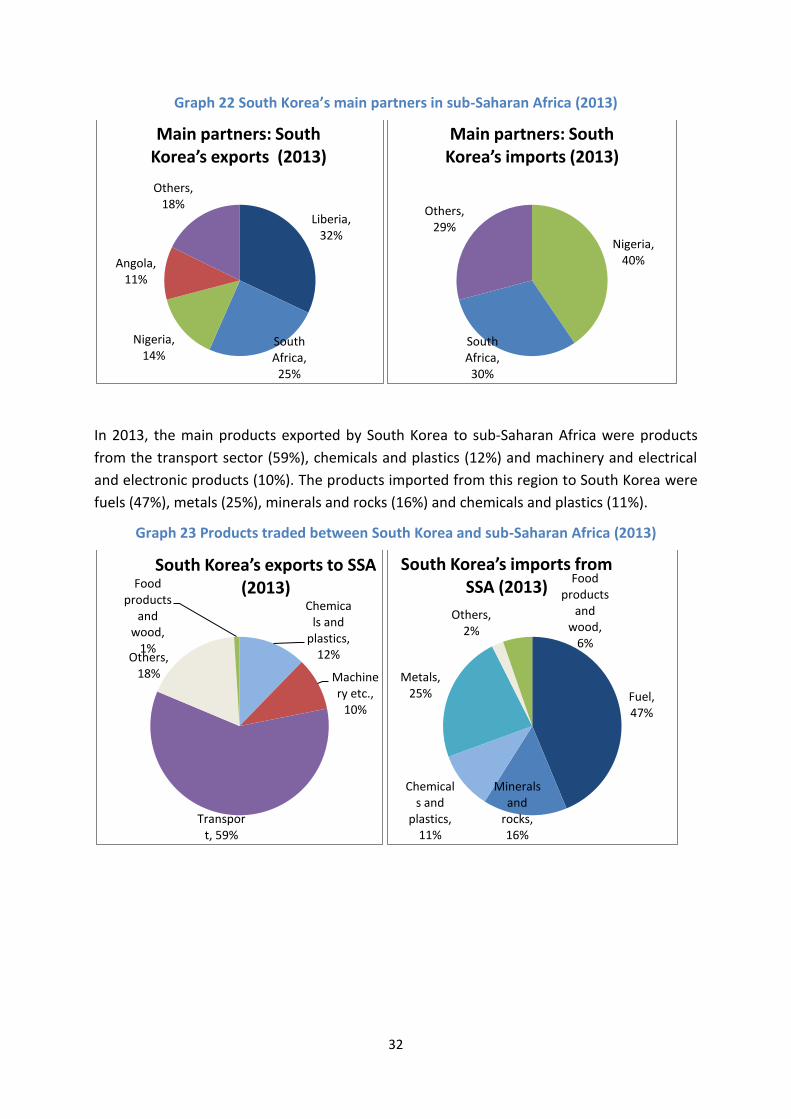
Graph 22 South Korea’s main partners in sub-Saharan Africa (2013)
In 2013, the main products exported by South Korea to sub-Saharan Africa were products
from the transport sector (59%), chemicals and plastics (12%) and machinery and electrical
and electronic products (10%). The products imported from this region to South Korea were
fuels (47%), metals (25%), minerals and rocks (16%) and chemicals and plastics (11%).
Graph 23 Products traded between South Korea and sub-Saharan Africa (2013)
Liberia, 32%
South Africa, 25%
Nigeria, 14%
Angola, 11%
Others, 18%
Main partners: South Korea’s exports (2013)
Nigeria, 40%
South Africa, 30%
Others, 29%
Main partners: South Korea’s imports (2013)
Chemicals and
plastics, 12%
Machinery etc.,
10%
Transport, 59%
Others, 18%
Food products
and wood,
1%
South Korea’s exports to SSA (2013)
Fuel, 47%
Minerals and
rocks, 16%
Chemicals and
plastics, 11%
Metals, 25%
Others, 2%
Food products
and wood,
6%
South Korea’s imports from SSA (2013)
33
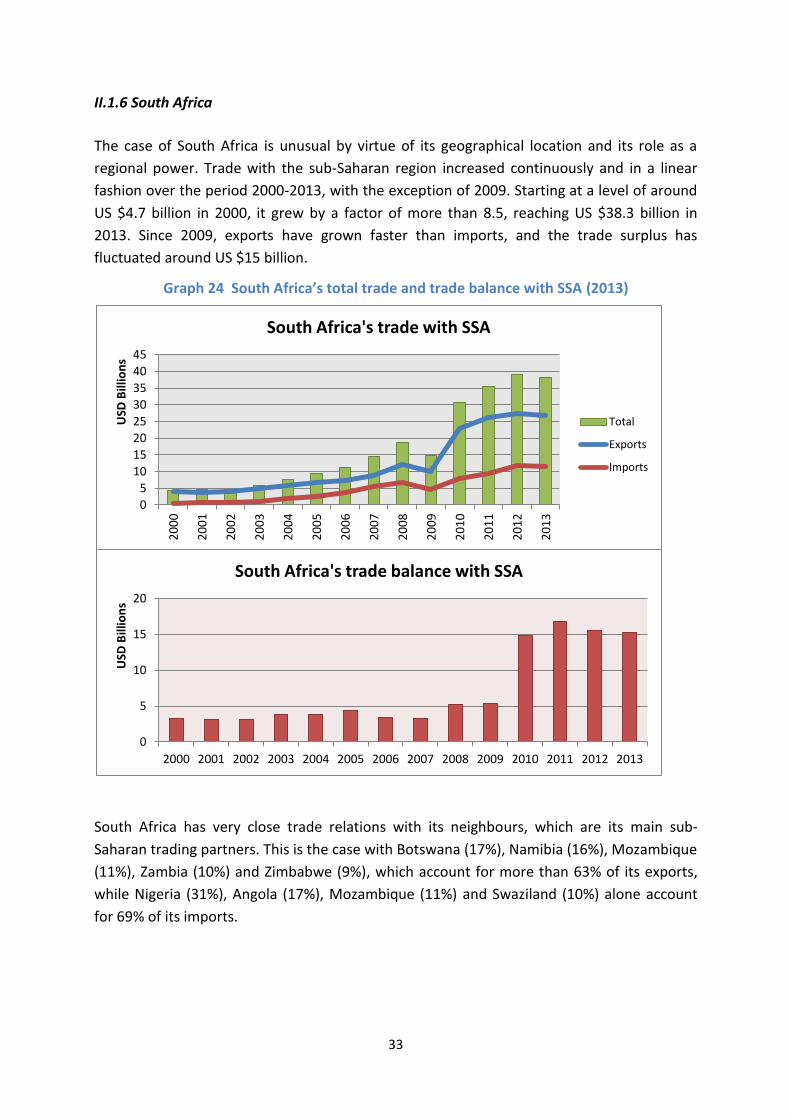
II.1.6 South Africa
The case of South Africa is unusual by virtue of its geographical location and its role as a
regional power. Trade with the sub-Saharan region increased continuously and in a linear
fashion over the period 2000-2013, with the exception of 2009. Starting at a level of around
US $4.7 billion in 2000, it grew by a factor of more than 8.5, reaching US $38.3 billion in
2013. Since 2009, exports have grown faster than imports, and the trade surplus has
fluctuated around US $15 billion.
Graph 24 South Africa’s total trade and trade balance with SSA (2013)
South Africa has very close trade relations with its neighbours, which are its main sub-
Saharan trading partners. This is the case with Botswana (17%), Namibia (16%), Mozambique
(11%), Zambia (10%) and Zimbabwe (9%), which account for more than 63% of its exports,
while Nigeria (31%), Angola (17%), Mozambique (11%) and Swaziland (10%) alone account
for 69% of its imports.
0
5
10
15
20
25
30
35
40
45
20
00
20
01
20
02
20
03
20
04
20
05
20
06
20
07
20
08
20
09
20
10
20
11
20
12
20
13
USD
Bill
ion
s
South Africa's trade with SSA
Total
Exports
Imports
0
5
10
15
20
2000 2001 2002 2003 2004 2005 2006 2007 2008 2009 2010 2011 2012 2013
USD
Bill
ion
s
South Africa's trade balance with SSA
34
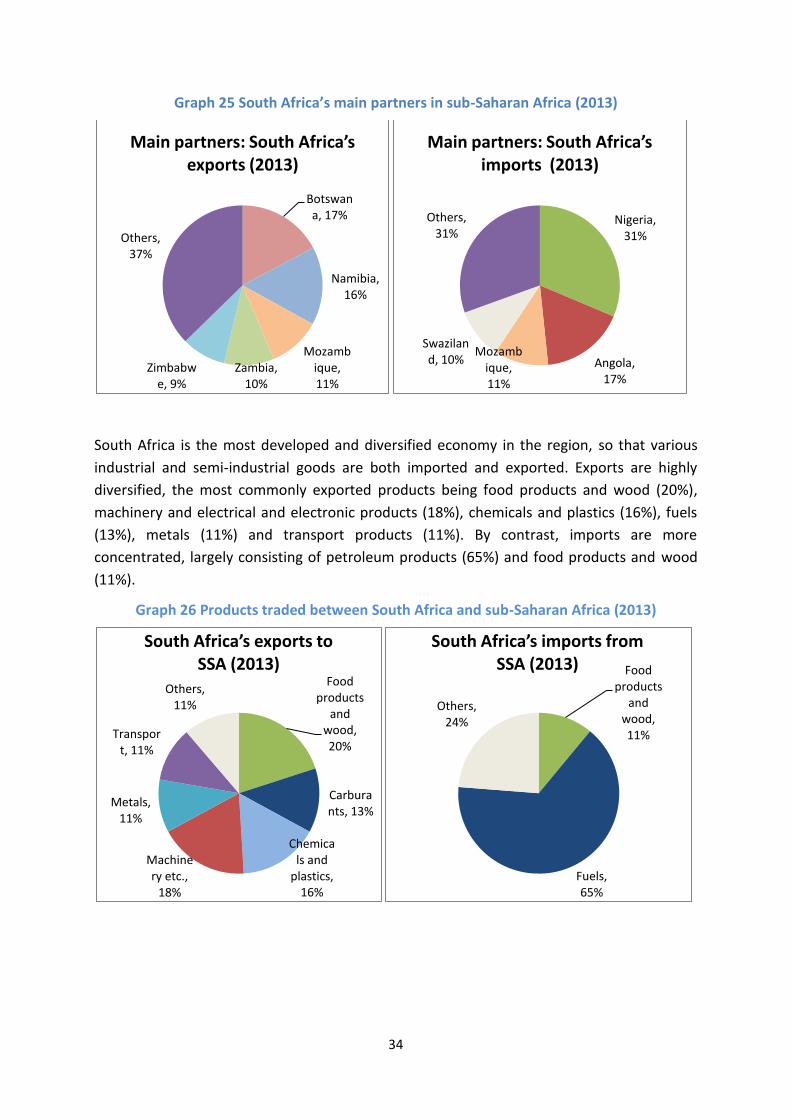
Graph 25 South Africa’s main partners in sub-Saharan Africa (2013)
South Africa is the most developed and diversified economy in the region, so that various
industrial and semi-industrial goods are both imported and exported. Exports are highly
diversified, the most commonly exported products being food products and wood (20%),
machinery and electrical and electronic products (18%), chemicals and plastics (16%), fuels
(13%), metals (11%) and transport products (11%). By contrast, imports are more
concentrated, largely consisting of petroleum products (65%) and food products and wood
(11%).
Graph 26 Products traded between South Africa and sub-Saharan Africa (2013)
Botswana, 17%
Namibia, 16%
Mozambique, 11%
Zambia, 10%
Zimbabwe, 9%
Others, 37%
Main partners: South Africa’s exports (2013)
Nigeria, 31%
Angola, 17%
Mozambique, 11%
Swaziland, 10%
Others, 31%
Main partners: South Africa’s imports (2013)
Food products
and wood, 20%
Carburants, 13%
Chemicals and
plastics, 16%
Machinery etc.,
18%
Metals, 11%
Transport, 11%
Others, 11%
South Africa’s exports to SSA (2013) Food
products and
wood, 11%
Fuels, 65%
Others, 24%
South Africa’s imports from SSA (2013)
35
II.2 The agricultural trade of each of the emerging countries with sub-
Saharan Africa
Agricultural products: methodology and nomenclature
For the purposes of this study, a group of agricultural products was defined. The nomenclature used is HS1996, and this group includes the following products:
Food products and similar (01-24)
Fertilisers (31)
Wood and similar (33*, 40*, 44-47)
Textiles (50-53)
Machinery (82*, 84*, 87*)
* certain sub-categories only: see methodology appendix for more details.
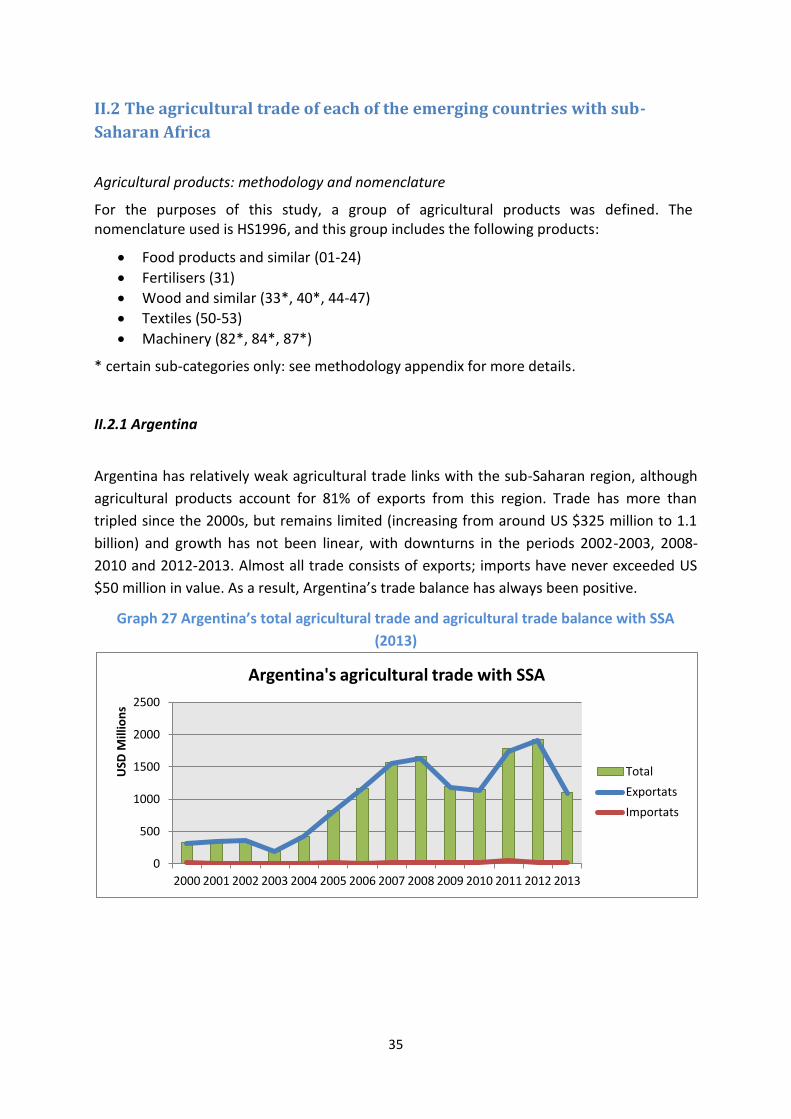
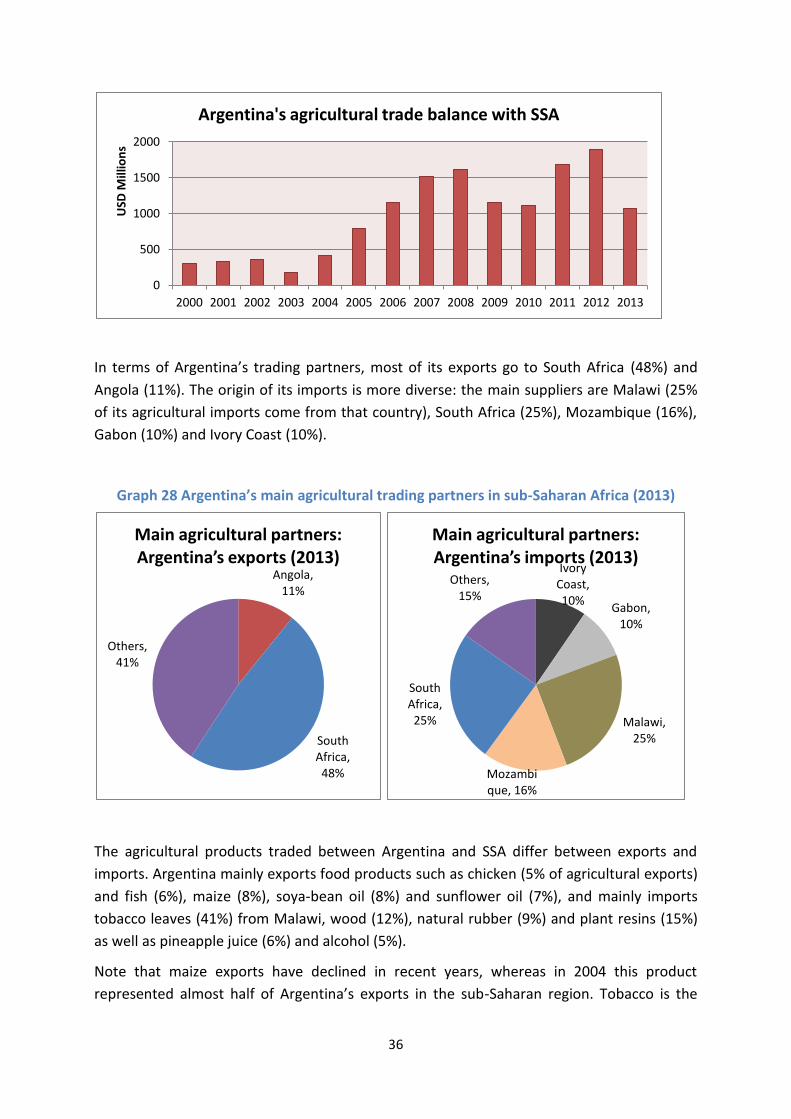
II.2.1 Argentina
Argentina has relatively weak agricultural trade links with the sub-Saharan region, although
agricultural products account for 81% of exports from this region. Trade has more than
tripled since the 2000s, but remains limited (increasing from around US $325 million to 1.1
billion) and growth has not been linear, with downturns in the periods 2002-2003, 2008-
2010 and 2012-2013. Almost all trade consists of exports; imports have never exceeded US
$50 million in value. As a result, Argentina’s trade balance has always been positive.
Graph 27 Argentina’s total agricultural trade and agricultural trade balance with SSA
(2013)
0
500
1000
1500
2000
2500
2000 2001 2002 2003 2004 2005 2006 2007 2008 2009 2010 2011 2012 2013
USD
Mill
ion
s
Argentina's agricultural trade with SSA
Total
Exportats
Importats
36
In terms of Argentina’s trading partners, most of its exports go to South Africa (48%) and
Angola (11%). The origin of its imports is more diverse: the main suppliers are Malawi (25%
of its agricultural imports come from that country), South Africa (25%), Mozambique (16%),
Gabon (10%) and Ivory Coast (10%).
Graph 28 Argentina’s main agricultural trading partners in sub-Saharan Africa (2013)
The agricultural products traded between Argentina and SSA differ between exports and
imports. Argentina mainly exports food products such as chicken (5% of agricultural exports)
and fish (6%), maize (8%), soya-bean oil (8%) and sunflower oil (7%), and mainly imports
tobacco leaves (41%) from Malawi, wood (12%), natural rubber (9%) and plant resins (15%)
as well as pineapple juice (6%) and alcohol (5%).
Note that maize exports have declined in recent years, whereas in 2004 this product
represented almost half of Argentina’s exports in the sub-Saharan region. Tobacco is the
0
500
1000
1500
2000
2000 2001 2002 2003 2004 2005 2006 2007 2008 2009 2010 2011 2012 2013
USD
Mill
ion
s Argentina's agricultural trade balance with SSA
Angola, 11%
South Africa, 48%
Others, 41%
Main agricultural partners: Argentina’s exports (2013)
Ivory Coast, 10%
Gabon, 10%
Malawi, 25%
Mozambique, 16%
South Africa, 25%
Others, 15%
Main agricultural partners: Argentina’s imports (2013)
37
main product imported, but its share of imports varies greatly from year to year in volume:
in 2003 it accounted for nearly 60% of agricultural imports, compared with just 7% in 2007.
Graph 29 Agricultural products traded between Argentina and sub-Saharan Africa (2013)
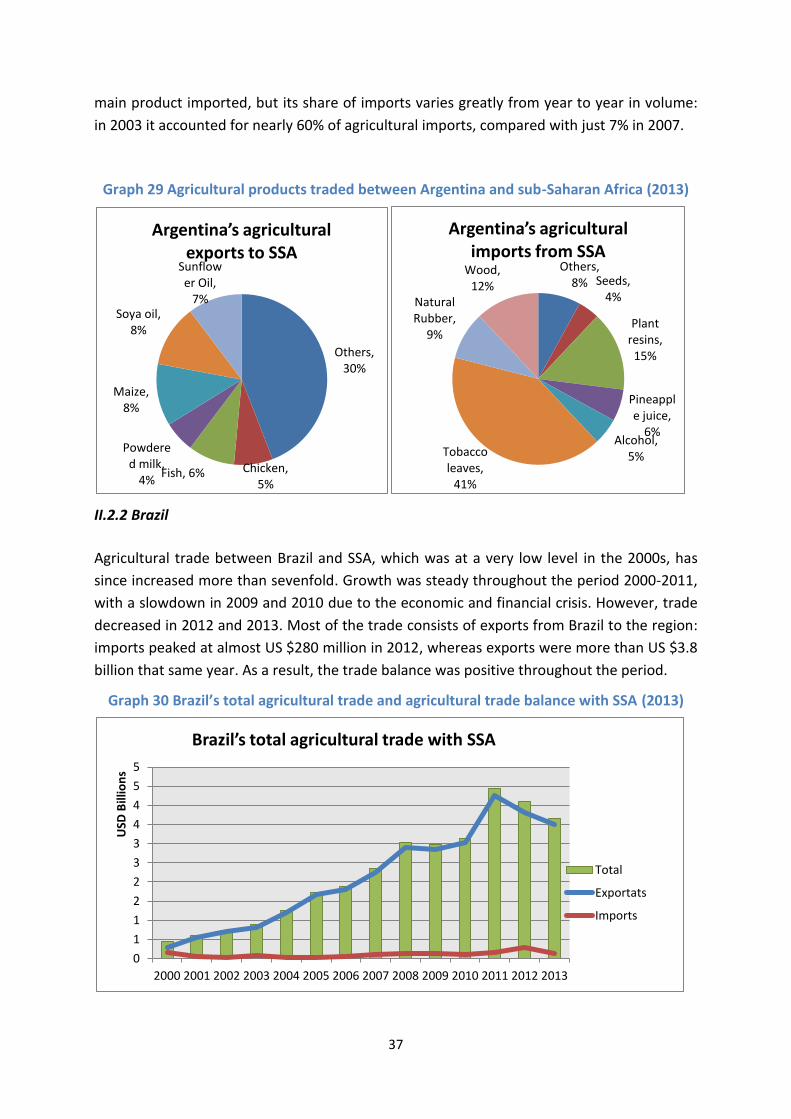
II.2.2 Brazil
Agricultural trade between Brazil and SSA, which was at a very low level in the 2000s, has
since increased more than sevenfold. Growth was steady throughout the period 2000-2011,
with a slowdown in 2009 and 2010 due to the economic and financial crisis. However, trade
decreased in 2012 and 2013. Most of the trade consists of exports from Brazil to the region:
imports peaked at almost US $280 million in 2012, whereas exports were more than US $3.8
billion that same year. As a result, the trade balance was positive throughout the period.
Graph 30 Brazil’s total agricultural trade and agricultural trade balance with SSA (2013)
Others, 30%
Chicken, 5%
Fish, 6%
Powdered milk,
4%
Maize, 8%
Soya oil, 8%
Sunflower Oil,
7%
Argentina’s agricultural exports to SSA
Others, 8% Seeds,
4%
Plant resins, 15%
Pineapple juice,
6% Alcohol,
5% Tobacco leaves,
41%
Natural Rubber,
9%
Wood, 12%
Argentina’s agricultural imports from SSA
0
1
1
2
2
3
3
4
4
5
5
2000 2001 2002 2003 2004 2005 2006 2007 2008 2009 2010 2011 2012 2013
USD
Bill
ion
s
Brazil’s total agricultural trade with SSA
Total
Exportats
Imports
38
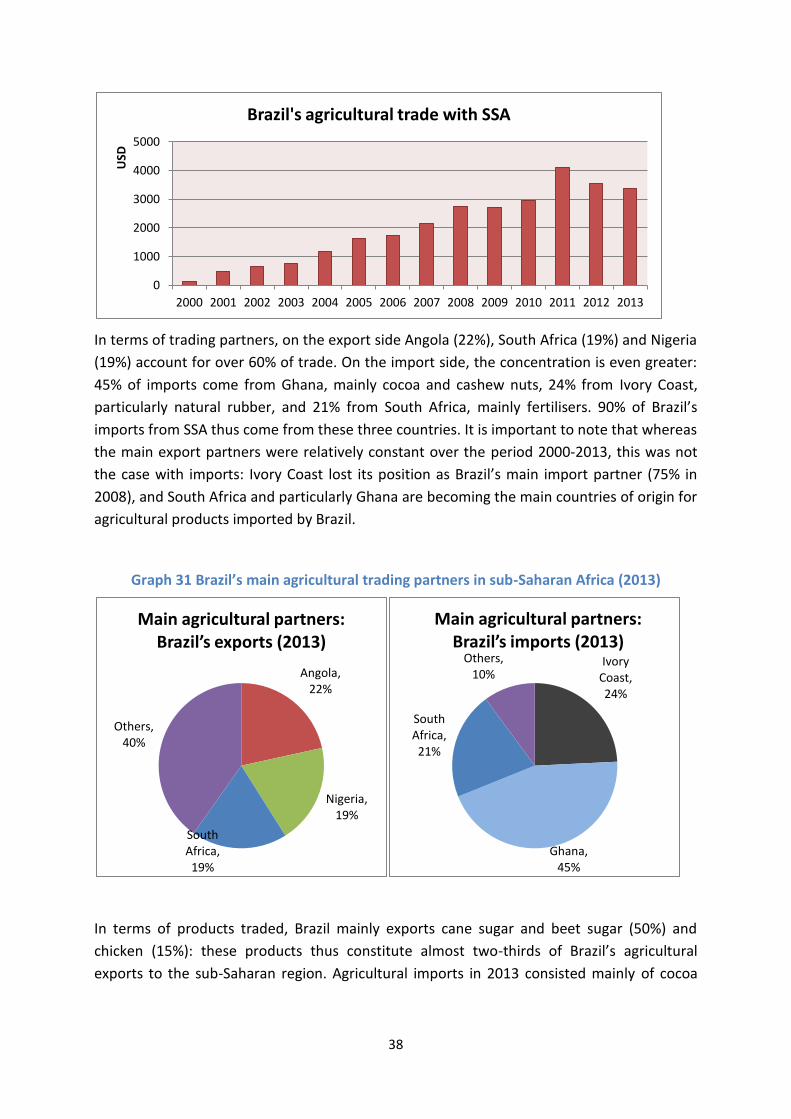
In terms of trading partners, on the export side Angola (22%), South Africa (19%) and Nigeria
(19%) account for over 60% of trade. On the import side, the concentration is even greater:
45% of imports come from Ghana, mainly cocoa and cashew nuts, 24% from Ivory Coast,
particularly natural rubber, and 21% from South Africa, mainly fertilisers. 90% of Brazil’s
imports from SSA thus come from these three countries. It is important to note that whereas
the main export partners were relatively constant over the period 2000-2013, this was not
the case with imports: Ivory Coast lost its position as Brazil’s main import partner (75% in
2008), and South Africa and particularly Ghana are becoming the main countries of origin for
agricultural products imported by Brazil.
Graph 31 Brazil’s main agricultural trading partners in sub-Saharan Africa (2013)
In terms of products traded, Brazil mainly exports cane sugar and beet sugar (50%) and
chicken (15%): these products thus constitute almost two-thirds of Brazil’s agricultural
exports to the sub-Saharan region. Agricultural imports in 2013 consisted mainly of cocoa
0
1000
2000
3000
4000
5000
2000 2001 2002 2003 2004 2005 2006 2007 2008 2009 2010 2011 2012 2013
USD
Brazil's agricultural trade with SSA
Angola, 22%
Nigeria, 19%
South Africa, 19%
Others, 40%
Main agricultural partners: Brazil’s exports (2013)
Ivory Coast, 24%
Ghana, 45%
South Africa, 21%
Others, 10%
Main agricultural partners: Brazil’s imports (2013)
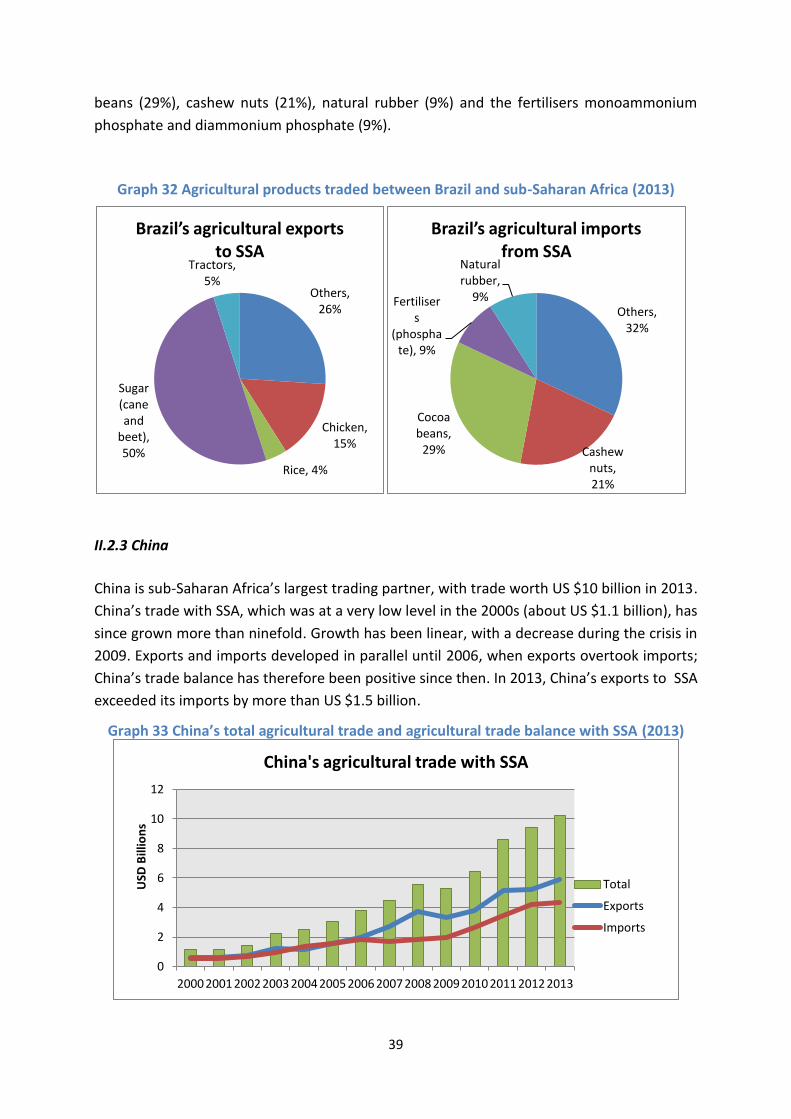
39
beans (29%), cashew nuts (21%), natural rubber (9%) and the fertilisers monoammonium
phosphate and diammonium phosphate (9%).
Graph 32 Agricultural products traded between Brazil and sub-Saharan Africa (2013)
II.2.3 China
China is sub-Saharan Africa’s largest trading partner, with trade worth US $10 billion in 2013.
China’s trade with SSA, which was at a very low level in the 2000s (about US $1.1 billion), has
since grown more than ninefold. Growth has been linear, with a decrease during the crisis in
2009. Exports and imports developed in parallel until 2006, when exports overtook imports;
China’s trade balance has therefore been positive since then. In 2013, China’s exports to SSA
exceeded its imports by more than US $1.5 billion.
Graph 33 China’s total agricultural trade and agricultural trade balance with SSA (2013)
Others, 26%
Chicken, 15%
Rice, 4%
Sugar (cane and
beet), 50%
Tractors, 5%
Brazil’s agricultural exports to SSA
Others, 32%
Cashew nuts, 21%
Cocoa beans,
29%
Fertilisers
(phosphate), 9%
Natural rubber,
9%
Brazil’s agricultural imports from SSA
0
2
4
6
8
10
12
2000 2001 2002 2003 2004 2005 2006 2007 2008 2009 2010 2011 2012 2013
USD
Bill
ion
s
China's agricultural trade with SSA
Total
Exports
Imports
40
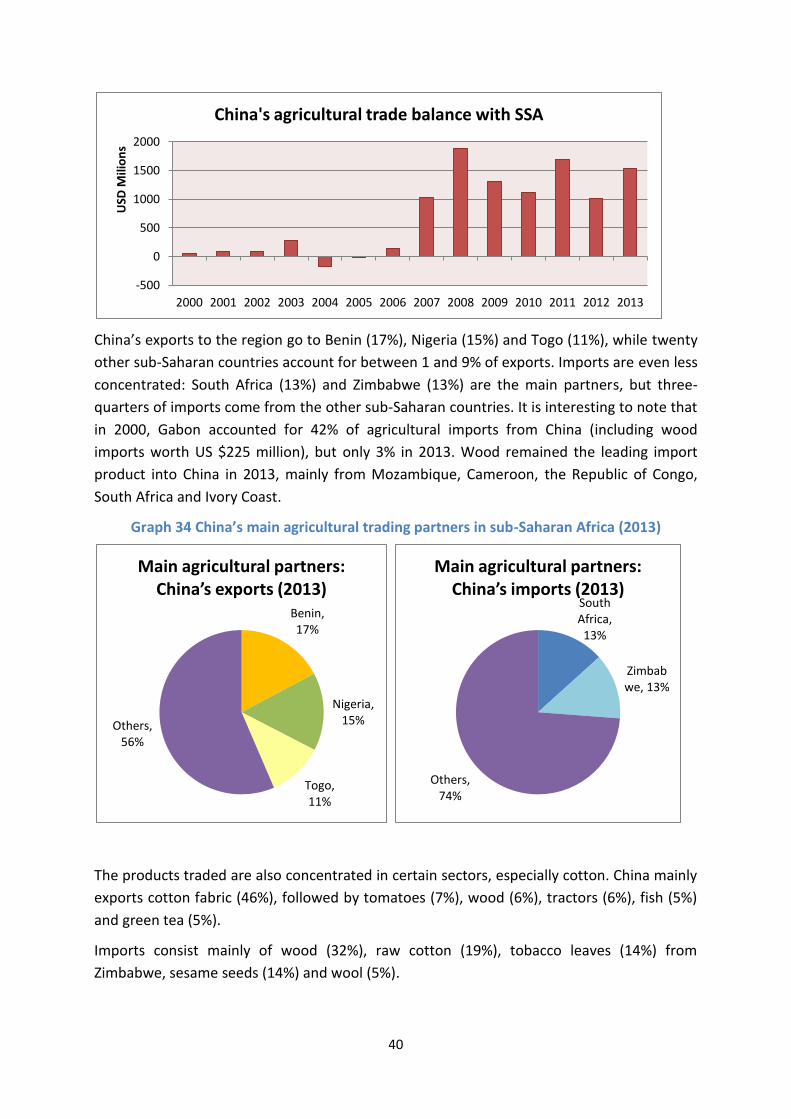
China’s exports to the region go to Benin (17%), Nigeria (15%) and Togo (11%), while twenty
other sub-Saharan countries account for between 1 and 9% of exports. Imports are even less
concentrated: South Africa (13%) and Zimbabwe (13%) are the main partners, but three-
quarters of imports come from the other sub-Saharan countries. It is interesting to note that
in 2000, Gabon accounted for 42% of agricultural imports from China (including wood
imports worth US $225 million), but only 3% in 2013. Wood remained the leading import
product into China in 2013, mainly from Mozambique, Cameroon, the Republic of Congo,
South Africa and Ivory Coast.
Graph 34 China’s main agricultural trading partners in sub-Saharan Africa (2013)
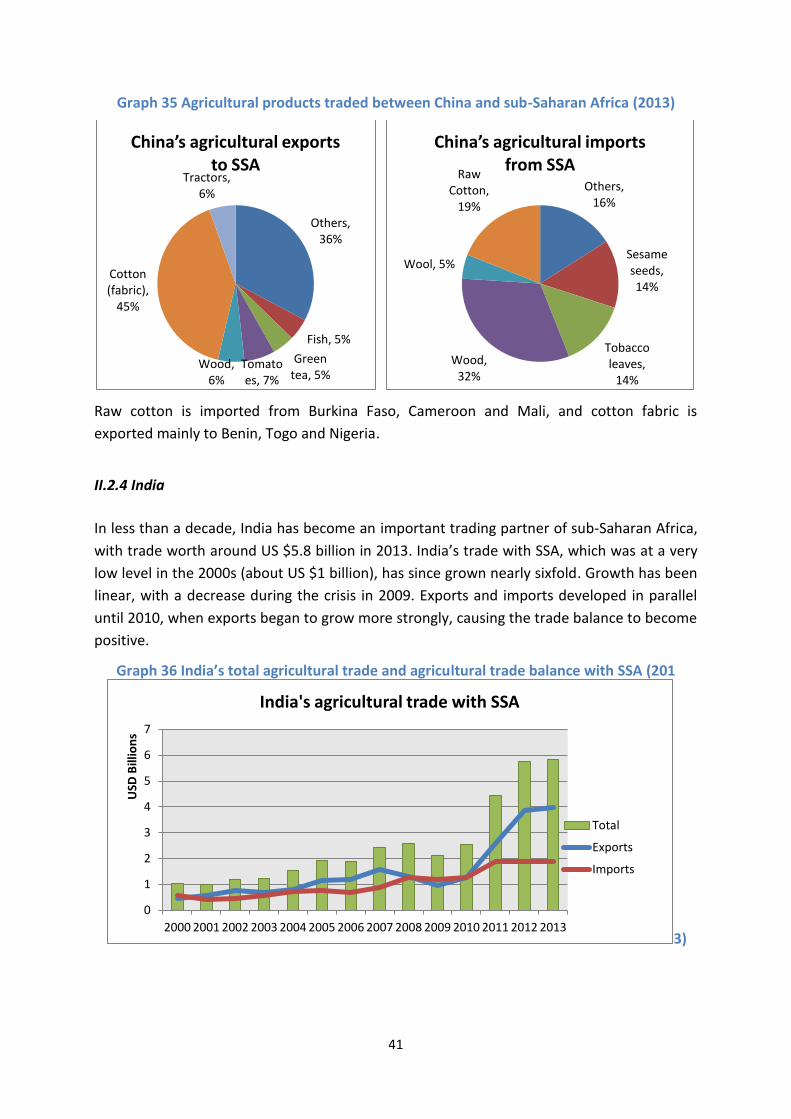
The products traded are also concentrated in certain sectors, especially cotton. China mainly
exports cotton fabric (46%), followed by tomatoes (7%), wood (6%), tractors (6%), fish (5%)
and green tea (5%).
Imports consist mainly of wood (32%), raw cotton (19%), tobacco leaves (14%) from
Zimbabwe, sesame seeds (14%) and wool (5%).
-500
0
500
1000
1500
2000
2000 2001 2002 2003 2004 2005 2006 2007 2008 2009 2010 2011 2012 2013
USD
Mili
on
s China's agricultural trade balance with SSA
Benin, 17%
Nigeria, 15%
Togo, 11%
Others, 56%
Main agricultural partners: China’s exports (2013)
South Africa, 13%
Zimbabwe, 13%
Others, 74%
Main agricultural partners: China’s imports (2013)
41
Graph 35 Agricultural products traded between China and sub-Saharan Africa (2013)
Raw cotton is imported from Burkina Faso, Cameroon and Mali, and cotton fabric is
exported mainly to Benin, Togo and Nigeria.
II.2.4 India
In less than a decade, India has become an important trading partner of sub-Saharan Africa,
with trade worth around US $5.8 billion in 2013. India’s trade with SSA, which was at a very
low level in the 2000s (about US $1 billion), has since grown nearly sixfold. Growth has been
linear, with a decrease during the crisis in 2009. Exports and imports developed in parallel
until 2010, when exports began to grow more strongly, causing the trade balance to become
positive.
Graph 36 India’s total agricultural trade and agricultural trade balance with SSA (201
3)
Others, 36%
Fish, 5%
Green tea, 5%
Tomatoes, 7%
Wood, 6%
Cotton (fabric),
45%
Tractors, 6%
China’s agricultural exports to SSA
Others, 16%
Sesame seeds, 14%
Tobacco leaves,
14%
Wood, 32%
Wool, 5%
Raw Cotton,
19%
China’s agricultural imports from SSA
0
1
2
3
4
5
6
7
2000 2001 2002 2003 2004 2005 2006 2007 2008 2009 2010 2011 2012 2013
USD
Bill
ion
s
India's agricultural trade with SSA
Total
Exports
Imports
42
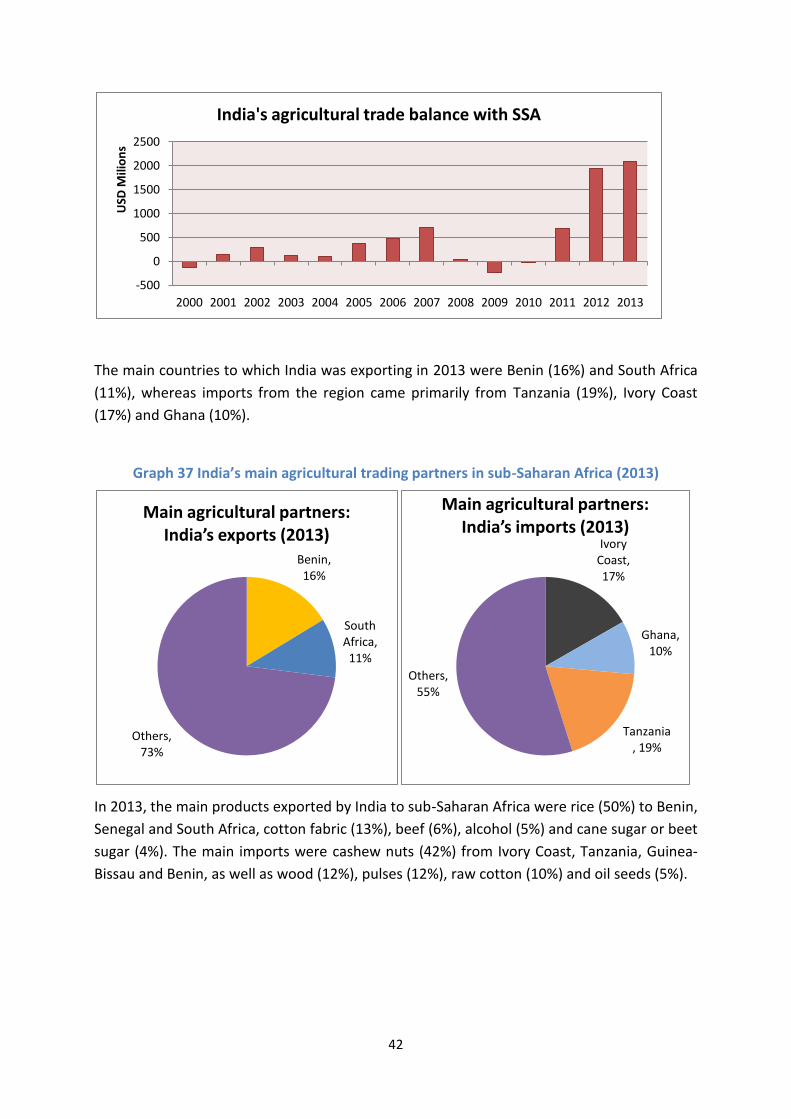
The main countries to which India was exporting in 2013 were Benin (16%) and South Africa
(11%), whereas imports from the region came primarily from Tanzania (19%), Ivory Coast
(17%) and Ghana (10%).
Graph 37 India’s main agricultural trading partners in sub-Saharan Africa (2013)
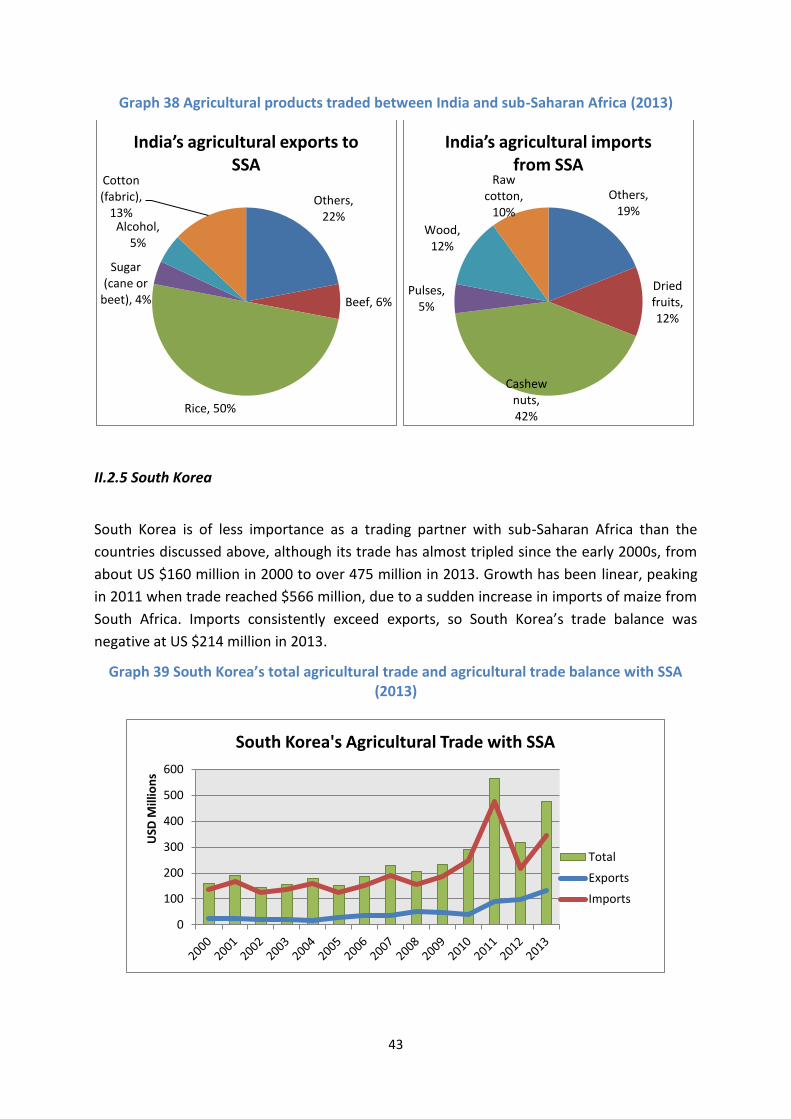
In 2013, the main products exported by India to sub-Saharan Africa were rice (50%) to Benin,
Senegal and South Africa, cotton fabric (13%), beef (6%), alcohol (5%) and cane sugar or beet
sugar (4%). The main imports were cashew nuts (42%) from Ivory Coast, Tanzania, Guinea-
Bissau and Benin, as well as wood (12%), pulses (12%), raw cotton (10%) and oil seeds (5%).
-500
0
500
1000
1500
2000
2500
2000 2001 2002 2003 2004 2005 2006 2007 2008 2009 2010 2011 2012 2013
USD
Mili
on
s India's agricultural trade balance with SSA
Benin, 16%
South Africa, 11%
Others, 73%
Main agricultural partners: India’s exports (2013)
Ivory Coast, 17%
Ghana, 10%
Tanzania, 19%
Others, 55%
Main agricultural partners: India’s imports (2013)
43
Graph 38 Agricultural products traded between India and sub-Saharan Africa (2013)
II.2.5 South Korea
South Korea is of less importance as a trading partner with sub-Saharan Africa than the
countries discussed above, although its trade has almost tripled since the early 2000s, from
about US $160 million in 2000 to over 475 million in 2013. Growth has been linear, peaking
in 2011 when trade reached $566 million, due to a sudden increase in imports of maize from
South Africa. Imports consistently exceed exports, so South Korea’s trade balance was
negative at US $214 million in 2013.
Graph 39 South Korea’s total agricultural trade and agricultural trade balance with SSA (2013)
Others, 22%
Beef, 6%
Rice, 50%
Sugar (cane or
beet), 4%
Alcohol, 5%
Cotton (fabric),
13%
India’s agricultural exports to SSA
Others, 19%
Dried fruits, 12%
Cashew nuts, 42%
Pulses, 5%
Wood, 12%
Raw cotton,
10%
India’s agricultural imports from SSA
0
100
200
300
400
500
600
USD
Mill
ion
s
South Korea's Agricultural Trade with SSA
Total
Exports
Imports
44
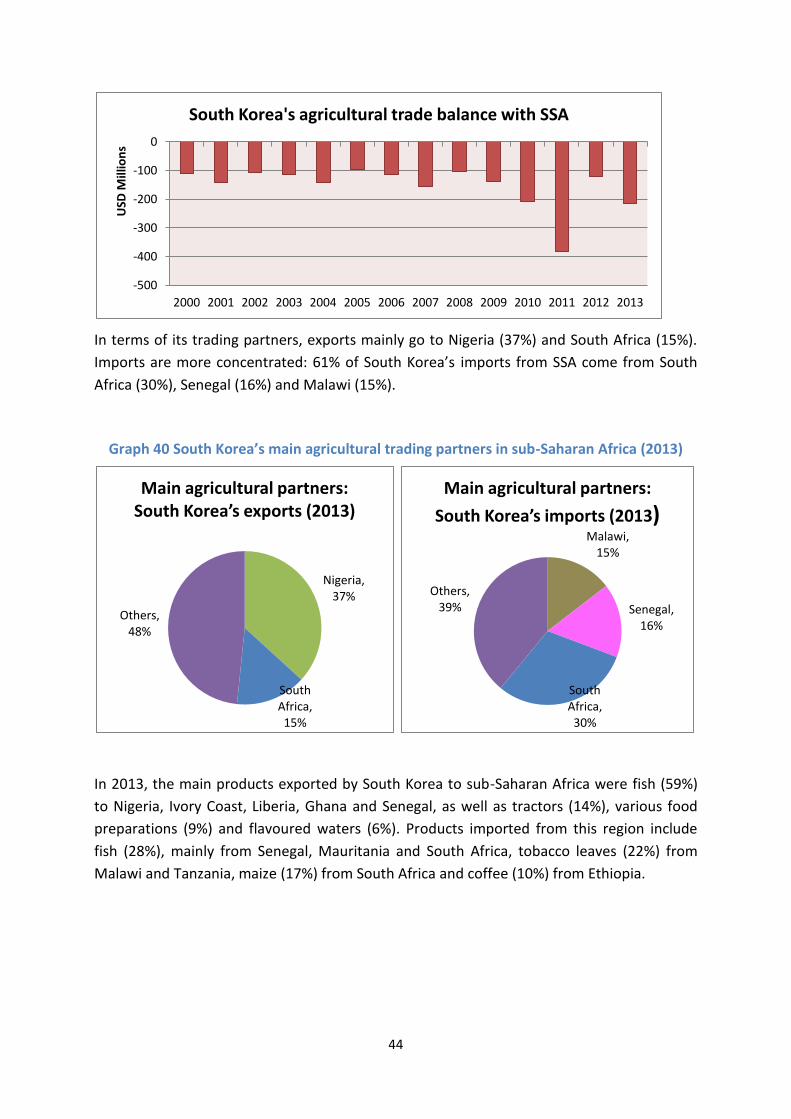
In terms of its trading partners, exports mainly go to Nigeria (37%) and South Africa (15%).
Imports are more concentrated: 61% of South Korea’s imports from SSA come from South
Africa (30%), Senegal (16%) and Malawi (15%).
Graph 40 South Korea’s main agricultural trading partners in sub-Saharan Africa (2013)
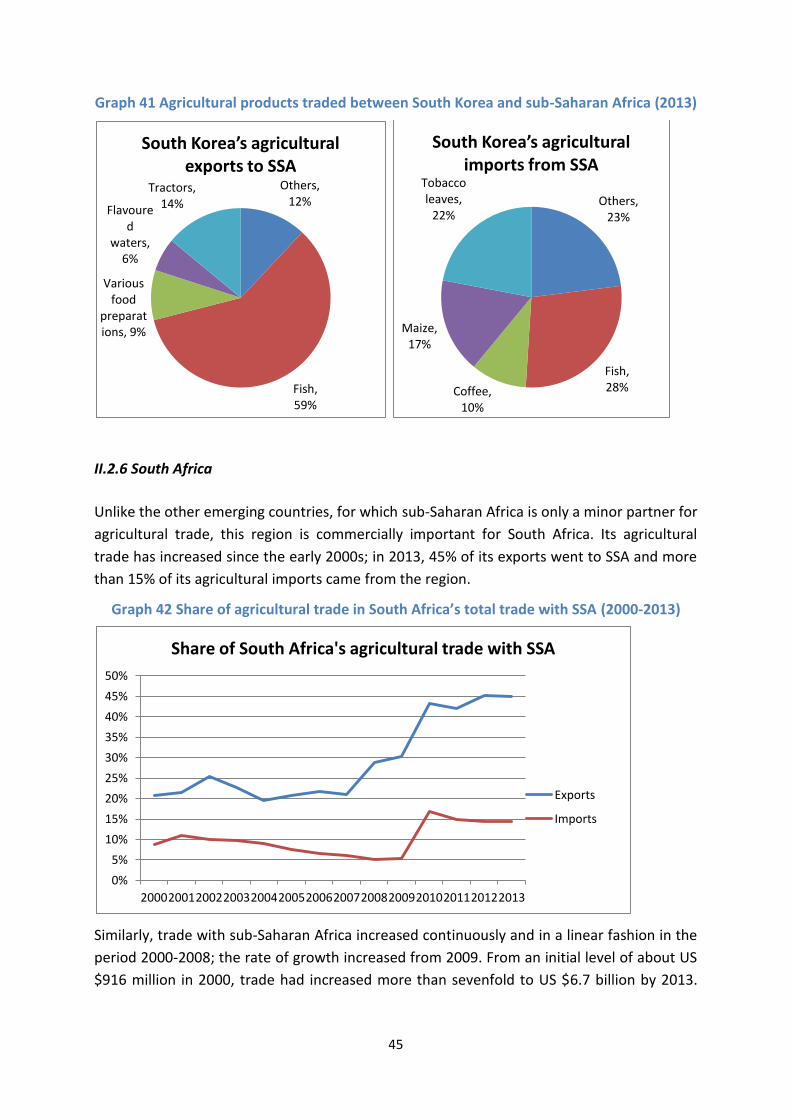
In 2013, the main products exported by South Korea to sub-Saharan Africa were fish (59%)
to Nigeria, Ivory Coast, Liberia, Ghana and Senegal, as well as tractors (14%), various food
preparations (9%) and flavoured waters (6%). Products imported from this region include
fish (28%), mainly from Senegal, Mauritania and South Africa, tobacco leaves (22%) from
Malawi and Tanzania, maize (17%) from South Africa and coffee (10%) from Ethiopia.
-500
-400
-300
-200
-100
0
2000 2001 2002 2003 2004 2005 2006 2007 2008 2009 2010 2011 2012 2013
USD
Mill
ion
s South Korea's agricultural trade balance with SSA
Nigeria, 37%
South Africa, 15%
Others, 48%
Main agricultural partners: South Korea’s exports (2013)
Malawi, 15%
Senegal, 16%
South Africa, 30%
Others, 39%
Main agricultural partners:
South Korea’s imports (2013)
45
Graph 41 Agricultural products traded between South Korea and sub-Saharan Africa (2013)
II.2.6 South Africa
Unlike the other emerging countries, for which sub-Saharan Africa is only a minor partner for
agricultural trade, this region is commercially important for South Africa. Its agricultural
trade has increased since the early 2000s; in 2013, 45% of its exports went to SSA and more
than 15% of its agricultural imports came from the region.
Graph 42 Share of agricultural trade in South Africa’s total trade with SSA (2000-2013)
Similarly, trade with sub-Saharan Africa increased continuously and in a linear fashion in the
period 2000-2008; the rate of growth increased from 2009. From an initial level of about US
$916 million in 2000, trade had increased more than sevenfold to US $6.7 billion by 2013.
Others, 12%
Fish, 59%
Various food
preparations, 9%
Flavoured
waters, 6%
Tractors, 14%
South Korea’s agricultural exports to SSA
Others, 23%
Fish, 28% Coffee,
10%
Maize, 17%
Tobacco leaves,
22%
South Korea’s agricultural imports from SSA
0%
5%
10%
15%
20%
25%
30%
35%
40%
45%
50%
2000 2001 2002 2003 2004 2005 2006 2007 2008 2009 2010 2011 2012 2013
Share of South Africa's agricultural trade with SSA
Exports
Imports
46
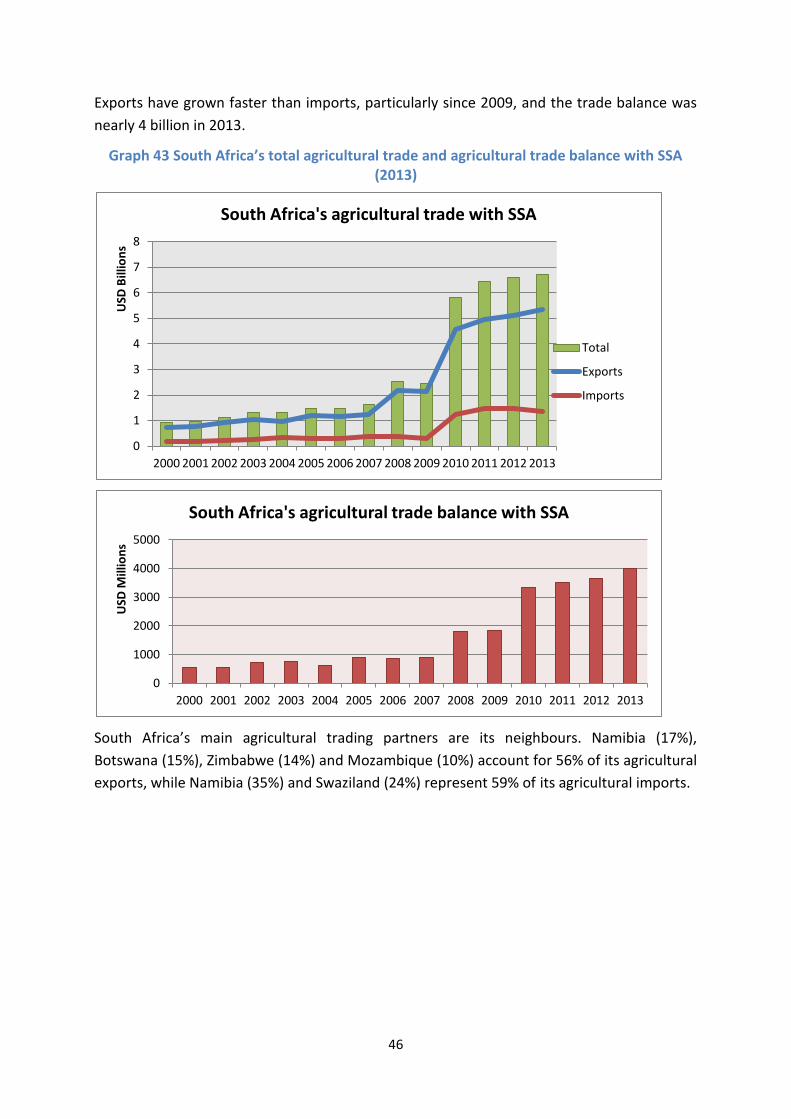
Exports have grown faster than imports, particularly since 2009, and the trade balance was
nearly 4 billion in 2013.
Graph 43 South Africa’s total agricultural trade and agricultural trade balance with SSA (2013)
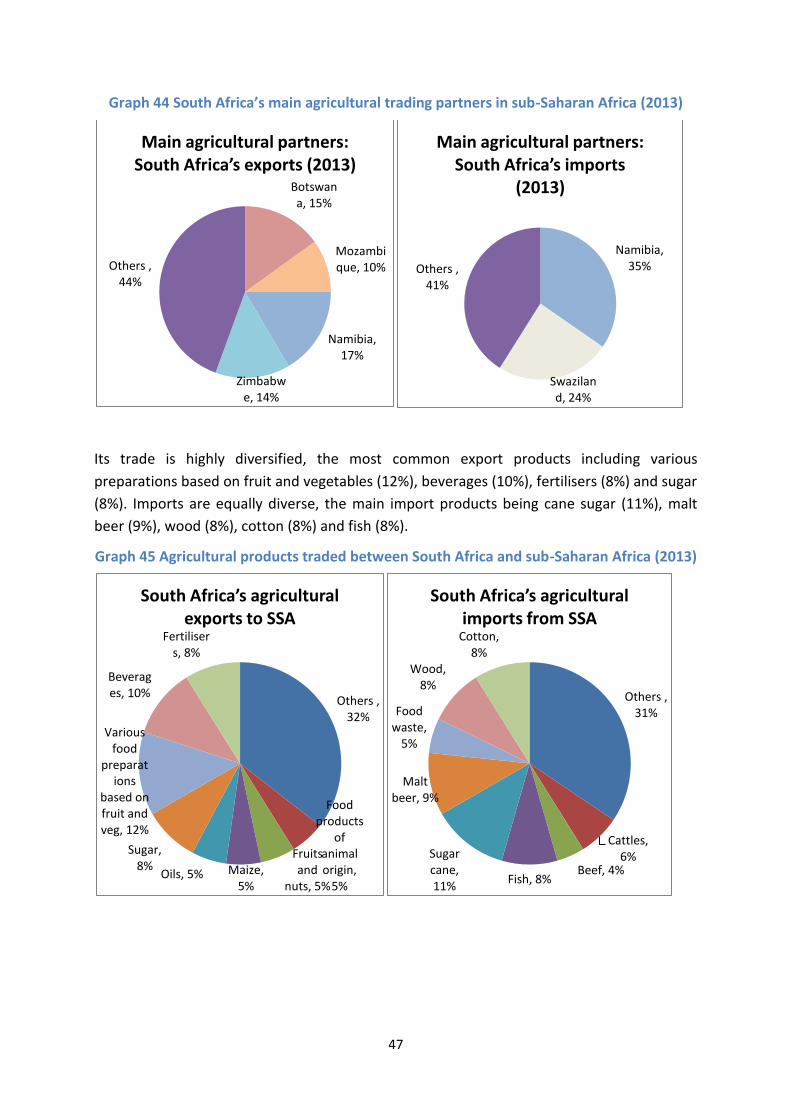
South Africa’s main agricultural trading partners are its neighbours. Namibia (17%),
Botswana (15%), Zimbabwe (14%) and Mozambique (10%) account for 56% of its agricultural
exports, while Namibia (35%) and Swaziland (24%) represent 59% of its agricultural imports.
0
1
2
3
4
5
6
7
8
2000 2001 2002 2003 2004 2005 2006 2007 2008 2009 2010 2011 2012 2013
USD
Bill
ion
s
South Africa's agricultural trade with SSA
Total
Exports
Imports
0
1000
2000
3000
4000
5000
2000 2001 2002 2003 2004 2005 2006 2007 2008 2009 2010 2011 2012 2013
USD
Mill
ion
s
South Africa's agricultural trade balance with SSA
47
Graph 44 South Africa’s main agricultural trading partners in sub-Saharan Africa (2013)
Its trade is highly diversified, the most common export products including various
preparations based on fruit and vegetables (12%), beverages (10%), fertilisers (8%) and sugar
(8%). Imports are equally diverse, the main import products being cane sugar (11%), malt
beer (9%), wood (8%), cotton (8%) and fish (8%).
Graph 45 Agricultural products traded between South Africa and sub-Saharan Africa (2013)
Botswana, 15%
Mozambique, 10%
Namibia, 17%
Zimbabwe, 14%
Others , 44%
Main agricultural partners: South Africa’s exports (2013)
Namibia, 35%
Swaziland, 24%
Others , 41%
Main agricultural partners: South Africa’s imports
(2013)
Others , 32%
Food products
of animal origin,
5%
Fruits and
nuts, 5% Maize,
5% Oils, 5%
Sugar, 8%
Various food
preparations
based on fruit and veg, 12%
Beverages, 10%
Fertilisers, 8%
South Africa’s agricultural exports to SSA
Others , 31%
Cattles, 6%
Beef, 4% Fish, 8%
Sugar cane, 11%
Malt beer, 9%
Food waste,
5%
Wood, 8%
Cotton, 8%
South Africa’s agricultural imports from SSA
48
Appendix 1 : Terms of reference
Cartography and study of the interventions of the emerging countries in the agricultural sector of Sub-Saharan Africa CIRAD is asked to coordinate this study, undertaking its own analysis, as well as oversee the work of four country-specific consultants and then integrate their findings in an overview report. CIRAD will do a mapping to analyze trade flows, official development assistance (ODA) and investments from China, Brazil, Argentina, South Africa , lndia and South Korea in the agricultural sector with Sub-Saharan African countries. Statistics indicating trends since the early 2000s will be used (COMTRADE sources (4 digit) for foreign trade. On ODA and investment, preferred sources will be specified for each emerging country because there is no single international source. Work of country consultants (separately contracted by CTA) will analyse the actions of China in the agricultural sector in four countries: Ethiopia, Senegal, Togo and Ivory Coast looking at: Micro 1 local scale from two major issues: employment and poverty :
- Perceptions of projects by local communities - The impacts of projects in terms of employment and income for local people Macroeconomie leve/:
- The implications of these projects on state budgets. We will analyze the financial conditions of the projects, the context in which they take place and its impact on state budgets. The issue of untying aid will also be addressed. - Impact of the project on agricultural policies in the countries concerned - Do agricultural projects of China generate structural change: effects on local diversification? Concerns of local processing of production, development of agribusiness? Changes in the distribution of value added? etc CIRAD Deliverables - Mapping of the interventions of the emerging countries in the agricultural sector of Sub-Saharan Africa - A policy brief - A consolidated report with the results of the actions of China in Ethiopia Senegal, Togo and Ivory Coast when reports coming from CTA will be available.
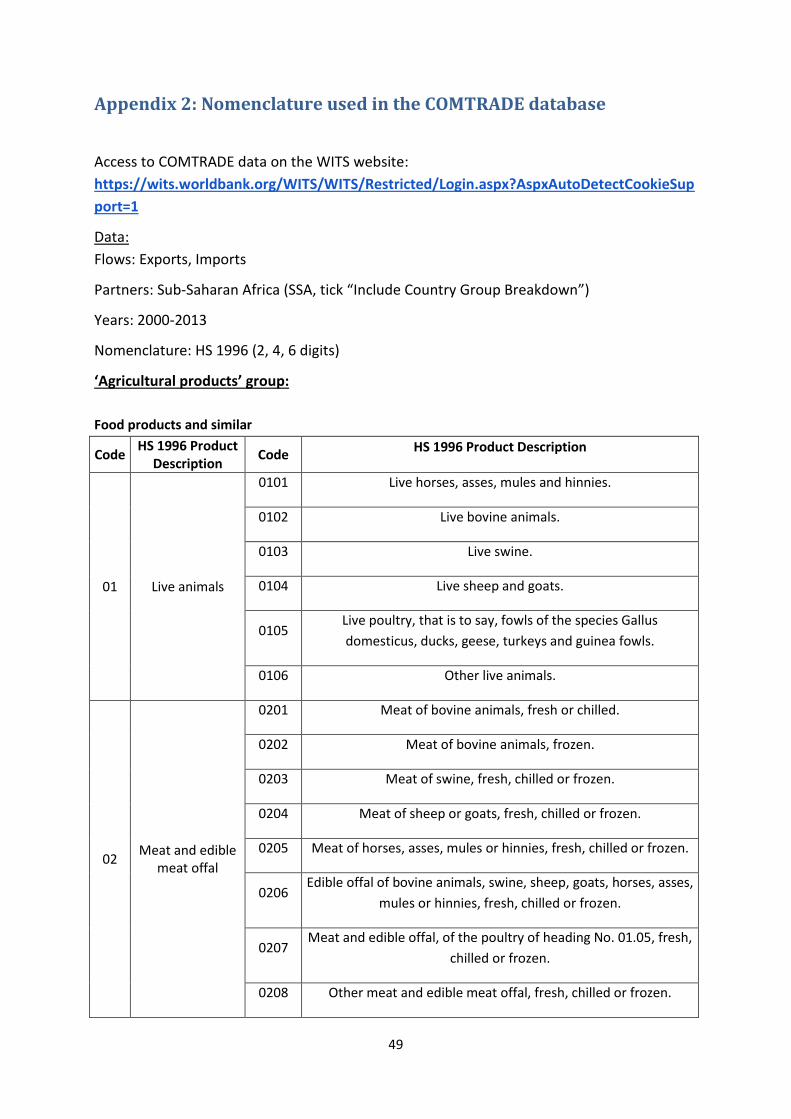
49
Appendix 2: Nomenclature used in the COMTRADE database
Access to COMTRADE data on the WITS website:
https://wits.worldbank.org/WITS/WITS/Restricted/Login.aspx?AspxAutoDetectCookieSup
port=1
Data:
Flows: Exports, Imports
Partners: Sub-Saharan Africa (SSA, tick “Include Country Group Breakdown”)
Years: 2000-2013
Nomenclature: HS 1996 (2, 4, 6 digits)
‘Agricultural products’ group:
Food products and similar
Code HS 1996 Product
Description Code
HS 1996 Product Description
01 Live animals
0101 Live horses, asses, mules and hinnies.
0102 Live bovine animals.
0103 Live swine.
0104 Live sheep and goats.
0105 Live poultry, that is to say, fowls of the species Gallus
domesticus, ducks, geese, turkeys and guinea fowls.
0106 Other live animals.
02 Meat and edible
meat offal
0201 Meat of bovine animals, fresh or chilled.
0202 Meat of bovine animals, frozen.
0203 Meat of swine, fresh, chilled or frozen.
0204 Meat of sheep or goats, fresh, chilled or frozen.
0205 Meat of horses, asses, mules or hinnies, fresh, chilled or frozen.
0206 Edible offal of bovine animals, swine, sheep, goats, horses, asses,
mules or hinnies, fresh, chilled or frozen.
0207 Meat and edible offal, of the poultry of heading No. 01.05, fresh,
chilled or frozen.
0208 Other meat and edible meat offal, fresh, chilled or frozen.
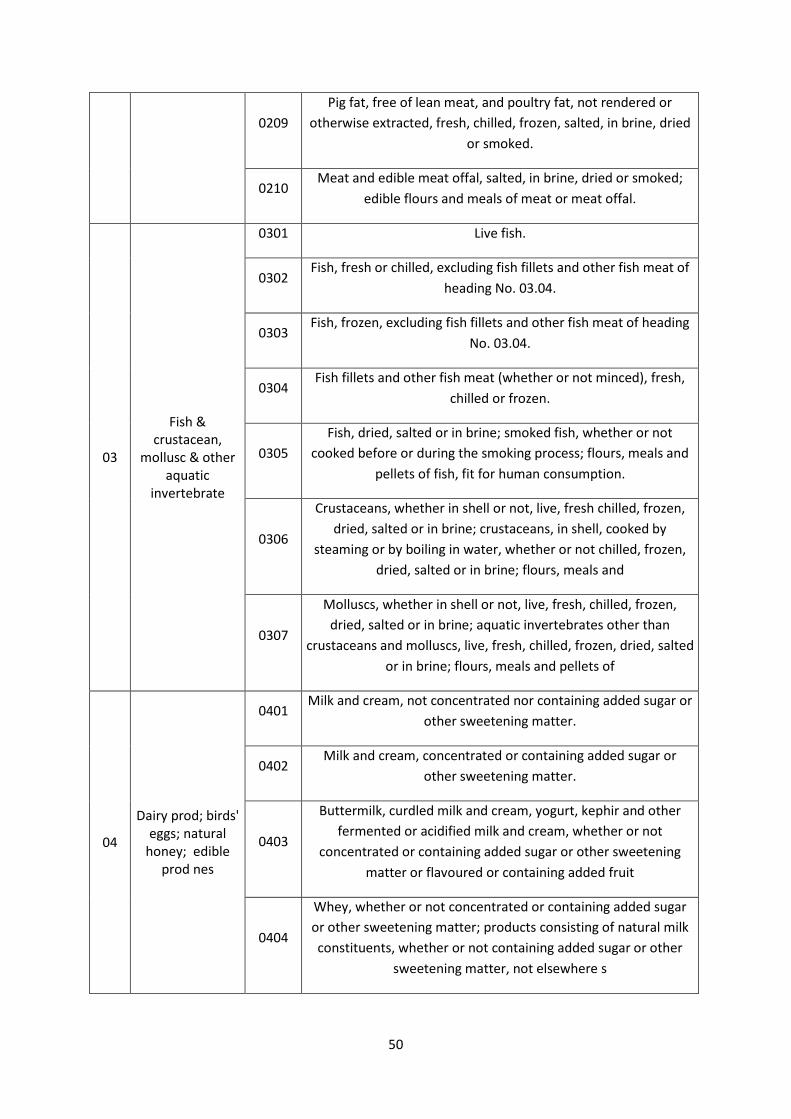
50
0209
Pig fat, free of lean meat, and poultry fat, not rendered or
otherwise extracted, fresh, chilled, frozen, salted, in brine, dried
or smoked.
0210 Meat and edible meat offal, salted, in brine, dried or smoked;
edible flours and meals of meat or meat offal.
03
Fish & crustacean,
mollusc & other aquatic
invertebrate
0301 Live fish.
0302 Fish, fresh or chilled, excluding fish fillets and other fish meat of
heading No. 03.04.
0303 Fish, frozen, excluding fish fillets and other fish meat of heading
No. 03.04.
0304 Fish fillets and other fish meat (whether or not minced), fresh,
chilled or frozen.
0305
Fish, dried, salted or in brine; smoked fish, whether or not
cooked before or during the smoking process; flours, meals and
pellets of fish, fit for human consumption.
0306
Crustaceans, whether in shell or not, live, fresh chilled, frozen,
dried, salted or in brine; crustaceans, in shell, cooked by
steaming or by boiling in water, whether or not chilled, frozen,
dried, salted or in brine; flours, meals and
0307
Molluscs, whether in shell or not, live, fresh, chilled, frozen,
dried, salted or in brine; aquatic invertebrates other than
crustaceans and molluscs, live, fresh, chilled, frozen, dried, salted
or in brine; flours, meals and pellets of
04
Dairy prod; birds' eggs; natural
honey; edible prod nes
0401 Milk and cream, not concentrated nor containing added sugar or
other sweetening matter.
0402 Milk and cream, concentrated or containing added sugar or
other sweetening matter.
0403
Buttermilk, curdled milk and cream, yogurt, kephir and other
fermented or acidified milk and cream, whether or not
concentrated or containing added sugar or other sweetening
matter or flavoured or containing added fruit
0404
Whey, whether or not concentrated or containing added sugar
or other sweetening matter; products consisting of natural milk
constituents, whether or not containing added sugar or other
sweetening matter, not elsewhere s
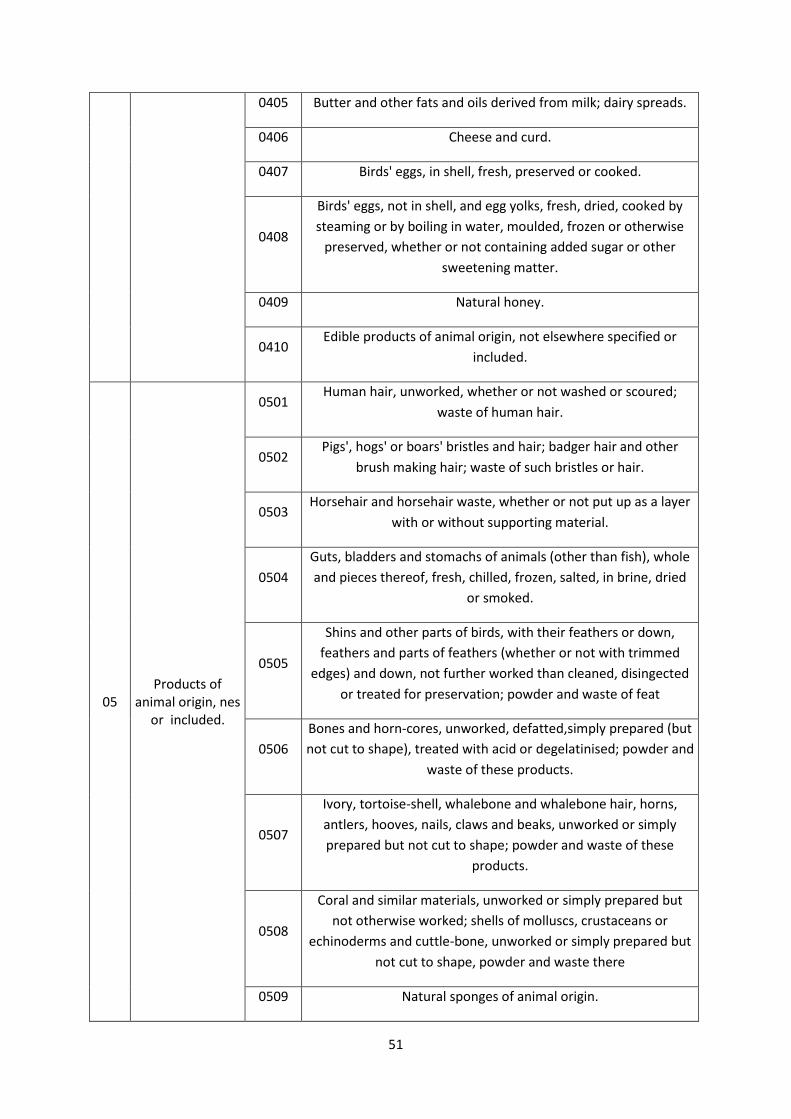
51
0405 Butter and other fats and oils derived from milk; dairy spreads.
0406 Cheese and curd.
0407 Birds' eggs, in shell, fresh, preserved or cooked.
0408
Birds' eggs, not in shell, and egg yolks, fresh, dried, cooked by
steaming or by boiling in water, moulded, frozen or otherwise
preserved, whether or not containing added sugar or other
sweetening matter.
0409 Natural honey.
0410 Edible products of animal origin, not elsewhere specified or
included.
05 Products of
animal origin, nes or included.
0501 Human hair, unworked, whether or not washed or scoured;
waste of human hair.
0502 Pigs', hogs' or boars' bristles and hair; badger hair and other
brush making hair; waste of such bristles or hair.
0503 Horsehair and horsehair waste, whether or not put up as a layer
with or without supporting material.
0504
Guts, bladders and stomachs of animals (other than fish), whole
and pieces thereof, fresh, chilled, frozen, salted, in brine, dried
or smoked.
0505
Shins and other parts of birds, with their feathers or down,
feathers and parts of feathers (whether or not with trimmed
edges) and down, not further worked than cleaned, disingected
or treated for preservation; powder and waste of feat
0506
Bones and horn-cores, unworked, defatted,simply prepared (but
not cut to shape), treated with acid or degelatinised; powder and
waste of these products.
0507
Ivory, tortoise-shell, whalebone and whalebone hair, horns,
antlers, hooves, nails, claws and beaks, unworked or simply
prepared but not cut to shape; powder and waste of these
products.
0508
Coral and similar materials, unworked or simply prepared but
not otherwise worked; shells of molluscs, crustaceans or
echinoderms and cuttle-bone, unworked or simply prepared but
not cut to shape, powder and waste there
0509 Natural sponges of animal origin.
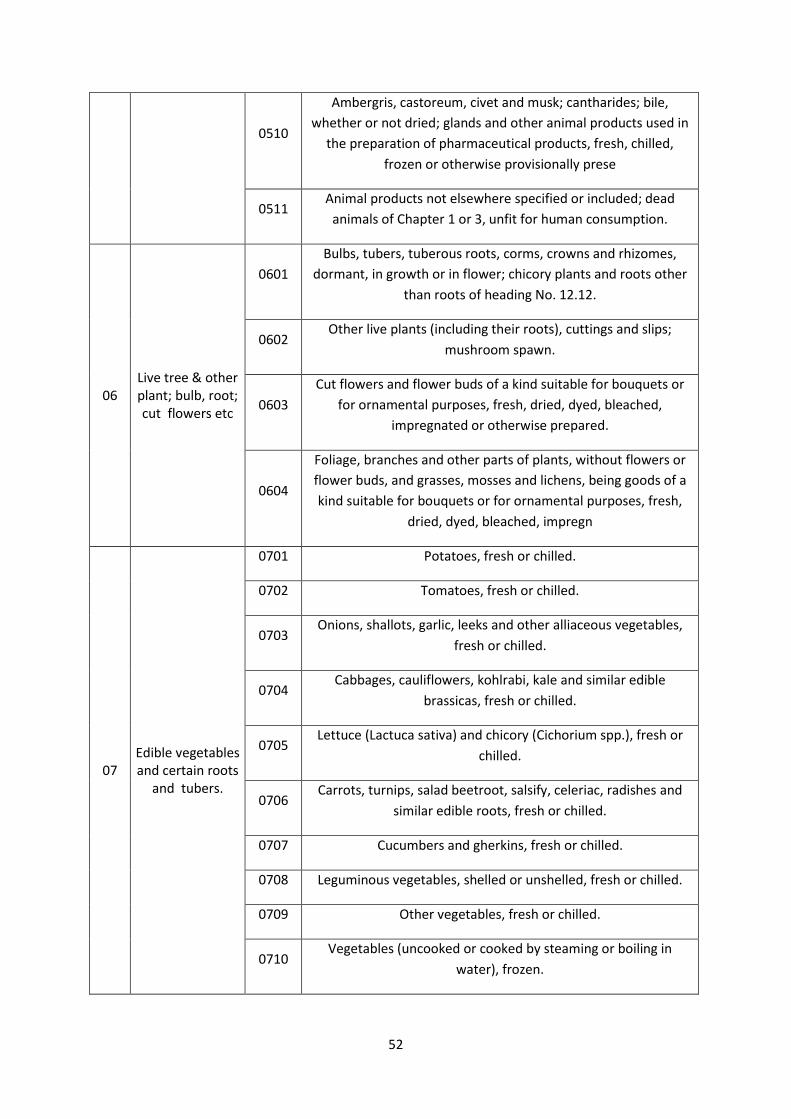
52
0510
Ambergris, castoreum, civet and musk; cantharides; bile,
whether or not dried; glands and other animal products used in
the preparation of pharmaceutical products, fresh, chilled,
frozen or otherwise provisionally prese
0511 Animal products not elsewhere specified or included; dead
animals of Chapter 1 or 3, unfit for human consumption.
06 Live tree & other plant; bulb, root; cut flowers etc
0601
Bulbs, tubers, tuberous roots, corms, crowns and rhizomes,
dormant, in growth or in flower; chicory plants and roots other
than roots of heading No. 12.12.
0602 Other live plants (including their roots), cuttings and slips;
mushroom spawn.
0603
Cut flowers and flower buds of a kind suitable for bouquets or
for ornamental purposes, fresh, dried, dyed, bleached,
impregnated or otherwise prepared.
0604
Foliage, branches and other parts of plants, without flowers or
flower buds, and grasses, mosses and lichens, being goods of a
kind suitable for bouquets or for ornamental purposes, fresh,
dried, dyed, bleached, impregn
07 Edible vegetables and certain roots
and tubers.
0701 Potatoes, fresh or chilled.
0702 Tomatoes, fresh or chilled.
0703 Onions, shallots, garlic, leeks and other alliaceous vegetables,
fresh or chilled.
0704 Cabbages, cauliflowers, kohlrabi, kale and similar edible
brassicas, fresh or chilled.
0705 Lettuce (Lactuca sativa) and chicory (Cichorium spp.), fresh or
chilled.
0706 Carrots, turnips, salad beetroot, salsify, celeriac, radishes and
similar edible roots, fresh or chilled.
0707 Cucumbers and gherkins, fresh or chilled.
0708 Leguminous vegetables, shelled or unshelled, fresh or chilled.
0709 Other vegetables, fresh or chilled.
0710 Vegetables (uncooked or cooked by steaming or boiling in
water), frozen.
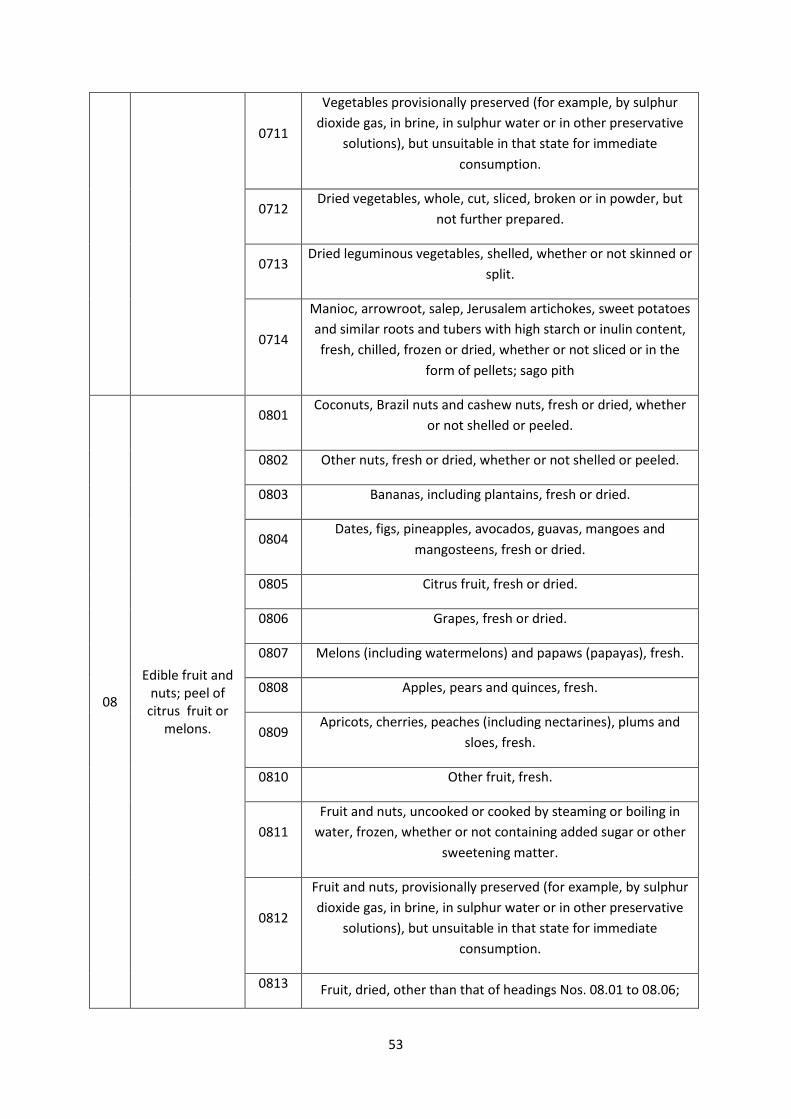
53
0711
Vegetables provisionally preserved (for example, by sulphur
dioxide gas, in brine, in sulphur water or in other preservative
solutions), but unsuitable in that state for immediate
consumption.
0712 Dried vegetables, whole, cut, sliced, broken or in powder, but
not further prepared.
0713 Dried leguminous vegetables, shelled, whether or not skinned or
split.
0714
Manioc, arrowroot, salep, Jerusalem artichokes, sweet potatoes
and similar roots and tubers with high starch or inulin content,
fresh, chilled, frozen or dried, whether or not sliced or in the
form of pellets; sago pith
08
Edible fruit and nuts; peel of
citrus fruit or melons.
0801 Coconuts, Brazil nuts and cashew nuts, fresh or dried, whether
or not shelled or peeled.
0802 Other nuts, fresh or dried, whether or not shelled or peeled.
0803 Bananas, including plantains, fresh or dried.
0804 Dates, figs, pineapples, avocados, guavas, mangoes and
mangosteens, fresh or dried.
0805 Citrus fruit, fresh or dried.
0806 Grapes, fresh or dried.
0807 Melons (including watermelons) and papaws (papayas), fresh.
0808 Apples, pears and quinces, fresh.
0809 Apricots, cherries, peaches (including nectarines), plums and
sloes, fresh.
0810 Other fruit, fresh.
0811
Fruit and nuts, uncooked or cooked by steaming or boiling in
water, frozen, whether or not containing added sugar or other
sweetening matter.
0812
Fruit and nuts, provisionally preserved (for example, by sulphur
dioxide gas, in brine, in sulphur water or in other preservative
solutions), but unsuitable in that state for immediate
consumption.
0813 Fruit, dried, other than that of headings Nos. 08.01 to 08.06;
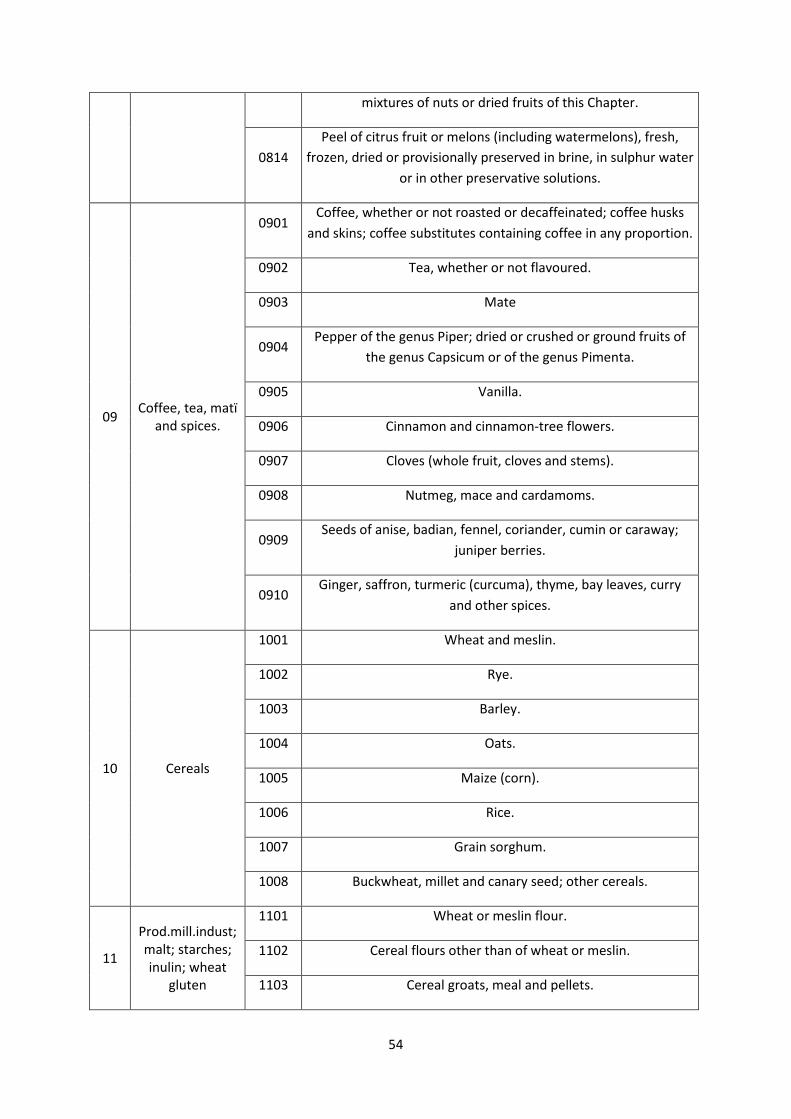
54
mixtures of nuts or dried fruits of this Chapter.
0814
Peel of citrus fruit or melons (including watermelons), fresh,
frozen, dried or provisionally preserved in brine, in sulphur water
or in other preservative solutions.
09 Coffee, tea, matï
and spices.
0901 Coffee, whether or not roasted or decaffeinated; coffee husks
and skins; coffee substitutes containing coffee in any proportion.
0902 Tea, whether or not flavoured.
0903 Mate
0904 Pepper of the genus Piper; dried or crushed or ground fruits of
the genus Capsicum or of the genus Pimenta.
0905 Vanilla.
0906 Cinnamon and cinnamon-tree flowers.
0907 Cloves (whole fruit, cloves and stems).
0908 Nutmeg, mace and cardamoms.
0909 Seeds of anise, badian, fennel, coriander, cumin or caraway;
juniper berries.
0910 Ginger, saffron, turmeric (curcuma), thyme, bay leaves, curry
and other spices.
10 Cereals
1001 Wheat and meslin.
1002 Rye.
1003 Barley.
1004 Oats.
1005 Maize (corn).
1006 Rice.
1007 Grain sorghum.
1008 Buckwheat, millet and canary seed; other cereals.
11
Prod.mill.indust; malt; starches; inulin; wheat
gluten
1101 Wheat or meslin flour.
1102 Cereal flours other than of wheat or meslin.
1103 Cereal groats, meal and pellets.
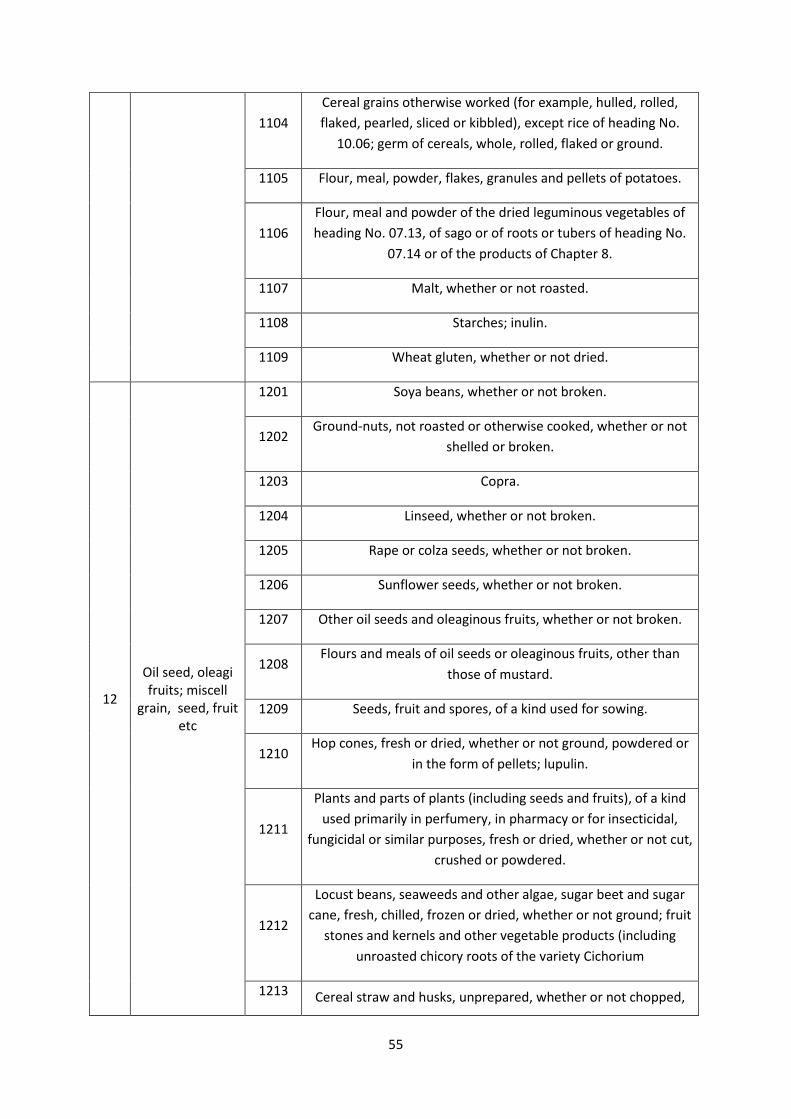
55
1104
Cereal grains otherwise worked (for example, hulled, rolled,
flaked, pearled, sliced or kibbled), except rice of heading No.
10.06; germ of cereals, whole, rolled, flaked or ground.
1105 Flour, meal, powder, flakes, granules and pellets of potatoes.
1106
Flour, meal and powder of the dried leguminous vegetables of
heading No. 07.13, of sago or of roots or tubers of heading No.
07.14 or of the products of Chapter 8.
1107 Malt, whether or not roasted.
1108 Starches; inulin.
1109 Wheat gluten, whether or not dried.
12
Oil seed, oleagi fruits; miscell
grain, seed, fruit etc
1201 Soya beans, whether or not broken.
1202 Ground-nuts, not roasted or otherwise cooked, whether or not
shelled or broken.
1203 Copra.
1204 Linseed, whether or not broken.
1205 Rape or colza seeds, whether or not broken.
1206 Sunflower seeds, whether or not broken.
1207 Other oil seeds and oleaginous fruits, whether or not broken.
1208 Flours and meals of oil seeds or oleaginous fruits, other than
those of mustard.
1209 Seeds, fruit and spores, of a kind used for sowing.
1210 Hop cones, fresh or dried, whether or not ground, powdered or
in the form of pellets; lupulin.
1211
Plants and parts of plants (including seeds and fruits), of a kind
used primarily in perfumery, in pharmacy or for insecticidal,
fungicidal or similar purposes, fresh or dried, whether or not cut,
crushed or powdered.
1212
Locust beans, seaweeds and other algae, sugar beet and sugar
cane, fresh, chilled, frozen or dried, whether or not ground; fruit
stones and kernels and other vegetable products (including
unroasted chicory roots of the variety Cichorium
1213 Cereal straw and husks, unprepared, whether or not chopped,
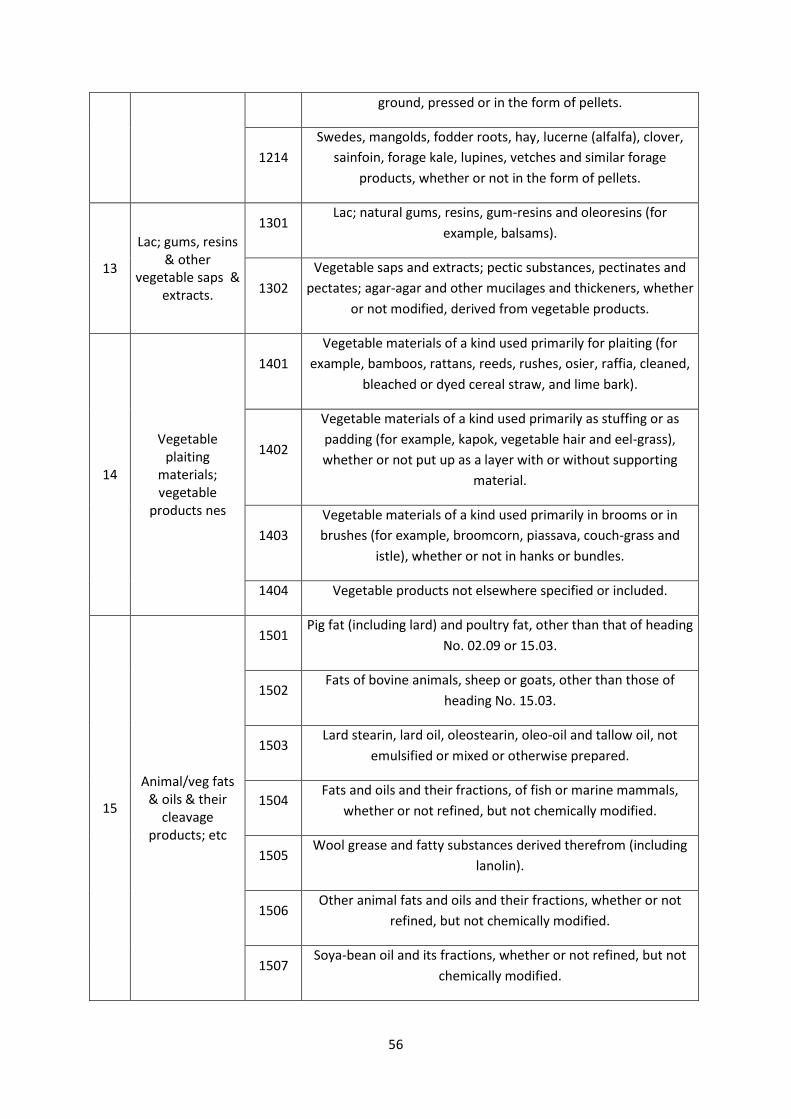
56
ground, pressed or in the form of pellets.
1214
Swedes, mangolds, fodder roots, hay, lucerne (alfalfa), clover,
sainfoin, forage kale, lupines, vetches and similar forage
products, whether or not in the form of pellets.
13
Lac; gums, resins & other
vegetable saps & extracts.
1301 Lac; natural gums, resins, gum-resins and oleoresins (for
example, balsams).
1302
Vegetable saps and extracts; pectic substances, pectinates and
pectates; agar-agar and other mucilages and thickeners, whether
or not modified, derived from vegetable products.
14
Vegetable plaiting
materials; vegetable
products nes
1401
Vegetable materials of a kind used primarily for plaiting (for
example, bamboos, rattans, reeds, rushes, osier, raffia, cleaned,
bleached or dyed cereal straw, and lime bark).
1402
Vegetable materials of a kind used primarily as stuffing or as
padding (for example, kapok, vegetable hair and eel-grass),
whether or not put up as a layer with or without supporting
material.
1403
Vegetable materials of a kind used primarily in brooms or in
brushes (for example, broomcorn, piassava, couch-grass and
istle), whether or not in hanks or bundles.
1404 Vegetable products not elsewhere specified or included.
15
Animal/veg fats & oils & their
cleavage products; etc
1501 Pig fat (including lard) and poultry fat, other than that of heading
No. 02.09 or 15.03.
1502 Fats of bovine animals, sheep or goats, other than those of
heading No. 15.03.
1503 Lard stearin, lard oil, oleostearin, oleo-oil and tallow oil, not
emulsified or mixed or otherwise prepared.
1504 Fats and oils and their fractions, of fish or marine mammals,
whether or not refined, but not chemically modified.
1505 Wool grease and fatty substances derived therefrom (including
lanolin).
1506 Other animal fats and oils and their fractions, whether or not
refined, but not chemically modified.
1507 Soya-bean oil and its fractions, whether or not refined, but not
chemically modified.
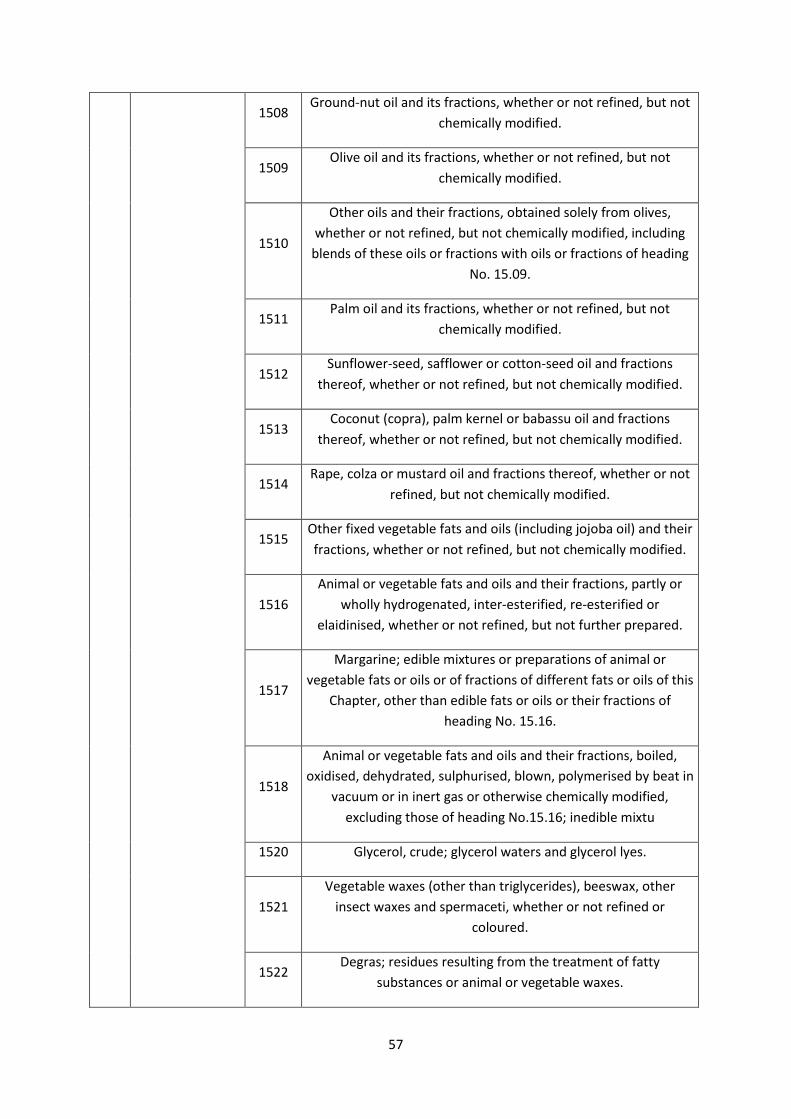
57
1508 Ground-nut oil and its fractions, whether or not refined, but not
chemically modified.
1509 Olive oil and its fractions, whether or not refined, but not
chemically modified.
1510
Other oils and their fractions, obtained solely from olives,
whether or not refined, but not chemically modified, including
blends of these oils or fractions with oils or fractions of heading
No. 15.09.
1511 Palm oil and its fractions, whether or not refined, but not
chemically modified.
1512 Sunflower-seed, safflower or cotton-seed oil and fractions
thereof, whether or not refined, but not chemically modified.
1513 Coconut (copra), palm kernel or babassu oil and fractions
thereof, whether or not refined, but not chemically modified.
1514 Rape, colza or mustard oil and fractions thereof, whether or not
refined, but not chemically modified.
1515 Other fixed vegetable fats and oils (including jojoba oil) and their
fractions, whether or not refined, but not chemically modified.
1516
Animal or vegetable fats and oils and their fractions, partly or
wholly hydrogenated, inter-esterified, re-esterified or
elaidinised, whether or not refined, but not further prepared.
1517
Margarine; edible mixtures or preparations of animal or
vegetable fats or oils or of fractions of different fats or oils of this
Chapter, other than edible fats or oils or their fractions of
heading No. 15.16.
1518
Animal or vegetable fats and oils and their fractions, boiled,
oxidised, dehydrated, sulphurised, blown, polymerised by beat in
vacuum or in inert gas or otherwise chemically modified,
excluding those of heading No.15.16; inedible mixtu
1520 Glycerol, crude; glycerol waters and glycerol lyes.
1521
Vegetable waxes (other than triglycerides), beeswax, other
insect waxes and spermaceti, whether or not refined or
coloured.
1522 Degras; residues resulting from the treatment of fatty
substances or animal or vegetable waxes.
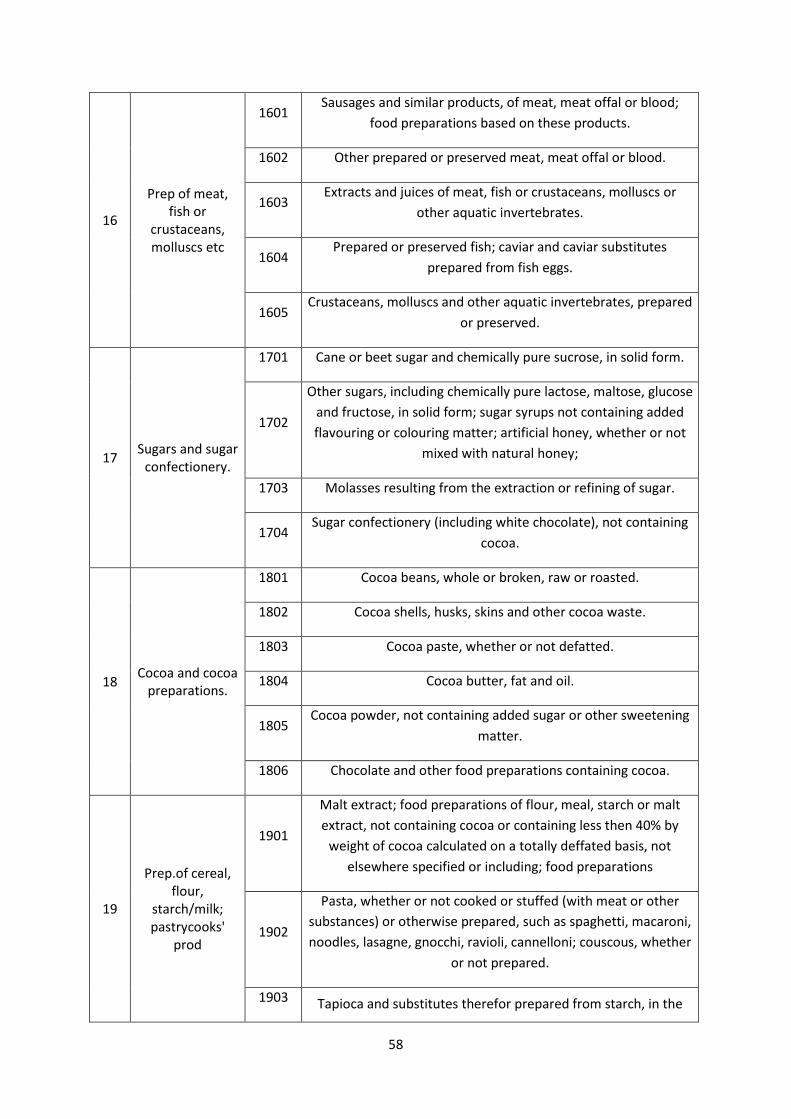
58
16
Prep of meat, fish or
crustaceans, molluscs etc
1601 Sausages and similar products, of meat, meat offal or blood;
food preparations based on these products.
1602 Other prepared or preserved meat, meat offal or blood.
1603 Extracts and juices of meat, fish or crustaceans, molluscs or
other aquatic invertebrates.
1604 Prepared or preserved fish; caviar and caviar substitutes
prepared from fish eggs.
1605 Crustaceans, molluscs and other aquatic invertebrates, prepared
or preserved.
17 Sugars and sugar
confectionery.
1701 Cane or beet sugar and chemically pure sucrose, in solid form.
1702
Other sugars, including chemically pure lactose, maltose, glucose
and fructose, in solid form; sugar syrups not containing added
flavouring or colouring matter; artificial honey, whether or not
mixed with natural honey;
1703 Molasses resulting from the extraction or refining of sugar.
1704 Sugar confectionery (including white chocolate), not containing
cocoa.
18 Cocoa and cocoa
preparations.
1801 Cocoa beans, whole or broken, raw or roasted.
1802 Cocoa shells, husks, skins and other cocoa waste.
1803 Cocoa paste, whether or not defatted.
1804 Cocoa butter, fat and oil.
1805 Cocoa powder, not containing added sugar or other sweetening
matter.
1806 Chocolate and other food preparations containing cocoa.
19
Prep.of cereal, flour,
starch/milk; pastrycooks'
prod
1901
Malt extract; food preparations of flour, meal, starch or malt
extract, not containing cocoa or containing less then 40% by
weight of cocoa calculated on a totally deffated basis, not
elsewhere specified or including; food preparations
1902
Pasta, whether or not cooked or stuffed (with meat or other
substances) or otherwise prepared, such as spaghetti, macaroni,
noodles, lasagne, gnocchi, ravioli, cannelloni; couscous, whether
or not prepared.
1903 Tapioca and substitutes therefor prepared from starch, in the
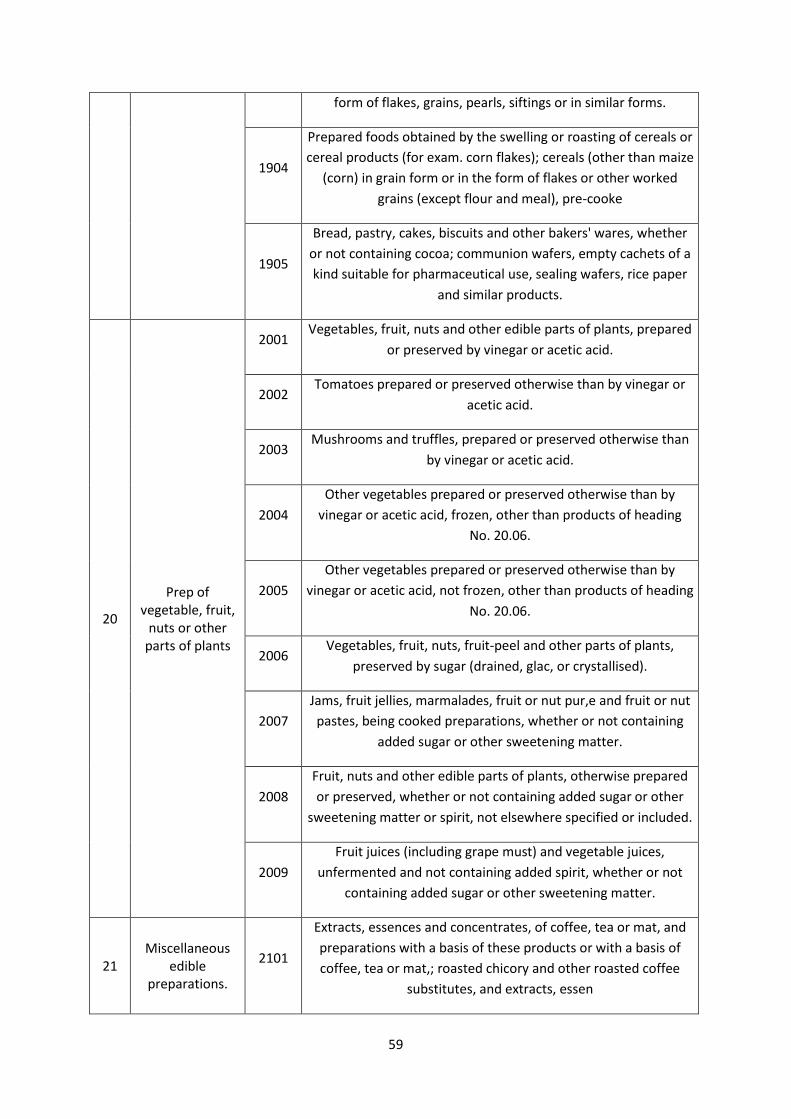
59
form of flakes, grains, pearls, siftings or in similar forms.
1904
Prepared foods obtained by the swelling or roasting of cereals or
cereal products (for exam. corn flakes); cereals (other than maize
(corn) in grain form or in the form of flakes or other worked
grains (except flour and meal), pre-cooke
1905
Bread, pastry, cakes, biscuits and other bakers' wares, whether
or not containing cocoa; communion wafers, empty cachets of a
kind suitable for pharmaceutical use, sealing wafers, rice paper
and similar products.
20
Prep of vegetable, fruit,
nuts or other parts of plants
2001 Vegetables, fruit, nuts and other edible parts of plants, prepared
or preserved by vinegar or acetic acid.
2002 Tomatoes prepared or preserved otherwise than by vinegar or
acetic acid.
2003 Mushrooms and truffles, prepared or preserved otherwise than
by vinegar or acetic acid.
2004
Other vegetables prepared or preserved otherwise than by
vinegar or acetic acid, frozen, other than products of heading
No. 20.06.
2005
Other vegetables prepared or preserved otherwise than by
vinegar or acetic acid, not frozen, other than products of heading
No. 20.06.
2006 Vegetables, fruit, nuts, fruit-peel and other parts of plants,
preserved by sugar (drained, glac‚ or crystallised).
2007
Jams, fruit jellies, marmalades, fruit or nut pur‚e and fruit or nut
pastes, being cooked preparations, whether or not containing
added sugar or other sweetening matter.
2008
Fruit, nuts and other edible parts of plants, otherwise prepared
or preserved, whether or not containing added sugar or other
sweetening matter or spirit, not elsewhere specified or included.
2009
Fruit juices (including grape must) and vegetable juices,
unfermented and not containing added spirit, whether or not
containing added sugar or other sweetening matter.
21 Miscellaneous
edible preparations.
2101
Extracts, essences and concentrates, of coffee, tea or mat‚ and
preparations with a basis of these products or with a basis of
coffee, tea or mat‚; roasted chicory and other roasted coffee
substitutes, and extracts, essen

60
2102
Yeasts (active or inactive); other single-cell micro-organisms,
dead (but not including vaccines of heading No 30.02); prepared
baking powders.
2103 Sauces and preparations therefor; mixed condiments and mixed
seasonings; mustard flour and meal and prepared mustard.
2104 Soups and broths and preparations therefor; homogenised
composite food preparations.
2105 Ice cream and other edible ice, whether or not containing cocoa.
2106 Food preparations not elsewhere specified or included.
22 Beverages, spirits
and vinegar.
2201
Waters, including natural or artificial mineral waters and aerated
waters, not containing added sugar or other sweetening matter
nor flavoured; ice and snow.
2202
Waters, including mineral waters and aerated waters, containing
added sugar or other sweetening matter or flavoured, and other
non-alcoholic beverages, not including fruit or vegetable juices
of heading No. 20.09.
2203 Beer made from malt.
2204 Wine of fresh grapes, including fortified wines; grape must other
than that of heading No. 20.09.
2205 Vermouth and other wine of fresh grapes flavoured with plants
or aromatic substances.
2206
Other fermented beverages (for example, cider, perry, mead);
mixtures of fermented beverages and mixtures of fermented
beverages and non-alcoholic beverages, not elsewhere specified
or included.
2207
Undenatured ethyl alcohol of an alcoholic strength by volume of
80 % vol or higher; ethyl alcohol and other spirits, denatured, of
any strength.
2208
Undenatured ethyl alcohol of an alcoholic strength by volume of
less than 80 % vol; spirits, liqueurs and other spirituous
beverages.
2209 Vinegar and substitutes for vinegar obtained from acetic acid.
23
Residues & waste from the food
indust; prepr ani fodder
2301
Flours, meals and pellets, of meat or meat offal, of fish or of
crustaceans, molluscs or other aquatic invertebrates, unfit for
human consumption; greaves.
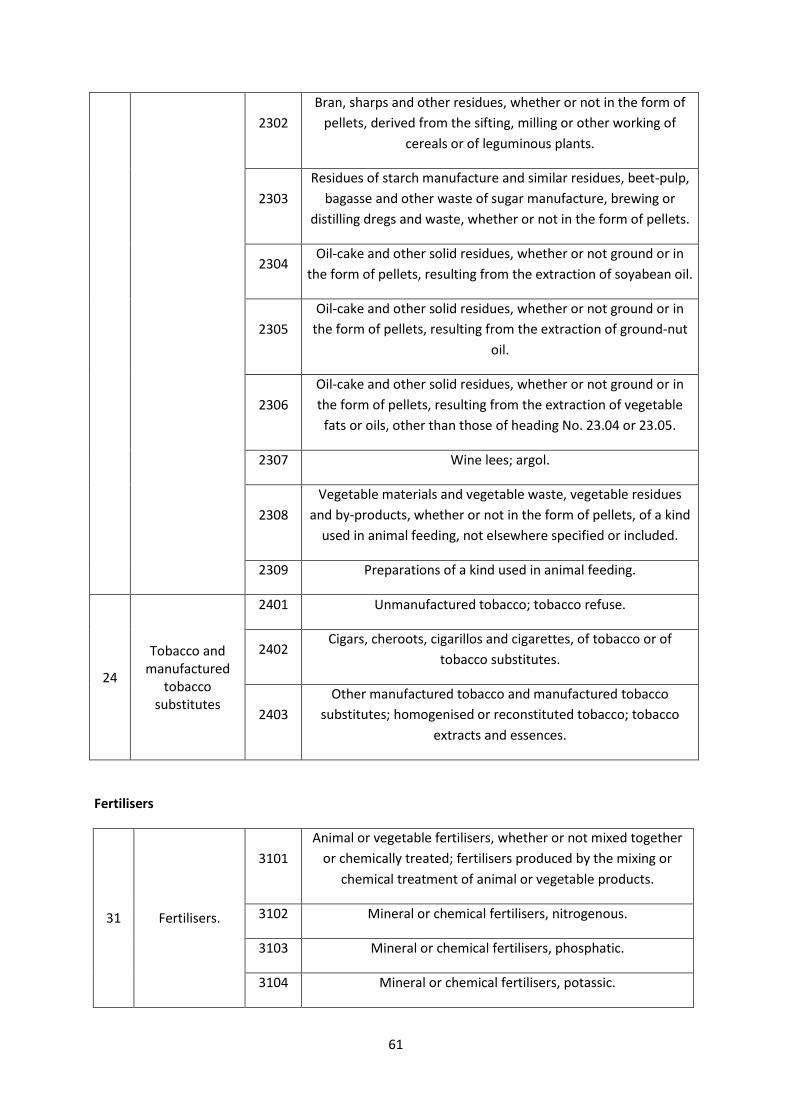
61
2302
Bran, sharps and other residues, whether or not in the form of
pellets, derived from the sifting, milling or other working of
cereals or of leguminous plants.
2303
Residues of starch manufacture and similar residues, beet-pulp,
bagasse and other waste of sugar manufacture, brewing or
distilling dregs and waste, whether or not in the form of pellets.
2304 Oil-cake and other solid residues, whether or not ground or in
the form of pellets, resulting from the extraction of soyabean oil.
2305
Oil-cake and other solid residues, whether or not ground or in
the form of pellets, resulting from the extraction of ground-nut
oil.
2306
Oil-cake and other solid residues, whether or not ground or in
the form of pellets, resulting from the extraction of vegetable
fats or oils, other than those of heading No. 23.04 or 23.05.
2307 Wine lees; argol.
2308
Vegetable materials and vegetable waste, vegetable residues
and by-products, whether or not in the form of pellets, of a kind
used in animal feeding, not elsewhere specified or included.
2309 Preparations of a kind used in animal feeding.
24
Tobacco and manufactured
tobacco substitutes
2401 Unmanufactured tobacco; tobacco refuse.
2402 Cigars, cheroots, cigarillos and cigarettes, of tobacco or of
tobacco substitutes.
2403
Other manufactured tobacco and manufactured tobacco
substitutes; homogenised or reconstituted tobacco; tobacco
extracts and essences.
Fertilisers
31 Fertilisers.
3101
Animal or vegetable fertilisers, whether or not mixed together
or chemically treated; fertilisers produced by the mixing or
chemical treatment of animal or vegetable products.
3102 Mineral or chemical fertilisers, nitrogenous.
3103 Mineral or chemical fertilisers, phosphatic.
3104 Mineral or chemical fertilisers, potassic.
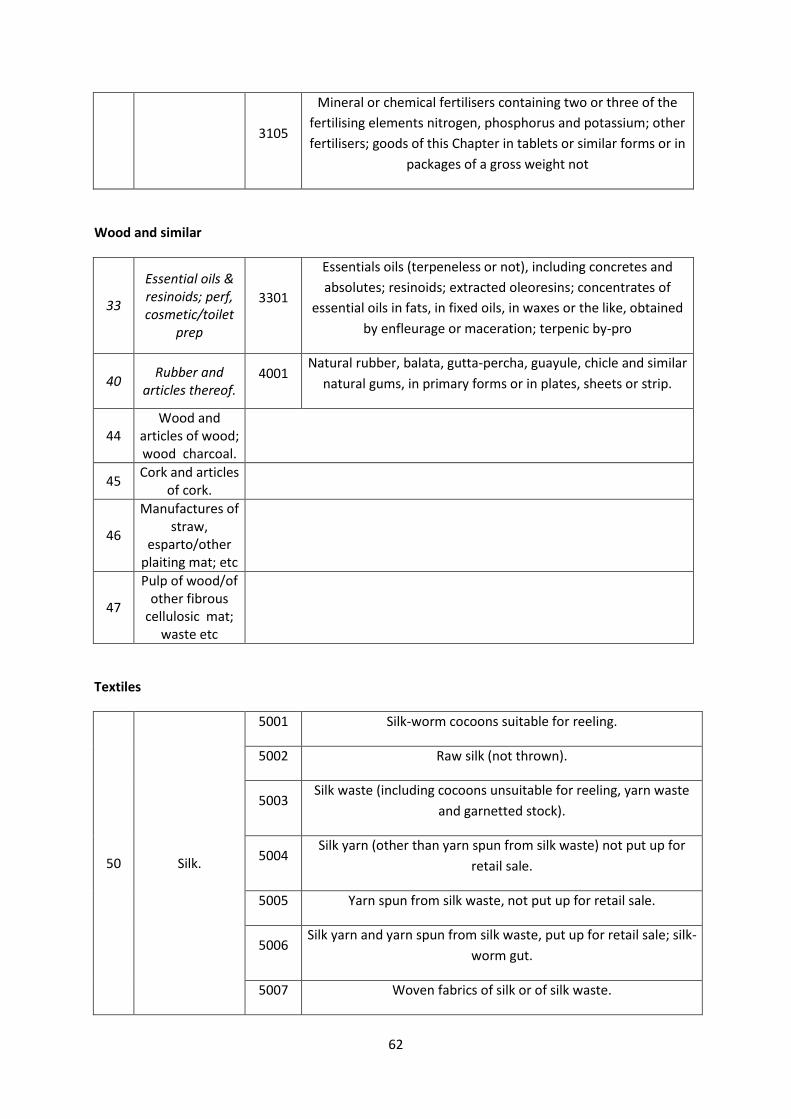
62
3105
Mineral or chemical fertilisers containing two or three of the
fertilising elements nitrogen, phosphorus and potassium; other
fertilisers; goods of this Chapter in tablets or similar forms or in
packages of a gross weight not
Wood and similar
33
Essential oils & resinoids; perf, cosmetic/toilet
prep
3301
Essentials oils (terpeneless or not), including concretes and
absolutes; resinoids; extracted oleoresins; concentrates of
essential oils in fats, in fixed oils, in waxes or the like, obtained
by enfleurage or maceration; terpenic by-pro
40 Rubber and
articles thereof. 4001
Natural rubber, balata, gutta-percha, guayule, chicle and similar
natural gums, in primary forms or in plates, sheets or strip.
44 Wood and
articles of wood; wood charcoal.
45 Cork and articles
of cork.
46
Manufactures of straw,
esparto/other plaiting mat; etc
47
Pulp of wood/of other fibrous
cellulosic mat; waste etc
Textiles
50 Silk.
5001 Silk-worm cocoons suitable for reeling.
5002 Raw silk (not thrown).
5003 Silk waste (including cocoons unsuitable for reeling, yarn waste
and garnetted stock).
5004 Silk yarn (other than yarn spun from silk waste) not put up for
retail sale.
5005 Yarn spun from silk waste, not put up for retail sale.
5006 Silk yarn and yarn spun from silk waste, put up for retail sale; silk-
worm gut.
5007 Woven fabrics of silk or of silk waste.
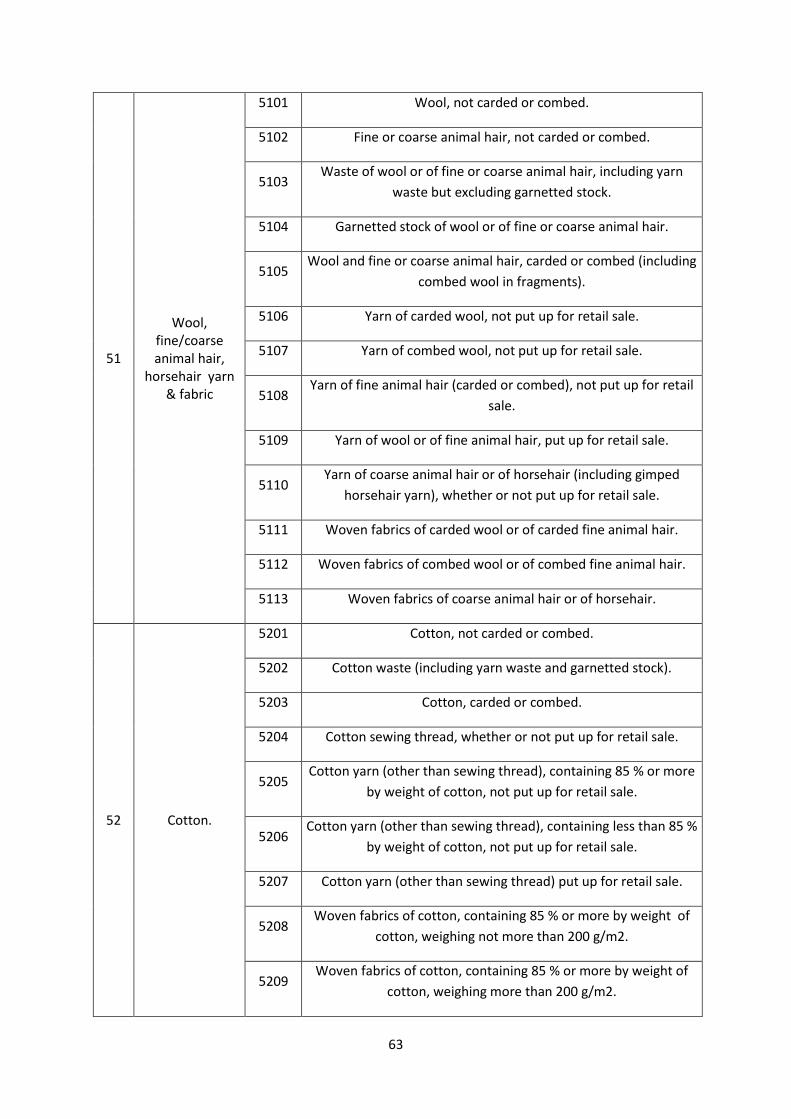
63
51
Wool, fine/coarse animal hair,
horsehair yarn & fabric
5101 Wool, not carded or combed.
5102 Fine or coarse animal hair, not carded or combed.
5103 Waste of wool or of fine or coarse animal hair, including yarn
waste but excluding garnetted stock.
5104 Garnetted stock of wool or of fine or coarse animal hair.
5105 Wool and fine or coarse animal hair, carded or combed (including
combed wool in fragments).
5106 Yarn of carded wool, not put up for retail sale.
5107 Yarn of combed wool, not put up for retail sale.
5108 Yarn of fine animal hair (carded or combed), not put up for retail
sale.
5109 Yarn of wool or of fine animal hair, put up for retail sale.
5110 Yarn of coarse animal hair or of horsehair (including gimped
horsehair yarn), whether or not put up for retail sale.
5111 Woven fabrics of carded wool or of carded fine animal hair.
5112 Woven fabrics of combed wool or of combed fine animal hair.
5113 Woven fabrics of coarse animal hair or of horsehair.
52 Cotton.
5201 Cotton, not carded or combed.
5202 Cotton waste (including yarn waste and garnetted stock).
5203 Cotton, carded or combed.
5204 Cotton sewing thread, whether or not put up for retail sale.
5205 Cotton yarn (other than sewing thread), containing 85 % or more
by weight of cotton, not put up for retail sale.
5206 Cotton yarn (other than sewing thread), containing less than 85 %
by weight of cotton, not put up for retail sale.
5207 Cotton yarn (other than sewing thread) put up for retail sale.
5208 Woven fabrics of cotton, containing 85 % or more by weight of
cotton, weighing not more than 200 g/m2.
5209 Woven fabrics of cotton, containing 85 % or more by weight of
cotton, weighing more than 200 g/m2.
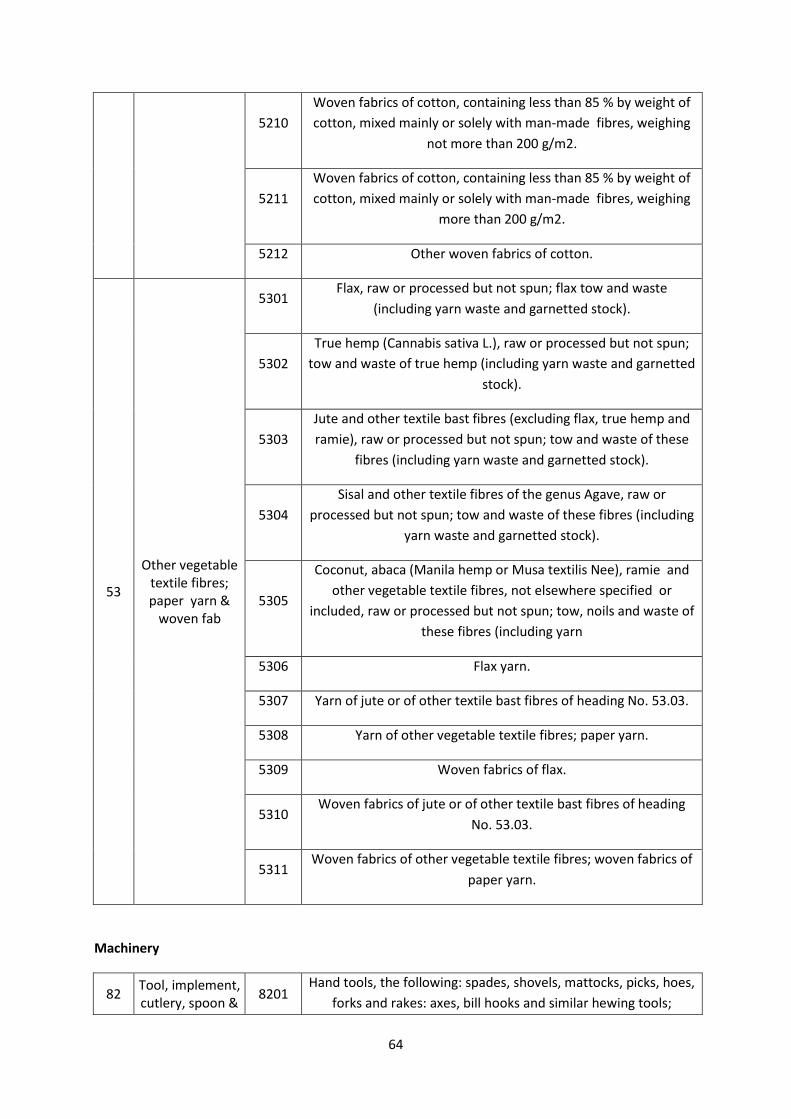
64
5210
Woven fabrics of cotton, containing less than 85 % by weight of
cotton, mixed mainly or solely with man-made fibres, weighing
not more than 200 g/m2.
5211
Woven fabrics of cotton, containing less than 85 % by weight of
cotton, mixed mainly or solely with man-made fibres, weighing
more than 200 g/m2.
5212 Other woven fabrics of cotton.
53
Other vegetable textile fibres; paper yarn &
woven fab
5301 Flax, raw or processed but not spun; flax tow and waste
(including yarn waste and garnetted stock).
5302
True hemp (Cannabis sativa L.), raw or processed but not spun;
tow and waste of true hemp (including yarn waste and garnetted
stock).
5303
Jute and other textile bast fibres (excluding flax, true hemp and
ramie), raw or processed but not spun; tow and waste of these
fibres (including yarn waste and garnetted stock).
5304
Sisal and other textile fibres of the genus Agave, raw or
processed but not spun; tow and waste of these fibres (including
yarn waste and garnetted stock).
5305
Coconut, abaca (Manila hemp or Musa textilis Nee), ramie and
other vegetable textile fibres, not elsewhere specified or
included, raw or processed but not spun; tow, noils and waste of
these fibres (including yarn
5306 Flax yarn.
5307 Yarn of jute or of other textile bast fibres of heading No. 53.03.
5308 Yarn of other vegetable textile fibres; paper yarn.
5309 Woven fabrics of flax.
5310 Woven fabrics of jute or of other textile bast fibres of heading
No. 53.03.
5311 Woven fabrics of other vegetable textile fibres; woven fabrics of
paper yarn.
Machinery
82 Tool, implement, cutlery, spoon &
8201 Hand tools, the following: spades, shovels, mattocks, picks, hoes,
forks and rakes: axes, bill hooks and similar hewing tools;
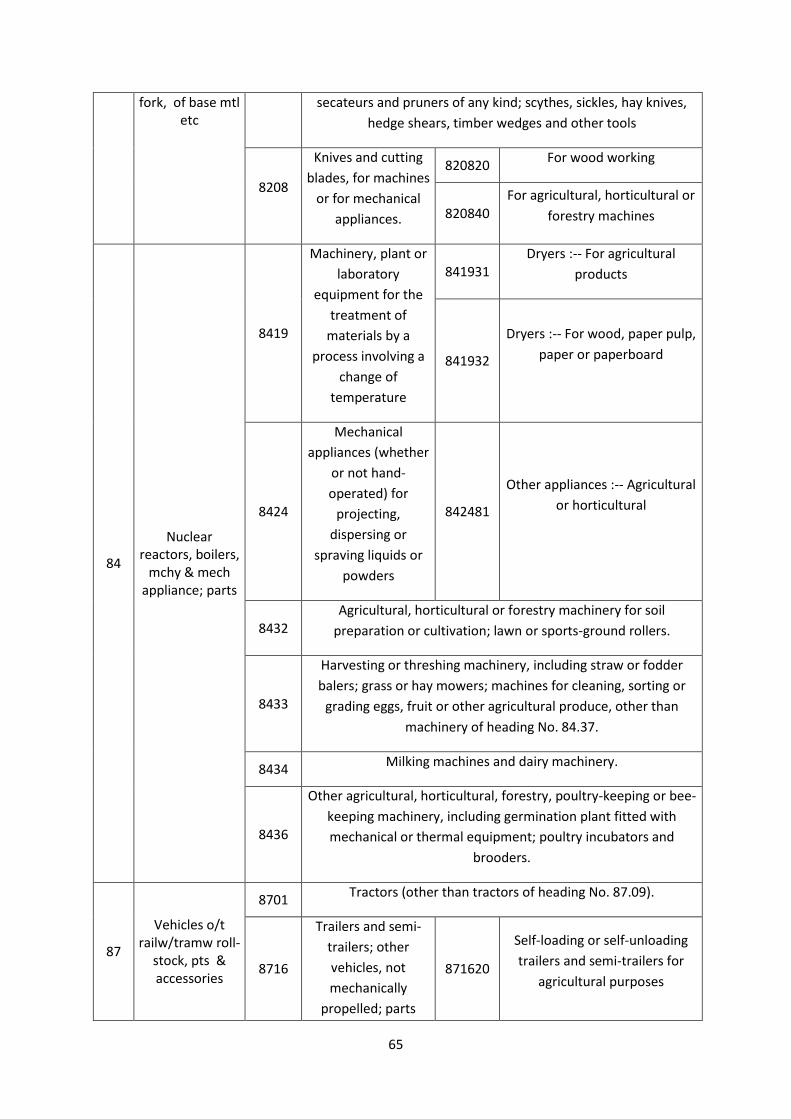
65
fork, of base mtl etc
secateurs and pruners of any kind; scythes, sickles, hay knives,
hedge shears, timber wedges and other tools
8208
Knives and cutting
blades, for machines
or for mechanical
appliances.
820820 For wood working
820840
For agricultural, horticultural or
forestry machines
84
Nuclear reactors, boilers,
mchy & mech appliance; parts
8419
Machinery, plant or
laboratory
equipment for the
treatment of
materials by a
process involving a
change of
temperature
841931 Dryers :-- For agricultural
products
841932
Dryers :-- For wood, paper pulp,
paper or paperboard
8424
Mechanical
appliances (whether
or not hand-
operated) for
projecting,
dispersing or
spraving liquids or
powders
842481
Other appliances :-- Agricultural
or horticultural
8432 Agricultural, horticultural or forestry machinery for soil
preparation or cultivation; lawn or sports-ground rollers.
8433
Harvesting or threshing machinery, including straw or fodder
balers; grass or hay mowers; machines for cleaning, sorting or
grading eggs, fruit or other agricultural produce, other than
machinery of heading No. 84.37.
8434 Milking machines and dairy machinery.
8436
Other agricultural, horticultural, forestry, poultry-keeping or bee-
keeping machinery, including germination plant fitted with
mechanical or thermal equipment; poultry incubators and
brooders.
87
Vehicles o/t railw/tramw roll-
stock, pts & accessories
8701 Tractors (other than tractors of heading No. 87.09).
8716
Trailers and semi-
trailers; other
vehicles, not
mechanically
propelled; parts
871620
Self-loading or self-unloading
trailers and semi-trailers for
agricultural purposes
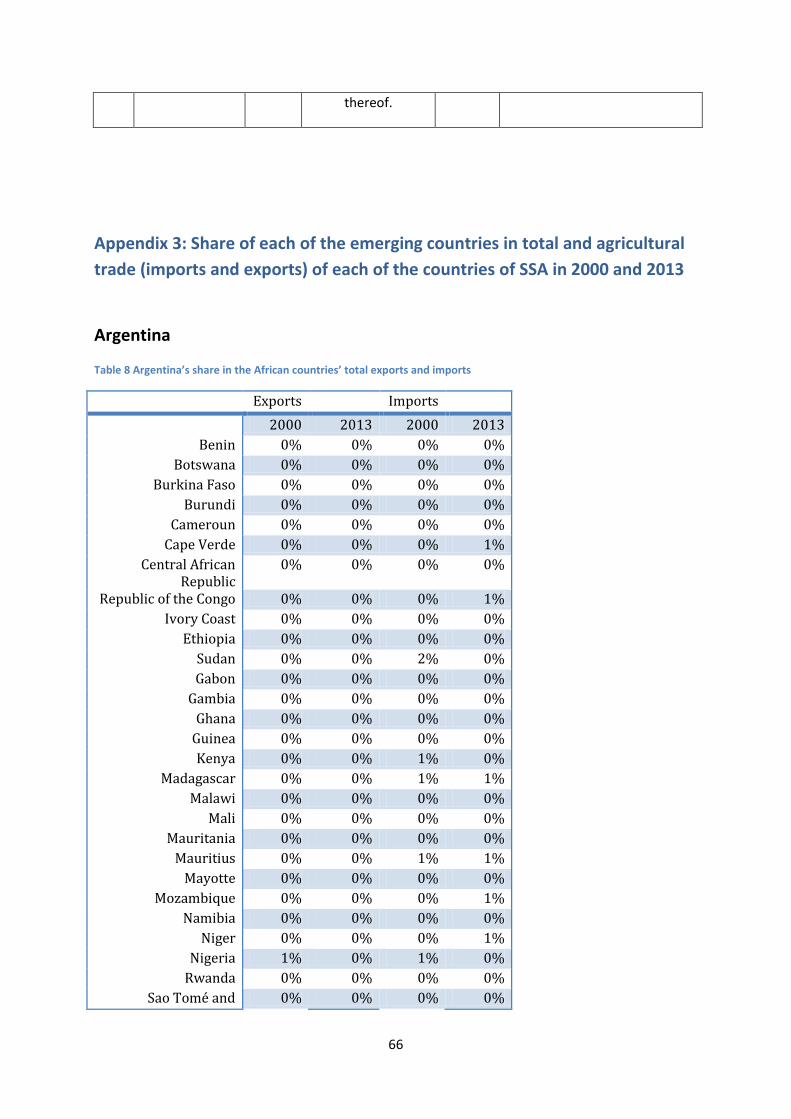
66
thereof.
Appendix 3: Share of each of the emerging countries in total and agricultural
trade (imports and exports) of each of the countries of SSA in 2000 and 2013
Argentina
Table 8 Argentina’s share in the African countries’ total exports and imports
Exports Imports
2000 2013 2000 2013
Benin 0% 0% 0% 0%
Botswana 0% 0% 0% 0%
Burkina Faso 0% 0% 0% 0%
Burundi 0% 0% 0% 0%
Cameroun 0% 0% 0% 0%
Cape Verde 0% 0% 0% 1%
Central African Republic
0% 0% 0% 0%
Republic of the Congo 0% 0% 0% 1%
Ivory Coast 0% 0% 0% 0%
Ethiopia 0% 0% 0% 0%
Sudan 0% 0% 2% 0%
Gabon 0% 0% 0% 0%
Gambia 0% 0% 0% 0%
Ghana 0% 0% 0% 0%
Guinea 0% 0% 0% 0%
Kenya 0% 0% 1% 0%
Madagascar 0% 0% 1% 1%
Malawi 0% 0% 0% 0%
Mali 0% 0% 0% 0%
Mauritania 0% 0% 0% 0%
Mauritius 0% 0% 1% 1%
Mayotte 0% 0% 0% 0%
Mozambique 0% 0% 0% 1%
Namibia 0% 0% 0% 0%
Niger 0% 0% 0% 1%
Nigeria 1% 0% 1% 0%
Rwanda 0% 0% 0% 0%
Sao Tomé and 0% 0% 0% 0%
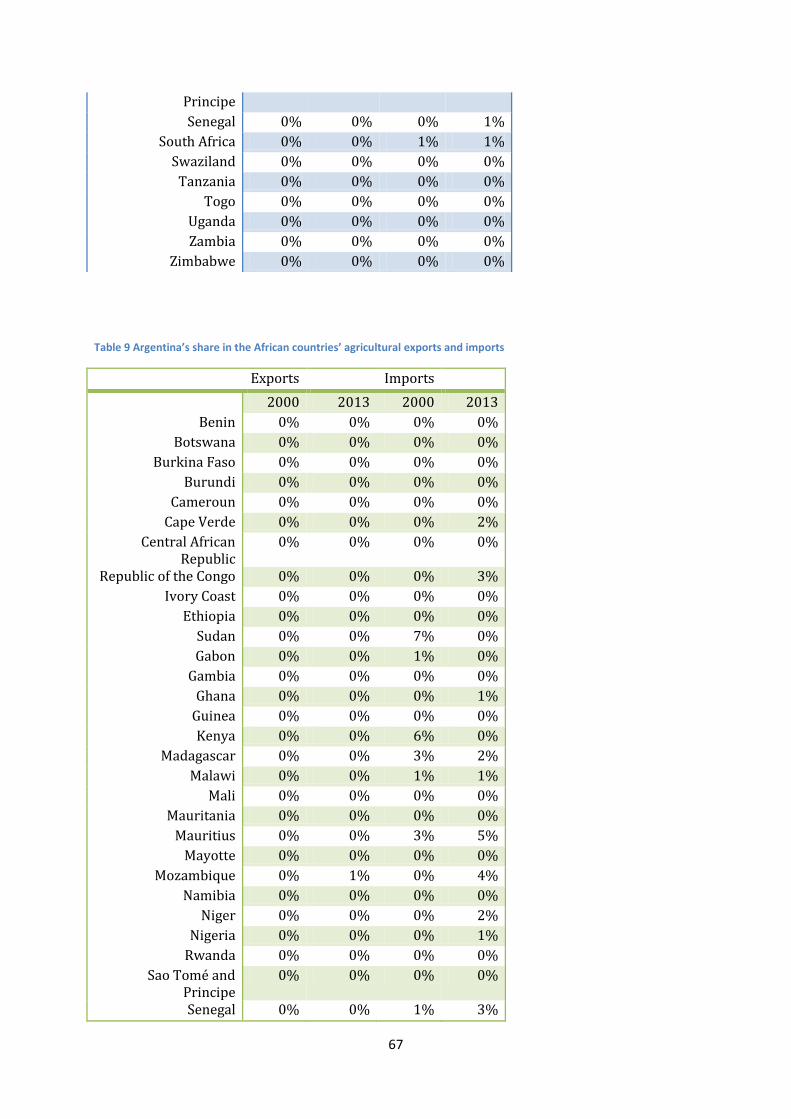
67
Principe
Senegal 0% 0% 0% 1%
South Africa 0% 0% 1% 1%
Swaziland 0% 0% 0% 0%
Tanzania 0% 0% 0% 0%
Togo 0% 0% 0% 0%
Uganda 0% 0% 0% 0%
Zambia 0% 0% 0% 0%
Zimbabwe 0% 0% 0% 0%
Table 9 Argentina’s share in the African countries’ agricultural exports and imports
Exports Imports
2000 2013 2000 2013
Benin 0% 0% 0% 0%
Botswana 0% 0% 0% 0%
Burkina Faso 0% 0% 0% 0%
Burundi 0% 0% 0% 0%
Cameroun 0% 0% 0% 0%
Cape Verde 0% 0% 0% 2%
Central African Republic
0% 0% 0% 0%
Republic of the Congo 0% 0% 0% 3%
Ivory Coast 0% 0% 0% 0%
Ethiopia 0% 0% 0% 0%
Sudan 0% 0% 7% 0%
Gabon 0% 0% 1% 0%
Gambia 0% 0% 0% 0%
Ghana 0% 0% 0% 1%
Guinea 0% 0% 0% 0%
Kenya 0% 0% 6% 0%
Madagascar 0% 0% 3% 2%
Malawi 0% 0% 1% 1%
Mali 0% 0% 0% 0%
Mauritania 0% 0% 0% 0%
Mauritius 0% 0% 3% 5%
Mayotte 0% 0% 0% 0%
Mozambique 0% 1% 0% 4%
Namibia 0% 0% 0% 0%
Niger 0% 0% 0% 2%
Nigeria 0% 0% 0% 1%
Rwanda 0% 0% 0% 0%
Sao Tomé and Principe
0% 0% 0% 0%
Senegal 0% 0% 1% 3%
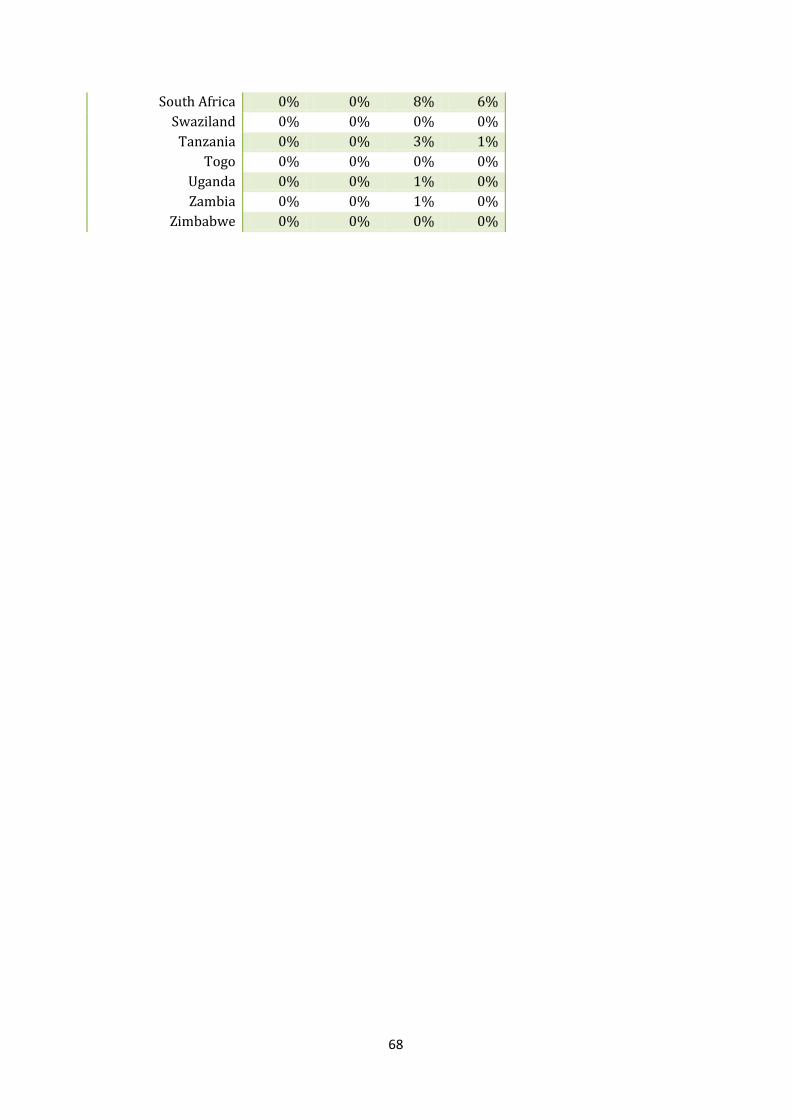
68
South Africa 0% 0% 8% 6%
Swaziland 0% 0% 0% 0%
Tanzania 0% 0% 3% 1%
Togo 0% 0% 0% 0%
Uganda 0% 0% 1% 0%
Zambia 0% 0% 1% 0%
Zimbabwe 0% 0% 0% 0%
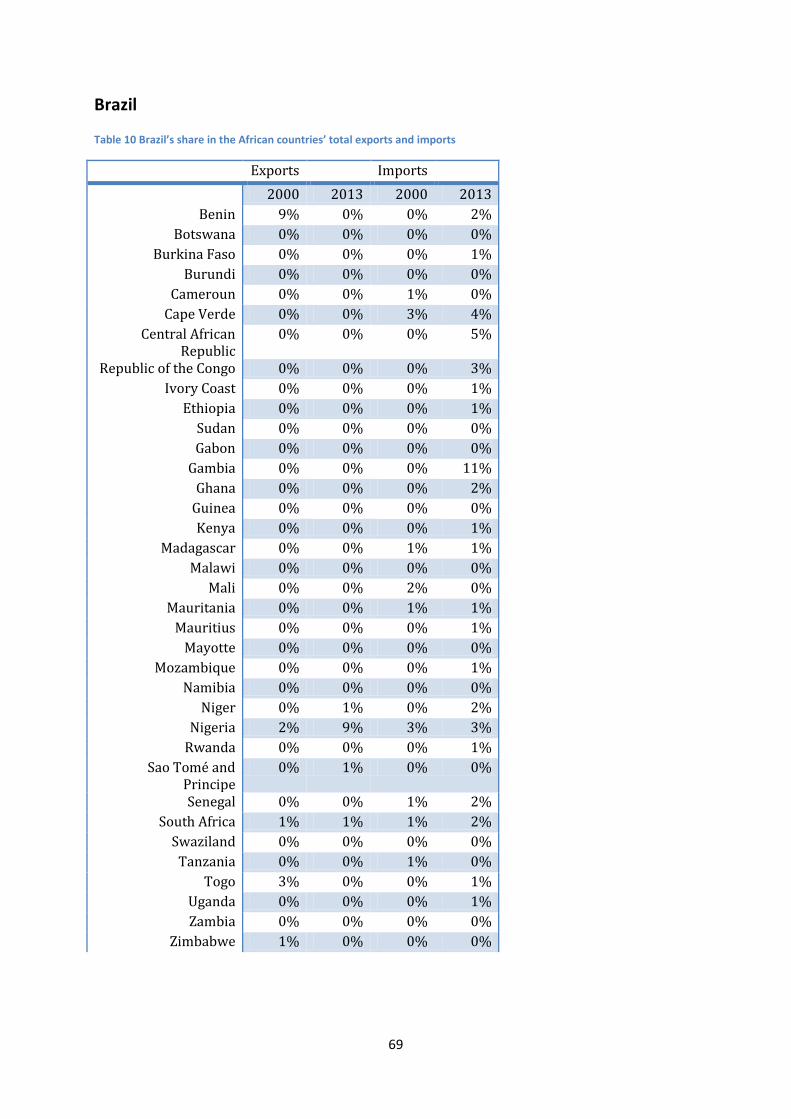
69
Brazil
Table 10 Brazil’s share in the African countries’ total exports and imports
Exports Imports
2000 2013 2000 2013
Benin 9% 0% 0% 2%
Botswana 0% 0% 0% 0%
Burkina Faso 0% 0% 0% 1%
Burundi 0% 0% 0% 0%
Cameroun 0% 0% 1% 0%
Cape Verde 0% 0% 3% 4%
Central African Republic
0% 0% 0% 5%
Republic of the Congo 0% 0% 0% 3%
Ivory Coast 0% 0% 0% 1%
Ethiopia 0% 0% 0% 1%
Sudan 0% 0% 0% 0%
Gabon 0% 0% 0% 0%
Gambia 0% 0% 0% 11%
Ghana 0% 0% 0% 2%
Guinea 0% 0% 0% 0%
Kenya 0% 0% 0% 1%
Madagascar 0% 0% 1% 1%
Malawi 0% 0% 0% 0%
Mali 0% 0% 2% 0%
Mauritania 0% 0% 1% 1%
Mauritius 0% 0% 0% 1%
Mayotte 0% 0% 0% 0%
Mozambique 0% 0% 0% 1%
Namibia 0% 0% 0% 0%
Niger 0% 1% 0% 2%
Nigeria 2% 9% 3% 3%
Rwanda 0% 0% 0% 1%
Sao Tomé and Principe
0% 1% 0% 0%
Senegal 0% 0% 1% 2%
South Africa 1% 1% 1% 2%
Swaziland 0% 0% 0% 0%
Tanzania 0% 0% 1% 0%
Togo 3% 0% 0% 1%
Uganda 0% 0% 0% 1%
Zambia 0% 0% 0% 0%
Zimbabwe 1% 0% 0% 0%
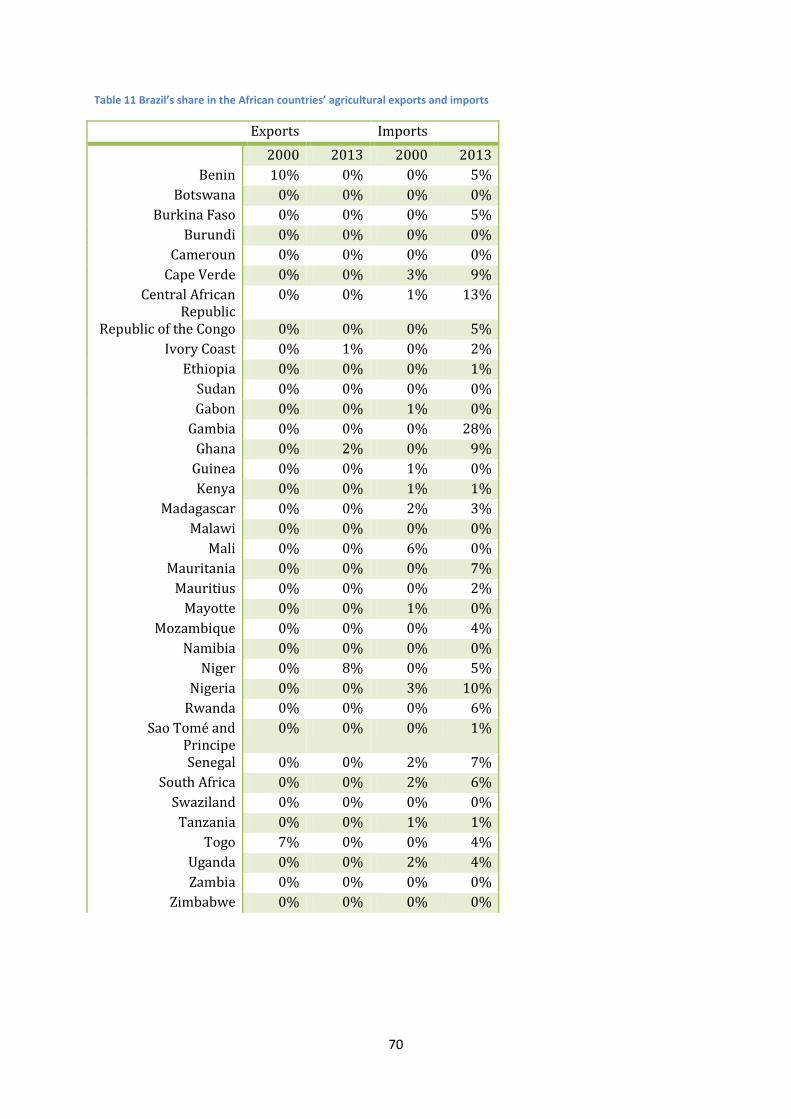
70
Table 11 Brazil’s share in the African countries’ agricultural exports and imports
Exports Imports
2000 2013 2000 2013
Benin 10% 0% 0% 5%
Botswana 0% 0% 0% 0%
Burkina Faso 0% 0% 0% 5%
Burundi 0% 0% 0% 0%
Cameroun 0% 0% 0% 0%
Cape Verde 0% 0% 3% 9%
Central African Republic
0% 0% 1% 13%
Republic of the Congo 0% 0% 0% 5%
Ivory Coast 0% 1% 0% 2%
Ethiopia 0% 0% 0% 1%
Sudan 0% 0% 0% 0%
Gabon 0% 0% 1% 0%
Gambia 0% 0% 0% 28%
Ghana 0% 2% 0% 9%
Guinea 0% 0% 1% 0%
Kenya 0% 0% 1% 1%
Madagascar 0% 0% 2% 3%
Malawi 0% 0% 0% 0%
Mali 0% 0% 6% 0%
Mauritania 0% 0% 0% 7%
Mauritius 0% 0% 0% 2%
Mayotte 0% 0% 1% 0%
Mozambique 0% 0% 0% 4%
Namibia 0% 0% 0% 0%
Niger 0% 8% 0% 5%
Nigeria 0% 0% 3% 10%
Rwanda 0% 0% 0% 6%
Sao Tomé and Principe
0% 0% 0% 1%
Senegal 0% 0% 2% 7%
South Africa 0% 0% 2% 6%
Swaziland 0% 0% 0% 0%
Tanzania 0% 0% 1% 1%
Togo 7% 0% 0% 4%
Uganda 0% 0% 2% 4%
Zambia 0% 0% 0% 0%
Zimbabwe 0% 0% 0% 0%
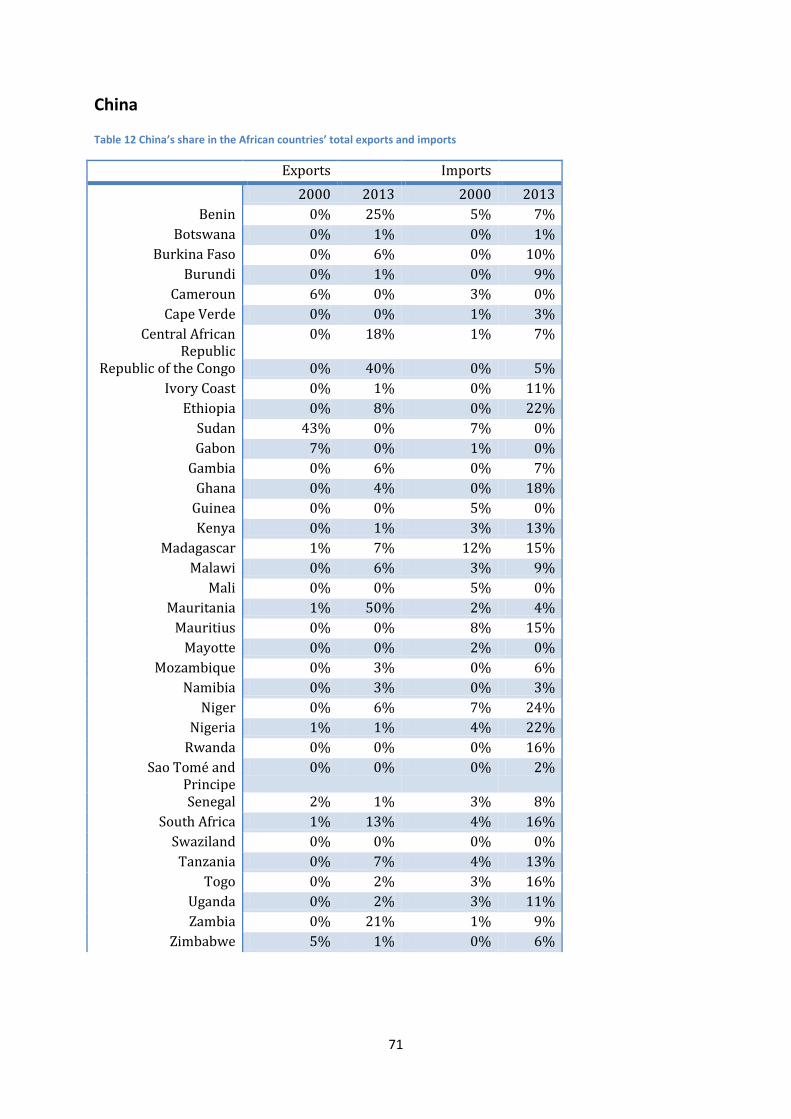
71
China
Table 12 China’s share in the African countries’ total exports and imports
Exports Imports
2000 2013 2000 2013
Benin 0% 25% 5% 7%
Botswana 0% 1% 0% 1%
Burkina Faso 0% 6% 0% 10%
Burundi 0% 1% 0% 9%
Cameroun 6% 0% 3% 0%
Cape Verde 0% 0% 1% 3%
Central African Republic
0% 18% 1% 7%
Republic of the Congo 0% 40% 0% 5%
Ivory Coast 0% 1% 0% 11%
Ethiopia 0% 8% 0% 22%
Sudan 43% 0% 7% 0%
Gabon 7% 0% 1% 0%
Gambia 0% 6% 0% 7%
Ghana 0% 4% 0% 18%
Guinea 0% 0% 5% 0%
Kenya 0% 1% 3% 13%
Madagascar 1% 7% 12% 15%
Malawi 0% 6% 3% 9%
Mali 0% 0% 5% 0%
Mauritania 1% 50% 2% 4%
Mauritius 0% 0% 8% 15%
Mayotte 0% 0% 2% 0%
Mozambique 0% 3% 0% 6%
Namibia 0% 3% 0% 3%
Niger 0% 6% 7% 24%
Nigeria 1% 1% 4% 22%
Rwanda 0% 0% 0% 16%
Sao Tomé and Principe
0% 0% 0% 2%
Senegal 2% 1% 3% 8%
South Africa 1% 13% 4% 16%
Swaziland 0% 0% 0% 0%
Tanzania 0% 7% 4% 13%
Togo 0% 2% 3% 16%
Uganda 0% 2% 3% 11%
Zambia 0% 21% 1% 9%
Zimbabwe 5% 1% 0% 6%

72
Table 13 China’s share in the African countries’ agricultural exports and imports
Exports Imports
2000 2013 2000 2013
Benin 0% 27% 10% 3%
Botswana 0% 0% 0% 1%
Burkina Faso 0% 18% 0% 4%
Burundi 0% 0% 0% 6%
Cameroun 2% 0% 7% 0%
Cape Verde 0% 0% 0% 0%
Central African Republic
0% 40% 1% 1%
Republic of the Congo 0% 53% 0% 5%
Ivory Coast 0% 2% 0% 5%
Ethiopia 0% 9% 0% 8%
Sudan 0% 0% 1% 0%
Gabon 36% 0% 0% 0%
Gambia 0% 6% 0% 3%
Ghana 0% 4% 0% 7%
Guinea 0% 0% 8% 0%
Kenya 0% 1% 1% 6%
Madagascar 2% 3% 26% 13%
Malawi 0% 7% 1% 8%
Mali 0% 0% 8% 0%
Mauritania 2% 9% 4% 7%
Mauritius 0% 0% 11% 10%
Mayotte 0% 0% 0% 0%
Mozambique 0% 10% 0% 3%
Namibia 0% 0% 0% 1%
Niger 0% 3% 12% 5%
Nigeria 0% 1% 1% 10%
Rwanda 0% 0% 0% 5%
Sao Tomé and Principe
0% 0% 0% 0%
Senegal 3% 2% 5% 4%
South Africa 1% 4% 3% 7%
Swaziland 0% 0% 0% 0%
Tanzania 0% 10% 7% 8%
Togo 0% 6% 2% 15%
Uganda 0% 1% 3% 5%
Zambia 0% 5% 0% 6%
Zimbabwe 7% 0% 0% 1%
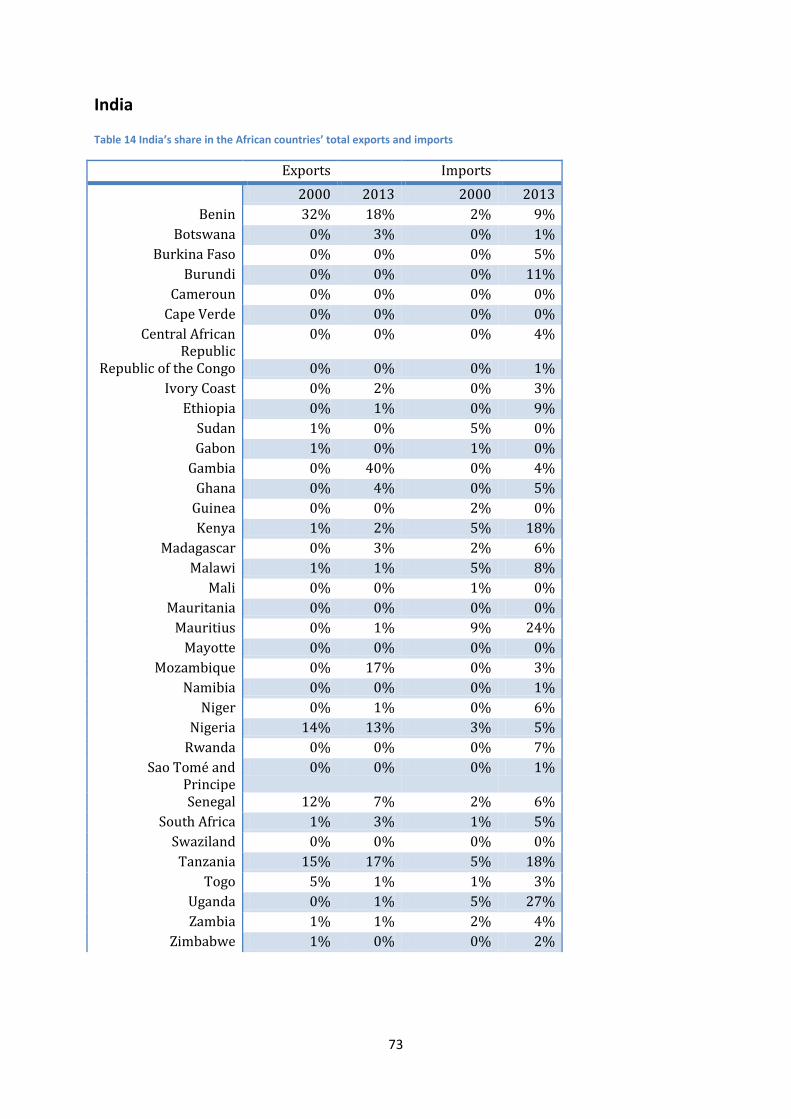
73
India
Table 14 India’s share in the African countries’ total exports and imports
Exports Imports
2000 2013 2000 2013
Benin 32% 18% 2% 9%
Botswana 0% 3% 0% 1%
Burkina Faso 0% 0% 0% 5%
Burundi 0% 0% 0% 11%
Cameroun 0% 0% 0% 0%
Cape Verde 0% 0% 0% 0%
Central African Republic
0% 0% 0% 4%
Republic of the Congo 0% 0% 0% 1%
Ivory Coast 0% 2% 0% 3%
Ethiopia 0% 1% 0% 9%
Sudan 1% 0% 5% 0%
Gabon 1% 0% 1% 0%
Gambia 0% 40% 0% 4%
Ghana 0% 4% 0% 5%
Guinea 0% 0% 2% 0%
Kenya 1% 2% 5% 18%
Madagascar 0% 3% 2% 6%
Malawi 1% 1% 5% 8%
Mali 0% 0% 1% 0%
Mauritania 0% 0% 0% 0%
Mauritius 0% 1% 9% 24%
Mayotte 0% 0% 0% 0%
Mozambique 0% 17% 0% 3%
Namibia 0% 0% 0% 1%
Niger 0% 1% 0% 6%
Nigeria 14% 13% 3% 5%
Rwanda 0% 0% 0% 7%
Sao Tomé and Principe
0% 0% 0% 1%
Senegal 12% 7% 2% 6%
South Africa 1% 3% 1% 5%
Swaziland 0% 0% 0% 0%
Tanzania 15% 17% 5% 18%
Togo 5% 1% 1% 3%
Uganda 0% 1% 5% 27%
Zambia 1% 1% 2% 4%
Zimbabwe 1% 0% 0% 2%
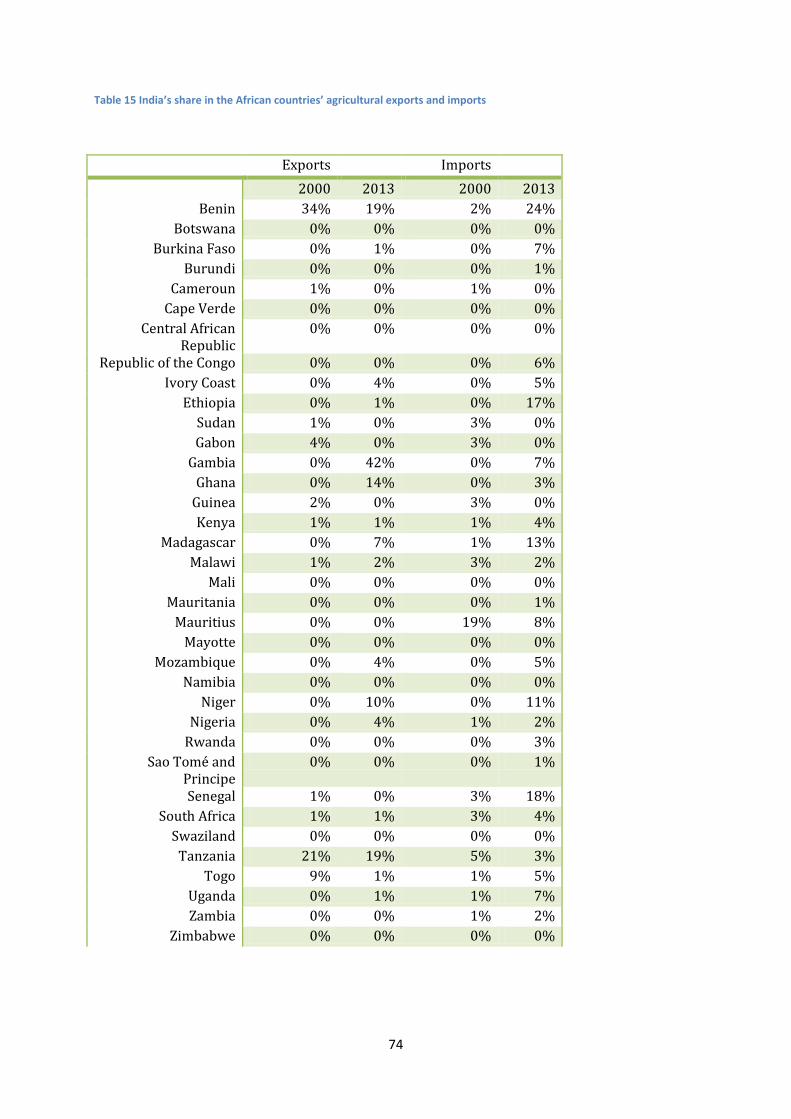
74
Table 15 India’s share in the African countries’ agricultural exports and imports
Exports Imports
2000 2013 2000 2013
Benin 34% 19% 2% 24%
Botswana 0% 0% 0% 0%
Burkina Faso 0% 1% 0% 7%
Burundi 0% 0% 0% 1%
Cameroun 1% 0% 1% 0%
Cape Verde 0% 0% 0% 0%
Central African Republic
0% 0% 0% 0%
Republic of the Congo 0% 0% 0% 6%
Ivory Coast 0% 4% 0% 5%
Ethiopia 0% 1% 0% 17%
Sudan 1% 0% 3% 0%
Gabon 4% 0% 3% 0%
Gambia 0% 42% 0% 7%
Ghana 0% 14% 0% 3%
Guinea 2% 0% 3% 0%
Kenya 1% 1% 1% 4%
Madagascar 0% 7% 1% 13%
Malawi 1% 2% 3% 2%
Mali 0% 0% 0% 0%
Mauritania 0% 0% 0% 1%
Mauritius 0% 0% 19% 8%
Mayotte 0% 0% 0% 0%
Mozambique 0% 4% 0% 5%
Namibia 0% 0% 0% 0%
Niger 0% 10% 0% 11%
Nigeria 0% 4% 1% 2%
Rwanda 0% 0% 0% 3%
Sao Tomé and Principe
0% 0% 0% 1%
Senegal 1% 0% 3% 18%
South Africa 1% 1% 3% 4%
Swaziland 0% 0% 0% 0%
Tanzania 21% 19% 5% 3%
Togo 9% 1% 1% 5%
Uganda 0% 1% 1% 7%
Zambia 0% 0% 1% 2%
Zimbabwe 0% 0% 0% 0%

75
South Korea
Table 16 South Korea’s share in the African countries’ total exports and imports
Exports Imports
2000 2013 2000 2013
Benin 0% 0% 0% 0%
Botswana 0% 0% 0% 0%
Burkina Faso 0% 0% 0% 0%
Burundi 0% 0% 0% 0%
Cameroun 0% 0% 0% 0%
Cape Verde 0% 0% 0% 0%
Central African Republic
0% 0% 0% 0%
Republic of the Congo 0% 0% 0% 0%
Ivory Coast 0% 0% 0% 0%
Ethiopia 0% 0% 0% 0%
Sudan 0% 0% 0% 0%
Gabon 2% 0% 0% 0%
Gambia 0% 0% 0% 0%
Ghana 0% 0% 0% 0%
Guinea 0% 0% 0% 0%
Kenya 0% 0% 0% 0%
Madagascar 0% 0% 0% 0%
Malawi 0% 0% 0% 0%
Mali 0% 0% 0% 0%
Mauritania 0% 0% 0% 0%
Mauritius 0% 0% 0% 0%
Mayotte 0% 0% 0% 0%
Mozambique 0% 0% 0% 0%
Namibia 0% 0% 0% 0%
Niger 0% 0% 0% 0%
Nigeria 0% 0% 0% 0%
Rwanda 0% 0% 0% 0%
Sao Tomé and Principe
0% 0% 0% 0%
Senegal 0% 0% 0% 0%
South Africa 0% 0% 0% 0%
Swaziland 0% 0% 0% 0%
Tanzania 0% 0% 0% 0%
Togo 0% 0% 0% 0%
Uganda 0% 0% 0% 0%
Zambia 0% 0% 0% 0%
Zimbabwe 0% 0% 0% 0%

76
Table 17 South Korea’s share in the African countries’ agricultural exports and imports
Exports Imports
2000 2013 2000 2013
Benin 0% 0% 0% 0%
Botswana 0% 0% 0% 0%
Burkina Faso 0% 0% 0% 0%
Burundi 0% 0% 0% 0%
Cameroun 0% 0% 0% 0%
Cape Verde 0% 0% 0% 0%
Central African Republic
0% 0% 0% 0%
Republic of the Congo 0% 0% 0% 0%
Ivory Coast 0% 0% 0% 0%
Ethiopia 0% 0% 0% 0%
Sudan 0% 0% 0% 0%
Gabon 0% 0% 0% 0%
Gambia 0% 0% 0% 0%
Ghana 0% 0% 0% 0%
Guinea 0% 0% 0% 0%
Kenya 0% 0% 0% 0%
Madagascar 0% 0% 0% 0%
Malawi 0% 0% 0% 0%
Mali 0% 0% 0% 0%
Mauritania 0% 0% 0% 0%
Mauritius 0% 0% 0% 0%
Mayotte 0% 0% 0% 0%
Mozambique 0% 0% 0% 0%
Namibia 0% 0% 0% 0%
Niger 0% 0% 0% 0%
Nigeria 0% 0% 0% 0%
Rwanda 0% 0% 0% 0%
Sao Tomé and Principe
0% 0% 0% 0%
Senegal 0% 0% 0% 0%
South Africa 0% 0% 0% 0%
Swaziland 0% 0% 0% 0%
Tanzania 0% 0% 0% 0%
Togo 0% 0% 0% 0%
Uganda 0% 0% 0% 0%
Zambia 0% 0% 0% 0%
Zimbabwe 0% 0% 0% 0%
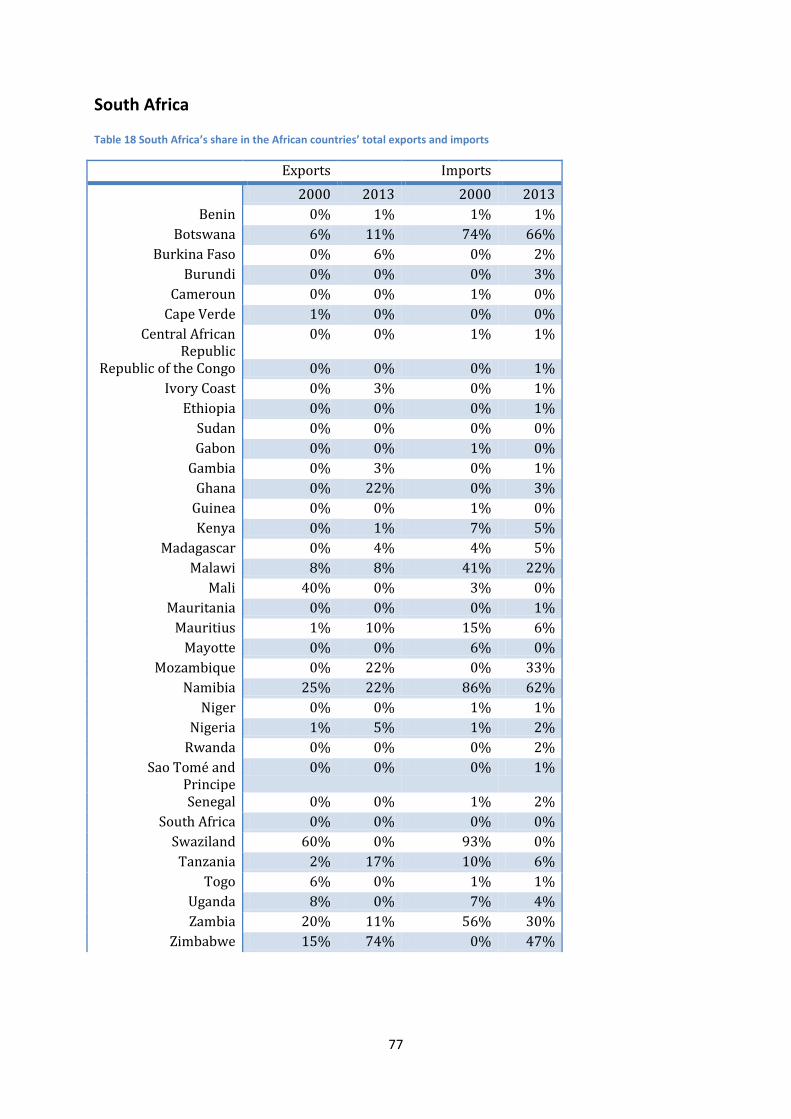
77
South Africa
Table 18 South Africa’s share in the African countries’ total exports and imports
Exports Imports
2000 2013 2000 2013
Benin 0% 1% 1% 1%
Botswana 6% 11% 74% 66%
Burkina Faso 0% 6% 0% 2%
Burundi 0% 0% 0% 3%
Cameroun 0% 0% 1% 0%
Cape Verde 1% 0% 0% 0%
Central African Republic
0% 0% 1% 1%
Republic of the Congo 0% 0% 0% 1%
Ivory Coast 0% 3% 0% 1%
Ethiopia 0% 0% 0% 1%
Sudan 0% 0% 0% 0%
Gabon 0% 0% 1% 0%
Gambia 0% 3% 0% 1%
Ghana 0% 22% 0% 3%
Guinea 0% 0% 1% 0%
Kenya 0% 1% 7% 5%
Madagascar 0% 4% 4% 5%
Malawi 8% 8% 41% 22%
Mali 40% 0% 3% 0%
Mauritania 0% 0% 0% 1%
Mauritius 1% 10% 15% 6%
Mayotte 0% 0% 6% 0%
Mozambique 0% 22% 0% 33%
Namibia 25% 22% 86% 62%
Niger 0% 0% 1% 1%
Nigeria 1% 5% 1% 2%
Rwanda 0% 0% 0% 2%
Sao Tomé and Principe
0% 0% 0% 1%
Senegal 0% 0% 1% 2%
South Africa 0% 0% 0% 0%
Swaziland 60% 0% 93% 0%
Tanzania 2% 17% 10% 6%
Togo 6% 0% 1% 1%
Uganda 8% 0% 7% 4%
Zambia 20% 11% 56% 30%
Zimbabwe 15% 74% 0% 47%
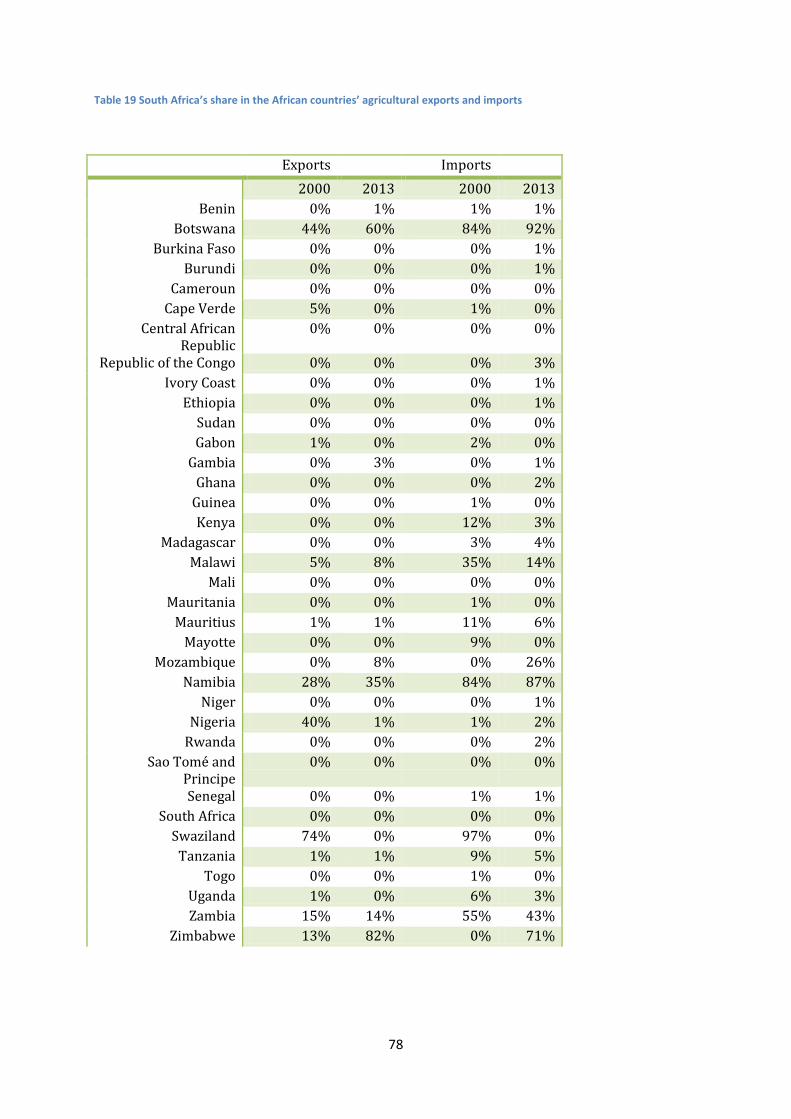
78
Table 19 South Africa’s share in the African countries’ agricultural exports and imports
Exports Imports
2000 2013 2000 2013
Benin 0% 1% 1% 1%
Botswana 44% 60% 84% 92%
Burkina Faso 0% 0% 0% 1%
Burundi 0% 0% 0% 1%
Cameroun 0% 0% 0% 0%
Cape Verde 5% 0% 1% 0%
Central African Republic
0% 0% 0% 0%
Republic of the Congo 0% 0% 0% 3%
Ivory Coast 0% 0% 0% 1%
Ethiopia 0% 0% 0% 1%
Sudan 0% 0% 0% 0%
Gabon 1% 0% 2% 0%
Gambia 0% 3% 0% 1%
Ghana 0% 0% 0% 2%
Guinea 0% 0% 1% 0%
Kenya 0% 0% 12% 3%
Madagascar 0% 0% 3% 4%
Malawi 5% 8% 35% 14%
Mali 0% 0% 0% 0%
Mauritania 0% 0% 1% 0%
Mauritius 1% 1% 11% 6%
Mayotte 0% 0% 9% 0%
Mozambique 0% 8% 0% 26%
Namibia 28% 35% 84% 87%
Niger 0% 0% 0% 1%
Nigeria 40% 1% 1% 2%
Rwanda 0% 0% 0% 2%
Sao Tomé and Principe
0% 0% 0% 0%
Senegal 0% 0% 1% 1%
South Africa 0% 0% 0% 0%
Swaziland 74% 0% 97% 0%
Tanzania 1% 1% 9% 5%
Togo 0% 0% 1% 0%
Uganda 1% 0% 6% 3%
Zambia 15% 14% 55% 43%
Zimbabwe 13% 82% 0% 71%