Embed Size (px)
Citation preview
The European Eggs & Poultry sectorForecast group - March 2009
DG AGRI C4 Forecast Group March 2009 2
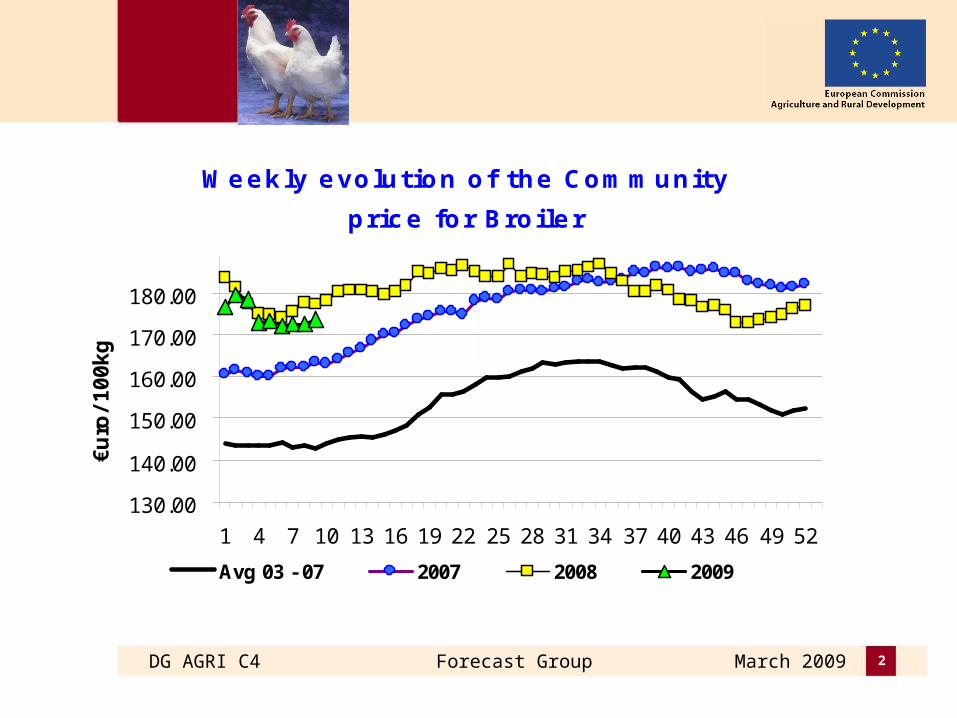
Weekly evolution of the Community
price for Broiler
130.00
140.00
150.00
160.00
170.00
180.00
1 4 7 10 13 16 19 22 25 28 31 34 37 40 43 46 49 52
€u
ro/
10
0k
g
Avg 03 - 07 2007 2008 2009
DG AGRI C4 Forecast Group March 2009 3
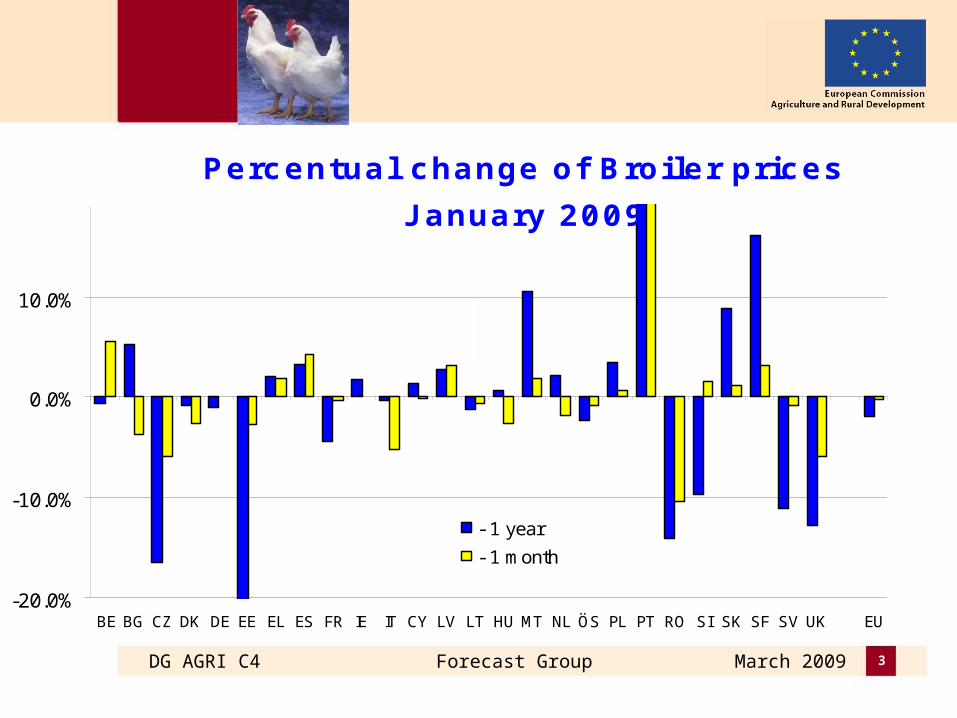
Percentual change of Broiler prices
J anuary 2009
-20.0%
-10.0%
0.0%
10.0%
BE BG CZ DK DE EE EL ES FR IE IT CY LV LT HU MT NL ÖS PL PT RO SI SK SF SV UK EU
- 1 year
- 1 month
DG AGRI C4 Forecast Group March 2009 4
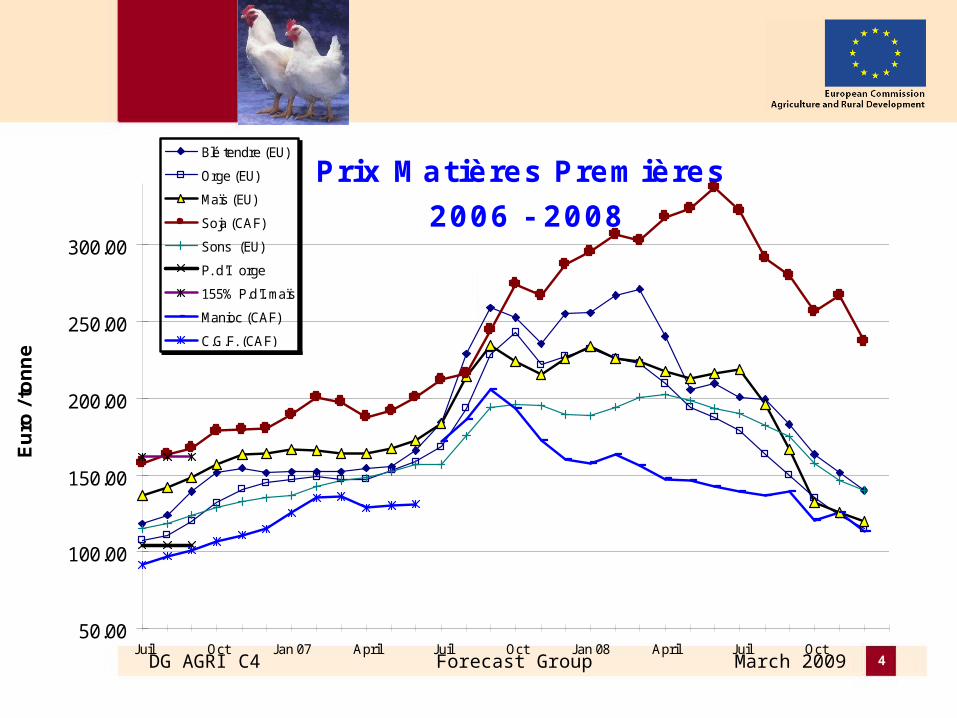
Prix Matières Premières
2006 - 2008
50.00
100.00
150.00
200.00
250.00
300.00
J uil Oct J an 07 April J uil Oct J an 08 April J uil Oct
Euro
/ to
nne
Blé tendre (EU)
Orge (EU)
Maïs (EU)
Soja (CAF)
Sons (EU)
P. d'I orge
155% P.d'I. maïs
Manioc (CAF)
C.G.F. (CAF)
DG AGRI C4 Forecast Group March 2009 5
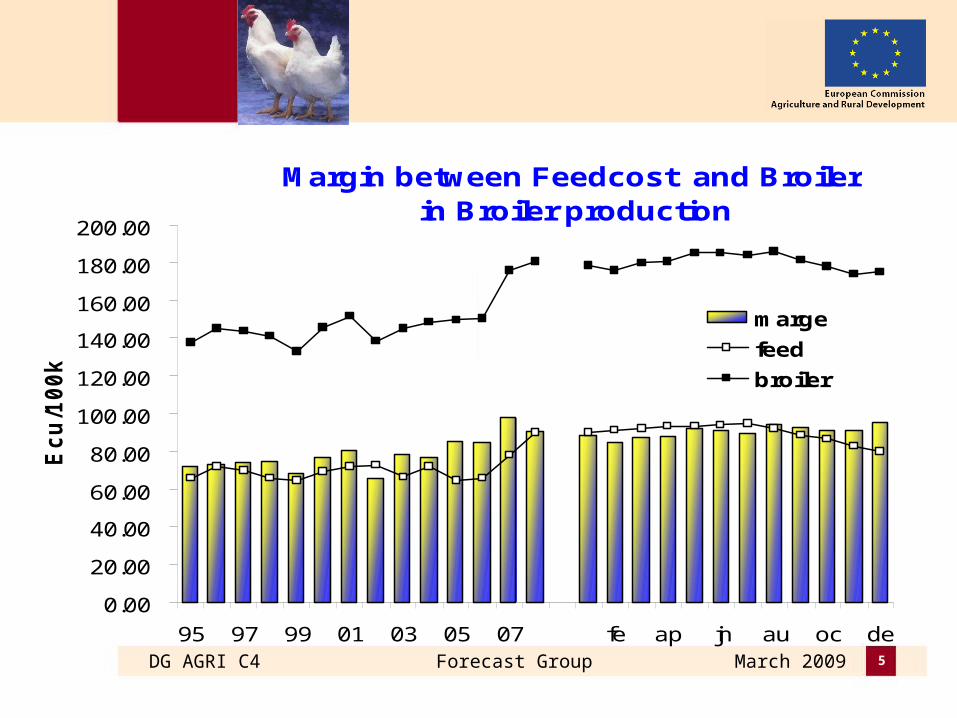
Margin between Feedcost and Broiler in Broiler production
0.00
20.00
40.00
60.00
80.00
100.00
120.00
140.00
160.00
180.00
200.00
95 97 99 01 03 05 07 fe ap jn au oc de
Ec
u/1
00
kg
marge
feed
broiler
DG AGRI C4 Forecast Group March 2009 6
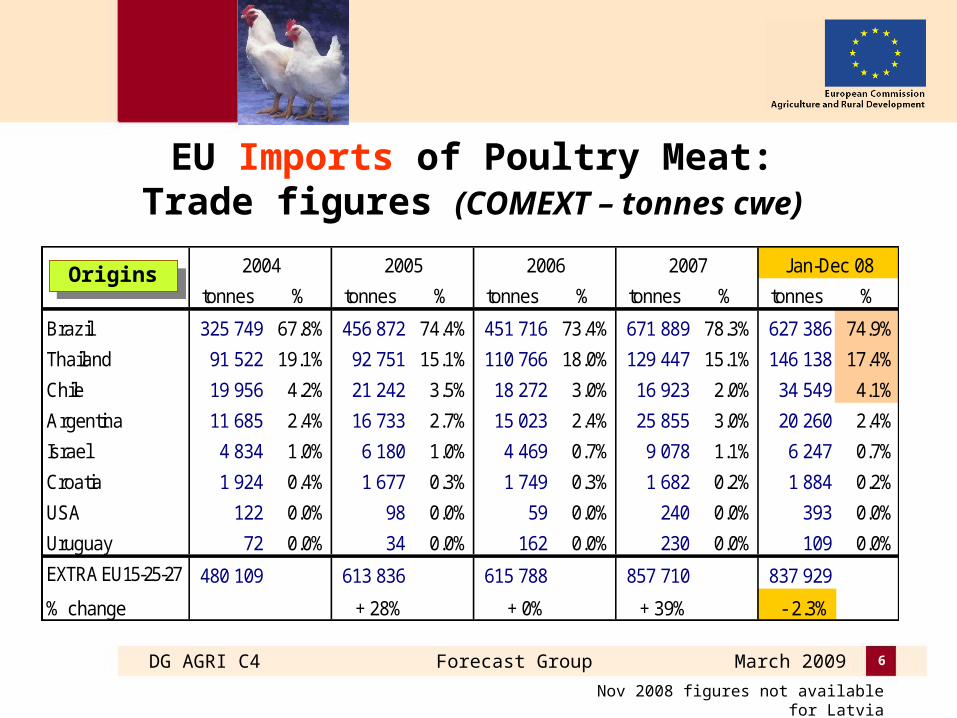
EU Imports of Poultry Meat:Trade figures (COMEXT – tonnes cwe)
tonnes % tonnes % tonnes % tonnes % tonnes %
Brazil 325 749 67.8% 456 872 74.4% 451 716 73.4% 671 889 78.3% 627 386 74.9%
Thailand 91 522 19.1% 92 751 15.1% 110 766 18.0% 129 447 15.1% 146 138 17.4%
Chile 19 956 4.2% 21 242 3.5% 18 272 3.0% 16 923 2.0% 34 549 4.1%
Argentina 11 685 2.4% 16 733 2.7% 15 023 2.4% 25 855 3.0% 20 260 2.4%
Israel 4 834 1.0% 6 180 1.0% 4 469 0.7% 9 078 1.1% 6 247 0.7%
Croatia 1 924 0.4% 1 677 0.3% 1 749 0.3% 1 682 0.2% 1 884 0.2%
USA 122 0.0% 98 0.0% 59 0.0% 240 0.0% 393 0.0%
Uruguay 72 0.0% 34 0.0% 162 0.0% 230 0.0% 109 0.0%EXTRA EU15-25-27 480 109 613 836 615 788 857 710 837 929
% change + 28% + 0% + 39% - 2.3%
2004 2005 2006 Jan-Dec 082007OriginsOrigins
Nov 2008 figures not available for Latvia
DG AGRI C4 Forecast Group March 2009 7
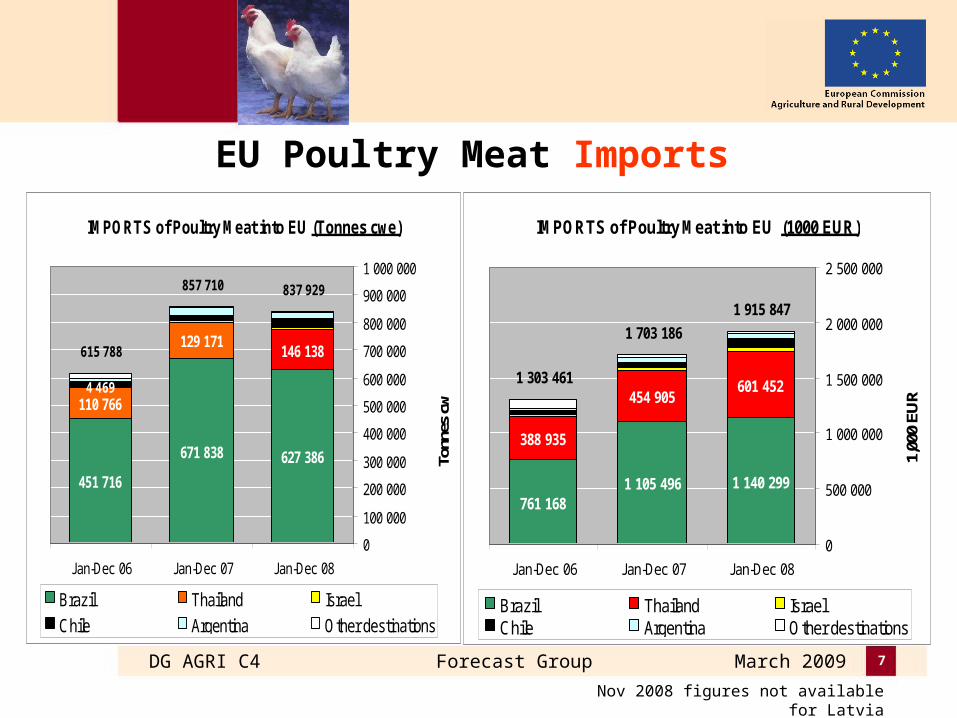
EU Poultry Meat ImportsDealing with increased
imports from
South America
IMPORTS of Poultry Meat into EU (Tonnes cwe)
451 716
671 838 627 386
110 766
129 171146 138
4 469
615 788
857 710 837 929
0
100 000
200 000
300 000
400 000
500 000
600 000
700 000
800 000
900 000
1 000 000
Jan-Dec 06 Jan-Dec 07 Jan-Dec 08
Tonn
es c
w
Brazil Thailand Israel
Chile Argentina Other destinations
IMPORTS of Poultry Meat into EU (1000 EUR)
761 1681 105 496 1 140 299
388 935
454 905601 4521 303 461
1 703 186
1 915 847
0
500 000
1 000 000
1 500 000
2 000 000
2 500 000
Jan-Dec 06 Jan-Dec 07 Jan-Dec 08
1,00
0 EU
R
Brazil Thailand IsraelChile Argentina Other destinations
Nov 2008 figures not available for Latvia
DG AGRI C4 Forecast Group March 2009 8
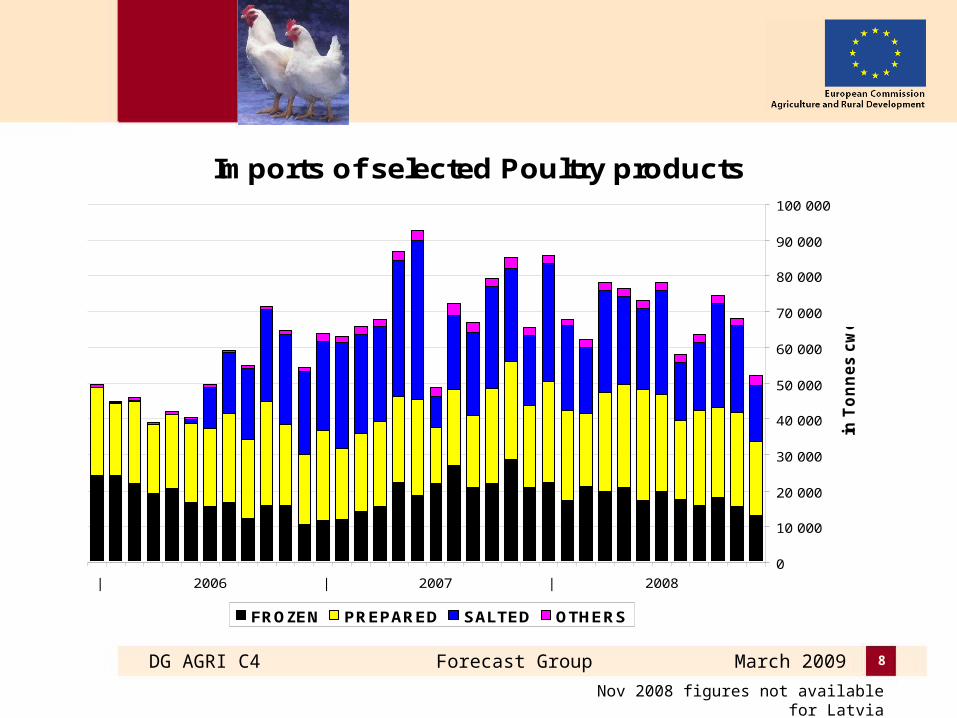
Imports of selected Poultry products
0
10 000
20 000
30 000
40 000
50 000
60 000
70 000
80 000
90 000
100 000
| 2006 | 2007 | 2008
in T
on
ne
s c
we
FROZEN PREPARED SALTED OTHERS
Nov 2008 figures not available for Latvia
DG AGRI C4 Forecast Group March 2009 9
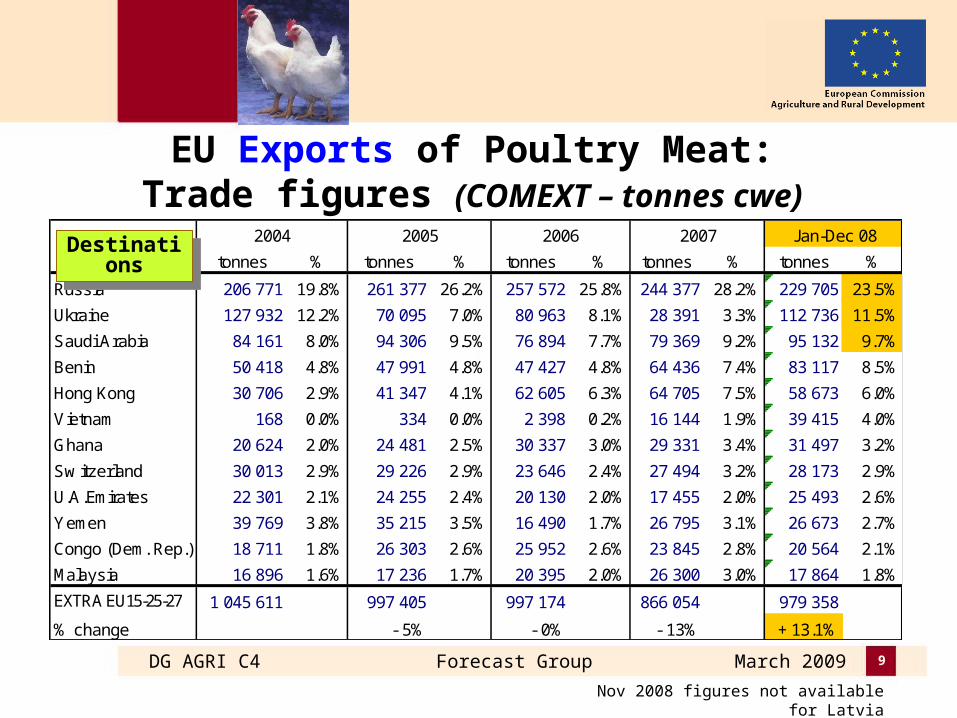
tonnes % tonnes % tonnes % tonnes % tonnes %
Russia 206 771 19.8% 261 377 26.2% 257 572 25.8% 244 377 28.2% 229 705 23.5%
Ukraine 127 932 12.2% 70 095 7.0% 80 963 8.1% 28 391 3.3% 112 736 11.5%
Saudi Arabia 84 161 8.0% 94 306 9.5% 76 894 7.7% 79 369 9.2% 95 132 9.7%
Benin 50 418 4.8% 47 991 4.8% 47 427 4.8% 64 436 7.4% 83 117 8.5%
Hong Kong 30 706 2.9% 41 347 4.1% 62 605 6.3% 64 705 7.5% 58 673 6.0%
Vietnam 168 0.0% 334 0.0% 2 398 0.2% 16 144 1.9% 39 415 4.0%
Ghana 20 624 2.0% 24 481 2.5% 30 337 3.0% 29 331 3.4% 31 497 3.2%
Sw itzerland 30 013 2.9% 29 226 2.9% 23 646 2.4% 27 494 3.2% 28 173 2.9%
U.A.Emirates 22 301 2.1% 24 255 2.4% 20 130 2.0% 17 455 2.0% 25 493 2.6%
Yemen 39 769 3.8% 35 215 3.5% 16 490 1.7% 26 795 3.1% 26 673 2.7%
Congo (Dem. Rep.) 18 711 1.8% 26 303 2.6% 25 952 2.6% 23 845 2.8% 20 564 2.1%
Malaysia 16 896 1.6% 17 236 1.7% 20 395 2.0% 26 300 3.0% 17 864 1.8%EXTRA EU15-25-27 1 045 611 997 405 997 174 866 054 979 358
% change - 5% - 0% - 13% + 13.1%
2004 2005 2006 Jan-Dec 082007
EU Exports of Poultry Meat:Trade figures (COMEXT – tonnes cwe)
DestinationsDestinations
Nov 2008 figures not available for Latvia
DG AGRI C4 Forecast Group March 2009 10
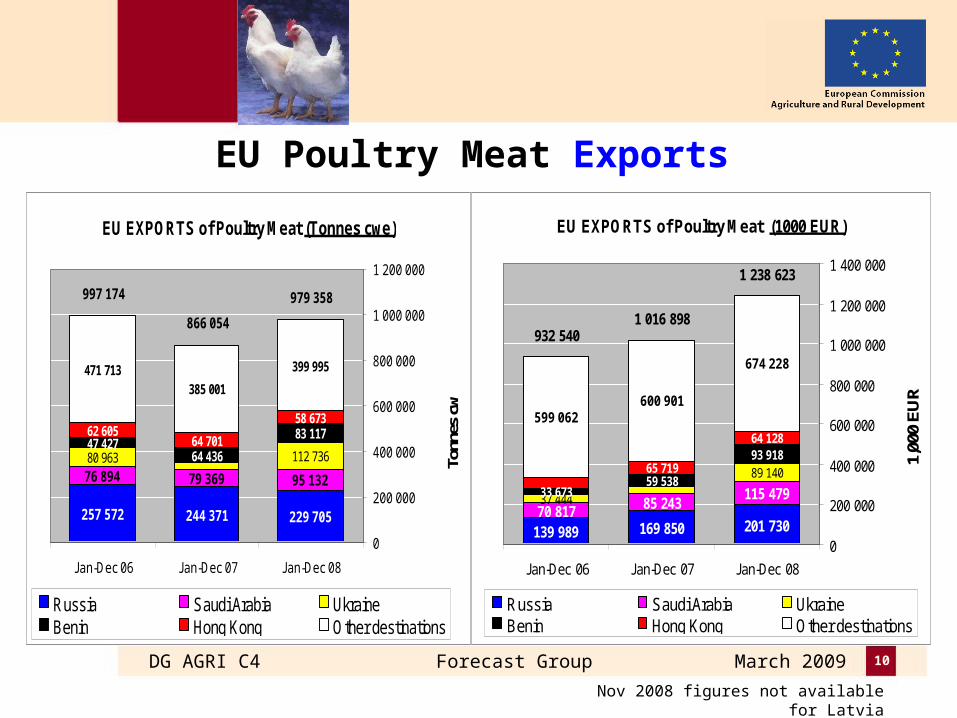
EU Poultry Meat Exports
EU EXPORTS of Poultry Meat (Tonnes cwe)
257 572 244 371 229 705
76 894 79 369 95 132
80 963 112 73647 427
64 436
83 11762 60564 701
58 673
471 713385 001
399 995
997 174
866 054
979 358
0
200 000
400 000
600 000
800 000
1 000 000
1 200 000
Jan-Dec 06 Jan-Dec 07 Jan-Dec 08
Tonn
es c
w
Russia Saudi Arabia UkraineBenin Hong Kong Other destinations
EU EXPORTS of Poultry Meat (1000 EUR)
139 989 169 850 201 73070 817 85 243
115 47937 444
89 140
33 67359 538
93 91865 719
64 128
599 062600 901
674 228
932 5401 016 898
1 238 623
0
200 000
400 000
600 000
800 000
1 000 000
1 200 000
1 400 000
Jan-Dec 06 Jan-Dec 07 Jan-Dec 08
1,00
0 E
UR
Russia Saudi Arabia UkraineBenin Hong Kong Other destinations
Nov 2008 figures not available for Latvia
DG AGRI C4 Forecast Group March 2009 11
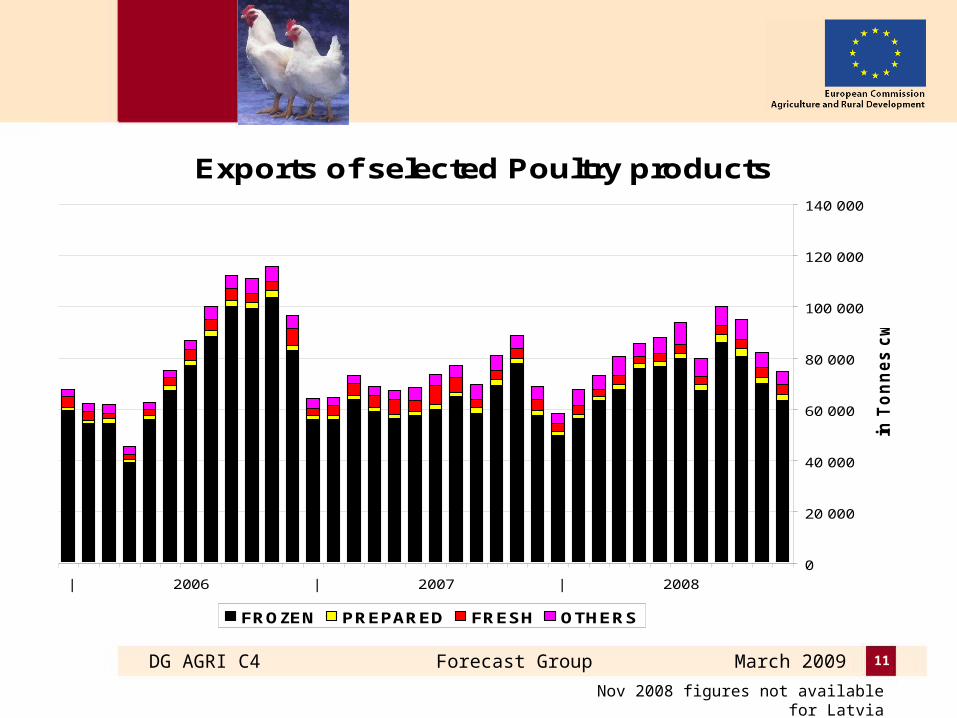
Exports of selected Poultry products
0
20 000
40 000
60 000
80 000
100 000
120 000
140 000
| 2006 | 2007 | 2008
in T
on
ne
s c
we
FROZEN PREPARED FRESH OTHERS
Nov 2008 figures not available for Latvia
DG AGRI C4 Forecast Group March 2009 12
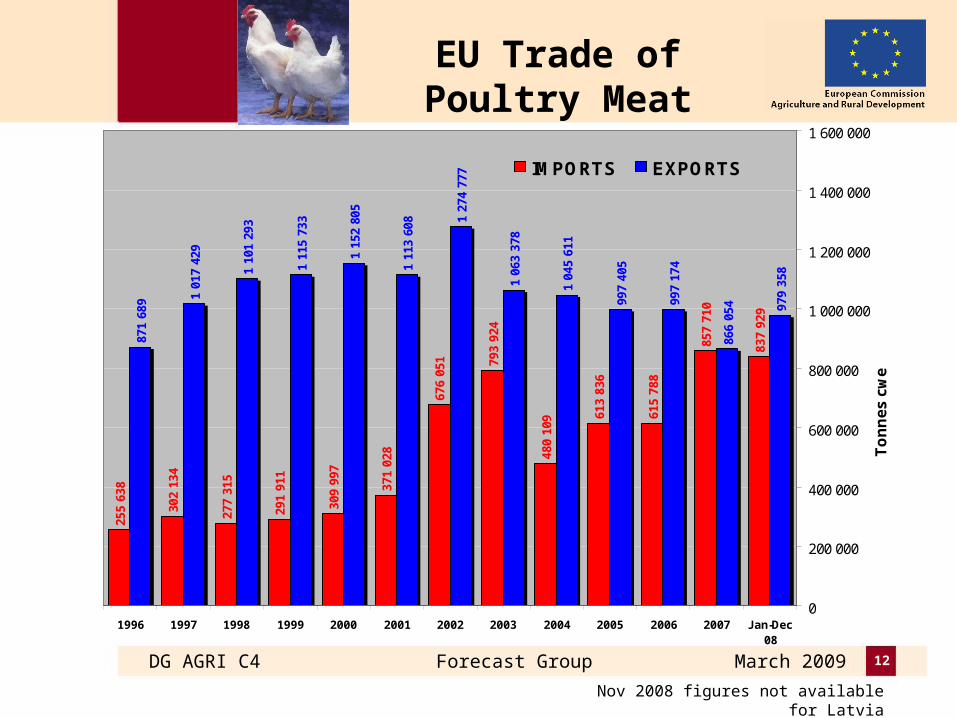
EU Trade of Poultry Meat
255
638
302
134
277
315
291
911
309
997
371
028
676
051 79
3 92
4
480
109 61
3 83
6
615
788
857
710
837
929
871
689 1
017
429
1 10
1 29
3
1 11
5 73
3
1 15
2 80
5
1 11
3 60
8 1 27
4 77
7
1 06
3 37
8
1 04
5 61
1
997
405
997
174
866
054 97
9 35
8
0
200 000
400 000
600 000
800 000
1 000 000
1 200 000
1 400 000
1 600 000
1996 1997 1998 1999 2000 2001 2002 2003 2004 2005 2006 2007 Jan-Dec08
To
nn
es
cw
e
IMPORTS EXPORTS
Nov 2008 figures not available for Latvia
DG AGRI C4 Forecast Group March 2009 13
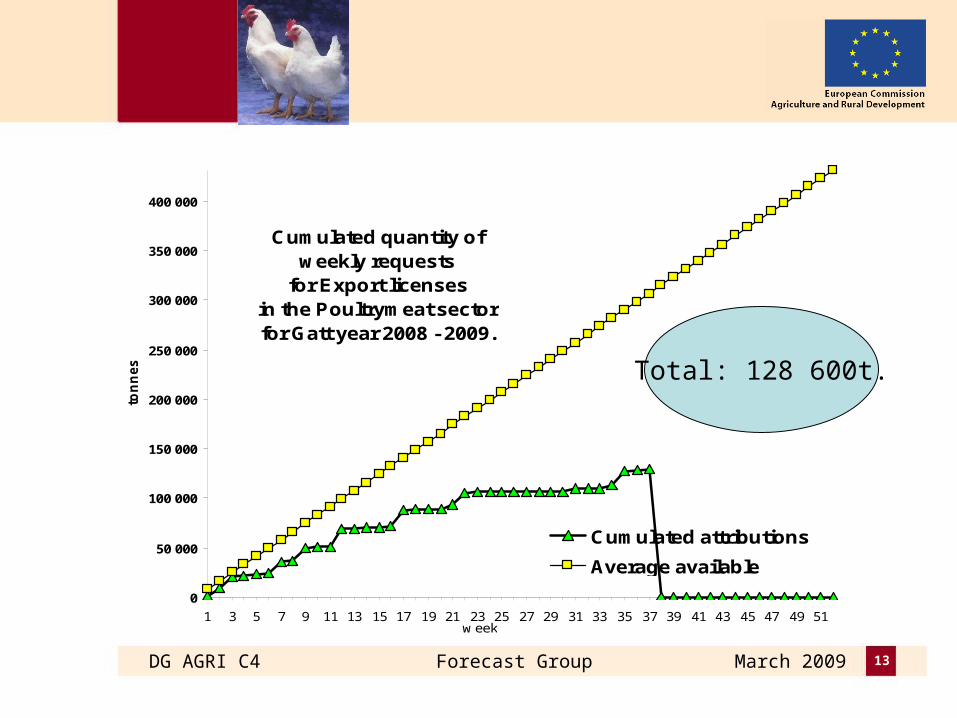
Cumulated quantity of weekly requests
for Export licenses in the Poultrymeat sectorfor Gatt year 2008 - 2009.
0
50 000
100 000
150 000
200 000
250 000
300 000
350 000
400 000
1 3 5 7 9 11 13 15 17 19 21 23 25 27 29 31 33 35 37 39 41 43 45 47 49 51w eek
ton
nes
Cumulated attributions
Average available
Total: 128 600t.
DG AGRI C4 Forecast Group March 2009 14
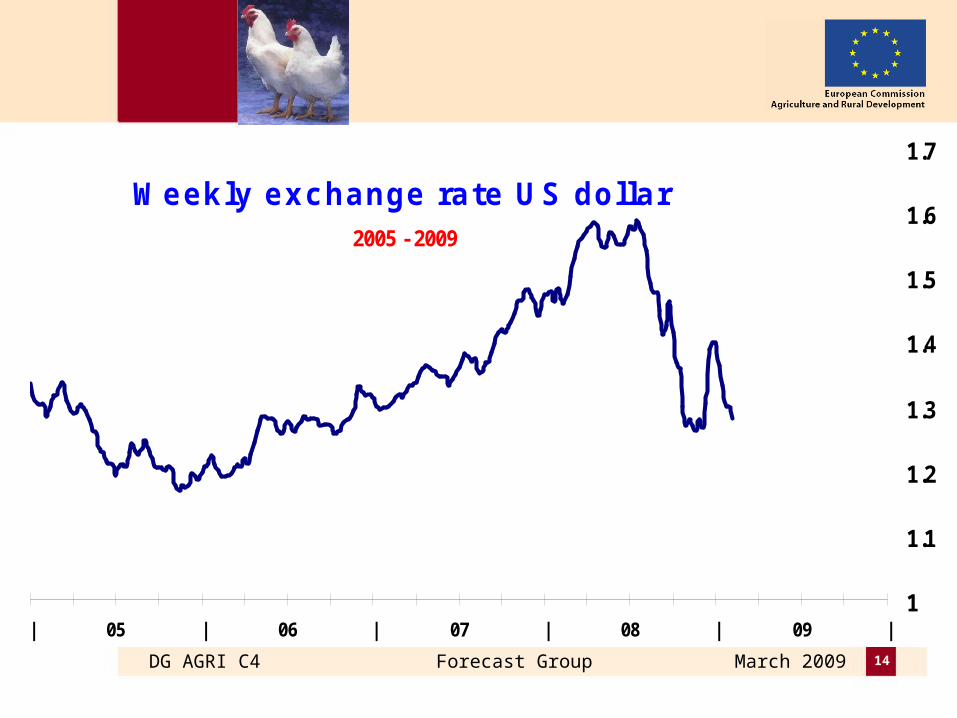
Weekly exchange rate US dollar 2005 - 2009
1
1.1
1.2
1.3
1.4
1.5
1.6
1.7
| 05 | 06 | 07 | 08 | 09 |
1 €uro = .......US$
DG AGRI C4 Forecast Group March 2009 15
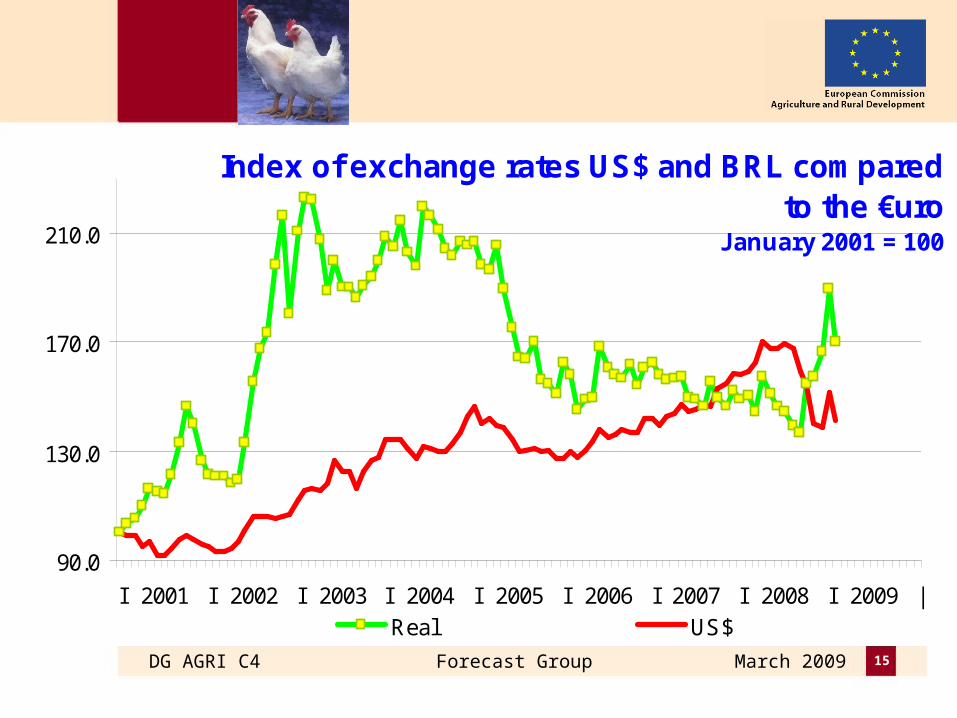
Index of exchange rates US$ and BRL compared to the €uro
January 2001 = 100
90.0
130.0
170.0
210.0
I 2001 I 2002 I 2003 I 2004 I 2005 I 2006 I 2007 I 2008 I 2009 |Real US$
DG AGRI C4 Forecast Group March 2009 16
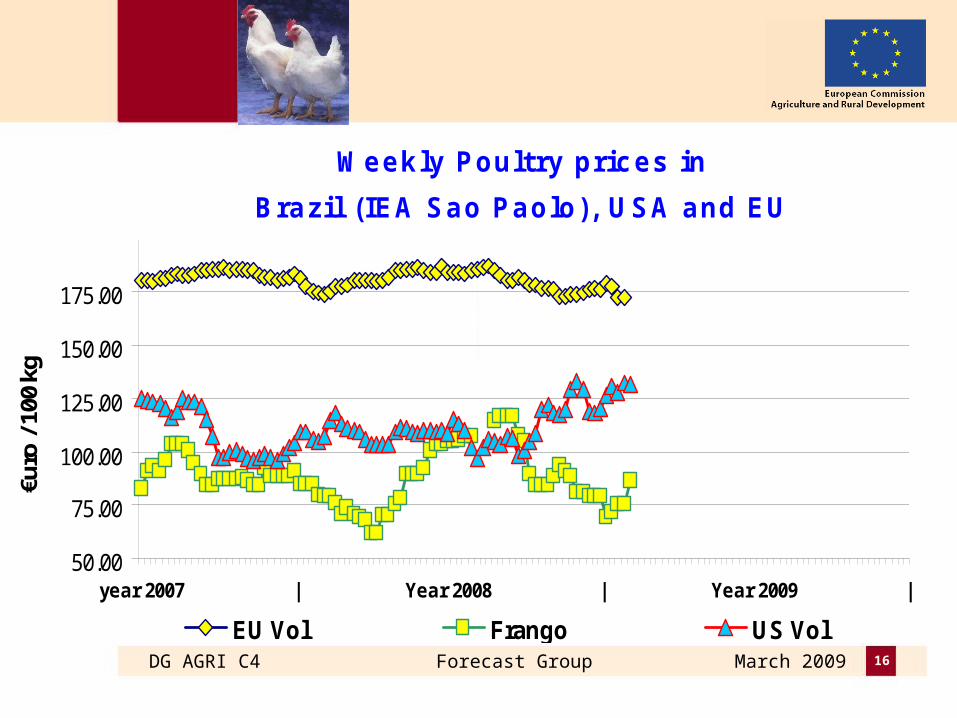
Weekly Poultry prices in
Brazil (IEA Sao Paolo), USA and EU
50.00
75.00
100.00
125.00
150.00
175.00
year 2007 | Year 2008 | Year 2009 |
€uro
/ 100
kg
EU Vol Frango US Vol
DG AGRI C4 Forecast Group March 2009 17
Introduction
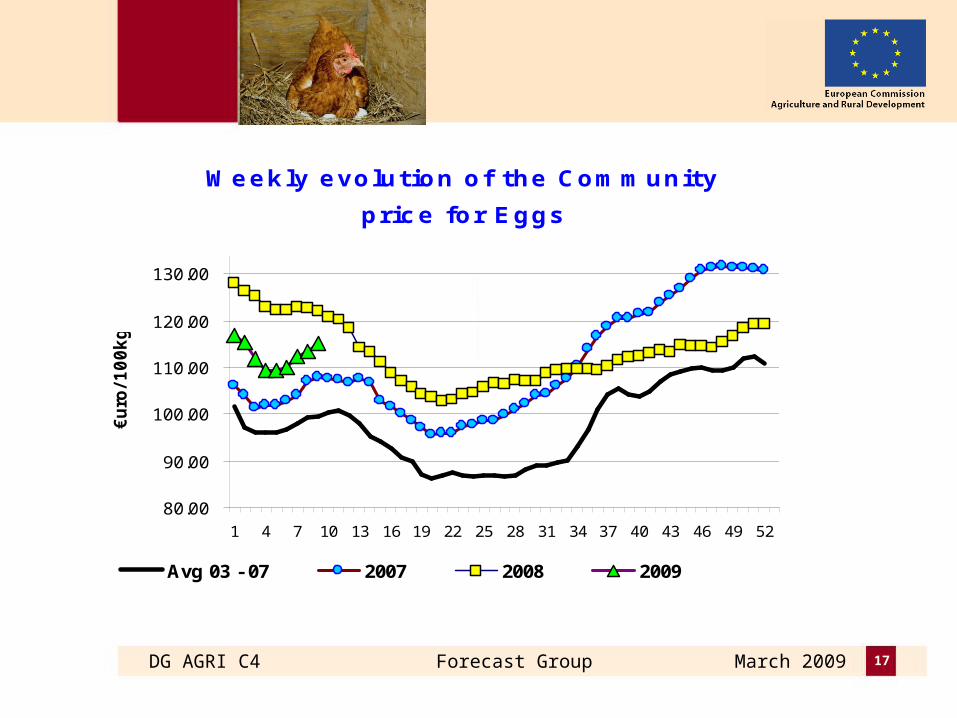
Weekly evolution of the Community
price for Eggs
80.00
90.00
100.00
110.00
120.00
130.00
1 4 7 10 13 16 19 22 25 28 31 34 37 40 43 46 49 52
€u
ro/ 1
00
kg
Avg 03 - 07 2007 2008 2009
DG AGRI C4 Forecast Group March 2009 18
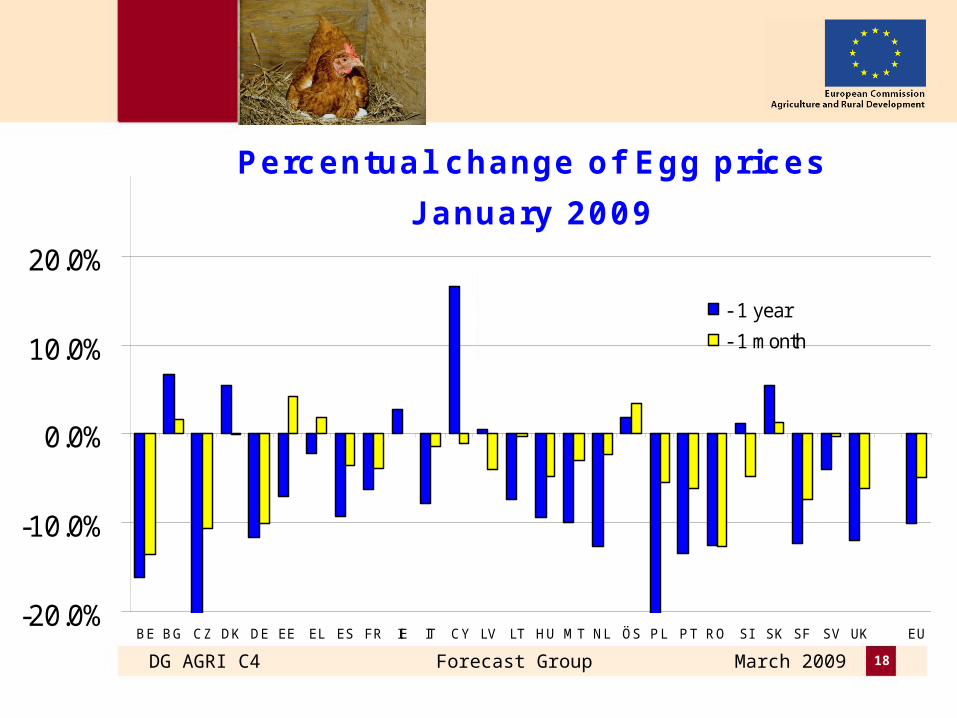
Percentual change of Egg prices
J anuary 2009
-20.0%
-10.0%
0.0%
10.0%
20.0%
BE BG CZ DK DE EE EL ES FR IE IT CY LV LT HU MT NL ÖS P L P T RO SI SK SF SV UK EU
- 1 year
- 1 month
DG AGRI C4 Forecast Group March 2009 19
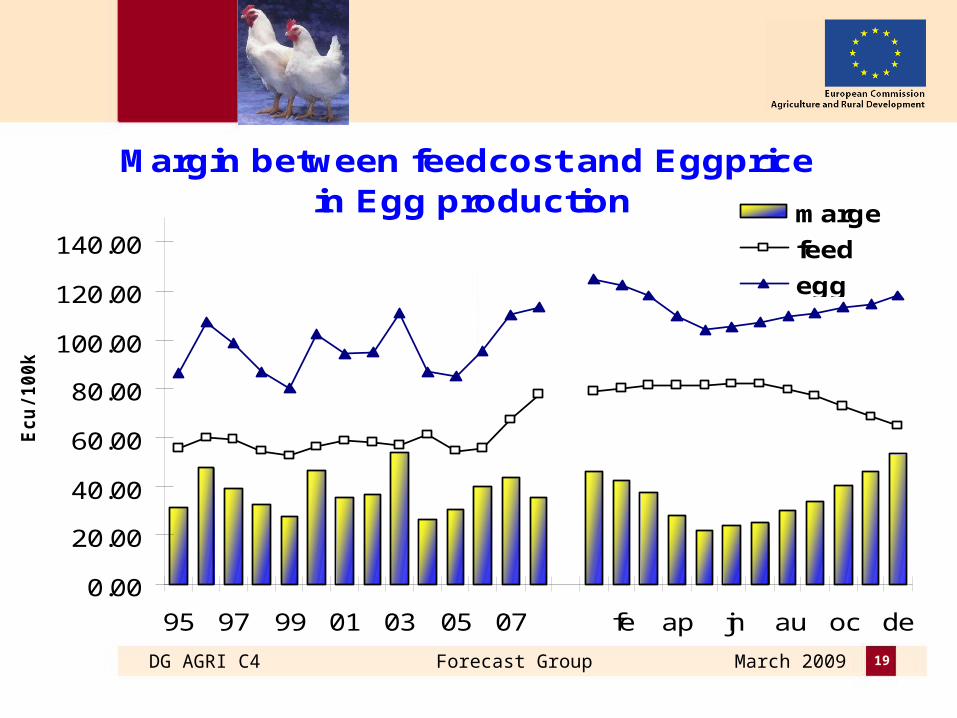
Margin between feedcost and Eggprice in Egg production
0.00
20.00
40.00
60.00
80.00
100.00
120.00
140.00
95 97 99 01 03 05 07 fe ap jn au oc de
Ecu
/ 100kg
marge
feed
egg
DG AGRI C4 Forecast Group March 2009 20
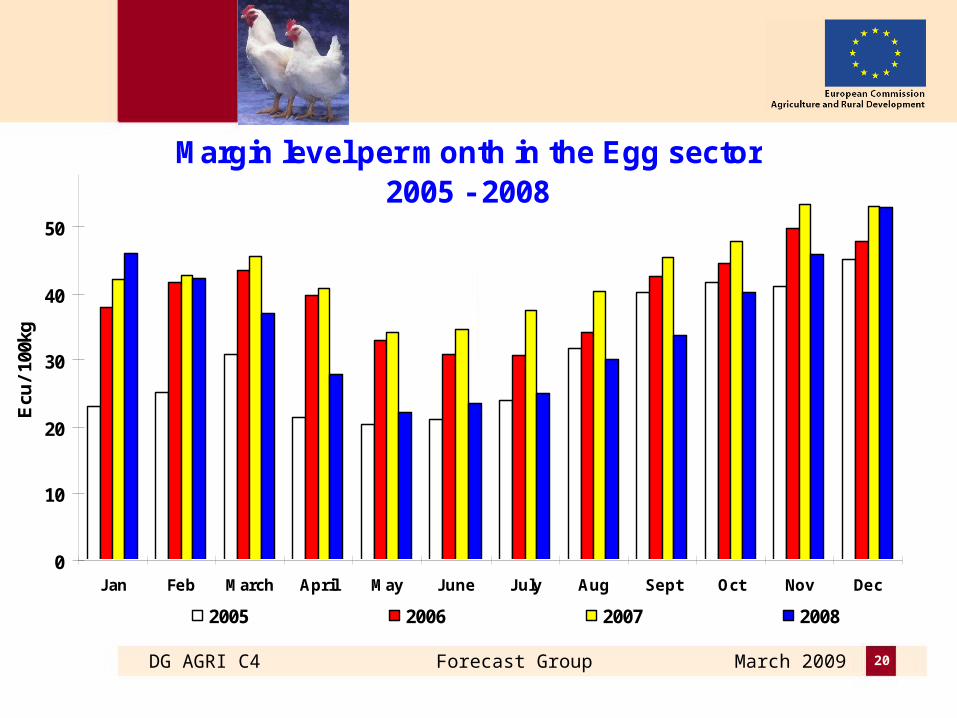
Margin level per month in the Egg sector2005 - 2008
0
10
20
30
40
50
Jan Feb March April May June July Aug Sept Oct Nov Dec
Ecu
/ 10
0kg
2005 2006 2007 2008
DG AGRI C4 Forecast Group March 2009 21
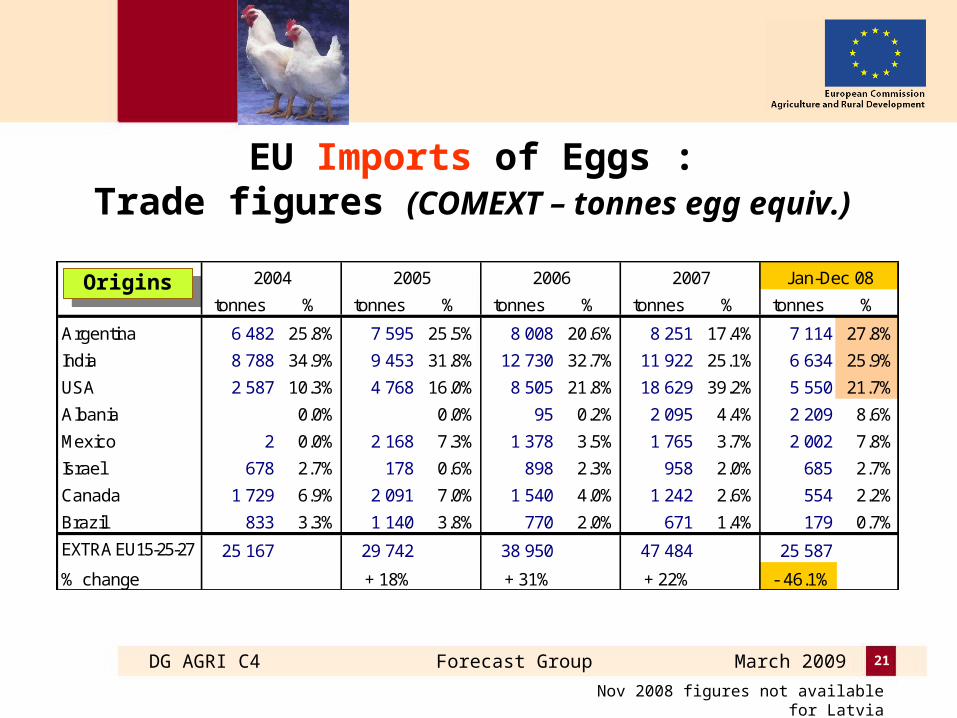
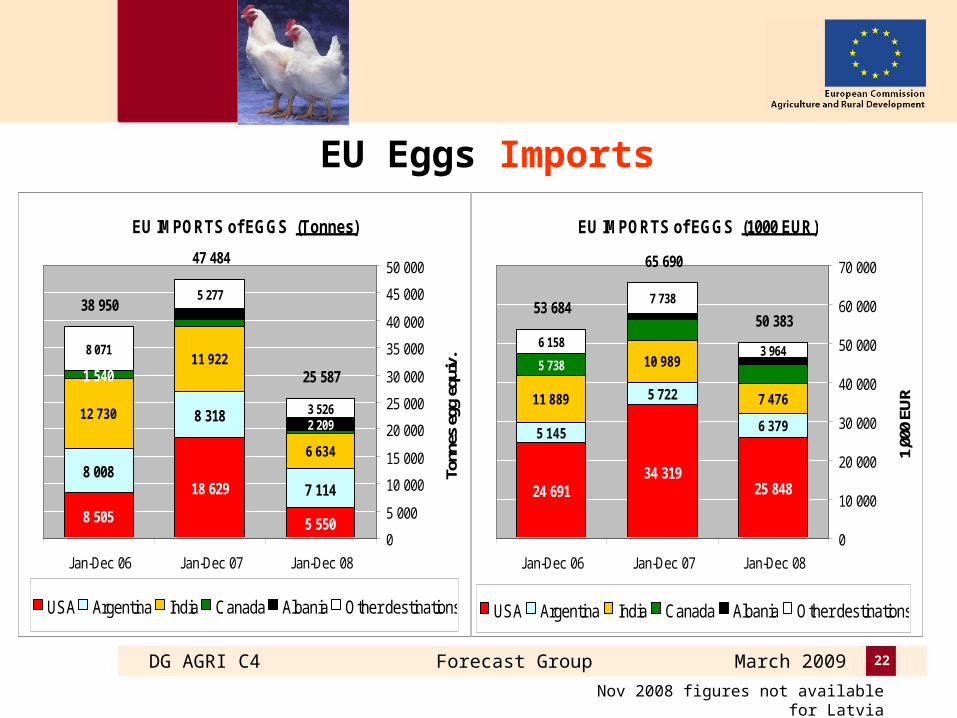
EU Imports of Eggs :Trade figures (COMEXT – tonnes egg equiv.)
OriginsOriginstonnes % tonnes % tonnes % tonnes % tonnes %
Argentina 6 482 25.8% 7 595 25.5% 8 008 20.6% 8 251 17.4% 7 114 27.8%
India 8 788 34.9% 9 453 31.8% 12 730 32.7% 11 922 25.1% 6 634 25.9%
USA 2 587 10.3% 4 768 16.0% 8 505 21.8% 18 629 39.2% 5 550 21.7%
Albania 0.0% 0.0% 95 0.2% 2 095 4.4% 2 209 8.6%
Mexico 2 0.0% 2 168 7.3% 1 378 3.5% 1 765 3.7% 2 002 7.8%
Israel 678 2.7% 178 0.6% 898 2.3% 958 2.0% 685 2.7%
Canada 1 729 6.9% 2 091 7.0% 1 540 4.0% 1 242 2.6% 554 2.2%
Brazil 833 3.3% 1 140 3.8% 770 2.0% 671 1.4% 179 0.7%EXTRA EU15-25-27 25 167 29 742 38 950 47 484 25 587
% change + 18% + 31% + 22% - 46.1%
2004 2005 2006 Jan-Dec 082007
Nov 2008 figures not available for Latvia
DG AGRI C4 Forecast Group March 2009 22
EU Eggs ImportsDealing with increased
imports from
South America
EU IMPORTS of EGGS (Tonnes)
8 505
18 629
5 550
8 008
8 318
7 114
12 730
11 922
6 634
1 540
2 209
8 071
5 277
3 526
38 950
47 484
25 587
0
5 000
10 000
15 000
20 000
25 000
30 000
35 000
40 000
45 000
50 000
Jan-Dec 06 Jan-Dec 07 Jan-Dec 08
Tonn
es e
gg e
quiv
.
USA Argentina India Canada Albania Other destinations
EU IMPORTS of EGGS (1000 EUR)
24 69134 319
25 848
5 145
5 722
6 379
11 889
10 989
7 476
5 738
6 158
7 738
3 964
53 684
65 690
50 383
0
10 000
20 000
30 000
40 000
50 000
60 000
70 000
Jan-Dec 06 Jan-Dec 07 Jan-Dec 08
1,00
0 EU
R
USA Argentina India Canada Albania Other destinations
Nov 2008 figures not available for Latvia
DG AGRI C4 Forecast Group March 2009 23
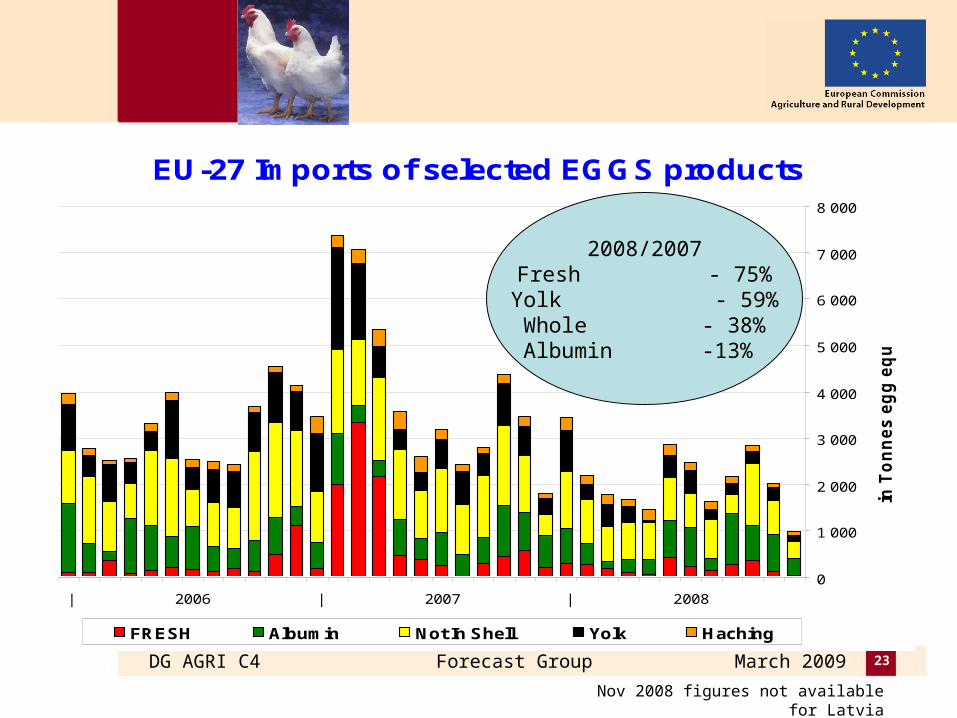
EU-27 Imports of selected EGGS products
0
1 000
2 000
3 000
4 000
5 000
6 000
7 000
8 000
| 2006 | 2007 | 2008
in T
on
ne
s e
gg
eq
uiv
.
FRESH Albumin Not In Shell Yolk Haching
Nov 2008 figures not available for Latvia
2008/2007Fresh - 75%Yolk - 59%
Whole - 38% Albumin -13%
DG AGRI C4 Forecast Group March 2009 24
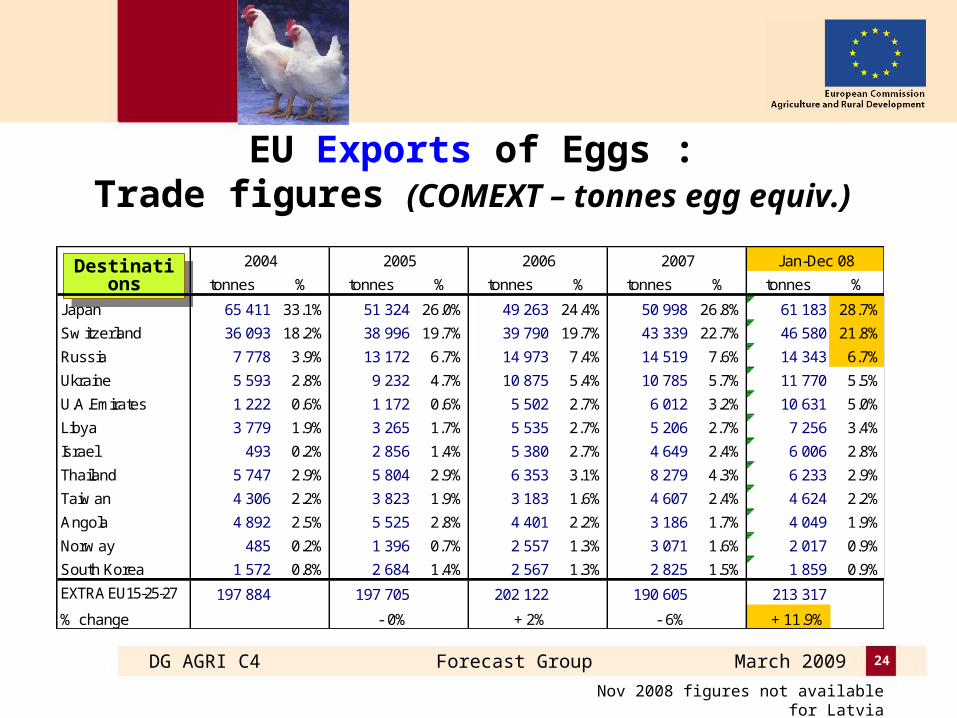
EU Exports of Eggs :Trade figures (COMEXT – tonnes egg equiv.)
DestinationsDestinationstonnes % tonnes % tonnes % tonnes % tonnes %
Japan 65 411 33.1% 51 324 26.0% 49 263 24.4% 50 998 26.8% 61 183 28.7%
Sw itzerland 36 093 18.2% 38 996 19.7% 39 790 19.7% 43 339 22.7% 46 580 21.8%
Russia 7 778 3.9% 13 172 6.7% 14 973 7.4% 14 519 7.6% 14 343 6.7%
Ukraine 5 593 2.8% 9 232 4.7% 10 875 5.4% 10 785 5.7% 11 770 5.5%
U.A.Emirates 1 222 0.6% 1 172 0.6% 5 502 2.7% 6 012 3.2% 10 631 5.0%
Libya 3 779 1.9% 3 265 1.7% 5 535 2.7% 5 206 2.7% 7 256 3.4%
Israel 493 0.2% 2 856 1.4% 5 380 2.7% 4 649 2.4% 6 006 2.8%
Thailand 5 747 2.9% 5 804 2.9% 6 353 3.1% 8 279 4.3% 6 233 2.9%
Taiw an 4 306 2.2% 3 823 1.9% 3 183 1.6% 4 607 2.4% 4 624 2.2%
Angola 4 892 2.5% 5 525 2.8% 4 401 2.2% 3 186 1.7% 4 049 1.9%
Norw ay 485 0.2% 1 396 0.7% 2 557 1.3% 3 071 1.6% 2 017 0.9%
South Korea 1 572 0.8% 2 684 1.4% 2 567 1.3% 2 825 1.5% 1 859 0.9%EXTRA EU15-25-27 197 884 197 705 202 122 190 605 213 317
% change - 0% + 2% - 6% + 11.9%
2004 2005 2006 Jan-Dec 082007
Nov 2008 figures not available for Latvia
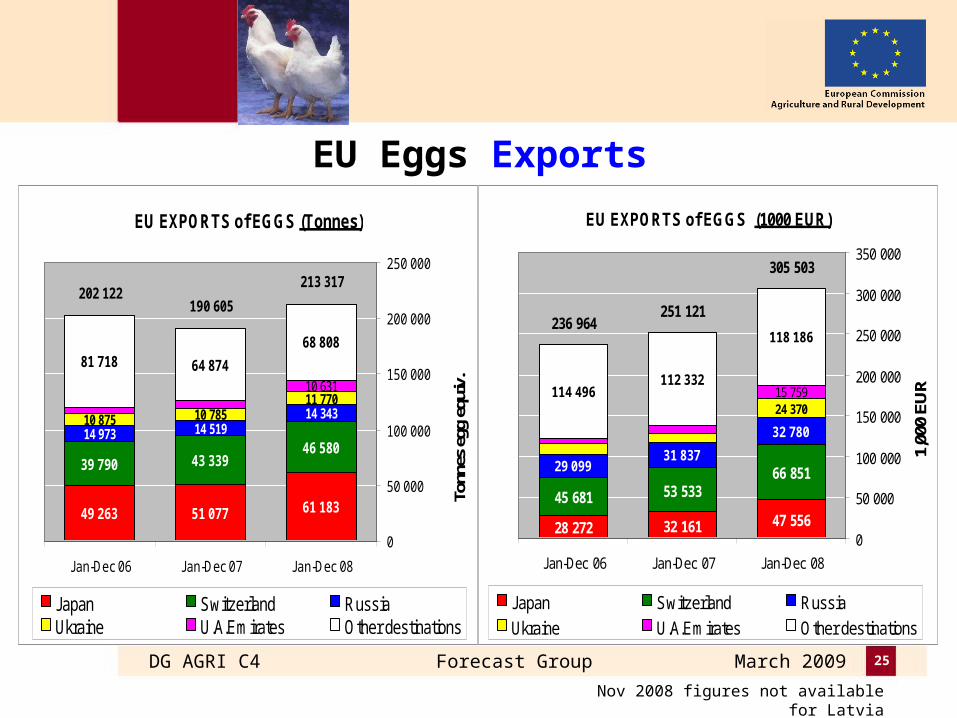
DG AGRI C4 Forecast Group March 2009 25
EU Eggs Exports
EU EXPORTS of EGGS (Tonnes)
49 263 51 077 61 183
39 790 43 33946 580
14 973 14 51914 34310 875 10 78511 77010 631
81 718 64 874
68 808
202 122190 605
213 317
0
50 000
100 000
150 000
200 000
250 000
Jan-Dec 06 Jan-Dec 07 Jan-Dec 08
Tonn
es e
gg e
quiv
.
Japan Switzerland RussiaUkraine U.A.Emirates Other destinations
EU EXPORTS of EGGS (1000 EUR)
28 272 32 161 47 556
45 681 53 53366 85129 099
31 837
32 780
15 759114 496112 332
118 186
24 370
236 964251 121
305 503
0
50 000
100 000
150 000
200 000
250 000
300 000
350 000
Jan-Dec 06 Jan-Dec 07 Jan-Dec 08
1,00
0 EU
R
Japan Switzerland Russia
Ukraine U.A.Emirates Other destinations
Nov 2008 figures not available for Latvia
DG AGRI C4 Forecast Group March 2009 26
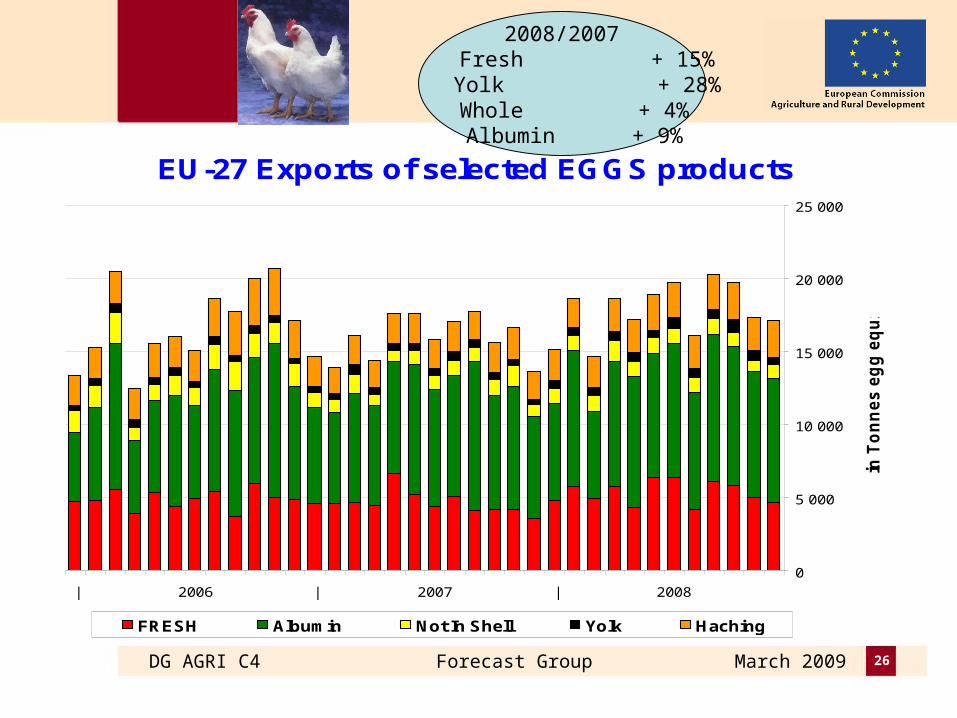
EU-27 Exports of selected EGGS products
0
5 000
10 000
15 000
20 000
25 000
| 2006 | 2007 | 2008
in T
on
ne
s e
gg
eq
uiv
.
FRESH Albumin Not In Shell Yolk Haching
2008/2007 Fresh + 15% Yolk + 28%
Whole + 4% Albumin + 9%
DG AGRI C4 Forecast Group March 2009 27
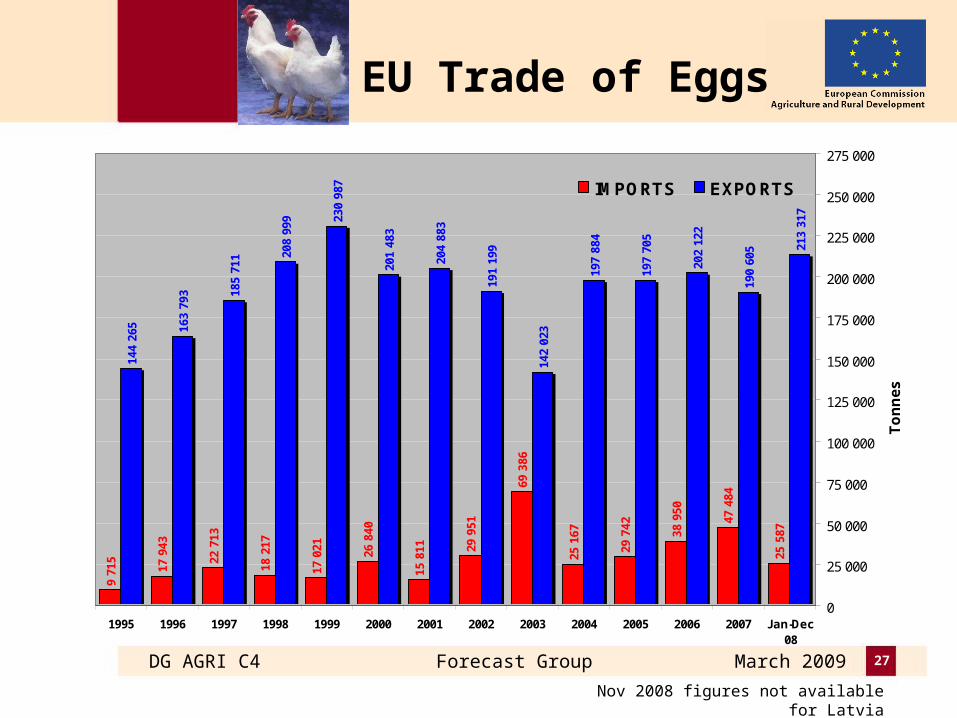
EU Trade of Eggs9
715
17 9
43
22 7
13
18 2
17
17 0
21 26 8
40
15 8
11 29 9
51
69 3
86
25 1
67
29 7
42
38 9
50
47 4
84
25 5
87
144
265 16
3 79
3 185
711 20
8 99
9 230
987
201
483
204
883
191
199
142
023
197
884
197
705
202
122
190
605 21
3 31
7
0
25 000
50 000
75 000
100 000
125 000
150 000
175 000
200 000
225 000
250 000
275 000
1995 1996 1997 1998 1999 2000 2001 2002 2003 2004 2005 2006 2007 Jan-Dec08
To
nn
es
IMPORTS EXPORTS
Nov 2008 figures not available for Latvia
DG AGRI C4 Forecast Group March 2009 28
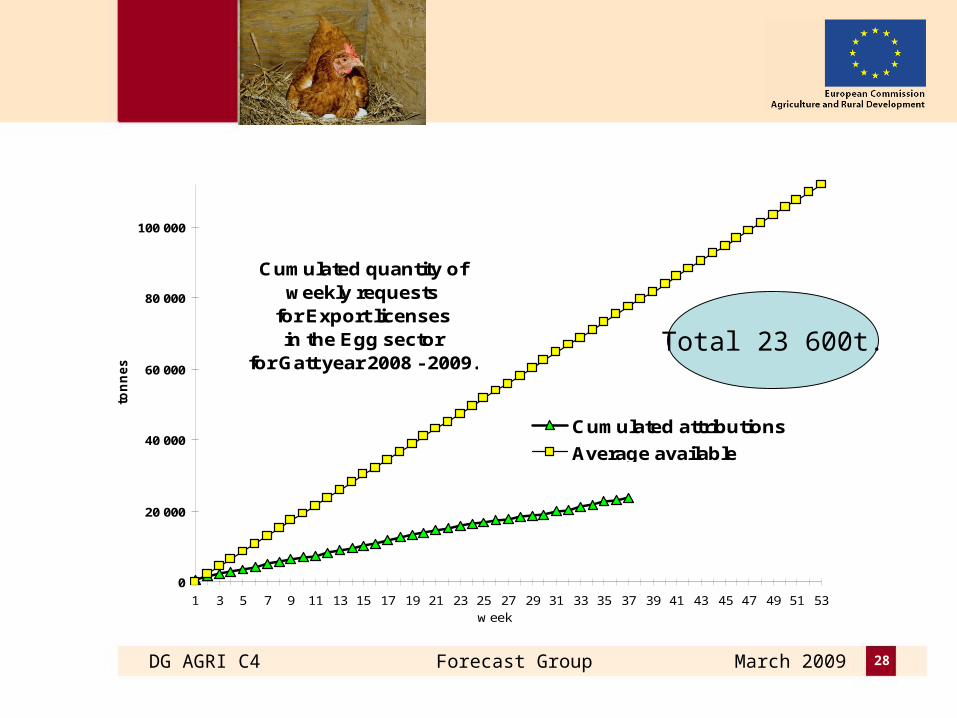
Cumulated quantity of weekly requests
for Export licenses in the Egg sector
for Gatt year 2008 - 2009.
0
20 000
40 000
60 000
80 000
100 000
1 3 5 7 9 11 13 15 17 19 21 23 25 27 29 31 33 35 37 39 41 43 45 47 49 51 53w eek
ton
nes
Cumulated attributions
Average available
Total 23 600t.
DG AGRI C4 Forecast Group March 2009 29
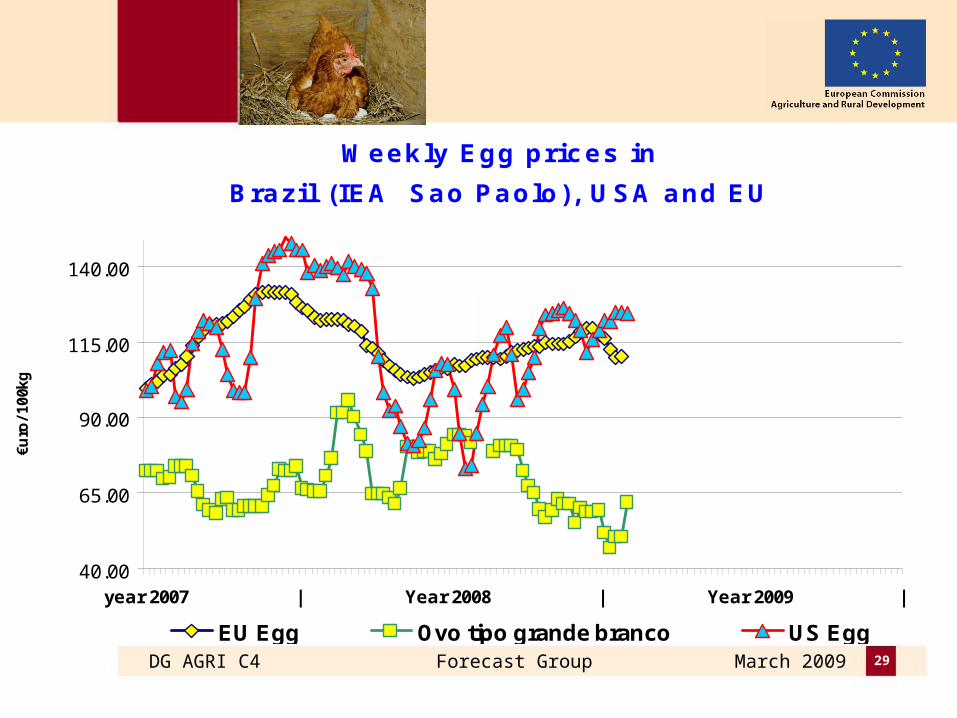
Weekly Egg prices in
Brazil (IEA Sao Paolo), USA and EU
40.00
65.00
90.00
115.00
140.00
year 2007 | Year 2008 | Year 2009 |
€uro
/ 100k
g
EU Egg Ovo tipo grande branco US Egg
DG AGRI C4 Forecast Group March 2009 30
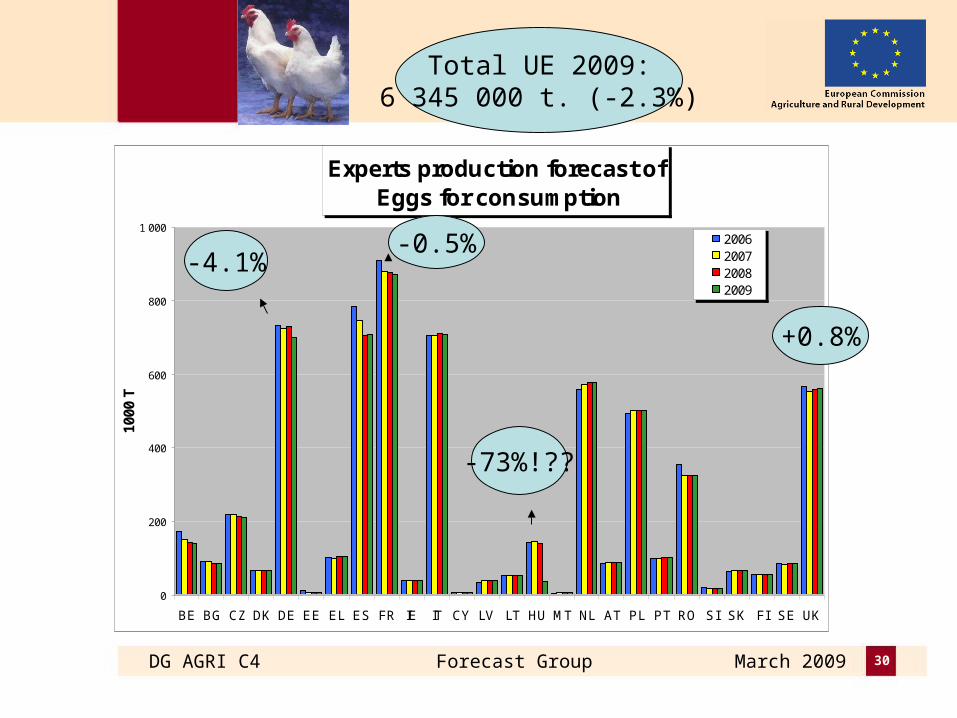
Experts production forecast of Eggs for consumption
0
200
400
600
800
1 000
BE BG CZ DK DE EE EL ES FR IE IT CY LV LT HU MT NL AT PL PT RO SI SK FI SE UK
1000
T
2006200720082009
Total UE 2009:6 345 000 t. (-2.3%)
-4.1%-0.5%
-73%!??
+0.8%
DG AGRI C4 Forecast Group March 2009 31
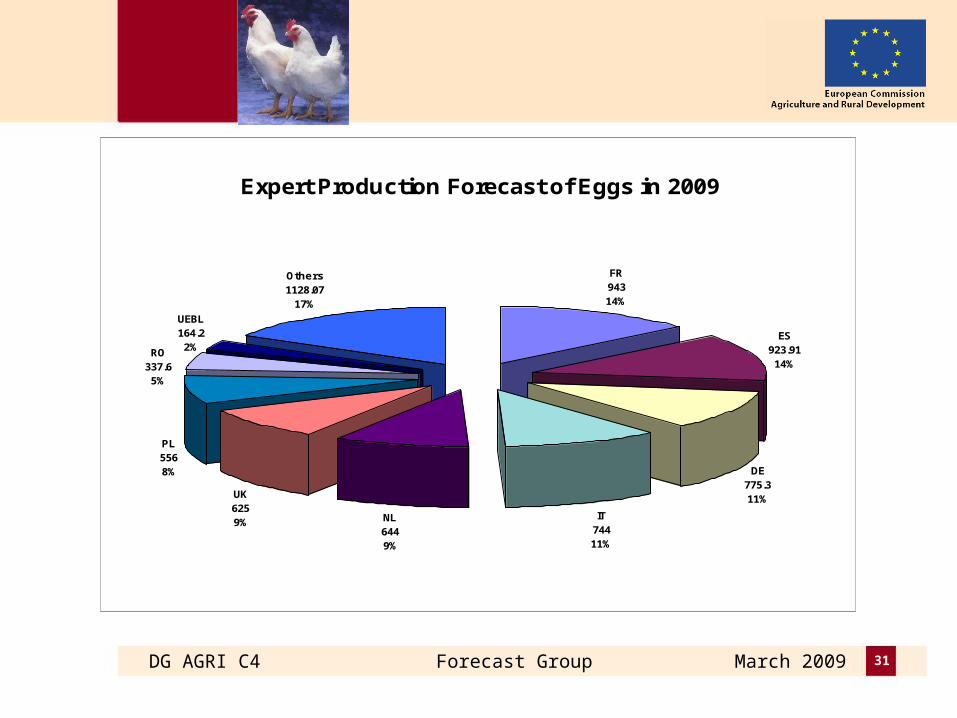
Expert Production Forecast of Eggs in 2009
FR94314%
ES923.9114%
DE775.311%
IT74411%
NL6449%
UK6259%
PL5568%
UEBL164.22%
Others1128.07
17%
RO337.65%
DG AGRI C4 Forecast Group March 2009 32
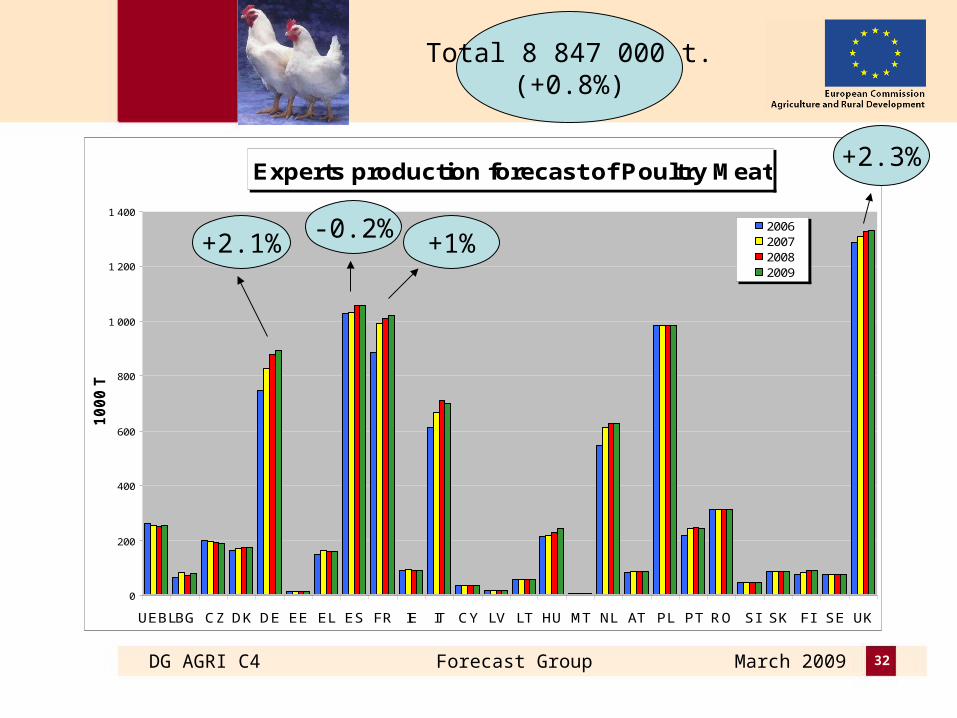
Experts production forecast of Poultry Meat
0
200
400
600
800
1 000
1 200
1 400
UEBLBG CZ DK DE EE EL ES FR IE IT CY LV LT HU MT NL AT PL PT RO SI SK FI SE UK
10
00
T
2006200720082009
Total 8 847 000 t.(+0.8%)
+2.1%-0.2%
+1%
+2.3%
DG AGRI C4 Forecast Group March 2009 33
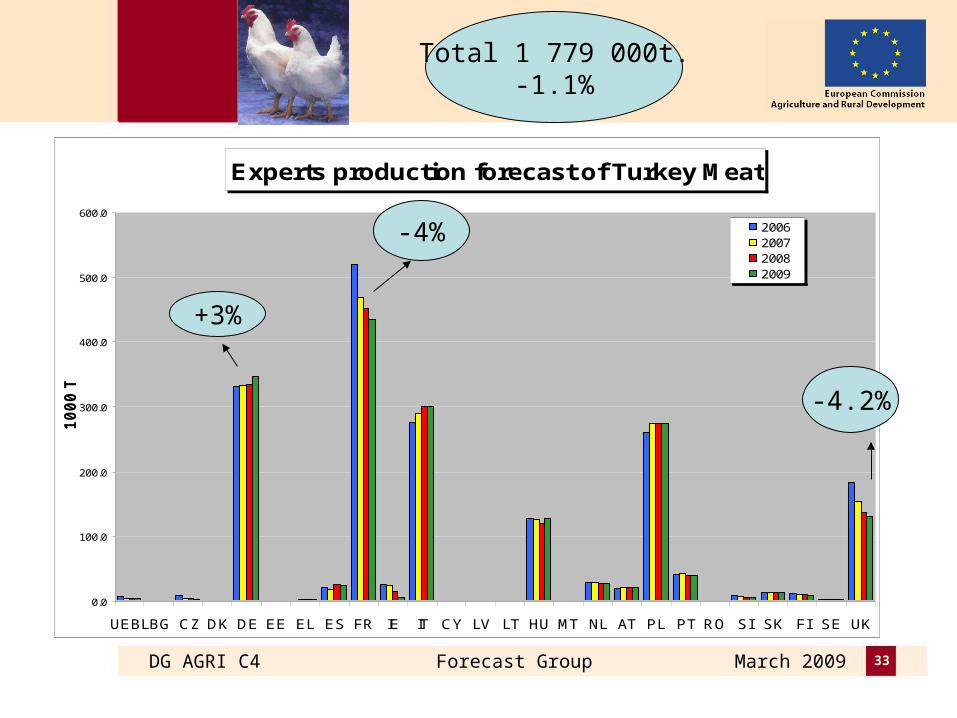
Experts production forecast of Turkey Meat
0.0
100.0
200.0
300.0
400.0
500.0
600.0
UEBLBG CZ DK DE EE EL ES FR IE IT CY LV LT HU MT NL AT PL PT RO SI SK FI SE UK
10
00
T
2006200720082009
Total 1 779 000t.-1.1%
-4%
+3%
Experts production forecast of Turkey Meat
0.0
100.0
200.0
300.0
400.0
500.0
600.0
UEBLBG CZ DK DE EE EL ES FR IE IT CY LV LT HU MT NL AT PL PT RO SI SK FI SE UK
10
00
T
2006200720082009
+3%
-4%
-4.2%
DG AGRI C4 Forecast Group March 2009 34
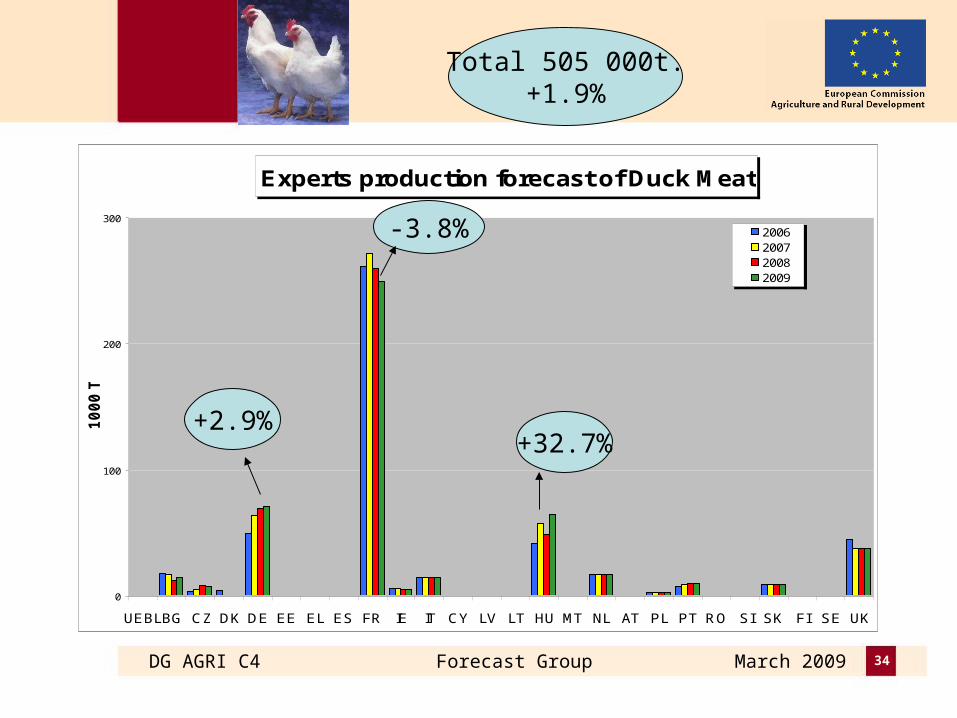
Experts production forecast of Duck Meat
0
100
200
300
UEBLBG CZ DK DE EE EL ES FR IE IT CY LV LT HU MT NL AT PL PT RO SI SK FI SE UK
10
00
T
2006200720082009
Total 505 000t.+1.9%
-3.8%
+2.9%+32.7%
DG AGRI C4 Forecast Group March 2009 35
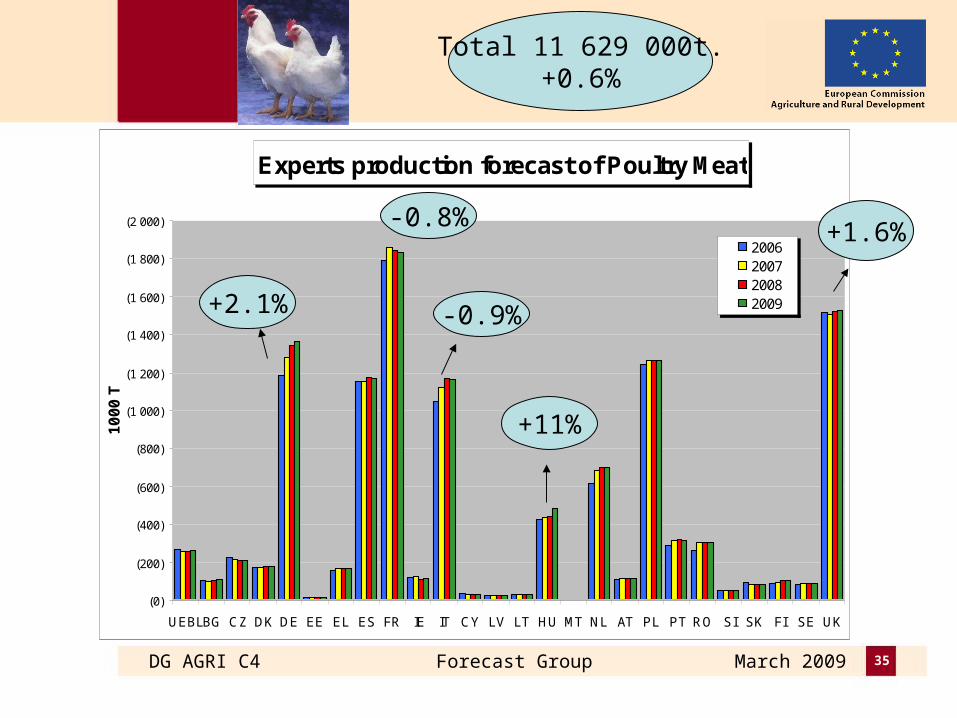
Experts production forecast of Poultry Meat
(0)
(200)
(400)
(600)
(800)
(1 000)
(1 200)
(1 400)
(1 600)
(1 800)
(2 000)
UEBLBG CZ DK DE EE EL ES FR IE IT CY LV LT HU MT NL AT PL PT RO SI SK FI SE UK
10
00
T
2006200720082009
Total 11 629 000t.+0.6%
+2.1%
-0.8%
-0.9%
+11%
+1.6%
DG AGRI C4 Forecast Group March 2009 36
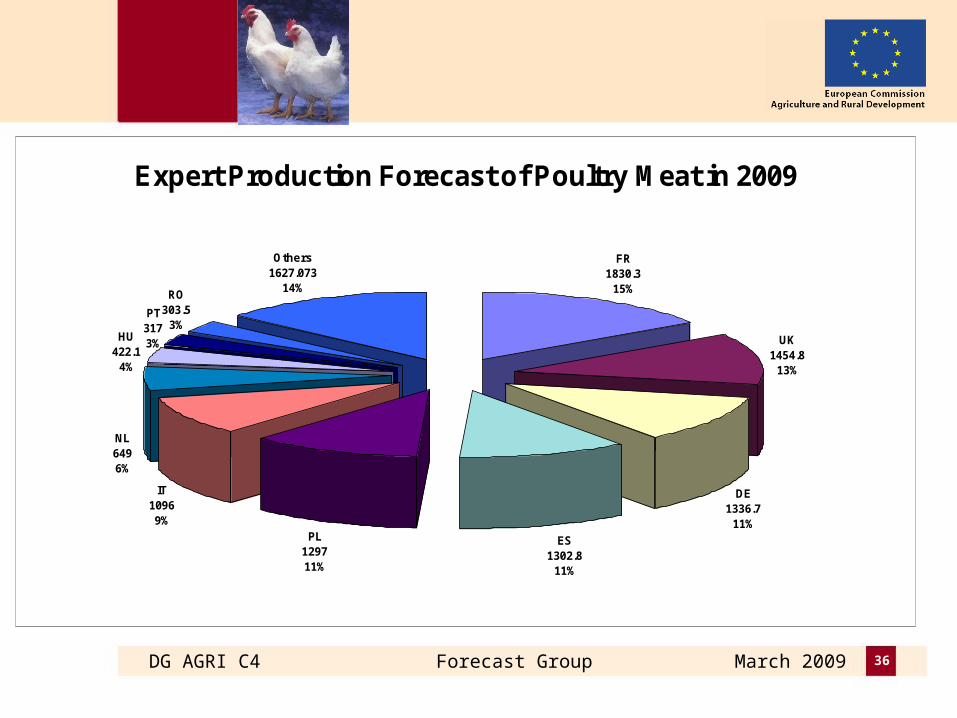
Expert Production Forecast of Poultry Meat in 2009
FR1830.3
15%
UK1454.8
13%
DE1336.7
11%
ES1302.8
11%
PL129711%
IT10969%
NL6496%
HU422.1
4%
PT3173%
RO303.5
3%
Others1627.073
14%
DG AGRI C4 Forecast Group March 2009 37
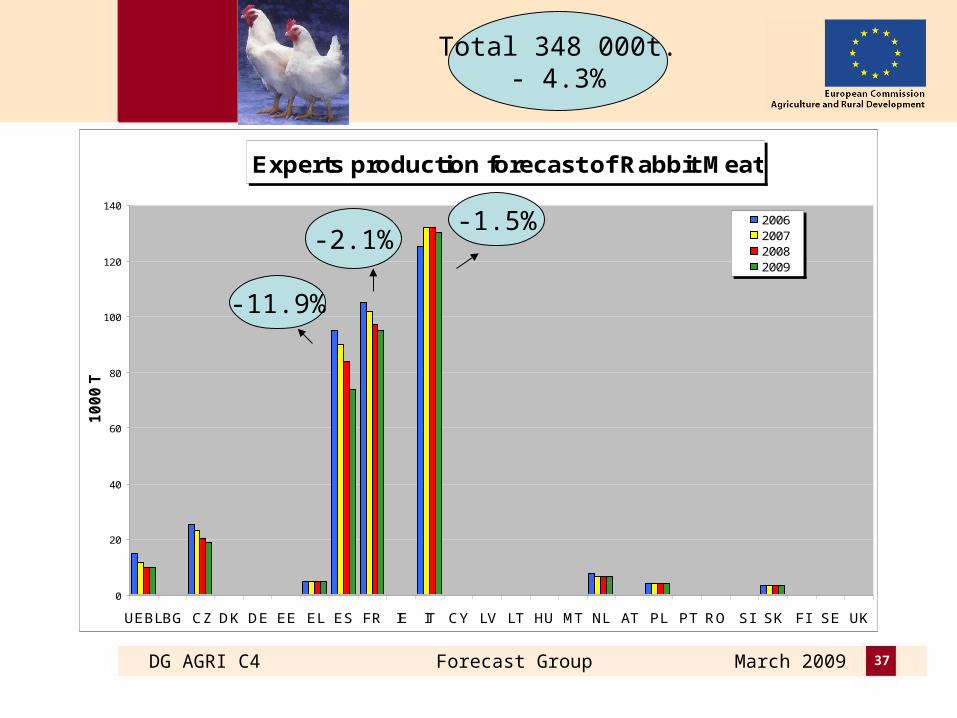
Experts production forecast of Rabbit Meat
0
20
40
60
80
100
120
140
UEBLBG CZ DK DE EE EL ES FR IE IT CY LV LT HU MT NL AT PL PT RO SI SK FI SE UK
10
00
T
2006200720082009
-11.9%
-2.1%-1.5%
Total 348 000t.- 4.3%