Embed Size (px)
Citation preview
The European Private Equity Market Outlook

The European Private Equity Market Outlook
1
Disclaimer The information in this Market Outlook does not constitute the provision of investment, legal, or tax advice. Opinions expressed may change without notice. Opinions expressed may differ from views set out in other documents, including other research published by the European Investment Fund or the European Private Equity and Venture Capital Association. The information in this Market Outlook is provided for informational pur-poses only and without any obligation. No warranty or representation is made as to the correctness, completeness and accuracy of the information given or the assessments made. Reproduction is authorized, except for commercial purposes, provided the source is acknowledged.


3
The European Private Equity Market Outlook
IntroductionThis report provides a general overview of the European private equity (PE) market as of June 2010 based on industry data published by the European Private Equity and Venture Capital Association (EVCA), the European Investment Fund’s (EIF) proprietary data and other third-party sources. The report is a collaboration between the EIF and EVCA.
Compiling and interpreting PE data is notoriously difficult. We therefore aim to com-plement the general overview with views from practitioners who can bring insight and a different perspective. We thank Peter Cornelius of Alpinvest, Katita Palamar of Cogent Partners, Helen Steers of Pantheon Ventures and Thomas Meyer of Deutsche Bank for contributing to this report.
The report is organised into three different sections: an introduction to the global eco-nomic outlook, followed by an overview of the main activity and performance trends in the European PE market, concluding with some perspectives on the future of the industry. We also compare performance trends with the EIF Direct Return Indices (D-Indices). The latter are calculated using the quarterly valuation of companies in the EIF’s portfolio of 330 funds (see Annex 2).

The European Private Equity Market Outlook
4
Table of contents
Executive summary 5
1. Global economic outlook 6
2. European private equity market outlook 10
2.1 Activity trends 10
2.2 Performance trends 18
2.3 EIF D-Indices 19
3. Concluding remarks 22
Annex 1: Acronyms 24
Annex 2: Methodology and Definitions 25
References 32
The European Private Equity Market Outlook
5
Executive summary
Global economic outlook
• The recovery remains “multi-speed”, with its overall pace slowing as the global economy enters a period of consolidation.
• The slowdown is being driven by a decline in inventory restocking and the withdrawal of the unprecedented policy stimulus that had fuelled the recovery since its introduction in mid-2009.
• A weak labour market, housing market concerns and the process of balance-sheet adjust-ment in various sectors are holding back private sector spending.
• Having used most of the tools at their disposal, some policymakers have turned to currency interventions to boost their recoveries. The euro has strengthened considerably against vari-ous currencies in recent months, affecting the competitiveness of certain peripheral Euro-zone countries.
• The economic outlook remains uncertain, and this is reflected in global financial markets, which remain vulnerable to confidence shocks and reliant on government support, and the still reduced availability of leverage.
European private equity market outlook
• In a climate of macroeconomic uncertainty, 2009 was an extremely challenging year for the PE industry. However, preliminary figures for 2010 suggest improving conditions for PE activity, although these are uneven among fundraising, investments and exits.
• Fundraising experienced a modest recovery (EUR 11.0bn raised in H1 2010 compared with EUR 16.1bn raised in the full-year 2009) but remains challenging, with a more significant pick-up expected in late 2011.
• Investments have picked up more substantially: EUR 17.2bn was invested in European com-panies in H1 2010, just 24% below the full-year 2009 figure.
• Exits have also started to recover (EUR 5.7bn in H1 2010 – only 20% below the 2009 level, excluding write-offs), but they have not fully lived up to expectations.
• Net short-term returns have moved back to positive territory, with overall PE one-year hori-zon IRRs as of December 2009 at 5.6% and a further upward trend observed to June 2010.
• As of June 2010, long-term PE returns remained steady, with 10-year and 20-year horizon IRRs of 5.4% and 9.4% respectively.
• EIF D-Indices show that the buyout segment has generally outperformed the venture capital (VC) segment since 2004, but the buyout sector has been hit harder by the crisis.
• The VC ICT sector has outperformed the life sciences sector, according to the EIF D-Indices. On the buyout side, tech (ICT and life sciences) and non-tech (generalist) investments have performed similarly over the years.
The European Private Equity Market Outlook
6
1. Global economic outlook
More recently, there has been something of a slowdown in the recovery as the global econo- my has entered a period of consolidation. According to figures from the International Monetary Fund (IMF1), the Economist Intelli-gence Unit (EIU2) and Roubini Global Econom-ics3, global growth for 2010 is forecast to be in the range of 4.0-4.5%, and 3.4-4.3% for 2011, somewhat lagging behind the 4.5% global average for 2004-8. Advanced economies are forecast to grow at 2.2-2.6% in 2010, and only 1.5-2.4% in 2011, while emerging economies are likely to see growth in the range of 6.8-7.0% in 2010 and 6.0-6.4% in 2011. Growth in 2011 is likely to be weaker as base effects4 dis-sipate, the effects of fiscal stimuli wane and several countries (particularly in the Euro-zone) implement fiscal austerity measures.
The multi-speed nature of the global recovery is reflected in Europe, with the northern and
core Eurozone countries outperforming the periphery. Although overall GDP growth in Q2 2010 in the Eurozone was double that experi-enced in the US, it was driven by Germany and its main trading partners, Austria and the Neth-erlands. Sovereign spreads over the German bund remain wide within the Eurozone due to continued financial market turbulence, and there is acute concern in the markets about the potential cost of Ireland’s bank rescue. The countries of central and eastern Europe, which were particularly hard-hit by the global crisis, are still lagging behind other emerging economies in terms of recovery, particularly those countries that are export-dependent.
The slowdown in the recovery is reflected in global trade growth, which has started to slow from the buoyant rates earlier in the year (Q2 2010 global trade flows grew by 3.6%, compared with 5.0% in Q1). The sluggish recovery is also reflected in purchasing manager index5 (PMI) data. The PMI for glo-bal all-industry output shows some slowing of growth since the beginning of the year, although it remains above the series average, signalling continued expansion. And although rising inflation may appear to suggest that economies are heating up, this is merely the headline figure, which reflects rising com-modity prices and price-level adjustments fol-lowing indirect tax increases. Core inflation remains moderate because of excess capacity in labour and product markets – especially in advanced economies.
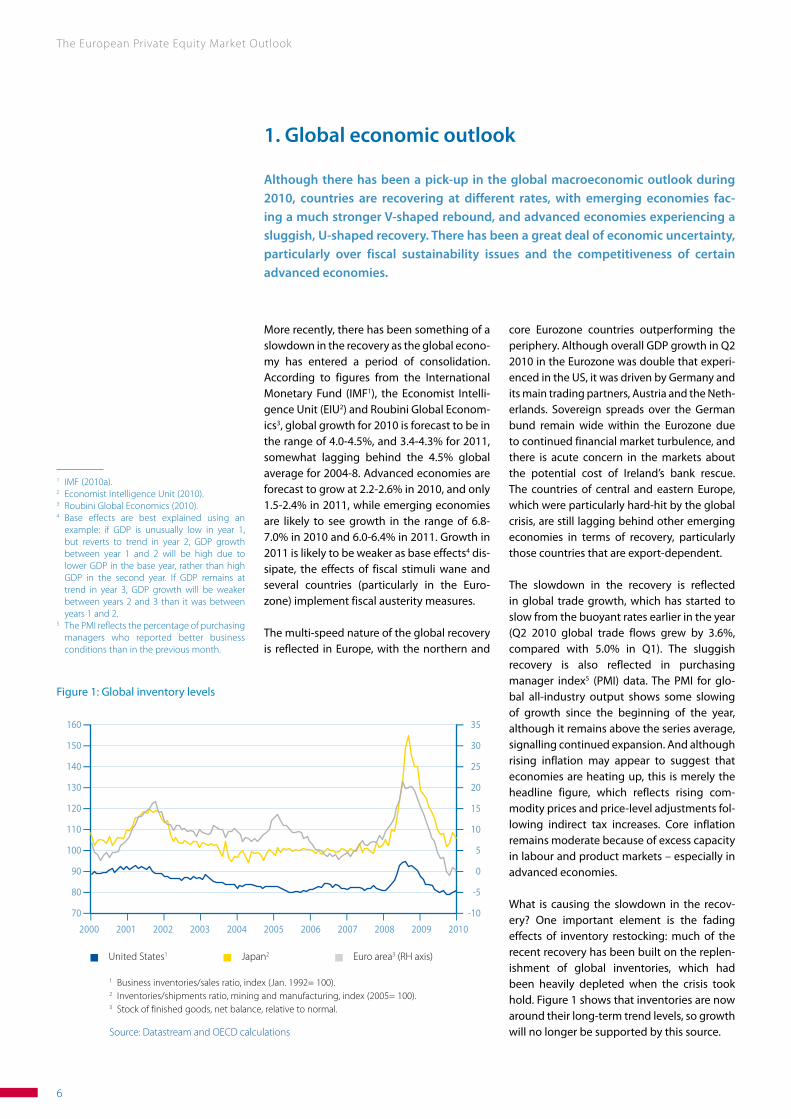
What is causing the slowdown in the recov-ery? One important element is the fading effects of inventory restocking: much of the recent recovery has been built on the replen-ishment of global inventories, which had been heavily depleted when the crisis took hold. Figure 1 shows that inventories are now around their long-term trend levels, so growth will no longer be supported by this source.
1 IMF (2010a).2 Economist Intelligence Unit (2010).3 Roubini Global Economics (2010).4 Base effects are best explained using an
example: if GDP is unusually low in year 1, but reverts to trend in year 2, GDP growth between year 1 and 2 will be high due to lower GDP in the base year, rather than high GDP in the second year. If GDP remains at trend in year 3, GDP growth will be weaker between years 2 and 3 than it was between years 1 and 2.
5 The PMI reflects the percentage of purchasing managers who reported better business conditions than in the previous month.
1 Business inventories/sales ratio, index (Jan. 1992= 100).2 Inventories/shipments ratio, mining and manufacturing, index (2005= 100).3 Stock of finished goods, net balance, relative to normal.
Source: Datastream and OECD calculations
Figure 1: Global inventory levels
160
150
140
130
120
110
100
90
80
70
35
30
25
20
15
10
5
0
-5
-10I I I I I I I I I I I2000 2001 2002 2003 2004 2005 2006 2007 2008 2009 2010
United States1 Japan2 Euro area3 (RH axis)
Although there has been a pick-up in the global macroeconomic outlook during 2010, countries are recovering at different rates, with emerging economies fac-ing a much stronger V-shaped rebound, and advanced economies experiencing a sluggish, U-shaped recovery. There has been a great deal of economic uncertainty, particularly over fiscal sustainability issues and the competitiveness of certain advanced economies.

The European Private Equity Market Outlook
7
Another important factor is the withdrawal of the policy stimuli that had fuelled the recov-ery since their introduction in mid-2009. Many advanced economies have started the transition from fiscal stimulus to austerity, in the face of rising debt. The gamble they are taking is that consumer confidence will be boosted by prudent economic management, and that private consumption will step in to compensate for reduced public spending. However, this strategy has yet to bear fruit, as the private sector does not appear to be fully convinced of the commitment of some countries to fiscal consolidation. Furthermore, weak labour and housing markets and the process of balance-sheet adjustment6 in vari-ous sectors are all holding back private sector spending.
Policymakers have by now used most of the tools at their disposal. Monetary policy has seen interest rates reduced to a minimum, quantitative easing has been introduced, and fiscal policy has been used to the extent pos-sible without causing confidence crises. This in part explains the current global trend towards currency interventions: in the face of weak domestic demand, countries are attempting to increase their GDP by developing their export markets. Recently the dollar fell after the Fed-eral Reserve made it clear it was prepared to act to counter excessively low inflation. Japan undertook its first intervention in six years in mid-September, in order to address the fact that the yen was at its highest nominal rate against the dollar since 1995. Switzerland’s for-eign reserves have quadrupled over the past two years. And it is well known that China has built up huge reserves to keep the yuan stable against the dollar. This has caused the euro to strengthen in relative terms, making it harder for European exporters to compete.
The loss of the exchange rate as a policy tool is proving particularly challenging for certain peripheral euro-zone countries that are suf-fering an acute lack of competitiveness. Their problems are a hangover from the introduc-tion of the euro, when the drop in real interest rates – particularly in Ireland, Greece and Spain – caused a consumer boom, pushing up unit wage costs, reducing competitiveness and giv-ing rise to large current account deficits. The problem is clearly demonstrated by comparing
the real effective exchange rates7 of the coun-tries of the Eurozone as shown in figure 2.
In the absence of the devaluation option, improving competitiveness requires either wage cuts or increases in productivity. The former is difficult to implement in conjunc-tion with fiscal austerity. Ultimately the weaker countries need to undertake structural reforms to improve their competitiveness.
6 Balance-sheet adjustment in this instance refers to changes in private sector debt and saving levels.
7 The real effective exchange rate is the weighted average of a country’s currency relative to an index or basket of other major currencies adjusted for the effects of inflation; the weightings are determined based on relative trade balances. It is used as a measure of the country’s external competitiveness.
Source: BIS Statistical Database, www.bis.org
Figure 2: Real effective exchange rates, Q2 2010
108
106
104
102
100
98
96
94 I I I I I I I I I I I I I
1999
Q1=
100
Greec
e
Spain
Belg
ium
Irelan
dPo
rtugal
Italy
Austria
Finlan
dEu
ro ar
eaNet
herlan
dsFra
nce
Germ
any
There is still no consensus among the mem-bers of the Eurozone as to whether countries with a trade surplus, such as Germany, should do more to address the Eurozone’s prob-lems by encouraging domestic consumption. Therefore the economic outlook remains par-ticularly uncertain. A double-dip recession remains a distinct possibility, although most economists believe a sluggish recovery in the medium term to be a more likely outcome.
Souce: EIU, Country Forecast, September 2010
Table 1: Real GDP growth (in %)
2009 2010(f) 2011(f) 2012(f) 2013(f) 2014(f)
Global -0.7 4.4 3.6 4.0 4.1 4.2US -2.6 2.3 1.5 1.9 2.3 2.4EU 27 -4.2 0.9 1.0 1.5 1.8 1.9EU 15 -4.2 1.4 1.0 1.3 1.5 1.7LATAM -2.1 5.2 3.6 4.1 4.2 4.4

The European Private Equity Market Outlook
8
The IMF Global Financial Stability Map8 illus-trates the stability of global financial mar-kets as of October 2010, and their evolution since October 2009 (see figure 3). Stability is assessed by estimating the key financial risks (macroeconomic risk, emerging market risk, credit risk, market and liquidity risk) and the two dimensions that assess general market conditions (monetary and financial condi-tions, and risk appetite).
According to the IMF, progress towards glo-bal financial stability has stuttered over the past six months. The turmoil in sovereign debt markets has exposed the vulnerability of bank and sovereign balance sheets, and the outlook is insecure despite interventions by European policymakers. Macroeconomic risks have heightened and, as discussed ear-lier, the recovery has begun to lose steam, as uncertainty has begun to take its toll on consumer confidence and other leading indicators have started to retract. Economic uncertainty, continuing deleveraging and sov-ereign spillovers mean that core banking sys-tems remain vulnerable to confidence shocks and remain reliant on government support. As a result, the improvement in credit risks that had been seen earlier in the year appears to have paused. Although the European poli- cy response discussed earlier was successful in addressing the rise in market and liquidity risks of April and May, the banking sector still has sizeable refinancing needs. These, along with the steps taken by central banks to start unwinding support measures introduced in response to the global credit crisis, have caused a tightening of monetary and financial conditions. Finally, the limited extent of spill-overs from the European sovereign debt tur-moil have meant that emerging markets have been somewhat protected, causing emerging market risk to decline.
8 IMF (2010b). 9 Closer to the centre signifies lower risk, tighter
monetary and financial conditions or reduced risk appetite.
Source: IMF, Global Financial Stability Report, October 2010
Emerging market risk
Risk appetite
Market and liquidity riskMonetary and financial conditions
Macroeconomic risk Credit risk
Figure 3: IMF Global Financial Stability Map9
Oct-09 Apr-10 Oct-10
0
1234
56789
10
Source: Bloomberg
Last 10y EU historical average 26%
Figure 4: DJ Eurostoxx 50 and Eurozone volatility index vs. EU confidence index
155 145 135 125 115 105
95 85 75 65 55 45 35 25 15
5
140
120
100
80
60
40
20
0I I I I I I I I I I I I I I I I I I I I I I I I
Eurozone Volatily index DJ EUROSTOXX 50 (rebased 03-1999) EU Business Confidence (RH axis)
Last 10y historical average Confidence index 100.41
DJ E
uros
toxx
50
reba
sed
and
Euro
pean
Vol
atili
ty in
dex
Euro
zone
Con
fiden
ce in
dex
Mar
-199
9Se
p-199
9M
ar-2
000
Sep-2
000
Mar
-200
1Se
p-200
1 M
ar-2
002
Sep-2
002
Mar
-200
3Se
p-200
3M
ar-2
004
Sep-2
004
Mar
-200
5Se
p-200
5M
ar-2
006
Sep-2
006
Mar
-200
7Se
p-200
7M
ar-2
008
Sep-2
008
Mar
-200
9Se
p-200
9M
ar-2
010
Sep-2
010
The European Private Equity Market Outlook
9
Stock markets have continued to recover from 2008 losses and volatilities and confi-dence indices are back to their historical aver-ages (see figure 4). However, the outlook in the short term is still uncertain and it is diffi-cult to draw conclusions on the future trend of the market.
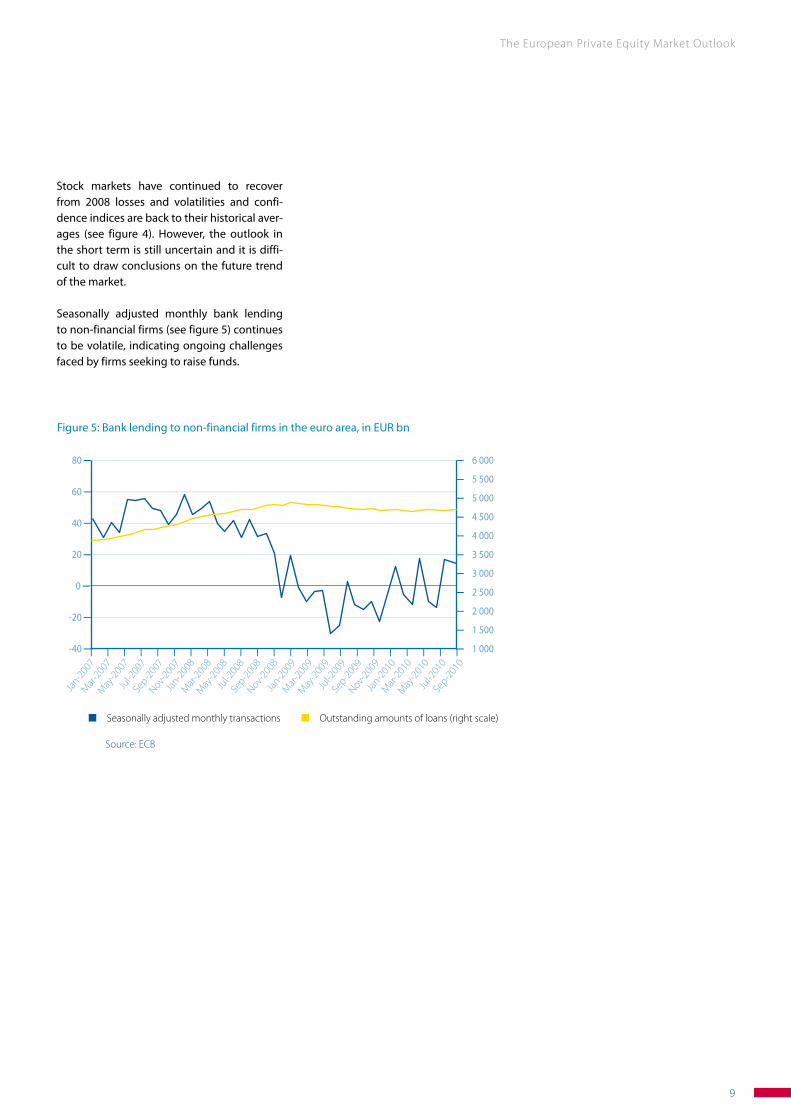
Seasonally adjusted monthly bank lending to non-financial firms (see figure 5) continues to be volatile, indicating ongoing challenges faced by firms seeking to raise funds.
Source: ECB
Jan-2
007
Mar
-200
7M
ay-2
007
Jul-2
007
Sep-2
007
Nov-20
07Ja
n-200
8M
ar-2
008
May
-200
8Ju
l-200
8Se
p-200
8Nov-
2008
Jan-2
009
Mar
-200
9M
ay-2
009
Jul-2
009
Sep-2
009
Nov-20
09Ja
n-201
0M
ar-2
010
May
-201
0Ju
l-201
0Se
p-201
0
Figure 5: Bank lending to non-financial firms in the euro area, in EUR bn
80
60
40
20
0
-20
-40
6 000
5 500
5 000
4 500
4 000
3 500
3 000
2 500
2 000
1 500
1 000I I I I I I I I I I I I I I I I I I I I I I I
Seasonally adjusted monthly transactions Outstanding amounts of loans (right scale)
The European Private Equity Market Outlook
10
2. European private equity market outlook
2.1 Activity trends
Overview
One of the biggest issues faced by the indus-try has been the challenging fundraising envi-ronment. In 2009, following a decrease in fund valuations, investors suffered a loss of confi-dence and reduced the level of new commit-ments. The problem was exacerbated by the denominator effect and Limited Partners’ (LPs) liquidity constraints as distributions dried up.
Nevertheless, most LPs seem to remain com-mitted to PE in the long term, continuing to trust the industry’s ability to deliver competi-tive returns. A survey conducted by Preqin in June 201010, which observed a large and varied sample of institutional investors, revealed that 87%11 of the respondents intend to increase (39%) or maintain (48%) the number of relation-ships they have with general partners (GPs).
Fundraising will most likely remain challeng-ing beyond the end of 2010 and start picking up more substantially in late 2011. But in the long term, 36% of the respondent LPs expect an increase in their allocation to the asset class while only 2% intend to decrease it.
Investment activity bottomed out in 2009 due to macroeconomic uncertainty, reduced availability of leverage and mismatching views on pricing between sellers and buy-ers. However, investment levels started pick-ing up in H1 2010, with Q2 2010 achieving the highest quarterly amount invested since Q3 2008. EVCA activity data for 2009 and H1 2010 reveal a striking amount of capital directed to existing portfolio companies. PE firms con-centrated on their existing portfolios, helping them through the crisis via additional equity support, internal diligence and carefully man-aged restructurings. Coupled with the fact that the number of investments made by the industry declined only marginally com-pared with recent years, this demonstrates PE firms’ support for European businesses at a time when other funding options almost dis-appeared.12 What’s more, the vast majority of companies receiving PE backing were small and medium-sized enterprises (SMEs) – the backbone of European economic growth.
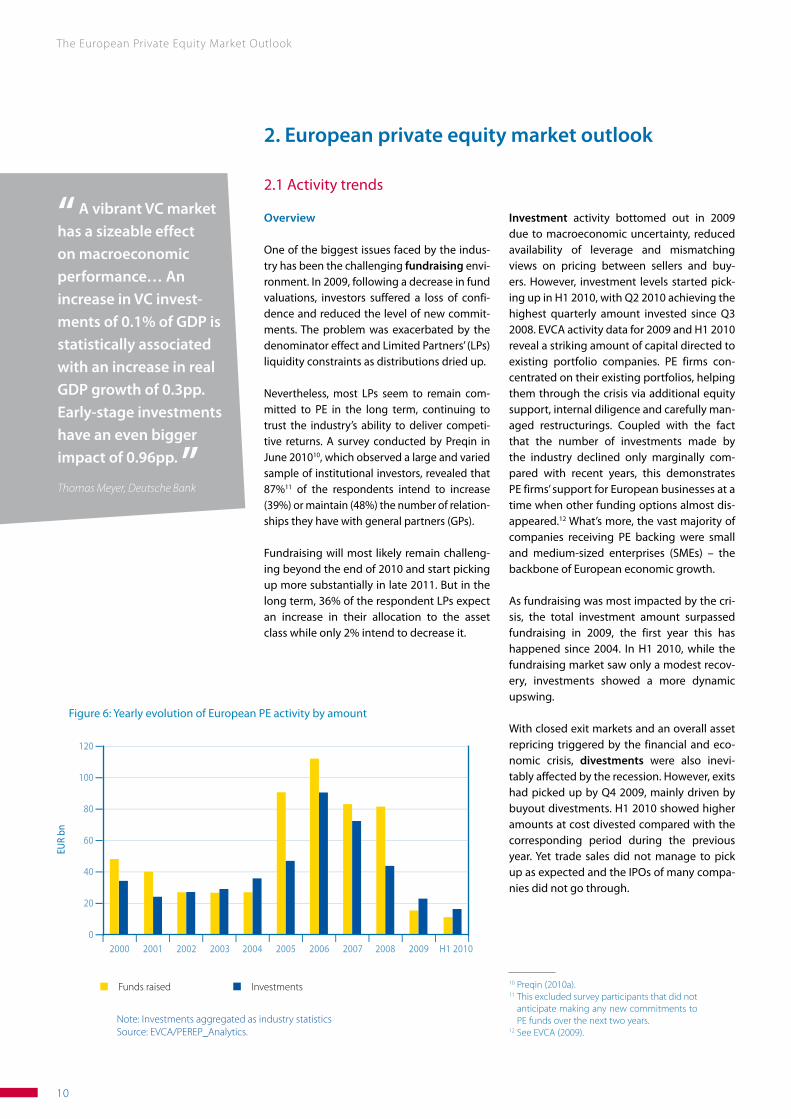
As fundraising was most impacted by the cri-sis, the total investment amount surpassed fundraising in 2009, the first year this has happened since 2004. In H1 2010, while the fundraising market saw only a modest recov-ery, investments showed a more dynamic upswing.
With closed exit markets and an overall asset repricing triggered by the financial and eco-nomic crisis, divestments were also inevi- tably affected by the recession. However, exits had picked up by Q4 2009, mainly driven by buyout divestments. H1 2010 showed higher amounts at cost divested compared with the corresponding period during the previous year. Yet trade sales did not manage to pick up as expected and the IPOs of many compa-nies did not go through.
10 Preqin (2010a).11 This excluded survey participants that did not
anticipate making any new commitments to PE funds over the next two years.
12 See EVCA (2009).
“ A vibrant VC market has a sizeable effect on macroeconomic performance… An increase in VC invest-ments of 0.1% of GDP is statistically associated with an increase in real GDP growth of 0.3pp. Early-stage investments have an even bigger impact of 0.96pp. ”Thomas Meyer, Deutsche Bank
Note: Investments aggregated as industry statisticsSource: EVCA/PEREP_Analytics.
Figure 6: Yearly evolution of European PE activity by amount
120
100
80
60
40
20
0 I I I I I I I I I I I I
EUR
bn
Funds raised Investments
2000 2001 2002 2003 2004 2005 2006 2007 2008 2009 H1 2010

The European Private Equity Market Outlook
11
Fundraising – the hardest challenge
As valuations stabilised, fundraising activity showed a modest recovery in H1 2010 (with EUR 11.0bn raised in H1 2010 compared with EUR 16.1bn raised in the full-year 2009). How-ever, this uptick needs to be viewed with caution, as the growth was driven mainly by three EUR 1bn+ funds. On the other hand, this development shows that some confidence in the upper (EUR 1bn+) end of the market is coming back. Quarterly VC fundraising figures increased in Q1 2010 (by about one-fifth, to EUR 1.1bn) but fell back again in Q2 2010 (by more than 60%, to EUR 376m) reaching close to the Q3 2009 level, the lowest quarterly VC fundraising in 2009.
By number of funds reaching final closing, H1 2010 – at 51 funds – is well on track to exceed the 2009 final closings (66 funds) by year-end.
In H1 2010, most of the funds reaching final closings were VC funds (23 venture funds out of a total of 51 funds with final closings), simi-lar to 2009 fundraising which was also domi-nated by VC funds, with 34 final closings. VC’s share of final closings in 2007 and 2008 had been about a third.
When looking at the upper end of the market, only five EUR 1bn+ funds were raised from the beginning of 2009 until the end of H1 2010, compared with 15 such funds raised in 2008, and 12 in 2007. As for the mid-market activ-ity, the funds that reached final closings in H1 2010 were similar to those of 2009 – the main differences being a slightly lower concentra-tion in the EUR 50m–EUR 149m space and a shift away from EUR 250m–EUR 499m funds into the EUR 500m–EUR 999m range.
Preliminary figures for H1 2010 seem to con-firm some shifts in the investor base for Euro-pean PE funds, namely pension funds losing their lead role in capital commitments, to the benefit of banks and sovereign wealth funds. According to Peter Cornelius of AlpInvest, this is driven by the considerable funding chal-lenges that pension funds face amid record low interest rates. Sovereign wealth funds picked up the pace during H1 2010. Banks were the only major capital contributor to European fundraising in both 2009 and 2010.
Source: EVCA/PEREP_Analytics
Figure 7: Quarterly fundraising evolution: 2007 – Q2 2010
84
72
60
48
36
24
12
0 I I I I I
EUR
bn
2007 2008 2009 2010
Q1 Q2 Q3 Q4
2517
5 7
23
24
34
1520
44
20 20
The longer average time spent “on the road” in the fundraising effort shows the difficult mar-ket conditions faced by fund managers for H1 2010 (figure 8).
Source: Preqin, Q3 2010 Fundraising Overview (global data)
Figure 8: Time spent fundraising for funds closed in Q3 2010
30%
25%
20%
15%
10%
5%
0% I I I I I I I I
Prop
ortio
n of
fund
s clo
sed
(%)
Time “on the road” (months)
9%
19%
27%
21%
15%
3%
6%
1-6 months
7-12 months
13-18 months
19-24 months
24-30 months
31-36months
37 + months

The European Private Equity Market Outlook
12
“ Several major factors were responsible for sup-pressed fundraising levels in 2009. First, the denomina-tor effect meant that many LPs were unable to commit to new funds. Additionally lower distributions exacer-bated the LPs’ general liquid-ity constraints. Second, private equity firms’ portfolios needed attention due to the severity of the downturn, which also meant that GPs were spend-ing a considerable amount of time focusing on their existing portfolio companies, rather than searching for new deals. Third, as leverage became more difficult to come by, deal activity declined in 2009, with potential sellers of businesses unwilling to sell at depressed valuations. There was a clear mismatch between seller and buyer price expectations, which resulted in few deals being closed in 2009, particu-larly as there was uncertainty about sales and profit fore-casts. ”
Helen Steers, Pantheon Ventures
The time on the road increased steadily since 2007 (figure 9). The biggest leap was in 2008 (from an average of 12 months for funds closed in 2007 to 15 months in 2008), and 2009 (to an average of 18.6 months). 2010 funds spent one more month on the road than 2009 funds.
The depressed market conditions led to a further decrease of the total amount raised by PE funds in 2009, driven by the reduction of fund target sizes by GPs and the adoption by LPs of revised strategies using smaller average ticket sizes and reduced portfolios.
Overall, taking into account the cyclical nature of fundraising – and the very high levels of funds committed to European PE between 2006 and 2008 – a large part of the industry still had considerable capital to invest. Never-theless, this would represent about two years of investment activity (see figure 10). Therefore, we might expect that the need to come back to the market will increase in 2011.
Source: Preqin (global data)
Figure 9: Average time taken for funds to achieve a final close
20
15
10
5
0 I I I I I I I I
Aver
age
nr. o
f mon
ths
Year of final closing
2004 2005 2006 2007 2008 2009 H1 2010
I I I I I I I I I I I I
Year
s
EUR
bn
2000 2001 2002 2003 2004 2005 2006 2007 2008 2009 H1 2010
Source: EIF on EVCA activity data
Figure 10: Ratio of cumulative undrawn capital to five-year-average investment activity – Europe
3.0
2.5
2.0
1.5
1.0
0.5
0.0
80
70
60
50
40
30
20
10
0
Yearly investment activity (EUR bn – RH axis)
Ratio of cumulative undrawn capital over 5y-avg. investment (years)
Linear (yearly investment activity (EUR bn))
The European Private Equity Market Outlook
13
“ Improved financing conditions have allowed the refinancing of exist-ing portfolio companies to address the maturing
wall of debt falling due over the next few years. Such conditions include
the fall in high-yield cor-porate bond spreads
to a level close to their long-term average and the increase in institu-
tional investors’ demand for leveraged loans. ”
Peter Cornelius, Alpinvest
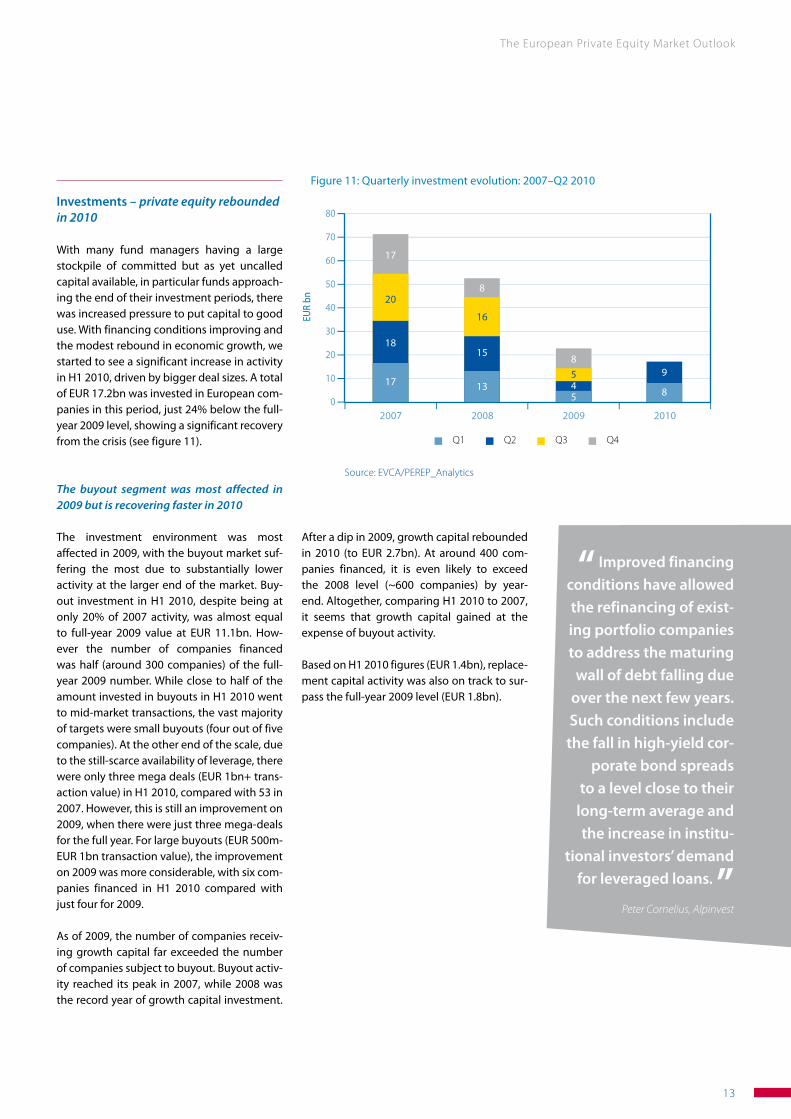
Source: EVCA/PEREP_Analytics
Figure 11: Quarterly investment evolution: 2007–Q2 2010
80
70
60
50
40
30
20
10
0 I I I I I
EUR
bn
2007 2008 2009 2010
17 1354
89
8
15
8
18
20
16
5
17
Q1 Q2 Q3 Q4
Investments – private equity rebounded in 2010
With many fund managers having a large stockpile of committed but as yet uncalled capital available, in particular funds approach-ing the end of their investment periods, there was increased pressure to put capital to good use. With financing conditions improving and the modest rebound in economic growth, we started to see a significant increase in activity in H1 2010, driven by bigger deal sizes. A total of EUR 17.2bn was invested in European com-panies in this period, just 24% below the full-year 2009 level, showing a significant recovery from the crisis (see figure 11).
The buyout segment was most affected in 2009 but is recovering faster in 2010
The investment environment was most affected in 2009, with the buyout market suf-fering the most due to substantially lower activity at the larger end of the market. Buy-out investment in H1 2010, despite being at only 20% of 2007 activity, was almost equal to full-year 2009 value at EUR 11.1bn. How-ever the number of companies financed was half (around 300 companies) of the full-year 2009 number. While close to half of the amount invested in buyouts in H1 2010 went to mid-market transactions, the vast majority of targets were small buyouts (four out of five companies). At the other end of the scale, due to the still-scarce availability of leverage, there were only three mega deals (EUR 1bn+ trans-action value) in H1 2010, compared with 53 in 2007. However, this is still an improvement on 2009, when there were just three mega-deals for the full year. For large buyouts (EUR 500m-EUR 1bn transaction value), the improvement on 2009 was more considerable, with six com-panies financed in H1 2010 compared with just four for 2009.
As of 2009, the number of companies receiv-ing growth capital far exceeded the number of companies subject to buyout. Buyout activ-ity reached its peak in 2007, while 2008 was the record year of growth capital investment.
After a dip in 2009, growth capital rebounded in 2010 (to EUR 2.7bn). At around 400 com-panies financed, it is even likely to exceed the 2008 level (~600 companies) by year-end. Altogether, comparing H1 2010 to 2007, it seems that growth capital gained at the expense of buyout activity.
Based on H1 2010 figures (EUR 1.4bn), replace-ment capital activity was also on track to sur-pass the full-year 2009 level (EUR 1.8bn).
The European Private Equity Market Outlook
14
“ In terms of indus-tries, buyouts have been broad-based, with more cyclical industries accounting for around half the transaction volume. Purchase multiples have been relatively high, reflect-ing strong competition including cash-rich strategic buyers. ”Peter Cornelius, Alpinvest
“ In contrast to lev-eraged buyouts, ven-ture capital transactions have remained sub-dued. Although the substantial decline in investment activity in this market segment appears to have bot-tomed out, there have been few signs of a sus-tained recovery yet. ”Peter Cornelius, Alpinvest
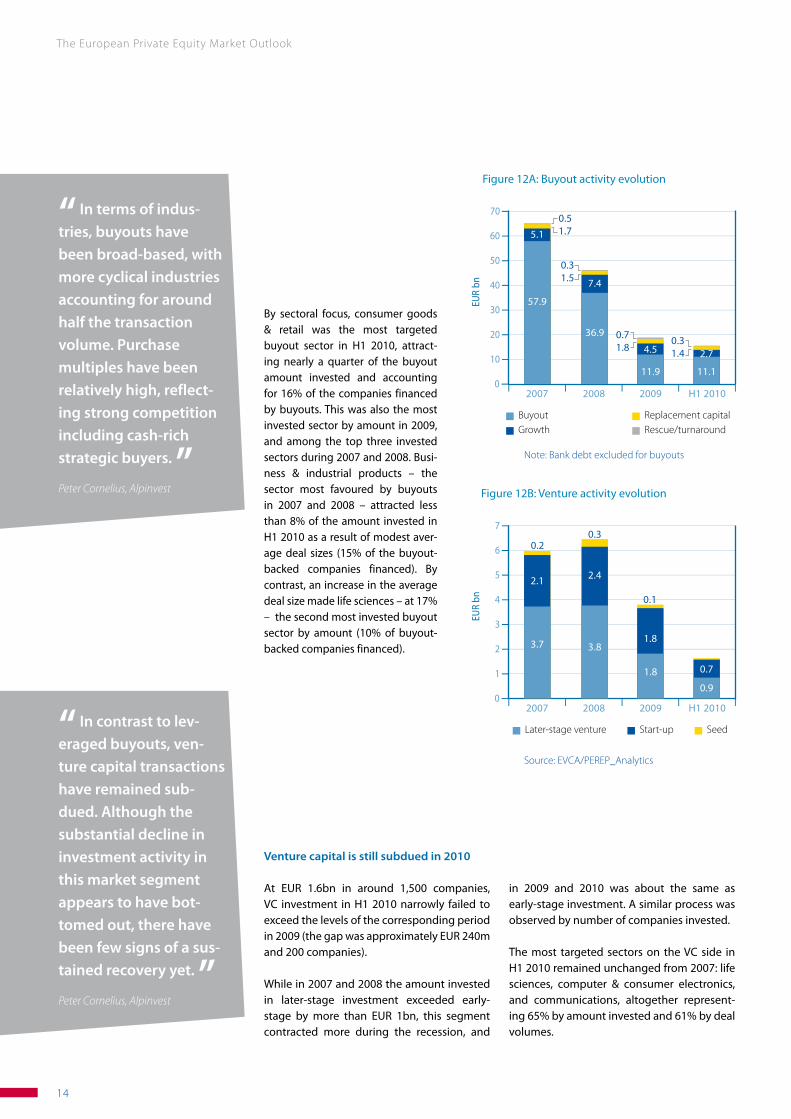
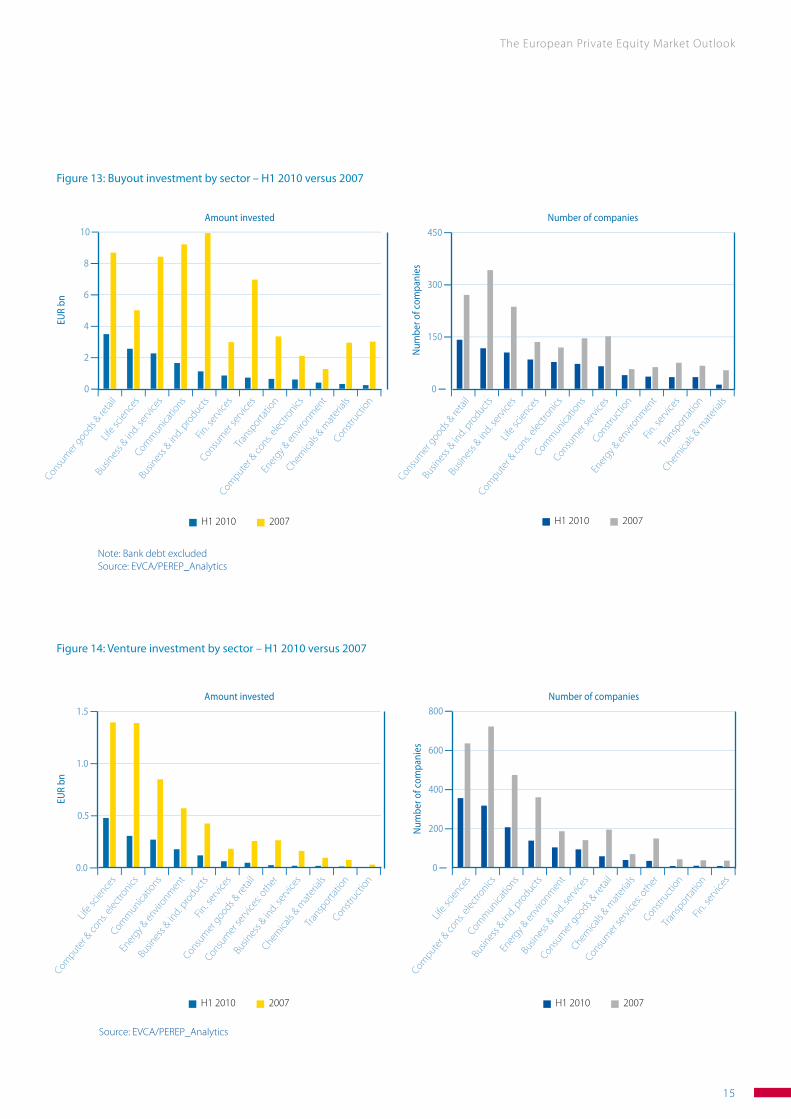
By sectoral focus, consumer goods & retail was the most targeted buyout sector in H1 2010, attract-ing nearly a quarter of the buyout amount invested and accounting for 16% of the companies financed by buyouts. This was also the most invested sector by amount in 2009, and among the top three invested sectors during 2007 and 2008. Busi-ness & industrial products – the sector most favoured by buyouts in 2007 and 2008 – attracted less than 8% of the amount invested in H1 2010 as a result of modest aver-age deal sizes (15% of the buyout-backed companies financed). By contrast, an increase in the average deal size made life sciences – at 17% – the second most invested buyout sector by amount (10% of buyout-backed companies financed).
Figure 12A: Buyout activity evolution
70
60
50
40
30
20
10
0 I I I I I
EUR
bn
2007 2008 2009 H1 2010
Buyout Growth
Replacement capital Rescue/turnaround
57.9
0.51.75.1
36.9
0.31.5 7.4
0.71.8
0.31.4
11.9 11.1
4.5 2.7
Source: EVCA/PEREP_Analytics
Note: Bank debt excluded for buyouts
Figure 12B: Venture activity evolution
7
6
5
4
3
2
1
0 I I I I I
EUR
bn
2007 2008 2009 H1 2010
Later-stage venture Start-up Seed
3.7
0.20.3
0.1
2.1
3.8
2.4
1.8
1.8
0.9
0.7
Venture capital is still subdued in 2010
At EUR 1.6bn in around 1,500 companies, VC investment in H1 2010 narrowly failed to exceed the levels of the corresponding period in 2009 (the gap was approximately EUR 240m and 200 companies).
While in 2007 and 2008 the amount invested in later-stage investment exceeded early-stage by more than EUR 1bn, this segment contracted more during the recession, and
in 2009 and 2010 was about the same as early-stage investment. A similar process was observed by number of companies invested.
The most targeted sectors on the VC side in H1 2010 remained unchanged from 2007: life sciences, computer & consumer electronics, and communications, altogether represent-ing 65% by amount invested and 61% by deal volumes.
The European Private Equity Market Outlook
15
Note: Bank debt excludedSource: EVCA/PEREP_Analytics
Figure 13: Buyout investment by sector – H1 2010 versus 2007
10
8
6
4
2
0
450
300
150
0 I I I I I I I I I I I I I I I I I I I I I I I I I I
EUR
bn
Num
ber o
f com
pani
es
Amount invested Number of companies
Consum
er g
oods & re
tail
Consum
er g
oods & re
tail
Busin
ess &
ind. s
ervic
es
Busin
ess &
ind. s
ervic
es
Comm
unicatio
ns
Life s
cience
s
Busin
ess &
ind. p
roduct
s
Compute
r & co
ns. ele
ctro
nics
Fin. s
ervic
es
Comm
unicatio
ns
Consum
er se
rvice
s
Consum
er se
rvice
s
Transp
ortatio
n
Construct
ion
Compute
r & co
ns. ele
ctro
nics
Ener
gy & en
vironm
ent
Ener
gy & en
vironm
ent
Fin. s
ervic
es
Chemica
ls & m
ater
ials
Transp
ortatio
n
Construct
ion
Chemica
ls & m
ater
ials
Life s
cience
s
Busin
ess &
ind. p
roduct
s
H1 2010 2007 H1 2010 2007
Figure 14: Venture investment by sector – H1 2010 versus 2007
1.5
1.0
0.5
0.0 I I I I I I I I I I I I I
EUR
bn
Amount invested
Compute
r & co
ns. ele
ctro
nics
Life s
cience
sEn
ergy &
envir
onmen
t
Busin
ess &
ind. p
roduct
sFin
. ser
vices
Consum
er g
oods & re
tail
Consum
er se
rvice
s: oth
er
Busin
ess &
ind. s
ervic
es
Chemica
ls & m
ater
ials
Transp
ortatio
nConstr
uctio
n
Comm
unicatio
ns
800
600
400
200
0 I I I I I I I I I I I I I
Num
ber o
f com
pani
es
Number of companies
Compute
r & co
ns. ele
ctro
nics
Life s
cience
sBu
sines
s & in
d. pro
ducts
Ener
gy & en
vironm
ent
Busin
ess &
ind. s
ervic
es
Consum
er g
oods & re
tail
Chemica
ls & m
ater
ials
Consum
er se
rvice
s: oth
erConstr
uctio
nTra
nsporta
tion
Fin. s
ervic
es
Comm
unicatio
ns
H1 2010 2007 H1 2010 2007
Source: EVCA/PEREP_Analytics
The European Private Equity Market Outlook
16
Source: EVCA/PEREP_Analytics
Figure 15: Divestment evolution by amount at cost divested (write-offs excluded)
30
25
20
15
10
5
0
30
25
20
15
10
5
0 I I I I I I I I I I
EUR
bn
EUR
bn
Num
ber o
f com
pani
es d
ives
ted
2007 20072008 20082009 2009H1 2010 H1 2010
Amount divested at cost
Number of companies divested
26.2
2,323
1,771
1,360
74212.9
7.0 5.7
2,500
2,000
1,500
1,000
500
01.01.1
8.2
5.5
6.6
5.9
3.3
4.2
2.13.2
2.02.9
3.42.3
Q1 Q2 Q3 Q4
13 This is the approach used to estimate the number of portfolio companies held by private equity firms.
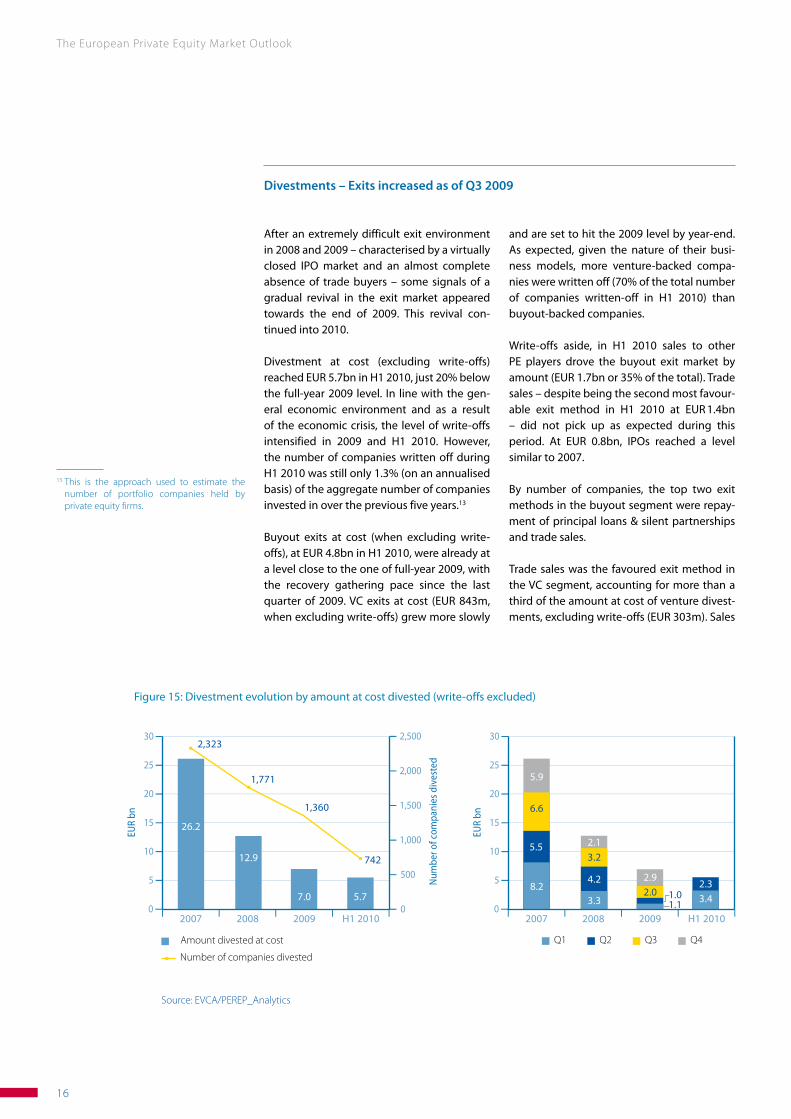
After an extremely difficult exit environment in 2008 and 2009 – characterised by a virtually closed IPO market and an almost complete absence of trade buyers – some signals of a gradual revival in the exit market appeared towards the end of 2009. This revival con- tinued into 2010.
Divestment at cost (excluding write-offs) reached EUR 5.7bn in H1 2010, just 20% below the full-year 2009 level. In line with the gen-eral economic environment and as a result of the economic crisis, the level of write-offs intensified in 2009 and H1 2010. However, the number of companies written off during H1 2010 was still only 1.3% (on an annualised basis) of the aggregate number of companies invested in over the previous five years.13
Buyout exits at cost (when excluding write-offs), at EUR 4.8bn in H1 2010, were already at a level close to the one of full-year 2009, with the recovery gathering pace since the last quarter of 2009. VC exits at cost (EUR 843m, when excluding write-offs) grew more slowly
and are set to hit the 2009 level by year-end. As expected, given the nature of their busi-ness models, more venture-backed compa-nies were written off (70% of the total number of companies written-off in H1 2010) than buyout-backed companies.
Write-offs aside, in H1 2010 sales to other PE players drove the buyout exit market by amount (EUR 1.7bn or 35% of the total). Trade sales – despite being the second most favour-able exit method in H1 2010 at EUR 1.4bn – did not pick up as expected during this period. At EUR 0.8bn, IPOs reached a level similar to 2007.
By number of companies, the top two exit methods in the buyout segment were repay-ment of principal loans & silent partnerships and trade sales.
Trade sales was the favoured exit method in the VC segment, accounting for more than a third of the amount at cost of venture divest-ments, excluding write-offs (EUR 303m). Sales
Divestments – Exits increased as of Q3 2009

The European Private Equity Market Outlook
17
Source: EVCA/PEREP_Analytics
Figure 16: Buyout divestment evolution by exit route (amount at cost divested)
24,000
20,000
16,000
12,000
8,000
4,000
0 I I I I I
EUR
m
2007 2008 2009 H1 2010
3,642
5
1,7754,084
2,762 1,3741,669
8,690
3,692
5,985
2,9131,532 1,098
3,474451
710
227692
366
2,873847542
710
566
368
Divestment by other means Repayment of principal loans & silent partnerships
Sale to another PE player
Write-off Public offering (IPO & sale of quoted equity)
Trade sale
Divestment by other means Repayment of principal loans & silent partnerships
Sale to another PE player
Write-off Public offering (IPO & sale of quoted equity)
Trade sale
“ While secondary transactions have
provided an important exit route, private equity
fund managers have also taken advantage of improved conditions in
the M&A and IPO markets, which have
permitted them to increase distributions
to their limited partners. ”
Peter Cornelius, Alpinvest
Source: EVCA/PEREP_Analytics
Figure 17: Venture divestment evolution by exit route (amount at cost divested)
4,000
3,500
3,000
2,500
2,000
1,500
1,000
500
0 I I I I I
EUR
m
2007 2008 2009 H1 2010
348
5
718987
173329
677
303
388
235 317
141
1,116
639
414
588
283
340
463
32188
168145
86
111
to another PE firm and repayment of princi-pal loans & silent partnerships followed some way behind, each with 17% of the total. There were few IPOs for SMEs in the VC arena. By number of companies divested, the top-rank-ing exit methods (excluding write-offs) on the VC side were similar to those of buyouts: repayment of principal loans & silent partner-ships and trade sales.
The PE activity for H1 2010 is a two-sided story. While deal flow clearly picked up, fund- raising showed no major improvement in the number of funds reaching final closing, and while there was an increase in exits, it was below expectations. Moreover, it is not yet possible to determine if even this mod-est increase in divestments is driven by ˝exit-ready˝ companies that were earlier kept in portfolios because of the exit market condi-tions, or by a general pick-up in the market itself. 2011 will determine whether PE activity will show a definitive market rebound.
The European Private Equity Market Outlook
18
2.2 Performance trends
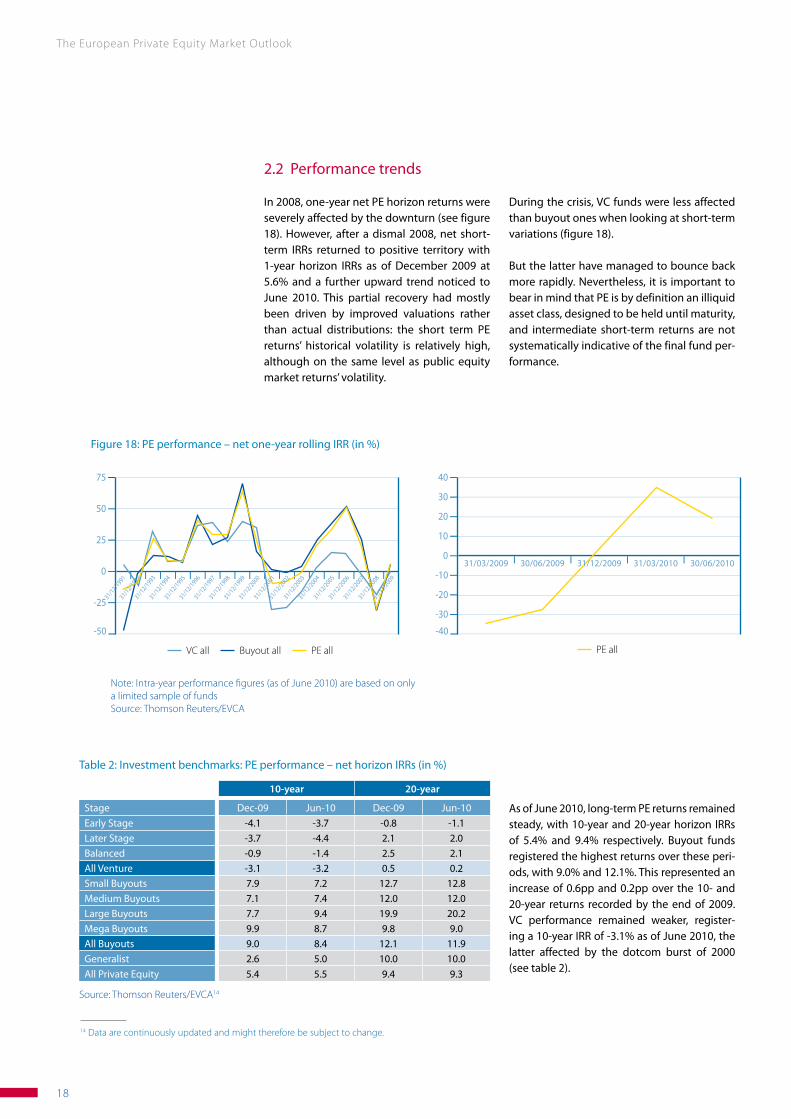
In 2008, one-year net PE horizon returns were severely affected by the downturn (see figure 18). However, after a dismal 2008, net short-term IRRs returned to positive territory with 1-year horizon IRRs as of December 2009 at 5.6% and a further upward trend noticed to June 2010. This partial recovery had mostly been driven by improved valuations rather than actual distributions: the short term PE returns’ historical volatility is relatively high, although on the same level as public equity market returns’ volatility.
14 Data are continuously updated and might therefore be subject to change.
Figure 18: PE performance – net one-year rolling IRR (in %)
75
50
25
0
-25
-50
40
30
20
10
0
-10
-20
-30
-40
I I I I I I I I I I I I I I I I I I I I I I
Note: Intra-year performance figures (as of June 2010) are based on only a limited sample of fundsSource: Thomson Reuters/EVCA
31/12/1991
31/12/1995
31/12/1999
31/12/1992
31/12/1996
31/12/2000
31/12/1993
31/12/1997
31/12/2001
31/12/1994
31/12/1998
31/12/200231/12/200331/12/200431/12/200531/12/200631/12/200731/12/200831/12/2009
VC all Buyout all PE all PE all
31/03/2009 30/06/2009 31/12/2009 31/03/2010 30/06/2010
Source: Thomson Reuters/EVCA14
Table 2: Investment benchmarks: PE performance – net horizon IRRs (in %)
10-year 20-year
Stage Dec-09 Jun-10 Dec-09 Jun-10Early Stage -4.1 -3.7 -0.8 -1.1 Later Stage -3.7 -4.4 2.1 2.0 Balanced -0.9 -1.4 2.5 2.1 All Venture -3.1 -3.2 0.5 0.2 Small Buyouts 7.9 7.2 12.7 12.8 Medium Buyouts 7.1 7.4 12.0 12.0 Large Buyouts 7.7 9.4 19.9 20.2 Mega Buyouts 9.9 8.7 9.8 9.0 All Buyouts 9.0 8.4 12.1 11.9 Generalist 2.6 5.0 10.0 10.0 All Private Equity 5.4 5.5 9.4 9.3
During the crisis, VC funds were less affected than buyout ones when looking at short-term variations (figure 18).
But the latter have managed to bounce back more rapidly. Nevertheless, it is important to bear in mind that PE is by definition an illiquid asset class, designed to be held until maturity, and intermediate short-term returns are not systematically indicative of the final fund per-formance.
As of June 2010, long-term PE returns remained steady, with 10-year and 20-year horizon IRRs of 5.4% and 9.4% respectively. Buyout funds registered the highest returns over these peri-ods, with 9.0% and 12.1%. This represented an increase of 0.6pp and 0.2pp over the 10- and 20-year returns recorded by the end of 2009. VC performance remained weaker, register-ing a 10-year IRR of -3.1% as of June 2010, the latter affected by the dotcom burst of 2000 (see table 2).

The European Private Equity Market Outlook
19
15 VC LS and ICT include biotechnology, medical/health, communications and media, computer hardware, computer software and services, internet specific, semiconductors/other electrical. BO tech includes communications and media, computer hardware, computer software and services, internet specific, semiconductors/other electrical and biotechnology. BO non-tech (generalist) includes medical/health, consumer related, industrial/energy and other products.
16 The indices are calculated based on the evolution of the valuations of portfolio companies in the EIF’s portfolio of 330 funds. Companies in portfolio are active at the beginning of the return calculation period, which implies that exits are taken into account. For additional details on the methodology of EIF D-indices see Annex 2.
Source: Thomson Reuters/EVCA
Figure 19: Sectoral performance by market segment – 10-year net horizon IRR (in %) 15
30
25
20
15
10
5
0
-5
-10
30
25
20
15
10
5
0 I I I I I I I I I I I I I I I I I I I I I I I I I I I I I I I I I I I I I I I I I I
LS VC ICT VC BO Tech BO Non Tech
31/12
/1990
31/12
/1996
31/12
/1992
31/12
/2002
31/12
/1998
31/12
/2004
31/12
/1994
31/12
/2000
31/12
/2006
31/12
/2008
30/06
/2009
31/12
/2009
30/06
/2010
31/12
/1998
31/12
/2000
31/12
/2002
31/12
/2004
31/12
/2006
31/12
/2008
30/06
/2009
31/12
/2009
30/06
/2010
40
35
30
25
20
15
10
5
0
-5 I I I I I I I I I I I I I I I I I I
Var +0.6%
US VC
EU BO
US BO
EU VC Var -2.1%
Var -1.1%
Var +0.1%
Source: Thomson Reuters/EVCA
Figure 20: US and European PE performance – 10-year net horizon IRRs (in %)
EU all venture EU all buyouts US all venture US all buyouts
30/06/2
010
31/12/2
009
30/06/2
009
31/03/2
009
2008
2004
2007
2003
1999
2006
2002
1998
2005
2001
1997
2000
1996
An analysis of performance figures over the long term (10-year IRR investment horizon returns) split by sectors (figure 19) illustrates how the performance of VC tech sectors – life sciences and ICT – has been following the same downward trend after the peak of the
US and EU comparison
The US VC market has not been immune to the effects of the crisis, as the plunge of US VC returns shows (see figure 20), for which the 10-year IRR fell from 1.9% as of Decem-ber 2009 to -4.1% by June 2010. This decline is significantly steeper than the correspond-ing +0.1% variation in the EU VC market from December 2009 to June 2010. The EU contin-ues to outperform the US market in the buy-out segment, although with a reduced gap of +1.7% (vs. +3.4% at the end of 2009).
2.3 EIF D-Indices
The performance trends described in the pre-vious section are confirmed by the EIF D-Indi-ces – return indices based on the underlying portfolio companies in the EIF portfolio16 (see Annex 2). Note that EIF returns are calculated gross before all fund management and incen-tive fees, so they are not directly comparable to the net fund performance figures published by Thomson Reuters presented in the previous section. Moreover, while Thomson Reuters’ fig-ures represent pooled IRRs, the EIF’s figures are calculated as time-weighted returns.
dotcom bubble in 2001. On the other hand, buyout returns remained more stable in the long term. However, the impact of the recent crisis affected buyout tech and non-tech (gen-eralist) funds differently, with the former suf-fering the most.
The figures below (figures 21-23) show the quarterly return evolution of EIF portfolio companies since 2004. To highlight the impact of the crisis, particular attention is paid to the variation between the peak of the summer of 2008 vs. the bottom reached in the summer of 2009 and the recovery since then.
The European Private Equity Market Outlook
20
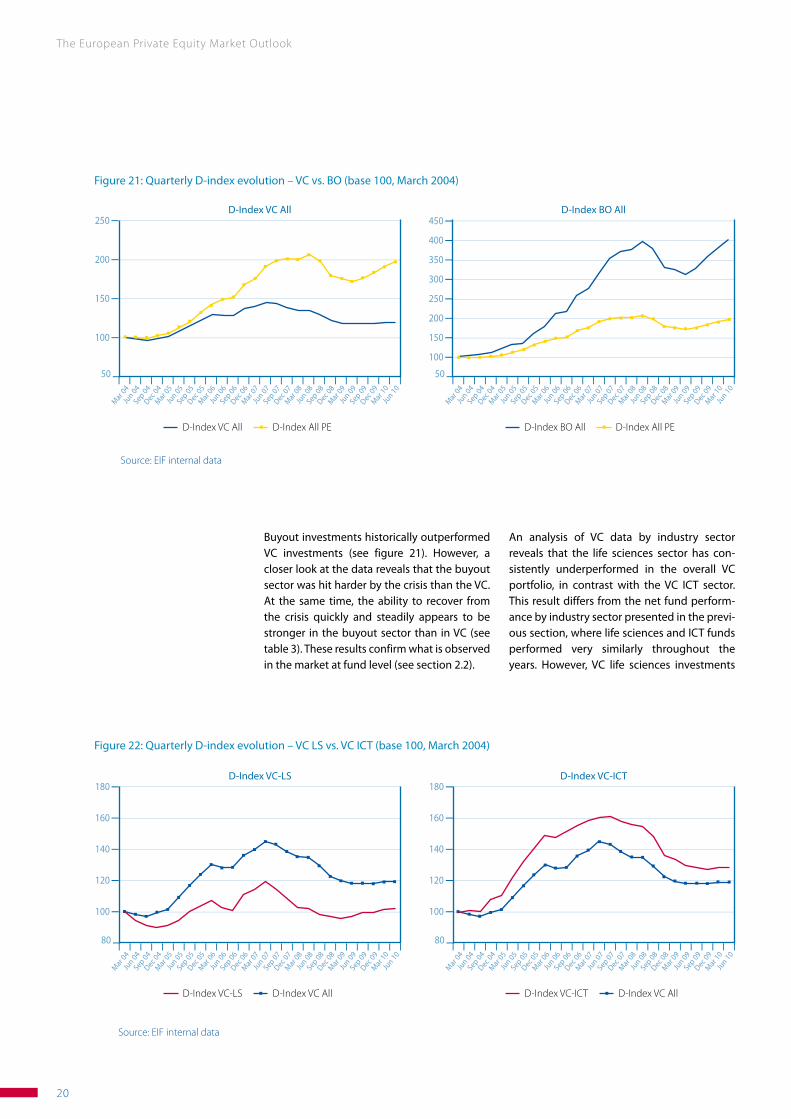
Buyout investments historically outperformed VC investments (see figure 21). However, a closer look at the data reveals that the buyout sector was hit harder by the crisis than the VC. At the same time, the ability to recover from the crisis quickly and steadily appears to be stronger in the buyout sector than in VC (see table 3). These results confirm what is observed in the market at fund level (see section 2.2).
Figure 21: Quarterly D-index evolution – VC vs. BO (base 100, March 2004)
250
200
150
100
50
450
400
350
300
250
200
150
100
50 I I I I I I I I I I I I I I I I I I I I I I I I I I I I I I I I I I I I I I I I I I I I I I I I I I I I I I
Source: EIF internal data
D-Index VC All D-Index All PE D-Index BO All D-Index All PE
Mar 04
Mar 04
Jun 04
Jun 04
Sep 04
Sep 04
Dec 04
Dec 04
Mar 05
Mar 05
Mar 06
Mar 06
Mar 07
Mar 07
Mar 08
Mar 08
Mar 09
Mar 09
Mar 10
Mar 10
Sep 05
Sep 05
Sep 06
Sep 06
Sep 07
Sep 07
Sep 08
Sep 08
Sep 09
Sep 09
Jun 05
Jun 05
Jun 06
Jun 06
Jun 07
Jun 07
Jun 08
Jun 08
Jun 09
Jun 09
Jun 10
Jun 10
Dec 05
Dec 05
Dec 06
Dec 06
Dec 07
Dec 07
Dec 08
Dec 08
Dec 09
Dec 09
D-Index VC All D-Index BO All
An analysis of VC data by industry sector reveals that the life sciences sector has con-sistently underperformed in the overall VC portfolio, in contrast with the VC ICT sector. This result differs from the net fund perform-ance by industry sector presented in the previ-ous section, where life sciences and ICT funds performed very similarly throughout the years. However, VC life sciences investments
Figure 22: Quarterly D-index evolution – VC LS vs. VC ICT (base 100, March 2004)
180
160
140
120
100
80
180
160
140
120
100
80 I I I I I I I I I I I I I I I I I I I I I I I I I I I I I I I I I I I I I I I I I I I I I I I I I I I I I I
Source: EIF internal data
D-Index VC-LS D-Index VC All D-Index VC-ICT D-Index VC All
Mar 04
Mar 04
Jun 04
Jun 04
Sep 04
Sep 04
Dec 04
Dec 04
Mar 05
Mar 05
Mar 06
Mar 06
Mar 07
Mar 07
Mar 08
Mar 08
Mar 09
Mar 09
Mar 10
Mar 10
Sep 05
Sep 05
Sep 06
Sep 06
Sep 07
Sep 07
Sep 08
Sep 08
Sep 09
Sep 09
Jun 05
Jun 05
Jun 06
Jun 06
Jun 07
Jun 07
Jun 08
Jun 08
Jun 09
Jun 09
Jun 10
Jun 10
Dec 05
Dec 05
Dec 06
Dec 06
Dec 07
Dec 07
Dec 08
Dec 08
Dec 09
Dec 09
D-Index VC-LS D-Index VC-ICT

The European Private Equity Market Outlook
21
performed somewhat better over the past few quarters (+5.1% from June 2009 till June 2010) compared with the ICT sector (see figure 22), which registered a –1.2% decrease in value from June 2009 till June 2010.
An analysis of buyout data by industry sector shows that both tech and non-tech (general-ist) investments have performed very similarly since March 2004 (see figure 23). However, non-tech investments were more severely impacted during the recent crisis, while tech ones were more resilient.
Figure 23: Quarterly D-index evolution – BO tech vs. BO non-tech (generalist, base 100, March 2004)
500
400
300
200
100
0
500
400
300
200
100
0 I I I I I I I I I I I I I I I I I I I I I I I I I I I I I I I I I I I I I I I I I I I I I I I I I I I I I I
Source: EIF internal data
D-Index BO-Tech D-Index BO All D-Index BO-Non Tech D-Index BO All
Mar 04
Mar 04
Jun 04
Jun 04
Sep 04
Sep 04
Dec 04
Dec 04
Mar 05
Mar 05
Mar 06
Mar 06
Mar 07
Mar 07
Mar 08
Mar 08
Mar 09
Mar 09
Mar 10
Mar 10
Sep 05
Sep 05
Sep 06
Sep 06
Sep 07
Sep 07
Sep 08
Sep 08
Sep 09
Sep 09
Jun 05
Jun 05
Jun 06
Jun 06
Jun 07
Jun 07
Jun 08
Jun 08
Jun 09
Jun 09
Jun 10
Jun 10
Dec 05
Dec 05
Dec 06
Dec 06
Dec 07
Dec 07
Dec 08
Dec 08
Dec 09
Dec 09
D-Index BO Tech D-Index BO-Non Tech
Source: EIF internal data
Table 3: EIF D-Indices statistics (from March 2004 to June 2010)
D-Index CAGR annual (%) STD DEV (%) Jun 08-09 Jun 09-10
VC LS 0.3 8.0 -4.6 5.1VC ICT 4.0 8.0 -16.1 -1.2VC ALL 3.0 7.0 -12.3 0.8BO Tech 28.0 17.0 4.4 32.2BO Non Tech 25.0 15.0 -25.6 27.8BO ALL 25.0 14.0 -21.0 28.6PE ALL 12.0 9.0 -16.6 14.9

The European Private Equity Market Outlook
22
After a challenging 2009, H1 2010 showed a moderate recovery in PE activity. Will PE activity pick up more substantially in 2011? Many industry practitioners, who shared their views with us, expect a further gradual improvement in PE activity with the pace of the recovery depending on the strength of the economic revival. Given the still considerable macroeconomic uncertainties, coupled with regulatory concerns, the market environment is expected to remain challenging in the short term with investors remaining cautious.
3. Concluding remarks
According to Peter Cornelius, economic growth is likely to have mod-erated in the second half of the year. “The near- to medium-term out-look remains clouded with exceptional uncertainty,” he says. “The base case foresees a further gradual improvement in private equity activity, as yield-chasing investors are expected to show robust demand for high-yield debt. Historically, fundraising has followed investments, suggesting that under such conditions commitments should start to recover soon, albeit at a relatively modest pace. How-ever, economic risks remain clearly tilted to the downside and could push a still fragile recovery in private equity off track”.
Industry practitioners such as Katita Palamar from Cogent Part-ners foresee a decrease in new investment activity, as managers are concerned about a double dip, with debt financing becoming less available.

The European Private Equity Market Outlook
23
Helen Steers concludes that, for now, both GPs and LPs will need to quantify and understand the macroeconomic risks associated with investing in various sectors and countries: “This situation is expected to increase uncertainty in the medium term, and drive capital to areas that are considered more promising,” she says. “However, a well-diversified European portfolio, invested with high-quality managers, should continue to deliver superior returns for investors, even in the current economic climate“.
Turning to fundraising, Peter Cornelius says market conditions will remain difficult in the short term, due to a number of different factors. “Key among them are: the funding challenges of pension funds and the regulatory uncertainty pertaining, for example, to the treatment of private equity under Solvency II, and the potential investment restrictions and costs under the new Alternative Invest-ment Fund Managers Directive (AIFMD)“.

The European Private Equity Market Outlook
24
Annex 1: Acronyms
AIFMD: Alternative Investment Fund Managers Directive BO: Buyout EIB: European Investment Bank EIF: European Investment Fund EIU: Economist Intelligence Unit EU: European Union EVCA: European Private Equity and Venture Capital Association GP: General partner ICT: Information and Communications Technologies IMF: International Monetary Fund IRR: Internal rate of return LP: Limited partner LS: Life Sciences PE: Private equity SMEs: Small and medium-sized enterprises VC: Venture capital
The European Private Equity Market Outlook
25
Annex 2: Methodology and Definitions
I. Market activity section - methodology
Fundraising
The funds included in the statistics are:• privateequity fundsmakingdirectprivate
equity investments • mezzanineprivateequityfunds• co-investmentfunds• rescue/turnaroundfunds
The following funds are excluded from the statistics:• infrastructurefunds• realestatefunds• distresseddebtfunds• primaryfundsoffunds• secondaryfundsoffunds
Fundraising is captured by two methods:• byincrementalamountraisedinayear–ifa
fund has an intermediary closing of €200m in 2010 and the cumulative amount raised for this fund stands at €500m, €200m only is captured in the 2010 fundraising
• byfinalclosings–capturesthetotalcumu-lative amount raised at final closing.
Investments
Unless stated otherwise (see figure 6. Industry statistics – by location of private equity firm), the approach taken in this report is a market approach (i.e. investments and divestments are represented by location of the portfolio company).
At European level, this means investments in European companies or divestments from European companies, regardless of the loca-tion of the private equity firm.
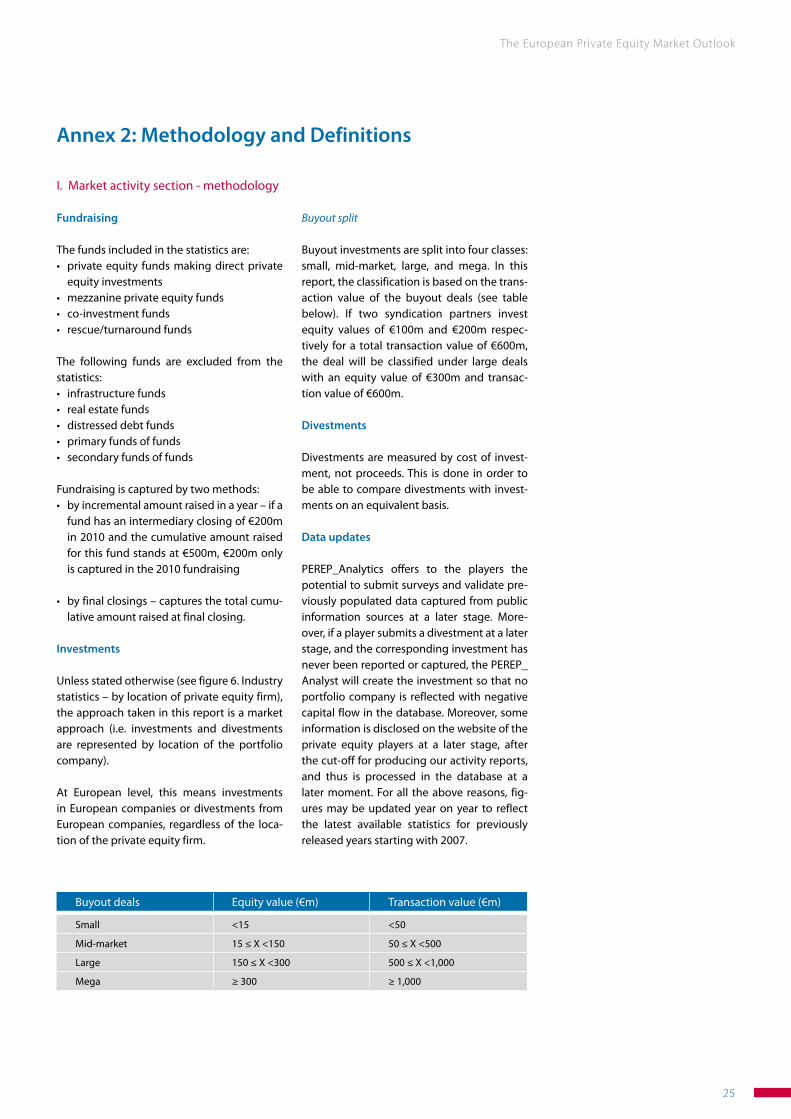
Buyout split
Buyout investments are split into four classes: small, mid-market, large, and mega. In this report, the classification is based on the trans-action value of the buyout deals (see table below). If two syndication partners invest equity values of €100m and €200m respec-tively for a total transaction value of €600m, the deal will be classified under large deals with an equity value of €300m and transac-tion value of €600m.
Divestments
Divestments are measured by cost of invest-ment, not proceeds. This is done in order to be able to compare divestments with invest-ments on an equivalent basis.
Data updates
PEREP_Analytics offers to the players the potential to submit surveys and validate pre-viously populated data captured from public information sources at a later stage. More- over, if a player submits a divestment at a later stage, and the corresponding investment has never been reported or captured, the PEREP_Analyst will create the investment so that no portfolio company is reflected with negative capital flow in the database. Moreover, some information is disclosed on the website of the private equity players at a later stage, after the cut-off for producing our activity reports, and thus is processed in the database at a later moment. For all the above reasons, fig-ures may be updated year on year to reflect the latest available statistics for previously released years starting with 2007.
Buyout deals Equity value (€m) Transaction value (€m)
Small <15 <50
Mid-market 15 ≤ X <150 50 ≤ X <500
Large 150 ≤ X <300 500 ≤ X <1,000
Mega ≥ 300 ≥ 1,000
The European Private Equity Market Outlook
26
II. EIF D-Indices - methodology
Source of data
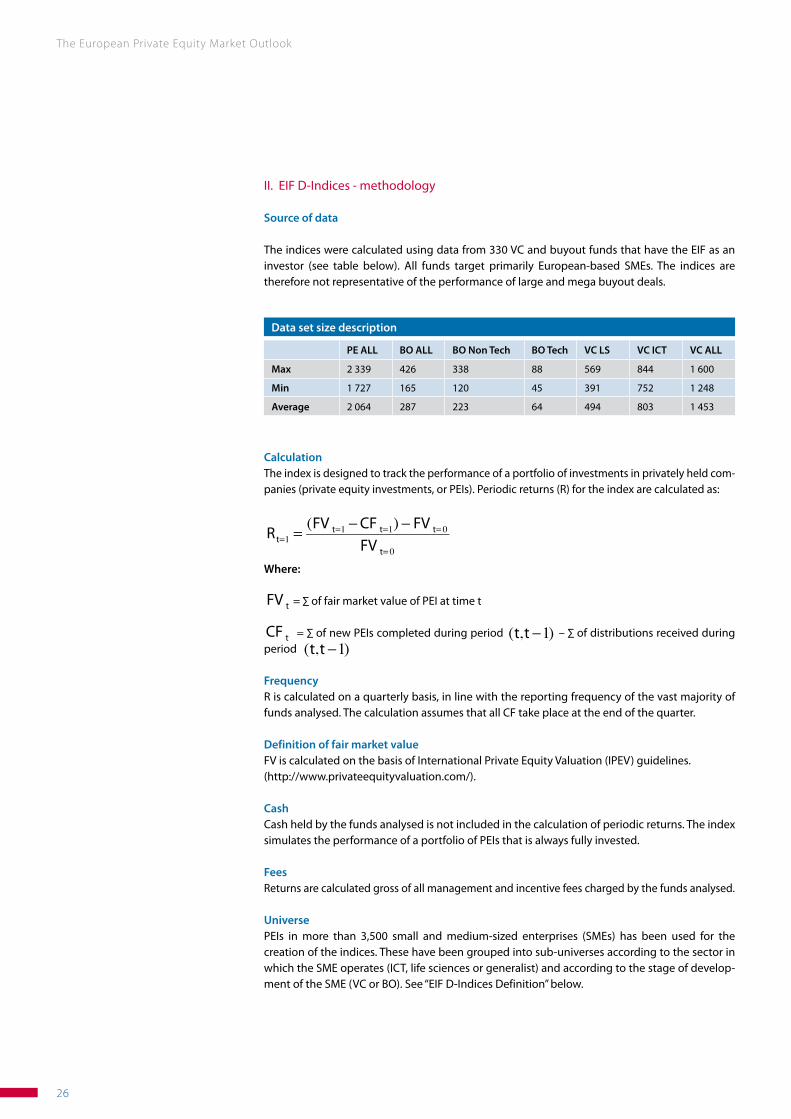
The indices were calculated using data from 330 VC and buyout funds that have the EIF as an investor (see table below). All funds target primarily European-based SMEs. The indices are therefore not representative of the performance of large and mega buyout deals.
CalculationThe index is designed to track the performance of a portfolio of investments in privately held com-panies (private equity investments, or PEIs). Periodic returns (R) for the index are calculated as:
€
Rt=1 = (FV t=1 − CF t=1) − FV t= 0
FV t= 0
Where:
€
FV t = ∑ of fair market value of PEI at time t
€
CF t = ∑ of new PEIs completed during period
€
(t,t −1) – ∑ of distributions received during period
€
(t,t −1)
FrequencyR is calculated on a quarterly basis, in line with the reporting frequency of the vast majority of funds analysed. The calculation assumes that all CF take place at the end of the quarter.
Definition of fair market valueFV is calculated on the basis of International Private Equity Valuation (IPEV) guidelines.(http://www.privateequityvaluation.com/).
CashCash held by the funds analysed is not included in the calculation of periodic returns. The index simulates the performance of a portfolio of PEIs that is always fully invested.
FeesReturns are calculated gross of all management and incentive fees charged by the funds analysed.
UniversePEIs in more than 3,500 small and medium-sized enterprises (SMEs) has been used for the creation of the indices. These have been grouped into sub-universes according to the sector in which the SME operates (ICT, life sciences or generalist) and according to the stage of develop-ment of the SME (VC or BO). See “EIF D-Indices Definition” below.
Data set size description
PE ALL BO ALL BO Non Tech BO Tech VC LS VC ICT VC ALL
Max 2 339 426 338 88 569 844 1 600
Min 1 727 165 120 45 391 752 1 248
Average 2 064 287 223 64 494 803 1 453

The European Private Equity Market Outlook
27
Index Name Sector Stage
D-Index VC-ICT ICT VC
D-Index VC-LS LS VC
D-Index VC ICT+LS+Generalist VC
D-Index BO-Tech ICT+LS BO
D-Index BO-Non Tech Generalist BO
D-Index BO ICT+LS+Generalist BO
D-Index All PE ICT+LS+Generalist BO+VC
EVCA Stage Investee Company
Stage Focus Fund Stage of the index
*Generalist “Mid-Market PE” or “Small Cap PE” or “Growth / Replacement Capital” or "Balanced PE”
BO
*Generalist “Seed Capital” or “Start-up / Early Stage” or “Balanced VC” or “Expansion VC” or “Technology Transfer Accelerator”
VC
Buyout No Filter BO
Expansion “Mid-Market PE” or “Small Cap PE” or “Growth / Replacement Capital” or “Balanced PE”
BO
Expansion “Seed Capital” or "Start-up / Early Stage” or “Balanced VC” or “Expansion VC” or “Technology Transfer Accelerator”
VC
Other early stage No Filter VC
Replacement Capital “Mid-Market PE” or “Small Cap PE” or “Growth / Replacement Capital” or “Balanced PE”
BO
Replacement Capital “Seed Capital” or “Start-up / Early Stage” or “Balanced VC” or “Expansion VC” or “Technology Transfer Accelerator”
VC
Seed No Filter VC
Start-Up No Filter VC
EVCA Sector Investee Company Sector of the index
*Generalist GeneralistAgriculture GeneralistBiotechnology Life ScienceChemicals and Materials GeneralistCommunications ICTComputer Related ICTConstruction GeneralistConsumer Related GeneralistEnergy GeneralistFinancial Services GeneralistIndustrial Automation GeneralistIndustrial Prod. and Services GeneralistMedical/Health Related Life ScienceNot Allocated GeneralistOther GeneralistOther Electronic Related ICTOther Manufacturing GeneralistOther Services GeneralistTransportation Generalist
II. EIF D-Indices Definitions
Sector membership and stage membership definitions can be found in the table below:
The conversion from EVCA’s sector classification to EIF D-Indices sector classification can be found below:
The conversion from EVCA’s stage classification to EIF D-Indices stage classification can be found below:

The European Private Equity Market Outlook
28
III. Definitions
Activity sectionPrivate equity: Private equity provides equity capital to enterprises not quoted on a stock mar-ket. Private equity includes the following investment stages: venture capital, growth capital, replacement capital, rescue/turnaround and buyouts. Private equity funds are pools of capital managed in general as closed-end, fixed-life funds making primarily equity capital investments into enterprises (i.e. direct private equity funds as opposed to primary or secondary private equity funds of funds) not quoted on a stock market.
Venture capital: Venture capital is, strictly speaking, a subset of private equity and refers to equity investments made for the launch, early development, or expansion of a business.
Fund stage focusEarly-stage fund: A venture capital fund focused on investing in companies in the early stages of their lives.
Later-stage fund: A venture capital fund focused on investing in later-stage companies in need of expansion capital, usually providing a third or fourth (or subsequent) round of venture investment.
Balanced fund: A venture capital fund focused on both early-stage and development, with no particular concentration on either.
Growth fund: Funds whose strategy is to invest in or acquire relatively mature companies that are looking for capital to expand or restructure operations; they often provide the first private equity investment in a company.
Buyout fund: A fund whose strategy is to acquire other businesses.
Mezzanine fund: A fund that provides (generally subordinated) debt to facilitate the financing of buyouts, frequently alongside a right to some of the equity upside.
Generalist fund: A fund with either a stated focus of investing in all stages of private equity investment, or with a broad area of investment activity.
Stage definitions Several financing stages can be identified in relation to the stages of development of a private-equity-backed company. These are described as follows:
Seed: Financing provided to research, assess and develop an initial concept before a business has reached the start-up phase.
Start-up: Financing provided to companies for product development and initial marketing. Companies may be in the process of being set up or may have been in business for a short time, but have not sold their product commercially.
Other early-stage: Financing to companies that have completed the product development stage and require further funds to initiate commercial manufacturing and sales. They will not yet be generating a profit.
Later-stage venture: Financing provided for the expansion of an operating company, which may or may not be breaking even or trading profitably. Later-stage venture tends to finance companies already backed by VCs, and are therefore involved in a third or fourth (or subse-quent) round of financing.

The European Private Equity Market Outlook
29
Growth: A type of private equity investment – most often a minority investment but not nec-essarily – in relatively mature companies that are looking for capital to expand or restructure operations, enter new markets or finance a significant acquisition without a change of control of the business. Growth capital tends to be a company’s first private equity financing. Addition-ally, most investments made by buyout funds into venture stages would be defined as growth capital.
Bridge financing: Financing made available to a company for the period of transition between being privately owned and publicly quoted.
Rescue/turnaround: Financing made available to an existing business, which has experienced trading difficulties, with a view to re-establishing prosperity.
Secondary purchase/replacement capital: The purchase of a minority stake of existing shares in a company from another private equity firm or from another shareholder or shareholders.
Refinancing bank debt: An injection of capital to reduce a company’s level of gearing.
Management buyout: Financing provided to enable current operating management and inves-tors to acquire existing product lines or businesses.
Management buy-in: Financing provided to enable a manager or group of managers from out-side the company to buy in to the company with the support of private equity investors.
Public-to-private: A transaction involving an offer for the entire share capital of a listed target com-pany for the purpose of delisting the company. Management may be involved in the offering.
Other PIPE: A private investment in public equity, as a minority or majority stake, without tak-ing the company private.
Other (leveraged) buyout: Financing provided to acquire a company (other than MBI, MBO, public-to-private or other PIPE). It may use a significant amount of borrowed money to meet the cost of acquisition.
Secondary buyout: A secondary buyout is a form of buyout where both buyer and seller are pri-vate equity firms or financial sponsors (ie a leveraged buyout of a company that was acquired through a leveraged buyout). Secondary buyouts differ from secondaries or secondary market purchases which typically involve the acquisition of portfolios of private equity assets, including limited partnership stakes and direct investments in corporate securities.
Mapping the above stages into the main five presented in the document leads to the following classification:Seed: seedStart-up: start-up, other early stageLater-stage venture: later-stage venture, bridge financingGrowth: growthRescue/turnaround: rescue/turnaround Replacement capital: secondary purchase/replacement capital, refinancing bank debtBuyouts: management buyout, management buy-in, public-to-private, other PIPE, leveraged buyout,Mapping the above stages further into the two main stages presented in the document – ven-ture and buyout & growth - leads to the following classification:
The European Private Equity Market Outlook
30
Venture deals: seed, start-up, later-stage venture
Buyout & growth deals: growth, rescue/turnaround, replacement capital, buyouts
Amounts definitionEquity value: Stricto sensu, the amount of capital invested to acquire shares in an enterprise. The equity value includes equity, quasi-equity, mezzanine, unsecured debt and secured debt financing provided by funds raised by private equity firms focused primarily on direct invest-ments (including co-investment funds) or incorporated direct private equity firms investing from the balance sheet (evergreen and direct captive private equity programmes).
Transaction value: The sum of the “equity value” as described above, to which financing coming from the rest of the syndicate is added (LP co-investors, individuals, entrepreneurs, business angels, management, corporates, funds-of-funds, other asset managers and/or financial institutions), together with the leverage (debt provided by banks or other providers). In other words, stricto sensu transaction value is equal to enteprise value multiplied by the percentage ownership by the acquiring syndicate in which at least one financial sponsor (private equity firm) is involved.
Sectoral definitionsFor a complete picture of the sectoral classification and its mapping to the NACE standardised sectoral classification of Eurostat (NACE Rev. 2, 2007), go to www.evca.eu//uploadedFiles/sectoral_classification.pdf
This link above shows the map between the old EVCA sectors, the 67 new sectors used in the online survey by PEREP, their grouping into the 14 sectoral classes used in the sectoral distribu-tion of investments in the EVCA Yearbook, and their further grouping into the seven sectoral clusters used in the fundraising by fund sectoral focus in the EVCA Yearbook.
Divestment methods:Divestment on flotation (IPO): An initial public offering (IPO) is the sale or distribution of a com-pany’s shares to the public for the first time by listing the company on the stock exchange. It is one way a private equity firm can sell its shares and exit an investment.
Repayment of preference shares/loans: If a private equity firm provided loans or bought pref-erence shares in the company at the time of investment, then their repayment according to the amortisation schedule represents a decrease of the financial claim of the firm against the com-pany, and hence a divestment.
Repayment of silent partnership: A silent partnership belongs to the so-called mezzanine financ-ing instruments. It is similar to a long-term bank loan but, in contrast to a loan, a silent partnership is subject to a subordination clause, so that in the event of insolvency all other creditors are paid before the silent partner. The company has to repay the partnership and has to pay interest and possibly a profit-related compensation. The subordination clause gives the capital the status of equity despite its loan character. This financing instrument is frequently used in Germany.
Sale of quoted equity post-flotation: This relates to the sale of quoted shares only if connected to a former private equity investment, such as the sale of quoted shares after a lock-up period.

The European Private Equity Market Outlook
31
Sale to another private equity house: See sale to financial institution.
Sale to financial institution: The sale of company shares to banks, insurance companies, pension funds, endowments, foundations and other asset managers other than private equity firms.
Sale to trade buyers: The sale of company shares to industrial investors.
Divestment by write-off: The total or partial write-down of a portfolio company’s value to zero or a symbolic amount (sales for a nominal amount) with the consequent exit from the company or reduction of the share owned. The value of the investment is eliminated and the return to investors is equal or close to -100%.
For more information on the methodology of this report, please contact [email protected].
Performance section
The data is taken from Thomson Reuters’ application Thomson ONE (www.thomsonone.com). Thomson Reuters’ applications contain detailed statistical measurements including distribution and valuation ratios from data based on a sample of 458 buyout and mezzanine funds formed between 1980 and 2009.
IRR Internal Rate of ReturnThe IRR is the interim net return earned by investors (Limited Partners) from the fund from incep-tion to a stated date. The IRR is calculated as an annualised effective compounded rate of return using monthly cash flows to and from investors, together with the Residual Value as a terminal cash flow to investors. The IRR is therefore net, i.e. after deduction of all fees and carried interest. In cases of captive or semi-captive investment vehicles without fees or carried interest, the IRR is adjusted to create a synthetic net return using assumed fees and carried interest.
Pooled IRRThe IRR obtained by taking cash flows since inception together with the Residual Value for all funds and aggregating them into a pool as if they were a single fund. This is superior to either the average, which can be skewed by large returns on relatively small investments, or the captial-weighted IRR which weights each IRR by the capital committed. This latter measure would be accurate only if all investments were made at once at the beginning of the funds’ life.
Horizon IRRThe horizon IRR allows for an indication of performance trends in the industry. It uses the fund’s net asset value at the beginning of the period as an initial cash outflow and the Residual Value at the end of the period as the terminal cash flow. The IRR is calculated using those values plus any cash actually received into or paid by the fund from or to investors in the defined time period (i.e. horizon). A three-year horizon looks back from the end of 2009 over three years to the end of 2006 and so on.
Ten-Year Rolling IRRThe ten-year rolling IRR shows the development of the five-year Horizon IRR, measured at the end of each year. By the same token the one-, three- and twenty-year rolling IRRs are produced.

The European Private Equity Market Outlook
32
− Bank for International Settlements, BIS (2010). www.bis.org
− Conforti, A. (2010). Private Equity and Venture Capital indicators: A research of EU-27 Private Equity and Venture Capital Markets. EIF Working Paper 2010/004.
http://www.eif.org/news_centre/publications/index.htm
− Di Carlo, A. (2010). The Private Equity Market in Europe: Rise of a New Cycle or Tail of the Reces-sion? EIF Working Paper 2010/003. http://www.eif.org/news_centre/publications/index.htm
− Di Carlo, A. and Kelly, R. (2010). Private Equity Market Outlook. EIF Working Paper 2010/005.
− Economist Intelligence Unit (2010). Global Outlook. October 2010. http://www.eif.org/news_centre/publications/index.htm
− European Central Bank (2010). http://www.ecb.int/home/html/index.en.html
− European Parliament, texts adopted at the sitting of Thursday, 11th November 2010, P7_TA-PROV(2010)11-11 PROVISIONAL EDITION PE 453.162
− EVCA (2009). Global trends in Venture Capital.
− EVCA (2010a). 2010 EVCA Yearbook.
− EVCA (2010b). European Private Equity Market – data www.evca.eu
− IMF (2010a). World Economic Outlook. July 2010.
− IMF (2010b). Global Financial Stability Report. October 2010.
− Meyer, Thomas D. (2010). Venture capital adds economic spice. Research briefing. Deutsche Bank Research. 2010
− Newton (2010). Private Equity: How to exploit an extraordinary opportunity in a world turned upside down. White paper http://www.newtoneurope.com/index.php
− Preqin (2010a). Private Equity Investor Survey. October 2010.
− Preqin (2010b). Private Equity Spotlight. October 2010.
− Preqin (2010c). http://www.preqin.com/
− Roubini Global Economics (2010). Global Overview: September 2010 Outlook Update.
− The Economist (2010). Private Inequity. 8 May 2010.
References


© EIB –12/2010 – QH-30-10-644-EN- C – © E IB GraphicTeam
The European Private Equity Market Outlook
Contacts
Anastasia Di CarloRisk Manager – Private EquityU [email protected]
Pierre-Yves MathonetHead of Risk Management – Private EquityU [email protected]
Roger KellySenior Researcher – Research and Market Analysis U [email protected]
Helmut Kraemer-EisHead of Research and Market Analysis U [email protected]
European Investment Fund96, boulevard Konrad AdenauerL-2968 Luxembourg3 (+352) 42 66 88 15 (+352) 42 66 88 200www.eif.org
Contacts
Zornitsa PavlovaHead of ResearchU [email protected]
Mirela EneResearch Consultant U [email protected]