Embed Size (px)
Citation preview
The Female Urinary Microbiome: a Comparison of Women with andwithout Urgency Urinary Incontinence
Meghan M. Pearce,a Evann E. Hilt,a,b Amy B. Rosenfeld,c Michael J. Zilliox,c Krystal Thomas-White,a Cynthia Fok,d*Stephanie Kliethermes,e Paul C. Schreckenberger,b,f Linda Brubaker,d Xiaowu Gai,c* Alan J. Wolfea,b
Department of Microbiology and Immunology,a Infectious Disease and Immunology Research Institute,b Department of Molecular Pharmacology and Therapeutics,c
Departments of Obstetrics & Gynecology and Urology,d Departments of Medicine and Public Health Sciences,e and Department of Pathology,f Stritch School of Medicine,Loyola University Chicago, Maywood, Illinois, USA
* Present address: Cynthia Fok, Department of Urology, University of Minnesota, Minneapolis, Minnesota, USA; Xiaowu Gai, Department of Ophthalmology, Massachusetts Eye and EarInfirmary, Harvard Medical School, Boston, Massachusetts, USA.
ABSTRACT Bacterial DNA and live bacteria have been detected in human urine in the absence of clinical infection, challenging theprevailing dogma that urine is normally sterile. Urgency urinary incontinence (UUI) is a poorly understood urinary conditioncharacterized by symptoms that overlap urinary infection, including urinary urgency and increased frequency with urinary in-continence. The recent discovery of the urinary microbiome warrants investigation into whether bacteria contribute to UUI. Inthis study, we used 16S rRNA gene sequencing to classify bacterial DNA and expanded quantitative urine culture (EQUC) tech-niques to isolate live bacteria in urine collected by using a transurethral catheter from women with UUI and, in comparison, acohort without UUI. For these cohorts, we demonstrated that the UUI and non-UUI urinary microbiomes differ by group basedon both sequence and culture evidences. Compared to the non-UUI microbiome, sequencing experiments revealed that the UUImicrobiome was composed of increased Gardnerella and decreased Lactobacillus. Nine genera (Actinobaculum, Actinomyces,Aerococcus, Arthrobacter, Corynebacterium, Gardnerella, Oligella, Staphylococcus, and Streptococcus) were more frequently cul-tured from the UUI cohort. Although Lactobacillus was isolated from both cohorts, distinctions existed at the species level, withLactobacillus gasseri detected more frequently in the UUI cohort and Lactobacillus crispatus most frequently detected in con-trols. Combined, these data suggest that potentially important differences exist in the urinary microbiomes of women with andwithout UUI, which have strong implications in prevention, diagnosis, or treatment of UUI.
IMPORTANCE New evidence indicates that the human urinary tract contains microbial communities; however, the role of thesecommunities in urinary health remains to be elucidated. Urgency urinary incontinence (UUI) is a highly prevalent yet poorlyunderstood urinary condition characterized by urgency, frequency, and urinary incontinence. Given the significant overlap ofUUI symptoms with those of urinary tract infections, it is possible that UUI may have a microbial component. We compared theurinary microbiomes of women affected by UUI to those of a comparison group without UUI, using both high-throughput se-quencing and extended culture techniques. We identified statistically significant differences in the frequency and abundance ofbacteria present. These differences suggest a potential role for the urinary microbiome in female urinary health.
Received 15 May 2014 Accepted 5 June 2014 Published 8 July 2014
Citation Pearce MM, Hilt EE, Rosenfeld AB, Zilliox MJ, Thomas-White K, Fok C, Kliethermes S, Schreckenberger PC, Brubaker L, Gai X, Wolfe AJ. 2014. The female urinarymicrobiome: a comparison of women with and without urgency urinary incontinence. mBio 5(4):e01283-14. doi:10.1128/mBio.01283-14.
Editor Martin Blaser, New York University
Copyright © 2014 Pearce et al. This is an open-access article distributed under the terms of the Creative Commons Attribution-Noncommercial-ShareAlike 3.0 Unportedlicense, which permits unrestricted noncommercial use, distribution, and reproduction in any medium, provided the original author and source are credited.
Address correspondence to Alan J. Wolfe, [email protected], or Xiaowu Gai, [email protected].
This article is a direct contribution from a Fellow of the American Academy of Microbiology.
The female urinary tract is a previously overlooked microbialniche. Recent detection of bacterial DNA (1–3) and live bac-
teria (4, 5) in urine from women with and without lower urinarytract symptoms has provided compelling evidence that the femaleurinary tract possesses its own unique microbiota. Research intothe roles of these bacterial communities in urinary health anddisease requires sensitive and specific detection and classification.Although the comparatively low bacterial load in urine challengessuch effort, expanded culture conditions have allowed researchersto detect bacteria at lower levels than previously used techniques.For example, we recently reported that bacteria overlooked by
standard culture conditions are cultivable by adjusting the growthconditions to include increased urine volume, diverse growth me-dia and atmospheric conditions, and lengthened incubation time(4). Using expanded quantitative urine culture (EQUC), we iso-lated bacteria from 80% of examined urine samples collected bytransurethral catheter, most (92%) of which had been reported as“no growth,” using a standard clinical microbiology urine cultureprotocol and a 103-CFU/ml threshold (4). Despite this significantadvance, many urinary bacteria cannot be cultured under theseconditions. Thus, culture-independent methods for bacterial de-tection, such as high-throughput sequencing of the 16S rRNA
RESEARCH ARTICLE
July/August 2014 Volume 5 Issue 4 e01283-14 ® mbio.asm.org 1
on Septem
ber 8, 2018 by guesthttp://m
bio.asm.org/
Dow
nloaded from
gene, have emerged as the predominant research technique, espe-cially as they become increasingly accessible due to declining se-quencing cost and improved bioinformatics tools (6).
There is a clinical need for these improved research techniques.For example, urgency urinary incontinence (UUI) is poorly un-derstood chronic urinary condition that is often attributed to ab-normal neuromuscular signaling and/or functioning. However,alternative or complementary mechanisms beyond neuromuscu-lar abnormalities must be considered, since UUI pharmacologicaltreatments aimed at the overactive bladder are ineffective in ap-proximately half of the pharmacologically treated UUI population(7, 8).
UUI is common, affecting 1.5 to 22% of the U.S. population,most frequently women and the elderly (8). Affected patients ex-perience a sudden, intense need to urinate with involuntary urineloss that detracts from the patient’s quality of life (9). A propor-tion of UUI cases resolve over time; however, it is a chronic con-dition for most women (8). There is a large socioeconomic bur-den, with the costs of UUI in the United States projected to reach$76.2 billion by 2015 (10).
The clinical diagnosis of UUI requires exclusion of urinarytract infections (UTI); thus, infectious etiology is not consideredfor UUI. Given the clinical similarly of UUI and UTI symptoms,however, we and others have recently used expanded culture tech-niques (4, 5) and quantitative PCR (2) to show the presence ofbacteria in standard culture-“negative” urine samples collectedfrom UUI patients.
In this analysis, we utilized both 16S rRNA gene sequencingand EQUC to characterize the microbiome in urine obtained bytransurethral catheter from women seeking treatment for UUIand a comparison group of women without UUI. Utilizing bothtechniques, we identified statistically significant differences in the
frequency and abundance of bacteria present, suggesting a poten-tial role for the urinary microbiome in female urinary health.
RESULTSCohort description. Table 1 displays the UUI symptoms by co-hort. Consistent with the intended composition of the cohorts, theUUI cohort reported more distress on both the urinary and pro-lapse subscales of the Pelvic Floor Distress Inventory (PFDI) (uri-nary distress inventory [UDI], 102 [�47] versus 11 [�11] [P �0.05]; Pelvic Organ Prolapse Distress Inventory [POPDI], 70[�52] versus 28 [�32] [P � 0.05]). The UUI cohort also reportedmore-severe overactive bladder (OAB) symptoms (66 [�23] ver-sus 4 [�7]; P � 0.05) and decreased quality of life as measured byhealth-related quality of life (HRQL) (56 [�25] versus 99 [�3];P � 0.05) compared to the non-UUI cohort.
Table 1 also displays the participant demographics by cohort.Marital status, diabetes, smoking, and prior pelvic surgeries didnot differ by group. However, the UUI cohort was heavier (bodymass index [BMI], 32 [�8] versus 28 [�6]; P � 0.01), less likely tobe using estrogen (27% versus 61%; P � 0.05), and older (63[�12] versus 49 [�14]; P � 0.05).
Sequence-based characterization of female urinary micro-biome. Bacterial DNA was detected in similar proportions ofurine samples (UUI, 63.9% [23/36]; non-UUI, 65.8% [25/38]).The lack of bacterial detection in the remaining samples may bedue to low bacterial load, insufficient bacterial lysis, and/or primerbias rather than being conclusive evidence of no bacteria in theseurine samples.
Further analyses were performed on the samples with detect-able bacterial DNA (for UUI, n � 23; for non-UUI, n � 25). Thesequences from these samples were classified into 22 phyla, 34classes, 69 orders, 150 families, and 386 genera. The most abun-
TABLE 1 Participant demographics and symptoms
Characteristic
Value for group (na)b or statistic
UUI (60)Non-UUI Control(58) P valuec
DemographicsAge (yrs) 63 (�12) 49 (�14) �0.05Race [no. (%)] 0.42
Caucasian 50 (83) 41 (77)African-American 10 (17) 11 (21)Asian 0 (0) 1 (2)
Estrogen status [no. (%)] �0.05Estrogen positive 16 (27) 31 (61)Estrogen negative 43 (73) 20 (39)
Body mass index (kg/m2) 32 (�8) 28 (�6) 0.01Hypertension [no. (%)] 21 (35) 9 (17) 0.03Coronary artery disease [no. (%)] 9 (15) 1 (2) 0.02
SymptomsSymptom scored 66 (�23) 4 (�7) �0.05Health-related quality of life (HRQL)d 56 (�25) 99 (�3) �0.05Urinary Distress Inventory (UDI)e 102 (�47) 11 (�11) �0.05Pelvic Organ Prolapse Distress Inventory (POPDI)e 70 (�52) 28 (�32) �0.05Colorectal-Anal Distress Inventory (CRADI)e 71 (�61) 43 (�62) 0.02
a n, no. of subjects.b Mean � SD or no. (%).c Pearson’s chi-square and Fisher’s exact tests were used with categorical variables. Student’s t test was used with continuous variables.d Based on OAB questionnaire.e Based on Pelvic Floor Disease Inventory.
Pearce et al.
2 ® mbio.asm.org July/August 2014 Volume 5 Issue 4 e01283-14
on Septem
ber 8, 2018 by guesthttp://m
bio.asm.org/
Dow
nloaded from
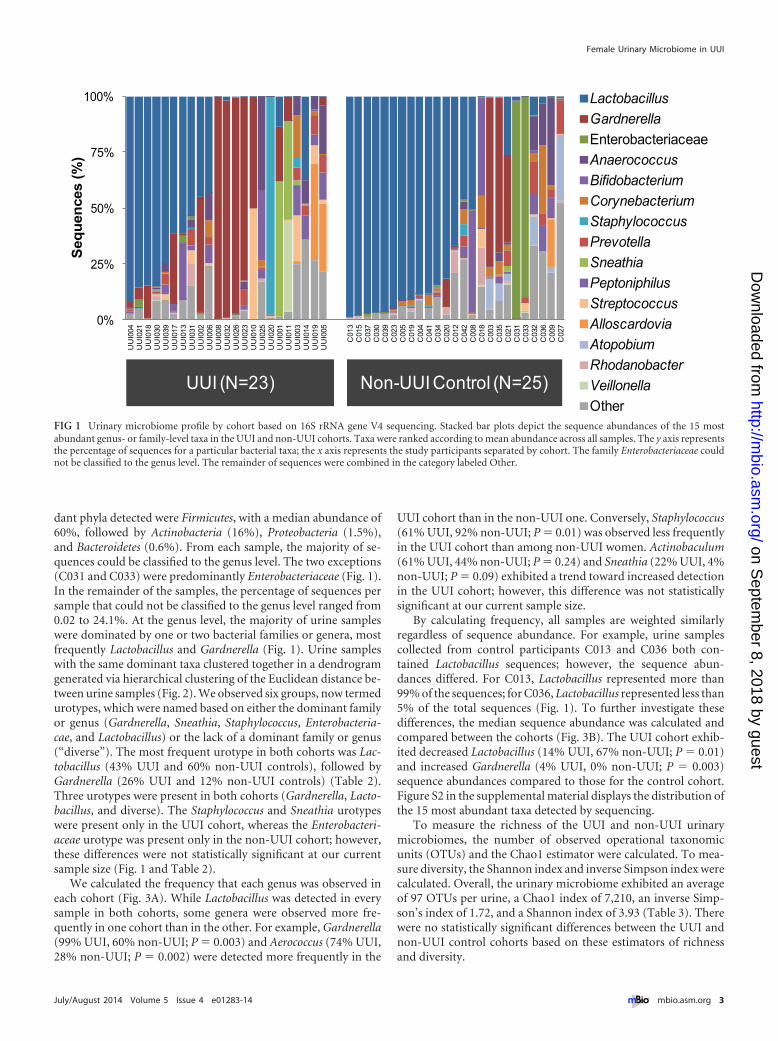
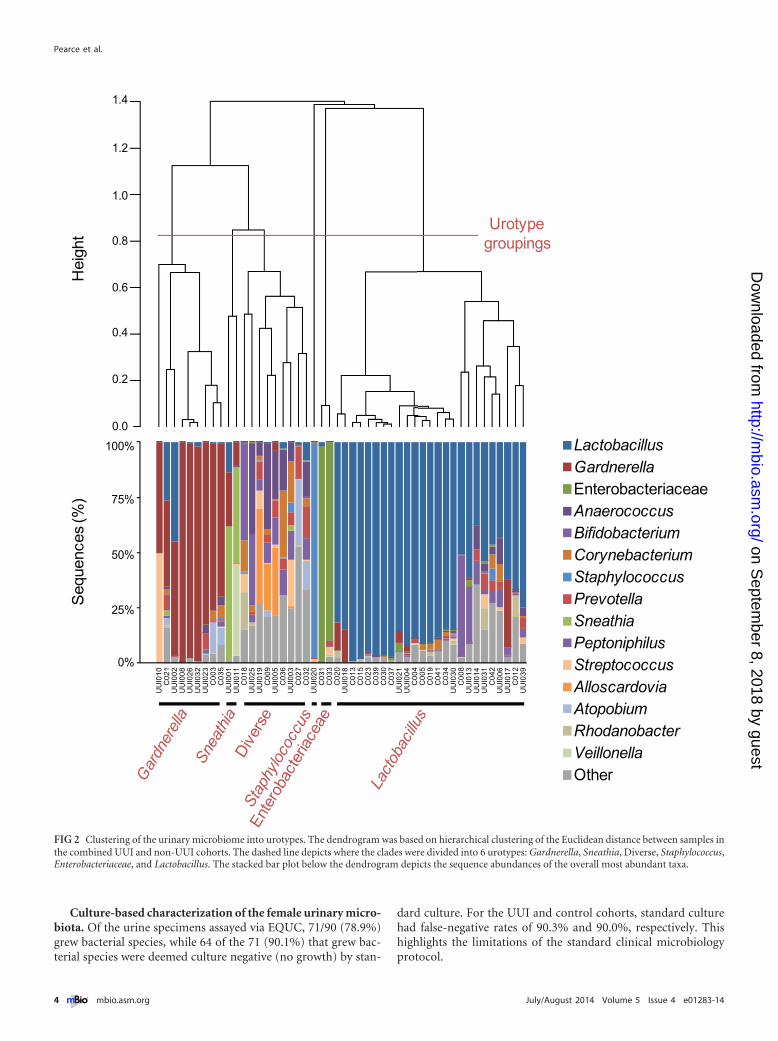
dant phyla detected were Firmicutes, with a median abundance of60%, followed by Actinobacteria (16%), Proteobacteria (1.5%),and Bacteroidetes (0.6%). From each sample, the majority of se-quences could be classified to the genus level. The two exceptions(C031 and C033) were predominantly Enterobacteriaceae (Fig. 1).In the remainder of the samples, the percentage of sequences persample that could not be classified to the genus level ranged from0.02 to 24.1%. At the genus level, the majority of urine sampleswere dominated by one or two bacterial families or genera, mostfrequently Lactobacillus and Gardnerella (Fig. 1). Urine sampleswith the same dominant taxa clustered together in a dendrogramgenerated via hierarchical clustering of the Euclidean distance be-tween urine samples (Fig. 2). We observed six groups, now termedurotypes, which were named based on either the dominant familyor genus (Gardnerella, Sneathia, Staphylococcus, Enterobacteria-cae, and Lactobacillus) or the lack of a dominant family or genus(“diverse”). The most frequent urotype in both cohorts was Lac-tobacillus (43% UUI and 60% non-UUI controls), followed byGardnerella (26% UUI and 12% non-UUI controls) (Table 2).Three urotypes were present in both cohorts (Gardnerella, Lacto-bacillus, and diverse). The Staphylococcus and Sneathia urotypeswere present only in the UUI cohort, whereas the Enterobacteri-aceae urotype was present only in the non-UUI cohort; however,these differences were not statistically significant at our currentsample size (Fig. 1 and Table 2).
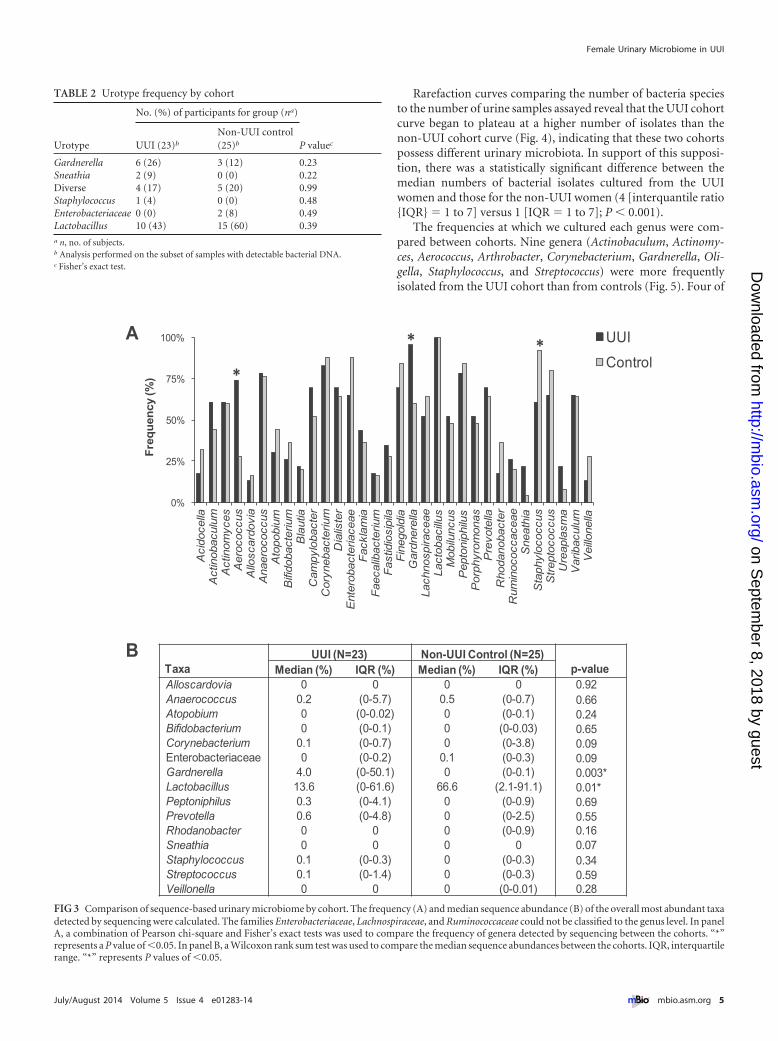
We calculated the frequency that each genus was observed ineach cohort (Fig. 3A). While Lactobacillus was detected in everysample in both cohorts, some genera were observed more fre-quently in one cohort than in the other. For example, Gardnerella(99% UUI, 60% non-UUI; P � 0.003) and Aerococcus (74% UUI,28% non-UUI; P � 0.002) were detected more frequently in the
UUI cohort than in the non-UUI one. Conversely, Staphylococcus(61% UUI, 92% non-UUI; P � 0.01) was observed less frequentlyin the UUI cohort than among non-UUI women. Actinobaculum(61% UUI, 44% non-UUI; P � 0.24) and Sneathia (22% UUI, 4%non-UUI; P � 0.09) exhibited a trend toward increased detectionin the UUI cohort; however, this difference was not statisticallysignificant at our current sample size.
By calculating frequency, all samples are weighted similarlyregardless of sequence abundance. For example, urine samplescollected from control participants C013 and C036 both con-tained Lactobacillus sequences; however, the sequence abun-dances differed. For C013, Lactobacillus represented more than99% of the sequences; for C036, Lactobacillus represented less than5% of the total sequences (Fig. 1). To further investigate thesedifferences, the median sequence abundance was calculated andcompared between the cohorts (Fig. 3B). The UUI cohort exhib-ited decreased Lactobacillus (14% UUI, 67% non-UUI; P � 0.01)and increased Gardnerella (4% UUI, 0% non-UUI; P � 0.003)sequence abundances compared to those for the control cohort.Figure S2 in the supplemental material displays the distribution ofthe 15 most abundant taxa detected by sequencing.
To measure the richness of the UUI and non-UUI urinarymicrobiomes, the number of observed operational taxonomicunits (OTUs) and the Chao1 estimator were calculated. To mea-sure diversity, the Shannon index and inverse Simpson index werecalculated. Overall, the urinary microbiome exhibited an averageof 97 OTUs per urine, a Chao1 index of 7,210, an inverse Simp-son’s index of 1.72, and a Shannon index of 3.93 (Table 3). Therewere no statistically significant differences between the UUI andnon-UUI control cohorts based on these estimators of richnessand diversity.
0%
25%
50%
75%
100%
UU
I004
UU
I021
UU
I018
UU
I030
UU
I039
UU
I017
UU
I013
UU
I031
UU
I002
UU
I006
UU
I008
UU
I032
UU
I026
UU
I023
UU
I010
UU
I025
UU
I020
UU
I001
UU
I011
UU
I003
UU
I014
UU
I019
UU
I005
C01
3C
015
C03
7C
030
C03
9C
023
C00
5C
019
C00
4C
041
C03
4C
020
C01
2C
042
C00
8C
018
C00
3C
035
C02
1C
031
C03
3C
032
C03
6C
009
C02
7
Seq
uen
ces
(%)
Lactobacillus
Gardnerella
EnterobacteriaceaeAnaerococcus
Bifidobacterium
Corynebacterium
Staphylococcus
Prevotella
Sneathia
Peptoniphilus
Streptococcus
Alloscardovia
Atopobium
Rhodanobacter
Veillonella
Other
UUI (N=23) Non-UUI Control (N=25)
FIG 1 Urinary microbiome profile by cohort based on 16S rRNA gene V4 sequencing. Stacked bar plots depict the sequence abundances of the 15 mostabundant genus- or family-level taxa in the UUI and non-UUI cohorts. Taxa were ranked according to mean abundance across all samples. The y axis representsthe percentage of sequences for a particular bacterial taxa; the x axis represents the study participants separated by cohort. The family Enterobacteriaceae couldnot be classified to the genus level. The remainder of sequences were combined in the category labeled Other.
Female Urinary Microbiome in UUI
July/August 2014 Volume 5 Issue 4 e01283-14 ® mbio.asm.org 3
on Septem
ber 8, 2018 by guesthttp://m
bio.asm.org/
Dow
nloaded from
Culture-based characterization of the female urinary micro-biota. Of the urine specimens assayed via EQUC, 71/90 (78.9%)grew bacterial species, while 64 of the 71 (90.1%) that grew bac-terial species were deemed culture negative (no growth) by stan-
dard culture. For the UUI and control cohorts, standard culturehad false-negative rates of 90.3% and 90.0%, respectively. Thishighlights the limitations of the standard clinical microbiologyprotocol.
0%
25%
50%
75%
100%
UU
I01
0C
02
1U
UI0
02
UU
I00
8U
UI0
26
UU
I03
2U
UI0
23
C0
03
C0
35
UU
I00
1U
UI0
11
C0
18
UU
I02
5U
UI0
19
C0
09
UU
I00
5C
03
6U
UI0
03
C0
27
C0
32
UU
I02
0C
03
1C
03
3C
02
0U
UI0
18
C0
13
C0
15
C0
23
C0
39
C0
30
C0
37
UU
I02
1U
UI0
04
C0
04
C0
05
C0
19
C0
41
C0
34
UU
I03
0C
00
8U
UI0
13
UU
I01
4U
UI0
31
C0
42
UU
I00
6U
UI0
17
C0
12
UU
I03
9
LactobacillusGardnerellaEnterobacteriaceaeAnaerococcusBifidobacteriumCorynebacteriumStaphylococcusPrevotellaSneathiaPeptoniphilusStreptococcusAlloscardoviaAtopobiumRhodanobacterVeillonellaOther
Urotypegroupings
1.4
1.2
1.0
0.8
0.6
0.4
0.2
0.0
Hei
ght
Seq
uenc
es (%
)
100%
75%
50%
25%
0%
FIG 2 Clustering of the urinary microbiome into urotypes. The dendrogram was based on hierarchical clustering of the Euclidean distance between samples inthe combined UUI and non-UUI cohorts. The dashed line depicts where the clades were divided into 6 urotypes: Gardnerella, Sneathia, Diverse, Staphylococcus,Enterobacteriaceae, and Lactobacillus. The stacked bar plot below the dendrogram depicts the sequence abundances of the overall most abundant taxa.
Pearce et al.
4 ® mbio.asm.org July/August 2014 Volume 5 Issue 4 e01283-14
on Septem
ber 8, 2018 by guesthttp://m
bio.asm.org/
Dow
nloaded from
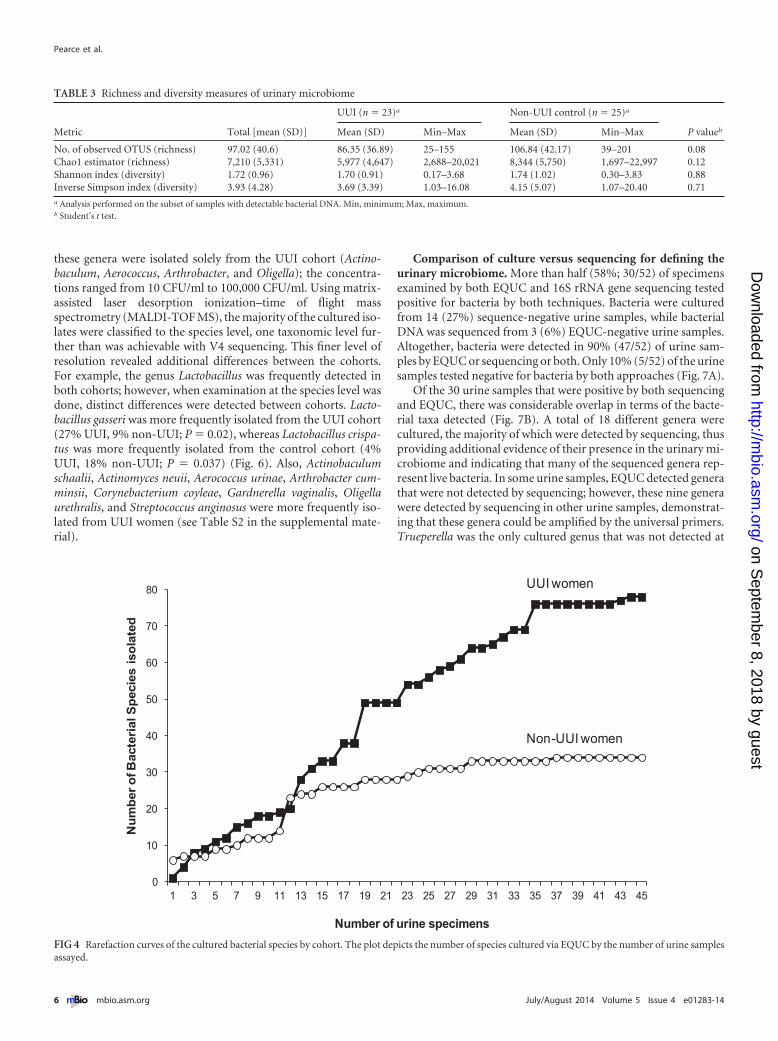
Rarefaction curves comparing the number of bacteria speciesto the number of urine samples assayed reveal that the UUI cohortcurve began to plateau at a higher number of isolates than thenon-UUI cohort curve (Fig. 4), indicating that these two cohortspossess different urinary microbiota. In support of this supposi-tion, there was a statistically significant difference between themedian numbers of bacterial isolates cultured from the UUIwomen and those for the non-UUI women (4 [interquantile ratio{IQR} � 1 to 7] versus 1 [IQR � 1 to 7]; P � 0.001).
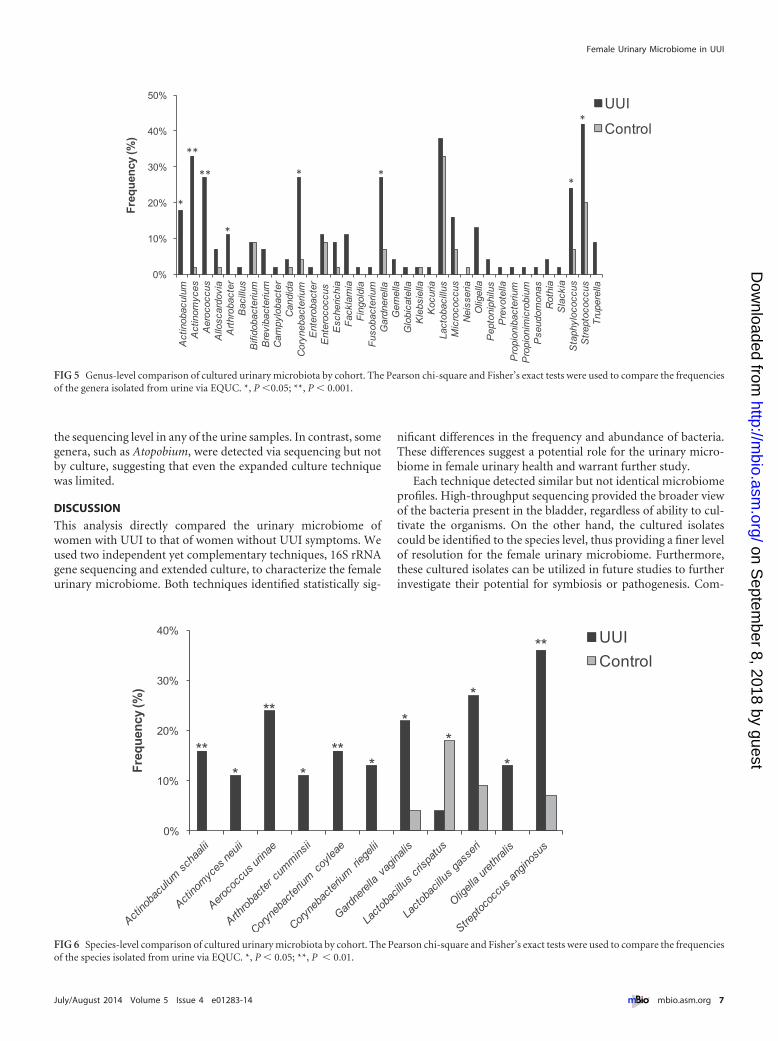
The frequencies at which we cultured each genus were com-pared between cohorts. Nine genera (Actinobaculum, Actinomy-ces, Aerococcus, Arthrobacter, Corynebacterium, Gardnerella, Oli-gella, Staphylococcus, and Streptococcus) were more frequentlyisolated from the UUI cohort than from controls (Fig. 5). Four of
TABLE 2 Urotype frequency by cohort
Urotype
No. (%) of participants for group (na)
P valuecUUI (23)b
Non-UUI control(25)b
Gardnerella 6 (26) 3 (12) 0.23Sneathia 2 (9) 0 (0) 0.22Diverse 4 (17) 5 (20) 0.99Staphylococcus 1 (4) 0 (0) 0.48Enterobacteriaceae 0 (0) 2 (8) 0.49Lactobacillus 10 (43) 15 (60) 0.39a n, no. of subjects.b Analysis performed on the subset of samples with detectable bacterial DNA.c Fisher’s exact test.
TaxaUUI (N=23) Non-UUI Control (N=25)
p-valueMedian (%) IQR (%) Median (%) IQR (%)Alloscardovia 0 0 0 0 0.92Anaerococcus 0.2 (0-5.7) 0.5 (0-0.7) 0.66Atopobium 0 (0-0.02) 0 (0-0.1) 0.24Bifidobacterium 0 (0-0.1) 0 (0-0.03) 0.65Corynebacterium 0.1 (0-0.7) 0 (0-3.8) 0.09Enterobacteriaceae 0 (0-0.2) 0.1 (0-0.3) 0.09Gardnerella 4.0 (0-50.1) 0 (0-0.1) 0.003*Lactobacillus 13.6 (0-61.6) 66.6 (2.1-91.1) 0.01*Peptoniphilus 0.3 (0-4.1) 0 (0-0.9) 0.69Prevotella 0.6 (0-4.8) 0 (0-2.5) 0.55Rhodanobacter 0 0 0 (0-0.9) 0.16Sneathia 0 0 0 0 0.07Staphylococcus 0.1 (0-0.3) 0 (0-0.3) 0.34Streptococcus 0.1 (0-1.4) 0 (0-0.3) 0.59Veillonella 0 0 0 (0-0.01) 0.28
0%
25%
50%
75%
100%
Acid
oce
llaA
ctin
obacu
lum
Act
inom
yces
Aero
cocc
us
Allo
scard
ovi
aA
naero
cocc
us
Ato
pobiu
mB
ifidobact
eriu
mB
lautia
Cam
pyl
obacte
rC
ory
nebacte
rium
Dia
liste
rE
nte
robact
eriaceae
Fack
lam
iaF
aeca
libact
erium
Fast
idio
sipila
Fin
egold
iaG
ard
nere
llaLach
nosp
iraceae
Lacto
baci
llus
Mob
iluncu
sP
epto
nip
hilu
sP
orp
hyr
om
onas
Pre
vote
llaR
hodanobact
er
Rum
inococcaceae
Sneath
iaS
taphyl
oco
ccus
Str
epto
coccus
Ure
apla
sma
Varib
acu
lum
Veill
onella
Fre
qu
en
cy (%
)
UUI
Control
A
B
**
*
FIG 3 Comparison of sequence-based urinary microbiome by cohort. The frequency (A) and median sequence abundance (B) of the overall most abundant taxadetected by sequencing were calculated. The families Enterobacteriaceae, Lachnospiraceae, and Ruminococcaceae could not be classified to the genus level. In panelA, a combination of Pearson chi-square and Fisher’s exact tests was used to compare the frequency of genera detected by sequencing between the cohorts. “*”represents a P value of �0.05. In panel B, a Wilcoxon rank sum test was used to compare the median sequence abundances between the cohorts. IQR, interquartilerange. “*” represents P values of �0.05.
Female Urinary Microbiome in UUI
July/August 2014 Volume 5 Issue 4 e01283-14 ® mbio.asm.org 5
on Septem
ber 8, 2018 by guesthttp://m
bio.asm.org/
Dow
nloaded from
these genera were isolated solely from the UUI cohort (Actino-baculum, Aerococcus, Arthrobacter, and Oligella); the concentra-tions ranged from 10 CFU/ml to 100,000 CFU/ml. Using matrix-assisted laser desorption ionization–time of flight massspectrometry (MALDI-TOF MS), the majority of the cultured iso-lates were classified to the species level, one taxonomic level fur-ther than was achievable with V4 sequencing. This finer level ofresolution revealed additional differences between the cohorts.For example, the genus Lactobacillus was frequently detected inboth cohorts; however, when examination at the species level wasdone, distinct differences were detected between cohorts. Lacto-bacillus gasseri was more frequently isolated from the UUI cohort(27% UUI, 9% non-UUI; P � 0.02), whereas Lactobacillus crispa-tus was more frequently isolated from the control cohort (4%UUI, 18% non-UUI; P � 0.037) (Fig. 6). Also, Actinobaculumschaalii, Actinomyces neuii, Aerococcus urinae, Arthrobacter cum-minsii, Corynebacterium coyleae, Gardnerella vaginalis, Oligellaurethralis, and Streptococcus anginosus were more frequently iso-lated from UUI women (see Table S2 in the supplemental mate-rial).
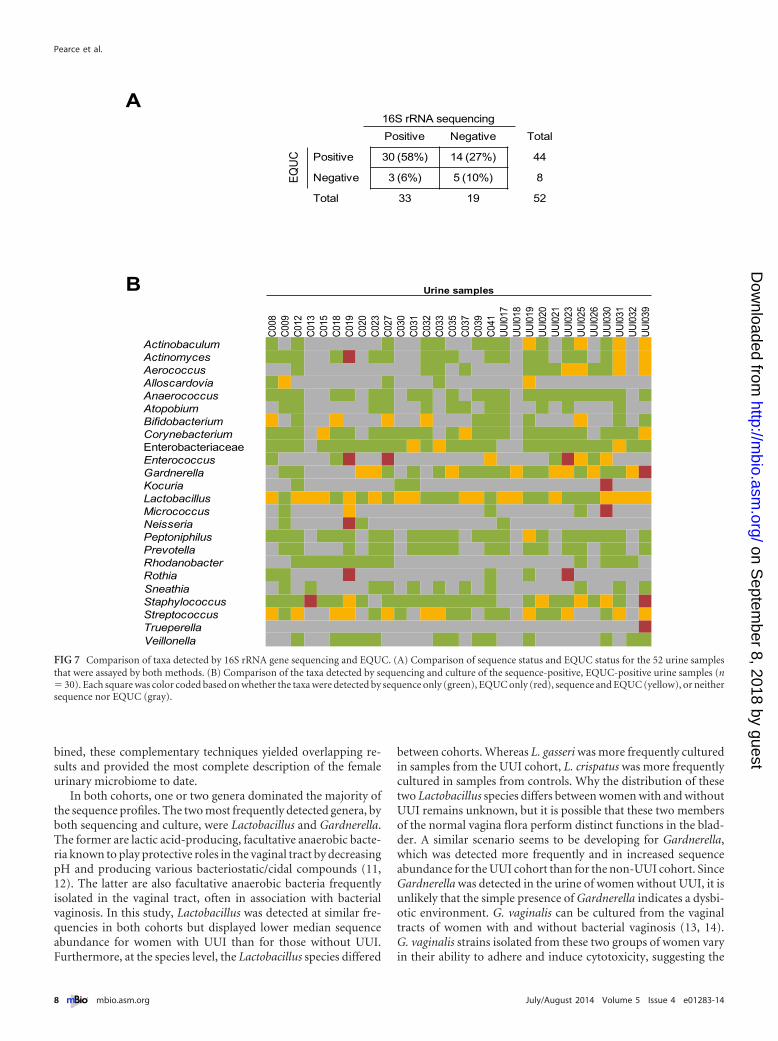
Comparison of culture versus sequencing for defining theurinary microbiome. More than half (58%; 30/52) of specimensexamined by both EQUC and 16S rRNA gene sequencing testedpositive for bacteria by both techniques. Bacteria were culturedfrom 14 (27%) sequence-negative urine samples, while bacterialDNA was sequenced from 3 (6%) EQUC-negative urine samples.Altogether, bacteria were detected in 90% (47/52) of urine sam-ples by EQUC or sequencing or both. Only 10% (5/52) of the urinesamples tested negative for bacteria by both approaches (Fig. 7A).
Of the 30 urine samples that were positive by both sequencingand EQUC, there was considerable overlap in terms of the bacte-rial taxa detected (Fig. 7B). A total of 18 different genera werecultured, the majority of which were detected by sequencing, thusproviding additional evidence of their presence in the urinary mi-crobiome and indicating that many of the sequenced genera rep-resent live bacteria. In some urine samples, EQUC detected generathat were not detected by sequencing; however, these nine generawere detected by sequencing in other urine samples, demonstrat-ing that these genera could be amplified by the universal primers.Trueperella was the only cultured genus that was not detected at
TABLE 3 Richness and diversity measures of urinary microbiome
Metric Total [mean (SD)]
UUI (n � 23)a Non-UUI control (n � 25)a
P valuebMean (SD) Min–Max Mean (SD) Min–Max
No. of observed OTUS (richness) 97.02 (40.6) 86.35 (36.89) 25–155 106.84 (42.17) 39–201 0.08Chao1 estimator (richness) 7,210 (5,331) 5,977 (4,647) 2,688–20,021 8,344 (5,750) 1,697–22,997 0.12Shannon index (diversity) 1.72 (0.96) 1.70 (0.91) 0.17–3.68 1.74 (1.02) 0.30–3.83 0.88Inverse Simpson index (diversity) 3.93 (4.28) 3.69 (3.39) 1.03–16.08 4.15 (5.07) 1.07–20.40 0.71a Analysis performed on the subset of samples with detectable bacterial DNA. Min, minimum; Max, maximum.b Student’s t test.
0
10
20
30
40
50
60
70
80
1 3 5 7 9 11 13 15 17 19 21 23 25 27 29 31 33 35 37 39 41 43 45
Nu
mb
er o
f Bac
teri
al S
pec
ies
iso
late
d
Number of urine specimens
UUI women
Non-UUI women
FIG 4 Rarefaction curves of the cultured bacterial species by cohort. The plot depicts the number of species cultured via EQUC by the number of urine samplesassayed.
Pearce et al.
6 ® mbio.asm.org July/August 2014 Volume 5 Issue 4 e01283-14
on Septem
ber 8, 2018 by guesthttp://m
bio.asm.org/
Dow
nloaded from
the sequencing level in any of the urine samples. In contrast, somegenera, such as Atopobium, were detected via sequencing but notby culture, suggesting that even the expanded culture techniquewas limited.
DISCUSSION
This analysis directly compared the urinary microbiome ofwomen with UUI to that of women without UUI symptoms. Weused two independent yet complementary techniques, 16S rRNAgene sequencing and extended culture, to characterize the femaleurinary microbiome. Both techniques identified statistically sig-
nificant differences in the frequency and abundance of bacteria.These differences suggest a potential role for the urinary micro-biome in female urinary health and warrant further study.
Each technique detected similar but not identical microbiomeprofiles. High-throughput sequencing provided the broader viewof the bacteria present in the bladder, regardless of ability to cul-tivate the organisms. On the other hand, the cultured isolatescould be identified to the species level, thus providing a finer levelof resolution for the female urinary microbiome. Furthermore,these cultured isolates can be utilized in future studies to furtherinvestigate their potential for symbiosis or pathogenesis. Com-
0%
10%
20%
30%
40%
50%
Act
inob
acul
umA
ctin
omyc
esA
eroc
occu
sA
llosc
ardo
via
Art
hrob
acte
rB
acill
usB
ifido
bact
eriu
mB
revi
bact
eriu
mC
ampy
loba
cter
Can
dida
Cor
yneb
acte
rium
Ent
erob
acte
rE
nter
ococ
cus
Esc
heric
hia
Fac
klam
iaF
ingo
ldia
Fus
obac
teriu
mG
ardn
erel
laG
emel
laG
lobi
cate
llaK
lebs
iella
Koc
uria
Lact
obac
illus
Mic
roco
ccus
Nei
sser
iaO
ligel
laP
epto
niph
ilus
Pre
vote
llaP
ropi
onib
acte
rium
Pro
pion
imic
robi
umP
seud
omon
asR
othi
aS
lack
iaS
taph
yloc
occu
sS
trep
toco
ccus
Tru
pere
lla
Fre
qu
ency
(%)
UUI
Control
*
**
**
*
* **
*
FIG 5 Genus-level comparison of cultured urinary microbiota by cohort. The Pearson chi-square and Fisher’s exact tests were used to compare the frequenciesof the genera isolated from urine via EQUC. *, P �0.05; **, P � 0.001.
0%
10%
20%
30%
40%
Fre
qu
ency
(%)
UUI
Control
**
*
**
*
***
**
*
*
**
FIG 6 Species-level comparison of cultured urinary microbiota by cohort. The Pearson chi-square and Fisher’s exact tests were used to compare the frequenciesof the species isolated from urine via EQUC. *, P � 0.05; **, P � 0.01.
Female Urinary Microbiome in UUI
July/August 2014 Volume 5 Issue 4 e01283-14 ® mbio.asm.org 7
on Septem
ber 8, 2018 by guesthttp://m
bio.asm.org/
Dow
nloaded from
bined, these complementary techniques yielded overlapping re-sults and provided the most complete description of the femaleurinary microbiome to date.
In both cohorts, one or two genera dominated the majority ofthe sequence profiles. The two most frequently detected genera, byboth sequencing and culture, were Lactobacillus and Gardnerella.The former are lactic acid-producing, facultative anaerobic bacte-ria known to play protective roles in the vaginal tract by decreasingpH and producing various bacteriostatic/cidal compounds (11,12). The latter are also facultative anaerobic bacteria frequentlyisolated in the vaginal tract, often in association with bacterialvaginosis. In this study, Lactobacillus was detected at similar fre-quencies in both cohorts but displayed lower median sequenceabundance for women with UUI than for those without UUI.Furthermore, at the species level, the Lactobacillus species differed
between cohorts. Whereas L. gasseri was more frequently culturedin samples from the UUI cohort, L. crispatus was more frequentlycultured in samples from controls. Why the distribution of thesetwo Lactobacillus species differs between women with and withoutUUI remains unknown, but it is possible that these two membersof the normal vagina flora perform distinct functions in the blad-der. A similar scenario seems to be developing for Gardnerella,which was detected more frequently and in increased sequenceabundance for the UUI cohort than for the non-UUI cohort. SinceGardnerella was detected in the urine of women without UUI, it isunlikely that the simple presence of Gardnerella indicates a dysbi-otic environment. G. vaginalis can be cultured from the vaginaltracts of women with and without bacterial vaginosis (13, 14).G. vaginalis strains isolated from these two groups of women varyin their ability to adhere and induce cytotoxicity, suggesting the
Urine samples
C008
C009
C012
C013
C015
C018
C019
C020
C023
C027
C030
C031
C032
C033
C035
C037
C039
C041
UUI0
17UU
I018
UUI0
19UU
I020
UUI0
21UU
I023
UUI0
25UU
I026
UUI0
30UU
I031
UUI0
32UU
I039
ActinobaculumActinomycesAerococcusAlloscardoviaAnaerococcusAtopobiumBifidobacteriumCorynebacteriumEnterobacteriaceaeEnterococcusGardnerellaKocuriaLactobacillusMicrococcusNeisseriaPeptoniphilusPrevotellaRhodanobacterRothiaSneathiaStaphylococcusStreptococcusTrueperellaVeillonella
A
B
16S rRNA sequencingPositive Negative Total
EQU
C Positive 30 (58%) 14 (27%) 44
Negative 3 (6%) 5 (10%) 8
Total 33 19 52
FIG 7 Comparison of taxa detected by 16S rRNA gene sequencing and EQUC. (A) Comparison of sequence status and EQUC status for the 52 urine samplesthat were assayed by both methods. (B) Comparison of the taxa detected by sequencing and culture of the sequence-positive, EQUC-positive urine samples (n� 30). Each square was color coded based on whether the taxa were detected by sequence only (green), EQUC only (red), sequence and EQUC (yellow), or neithersequence nor EQUC (gray).
Pearce et al.
8 ® mbio.asm.org July/August 2014 Volume 5 Issue 4 e01283-14
on Septem
ber 8, 2018 by guesthttp://m
bio.asm.org/
Dow
nloaded from
possibility of pathogenic and symbiotic strains of G. vaginalis (14).Whether the isolates identified by MALDI-TOF MS as Gardnerellaspecies fall into the latter category remains to be determined.
Several bacterial genera were more frequently sequenced andcultured from the urine of women with UUI, including Actino-baculum, Actinomyces, Aerococcus, Arthrobacter, and Oligella. In-terestingly, many of these genera contain emerging uropathogens,including Actinobaculum schaalii, Aerococcus urinae, Oligella ureo-lytica, and Arthrobacter cumminsii (15–19). Whether these bacte-ria contribute to UUI is unknown at this time.
In addition to Lactobacillus and Gardnerella, many of the gen-era detected in the urinary microbiome are often found in thevaginal tract, including Bifidobacterium, Enterococcus, Actinomy-ces, Prevotella, and Atopobium (13, 20). Since the urine samples inthis study were collected via transurethral catheter, as opposed toa voided approach, these genera are likely true inhabitants of theurinary tract and not vaginal contamination. This contention issupported by our previous demonstration that the microbiomesequence profile of catheterized urine is distinct from that ofvoided urine and instead closely resembles that of urine collectedvia suprapubic aspiration, which bypasses the vagina and urethra(1). Genera found in both the urinary and vaginal tracts couldsuggest a shared urogenital microbiome. Alternatively, therecould be differences at the species or strain levels, such that thevaginal and urinary community members differ. It is easy to imag-ine that the specific conditions of these quite different environ-mental niches could select for different traits.
Two genera, Corynebacterium and Streptococcus, were culturedmore frequently from UUI women yet were detected at similarfrequencies by sequencing. A third genus, Staphylococcus, wasmore frequently cultured from UUI women but more frequentlydetected by sequencing in the control cohort. The simplest expla-nation for these discrepancies would be that certain species ofthese genera do not grow under the current EQUC conditions.Efforts to further extend this new protocol are planned.
Although the urinary microbiome shares a number of generain common with other microbial sites within the human body,two key differences set the urinary microbiome apart. Comparedto the colon, which contains 1011 to 1012 CFU/g (21), on average,the urinary tract microbiome consists of �104 CFU/ml total bac-teria. In our study, the median amount of bacteria per urine was85 CFU/ml. The urinary microbiome, with a median inverseSimpson index of 2.3 and Shannon index of 1.5, is also less diversethan other microbial sites in the human body, such as the skin,mouth, and gastrointestinal tract (22, 23). Taken together, thesefindings suggest that the bladder is a relatively unique microbialsite within the human body and may be more akin to other low-abundance sites, such as the eye (24).
Changes in microbial diversity within a niche have been linkedto disease. Examples include decreased fecal microbiome diversityassociated with Clostridium difficile infection (25) and increasedvaginal microbiome diversity associated with bacterial vaginosis(26). In this study, we did not detect large differences in sequence-based diversity between the two cohorts. It is possible that we wereunable to detect a difference due to the lack of power with oursmall sample size. Alternatively, the amount of diversity within theurinary microbiome of UUI women may not differ from that fornon-UUI women. Instead, the key distinction might be the bacte-rial types that are present. Although we did not detect differencesin richness or diversity by sequence, we detected differences in the
species richness between the cohorts by culture. A greater numberof bacterial species were cultured from the UUI cohort than fromthe non-UUI control cohort. This finding further demonstratesthe power of utilizing multiple approaches to define a microbialcommunity.
The urine of UUI women was more likely to contain Actino-myces, Aerococcus, and Gardnerella and less likely to contain Lac-tobacillus than urine collected from women without UUI. Themechanism behind this observation is unknown. One possibilityis that the UUI bladder selects for some bacteria over others, andas such, the presence of these organisms in the bladder could serveas a marker for dysbiosis. Another possibility is that these bacteriacontribute to UUI symptoms, a supposition supported by the ob-servation that each of the genera associated with the UUI cohortcontains at least one reported pathogenic species. Taken together,this study, along with others, will eventually allow us to define acore or common urinary microbiome that can be used to detectalterations to that community.
A limitation of this analysis is that our UUI and non-UUI co-horts differed in several characteristics that may have clinical rel-evance for the female urinary microbiome. Thus, we are unable tosay whether age, BMI, or hormonal status affects our findings, andit is possible that our findings are related to these differencesrather than to urinary symptomatology. Studies that describe thefemale urinary microbiome in large, well-characterized popula-tions have not been published. Future studies, with larger samplesizes, will be required to evaluate these potentially important dif-ferences. Studies describing the longitudinal stability of the femaleurinary microbiome (including populations undergoing treat-ment for urinary disorders) are also lacking. Such studies shouldbe prioritized given the emerging evidence that the female urinarymicrobiome may yield important clinical information.
MATERIALS AND METHODSStudy design and population. Following Loyola institutional reviewboard (IRB) approval, participants gave verbal and written consent forchart abstraction and urine collection with analysis for research purposes.Participants were recruited from the clinical practice of the Female PelvicMedicine and Reconstructive Surgery Center of Loyola University Medi-cal Center between August 2012 and February 2014. These includedwomen undergoing UUI treatment (UUI cohort) and a comparisongroup of women not bothered by urinary symptoms (non-UUI controlcohort). All women were screened for potential study participation usingthe validated symptom questionnaire, the Pelvic Floor Distress Inventory(PFDI) (27, 28). Exclusion criteria for both cohorts included current UTI(based on urine dipstick) or history of recurrent UTI, antibiotic exposurein the past 4 weeks for any reason, immunologic deficiency, neurologicaldisease known to affect the lower urinary tract, pelvic malignancy or ra-diation, untreated symptomatic pelvic organ prolapse (POP) greater thanPOP-Q stage II (vaginal protrusion more than 1 cm outside of the vaginalhymen), or pregnancy. Clinical and demographic information were ab-stracted from the electronic medical record. Enrolled participants com-pleted the long form of the PFDI and the Overactive Bladder Question-naire (OAB-q) (29). Premenopausal woman and postmenopausal womentaking any form of estrogen replacement were considered estrogen posi-tive.
Sample collection. Urine was collected aseptically via transurethralcatheter. A portion of the urine sample was placed in a BD Vacutainer PlusC&S preservative tube for culturing. A separate portion for sequencingwas placed at 4° C for �4 h following collection; 10% AssayAssure(Thermo Scientific; Waltham, MA) was added before storage at �80° C.
The first urine samples collected (14 UUI samples and 8 non-UUI
Female Urinary Microbiome in UUI
July/August 2014 Volume 5 Issue 4 e01283-14 ® mbio.asm.org 9
on Septem
ber 8, 2018 by guesthttp://m
bio.asm.org/
Dow
nloaded from
control samples) were screened exclusively by 16S rRNA gene sequencing;this was before we implemented EQUC. Subsequent urine samples (22UUI and 30 non-UUI control samples) were screened by both 16S rRNAgene sequencing and EQUC. The final urine samples (23 UUI and 15non-UUI control samples) were screened only by EQUC without high-throughput sequencing. Thus, we used EQUC for 45 UUI and 45 non-UUI samples and 16S rRNA gene sequencing for 36 UUI and 38 non-UUIsamples.
Urine culture. For standard urine culture, we struck 0.001 ml of urineonto 5% sheep blood (BAP) and MacConkey agars (BD BBL preparedplated media), which were incubated aerobically at 35°C for 24 h. Eachseparate morphological colony type was counted and identified in anyamount. The detection level was 1,000 CFU/ml, represented by 1 colonyof growth on either plate. If no growth was observed, the culture wasreported as “no growth,” indicating no growth of bacteria at the lowestdilution, i.e., 1:1,000.
For EQUC, we struck 0.1 ml of urine onto BAP, chocolate and colistin,naladixic acid (CNA) agars (BD BBL prepared plated media), which wereincubated in 5% CO2 at 35°C for 48 h (see Fig. S1 in the supplementalmaterial). A second set of BAPs was inoculated with 0.1 ml of urine andincubated in room atmosphere at 35°C and 30°C for 48 h. We also inoc-ulated 0.1 ml of urine onto each of two CDC anaerobe 5% sheep bloodagar plates (BD BBL prepared plated media) and incubated either in aCampy gas mixture (5% O2, 10% CO2, and 85% N) or under anaerobicconditions at 35°C for 48 h. The detection level was 10 CFU/ml, repre-sented by 1 colony of growth on any of the plates. Finally, to detect anybacterial species that may be present at quantities lower than 10 CFU/ml,1.0 ml of urine was placed in thioglycolate medium (BD BBL preparedtubed media) and incubated aerobically at 35°C for 5 days. If growth wasvisually detected in the thioglycolate medium, the medium was mixed,and a few drops were plated on BAP and CDC Anaerobe 5% sheep bloodagars for isolation and incubated aerobically and anaerobically at 35°C for48 h. Each morphologically distinct colony type was isolated on a differentplate of the same medium to prepare a pure culture that was used foridentification. Matrix-assisted laser desorption ionization–time of flightmass spectrophotometry (MALDI-TOF MS) with the MALDI Biotyper3.0 software program (Bruker Daltonics, Billerica, MA) was used to iden-tify the bacterial isolates, as described elsewhere (4). To determine thefalse-negative rate, the following equation was used: the number of falsenegatives (EQUC positive, standard negative) divided by the sum of thenumber of true positives (EQUC positive) and false negatives (EQUCpositive, routine negative).
DNA isolation from urine. We used a previously validated DNA ex-traction protocol developed for the Human Microbiome Project. Theprotocol includes the addition of the peptidoglycan-degrading enzymesmutanolysin and lysozyme, which ensure robust lysis of Gram-positiveand Gram-negative species, to isolate genomic DNA from urine samples(30). Briefly, 1 ml of urine was centrifuged at 13,500 rpm for 10 min, andthe resulting pellet was resuspended in 200 �l of filter-sterilized bufferconsisting of 20 mM Tris-Cl (pH 8), 2 mM EDTA, 1.2% Triton X-100,and 20 �g/ml lysozyme and supplemented with 30 �l of filter-sterilizedmutanolysin (5,000 U/ml; Sigma-Aldrich, St. Louis, MO). The mixturewas incubated for 1 h at 37°C, and the lysates were processed through theDNeasy blood and tissue kit (Qiagen, Valencia, CA) according to themanufacturer’s protocol. The DNA was eluted into 50 �l of buffer AE,pH 8.0, and stored at �20° C.
16S rRNA gene library generation and MiSeq sequencing. Sequenc-ing was performed using a MiSeq desktop sequencer (Illumina, San Di-ego, CA). First, a 16S rRNA gene amplicon library was generated via twoconsecutive PCR amplifications. In the first reaction, the variable 4 region(V4) of the 16S rRNA gene was amplified using the universal primers 515Fand 806R, which were modified to encode the Illumina MiSeq sequencingprimer sequence at the 5= end (see Table S1 in the supplemental material).Reaction mixtures were incubated at 94°C for 2 min to denature the DNAtemplate and amplified for 30 cycles at 94°C for 30 s, 55°C for 30 s, and
72°C for 90 s. To ensure complete amplification, samples were incubatedat 72°C for an additional 10 min. Ten-microliter aliquots of each reactionmixture were run on a 1% agarose gel. Samples containing a band ofapproximately 360 bp were considered PCR positive and subjected tofurther library preparation. Samples with no visible amplified productwere considered PCR negative and not processed further. The PCR-positive reaction mixtures were diluted 1:50 and amplified for an addi-tional 10 cycles, utilizing primers encoding the required adapter se-quences for Illumina MiSeq sequencing and an 8-nucleotide (nt) sampleindex (see Table S1), using the PCR conditions described above. Unincor-porated nucleotides and remaining primers were removed via use of theQIAquick PCR purification kit (Qiagen, Valencia, CA), and the DNAconcentration of the eluted product was determined by Nanodrop spec-troscopy (Thermo Scientific; Waltham, MA). One hundred nanograms ofeach sample amplicon was pooled and run through a 1% agarose gel. Thefinal product, which includes the V4 region and the adapter sequences(390 to 450 bp in length depending upon the length of the V4 region), wasgel extracted via the QIAquick gel extraction kit and further purified viaAgencourt AMPure XP-PCR magnetic beads (Beckman Coulter, Pasa-dena, CA). The final concentration of the pooled DNA was determined viaNanodrop spectroscopy and diluted in EBT (Elution Buffer with Tris;Illumina, San Diego, CA) to 2 nM. An equal volume of 0.2 N NaOH wasadded, incubated at room temperature for 5 min, and quenched withhybridization buffer (Illumina, San Diego, CA) to a final concentration of8 pM. The Human Microbiome Project mock community HM-782D(BEI Resources, ATCC, Manassas, VA), a standard used to optimize ourapproach, was mixed 1:1 with randomly generated PhiX libraries, whichare added to help focus the cameras on the sequencing clusters. Thismixture was added to the sample library at equal volumes and placed inthe 2 � 250 bp sequencing reagent cartridge according to the manufac-turer’s instructions (Illumina, San Diego, CA).
Care was taken to avoid bacterial DNA contamination by utilizingDNA-free reagents when applicable, filter sterilizing all solutions througha 0.2 �M filter, and working in a PCR-clean hood. To control for theintroduction of contaminating DNA, negative controls for extraction (nourine) and PCR (no template) were included in each experiment. Theextraction negative control for each experiment was sequenced to identifyspurious genera likely introduced from contaminated reagents and mate-rials.
Sequence analysis. The Illumina MiSeq postsequencing software pre-processed sequences by removing primers and sequence adaptors. Usingthe open-source software program mothur (v 1.31.2), the paired-endreads were assembled and contigs of incorrect length (�285 bp or�300 bp) and/or contigs containing ambiguous bases were removed (31,32). These modified sequences were aligned to the SILVA reference data-base, and any potential chimeric sequences were detected and removedusing the program UCHIME (33). The remaining sequences were taxo-nomically classified, using a naive Bayesian classifier (34) and the mothur-formatted RDP training set v9, and clustered into operational taxonomicunits (OTUs), an operational definition of a species-level cluster based onsequence similarity, using a 97% cutoff. The software program METAGE-Nassist was used to link OTU nomenclature to taxonomic assignments(35).
All samples were processed in duplicate, and the percent reads of thereplicates were averaged for downstream analysis. Stacked bar plots basedon sequence abundance were produced for each sample. Euclidean dis-tance was calculated between samples, and the complete method was usedfor hierarchical clustering via R software, version 2.15.1 (36). Richnessand diversity metrics, including the number of observed OTUs, Chao1estimator, Shannon index, and inverse Simpson’s index, were calculatedusing mothur and were based on subsampling to the number of sequencesin the sample with the least coverage. Urine is a low-biomass environ-ment, and thus the sequencing results are more likely to be influenced byextraneous DNA arising from reagents and resources; therefore, only
Pearce et al.
10 ® mbio.asm.org July/August 2014 Volume 5 Issue 4 e01283-14
on Septem
ber 8, 2018 by guesthttp://m
bio.asm.org/
Dow
nloaded from
reads representing �0.01% of the sample total were included in thestacked bar plots, dendrogram, and frequency and abundance analyses.
Statistical analysis. Statistical analyses, comparing participant demo-graphics and symptoms, were performed using the SPSS software pro-gram, version 19. For continuous variables, Student’s t tests were applied.For categorical variables, Pearson chi-square and Fisher’s exact tests wereperformed. Results were considered significant when the P value was lessthan 0.05.
Statistical analyses of the microbiome data were performed using theSAS software program, version 9.3. The Wilcoxon rank sum tests wereused to compare the median abundances for the 15 most abundant se-quenced taxa and all cultured genera between groups. The frequencies ofdetected genera were compared between groups, using either the Pearsonchi-square or Fisher’s exact test, depending on assumption validity. Noadjustments for multiple comparisons were made, since these analyseswere considered descriptive.
SUPPLEMENTAL MATERIALSupplemental material for this article may be found at http://mbio.asm.org/lookup/suppl/doi:10.1128/mBio.01283-14/-/DCSupplemental.
Figure S1, PDF file, 0.1 MB.Figure S2, PDF file, 0.1 MB.Table S1, DOCX file, 0.1 MB.Table S2, DOCX file, 0.1 MB.
ACKNOWLEDGMENTS
We thank Mary Tulke and Bozena Zemaitaitis for their assistance in re-cruitment of participants and sample collection and Kathleen McKinleyfor her clinical microbiology expertise. We acknowledge and thank theLoyola University Chicago Health Sciences Division’s Office of Informat-ics and Systems Development for their expertise and for the computa-tional resources utilized in support of this research. The following reagentwas obtained through BEI Resources, NIAID, NIH, as part of the HumanMicrobiome Project: Genomic DNA from Microbial Mock Community A(Even, Low Concentration), HM-782D.
Loyola University Chicago Stritch School of Medicine’s research com-puting facility was developed through grant funds awarded by the Depart-ment of Health and Human Services, award number 1G20RR030939-01.This study was supported by a grant from the Falk Foundation (LU202567), by NIH grant R21DK097435-01A1, and by Astellas Medical andScientific Affairs and is registered at http://www.clinicaltrials.gov asNCT01642277.
REFERENCES1. Wolfe AJ, Toh E, Shibata N, Rong R, Kenton K, Fitzgerald M, Mueller
ER, Schreckenberger P, Dong Q, Nelson DE, Brubaker L. 2012. Evi-dence of uncultivated bacteria in the adult female bladder. J. Clin. Micro-biol. 50:1376 –1383. http://dx.doi.org/10.1128/JCM.05852-11.
2. Brubaker L, Nager CW, Richter HE, Visco A, Nygaard I, Barber MD,Schaffer J, Meikle S, Wallace D, Shibata N, Wolfe AJ. Urinary bacteriain adult women with urgency urinary incontinence. Int. Urogynecol. J., inpress.
3. Fouts DE, Pieper R, Szpakowski S, Pohl H, Knoblach S, Suh MJ, HuangST, Ljungberg I, Sprague BM, Lucas SK, Torralba M, Nelson KE, GroahSL. 2012. Integrated next-generation sequencing of 16S rDNA and meta-proteomics differentiate the healthy urine microbiome from asymptom-atic bacteriuria in neuropathic bladder associated with spinal cord injury.J. Transl. Med. 10:174. http://dx.doi.org/10.1186/1479-5876-10-174.
4. Hilt EE, McKinley K, Pearce MM, Rosenfeld AB, Zilliox MJ, MuellerER, Brubaker L, Gai X, Wolfe AJ, Schreckenberger PC. 2014. Urine isnot sterile: use of enhanced urine culture techniques to detect residentbacterial flora in the adult female bladder. J. Clin. Microbiol. 52:871– 876.http://dx.doi.org/10.1128/JCM.02876-13.
5. Khasriya R, Sathiananthamoorthy S, Ismail S, Kelsey M, Wilson M,Rohn JL, Malone-Lee J. 2013. Spectrum of bacterial colonization associ-ated with urothelial cells from patients with chronic lower urinary tractsymptoms. J. Clin. Microbiol. 51:2054 –2062. http://dx.doi.org/10.1128/JCM.03314-12.
6. Riesenfeld CS, Schloss PD, Handelsman J. 2004. Metagenomics:genomic analysis of microbial communities. Annu. Rev. Genet. 38:525–552. http://dx.doi.org/10.1146/annurev.genet.38.072902.091216.
7. Nitti VW, Kopp Z, Lin AT, Moore KH, Oefelein M, Mills IW. 2010. Canwe predict which patient will fail drug treatment for overactive bladder? Athink tank discussion. Neurourol. Urodyn. 29:652– 657. http://dx.doi.org/10.1002/nau.20910.
8. Hartmann KE, McPheeters ML, Biller DH, Ward RM, McKoy JN,Jerome RN, Micucci SR, Meints L, Fisher JA, Scott TA, Slaughter JC,Blume JD. August 2009. Treatment of overactive bladder in women.Evidence report/technological assessment no. 187. (Prepared by the Van-derbilt Evidence-based Practice Center under Contract No. 290-2007-10065-I.) AHRQ publication no. 09-E017. Agency for Healthcare Re-search and Quality, Rockville, MD.
9. Haylen BT, de Ridder D, Freeman RM, Swift SE, Berghmans B, Lee J,Monga A, Petri E, Rizk DE, Sand PK, Schaer GN, International Uro-gynecological Association, International Continence Society. 2010. AnInternational Urogynecological Association (IUGA)/international Conti-nence Society (ICS) joint report on the terminology for female pelvic floordysfunction. Neurourol. Urodyn. 29:4 –20. http://dx.doi.org/10.1007/s00192-009-0976-9.
10. Coyne KS, Wein A, Nicholson S, Kvasz M, Chen CI, Milsom I. 2014.Economic burden of urgency urinary incontinence in the United States: asystematic review. J. Manag. Care Pharm. 20:130 –140.
11. Redondo-Lopez V, Cook RL, Sobel JD. 1990. Emerging role of lactoba-cilli in the control and maintenance of the vaginal bacterial microflora.Rev. Infect. Dis. 12:856 – 872. http://dx.doi.org/10.1093/clinids/12.5.856.
12. Kaewsrichan J, Peeyananjarassri K, Kongprasertkit J. 2006. Selectionand identification of anaerobic lactobacilli producing inhibitory com-pounds against vaginal pathogens. FEMS Immunol. Med. Microbiol. 48:75– 83. http://dx.doi.org/10.1111/j.1574-695X.2006.00124.x.
13. Hyman RW, Fukushima M, Diamond L, Kumm J, Giudice LC, DavisRW. 2005. Microbes on the human vaginal epithelium. Proc. Natl. Acad.Sci. U. S. A. 102:7952–7957. http://dx.doi.org/10.1073/pnas.0503236102.
14. Harwich MD, Jr, Alves JM, Buck GA, Strauss JF, III, Patterson JL, OkiAT, Girerd PH, Jefferson KK. 2010. Drawing the line between commen-sal and pathogenic Gardnerella vaginalis through genome analysis andvirulence studies. BMC Genomics 11:375. http://dx.doi.org/10.1186/1471-2164-11-375.
15. Zimmermann P, Berlinger L, Liniger B, Grunt S, Agyeman P, Ritz N.2012. Actinobaculum schaalii an emerging pediatric pathogen? BMC In-fect. Dis. 12:201. http://dx.doi.org/10.1186/1471-2334-12-201.
16. Bank S, Jensen A, Hansen TM, Søby KM, Prag J. 2010. Actinobaculumschaalii, a common uropathogen in elderly patients, Denmark. Emerg.Infect. Dis. 16:76 – 80. http://dx.doi.org/10.3201/eid1601.090761.
17. Rasmussen M. 2013. Aerococci and aerococcal infections. J. Infect. 66:467– 474. http://dx.doi.org/10.1016/j.jinf.2012.12.006.
18. Dabkowski J, Dodds P, Hughes K, Bush M. 2013. A persistent, symp-tomatic urinary tract infection with multiple “negative” urine cultures.Conn. Med. 77:27–29.
19. Funke G, Pagano-Niederer M, Sjödén B, Falsen E. 1998. Characteristicsof Arthrobacter cumminsii, the most frequently encountered Arthrobac-ter species in human clinical specimens. J. Clin. Microbiol. 36:1539 –1543.
20. Ravel J, Gajer P, Abdo Z, Schneider GM, Koenig SS, McCulle SL,Karlebach S, Gorle R, Russell J, Tacket CO, Brotman RM, Davis CC,Ault K, Peralta L, Forney LJ. 2011. Vaginal microbiome of reproductive-age women. Proc. Natl. Acad. Sci. U. S. A. 108:4680 – 4687. http://dx.doi.org/10.1073/pnas.1002611107.
21. O’Hara AM, Shanahan F. 2006. The gut flora as a forgotten organ. EMBORep. 7:688 – 693. http://dx.doi.org/10.1038/sj.embor.7400731.
22. Microbiome Human Project. 2012. Structure, function and diversity ofthe healthy human microbiome. Nature 486:207–214. http://dx.doi.org/10.1038/nature11234.
23. Grice EA, Kong HH, Conlan S, Deming CB, Davis J, Young AC,Bouffard GG, Blakesley RW, Murray PR, Green ED, Turner ML, SegreJA. 2009. Topographical and temporal diversity of the human skin micro-biome. Science 324:1190 –1192. http://dx.doi .org/10.1126/science.1171700.
24. Dong Q, Brulc JM, Iovieno A, Bates B, Garoutte A, Miller D, RevannaKV, Gao X, Antonopoulos DA, Slepak VZ, Shestopalov VI. 2011.Diversity of bacteria at healthy human conjunctiva. Invest. Ophthalmol.Vis. Sci. 52:5408 –5413. http://dx.doi.org/10.1167/iovs.10-6939.
25. Chang JY, Antonopoulos DA, Kalra A, Tonelli A, Khalife WT, Schmidt
Female Urinary Microbiome in UUI
July/August 2014 Volume 5 Issue 4 e01283-14 ® mbio.asm.org 11
on Septem
ber 8, 2018 by guesthttp://m
bio.asm.org/
Dow
nloaded from
TM, Young VB. 2008. Decreased diversity of the fecal microbiome inrecurrent Clostridium difficile-associated diarrhea. J. Infect. Dis. 197:435– 438. http://dx.doi.org/10.1086/525047.
26. Liu MB, Xu SR, He Y, Deng GH, Sheng HF, Huang XM, Ouyang CY,Zhou HW. 2013. Diverse vaginal microbiomes in reproductive-agewomen with vulvovaginal candidiasis. PLoS One 8:e79812. http://dx.doi.org/10.1371/journal.pone.0079812.
27. Barber MD, Kuchibhatla MN, Pieper CF, Bump RC. 2001. Psychomet-ric evaluation of 2 comprehensive condition-specific quality of life instru-ments for women with pelvic floor disorders. Am. J. Obstet. Gynecol.185:1388 –1395. http://dx.doi.org/10.1067/mob.2001.118659.
28. Uebersax JS, Wyman JF, Shumaker SA, McClish DK, Fantl JA. 1995.Short forms to assess life quality and symptom distress for urinary incon-tinence in women: the Incontinence Impact Questionnaire and the uro-genital Distress Inventory. Continence Programs Women ResearchGroup. Neurourol. Urodyn. 14:131–139.
29. Coyne K, Revicki D, Hunt T, Corey R, Stewart W, Bentkover J, KurthH, Abrams P. 2002. Psychometric validation of an overactive bladdersymptom and health-related quality of life questionnaire: the OAB-q.Qual. Life Res. 11:563–574. http://dx.doi.org/10.1023/A:1016370925601.
30. Yuan S, Cohen DB, Ravel J, Abdo Z, Forney LJ. 2012. Evaluation ofmethods for the extraction and purification of DNA from the humanmicrobiome. PLoS One 7:e33865. http://dx.doi.org/10.1371/journal.pone.0033865.
31. Schloss PD, Westcott SL, Ryabin T, Hall JR, Hartmann M, Hollister EB,Lesniewski RA, Oakley BB, Parks DH, Robinson CJ, Sahl JW, Stres B,Thallinger GG, Van Horn DJ, Weber CF. 2009. Introducing mothur:open-source, platform-independent, community-supported software fordescribing and comparing microbial communities. Appl. Environ. Micro-biol. 75:7537–7541. http://dx.doi.org/10.1128/AEM.01541-09.
32. Kozich JJ, Westcott SL, Baxter NT, Highlander SK, Schloss PD. 2013.Development of a dual-index sequencing strategy and curation pipelinefor analyzing amplicon sequence data on the MiSeq Illumina sequencingplatform. Appl. Environ. Microbiol. 79:5112–5120. http://dx.doi.org/10.1128/AEM.01043-13.
33. Edgar RC, Haas BJ, Clemente JC, Quince C, Knight R. 2011. UCHIMEimproves sensitivity and speed of chimera detection. Bioinformatics 27:2194 –2200. http://dx.doi.org/10.1093/bioinformatics/btr381.
34. Wang Q, Garrity GM, Tiedje JM, Cole JR. 2007. Naive Bayesian classifierfor rapid assignment of rRNA sequences into the new bacterial taxonomy.Appl. Environ. Microbiol. 73:5261–5267. http://dx.doi.org/10.1128/AEM.00062-07.
35. Arndt D, Xia J, Liu Y, Zhou Y, Guo AC, Cruz JA, Sinelnikov I, BudwillK, Nesbø CL, Wishart DS. 2012. METAGENassist: a comprehensive webserver for comparative metagenomics. Nucleic Acids Res. 40:W88 –W95.http://dx.doi.org/10.1093/nar/gkr734.
36. R Development Core Team. 2014. R: a language and environment forstatistical computing. R Foundation for Statistical Computing.
Pearce et al.
12 ® mbio.asm.org July/August 2014 Volume 5 Issue 4 e01283-14
on Septem
ber 8, 2018 by guesthttp://m
bio.asm.org/
Dow
nloaded from