Embed Size (px)
Citation preview
HYDROLOGICAL PROCESSESHydrol. Process. (2011)Published online in Wiley Online Library(wileyonlinelibrary.com) DOI: 10.1002/hyp.8390
The Fill–Spill Hydrology of Prairie Wetland Complexes duringDrought and Deluge
Dean A. Shaw,1* Garth Vanderkamp,2 F. Malcolm Conly,2 Al Pietroniro2 and Lawrence Martz31 School of Environment and Sustainability, University of Saskatchewan, Room 323, Kirk Hall 117 Science Place, Saskatoon, Saskatchewan, Canada,
S7N 5C82 Environment Canada–National Hydrology Research Centre, Saskatoon, Saskatchewan, Canada3 College of Graduate Studies, University of Saskatchewan, Saskatoon, Saskatchewan, Canada
*CSusScisha
Co
Abstract:
The fill–spill of surface depressions (wetlands) results in intermittent surface water connectivity between wetlands in the prairiewetland region of North America. Dynamic connectivity between wetlands results in dynamic contributing areas for runoff.However, the effect of fill–spill and the resultant variable or dynamic basin contributing area has largely been disregarded in thehydrological community.Long-term field observations recorded at the St. Denis National Wildlife Area, Saskatchewan, allow fill–spill in the basin to be
identified and quantified. Along with historical water-level observations dating back to 1968, recent data collected for the basininclude snow surveys, surface water survey and production of a light detection and ranging–derived digital elevation model. Datacollection for the basin includes both wet and dry antecedent basin conditions during spring runoff events.A surface water survey at St. Denis in 2006 reveals a disconnected channel network during the spring freshet runoff event.
Rather than 100% of the basin contributing runoff to the outlet, which most hydrological models assume, only approximately39% of the basin contributes to the outlet. Anthropogenic features, such as culverts and roads, were found to influence the extentand spatial distribution of contributing areas in the basin. Historical pond depth records illustrate the effect of antecedent basinconditions on fill–spill and basin contributing area. A large pond at the outlet of the St. Denis basin, which only receives localrunoff during dry years when upstream surface storage has not been satisfied, has pond runoff volumes that increase by a factorof 20 or more during wet years when upstream antecedent basin surface storage is satisfied and basin-wide runoff contributes tothe pond. Copyright © 2011 John Wiley & Sons, Ltd.
KEY WORDS prairie wetland; digital terrain analysis; contributing area; fill–spill
Received 18 January 2011; Accepted 12 October 2011
INTRODUCTION
Threshold storage events can be defined as runoff events inwhich all potential surface storage (threshold storage) in abasin is satisfied, and 100% of the basin can contributerunoff to the basin outlet. Current hydrological practiceoften uses automated methods such as landscape analysistools that calculate the threshold storage volume that isrequired to be satisfied in order for 100% of the basin tocontribute runoff to the outlet. However, runoff events inthe prairie wetland region of North America rarely satisfythe threshold surface storage volume for the entire basin.These subthreshold storage runoff events, which do notcontribute 100% of basin area to the outlet, can have areasof the basin that are connected by surface water but do notultimately connect to the basin outlet. Surface waterconnectivity between areas in the basin arises when thevolume of surface storage available in an individualdepression in the landscape (wetland) is satisfied, allowingfurther runoff to cascade to an adjacent wetland (Stichling
orrespondence to: Dean A. Shaw, School of Environment andtainability, University of Saskatchewan, Room 323, Kirk Hall 117ence Place, Saskatoon, Saskatchewan, Canada S7N 5C8. E-mail: [email protected]
pyright © 2011 John Wiley & Sons, Ltd.
and Blackwell, 1957; Rosenberry and Winter, 1997). Thefill–spill of prairie wetlands can result in intermittentsurface water connections during runoff events as wetlandsconnect due to spilling and disconnect when wetlands nolonger spill (Leibowitz and Vining, 2003).Depending on the topography, topology and antecedent
conditions of the basin, connected areas may ultimatelyconnect to the outlet or may not. As a result, basincontributing area and the resulting runoff volume at theoutlet are dynamic. The issue of variable or dynamiccontributing area in the prairie wetland region has largelybeen disregarded in the hydrological community. Forexample, Gray et al. (1984) presented a model forsynthesising streamflow in prairie wetland basins anddiscussed the performance of the model with only cursorymention of the topography, and the effect depressionalstorage will have on the resulting hydrographs. Euliss et al.(2004) proposed a conceptualisation of the horizontalmovement of water in the prairie wetland region as entirelygroundwater driven. Although this may be reasonable insome wetland complexes, other research in the prairiewetland region contradicts the importance of groundwateras a mechanism for lateral movement of water in the basin(van der Kamp and Hayashi, 2009). Other studies haveacknowledged surface water connectivity between
D. A. SHAW ET AL.
depressions (wetlands) in the region but have notpresented a methodology for capturing and simulatingthe effect of fill and spill and the resulting connectivitybetween wetlands (Rosenberry and Winter, 1997;Leibowitz and Vining, 2003).Leibowitz and Vining (2003) estimated that 28% of
wetlands in a North Dakota field site were connected, orwere at least temporarily connected, by surface runoff.Although a great deal of work has been completed on theoverland hydrological processes of individual prairiewetlands (Woo and Rowsell 1993; Su et al., 2000; van derKamp et al., 2003), very little work has examined how andwhen these wetlands connect to downstream wetlands.Anecdotal evidence of prairie wetlands spilling exists inother studies (Stichling and Blackwell, 1957; Rosenberryand Winter, 1997). Understanding the spatial and temporalconnectivity of prairie wetlands plays a large part indetermining the extent of contributing area in the river basin.Several studies examine how wetland patterns and size
influence surface runoff between wetlands (Dillon et al.,1991; Waddington et al., 1993). These studies found arelationship between wetlands area and the amount ofsurface water connectivity between wetlands. However,these studies were carried out in humid areas of high relief.Other research that highlights the importance of theconnectedness in the prairie wetland region includes thework of Spence (2007), which incorporates connectednessinto a geophysically based framework for convertingcatchment storage to runoff.The concepts of fill–spill and connectedness are found
in other similar hydrological research, such as modelledoutflow from a hillslope (Lehman et al., 2007), whichproposed to model the nonlinear relationship between raininput and hillslope outflow using percolation theory.When rainfall exceeded a threshold, underlying elements(macropores) became connected and resulted in waterflowing from the base of the hillslope. Tromp-vanMeerveld and McDonnell (2006a, 2006b) proposed theconcept of fill–spill for subsurface storm-flow. Theynoted that when a rainfall event exceeded 55 mm, onlythen will bedrock depressions fill and water spill overmicrotopographic relief in the bedrock surface, allowingsubsurface areas to connect to the trench face. Spence andWoo (2003) proposed the concept of ‘fill–spill’ in asubarctic basin where storage has to be satisfied beforesurface runoff could be observed. A fill–spill runoffsystem is proposed in which the valley physiographyresults in a series of units with varying surface storagevolume available. As water is contributed from thehillslopes to the valley, each unit has to be filled until itsstorage threshold for runoff is exceeded. Subsurface orsurface flows will then be generated. However, theseflows may be used to satisfy the storage requirements ofthe units downstream.There has been a considerable research effort examining
whether the practice of draining wetlands for agriculturalpurposes has exacerbated floods in North Dakota(Padmanabhan and Bengtson, 1999; Simonovic andJuliano, 2001; Vining, 2002). The results of these studies
Copyright © 2011 John Wiley & Sons, Ltd.
show that prairie wetlands do affect the flood hydrograph forhigh-frequency events. High-frequency, low runoff volumeevents (subthreshold runoff events) can be completely orpartially attenuated through impoundment by landscapedepressions. The size of the runoff event and the antecedentconditions at the start of the event will determine wherestorage is overwhelmed and how much runoff iscontributing to the basin outlet. During high-frequencyevents with little or no surface storage satisfied, storageattenuates most or all of the runoff in the basin. As a result,the prairie wetlands have a significant effect on basindischarge. The water balance will therefore reflect a changein storage with very little of the input precipitationproducing runoff.However, prairie potholes have very little effect on the
severity of the flood during low-frequency events(Padmanabhan and Bengtson, 1999; Vining, 2002).During these low-frequency, large runoff events, it wouldseem that there is a threshold for impounding runoff thatwhen exceeded causes the contributing areas of the basinto dramatically increase. During low-frequency runoffevents, once threshold storage requirements are met,pothole connectivity is established throughout the basin,and the entire basin contributes to the outlet. In this case,the hydrograph will reflect the initial lag where storage isbeing filled, but after the storage requirements are met, theentire basin will contribute flow and the rising limb of thehydrograph will rise sharply. Low-frequency events willbe characterised by runoff conditions that fill storagequickly by efficiently moving runoff to the potholes.These studies, however, do not include antecedent basin
conditions in their theory. The importance of antecedentbasin conditions in the prairie wetland region with regardto the ability of prairie wetlands to impound and releasewater downstream, through wetland connections, has beenof interest in recent years because of the Red River flood in1997 and the subsequent wet climatological cycle that isoccurring in North Dakota. Although it is intuitive thathigh-frequency runoff events will result in very little areacontributing to the outlet because of surface storage in thebasin, what must be taken into account is the state of thebasin surface storage. Successive wet years may result inmuch of the subsurface and surface storage being filledbefore the runoff event. Antecedent basin conditions suchas these may result in high-frequency precipitation eventsproducing water volumes at the outlet similar to those oflow-frequency, high-volume runoff events.Long-term detailed observations on pond depth level and
other hydrologically relevant data recorded at St. DenisNational Wildlife Area (SDNWA) in Saskatchewan,Canada offer an opportunity to examine the surfacehydrology and fill–spill events of a prairie wetland basinin response to the drought and deluge from 2000 to 2007,and under a variety of antecedent conditions. This articledescribes the fill–spill hydrology of a 10-km2 prairiecatchment with numerous wetlands and depressions,including a portion of the SDNWA. Light detection andranging (LIDAR) topographic data combined with climatedata and 40 years of pond depth data allow for a detailed
Hydrol. Process. (2011)DOI: 10.1002/hyp
THE FILL–SPILL HYDROLOGY OF PRAIRIE WETLAND COMPLEXES
quantitative description of fill–spill processes and forevaluation of conceptual models of fill–spill.
METHODS
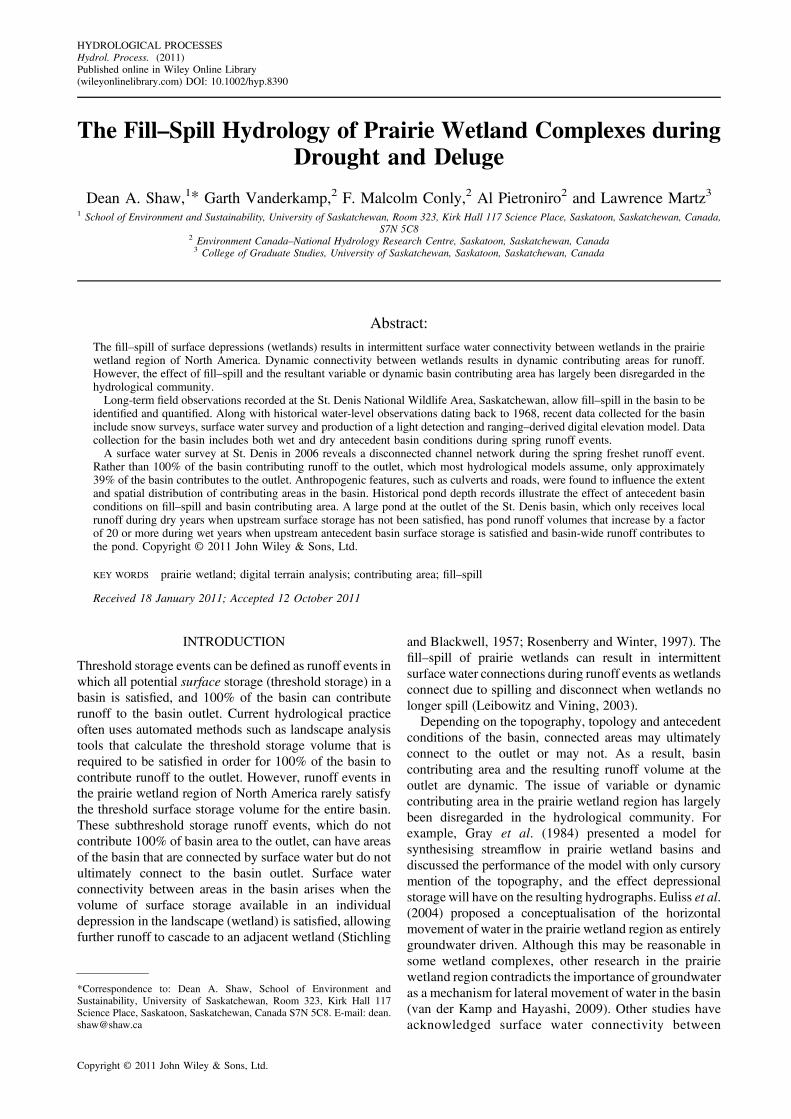
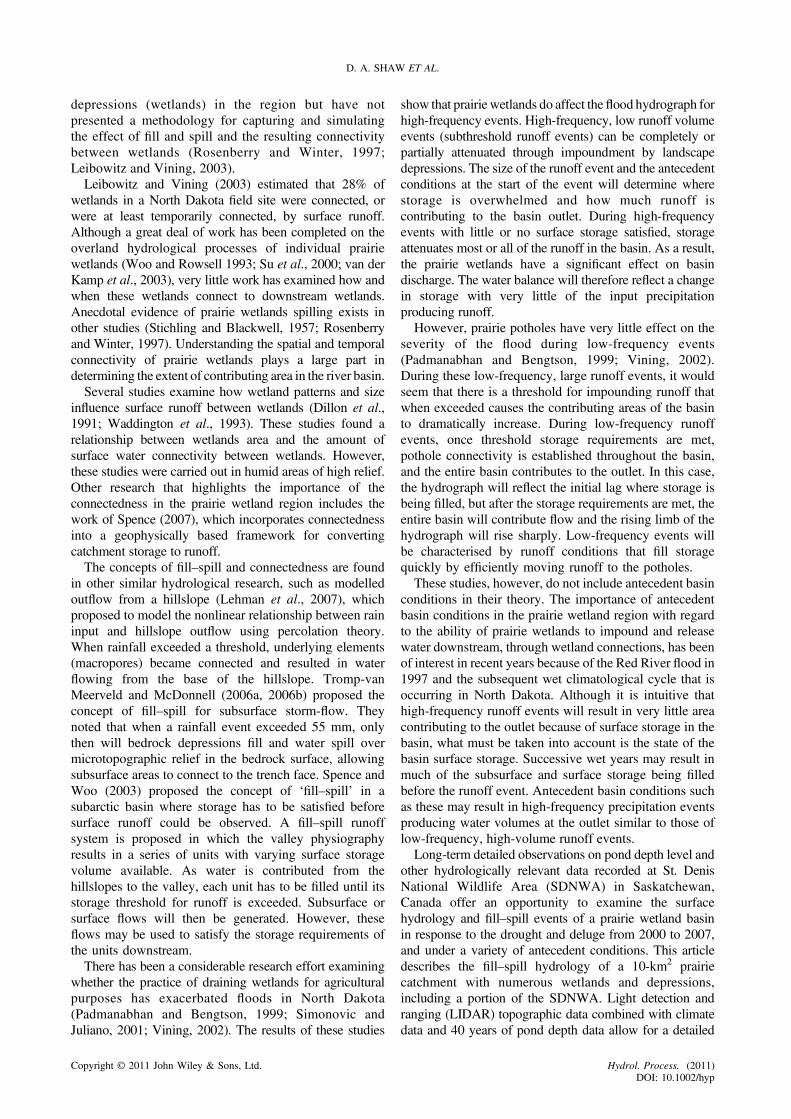
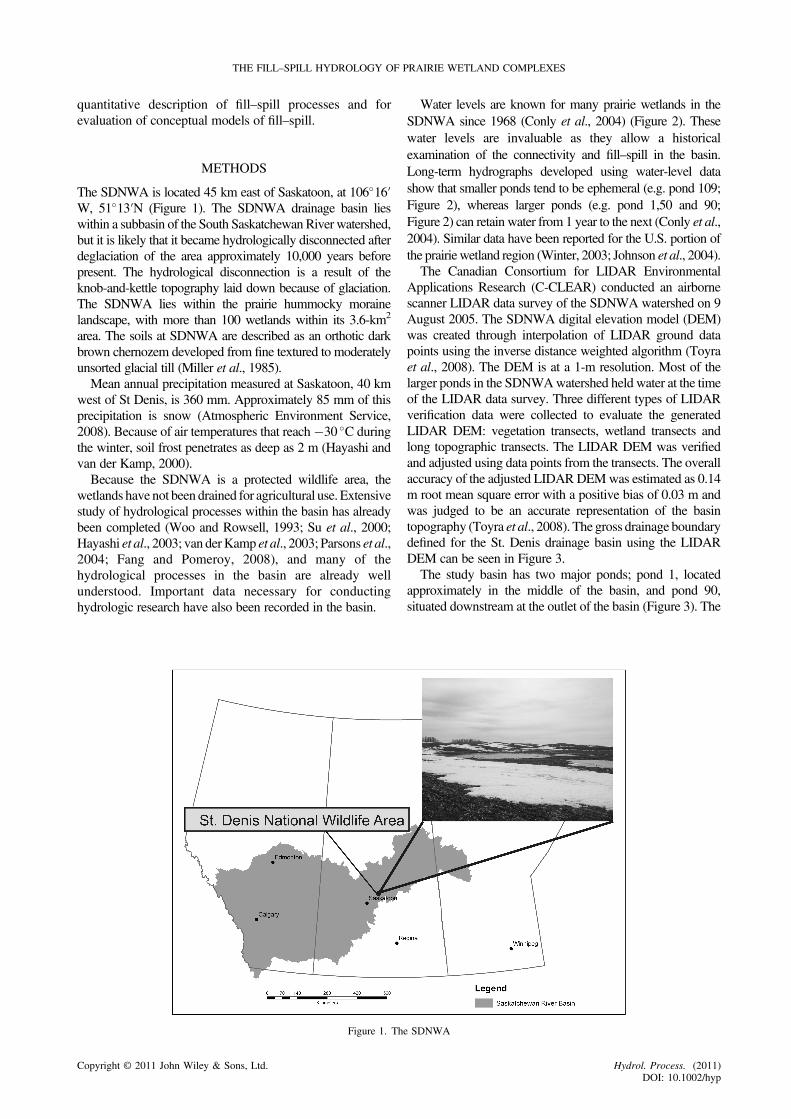
The SDNWA is located 45 km east of Saskatoon, at 106�16′W, 51�13′N (Figure 1). The SDNWA drainage basin lieswithin a subbasin of the South SaskatchewanRiver watershed,but it is likely that it became hydrologically disconnected afterdeglaciation of the area approximately 10,000 years beforepresent. The hydrological disconnection is a result of theknob-and-kettle topography laid down because of glaciation.The SDNWA lies within the prairie hummocky morainelandscape, with more than 100 wetlands within its 3.6-km2
area. The soils at SDNWA are described as an orthotic darkbrown chernozem developed from fine textured to moderatelyunsorted glacial till (Miller et al., 1985).Mean annual precipitation measured at Saskatoon, 40 km
west of St Denis, is 360 mm. Approximately 85 mm of thisprecipitation is snow (Atmospheric Environment Service,2008). Because of air temperatures that reach�30 �C duringthe winter, soil frost penetrates as deep as 2 m (Hayashi andvan der Kamp, 2000).Because the SDNWA is a protected wildlife area, the
wetlands have not been drained for agricultural use. Extensivestudy of hydrological processes within the basin has alreadybeen completed (Woo and Rowsell, 1993; Su et al., 2000;Hayashi et al., 2003; van derKamp et al., 2003; Parsons et al.,2004; Fang and Pomeroy, 2008), and many of thehydrological processes in the basin are already wellunderstood. Important data necessary for conductinghydrologic research have also been recorded in the basin.
Figure 1. Th
Copyright © 2011 John Wiley & Sons, Ltd.
Water levels are known for many prairie wetlands in theSDNWA since 1968 (Conly et al., 2004) (Figure 2). Thesewater levels are invaluable as they allow a historicalexamination of the connectivity and fill–spill in the basin.Long-term hydrographs developed using water-level datashow that smaller ponds tend to be ephemeral (e.g. pond 109;Figure 2), whereas larger ponds (e.g. pond 1,50 and 90;Figure 2) can retain water from 1 year to the next (Conly et al.,2004). Similar data have been reported for the U.S. portion ofthe prairie wetland region (Winter, 2003; Johnson et al., 2004).The Canadian Consortium for LIDAR Environmental
Applications Research (C-CLEAR) conducted an airbornescanner LIDAR data survey of the SDNWA watershed on 9August 2005. The SDNWA digital elevation model (DEM)was created through interpolation of LIDAR ground datapoints using the inverse distance weighted algorithm (Toyraet al., 2008). The DEM is at a 1-m resolution. Most of thelarger ponds in the SDNWAwatershed held water at the timeof the LIDAR data survey. Three different types of LIDARverification data were collected to evaluate the generatedLIDAR DEM: vegetation transects, wetland transects andlong topographic transects. The LIDAR DEM was verifiedand adjusted using data points from the transects. The overallaccuracy of the adjusted LIDARDEMwas estimated as 0.14m root mean square error with a positive bias of 0.03 m andwas judged to be an accurate representation of the basintopography (Toyra et al., 2008). The gross drainage boundarydefined for the St. Denis drainage basin using the LIDARDEM can be seen in Figure 3.The study basin has two major ponds; pond 1, located
approximately in the middle of the basin, and pond 90,situated downstream at the outlet of the basin (Figure 3). The
e SDNWA
Hydrol. Process. (2011)DOI: 10.1002/hyp
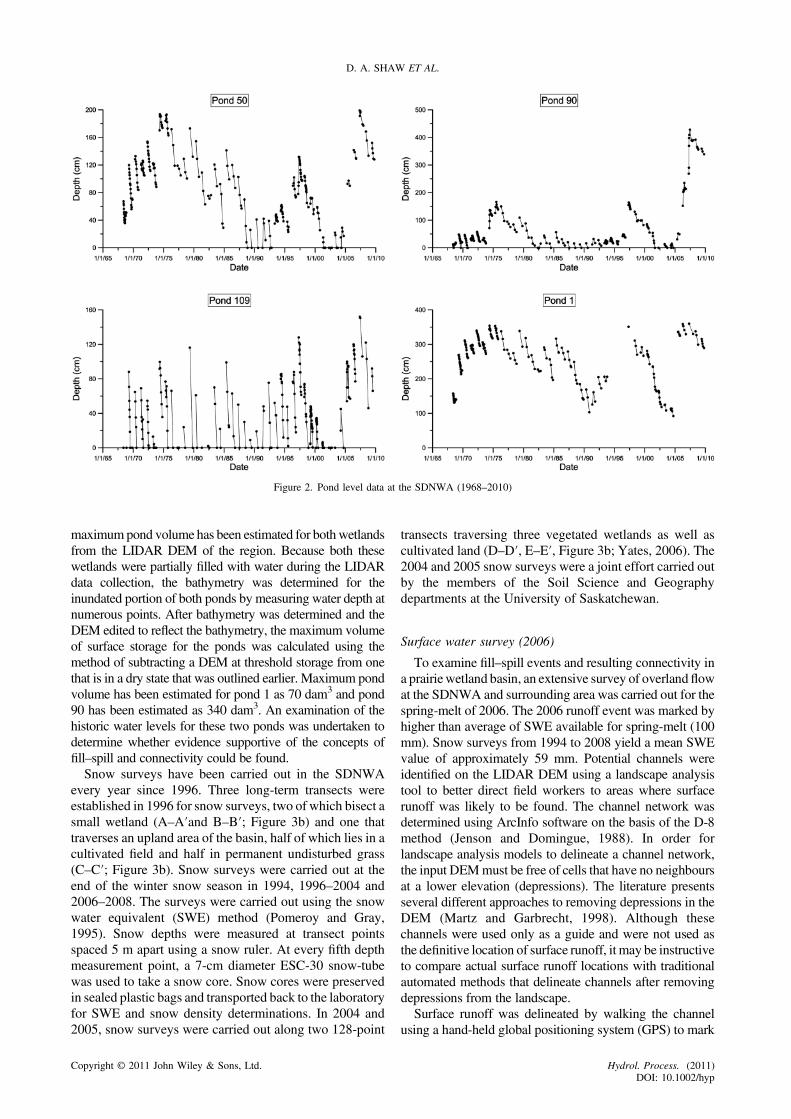
Figure 2. Pond level data at the SDNWA (1968–2010)
D. A. SHAW ET AL.
maximumpond volume has been estimated for bothwetlandsfrom the LIDAR DEM of the region. Because both thesewetlands were partially filled with water during the LIDARdata collection, the bathymetry was determined for theinundated portion of both ponds by measuring water depth atnumerous points. After bathymetry was determined and theDEM edited to reflect the bathymetry, the maximum volumeof surface storage for the ponds was calculated using themethod of subtracting a DEM at threshold storage from onethat is in a dry state that was outlined earlier. Maximum pondvolume has been estimated for pond 1 as 70 dam3 and pond90 has been estimated as 340 dam3. An examination of thehistoric water levels for these two ponds was undertaken todetermine whether evidence supportive of the concepts offill–spill and connectivity could be found.Snow surveys have been carried out in the SDNWA
every year since 1996. Three long-term transects wereestablished in 1996 for snow surveys, two of which bisect asmall wetland (A–A′and B–B′; Figure 3b) and one thattraverses an upland area of the basin, half of which lies in acultivated field and half in permanent undisturbed grass(C–C′; Figure 3b). Snow surveys were carried out at theend of the winter snow season in 1994, 1996–2004 and2006–2008. The surveys were carried out using the snowwater equivalent (SWE) method (Pomeroy and Gray,1995). Snow depths were measured at transect pointsspaced 5 m apart using a snow ruler. At every fifth depthmeasurement point, a 7-cm diameter ESC-30 snow-tubewas used to take a snow core. Snow cores were preservedin sealed plastic bags and transported back to the laboratoryfor SWE and snow density determinations. In 2004 and2005, snow surveys were carried out along two 128-point
Copyright © 2011 John Wiley & Sons, Ltd.
transects traversing three vegetated wetlands as well ascultivated land (D–D′, E–E′, Figure 3b; Yates, 2006). The2004 and 2005 snow surveys were a joint effort carried outby the members of the Soil Science and Geographydepartments at the University of Saskatchewan.
Surface water survey (2006)
To examine fill–spill events and resulting connectivity ina prairiewetland basin, an extensive survey of overlandflowat the SDNWA and surrounding area was carried out for thespring-melt of 2006. The 2006 runoff event was marked byhigher than average of SWE available for spring-melt (100mm). Snow surveys from 1994 to 2008 yield a mean SWEvalue of approximately 59 mm. Potential channels wereidentified on the LIDAR DEM using a landscape analysistool to better direct field workers to areas where surfacerunoff was likely to be found. The channel network wasdetermined using ArcInfo software on the basis of the D-8method (Jenson and Domingue, 1988). In order forlandscape analysis models to delineate a channel network,the input DEMmust be free of cells that have no neighboursat a lower elevation (depressions). The literature presentsseveral different approaches to removing depressions in theDEM (Martz and Garbrecht, 1998). Although thesechannels were used only as a guide and were not used asthe definitive location of surface runoff, it may be instructiveto compare actual surface runoff locations with traditionalautomated methods that delineate channels after removingdepressions from the landscape.Surface runoff was delineated by walking the channel
using a hand-held global positioning system (GPS) to mark
Hydrol. Process. (2011)DOI: 10.1002/hyp
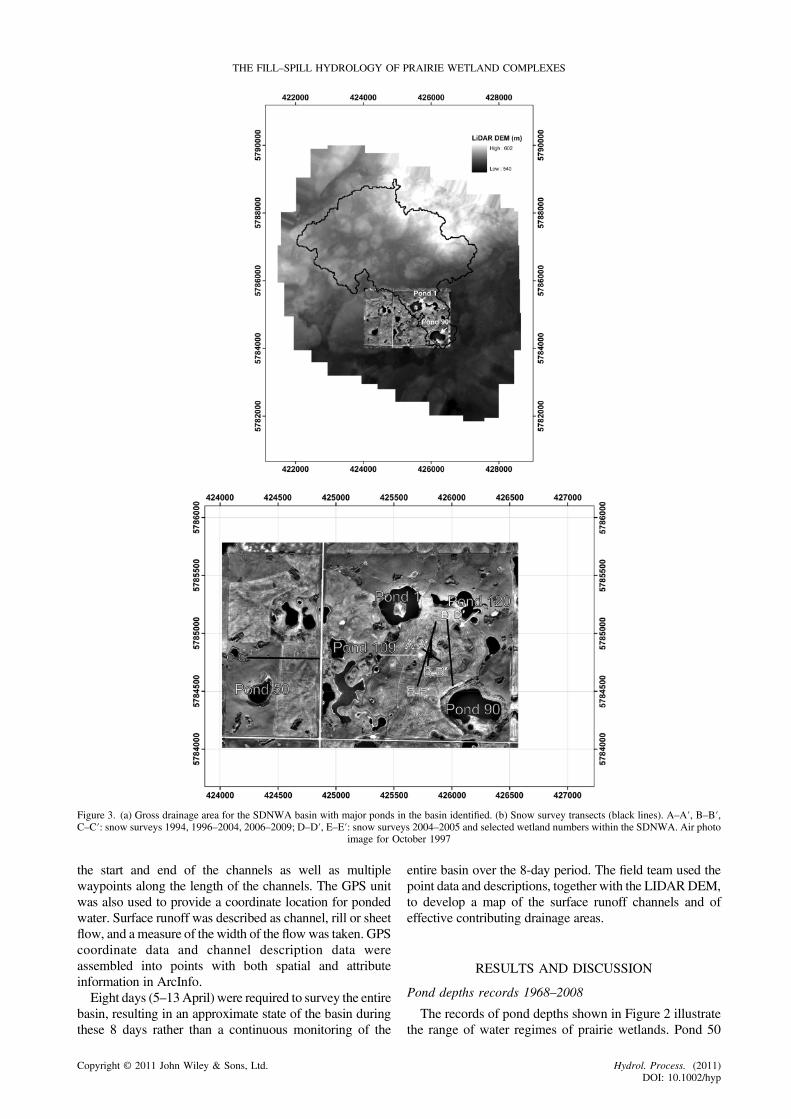
Figure 3. (a) Gross drainage area for the SDNWA basin with major ponds in the basin identified. (b) Snow survey transects (black lines). A–A′, B–B′,C–C′: snow surveys 1994, 1996–2004, 2006–2009; D–D′, E–E′: snow surveys 2004–2005 and selected wetland numbers within the SDNWA. Air photo
image for October 1997
THE FILL–SPILL HYDROLOGY OF PRAIRIE WETLAND COMPLEXES
the start and end of the channels as well as multiplewaypoints along the length of the channels. The GPS unitwas also used to provide a coordinate location for pondedwater. Surface runoff was described as channel, rill or sheetflow, and a measure of the width of the flowwas taken. GPScoordinate data and channel description data wereassembled into points with both spatial and attributeinformation in ArcInfo.Eight days (5–13April) were required to survey the entire
basin, resulting in an approximate state of the basin duringthese 8 days rather than a continuous monitoring of the
Copyright © 2011 John Wiley & Sons, Ltd.
entire basin over the 8-day period. The field team used thepoint data and descriptions, together with the LIDARDEM,to develop a map of the surface runoff channels and ofeffective contributing drainage areas.
RESULTS AND DISCUSSION
Pond depths records 1968–2008
The records of pond depths shown in Figure 2 illustratethe range of water regimes of prairie wetlands. Pond 50
Hydrol. Process. (2011)DOI: 10.1002/hyp
D. A. SHAW ET AL.
lies in a large isolated wetland (Figure 3b), which receiveslocal runoff from the surrounding catchment, whichcontains numerous small depressions that may fill andspill in wet years but no large depressions. Pond 50 hasnever spilled over the period of record, and probably for avery long time, because the depth at which it would spill(6.4 m) is far higher than any of the recorded levels. Thewater depth records for pond 50 reflect long-termvariations between dry and wet conditions. Pond 109 isa small wetland (Figure 3b), which receives runoff from ahummocky plateau with many smaller depressions someof which fill and spill in wet years. Pond 109 has notspilled during the period of record (spill depth is 2.08 m)and falls dry most years. Pond 1 is a large deep pond,which receives runoff from the upper regions of the StDenis catchment and in turn spills in many years (spilldepth is 3.26 m) towards pond 90 and the interveningponds. Pond 90, the main focus of this article, is a largeend-receiving pond with numerous large depressions inits catchment area as well as small upland catchments. Ithas spilled slightly only in the spring of 2007 (spill depthis 4.3 m). The dynamic nature of the catchment areacontributing to pond 90 is reflected in its water depthregime, which is typified by occasional large and abruptrises in years when it receives fill and spill runoff from theupstream ponds (1974, 1975, 1979, 1997, 2006, 2007,2008). The pond water depths decline during the summerof every year, thus increasing the surface water storagecapacity for the next year’s runoff. This regular annualdecline is the critical aspect of prairie hydrology, whichgoverns the existence of dynamic contributing areas.
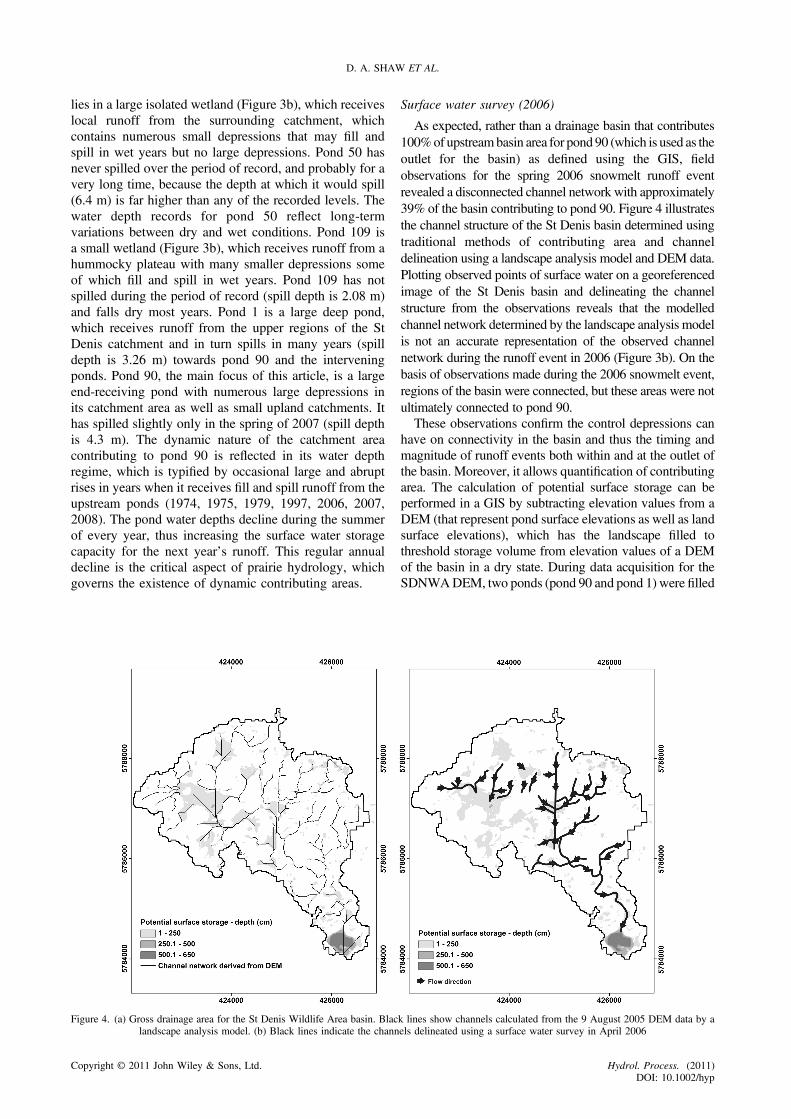
Figure 4. (a) Gross drainage area for the St Denis Wildlife Area basin. Blaclandscape analysis model. (b) Black lines indicate the chann
Copyright © 2011 John Wiley & Sons, Ltd.
Surface water survey (2006)
As expected, rather than a drainage basin that contributes100%of upstreambasin area for pond90 (which is used as theoutlet for the basin) as defined using the GIS, fieldobservations for the spring 2006 snowmelt runoff eventrevealed a disconnected channel network with approximately39% of the basin contributing to pond 90. Figure 4 illustratesthe channel structure of the St Denis basin determined usingtraditional methods of contributing area and channeldelineation using a landscape analysis model and DEM data.Plotting observed points of surface water on a georeferencedimage of the St Denis basin and delineating the channelstructure from the observations reveals that the modelledchannel network determined by the landscape analysis modelis not an accurate representation of the observed channelnetwork during the runoff event in 2006 (Figure 3b). On thebasis of observations made during the 2006 snowmelt event,regions of the basin were connected, but these areas were notultimately connected to pond 90.These observations confirm the control depressions can
have on connectivity in the basin and thus the timing andmagnitude of runoff events both within and at the outlet ofthe basin. Moreover, it allows quantification of contributingarea. The calculation of potential surface storage can beperformed in a GIS by subtracting elevation values from aDEM (that represent pond surface elevations as well as landsurface elevations), which has the landscape filled tothreshold storage volume from elevation values of a DEMof the basin in a dry state. During data acquisition for theSDNWADEM, two ponds (pond 90 and pond 1) were filled
k lines show channels calculated from the 9 August 2005 DEM data by aels delineated using a surface water survey in April 2006
Hydrol. Process. (2011)DOI: 10.1002/hyp
THE FILL–SPILL HYDROLOGY OF PRAIRIE WETLAND COMPLEXES
withwater. Bathymetry data were used to edit the DEMdatato reflect a dry condition for the two ponds. The DEM wasfurther conditioned by removing depressions that were lessthan 0.25 m. This was performed to remove many smalldepressions that were likely introduced during the DEMinterpolation process.DEM data reveal that the upper half of the SDNWAbasin
contains 48%of the total volume of surface storage availablein the basin. Because of the shape (shallow and wide) ofmany of the wetlands in this area, many of the wetlandsfilled and overflowed and connected overland todownstream wetlands allowing much of the upper basin tobe connected during the 2006 runoff event. However, therunoff event was not of a magnitude that allowedconnections to occur between the upper area of the basinand the middle of the basin. This was due to wetlands in themiddle of the basin being deeper and less likely to overflow.Thus, the upper basin is disconnected from the lower basinand therefore did not contribute to pond 90 in 2006.It is interesting to note that when subwatersheds
determined from the DEM data were used to help define
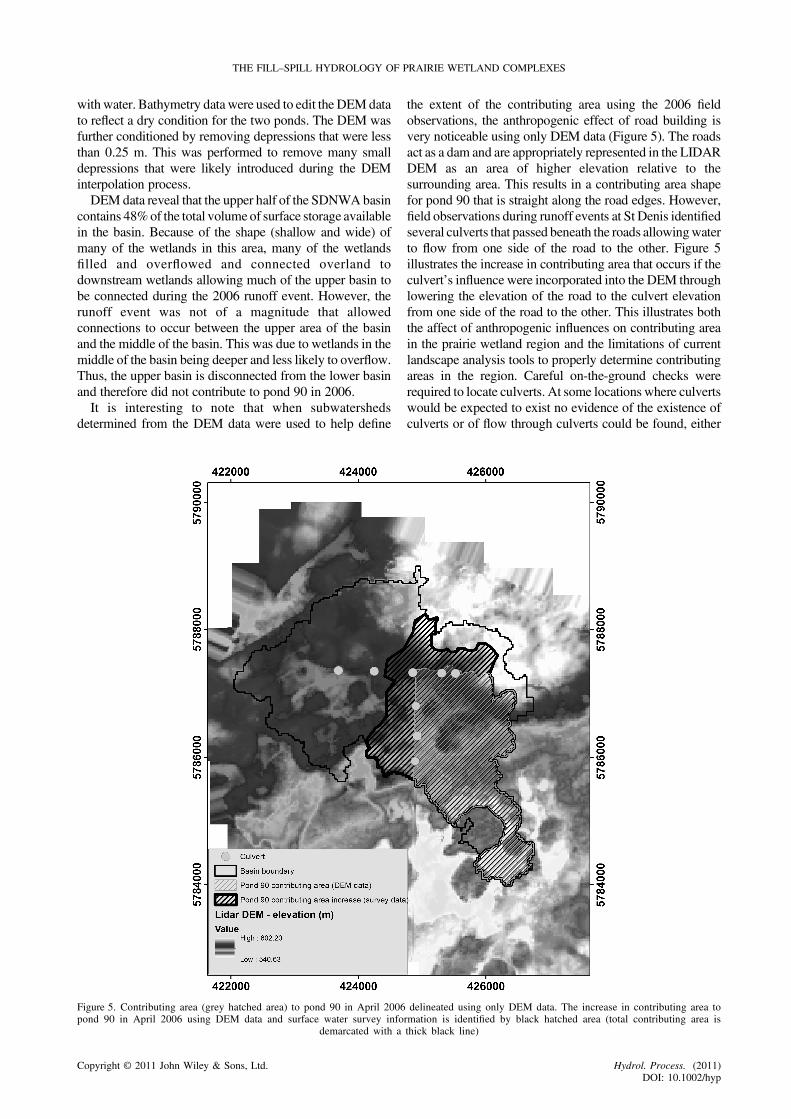
Figure 5. Contributing area (grey hatched area) to pond 90 in April 2006pond 90 in April 2006 using DEM data and surface water survey info
demarcated with a
Copyright © 2011 John Wiley & Sons, Ltd.
the extent of the contributing area using the 2006 fieldobservations, the anthropogenic effect of road building isvery noticeable using only DEM data (Figure 5). The roadsact as a dam and are appropriately represented in the LIDARDEM as an area of higher elevation relative to thesurrounding area. This results in a contributing area shapefor pond 90 that is straight along the road edges. However,field observations during runoff events at St Denis identifiedseveral culverts that passed beneath the roads allowingwaterto flow from one side of the road to the other. Figure 5illustrates the increase in contributing area that occurs if theculvert’s influence were incorporated into the DEM throughlowering the elevation of the road to the culvert elevationfrom one side of the road to the other. This illustrates boththe affect of anthropogenic influences on contributing areain the prairie wetland region and the limitations of currentlandscape analysis tools to properly determine contributingareas in the region. Careful on-the-ground checks wererequired to locate culverts. At some locations where culvertswould be expected to exist no evidence of the existence ofculverts or of flow through culverts could be found, either
delineated using only DEM data. The increase in contributing area tormation is identified by black hatched area (total contributing area isthick black line)
Hydrol. Process. (2011)DOI: 10.1002/hyp
D. A. SHAW ET AL.
because there were no culverts or because culverts hadbecome buried or blocked and therefore ineffective.It is also interesting to note in Figure 5 that the area
defined as contributing area for pond 90 during 2006 doesnot include part of a plateau area adjacent to pond 90. Indry years, such as 2006, only slopes facing pond 90supply local runoff. The plateau area adjacent to pond 90impounds most of the runoff in wetlands that do not spillin dry years (e.g. pond 109, Figure 2 and 3b).
Historical water-level data
The historical record of pond depth levels at theSDNWA offers an opportunity to examine the influencethat connected areas have on the response of the basin torunoff events. Increases in pond depth and the resultingincrease in pond volume in response to a runoff event canbe used to quantify runoff. Using a pond in the St DenisNWA as an outlet of a basin allows measurement of therunoff response to a spring-melt event during both droughtand deluge. This method was necessary as there are veryfew flow basins in the Canadian prairie wetland regionwithstreams or stream-gauges. Further, there are no areas of theprairie wetland region for which dynamic contributingareas have been mapped during dry and wet years.Water levels for pond 1 and pond 90 are shown in
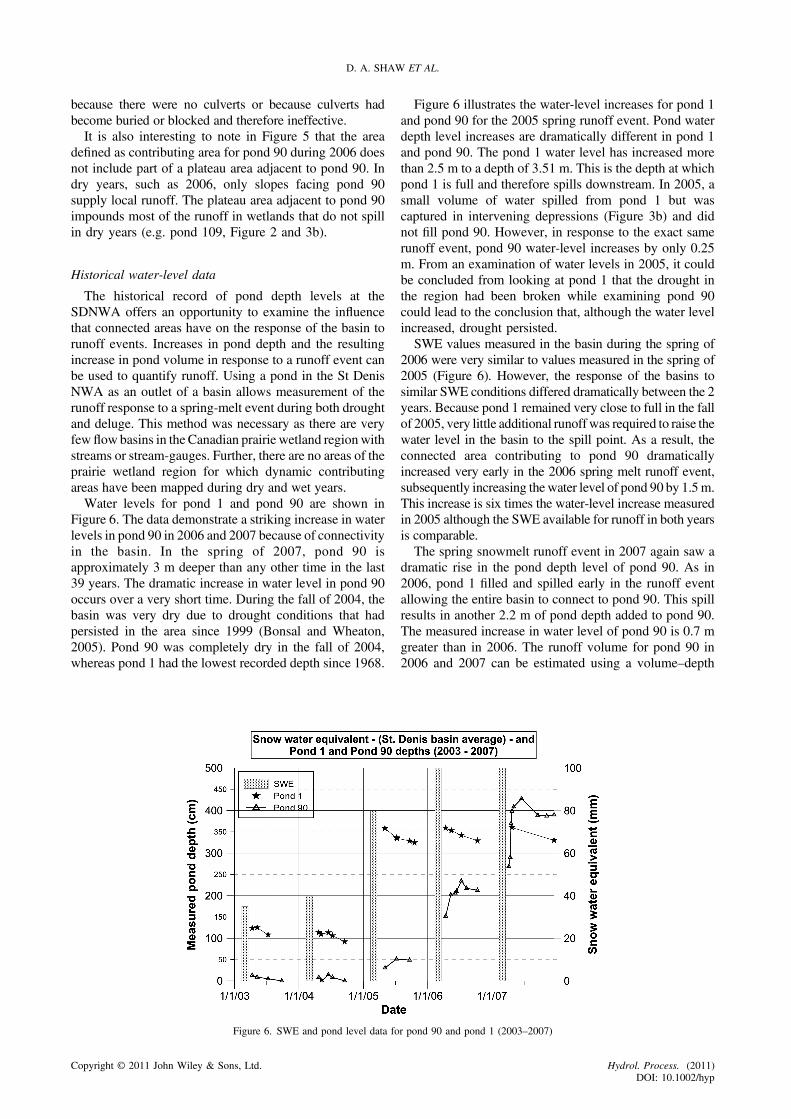
Figure 6. The data demonstrate a striking increase in waterlevels in pond 90 in 2006 and 2007 because of connectivityin the basin. In the spring of 2007, pond 90 isapproximately 3 m deeper than any other time in the last39 years. The dramatic increase in water level in pond 90occurs over a very short time. During the fall of 2004, thebasin was very dry due to drought conditions that hadpersisted in the area since 1999 (Bonsal and Wheaton,2005). Pond 90 was completely dry in the fall of 2004,whereas pond 1 had the lowest recorded depth since 1968.
Figure 6. SWE and pond level data fo
Copyright © 2011 John Wiley & Sons, Ltd.
Figure 6 illustrates the water-level increases for pond 1and pond 90 for the 2005 spring runoff event. Pond waterdepth level increases are dramatically different in pond 1and pond 90. The pond 1 water level has increased morethan 2.5 m to a depth of 3.51 m. This is the depth at whichpond 1 is full and therefore spills downstream. In 2005, asmall volume of water spilled from pond 1 but wascaptured in intervening depressions (Figure 3b) and didnot fill pond 90. However, in response to the exact samerunoff event, pond 90 water-level increases by only 0.25m. From an examination of water levels in 2005, it couldbe concluded from looking at pond 1 that the drought inthe region had been broken while examining pond 90could lead to the conclusion that, although the water levelincreased, drought persisted.SWE values measured in the basin during the spring of
2006 were very similar to values measured in the spring of2005 (Figure 6). However, the response of the basins tosimilar SWE conditions differed dramatically between the 2years. Because pond 1 remained very close to full in the fallof 2005, very little additional runoff was required to raise thewater level in the basin to the spill point. As a result, theconnected area contributing to pond 90 dramaticallyincreased very early in the 2006 spring melt runoff event,subsequently increasing the water level of pond 90 by 1.5m.This increase is six times the water-level increase measuredin 2005 although the SWE available for runoff in both yearsis comparable.The spring snowmelt runoff event in 2007 again saw a
dramatic rise in the pond depth level of pond 90. As in2006, pond 1 filled and spilled early in the runoff eventallowing the entire basin to connect to pond 90. This spillresults in another 2.2 m of pond depth added to pond 90.The measured increase in water level of pond 90 is 0.7 mgreater than in 2006. The runoff volume for pond 90 in2006 and 2007 can be estimated using a volume–depth
r pond 90 and pond 1 (2003–2007)
Hydrol. Process. (2011)DOI: 10.1002/hyp
THE FILL–SPILL HYDROLOGY OF PRAIRIE WETLAND COMPLEXES
relationship proposed by Hayashi and van der Kamp(2000). The volume–depth calculations yield a runoffvolume for 2006 estimated at 136 dam3 and a volume for2007 of 163 dam3.What the response of pond 90 illustrates is the
importance of connected areas in modelling the hydrologyof the prairie wetland region. The fill–spill of wetlandsinfluences the extent of connected area and can influencethe basin contributing area. The water-level data atSDNWA reveal that basin storage can be satisfied in sucha manner that minor runoff events can cause a tremendousincrease in basin contributing area.
SUMMARY AND CONCLUSIONS
Landscape tools currently can calculate threshold storagevolume.When this threshold storage volume is assumed to besatisfied, 100% of the basin can contribute runoff to the basinoutlet. However, for runoff events of magnitudes that do notreach threshold volume (subthreshold events), the calculationof contributing area is more complex. Subthreshold runoffevents will have dynamic contributing area because ofdynamic basin conditions, such as antecedent surface storage,that affect surface water connectivity between wetlands.Surface water connectivity, controlled by the fill–spill ofwetlands, determines the percentage of the basin that cancontribute to the outlet.Extensive data collection at the St Denis basin during
periods of drought and deluge allows fill–spill events to beidentified, and the effect of these events on contributingareas can be quantified under various antecedent basinconditions. Fill–spill events can lead to large, suddeninflows and changes of water levels in end receiving basins.These data illustrate the effect of fill–spill on prairiehydrology. Water resource managers in the prairie wetlandregion would benefit greatly from an algorithm thataccurately and reliably determines the state of basin storageand how close the basin is to being connected in a mannerthat dramatically increases basin contributing area.The data presented in the article illustrate that
anthropogenic influences such as roads are an importantconsideration for contributing area calculations in theprairie wetland region. The identification of this issuemay guide future research on contributing areas in theprairie wetland region.Although this research focussed on wetlands, the
research also is applicable for larger depressions that fillwith lakes. The fill–spill of lakes will be similar to what hasbeen observed in wetlands but with larger water volumes.Recent research examining long-term lake levels in theprairie wetland region (van der Kamp et al., 2008)illustrates the opportunity to scale up the researchpresented in this article.
ACKNOWLEDGEMENTS
Randy Schmidt of Environment Canada carried out thelong-term snow surveys since 1996. Snow surveys at the
Copyright © 2011 John Wiley & Sons, Ltd.
SDNWA in 2004 and 2005 were a joint effort carried outby the members of the Soil Science and Geographydepartments of the University of Saskatchewan. The 2006stream survey was coordinated by Carol Casey ofEnvironment Canada.
REFERENCES
Atmospheric Environment Service. 2008. Canadian daily climate data onCD-ROM, Western Canada, Environment Canada, Downsview,Ontario, Canada.
Bonsal BR, Wheaton EE. 2005. Atmospheric Circulation Comparisonsbetween the 2001 and 2002 and the 1961 and 1988 Canadian PrairieDroughts. Atmosphere-Ocean 43(2): 9.
ConlyMF,SuM, van derKampG,Miller JB. 2004.Note—a practical approachto monitoring water levels in prairie wetlands. Wetlands 24(1): 219–226.
Dillon PJ, Molot LA, Scheider WA. 1991. Phosphorous and nitrogenexport from forested stream catchments in central Ontario. Journal ofEnvironmental Quality 20: 857–864.
Euliss NH, LaBaugh JW, Fredrickson LH, Mushet DM, Laubhan MK,Swanson GA, Winter TC, Rosenberry DO, Nelson RD. 2004. Thewetland continuum: A conceptual framework for interpreting biologicalstudies. Wetlands 24(2): 10.
Fang X, Pomeroy JW. 2008. Drought impacts on Canadian prairie wetlandsnow hydrology. Hydrological Processes 22: 2858–2873.
Gray DM, Landine PG, Granger RJ. 1984. Simulating infiltration intofrozen Prairie soils in streamflow models. Canadian Journal of EarthSciences 22: 464–472.
Hayashi M, van der Kamp G. 2000. Simple equations to represent thevolume–area–depth relations of shallow wetlands in small topographicdepressions. Journal of Hydrology 237: 74–85.
Hayashi M, van der Kamp G, Schmidt R. 2003. Focused infiltration ofsnowmelt water in partially frozen soil under small depressions. Journalof Hydrology 270: 214–229.
Jenson SK, Domingue JO. 1988. Extracting Topographic Structure fromDigital Elevation Data for Geographic Information System Analysis.Photogrammetric Engineering and Remote Sensing 54(11): 1593–1600.
Johnson WC, Boettcher SE, Poiani KA, Guntenspergen G. 2004.Influence of weather extremes on the water levels of glaciated prairiewetlands. Wetlands 24: 385–398.
van der Kamp G, Hayashi M. 2009. Groundwater-wetland ecosysteminteraction in the semiarid glaciated plains of North America.Hydrogeology Journal 17(1): 203–214.
van der Kamp G, Hayashi M, Gallen D. 2003. Comparing the hydrologyof grassed and cultivated catchments in the semi-arid Canadian prairies.Hydrological Processes 17: 559–575.
van der Kamp G, Keir D, Evans MS. 2008. Long-term water level changesin closed-basin lakes of the Canadian prairies. Canadian WaterResources Journal 33(1): 23–38.
Lehman P, Hinz C, McGrath G, Tromp-van Meerveld HJ, McDonnell JJ.2007. Rainfall threshold for hillslope outlfow: an emergent property offlow pathway connectivity.Hydrology and Earth System Sciences 11: 16.
Leibowitz SG, Vining KC. 2003. Temporal connectivity in a prairiepothole complex. Wetlands 25(1): 15–25.
Martz LW, Garbrecht J. 1998. The treatment of flat areas and depressionsin automated drainage analysis of raster digital elevation models.Hydrological Processes 12: 843–855.
Miller JJ, Acton DF, St. Arnaud RJ. 1985. The effect of groundwater onsoil formation in a morainal landscape in Saskatchewan. CanadianJournal of Earth Sciences 65: 293–307.
Padmanabhan G, Bengtson ML. 1999. A Review of Models forInvestigating the Influence of Wetlands on Flooding. North DakotaState University: Fargo, North Dakota; 33.
Parsons DF, Hayashi M, van der Kamp G. 2004. Infiltration and solutetransport under a seasonal wetland: bromide tracer experiments inSaskatoon, Canada. Hydrological Processes 18: 2011–2027.
Pomeroy JW, Gray DM. 1995. Snowcover—accumulation, relocation andmanagement. NHRI Series Report Number 7, National HydrologyResearch Institute; 122.
Rosenberry DO, Winter TC. 1997. Dynamics of water-table fluctuations inan upland between two prairie-pothole wetlands in North Dakota.Journal of Hydrology 191: 266–289.
Simonovic SP, Juliano KM. 2001. The role of wetlands during lowfrequency flooding events in the Red River basin. Canadian WaterResources Journal 26(3): 377–397.
Hydrol. Process. (2011)DOI: 10.1002/hyp

D. A. SHAW ET AL.
Spence C. 2007. On the relation between dynamic storage and runoff: Adiscussion on the thresholds, efficiency and function. Water ResourcesResearch 43: 11.
Spence C, Woo MK. 2003. Hydrology of subarctic Canadian shield: soil-filledvalleys. Journal of Hydrology 279: 15.
Stichling W, Blackwell SR. 1957. Drainage area as a hydrologic factor onthe Canadian prairies. IUGG Proceedings, Toronto, Ontario.
Su M, Stolte WJ, van der Kamp G. 2000. Modelling Canadian prairiewetland hydrology using a semi-distributed streamflow model.Hydrological Processes 14: 2405–2422.
Toyra J, Pietroniro A, Craymer M, Veronneau M. 2008. Evaluation ofLiDAR-derived ground surface digital elevation model (DEM) in low-relief regions: Case study on the Canadian Prairies. In Hydroscan:Airborne Laser Mapping of Hydrological Features and Resources,Hopkinson C, Pietroniro A, Pomeroy JW. Saskatoon, EnvironmentCanada and the Canadian Water Resources Association.
Tromp-van Meerveld HJ, McDonnell JJ. 2006a. Threshold relations insubsurface stormflow: 1. A 147-storm analysis of the Panola hillslope.Water Resources Research 42.
Copyright © 2011 John Wiley & Sons, Ltd.
Tromp-van Meerveld HJ, McDonnell JJ. 2006b. Threshold relations insubsurface stormflow: 2. The fill and spill hypothesis. Water ResourcesResearch 42.
Vining KC. 2002. Simulation of Streamflow and Wetland Storage,Starkweather Coulee Subbasin, North Dakota, Water Years 1981–98.Water-Resources Investigations Report 02-4113. U.S. GeologicalSurvey: Bismark, North Dakota; 24.
Waddington JM, Roulet N, Hill AR. 1993. Runoff mechanisms in a forestedgroundwater discharge wetland. Journal of Hydrology 147: 37–60.
Winter TC. 2003. Geohydrologic setting of the Cottonwood Lake Area. InHydrological, chemical, biological characteristics of a prairie potholewetland complex under highly variable climate conditions – TheCottonwood Lake Area, east-central North Dakota, Winter TC (ed.). U.S. Geological Survey Professional Paper: Denver, CO; 1–24.
Woo M-K, Rowsell RD. 1993. Hydrology of a prairie slough. Journal ofHydrology 146: 175–207.
Yates TT. 2006. Spatial and temporal patterns of nitrous oxide and theirrelationship to soil water and soil properties. Soil Science. Saskatoon,University of Saskatchewan. Doctor of Philosophy.
Hydrol. Process. (2011)DOI: 10.1002/hyp