Embed Size (px)
Citation preview
AR-95.book : accrep.fm 11 Fri Apr 7 11:55:18 1995
1
The Fourth Annual Test of OCR Accuracy
Stephen V. Rice, Frank R. Jenkins, and Thomas A. Nartker
1 Introduction
For four years, ISRI has conducted an annual test of optical character recognition (OCR) systemsknown as “page readers.” These systems accept as input a bitmapped image of any documentpage, and attempt to identify the machine-printed characters on the page. In the annual test, wemeasure the accuracy of this process by comparing the text that is produced as output with thecorrect text. The goals of the test include:
1. to provide a current, independent assessment of system performance,
2. to measure the advances in the technology from year to year,
3. to gain insight into the complex nature of OCR, and
4. to identify problems at the state-of-the-art.
The scope of the test has increased greatly over the past four years. In the first test[Rice 92], six OCR systems processed binary images of 132 pages containing a total of 278,000characters. These pages were randomly selected from a U.S. Department of Energy (DOE)database of scientific and technical documents. In the second year, new measures ofperformance were introduced in evaluating eight OCR systems using a larger DOE sample (460pages and 817,000 characters) [Rice 93a, Kanai 93, Nartker 94a]. The third annual test re-usedthis DOE sample and featured a 200-page sample of articles from popular U.S. magazinesscanned at three different resolutions. Six OCR systems were thus tested on pages containingnearly 1.5 million characters [Rice 94, Nartker 94b].
In this report, we present the results of the fourth annual test, our largest and mostcomprehensive to date. The test samples contain more than three million characters frombusiness letters, DOE documents, and articles from magazines and newspapers. Each page hasbeen scanned four times to produce binary images at three different resolutions, plus one grayscale image. Furthermore, fax images at two different resolutions have been obtained for eachbusiness letter page. We introduce our first non-English sample, which is a collection ofSpanish-language newspaper articles, and for the first time, we report the speed of the OCRsystems.
AR-95.book : accrep.fm 12 Fri Apr 7 11:55:18 1995
2
1.1 Participants
Any organization may participate in the annual test provided:
1. it submits a version of an OCR system by the established deadline (December 15, 1994 forthe fourth annual test),
2. the version runs on a PC or Sun SPARCstation, and
3. the version can process specific regions of a TIFF image in a fully automatic (non-interac-tive) way.
Furthermore, only one entry is allowed per organization.There are many features of OCR systems that are evaluated in this test. Submitted versions
need not support all of these features. For example, if a version does not support automaticzoning or Spanish OCR, then it will simply be excluded from that portion of the test.
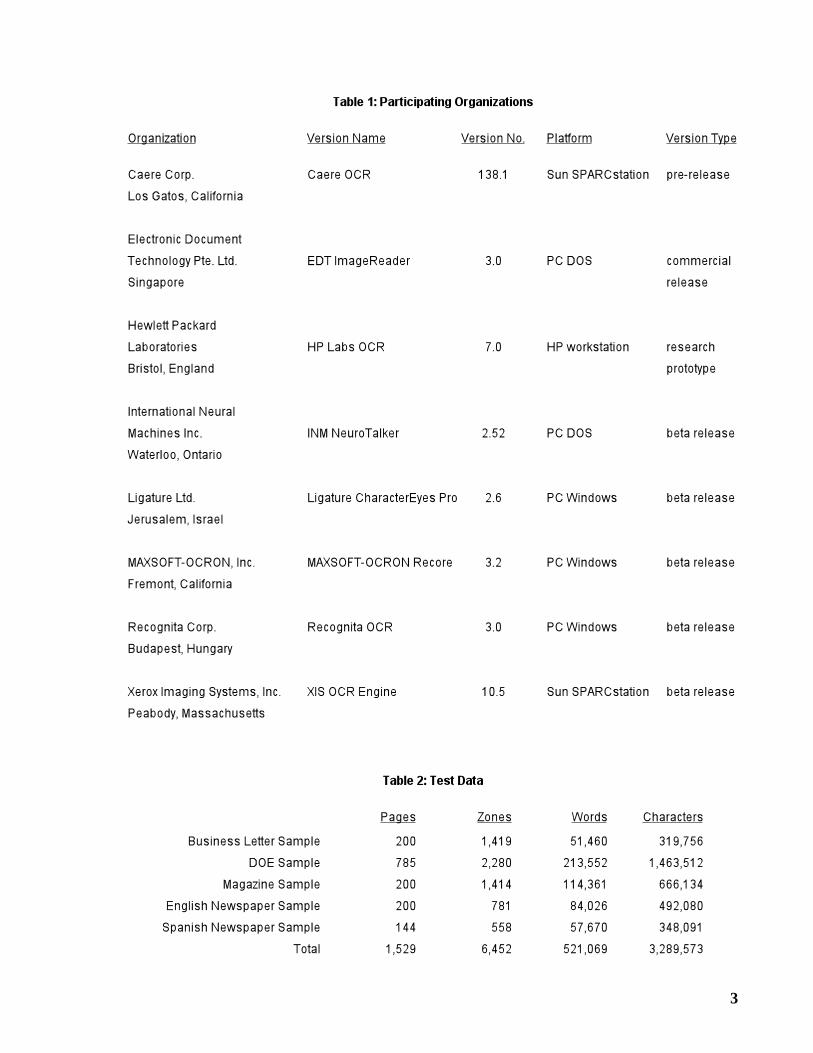
Table 1 lists the eight organizations that participated in this year’s test, and the versions theysubmitted. Hewlett Packard Laboratories submitted a research prototype that operates on onlyan HP workstation. This was allowed because HP provided the hardware, and facilitated theinterface, well in advance of the deadline.
1.2 Test Data
Five test samples were used in this year’s test.
1. TheBusiness Letter Sample contains a variety of letters received by businesses and individ-uals and donated to ISRI.
2. The DOE Sample is the third and largest sample we have prepared by randomly selectingpages from a DOE collection of scientific and technical documents.
3. TheMagazine Sample, which was used in the third annual test, consists of pages selected atrandom from the 100 U.S. magazines having the largest circulation.
4. TheEnglish Newspaper Sample contains articles selected at random from the 50 U.S. news-papers having the largest circulation.
5. TheSpanish Newspaper Sample contains articles selected at random from 12 popular news-papers from Argentina, Mexico, and Spain.
For the newspaper samples, only articles from the first section of the newspaper were selected,and each article was clipped from the newspaper.
Each test page was placed manually on the platen of a Fujitsu M3096G scanner, and thendigitized four times to produce binary images at 200, 300, and 400 dots per inch (dpi), and an 8-bit gray scale image at 300 dpi. A global threshold of 127 (out of 255) was used to create thebinary images for the Business Letter, DOE, and Magazine Samples. A different threshold waschosen for the newspaper samples: 75 for the English articles, and 95 for the Spanish articles.
AR-95.book : accrep.fm 13 Fri Apr 7 11:55:18 1995
3
AR-95.book : accrep.fm 14 Fri Apr 7 11:55:18 1995
4
We created fax images of the Business Letter Sample by transmitting each page locally,using standard and fine modes, from a Xerox 7024 fax machine to a fax modem. The standard-mode fax images have a resolution of 204 dpi in the X-direction, and 98 dpi in the Y-direction.The fine-mode images are also 204 dpi in the X-direction, but are 196 dpi in the Y-direction.
We manually “zoned” each page, i.e., we delineated and ordered the text regions of thepage. The OCR systems processed only these “zones.” Some text was deemed to be unsuitablefor the test, and was excluded; examples include equations, advertisements, text that is part of afigure (such as the labelling of a graph or map), and text that is considered to be unreadable byhumans.
We carefully prepared the correct text, or “ground-truth,” corresponding to each zone. Toensure the highest possible accuracy, the text for each zone was entered four times, by differenttypists working independently. The four versions were reconciled with the help of a differencealgorithm.
Table 2 gives the number of pages, zones, words, and characters in each test sample.
1.3 Test Operation
Version 5.0 of the OCR Experimental Environment was used to conduct the fourth annual test.This is a suite of software tools developed by ISRI for large-scale, automated testing and experi-mental research in OCR. An earlier version of this software is described in [Rice 93b].
This software runs on Sun SPARCstations and provides remote control of PCs. Each OCRsystem is operated in a fully automatic manner, i.e., without human interaction. The comparisonof OCR-generated text with correct text, and the tabulation of accuracy statistics, are performedentirely under computer control.
Pages were not re-scanned for each OCR system, nor were page images re-zoned; all OCRsystems processed the same zoned portions of the same page images. Unless otherwise noted,tests were run using the 300 dpi binary and gray scale images. Exceptions are the testsinvolving the fax business letters, and the test of the effect of resolution, which also utilized the200 and 400 dpi binary images.
Caere OCR and the XIS OCR Engine were operated under SunOS 4.1.3 on a single-processor Sun SPARCstation 10 with 64 megabytes of memory. The five PC-based OCRsystems performed on identically-configured 486DX/33 machines with 8 megabytes of memory,running under MS-DOS 5.0, and for three of these, MS Windows 3.1. HP Labs OCR wasoperated under HP-UX A.09.01 on an HP 9000 Model 735 with 32 megabytes of memory.
Each machine was unburdened when timing figures were recorded, i.e., only the OCRsystem was running on the machine. Each OCR system processed one page image perinvocation; thus, the timing figures include the modest overhead of initializing the OCR systemfor each image.
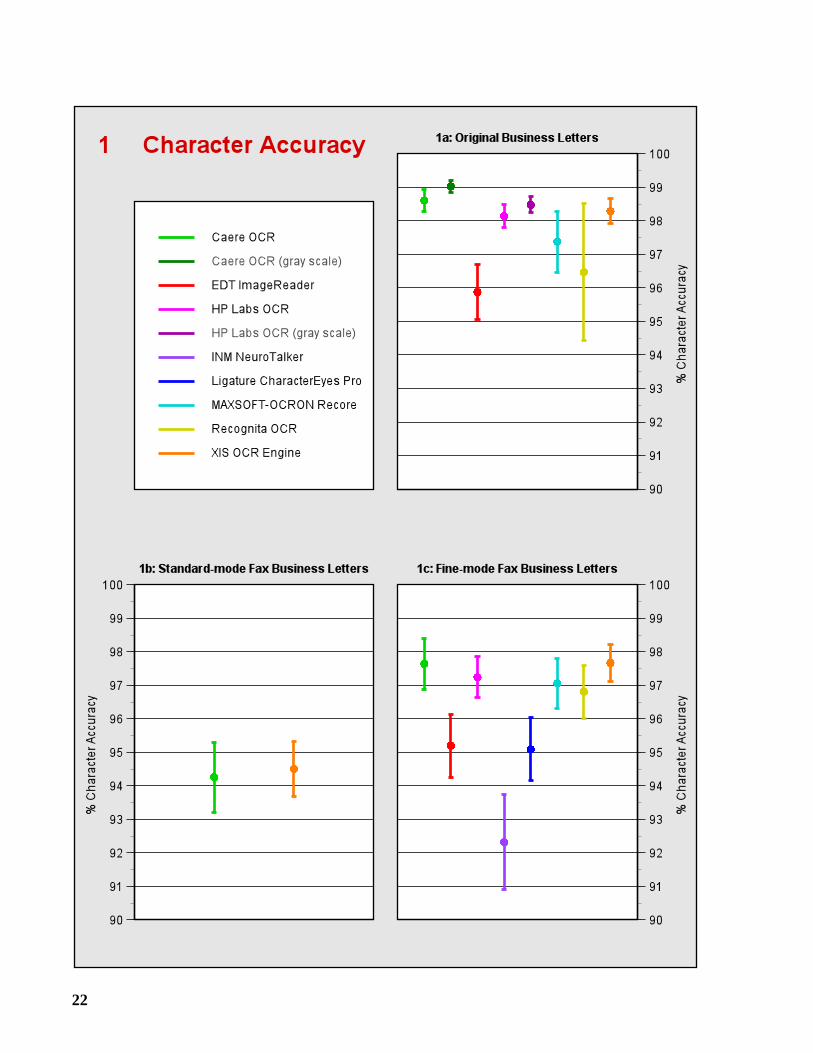
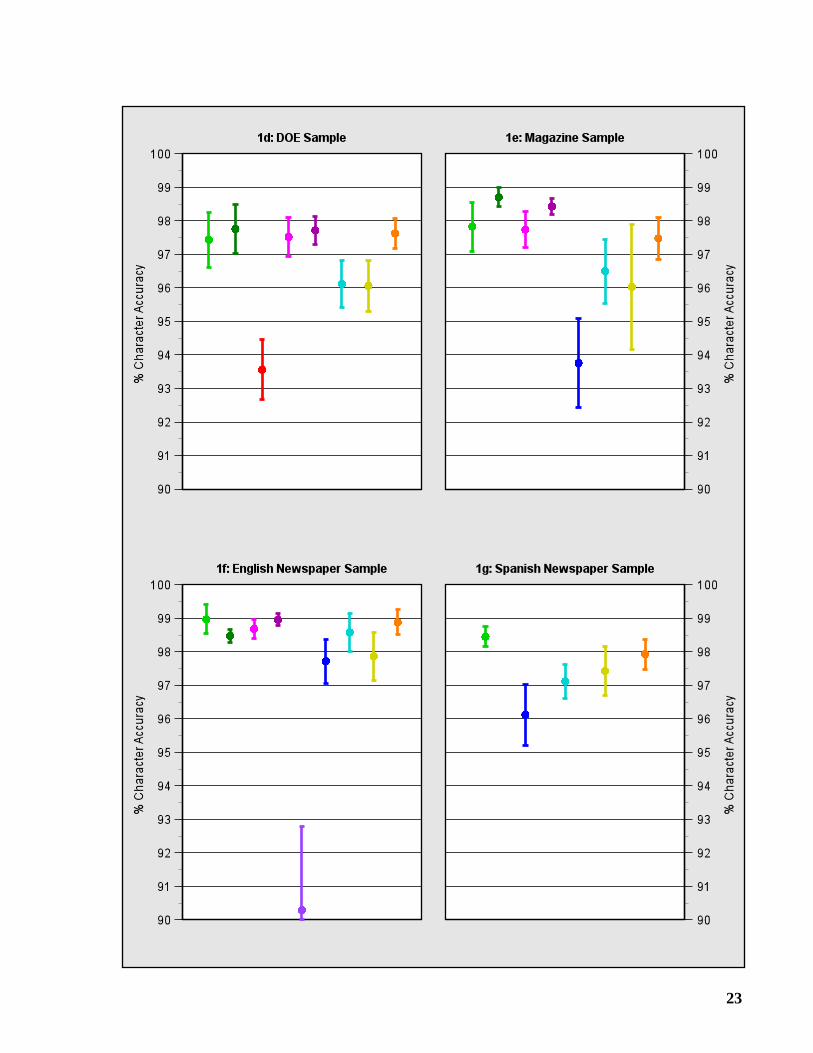
2 Character Accuracy
While there are many ways of quantifying the deviation between OCR-generated and correct text,in our most fundamental measure, we reflect the effort required by a human editor to correct theOCR-generated text. Specifically, we compute the minimum number of edit operations (character
AR-95.book : accrep.fm 15 Fri Apr 7 11:55:18 1995
5
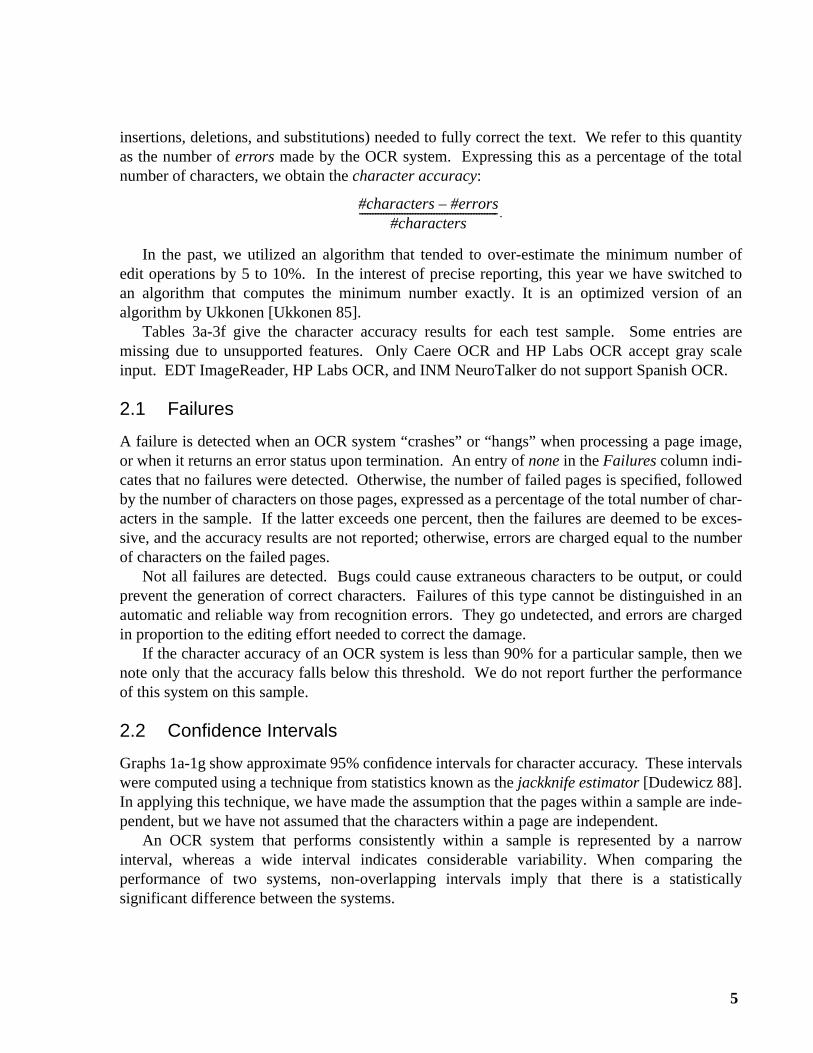
insertions, deletions, and substitutions) needed to fully correct the text. We refer to this quantityas the number oferrors made by the OCR system. Expressing this as a percentage of the totalnumber of characters, we obtain thecharacter accuracy:
In the past, we utilized an algorithm that tended to over-estimate the minimum number ofedit operations by 5 to 10%. In the interest of precise reporting, this year we have switched toan algorithm that computes the minimum number exactly. It is an optimized version of analgorithm by Ukkonen [Ukkonen 85].
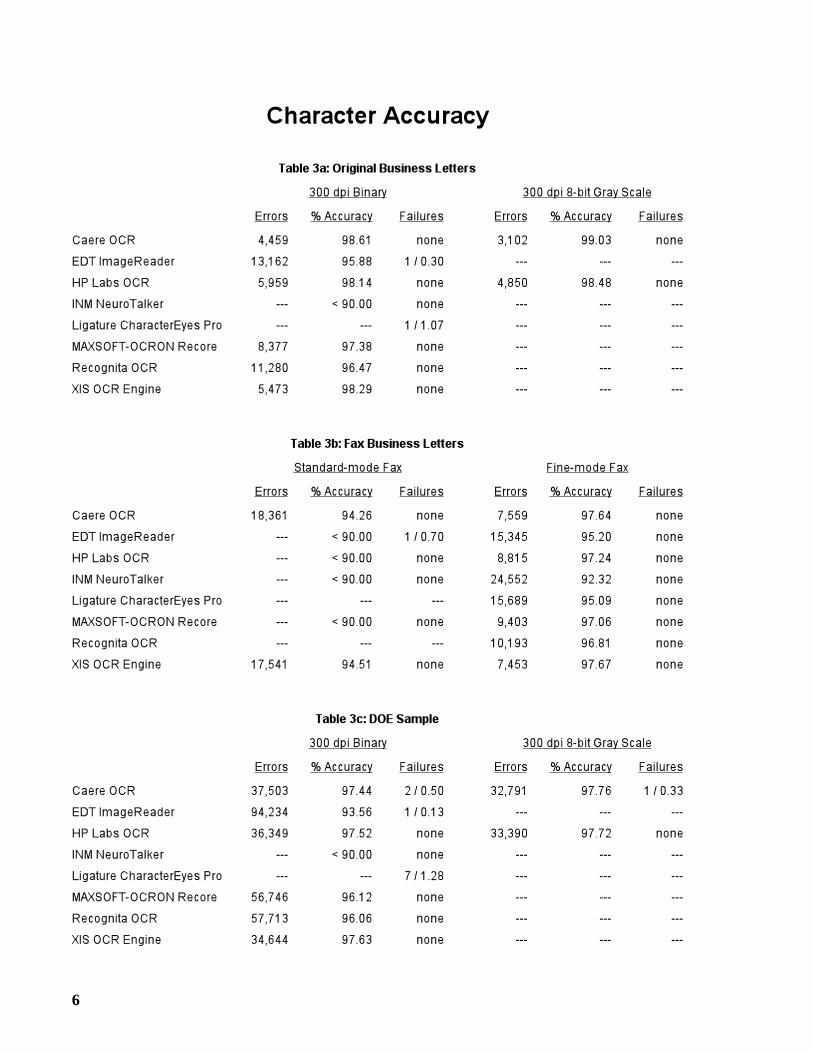
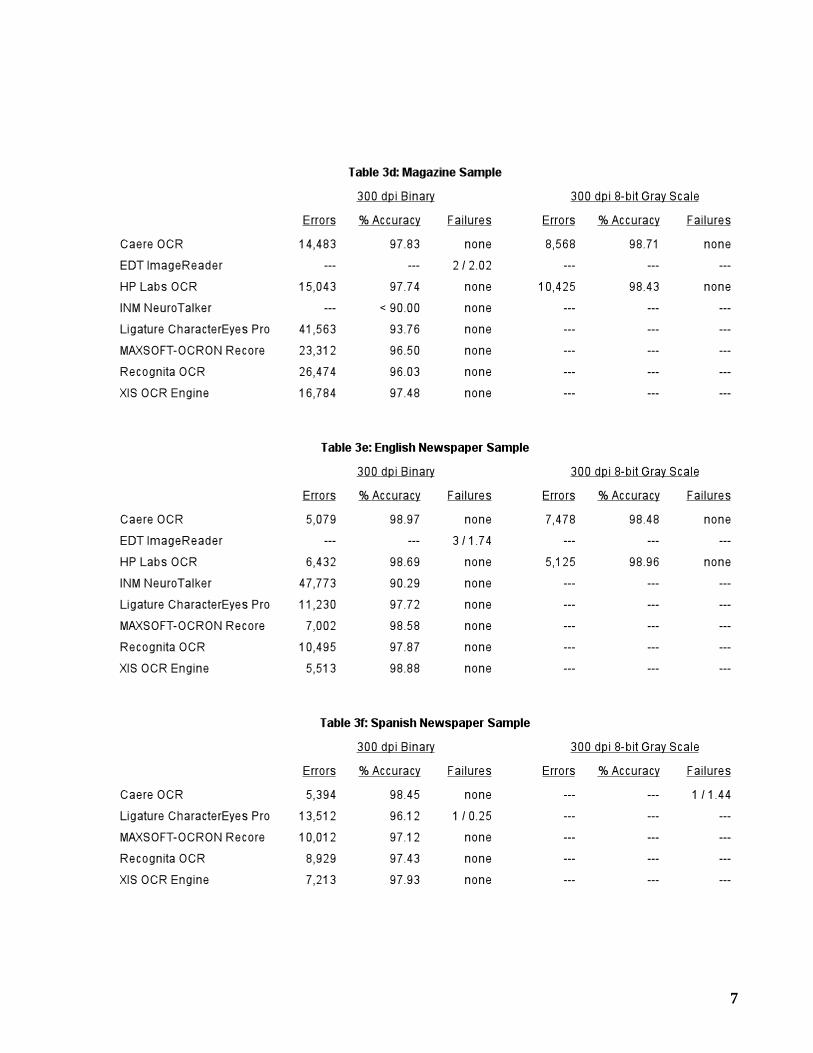
Tables 3a-3f give the character accuracy results for each test sample. Some entries aremissing due to unsupported features. Only Caere OCR and HP Labs OCR accept gray scaleinput. EDT ImageReader, HP Labs OCR, and INM NeuroTalker do not support Spanish OCR.
2.1 Failures
A failure is detected when an OCR system “crashes” or “hangs” when processing a page image,or when it returns an error status upon termination. An entry ofnone in theFailures column indi-cates that no failures were detected. Otherwise, the number of failed pages is specified, followedby the number of characters on those pages, expressed as a percentage of the total number of char-acters in the sample. If the latter exceeds one percent, then the failures are deemed to be exces-sive, and the accuracy results are not reported; otherwise, errors are charged equal to the numberof characters on the failed pages.
Not all failures are detected. Bugs could cause extraneous characters to be output, or couldprevent the generation of correct characters. Failures of this type cannot be distinguished in anautomatic and reliable way from recognition errors. They go undetected, and errors are chargedin proportion to the editing effort needed to correct the damage.
If the character accuracy of an OCR system is less than 90% for a particular sample, then wenote only that the accuracy falls below this threshold. We do not report further the performanceof this system on this sample.
2.2 Confidence Intervals
Graphs 1a-1g show approximate 95% confidence intervals for character accuracy. These intervalswere computed using a technique from statistics known as thejackknife estimator [Dudewicz 88].In applying this technique, we have made the assumption that the pages within a sample are inde-pendent, but we have not assumed that the characters within a page are independent.
An OCR system that performs consistently within a sample is represented by a narrowinterval, whereas a wide interval indicates considerable variability. When comparing theperformance of two systems, non-overlapping intervals imply that there is a statisticallysignificant difference between the systems.
#characters #errors–#characters
---------------------------------------------------- .
AR-95.book : accrep.fm 16 Fri Apr 7 11:55:18 1995
6
AR-95.book : accrep.fm 17 Fri Apr 7 11:55:18 1995
7
AR-95.book : accrep.fm 18 Fri Apr 7 11:55:18 1995
8
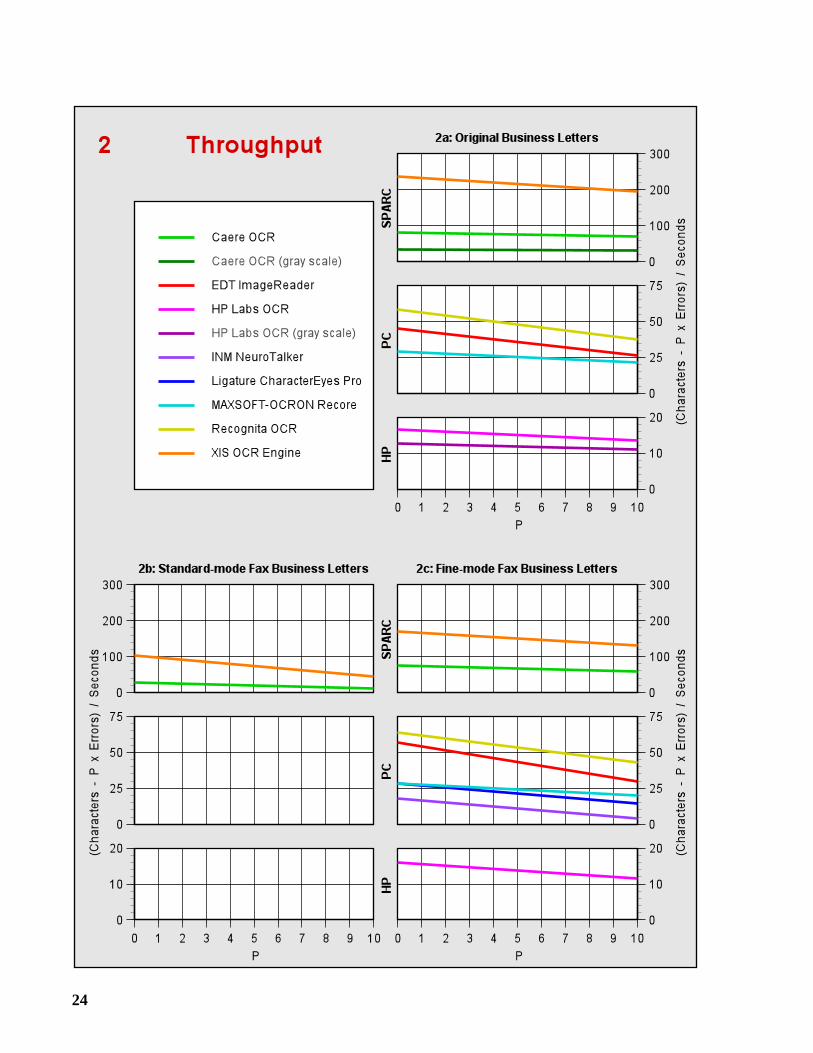
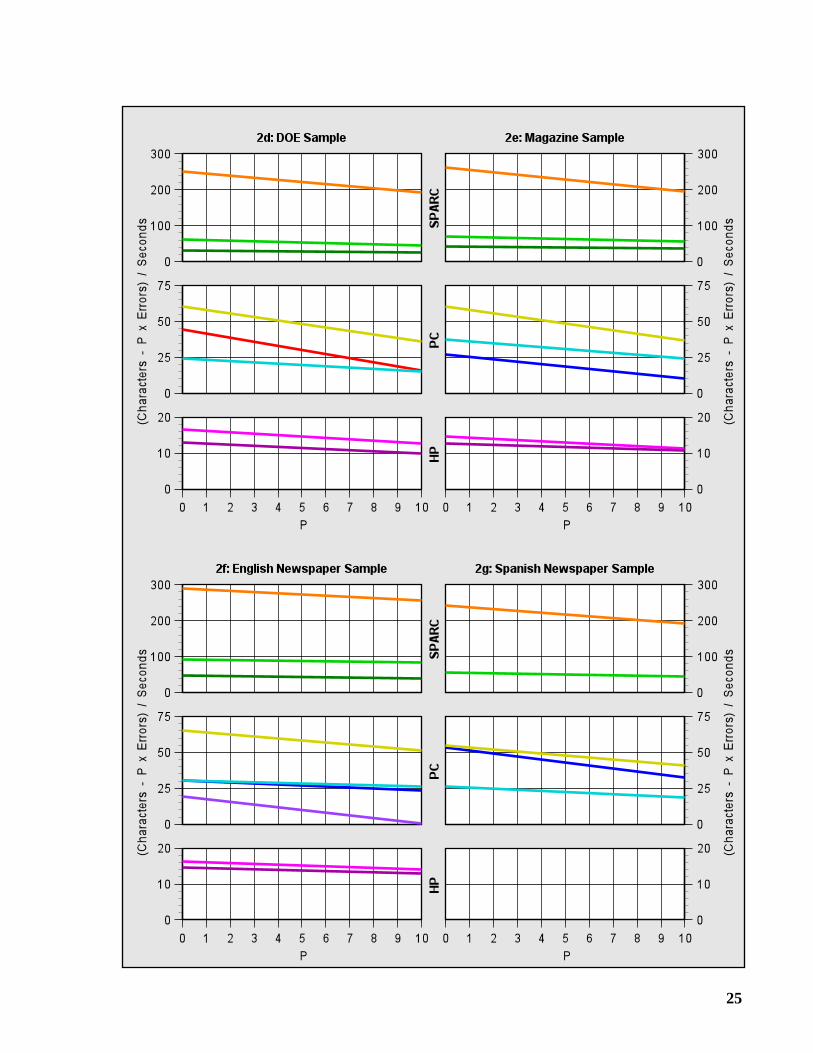
2.3 Speed and Throughput
For most applications, speed is less important than accuracy. Indeed, there is little use for afast OCR system that produces mostly gibberish as output. But given OCR systems ofcomparable accuracy, speed becomes an important factor.
We are generally opposed to reporting raw speed figures without consideration of accuracy.Thus, we introduce the followingthroughput function which reports speed while penalizing forerrors:
P represents the penalty assigned to each error. WhenP = 0, the function gives the raw speed interms of characters per second. Some authors have defined throughput to mean “correct charac-ters” per second, which corresponds toP = 1. We do not feel that this is a sufficient penalty forerrors; hence, in Graphs 2a-2g, we present throughput forP = 0 to 10.
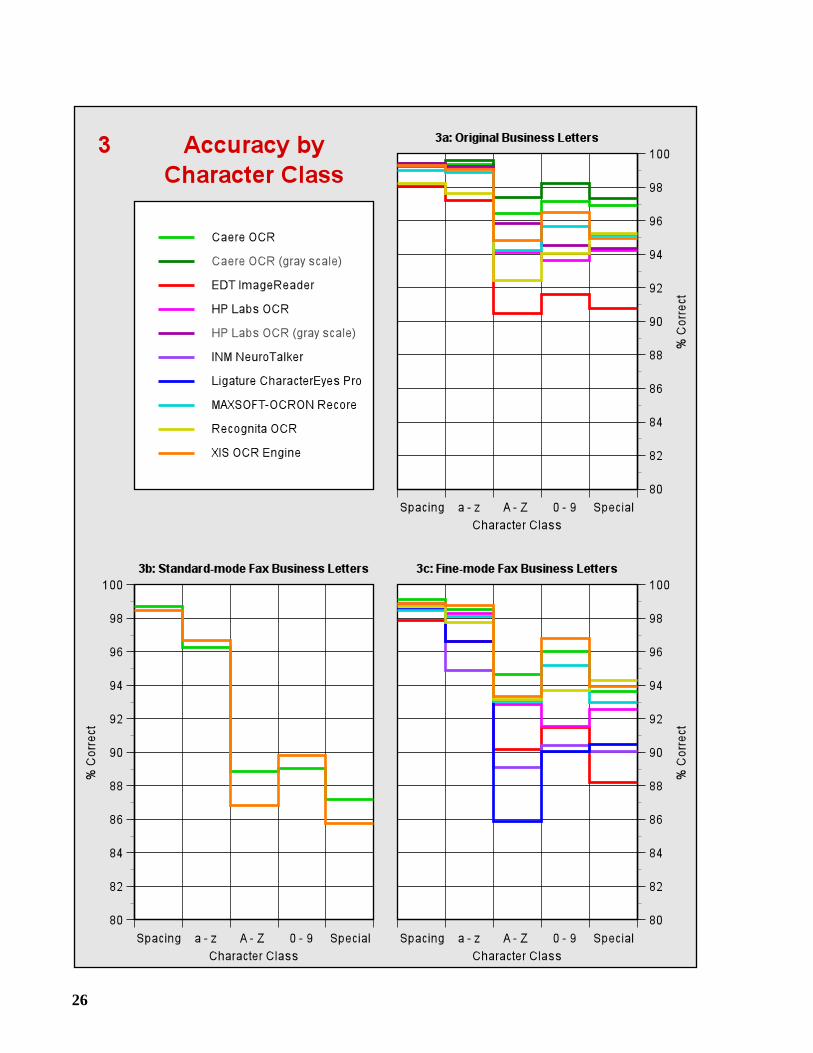
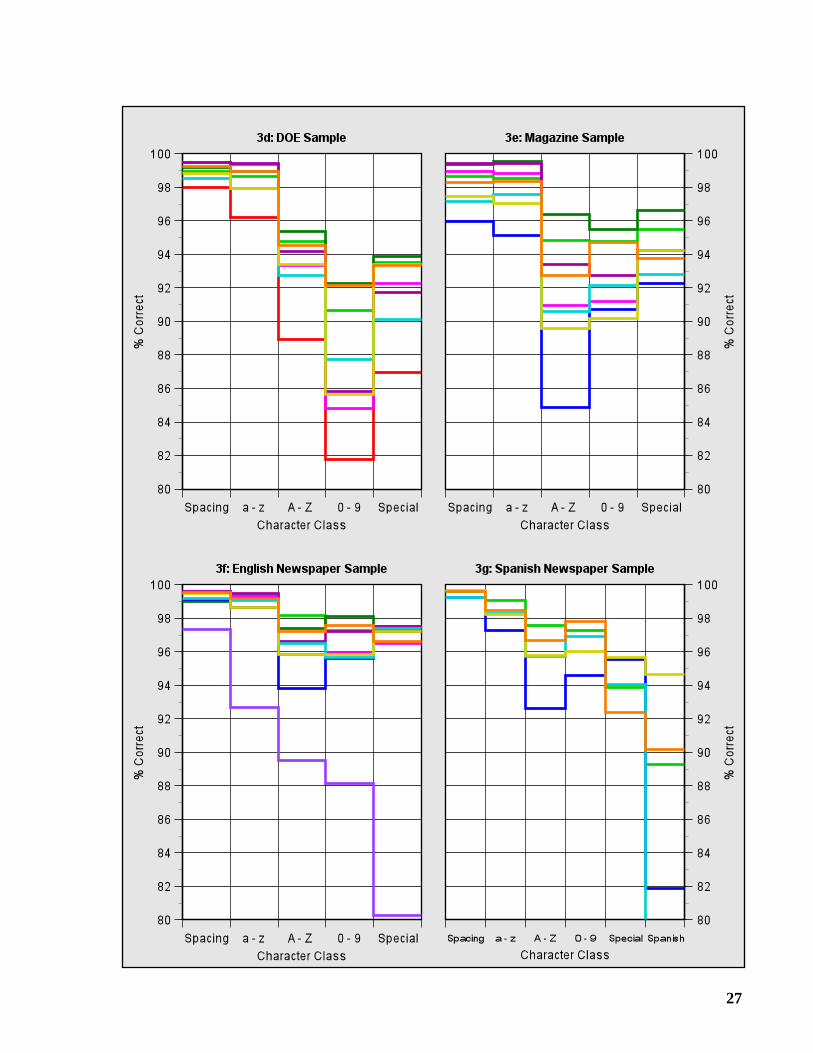
2.4 Accuracy by Character Class
In accuracy by character class, we divide the ground-truth characters into classes, and determinethe percentage of characters in each class that were correctly recognized. The following classeswere used.
1. Spacing: the blank and end-of-line characters,
2. a - z: the lowercase letters,
3. A - Z: the uppercase letters,
4. 0 - 9: the decimal digits, and
5. Special: punctuation and other special symbols.
For the Spanish Newspaper Sample, aSpanish class was added containing the Spanish accentedletters and punctuation symbols. Graphs 3a-3g display the results for each test sample.
The largest of these classes is thea - z class; depending on the sample, 68 to 75% of theground-truth characters belong to this class. The second largest class is theSpacing class,accounting for 16 to 17% of the characters.
The A - Z, 0 - 9, and Special classes contain 3-7%, 1-6%, and 3-5% of the characters,respectively. TheSpanish class contains 2% of the characters in the Spanish NewspaperSample. The OCR systems were less accurate on these smaller classes.
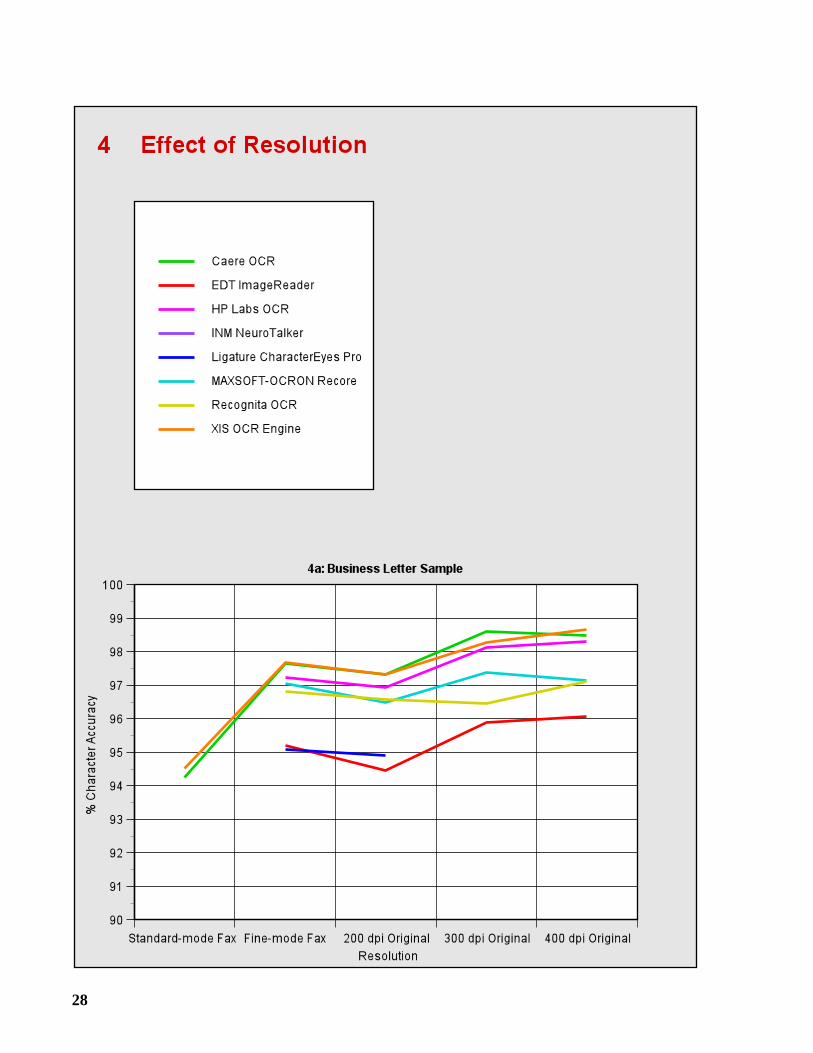
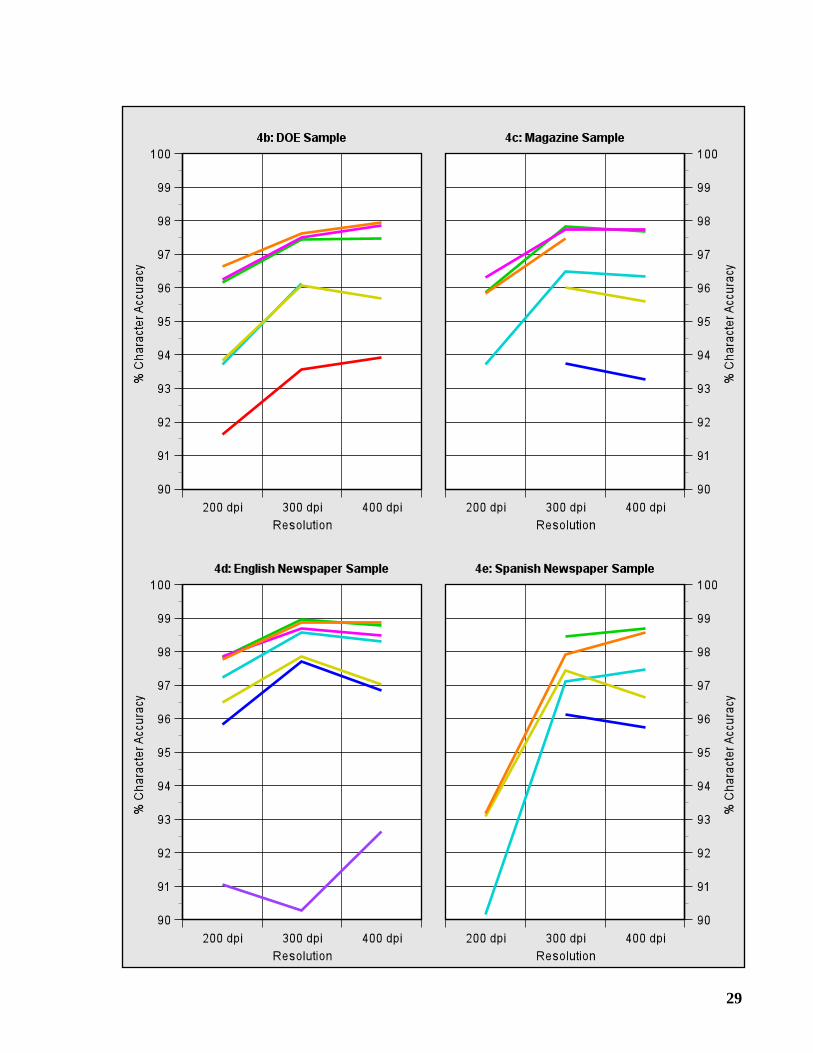
2.5 Effect of Resolution
Graphs 4a-4e show how character accuracy is affected by decreasing the resolution of binaryimages from 300 to 200 dpi, and by increasing it to 400 dpi. Graph 4a also includes the faximages. If the data point for a particular resolution is missing, then the OCR system had difficultyprocessing the images scanned at this resolution: either it made excessive failures or its accuracywas less than 90%.
Decreasing the resolution from 300 to 200 dpi caused a substantial increase in the number of
#characters P #errors×–#seconds
--------------------------------------------------------------.
AR-95.book : accrep.fm 19 Fri Apr 7 11:55:18 1995
9
errors: approximately a 50% increase for the Business Letter and DOE Samples, and a 75%increase for the Magazine and English Newspaper Samples. The number of errors jumped by200% for the Spanish Newspaper Sample.
One would expect the number of errors to decrease by increasing the resolution from 300 to400 dpi. In some cases it did by a small amount, but just as often, the number of errorsincreased. The higher resolution provided little or no advantage.
The fine-mode fax images have essentially the same resolution as the 200 dpi images. Butwhen processing the former, the OCR systems made 5 to 15% fewer errors than they did on thelatter. Upon inspection, we observed that the images created by the fax machine are “darker,”and contain fewer broken characters, than the images produced using the Fujitsu scanner.
The standard-mode fax images presented a very difficult test for the OCR systems. Morethan twice the number of errors were made on these images than on the fine-mode images, andonly two systems, Caere OCR and the XIS OCR Engine, attained a character accuracy above90%. Two organizations, Ligature and Recognita, chose not to participate in this test.
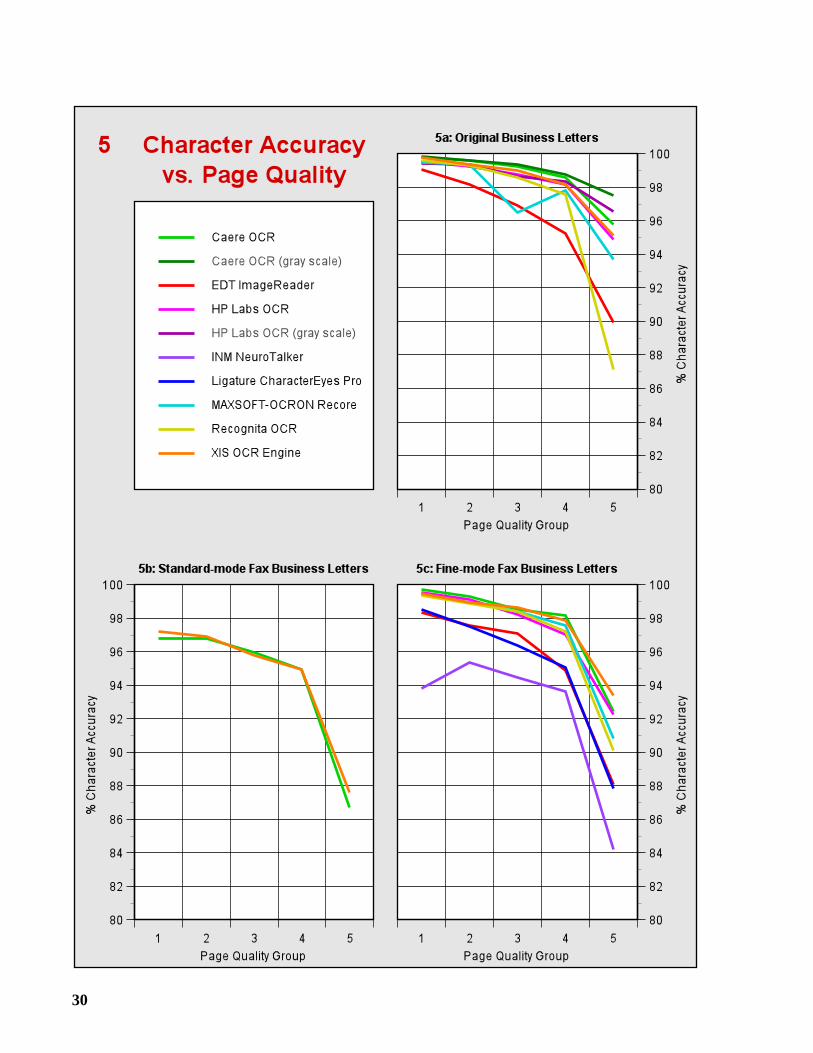
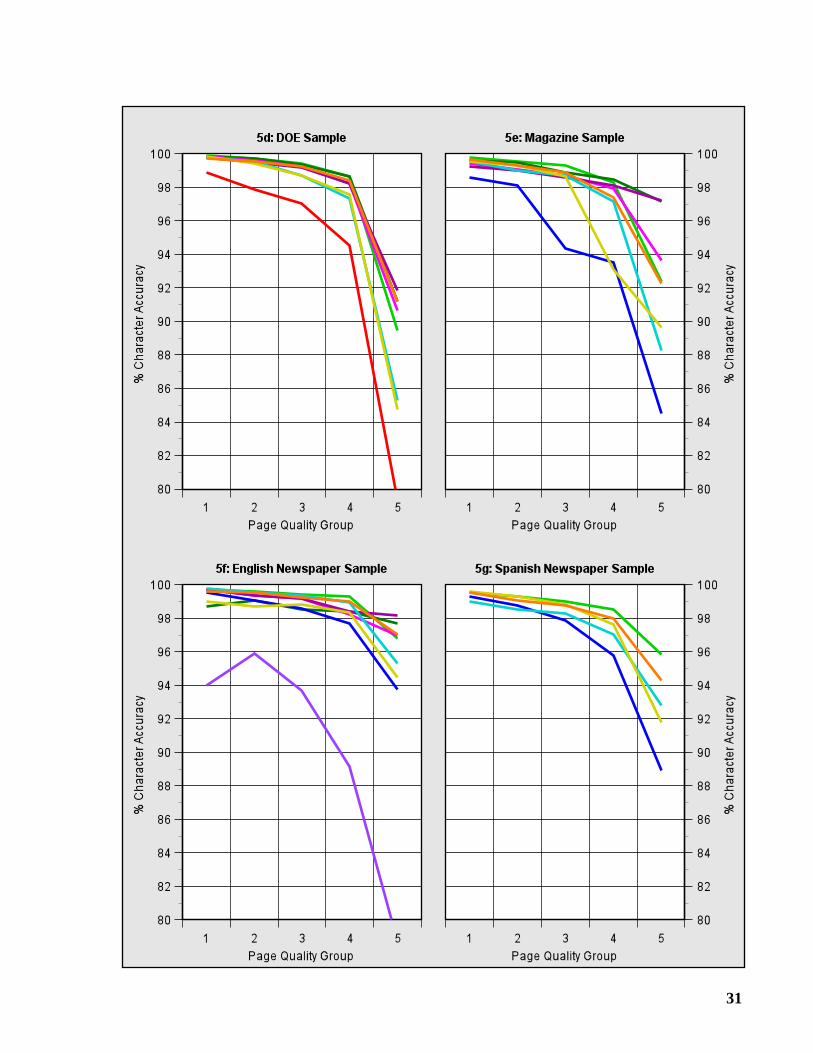
2.6 Page Quality Groups
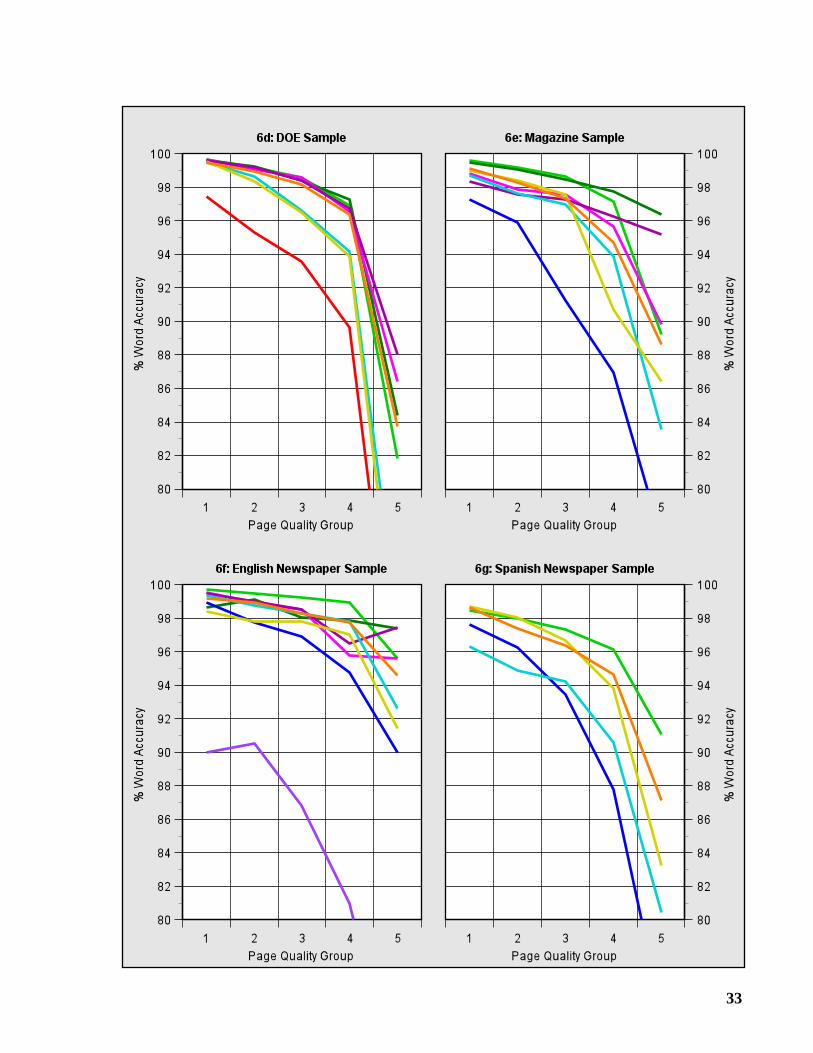
If we process a given page using several OCR systems, and determine the character accuracy ofeach system on this page, then we can compute the median of these accuracies to obtain a mea-sure of the quality, or “OCR difficulty,” of the page. We use this measure to divide the pages ofeach sample into five “Page Quality Groups” of approximately equal size. Group 1 contains thepages with the highest median accuracy (best page quality), and Group 5 contains the pages withthe lowest median accuracy (worst page quality). In Graphs 5a-5g, the character accuracy withineach group is plotted to show the effect of page quality.
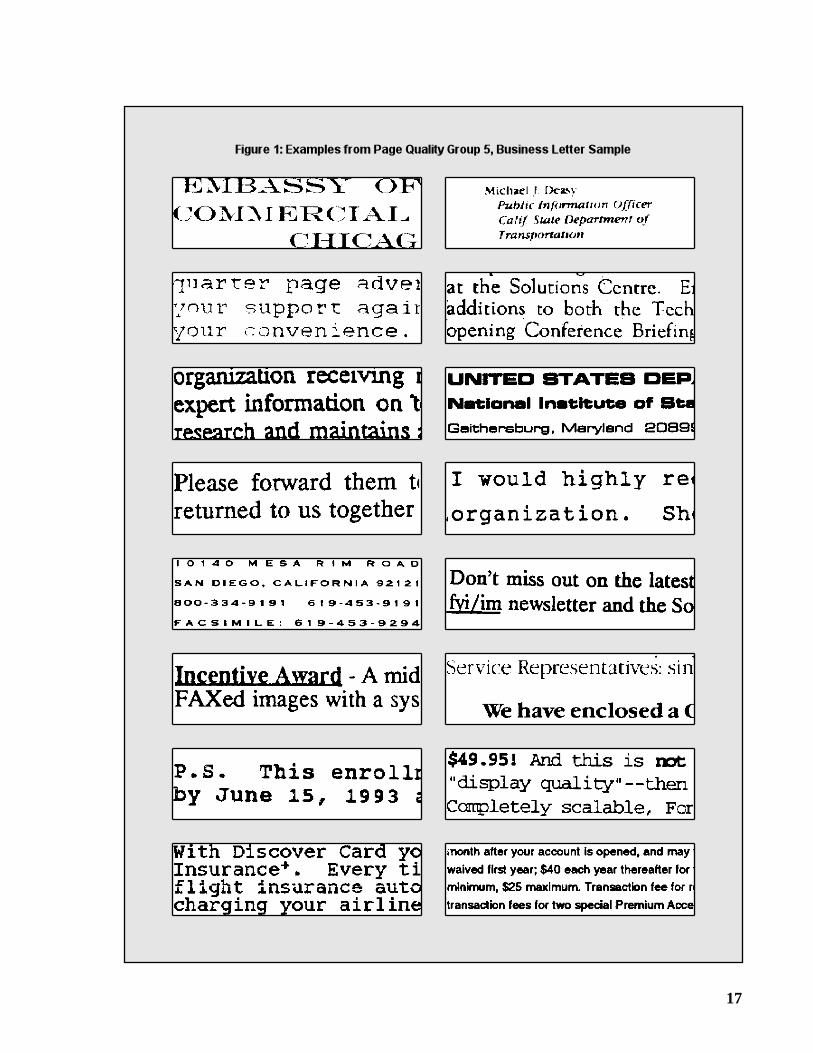
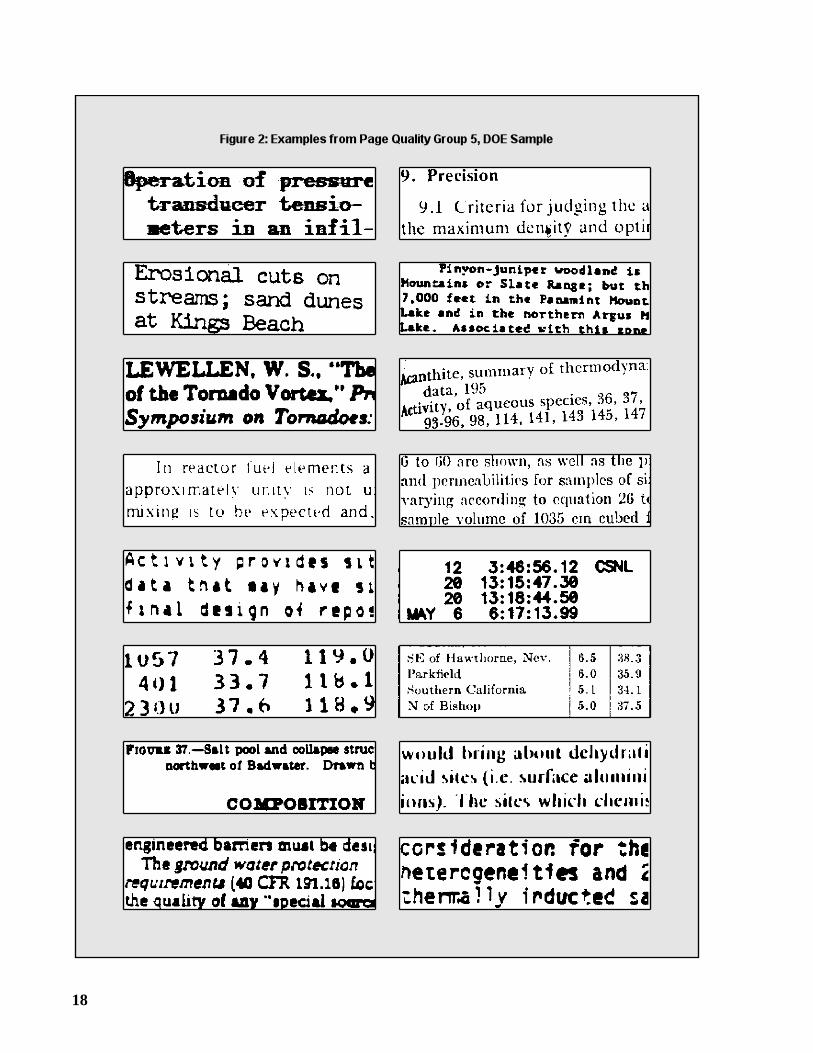
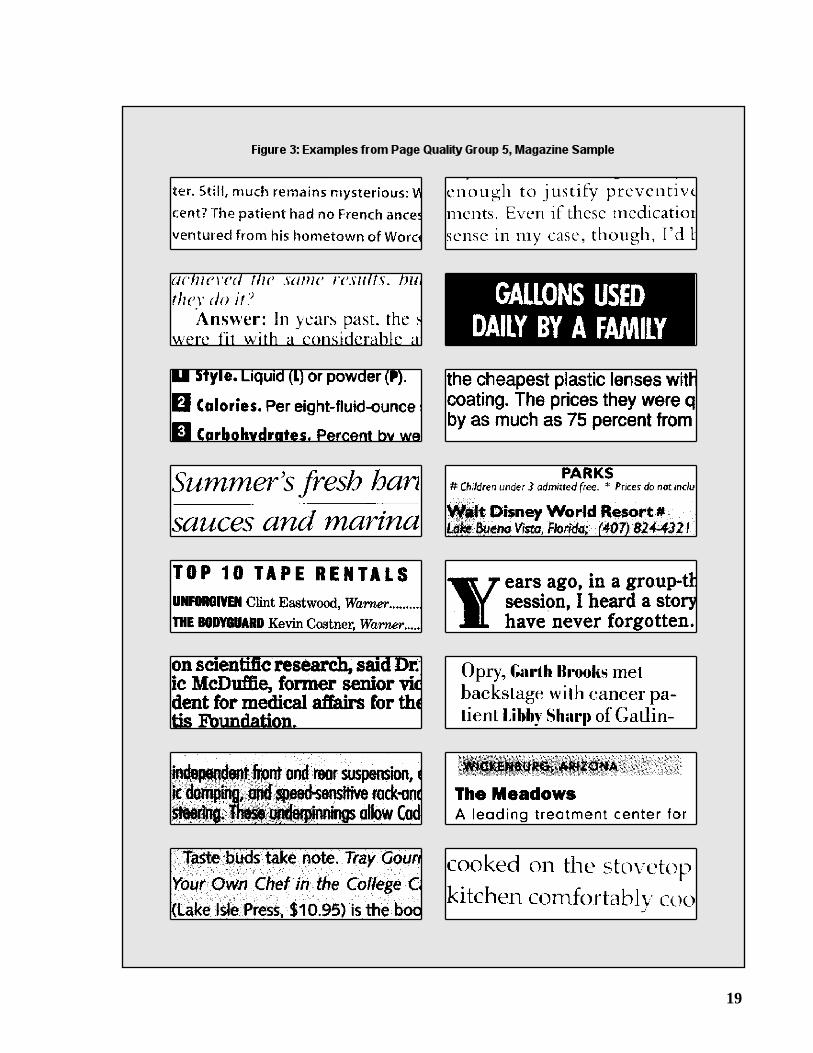
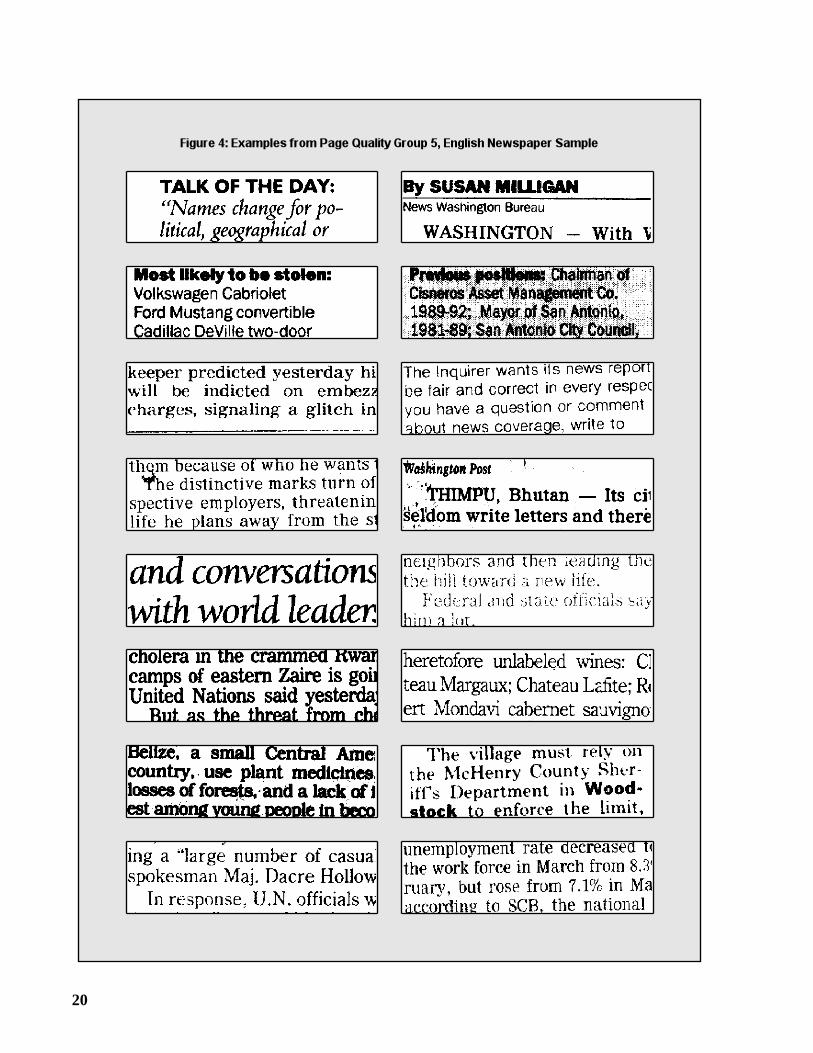
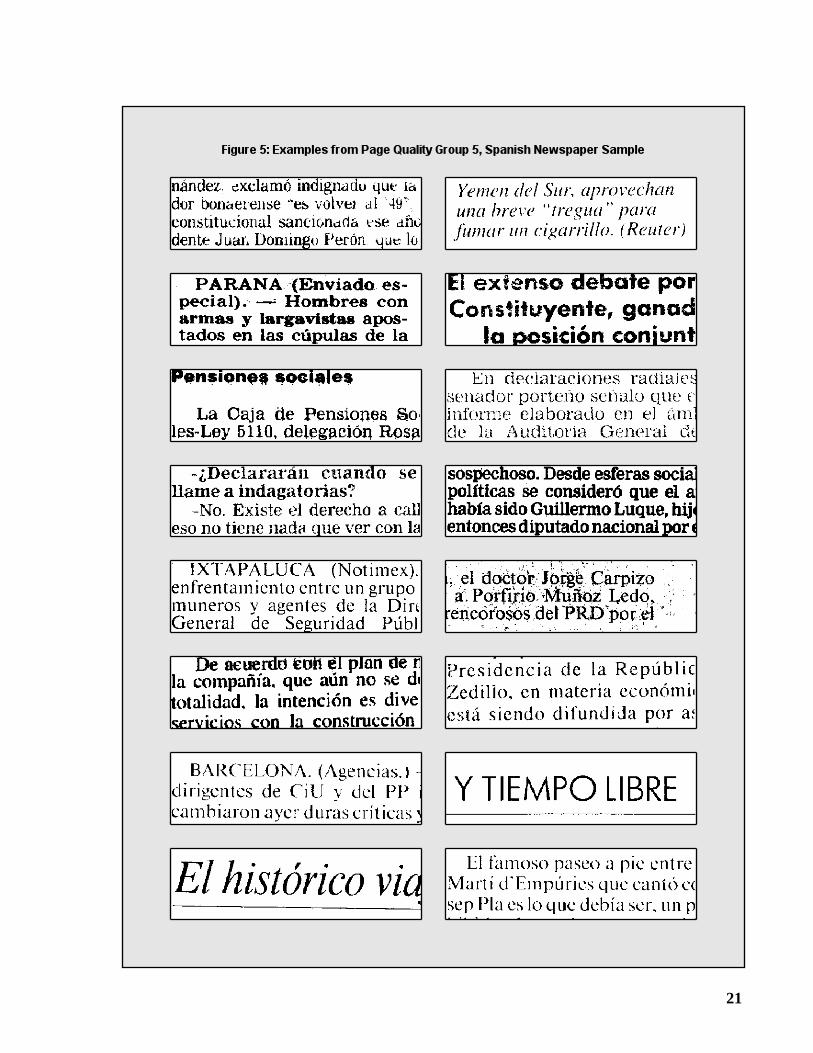
A large percentage of the errors, about 50 to 60%, are made on the worst 20% of eachsample, i.e., Group 5. For the DOE Sample, this percentage is even higher, roughly 70 to 80%.We can gain some insight into what makes OCR difficult by examining the images of pagesbelonging to Group 5. In Figures 1-5, we present snippets taken from these images. Each wasreproduced from the 300 dpi binary image, and enlarged by 50% to make it easier to see thedegradation.
Broken and touching characters, also known as “splits” and “joins,” are a very commonsource of error, and occur in each test sample. When processing the business letters, the OCRsystems encountered some difficulty reading letterheads, which are often printed in a stylisticmanner; also, creases in the hard copy affected the recognition of entire lines. The DOE Samplecontains many challenging tables, and some pages with skewed text and/or curved baselines.Text printed on a shaded background is common in magazine articles, and is a significant sourceof error. Bleedthrough and other irregularities of newsprint caused some speckling of thenewspaper images.
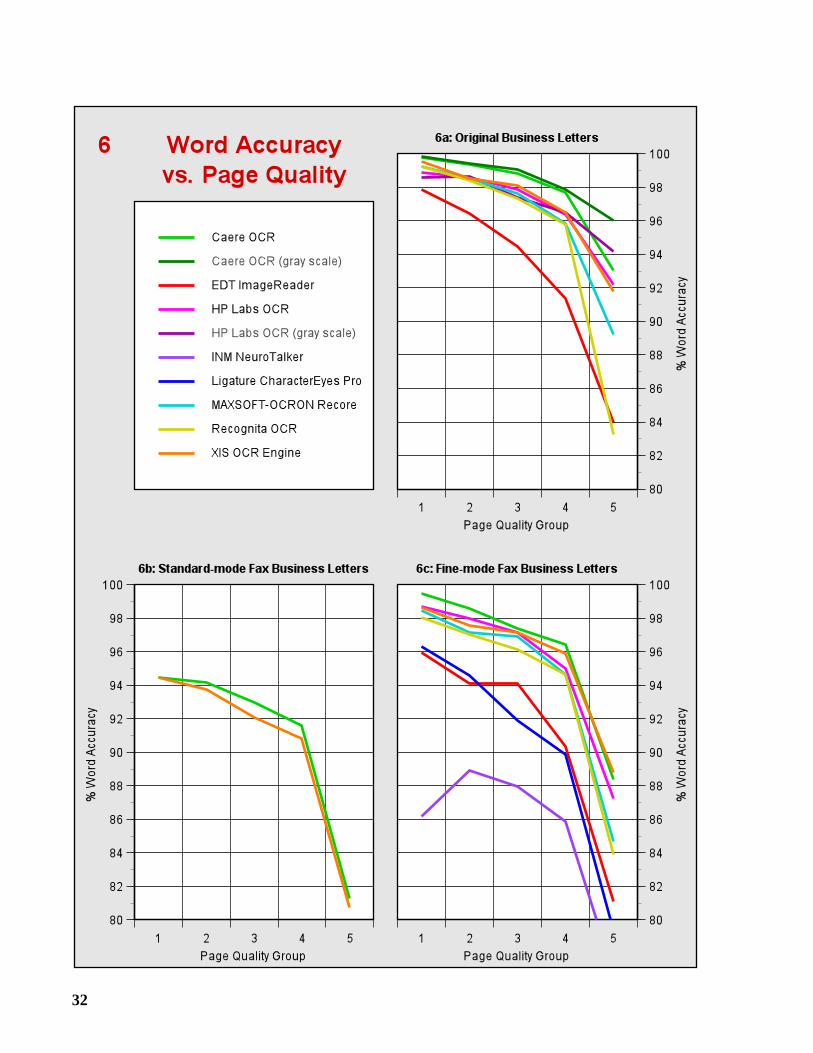
3 Word Accuracy
A popular application of OCR is to build a text database from a collection of hard-copy docu-ments. Information retrieval techniques can then be applied to locate documents of interest. Inthis environment, the percentage of words that are correctly recognized, or word accuracy of the
AR-95.book : accrep.fm 20 Fri Apr 7 11:55:18 1995
10
AR-95.book : accrep.fm 21 Fri Apr 7 11:55:18 1995
11
AR-95.book : accrep.fm 22 Fri Apr 7 11:55:18 1995
12
OCR-generated text, is an important measure.We define a word to be any sequence of one or more letters. A word is considered to be
correctly recognized if all of its letters have been correctly identified. Since full-text searchingis normally performed on a case-insensitive basis, a letter that is generated in the wrong case(e.g., C for c) is still considered to be correct.
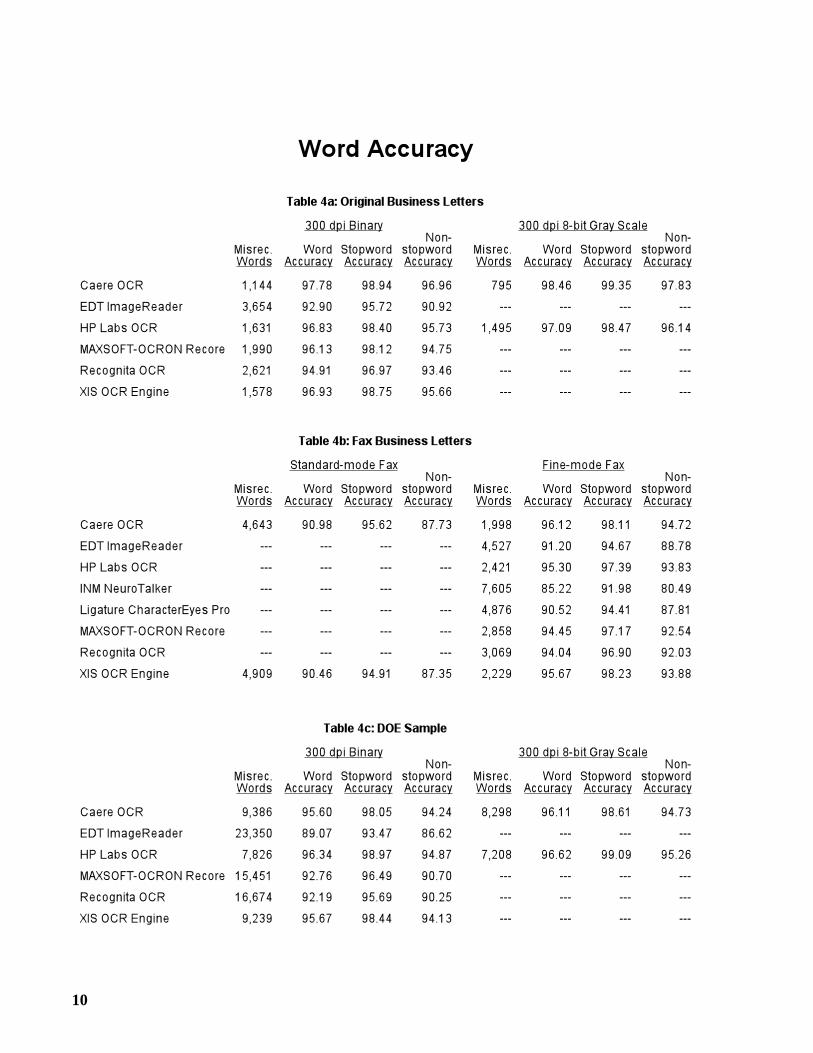
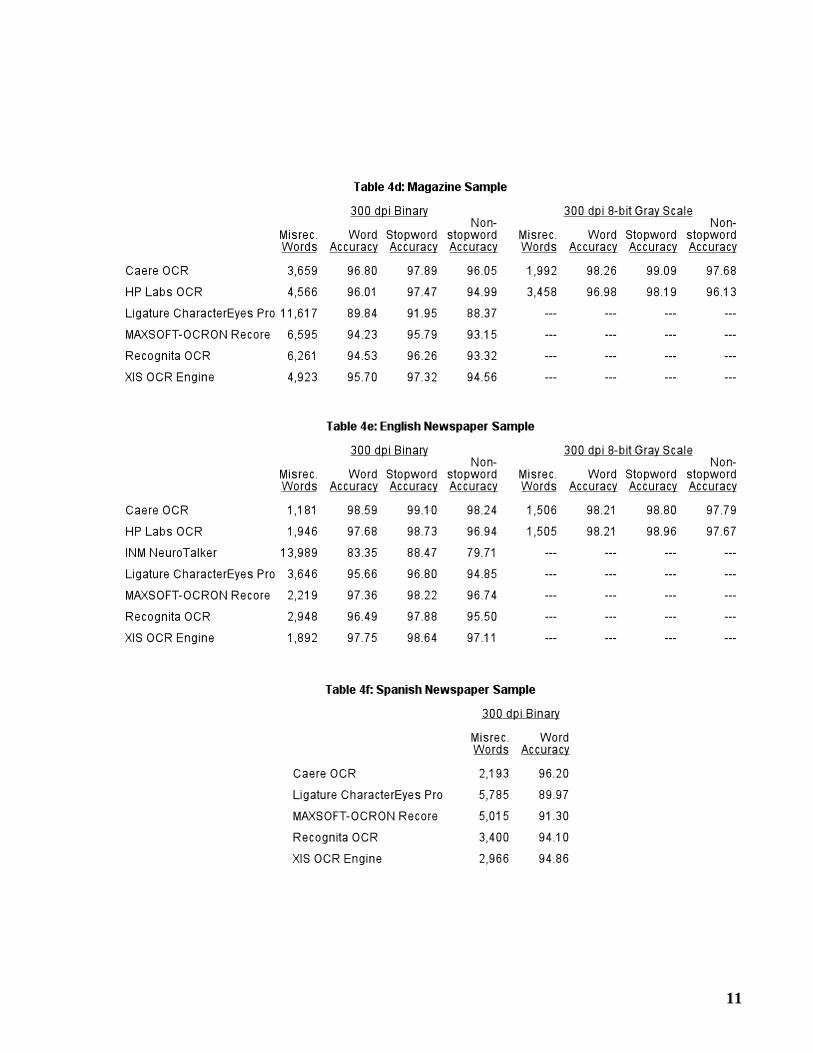
Tables 4a-4f give the number of misrecognized words and the word accuracy for each testsample. Graphs 6a-6g show the word accuracy within each Page Quality Group.
3.1 Stopwords and Non-stopwords
Stopwords are common words such as the, of, and, in, etc. Since these words have little retrievalvalue, they are normally not indexed by text retrieval systems. Since users search only for non-stopwords, it is the percentage of non-stopwords that are correctly recognized, or non-stopwordaccuracy, that is especially of interest.
We utilize the default set of 110 stopwords from the BASISPLUS text retrieval system[IDI 90]. About 40% of the words in the test samples are stopwords. Tables 4a-4e show thestopword and non-stopword accuracy for each test sample. (These were not computed for theSpanish Newspaper Sample.)
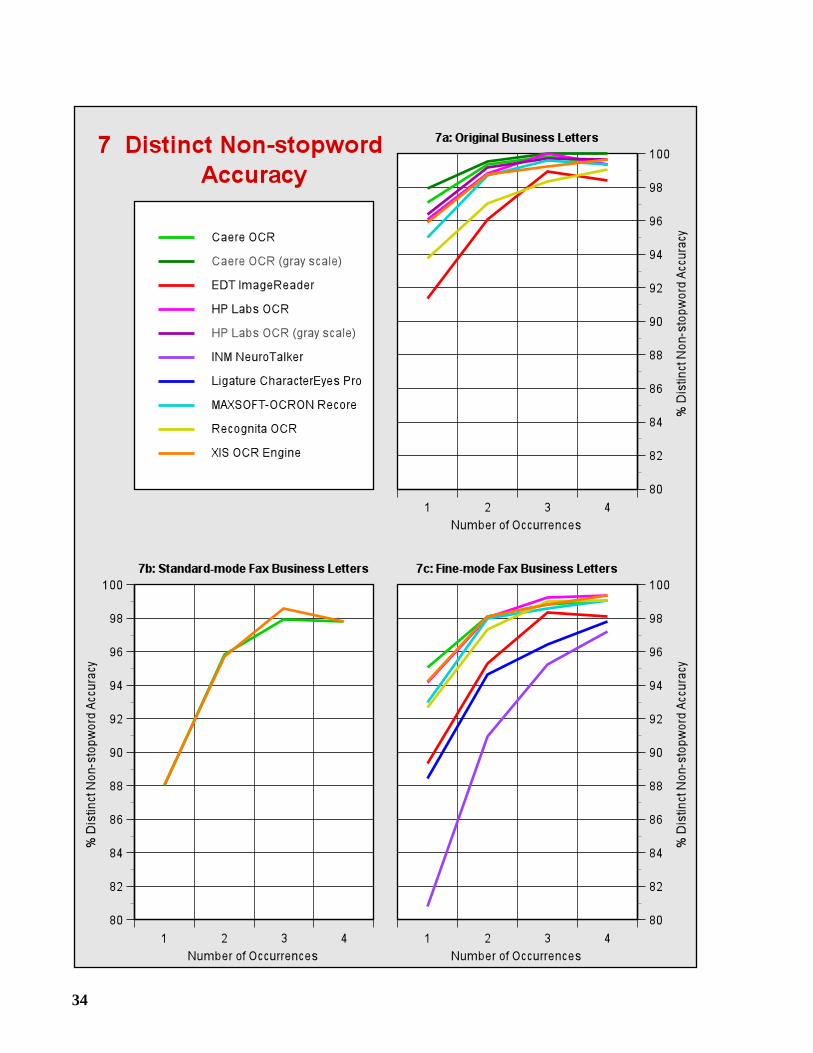
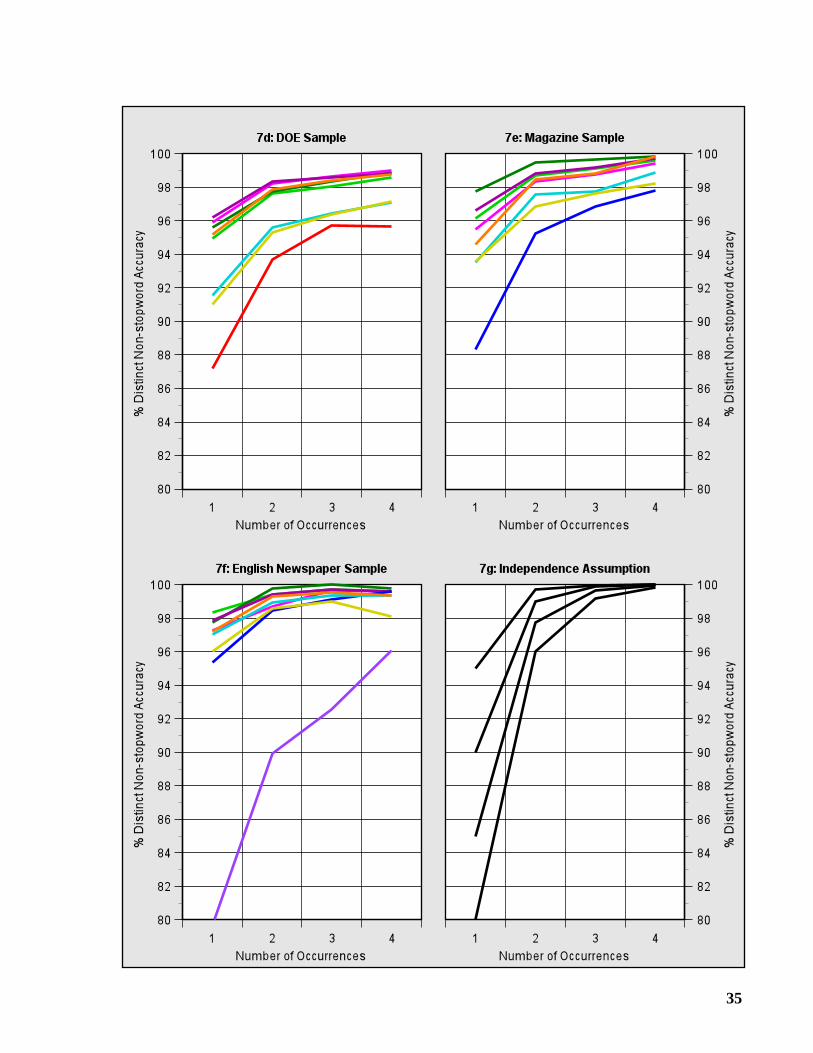
3.2 Distinct Non-stopword Accuracy
Suppose a user wishes to find every document in the database that contains a specific term (non-stopword). If a document containing this term is to be located, then at least one occurrence of theterm must have been correctly recognized by the OCR system. With this in mind, we introduce ameasure called distinct non-stopword accuracy.
For a given page, we refer to each unique term occurring on the page as a distinct non-stopword, and we say that it is correctly recognized if at least one of its occurrences has beencorrectly identified. Distinct non-stopword accuracy is the percentage of distinct non-stopwordsthat are correctly recognized.
It has been argued that full-text searching is resilient to OCR errors because of the inherentredundancy of text. Because a search term may occur many times within a document, it isunlikely that the OCR system will misrecognize every occurrence. Under the assumption ofindependence, if OCR-generated text has an overall non-stopword accuracy of 90%, then for aterm occurring n times, the probability that every occurrence has been misrecognized is 10-n. Acounter-argument can be put forward that an image defect that causes the OCR system tomisrecognize one occurrence may be present in every occurrence, making it considerably morelikely that every occurrence will be missed.
In Graphs 7a-7f, we show how often at least one occurrence is correctly recognized as thenumber of occurrences increases from one to four. Contrast these graphs with Graph 7g, whichillustrates the expected shape of the curves under the independence assumption.
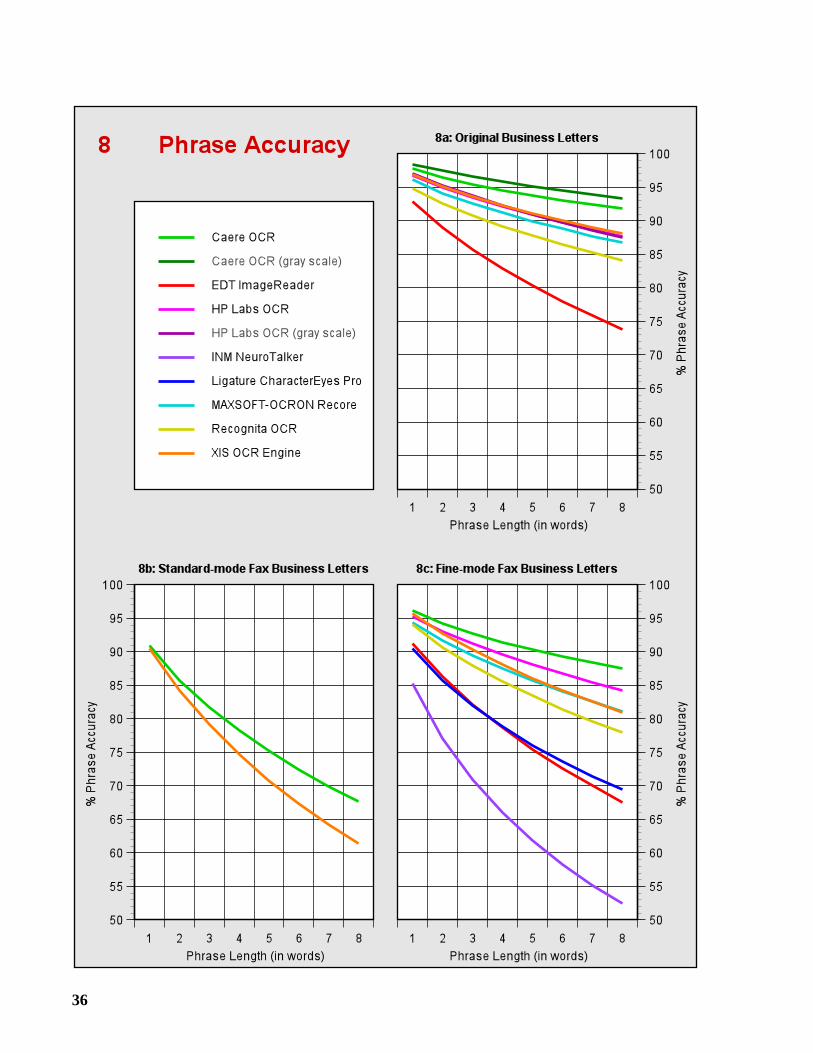
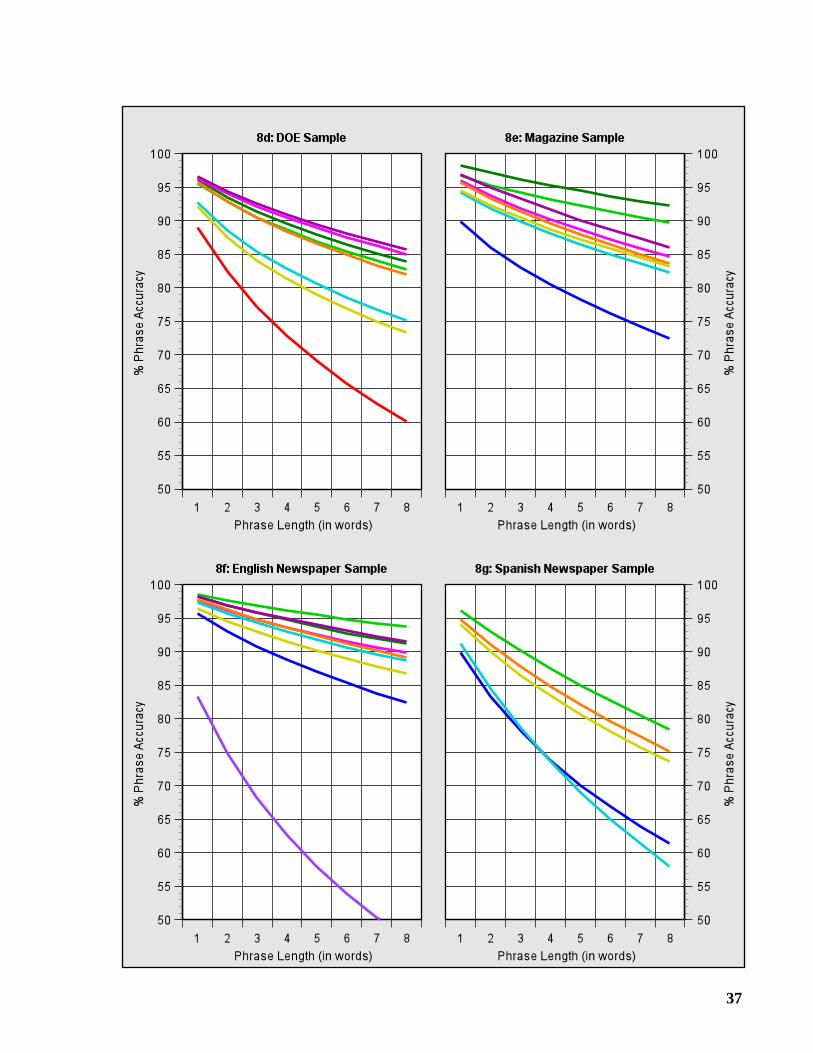
3.3 Phrase Accuracy
Users also search for documents containing specific phrases. We define a phrase of length n to beany sequence of n words. A phrase is correctly recognized if all of its words have been correctly
AR-95.book : accrep.fm 23 Fri Apr 7 11:55:18 1995
13
identified. Phrase accuracy is the percentage of phrases that are correctly recognized. Graphs8a-8g show the accuracy for phrases of lengths one through eight. Note that the phrase accuracyfor length one is equal to the word accuracy.
Phrase accuracy provides a useful measure of “error bunching.” Given two OCR systemswith the same word accuracy, the one with the lower phrase accuracy has produced errors thatare more widely dispersed throughout the text.
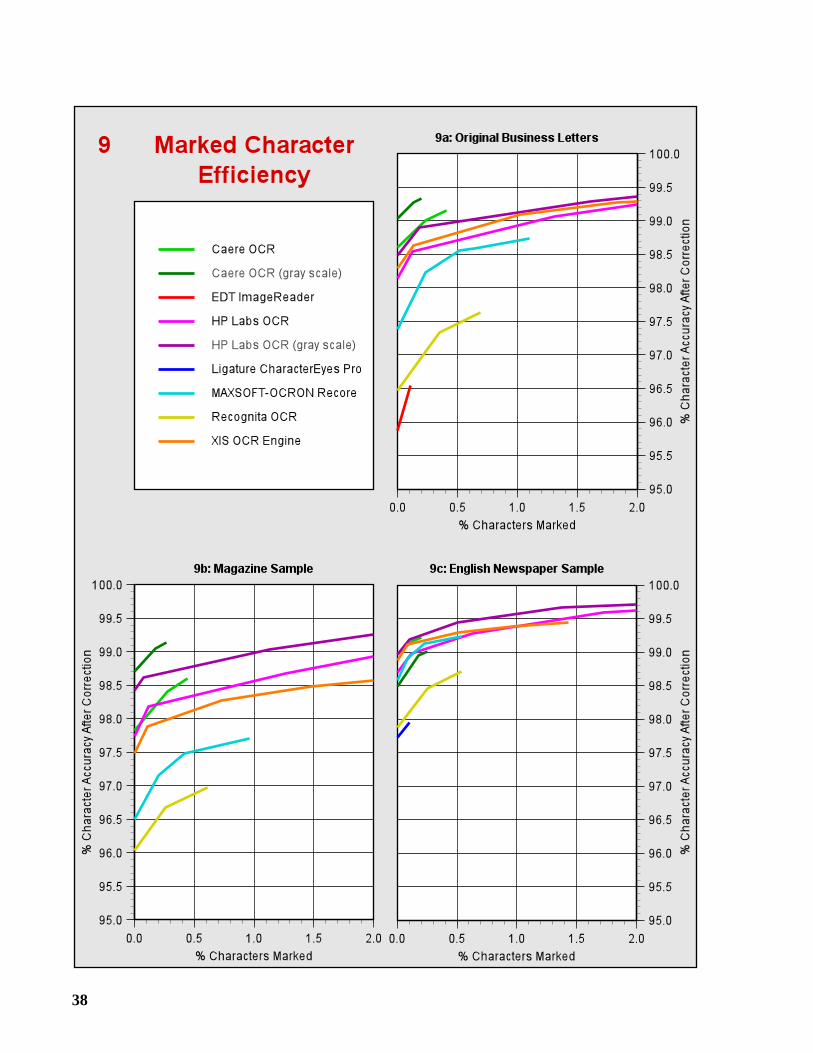
4 Marked Character Efficiency
Finding and correcting errors in OCR-generated text can be a tedious and expensive process forusers. But an OCR system provides some assistance by flagging the generated characters that itbelieves are most likely in error. A reject character (~) is placed in the output when the OCR sys-tem is unable to recognize a character. Also, the system may place asuspect marker (∧) beforeeach character that is generated with low confidence. We refer to reject characters, and charactersmarked as suspect, asmarked characters.
This sentenc~ conta∧lns reject charact~rs an∧d suspect markars.
In the above sentence, there are threemarked errors: the two reject characters and the “l” in“contains.” The second “a” in “markers” is anunmarked error. The “d” in “and” is afalsemark, which is a correctly-generated character that is marked as suspect.
In marked character efficiency, we measure the utility of the marked characters produced byan OCR system. Graphs 9a-9c display curves that show how the character accuracy of the OCR-generated text increases as a human editor examines more and more marked characters andcorrects the marked errors. Initially, this process is very efficient as the editor corrects the errorsidentified by reject characters, and then the first level of suspect markers. But as the number ofsuspect markers increases, the curves flatten due to an increasing percentage of false marks.
Marked characters make it possible for an editor to inspect only one-half of one percent ofthe OCR-generated text yet correct 20 to 45% of the errors in the text. The editor may examinemore characters than this, but the operation becomes considerably less efficient.
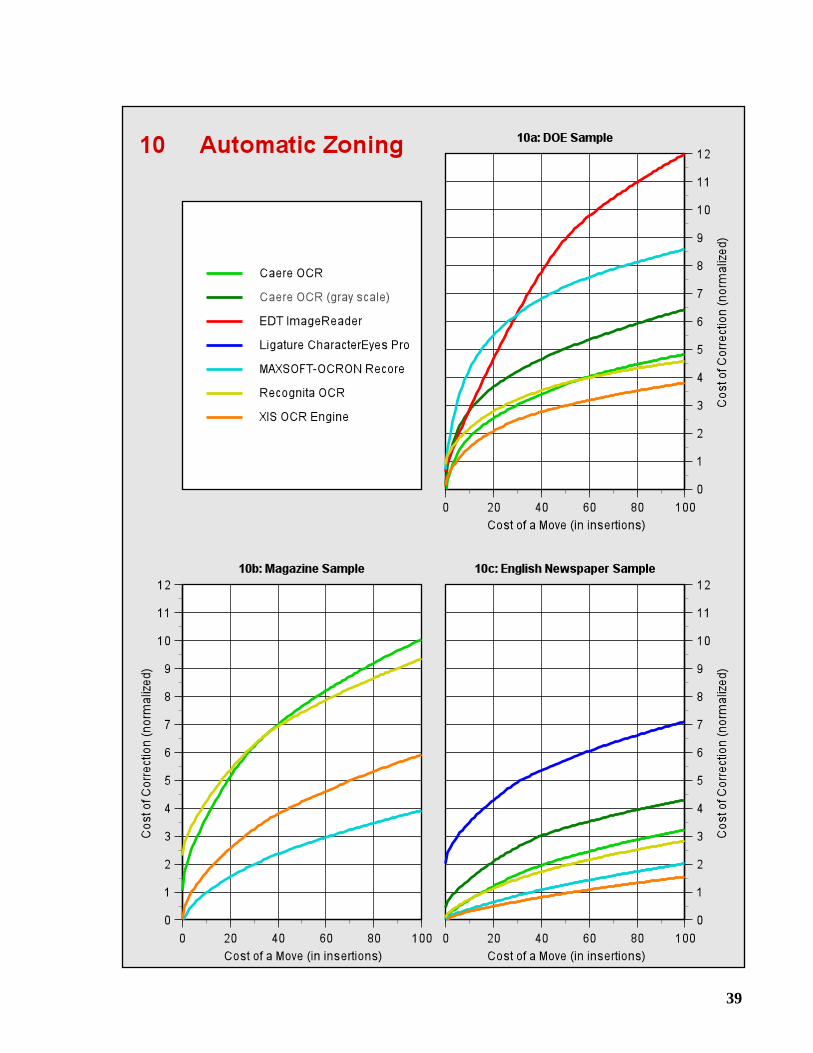
5 Automatic Zoning
In every test discussed so far, the OCR systems were given the coordinates of the text regions toprocess. In the test of automatic zoning, this information was not provided, and each system wasasked to locate the text regions, and determine their correct reading order.
To measure how well this task is performed, we apply an algorithm that estimates thenumber of character insertions and block move operations needed to correct the automaticzoning errors. If an OCR system does not find a text region, then insertions are required to enterthe missing text. If text blocks are out of order, then move operations are needed to re-orderthem. Using a conversion factor to express each move operation in terms of an equivalentnumber of insertions, the cost of correction is ultimately given solely in terms of insertions.Details of this method are presented in [Kanai 95].
AR-95.book : accrep.fm 24 Fri Apr 7 11:55:18 1995
14
Graphs 10a-10c present the results of this test. The cost of correction is plotted for a rangeof conversion factors, and has been normalized using the number of characters in each sample toallow for comparison across samples. HP Labs OCR and INM NeuroTalker do not supportautomatic zoning, and are thus missing from the graphs. The other curves that are missing aredue to excessive failures. The XIS OCR Engine performed the best overall on this test.
The cost of correction was least for the English Newspaper Sample. Since each article wasclipped from the newspaper, the OCR systems contended primarily with a headline above one ormore columns of text. But the magazine articles were not clipped, and are part of a page layoutthat may be very creative (i.e., complicated). The DOE pages presented the challenge ofdistinguishing tables from multi-column text; the OCR system should “de-columnize” the latter,but not the former.
6 Comparison of OCR Systems: Accuracy and Speed
6.1 Binary Input
The best overall accuracy on binary images was achieved by Caere OCR, HP Labs OCR, and theXIS OCR Engine. We observed no significant differences in accuracy among these systems, withone exception: HP Labs OCR was out-performed by the other two systems on the standard-modefax images.
But significant differences in speed were evident. The XIS OCR Engine was 2.3 to 4.4times faster than Caere OCR, depending on the sample. Although Caere OCR and HP LabsOCR operated on different platforms, it is apparent that the former was much faster than thelatter. When HP Labs OCR was submitted for this test, an HP Labs representative indicated thatthis version had not been optimized and was not expected to be competitive in terms of speed.
MAXSOFT-OCRON Recore and Recognita OCR comprise a second tier of systems.Although these two systems were comparable in terms of accuracy, Recognita OCR performedwith roughly twice the speed.
A third tier of systems consists of EDT ImageReader, INM NeuroTalker, and LigatureCharacterEyes Pro. An interesting feature of INM NeuroTalker is the ability to adjust the trade-off of speed versus accuracy. At the request of INM, we began to test this system using thesetting for highest accuracy (and slowest speed). But after encountering too many failures forthe system to remain in the test, at INM’s request we changed the setting to one that decreasedthe accuracy, increased the speed, and circumvented the failures. (INM attributes the failures toa faulty DOS extender that was shipped with the system.)
Since the Magazine Sample was used in the third annual test, it can serve as a yardstick tomeasure progress in the past year. Four organizations participated in both the third and fourthannual tests: Caere, EDT, Recognita, and XIS. In this year’s test, the systems from Caere andXIS made 27 to 28% fewer errors on this sample than their predecessors made a year ago. TheRecognita version made 6% more errors this year than last year. No comparison was possiblefor the EDT version because of failures.
AR-95.book : accrep.fm 25 Fri Apr 7 11:55:18 1995
15
6.2 Gray Scale Input
Caere OCR and HP Labs OCR utilize fundamentally different approaches when processing a grayscale image. HP Labs OCR first “binarizes” the image, i.e., creates a binary image from the grayscale image, and then recognizes the characters on the binary image. On the other hand, CaereOCR recognizes the characters directly from the gray scale image.
It is clear that gray scale input offers advantages over binary input in terms of accuracy.Depending on the sample, these systems produced 10 to 40% fewer errors when given grayscale input. But there was one exception: Caere OCR made substantially more errors whenprocessing the gray scale images of the English Newspaper Sample. This may have been causedby bleedthrough, which is often visible in the gray scale image of a newspaper, but mostlydisappears after the binarization process.
It appears that gray scale input was of greatest value when recognizing text printed on ashaded background, which is commonly found in the Magazine Sample. The binary image ofthis text is usually speckled and problematic, but given a gray scale image, an OCR system has amuch better chance of separating the text from its background.
Gray scale images require considerably more storage and take longer to process than binaryimages. On average, Caere OCR needed twice as much time, and HP Labs OCR needed 20%more time, to process the gray scale input.
7 Summary
Eight organizations submitted OCR systems for the fourth annual test. These systems processedbitmapped images of more than 1,500 pages of business letters, scientific documents, and maga-zine and newspaper articles. The analytic tools of the OCR Experimental Environment were usedto compare the OCR-generated text with the correct text, and compute several measures of perfor-mance. These include character, word, non-stopword, and phrase accuracy, and three new mea-sures: throughput, accuracy by character class, and distinct non-stopword accuracy. Also, theeffect of page quality was observed, the utility of marked characters was gauged, and the cost ofcorrecting automatic zoning errors was estimated.
The accuracy of the OCR systems declined dramatically when the resolution of the imageswas reduced from 300 to 200 dpi; however, little or no benefit was obtained by increasing theresolution to 400 dpi. Fax images, especially the standard-mode variety, presented a significantchallenge. The improved accuracy obtained from gray scale input demonstrates that this is animportant new direction.
With the assistance of confidence intervals, we partitioned the eight systems into three tiersbased on the accuracy results for binary input. We then noted differences in speed within tiers.This “ranking” reflects the performance of these systems on this test; their relative performancemay vary when processing other types of documents, or when processing similar documentsunder different test conditions. Finally, we wish to emphasize that ISRI does not endorse anyparticular OCR system or systems.
AR-95.book : accrep.fm 26 Fri Apr 7 11:55:18 1995
16
Acknowledgment
We acknowledge the help of Dr. Ashok Singh and Dr. George Nagy in establishing the confidenceinterval method for character accuracy. Also, “Accuracy by Character Class” was suggested byJunichi Kanai.
References
[Dudewicz 88] Edward J. Dudewicz and Satya N. Mishra. Modern Mathematical Statistics, pag-es 743-748. John Wiley & Sons, 1988.
[IDI 90] Information Dimensions, Inc., Dublin, Ohio. BASISPLUS Database Administra-tion Reference, Release L, June 1990.
[Kanai 93] Junichi Kanai, Stephen V. Rice, and Thomas A. Nartker. A preliminary evalua-tion of automatic zoning. Technical Report 93-02, Information Science ResearchInstitute, University of Nevada, Las Vegas, April 1993.
[Kanai 95] Junichi Kanai, Stephen V. Rice, Thomas A. Nartker, and George Nagy. Automat-ed evaluation of OCR zoning. IEEE Transactions on Pattern Analysis and Ma-chine Intelligence 17(1):86-90, January 1995.
[Nartker 94a] Thomas A. Nartker, Stephen V. Rice, and Junichi Kanai. OCR accuracy:UNLV’s second annual test. Inform, Association for Information and ImageManagement. 8(1):40+, January 1994.
[Nartker 94b] Thomas A. Nartker and Stephen V. Rice. OCR accuracy: UNLV’s third annualtest. Inform, Association for Information and Image Management. 8(8):30+, Sep-tember 1994.
[Rice 92] Stephen V. Rice, Junichi Kanai, and Thomas A. Nartker. A report on the accuracyof OCR devices. Technical Report 92-02, Information Science Research Insti-tute, University of Nevada, Las Vegas, March 1992.
[Rice 93a] Stephen V. Rice, Junichi Kanai, and Thomas A. Nartker. An evaluation of OCRaccuracy. Technical Report 93-01, Information Science Research Institute, Uni-versity of Nevada, Las Vegas, April 1993.
[Rice 93b] Stephen V. Rice. The OCR experimental environment, version 3. Technical Re-port 93-04, Information Science Research Institute, University of Nevada, LasVegas, April 1993.
[Rice 94] Stephen V. Rice, Junichi Kanai, and Thomas A. Nartker. The third annual test ofOCR accuracy. Technical Report 94-03, Information Science Research Institute,University of Nevada, Las Vegas, April 1994.
[Ukkonen 85] Esko Ukkonen. Algorithms for approximate string matching. Information andControl 64:100-118, 1985.
17
18
19
20
21
22
��
�
�
�
�
�
��
�
�
�
�
�
�
�
�
�
23
�
�
�
�
�
�
��
�
�
�
�
�
�
�
�
�
�
�
�
�
��
�
�
��
� �
�
24
25
26
27
28
29
30
31
32
33
34
35
36
37
38
39