Embed Size (px)
Citation preview
The Fukushima Nuclear Power Plant accident and exposuresin the environment
Keiichi Akahane • Shunsuke Yonai • Shigekazu Fukuda •
Nobuyuki Miyahara • Hiroshi Yasuda • Kazuki Iwaoka •
Masaki Matsumoto • Akifumi Fukumura • Makoto Akashi
Published online: 17 January 2012
� Springer Science+Business Media, LLC 2012
Abstract The Great East Japan Earthquake has occurred
on March 11, 2011, in the Tohoku District of Japan. Due to
the earthquake, big tsunamis were induced, and they rushed
to the Fukushima Nuclear Power Stations, causing severe
accidents. Radioactive materials including I-131, Cs-137
and so on were emitted from the plant to the environment.
The Japanese government, Fukushima prefectural govern-
ment and other local governments have struggled against
the accidents. The restricted area and deliberate evacuation
area are set by the government, and the residents are
evacuated. The dose rates in and around Fukushima Pre-
fecture have been monitored by the governments and other
involved organizations. Fukushima government has started
the health management survey for all residents in Fuku-
shima Prefecture including the questions on their activities
for the estimations of their external doses.
Keywords Fukushima � Earthquake � Nuclear accident �Radiation exposure
1 The Great East Japan Earthquake
The Great East Japan Earthquake occurred at 14:46 on
March 11, 2011, in the Tohoku District of Japan, causing
severe damages to the area and the residents. The magni-
tude of the earthquake was estimated to be 9.0, which is the
highest recorded in the history of Japan. Until September
16, 2011, the number of death was 15,790; 4,056 persons
were missing; and 5,933 were wounded. Because of the
damages, many residents in Fukushima had to evacuate
from the area after the earthquake.
Due to the earthquake, big tsunamis occurred and rushed
to the coast of Fukushima, breaking and washing out many
persons, homes, buildings and many other things. The
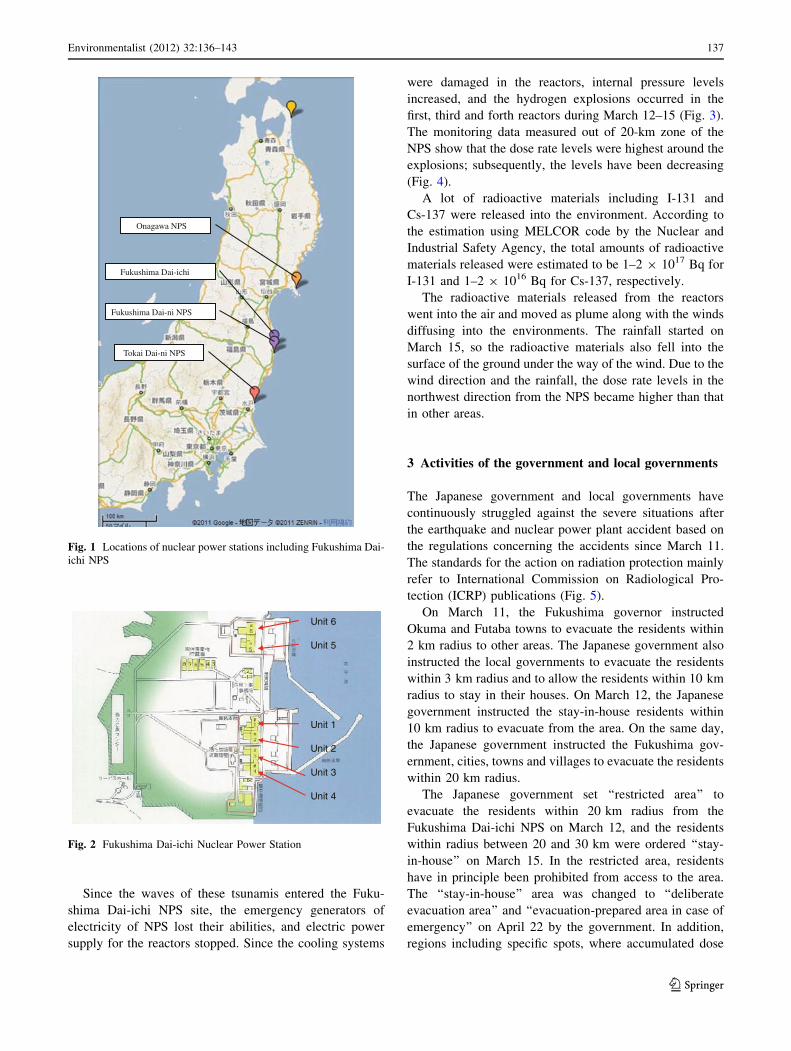
Fukushima Dai-ichi Nuclear Power Stations located in the
towns of Okuma and Futaba near the coast (Fig. 1) were
also attacked by the tsunamis, and the external power
supplies for the nuclear power stations (NPS) were dam-
aged by these tsunamis. Subsequent accidents in the
buildings of the reactors emitted radioactive materials to
the environment.
The Japanese government has submitted two reports on
the accident at Fukushima Nuclear Power Stations to
International Atomic Energy Agency (IAEA) in June and
September 2011a, b. This article basically refers to the two
reports and some other sources. Some more recent data
were added.
2 Fukushima Nuclear Power Stations
There were 17 nuclear power plants in 13 prefectures in
Japan as of January 1, 2011, producing 48.847 million kW
electricity from 54 reactors. In Fukushima Prefecture, 10
boiling water reactors (BWR) were operated in 3 plants as
of January 1, 2011. The Fukushima Dai-ichi power plant is
one of them and has 4 BWRs (Fig. 2). After the earth-
quake, the first big tsunami reached the coast from the sea
at 15:27, 41 min after the earthquake, and the second wave
reached the Fukushima Dai-ichi Nuclear Power Stations
(NPS) at 15:35.
K. Akahane (&) � S. Yonai � S. Fukuda � N. Miyahara �H. Yasuda � K. Iwaoka � M. Matsumoto �A. Fukumura � M. Akashi
National Institute of Radiological Sciences (NIRS),
4-9-1, Anagawa, Inage-ku 263-8555, Chiba-shi, Japan
e-mail: [email protected]
123
Environmentalist (2012) 32:136–143
DOI 10.1007/s10669-011-9381-2
Since the waves of these tsunamis entered the Fuku-
shima Dai-ichi NPS site, the emergency generators of
electricity of NPS lost their abilities, and electric power
supply for the reactors stopped. Since the cooling systems
were damaged in the reactors, internal pressure levels
increased, and the hydrogen explosions occurred in the
first, third and forth reactors during March 12–15 (Fig. 3).
The monitoring data measured out of 20-km zone of the
NPS show that the dose rate levels were highest around the
explosions; subsequently, the levels have been decreasing
(Fig. 4).
A lot of radioactive materials including I-131 and
Cs-137 were released into the environment. According to
the estimation using MELCOR code by the Nuclear and
Industrial Safety Agency, the total amounts of radioactive
materials released were estimated to be 1–2 9 1017 Bq for
I-131 and 1–2 9 1016 Bq for Cs-137, respectively.
The radioactive materials released from the reactors
went into the air and moved as plume along with the winds
diffusing into the environments. The rainfall started on
March 15, so the radioactive materials also fell into the
surface of the ground under the way of the wind. Due to the
wind direction and the rainfall, the dose rate levels in the
northwest direction from the NPS became higher than that
in other areas.
3 Activities of the government and local governments
The Japanese government and local governments have
continuously struggled against the severe situations after
the earthquake and nuclear power plant accident based on
the regulations concerning the accidents since March 11.
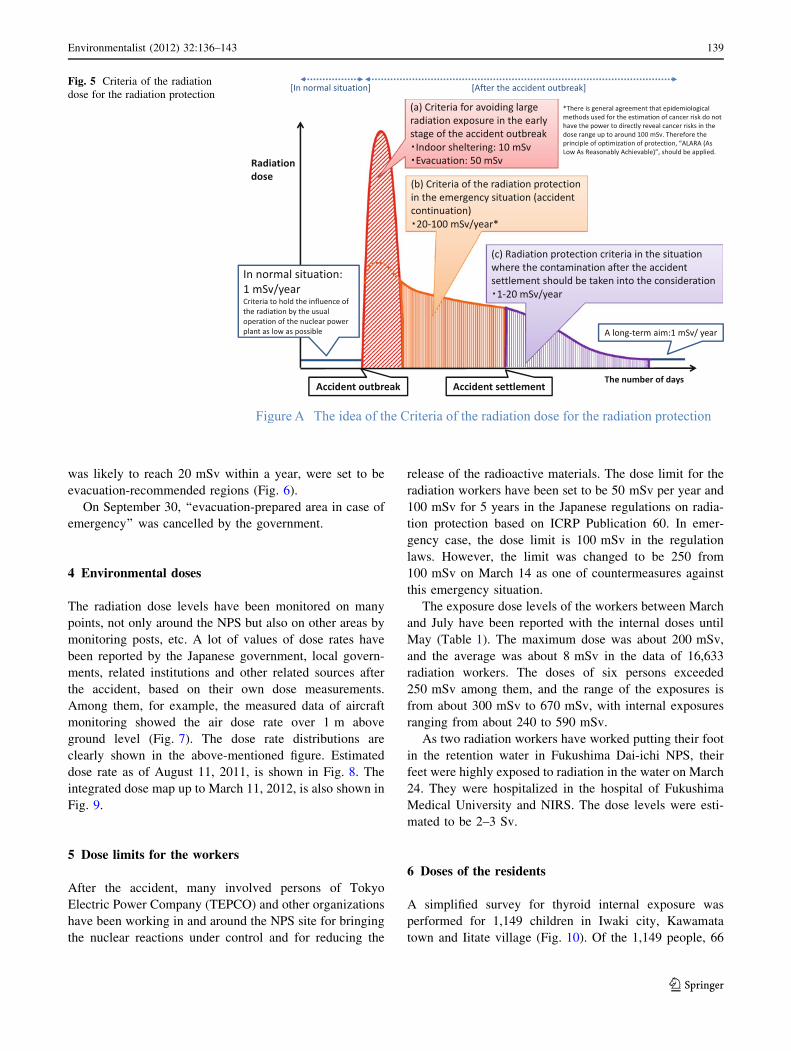
The standards for the action on radiation protection mainly
refer to International Commission on Radiological Pro-
tection (ICRP) publications (Fig. 5).
On March 11, the Fukushima governor instructed
Okuma and Futaba towns to evacuate the residents within
2 km radius to other areas. The Japanese government also
instructed the local governments to evacuate the residents
within 3 km radius and to allow the residents within 10 km
radius to stay in their houses. On March 12, the Japanese
government instructed the stay-in-house residents within
10 km radius to evacuate from the area. On the same day,
the Japanese government instructed the Fukushima gov-
ernment, cities, towns and villages to evacuate the residents
within 20 km radius.
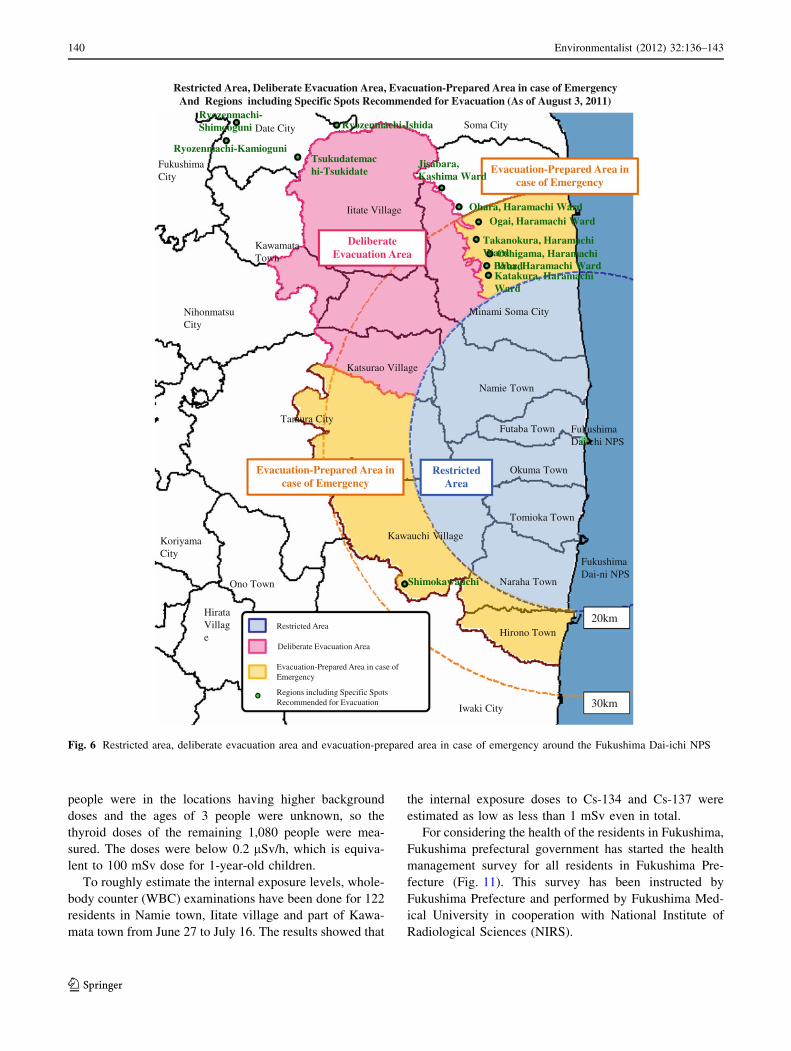
The Japanese government set ‘‘restricted area’’ to
evacuate the residents within 20 km radius from the
Fukushima Dai-ichi NPS on March 12, and the residents
within radius between 20 and 30 km were ordered ‘‘stay-
in-house’’ on March 15. In the restricted area, residents
have in principle been prohibited from access to the area.
The ‘‘stay-in-house’’ area was changed to ‘‘deliberate
evacuation area’’ and ‘‘evacuation-prepared area in case of
emergency’’ on April 22 by the government. In addition,
regions including specific spots, where accumulated dose
Tokai Dai-ni NPS
Fukushima Dai-ni NPS
Fukushima Dai-ichi
Onagawa NPS
Fig. 1 Locations of nuclear power stations including Fukushima Dai-
ichi NPS
Unit 4
Unit 3
Unit 2
Unit 1
Unit 5
Unit 6
Fig. 2 Fukushima Dai-ichi Nuclear Power Station
Environmentalist (2012) 32:136–143 137
123
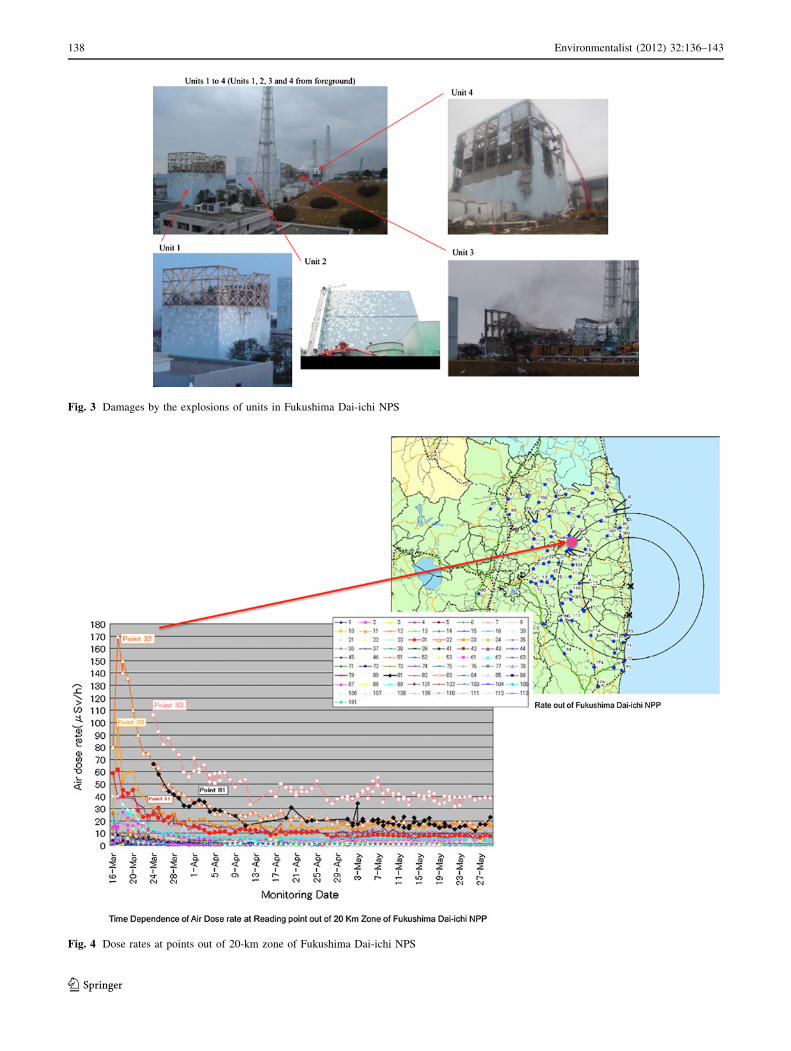
Fig. 3 Damages by the explosions of units in Fukushima Dai-ichi NPS
Fig. 4 Dose rates at points out of 20-km zone of Fukushima Dai-ichi NPS
138 Environmentalist (2012) 32:136–143
123
was likely to reach 20 mSv within a year, were set to be
evacuation-recommended regions (Fig. 6).
On September 30, ‘‘evacuation-prepared area in case of
emergency’’ was cancelled by the government.
4 Environmental doses
The radiation dose levels have been monitored on many
points, not only around the NPS but also on other areas by
monitoring posts, etc. A lot of values of dose rates have
been reported by the Japanese government, local govern-
ments, related institutions and other related sources after
the accident, based on their own dose measurements.
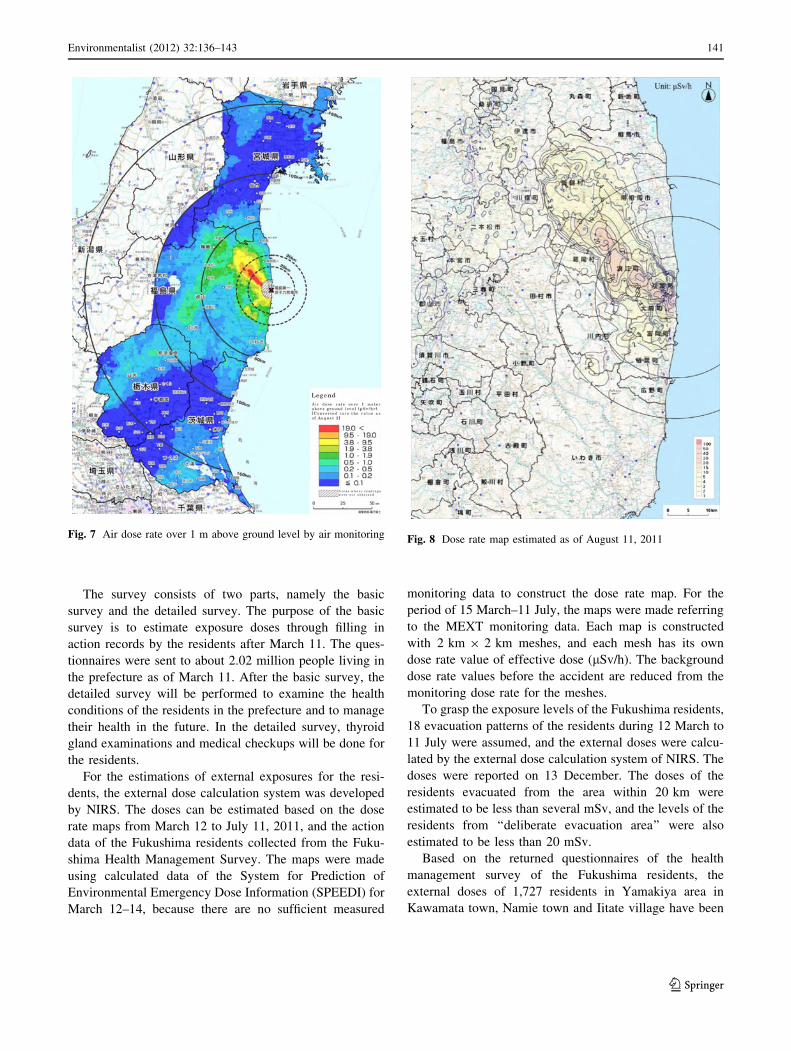
Among them, for example, the measured data of aircraft
monitoring showed the air dose rate over 1 m above
ground level (Fig. 7). The dose rate distributions are
clearly shown in the above-mentioned figure. Estimated
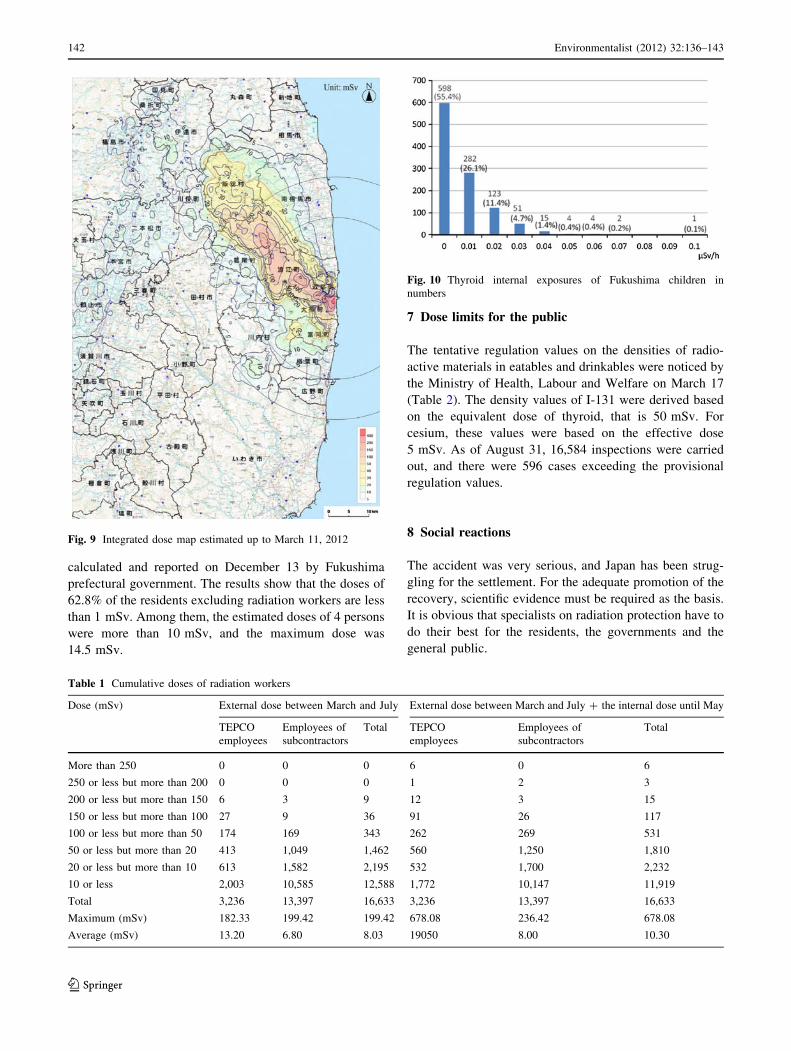
dose rate as of August 11, 2011, is shown in Fig. 8. The
integrated dose map up to March 11, 2012, is also shown in
Fig. 9.
5 Dose limits for the workers
After the accident, many involved persons of Tokyo
Electric Power Company (TEPCO) and other organizations
have been working in and around the NPS site for bringing
the nuclear reactions under control and for reducing the
release of the radioactive materials. The dose limit for the
radiation workers have been set to be 50 mSv per year and
100 mSv for 5 years in the Japanese regulations on radia-
tion protection based on ICRP Publication 60. In emer-
gency case, the dose limit is 100 mSv in the regulation
laws. However, the limit was changed to be 250 from
100 mSv on March 14 as one of countermeasures against
this emergency situation.
The exposure dose levels of the workers between March
and July have been reported with the internal doses until
May (Table 1). The maximum dose was about 200 mSv,
and the average was about 8 mSv in the data of 16,633
radiation workers. The doses of six persons exceeded
250 mSv among them, and the range of the exposures is
from about 300 mSv to 670 mSv, with internal exposures
ranging from about 240 to 590 mSv.
As two radiation workers have worked putting their foot
in the retention water in Fukushima Dai-ichi NPS, their
feet were highly exposed to radiation in the water on March
24. They were hospitalized in the hospital of Fukushima
Medical University and NIRS. The dose levels were esti-
mated to be 2–3 Sv.
6 Doses of the residents
A simplified survey for thyroid internal exposure was
performed for 1,149 children in Iwaki city, Kawamata
town and Iitate village (Fig. 10). Of the 1,149 people, 66
Fig. 5 Criteria of the radiation
dose for the radiation protection
Environmentalist (2012) 32:136–143 139
123
people were in the locations having higher background
doses and the ages of 3 people were unknown, so the
thyroid doses of the remaining 1,080 people were mea-
sured. The doses were below 0.2 lSv/h, which is equiva-
lent to 100 mSv dose for 1-year-old children.
To roughly estimate the internal exposure levels, whole-
body counter (WBC) examinations have been done for 122
residents in Namie town, Iitate village and part of Kawa-
mata town from June 27 to July 16. The results showed that
the internal exposure doses to Cs-134 and Cs-137 were
estimated as low as less than 1 mSv even in total.
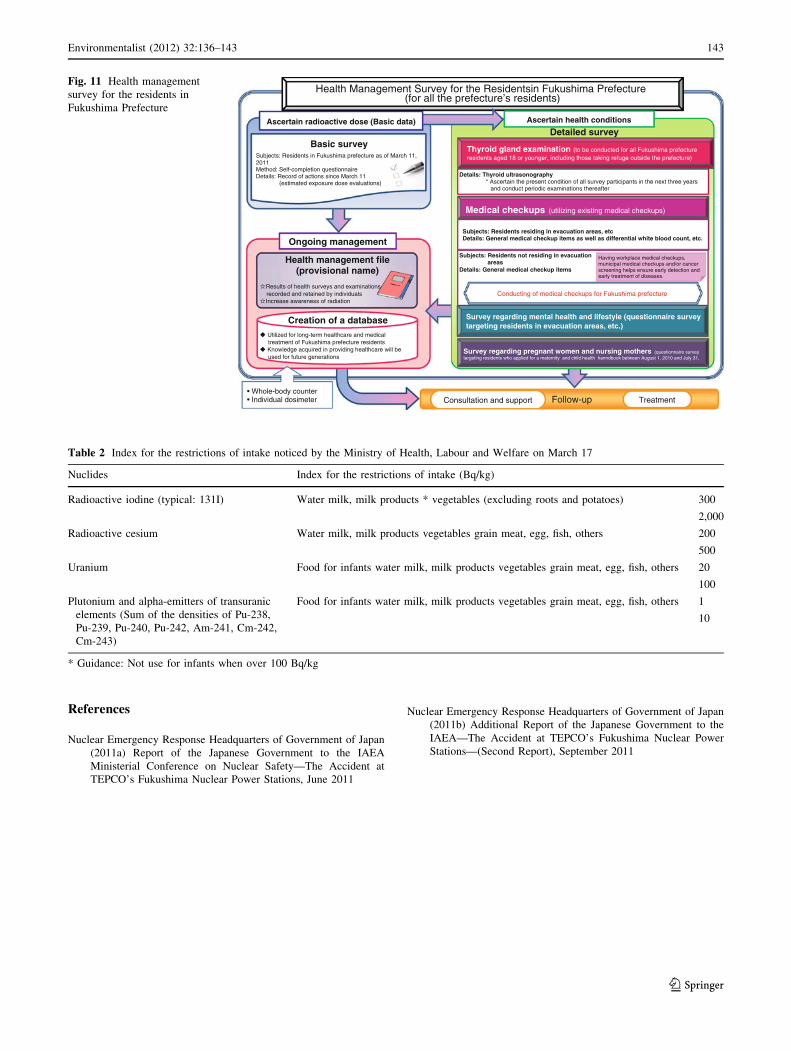
For considering the health of the residents in Fukushima,
Fukushima prefectural government has started the health
management survey for all residents in Fukushima Pre-
fecture (Fig. 11). This survey has been instructed by
Fukushima Prefecture and performed by Fukushima Med-
ical University in cooperation with National Institute of
Radiological Sciences (NIRS).
Minami Soma City
Iitate Village
Namie Town
Katsurao Village
Futaba Town
Okuma Town
Tomioka Town
Naraha Town
Hirono Town
Kawauchi Village
Tamura City
Kawamata Town
Date City
Iwaki City
Ono Town
Hirata Village
Nihonmatsu City
Soma City
Fukushima City
Koriyama City
Ryozenmachi-KamioguniTsukudatemachi-Tsukidate
Ryozenmachi-Ishida
Ohara, Haramachi WardOgai, Haramachi Ward
Takanokura, Haramachi Ward
Baba, Haramachi WardKatakura, Haramachi Ward
Oshigama, Haramachi Ward
Shimokawauchi
Deliberate Evacuation Area
Evacuation-Prepared Area in case of Emergency
Restricted Area
Regions including Specific Spots Recommended for Evacuation
Deliberate Evacuation Area
Evacuation-Prepared Area in case of Emergency
Evacuation-Prepared Area in case of Emergency
Restricted Area
Fukushima Dai-chi NPS
Fukushima Dai-ni NPS
20km
30km
Restricted Area, Deliberate Evacuation Area, Evacuation-Prepared Area in case of Emergency And Regions including Specific Spots Recommended for Evacuation (As of August 3, 2011)
Jisabara, Kashima Ward
Ryozenmachi-Shimooguni
Fig. 6 Restricted area, deliberate evacuation area and evacuation-prepared area in case of emergency around the Fukushima Dai-ichi NPS
140 Environmentalist (2012) 32:136–143
123
The survey consists of two parts, namely the basic
survey and the detailed survey. The purpose of the basic
survey is to estimate exposure doses through filling in
action records by the residents after March 11. The ques-
tionnaires were sent to about 2.02 million people living in
the prefecture as of March 11. After the basic survey, the
detailed survey will be performed to examine the health
conditions of the residents in the prefecture and to manage
their health in the future. In the detailed survey, thyroid
gland examinations and medical checkups will be done for
the residents.
For the estimations of external exposures for the resi-
dents, the external dose calculation system was developed
by NIRS. The doses can be estimated based on the dose
rate maps from March 12 to July 11, 2011, and the action
data of the Fukushima residents collected from the Fuku-
shima Health Management Survey. The maps were made
using calculated data of the System for Prediction of
Environmental Emergency Dose Information (SPEEDI) for
March 12–14, because there are no sufficient measured
monitoring data to construct the dose rate map. For the
period of 15 March–11 July, the maps were made referring
to the MEXT monitoring data. Each map is constructed
with 2 km 9 2 km meshes, and each mesh has its own
dose rate value of effective dose (lSv/h). The background
dose rate values before the accident are reduced from the
monitoring dose rate for the meshes.
To grasp the exposure levels of the Fukushima residents,
18 evacuation patterns of the residents during 12 March to
11 July were assumed, and the external doses were calcu-
lated by the external dose calculation system of NIRS. The
doses were reported on 13 December. The doses of the
residents evacuated from the area within 20 km were
estimated to be less than several mSv, and the levels of the
residents from ‘‘deliberate evacuation area’’ were also
estimated to be less than 20 mSv.
Based on the returned questionnaires of the health
management survey of the Fukushima residents, the
external doses of 1,727 residents in Yamakiya area in
Kawamata town, Namie town and Iitate village have been
Fig. 7 Air dose rate over 1 m above ground level by air monitoring Fig. 8 Dose rate map estimated as of August 11, 2011
Environmentalist (2012) 32:136–143 141
123
calculated and reported on December 13 by Fukushima
prefectural government. The results show that the doses of
62.8% of the residents excluding radiation workers are less
than 1 mSv. Among them, the estimated doses of 4 persons
were more than 10 mSv, and the maximum dose was
14.5 mSv.
7 Dose limits for the public
The tentative regulation values on the densities of radio-
active materials in eatables and drinkables were noticed by
the Ministry of Health, Labour and Welfare on March 17
(Table 2). The density values of I-131 were derived based
on the equivalent dose of thyroid, that is 50 mSv. For
cesium, these values were based on the effective dose
5 mSv. As of August 31, 16,584 inspections were carried
out, and there were 596 cases exceeding the provisional
regulation values.
8 Social reactions
The accident was very serious, and Japan has been strug-
gling for the settlement. For the adequate promotion of the
recovery, scientific evidence must be required as the basis.
It is obvious that specialists on radiation protection have to
do their best for the residents, the governments and the
general public.
Fig. 9 Integrated dose map estimated up to March 11, 2012
Table 1 Cumulative doses of radiation workers
Dose (mSv) External dose between March and July External dose between March and July ? the internal dose until May
TEPCO
employees
Employees of
subcontractors
Total TEPCO
employees
Employees of
subcontractors
Total
More than 250 0 0 0 6 0 6
250 or less but more than 200 0 0 0 1 2 3
200 or less but more than 150 6 3 9 12 3 15
150 or less but more than 100 27 9 36 91 26 117
100 or less but more than 50 174 169 343 262 269 531
50 or less but more than 20 413 1,049 1,462 560 1,250 1,810
20 or less but more than 10 613 1,582 2,195 532 1,700 2,232
10 or less 2,003 10,585 12,588 1,772 10,147 11,919
Total 3,236 13,397 16,633 3,236 13,397 16,633
Maximum (mSv) 182.33 199.42 199.42 678.08 236.42 678.08
Average (mSv) 13.20 6.80 8.03 19050 8.00 10.30
Fig. 10 Thyroid internal exposures of Fukushima children in
numbers
142 Environmentalist (2012) 32:136–143
123
References
Nuclear Emergency Response Headquarters of Government of Japan
(2011a) Report of the Japanese Government to the IAEA
Ministerial Conference on Nuclear Safety—The Accident at
TEPCO’s Fukushima Nuclear Power Stations, June 2011
Nuclear Emergency Response Headquarters of Government of Japan
(2011b) Additional Report of the Japanese Government to the
IAEA—The Accident at TEPCO’s Fukushima Nuclear Power
Stations—(Second Report), September 2011
Health Management Survey for the Residentsin Fukushima Prefecture (for all the prefecture’s residents)
Basic survey
Ascertain health conditions
Subjects: Residents in Fukushima prefecture as of March 11, 2011Method: Self-completion questionnaire Details: Record of actions since March 11
(estimated exposure dose evaluations)Details: Thyroid ultrasonography
* Ascertain the present condition of all survey participants in the next three yearsand conduct periodic examinations thereafter
Thyroid gland examination (to be conducted for all Fukushima prefecture residents aged 18 or younger, including those taking refuge outside the prefecture)
Subjects: Residents not residing in evacuation areas
Details: General medical checkup items
Having workplace medical checkups, municipal medical checkups and/or cancer screening helps ensure early detection and early treatment of diseases.
Conducting of medical checkups for Fukushima prefecture
Subjects: Residents residing in evacuation areas, etcDetails: General medical checkup items as well as differential white blood count, etc.
Detailed survey
Creation of a databaseUtilized for long-term healthcare and medicaltreatment of Fukushima prefecture residentsKnowledge acquired in providing healthcare will beused for future generations
Ongoing management
Results of health surveys and examinations recorded and retained by individualsIncrease awareness of radiation
Follow-up• Whole-body counter• Individual dosimeter
Ascertain radioactive dose (Basic data)
Medical checkups (utilizing existing medical checkups)
Consultation and support Treatment
Health management file(provisional name)
Survey regarding pregnant women and nursing mothers (questionnaire survey targeting residents who applied for a maternity and child health hanndbook between August 1, 2010 and July 31,
Survey regarding mental health and lifestyle (questionnaire survey targeting residents in evacuation areas, etc.)
Fig. 11 Health management
survey for the residents in
Fukushima Prefecture
Table 2 Index for the restrictions of intake noticed by the Ministry of Health, Labour and Welfare on March 17
Nuclides Index for the restrictions of intake (Bq/kg)
Radioactive iodine (typical: 131I) Water milk, milk products * vegetables (excluding roots and potatoes) 300
2,000
Radioactive cesium Water milk, milk products vegetables grain meat, egg, fish, others 200
500
Uranium Food for infants water milk, milk products vegetables grain meat, egg, fish, others 20
100
Plutonium and alpha-emitters of transuranic
elements (Sum of the densities of Pu-238,
Pu-239, Pu-240, Pu-242, Am-241, Cm-242,
Cm-243)
Food for infants water milk, milk products vegetables grain meat, egg, fish, others 1
10
* Guidance: Not use for infants when over 100 Bq/kg
Environmentalist (2012) 32:136–143 143
123