Embed Size (px)
Citation preview
The Future of Energy: Toward the 21st Century Energy System We Need (With an Eye on the Rear View Mirror)
Sue Tierney Analysis Group, Boston, MA Department of Energy “Energy All Stars” Day, Washington, D.C. – January 19, 2013
Page 2
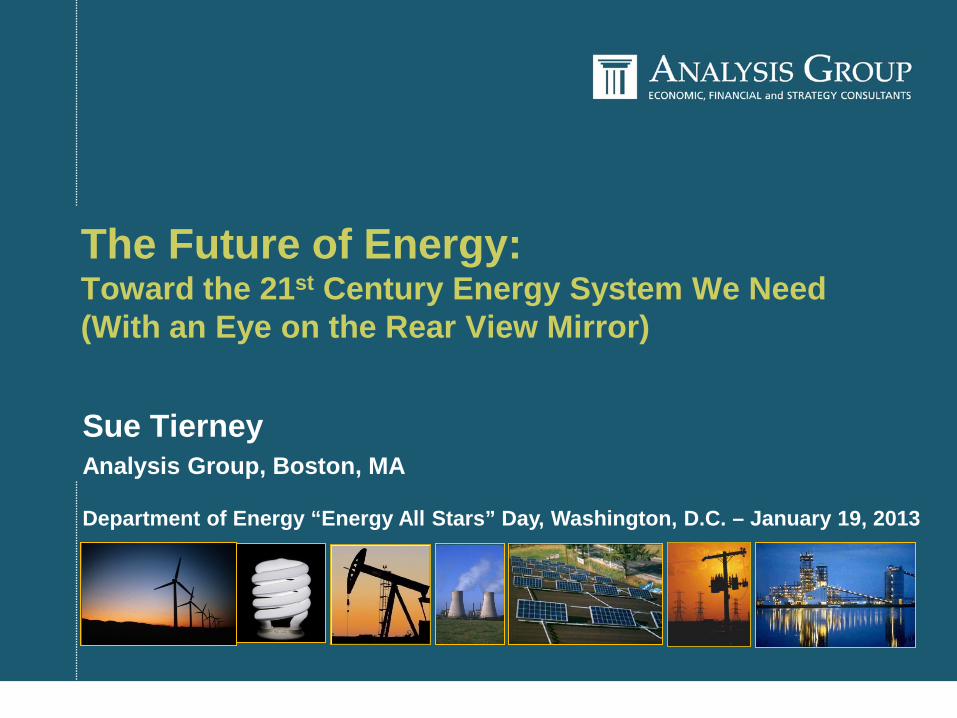
My story: Redlands, CA, c.1955 – at the foot of 11,500’ mountains
Page 3
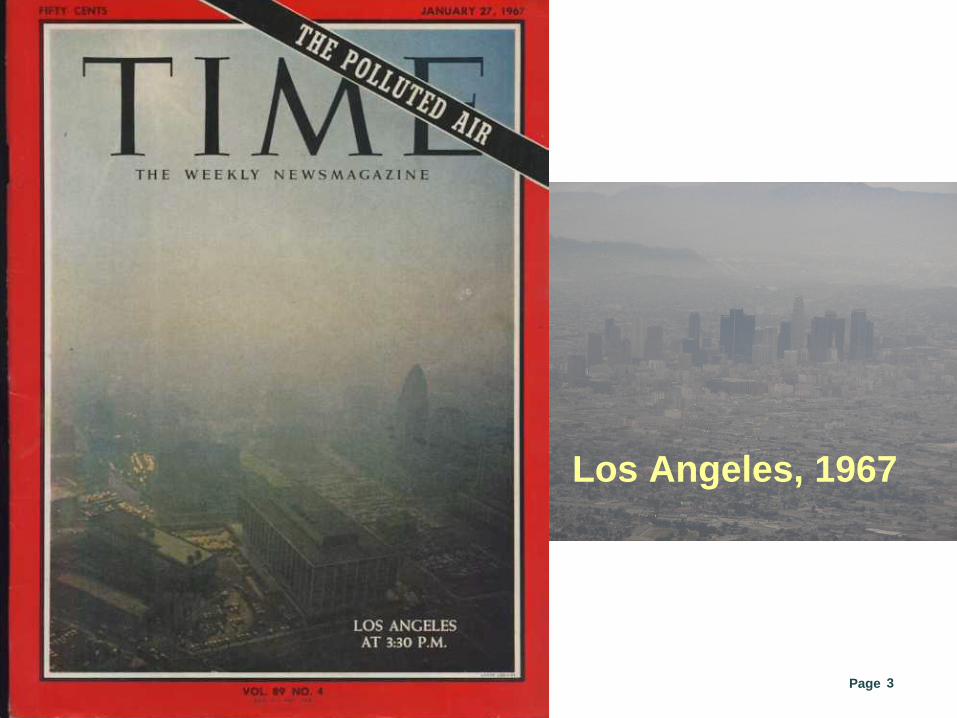
Los Angeles, 1967
Page 4
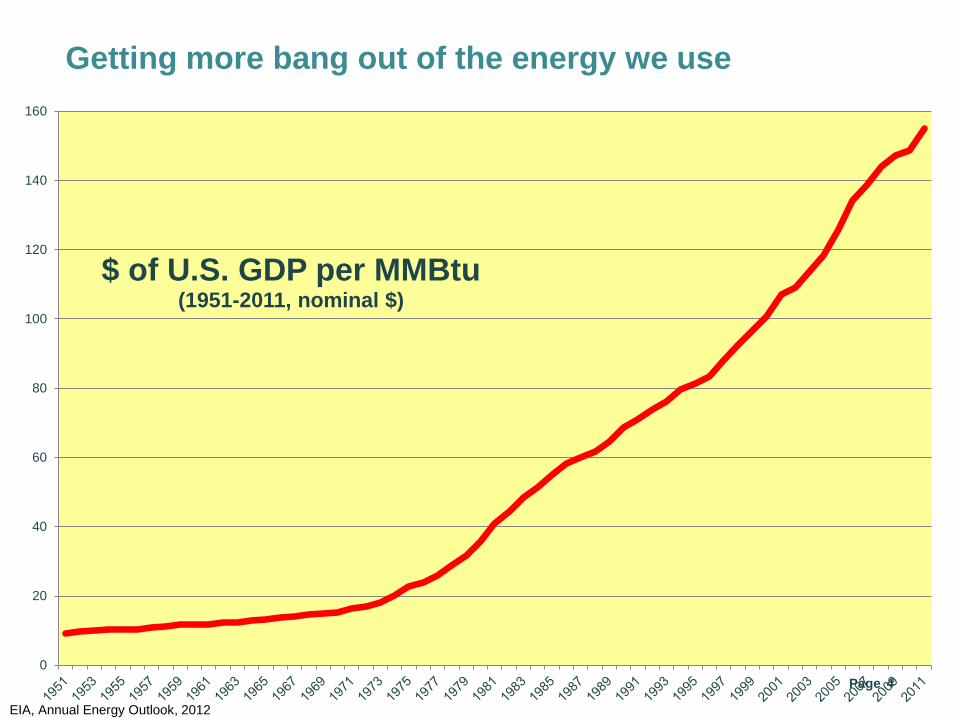
Getting more bang out of the energy we use
0
20
40
60
80
100
120
140
160
$ of U.S. GDP per MMBtu (1951-2011, nominal $)
EIA, Annual Energy Outlook, 2012
Page 5
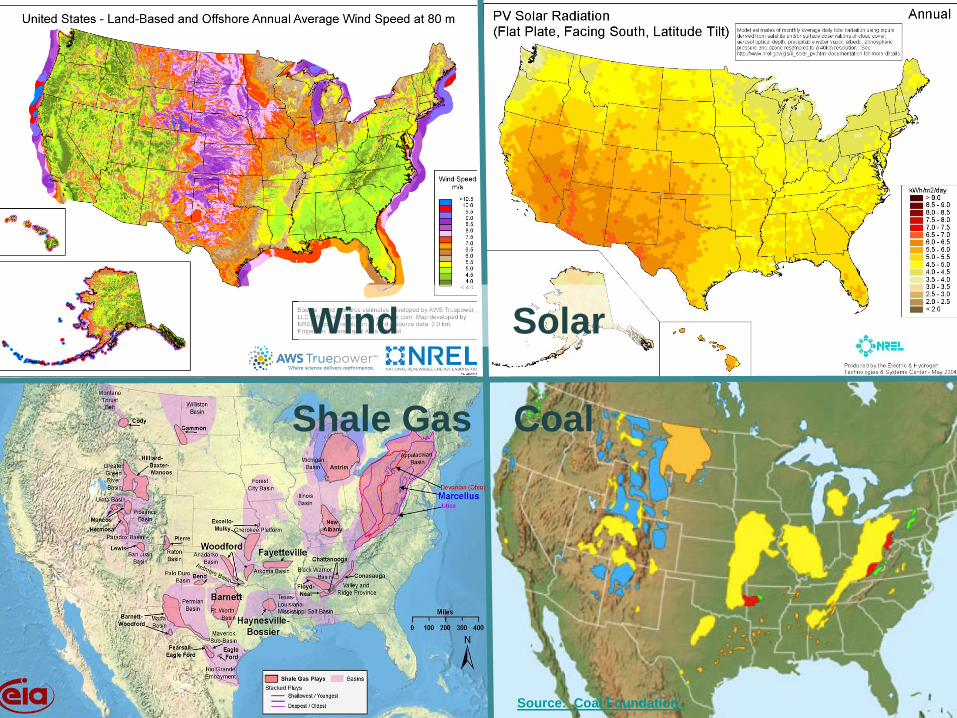
Source: Coal Foundation.
Shale Gas Coal
Wind Solar
Page 6
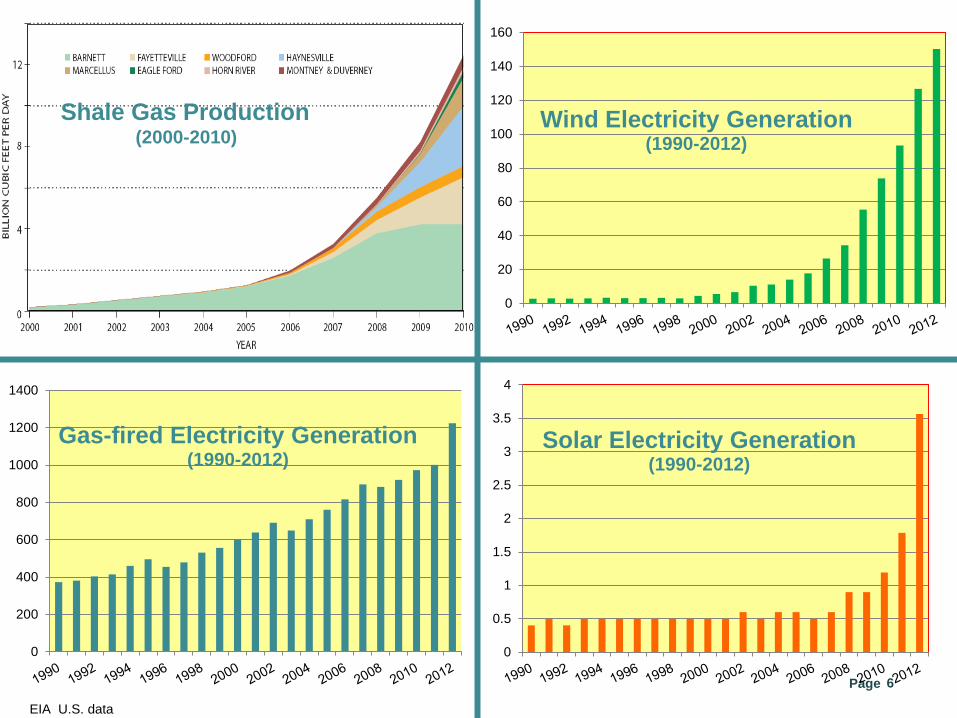
EIA U.S. data
0
20
40
60
80
100
120
140
160
Wind Electricity Generation (1990-2012)
0
0.5
1
1.5
2
2.5
3
3.5
4
Solar Electricity Generation (1990-2012)
Shale Gas Production (2000-2010)
0
200
400
600
800
1000
1200
1400
Gas-fired Electricity Generation (1990-2012)
Page 7
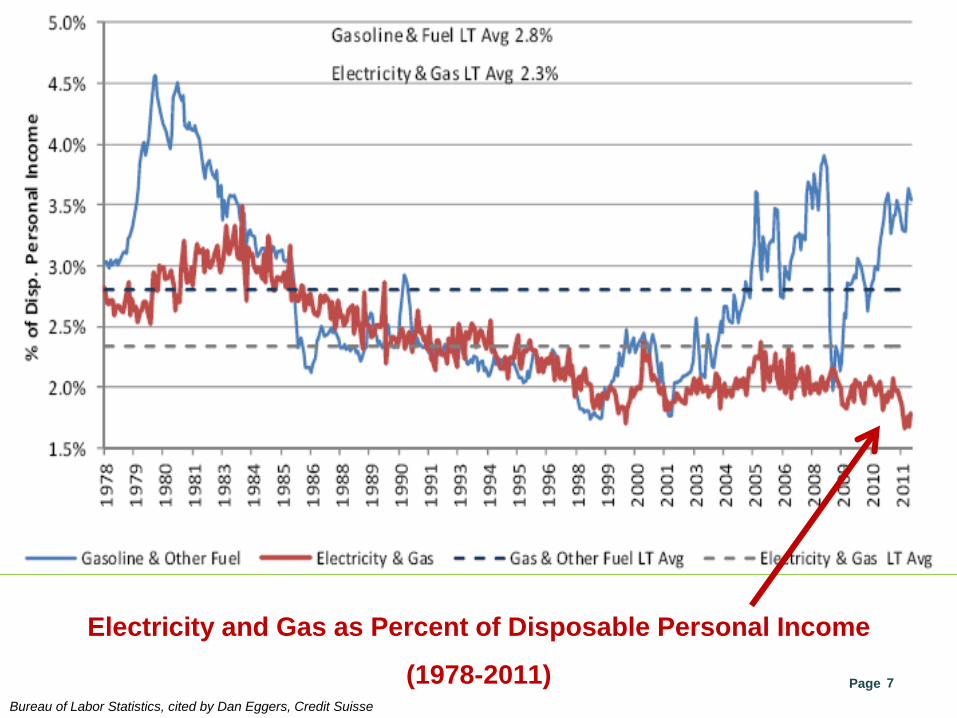
Electricity and Gas as Percent of Disposable Personal Income
(1978-2011) Bureau of Labor Statistics, cited by Dan Eggers, Credit Suisse
Page 8
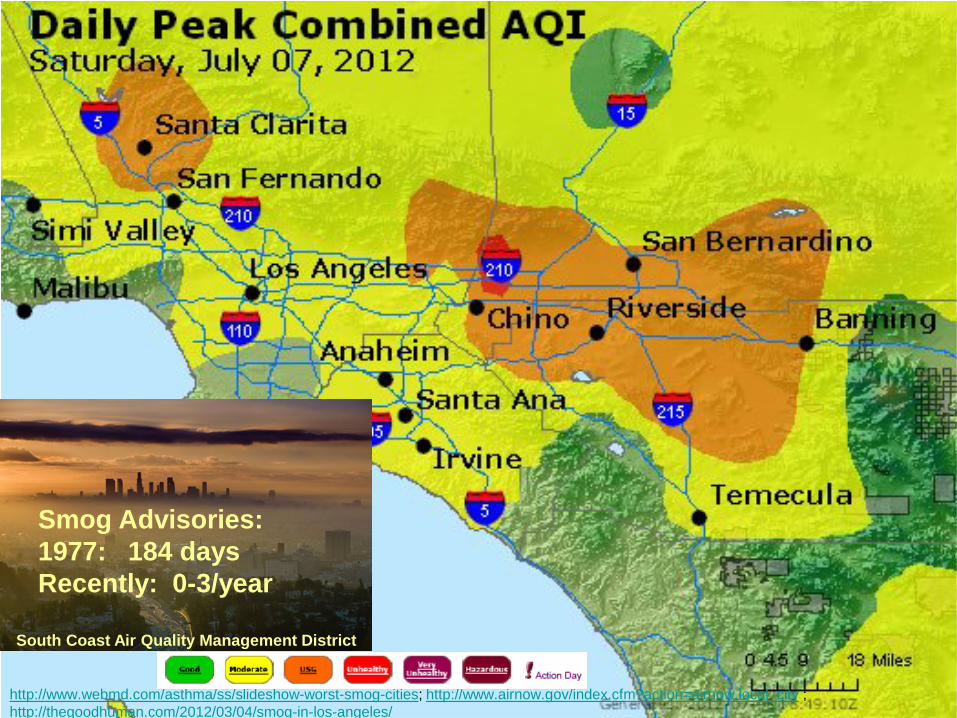
http://www.webmd.com/asthma/ss/slideshow-worst-smog-cities; http://www.airnow.gov/index.cfm?action=airnow.local_city ; http://thegoodhuman.com/2012/03/04/smog-in-los-angeles/
Smog Advisories: 1977: 184 days Recently: 0-3/year South Coast Air Quality Management District
Page 9
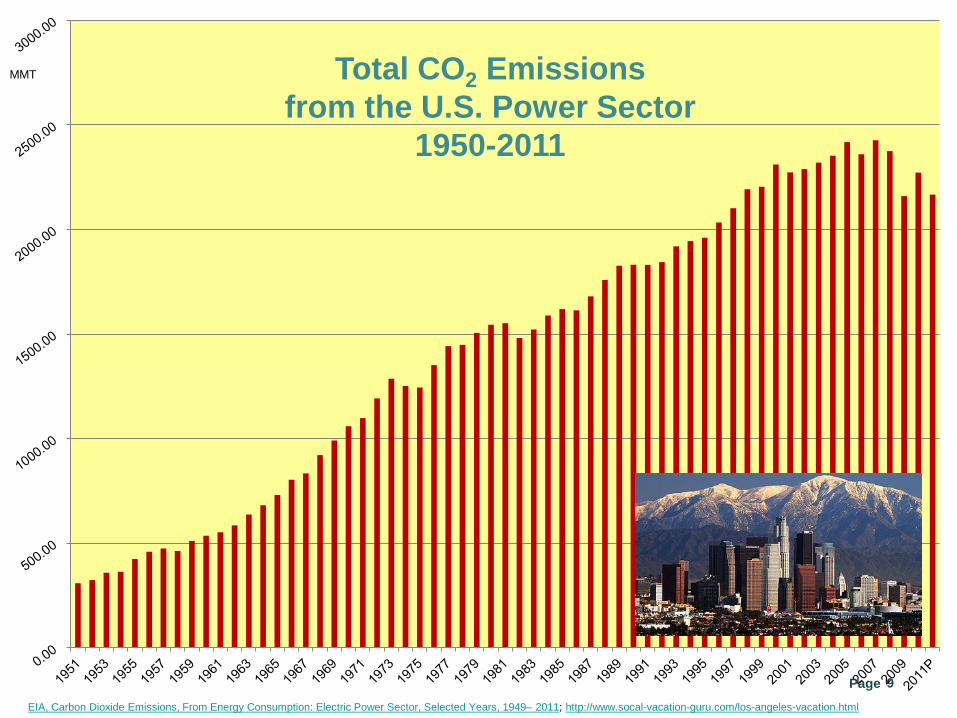
EIA, Carbon Dioxide Emissions, From Energy Consumption: Electric Power Sector, Selected Years, 1949– 2011; http://www.socal-vacation-guru.com/los-angeles-vacation.html
Total CO2 Emissions from the U.S. Power Sector
1950-2011
MMT
Page 10
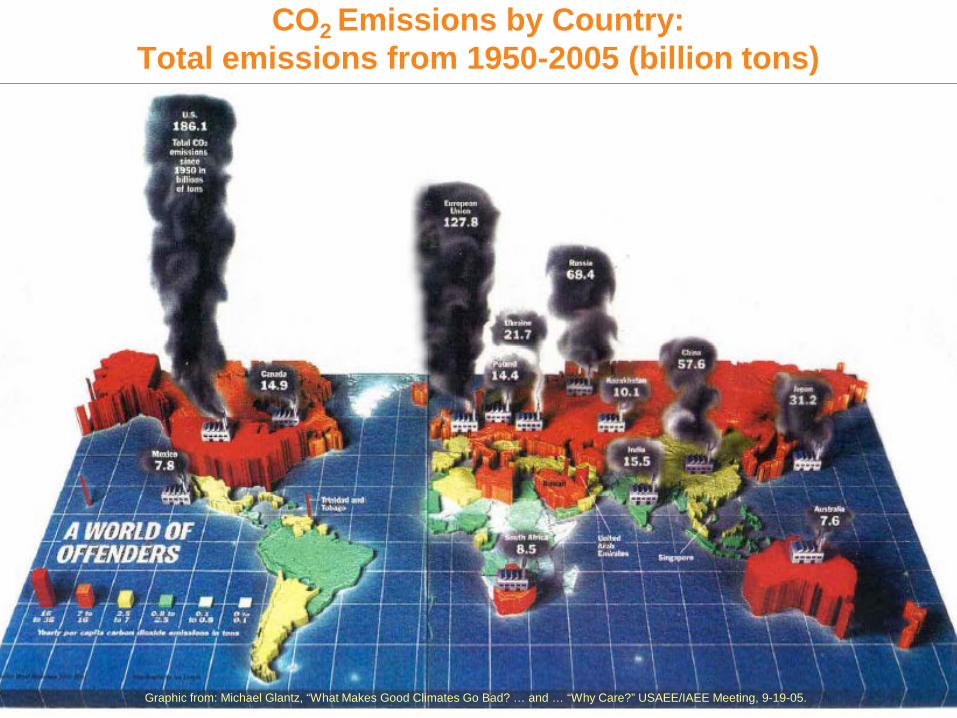
CO2 Emissions by Country: Total emissions from 1950-2005 (billion tons)
Graphic from: Michael Glantz, “What Makes Good Climates Go Bad? … and … “Why Care?” USAEE/IAEE Meeting, 9-19-05.
Page 11
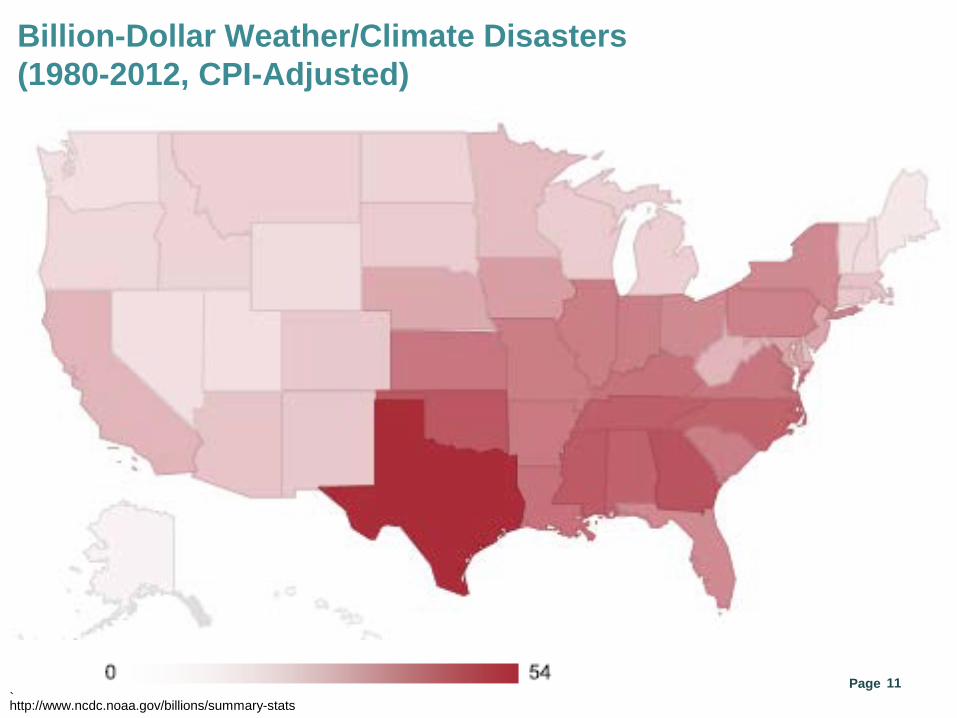
Billion-Dollar Weather/Climate Disasters (1980-2012, CPI-Adjusted)
` http://www.ncdc.noaa.gov/billions/summary-stats
Page 12
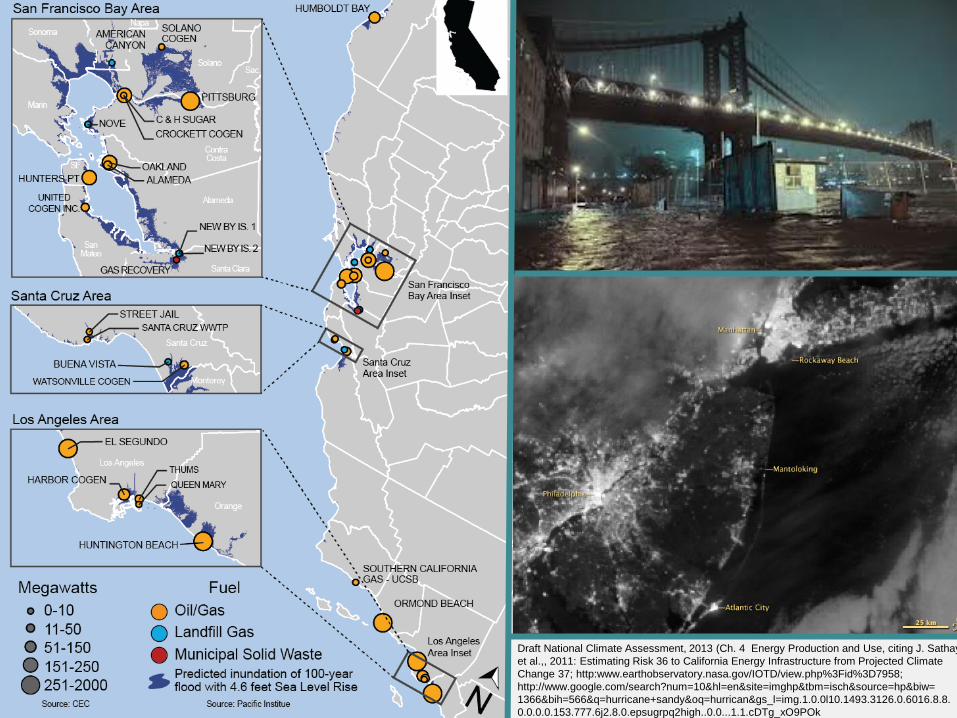
Draft National Climate Assessment, 2013 (Ch. 4 Energy Production and Use, citing J. Sathay et al.,, 2011: Estimating Risk 36 to California Energy Infrastructure from Projected Climate Change 37; http:www.earthobservatory.nasa.gov/IOTD/view.php%3Fid%3D7958; http://www.google.com/search?num=10&hl=en&site=imghp&tbm=isch&source=hp&biw= 1366&bih=566&q=hurricane+sandy&oq=hurrican&gs_l=img.1.0.0l10.1493.3126.0.6016.8.8. 0.0.0.0.153.777.6j2.8.0.epsugrpq2high..0.0...1.1.cDTg_xO9POk
Page 13
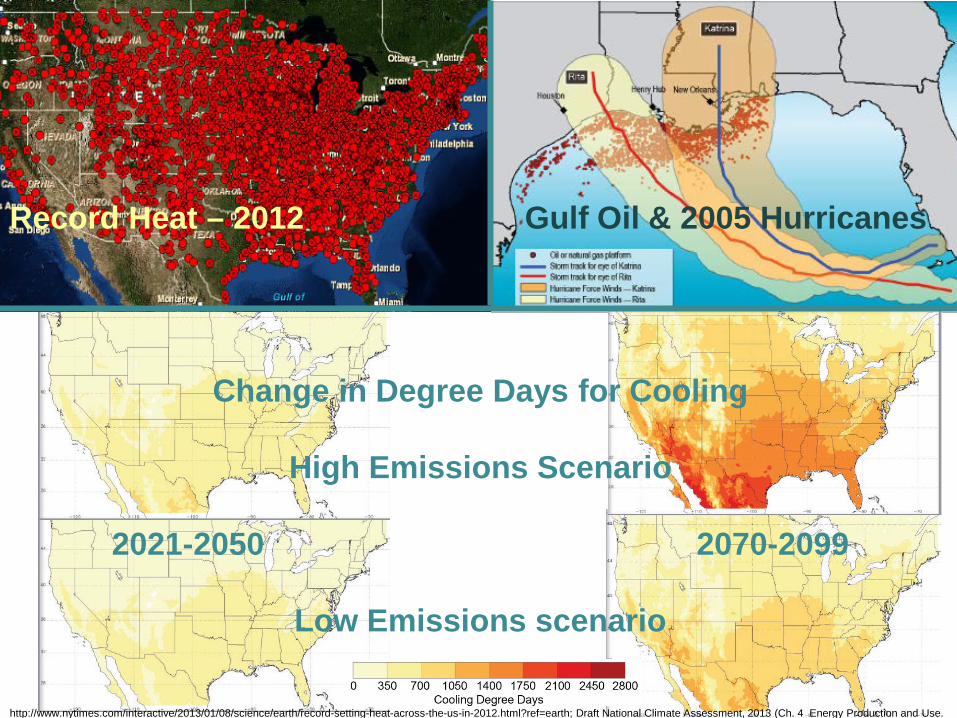
Change in Degree Days for Cooling
High Emissions Scenario
2021-2050 2070-2099
Low Emissions scenario
http://www.nytimes.com/interactive/2013/01/08/science/earth/record-setting-heat-across-the-us-in-2012.html?ref=earth; Draft National Climate Assessment, 2013 (Ch. 4 Energy Production and Use.
Record Heat – 2012 Gulf Oil & 2005 Hurricanes
Page 14 IPCC
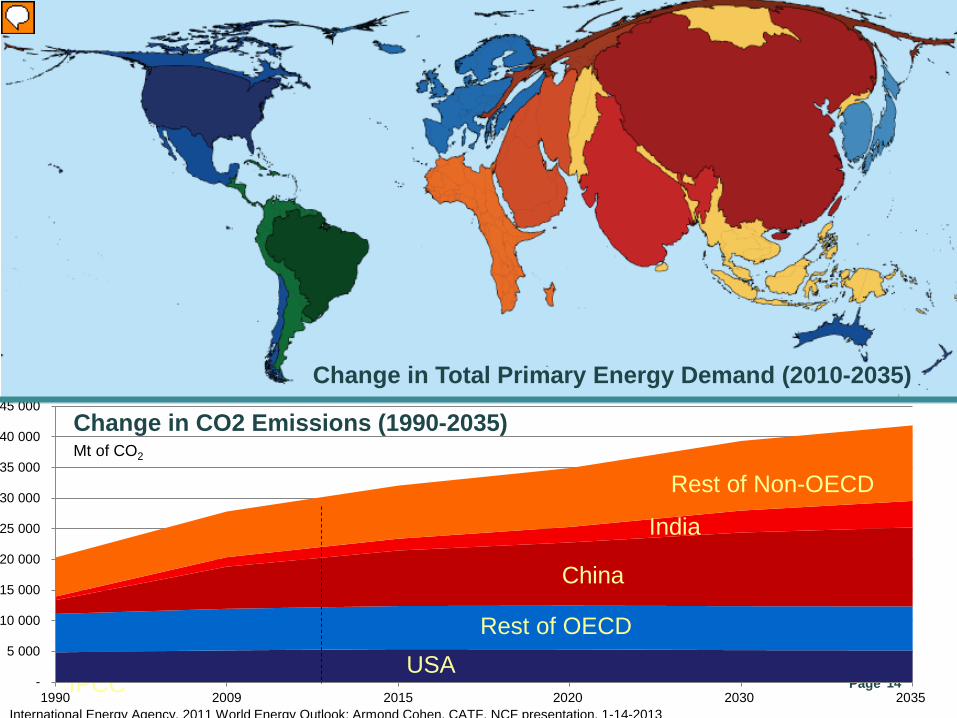
Change in Total Primary Energy Demand (2010-2035)
-
5 000
10 000
15 000
20 000
25 000
30 000
35 000
40 000
45 000
1990 2009 2015 2020 2030 2035
Mt of CO2
Change in CO2 Emissions (1990-2035)
Rest of OECD USA
China
India
Rest of Non-OECD
International Energy Agency, 2011 World Energy Outlook; Armond Cohen, CATF, NCF presentation, 1-14-2013
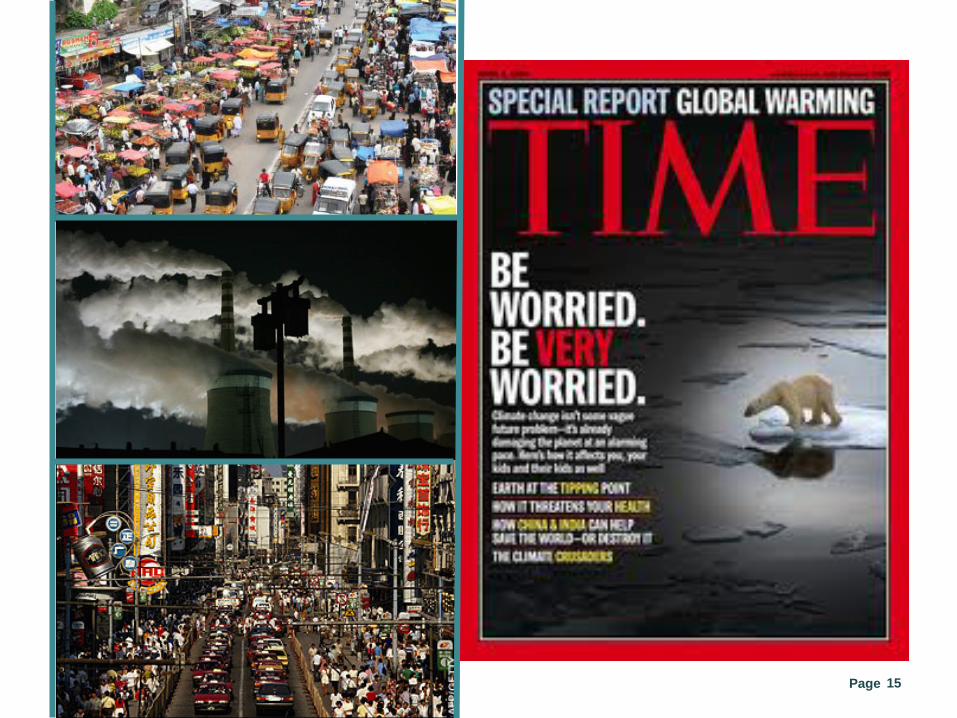
Page 15
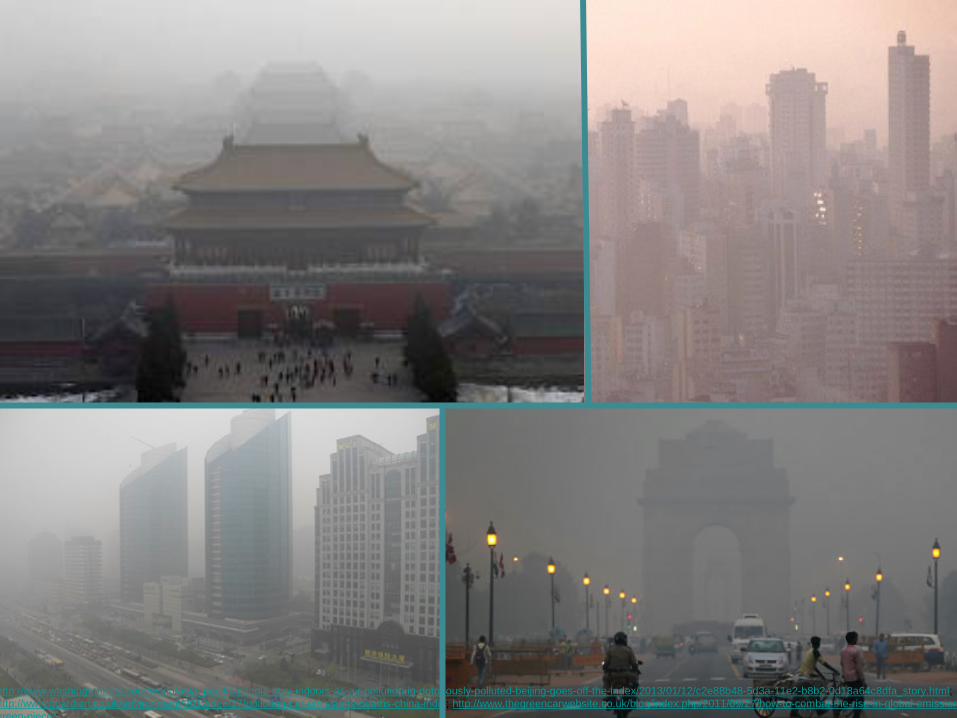
Page 16 http://www.washingtonpost.com/world/asia_pacific/people-stay-indoors-as-air-pollution-in-notoriously-polluted-beijing-goes-off-the-index/2013/01/12/c2e88b48-5d3a-11e2-b8b2-0d18a64c8dfa_story.html;
http://www.guardian.co.uk/environment/2012/dec/17/pollution-car-emissions-deaths-china-india; http://www.thegreencarwebsite.co.uk/blog/index.php/2011/09/27/how-to-combat-the-rise-in-global-emissiongreen-piece/;
Page 17
MT
WY
ID
WA
OR
NV
UT
CA
AZ
ND
SD
NE
CO
NM
TX
OK
KS
AR
LA
MO
IA
MN
WI
IL IN
KY
TN
MS AL GA
FL
SC
NC
VA WV
OH
MI
NY
PA
MD
DE
NJ CT
RI
MA
ME
VT NH
AK
HI
$0 to $30
$30 to $40
$40 to $50 $50 to $75
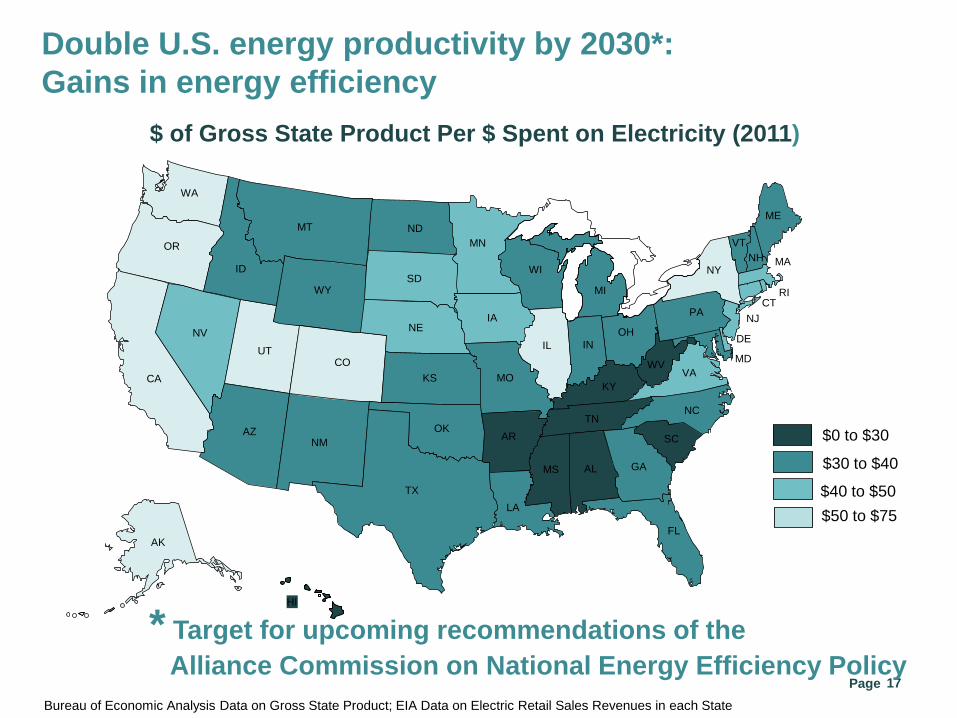
$ of Gross State Product Per $ Spent on Electricity (2011)
Bureau of Economic Analysis Data on Gross State Product; EIA Data on Electric Retail Sales Revenues in each State
Double U.S. energy productivity by 2030*: Gains in energy efficiency
* Target for upcoming recommendations of the Alliance Commission on National Energy Efficiency Policy
Page 18
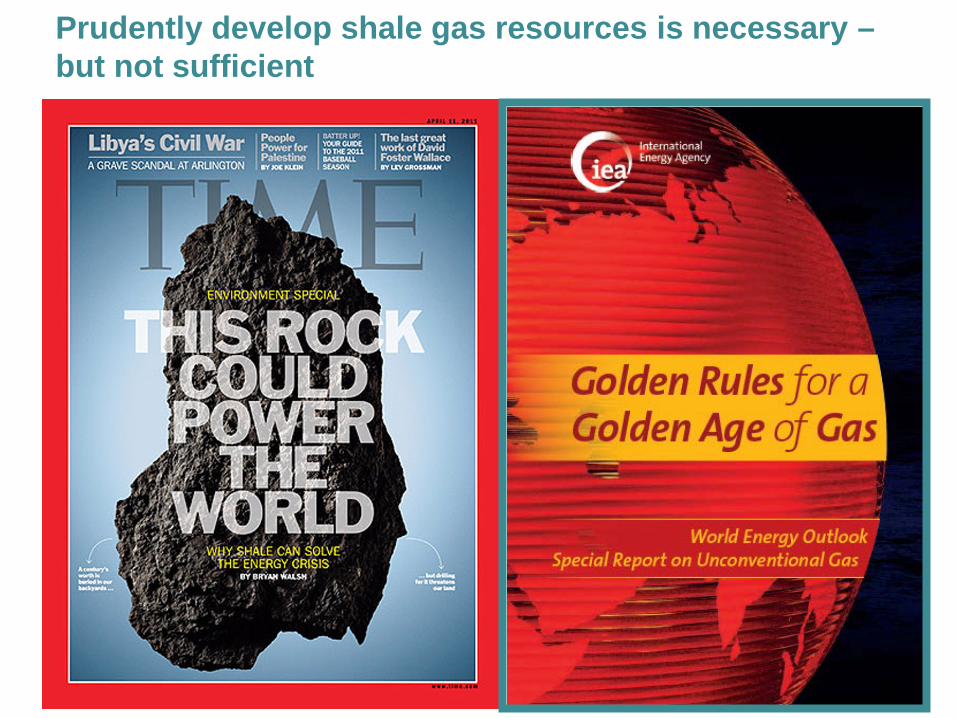
Prudently develop shale gas resources is necessary – but not sufficient
Page 19
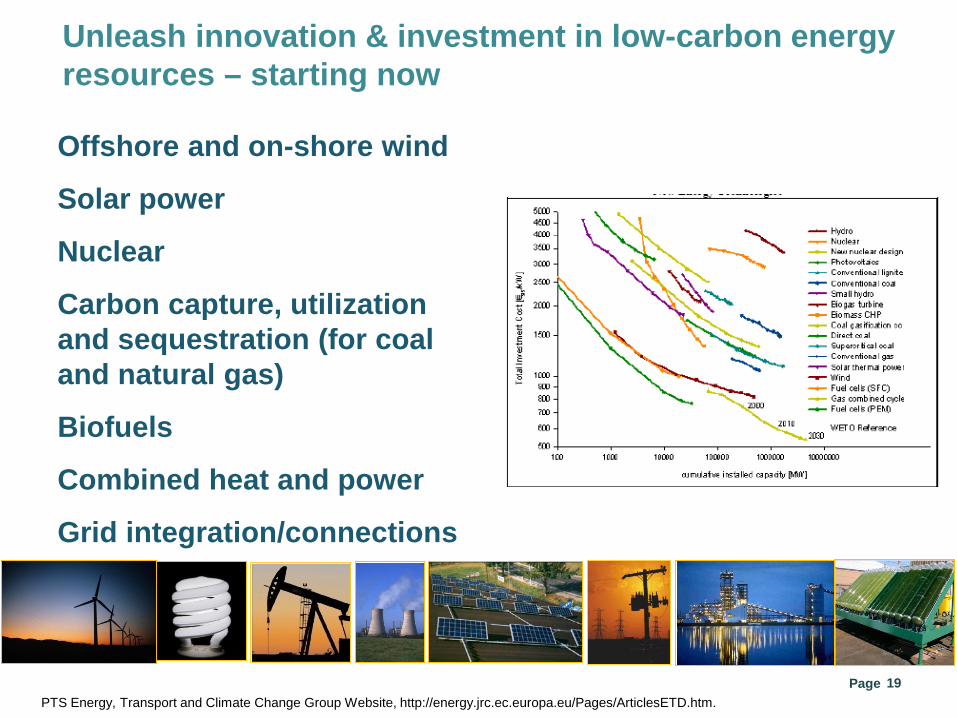
Unleash innovation & investment in low-carbon energy resources – starting now
Offshore and on-shore wind
Solar power
Nuclear
Carbon capture, utilization and sequestration (for coal and natural gas)
Biofuels
Combined heat and power
Grid integration/connections
PTS Energy, Transport and Climate Change Group Website, http://energy.jrc.ec.europa.eu/Pages/ArticlesETD.htm.
Page 20
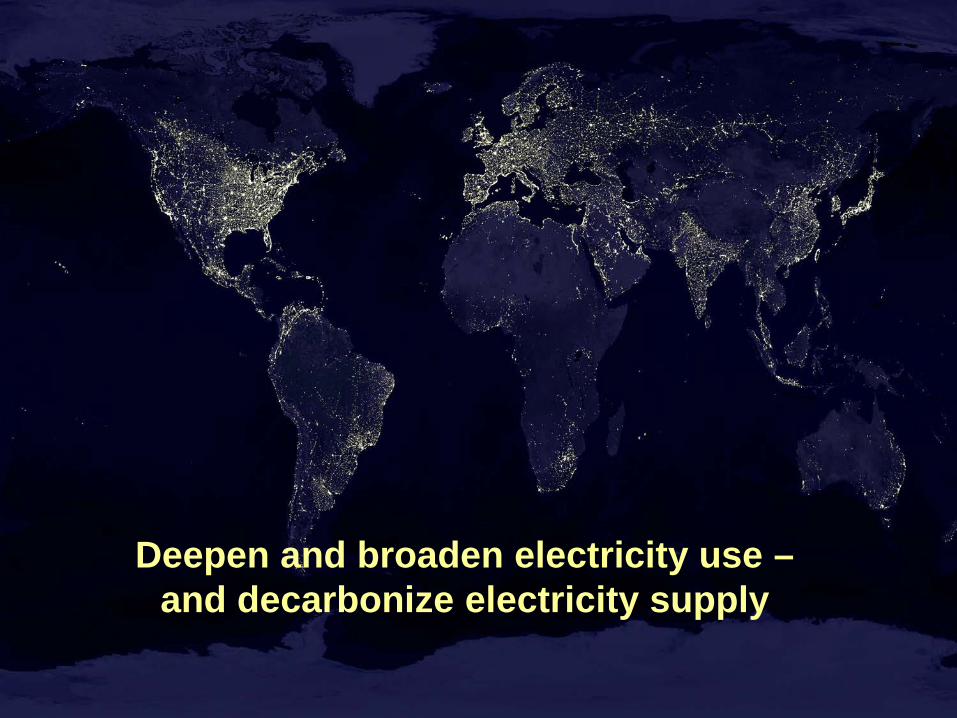
Deepen and broaden electricity use – and decarbonize electricity supply
Page 21
Our children are counting on us