Embed Size (px)
Citation preview
The future of reward in the U.S.
Part of the Korn Ferry Hay Group global reward webinar series.
© 2017 Korn Ferry. All rights reserved 2
Tom McMullen
Kevin Coogan
Meet your presenters
Senior partner and reward expertise leader, North America
Korn Ferry Hay Group
Based in Chicago, United States
Phone: +1-312-228-1848
Email: [email protected]
U.S. product manager – Pay
Korn Ferry Hay Group
Based in Philadelphia, United States
Phone: +1.215.861.2587
Email: [email protected]
© 2017 Korn Ferry. All rights reserved 3
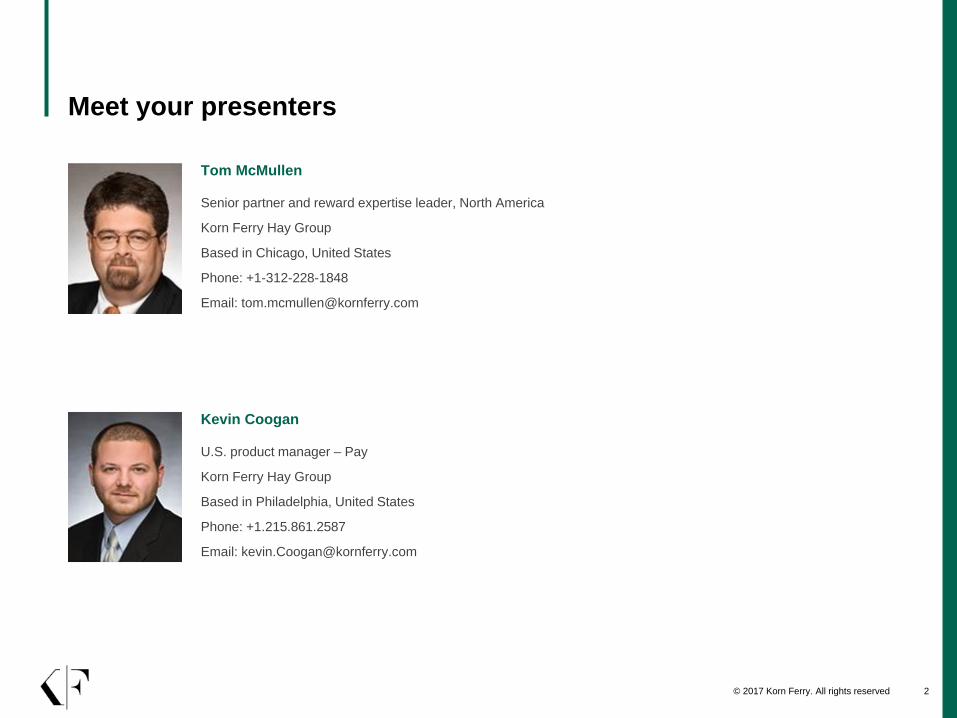
Agenda
1 ABOUT KORN FERRY HAY GROUP 4
2 U.S. GENERAL INDUSTRY OUTLOOK 8
3 REWARD DATA HEADLINES 15
4 REWARD TRENDS AND IMPLICATIONS 24
1About Korn Ferry Hay Group
© 2017 Korn Ferry. All rights reserved 5
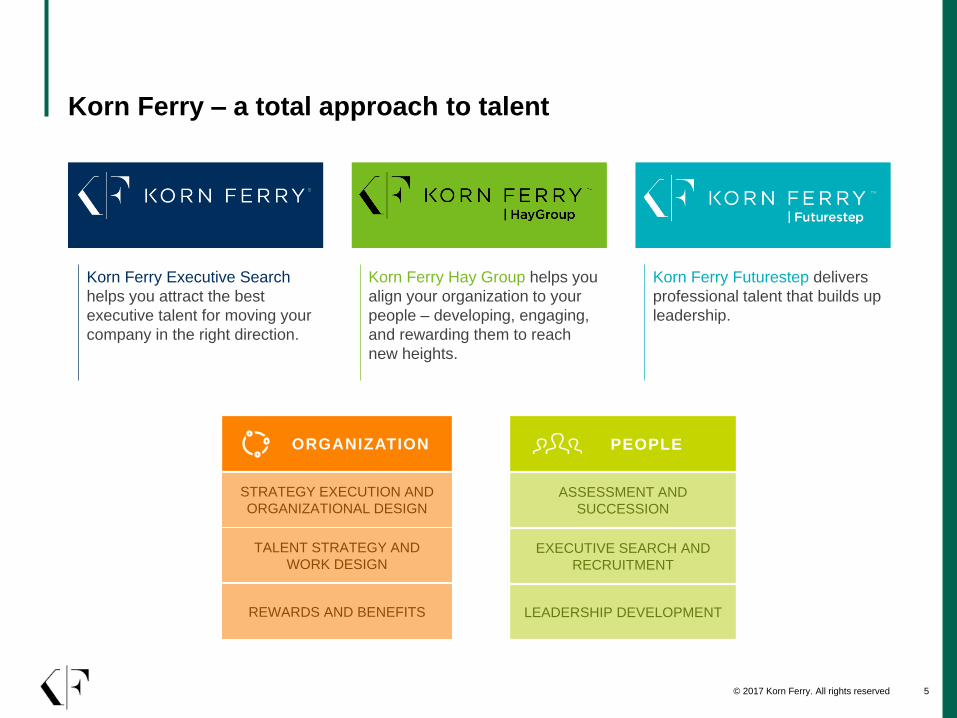
Korn Ferry – a total approach to talent
Korn Ferry Hay Group helps you
align your organization to your
people – developing, engaging,
and rewarding them to reach
new heights.
Korn Ferry Executive Search
helps you attract the best
executive talent for moving your
company in the right direction.
Korn Ferry Futurestep delivers
professional talent that builds up
leadership.
ORGANIZATION
STRATEGY EXECUTION AND
ORGANIZATIONAL DESIGN
REWARDS AND BENEFITS
TALENT STRATEGY AND
WORK DESIGN
PEOPLE
ASSESSMENT AND
SUCCESSION
LEADERSHIP DEVELOPMENT
EXECUTIVE SEARCH AND
RECRUITMENT
© 2017 Korn Ferry. All rights reserved 6
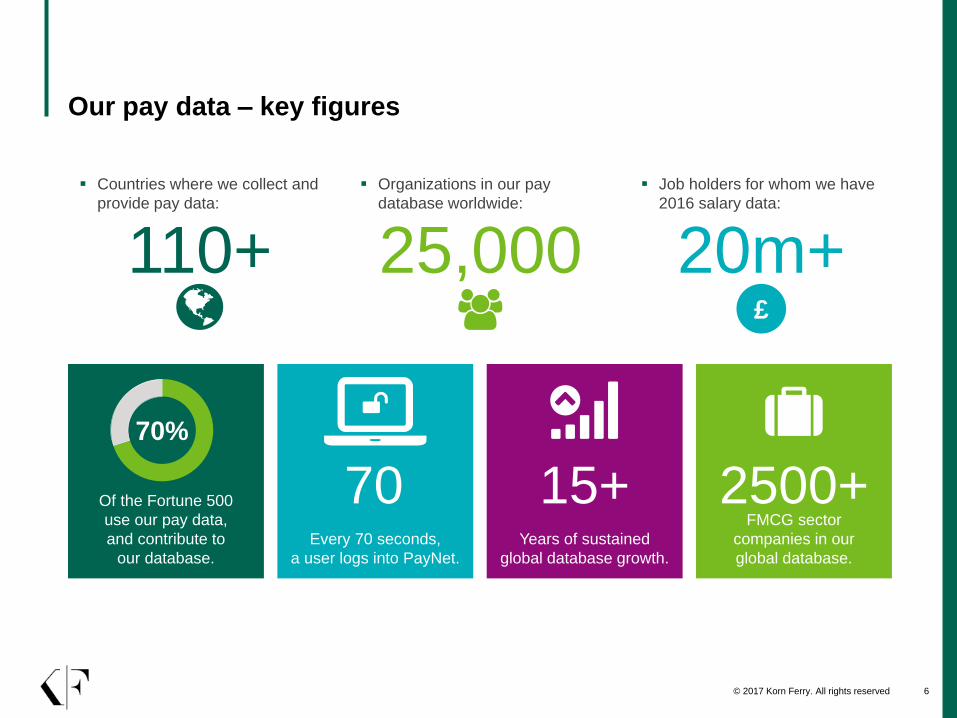
Our pay data – key figures
Organizations in our pay
database worldwide:
25,000
Countries where we collect and
provide pay data:
110+
Job holders for whom we have
2016 salary data:
20m+£
Of the Fortune 500
use our pay data,
and contribute to
our database.
70%
Every 70 seconds,
a user logs into PayNet.
Years of sustained
global database growth.
15+FMCG sector
companies in our
global database.
2500+70
© 2017 Korn Ferry. All rights reserved 7
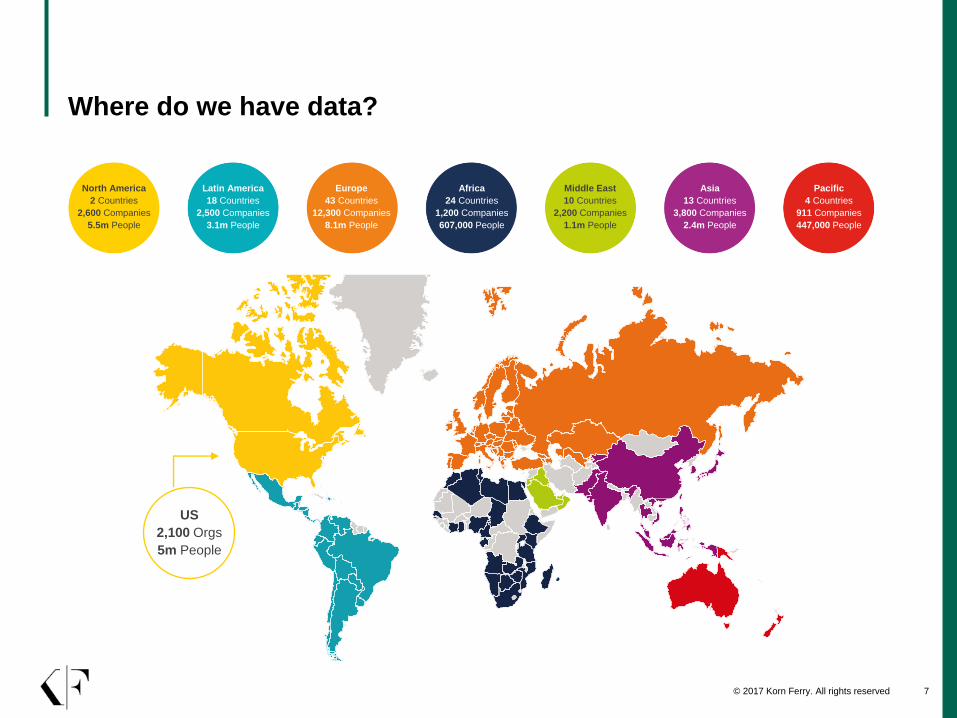
Where do we have data?
North America
2 Countries
2,600 Companies
5.5m People
Latin America
18 Countries
2,500 Companies
3.1m People
Europe
43 Countries
12,300 Companies
8.1m People
Africa
24 Countries
1,200 Companies
607,000 People
Middle East
10 Countries
2,200 Companies
1.1m People
Asia
13 Countries
3,800 Companies
2.4m People
Pacific
4 Countries
911 Companies
447,000 People
US
2,100 Orgs
5m People
2US General Industry Outlook
© 2017 Korn Ferry. All rights reserved 9
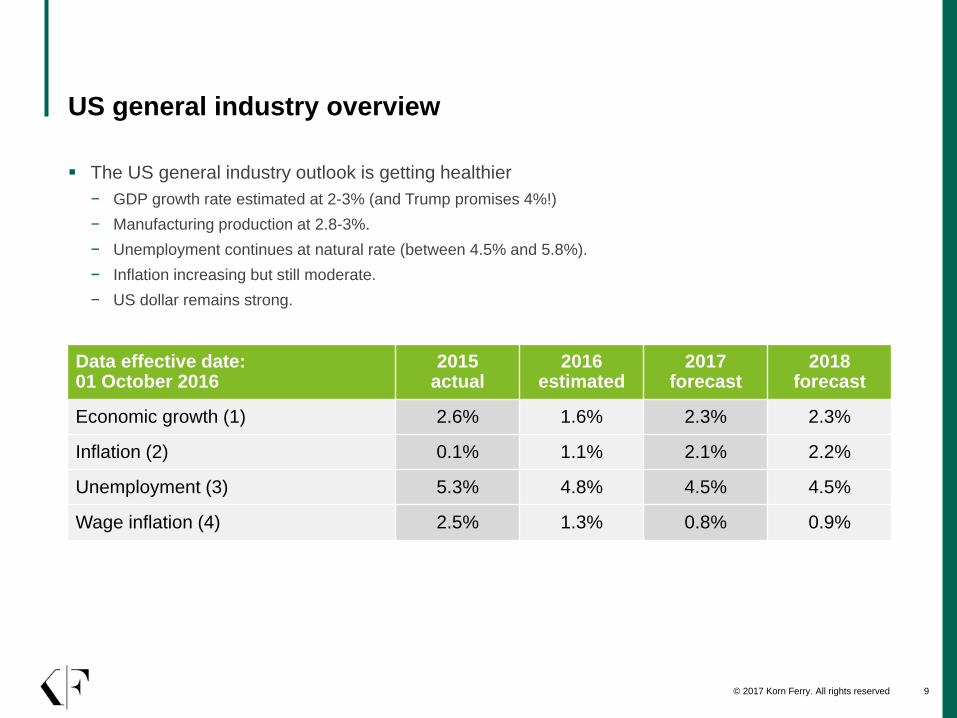
US general industry overview
The US general industry outlook is getting healthier
− GDP growth rate estimated at 2-3% (and Trump promises 4%!)
− Manufacturing production at 2.8-3%.
− Unemployment continues at natural rate (between 4.5% and 5.8%).
− Inflation increasing but still moderate.
− US dollar remains strong.
Data effective date: 01 October 2016
2015 actual
2016 estimated
2017 forecast
2018 forecast
Economic growth (1) 2.6% 1.6% 2.3% 2.3%
Inflation (2) 0.1% 1.1% 2.1% 2.2%
Unemployment (3) 5.3% 4.8% 4.5% 4.5%
Wage inflation (4) 2.5% 1.3% 0.8% 0.9%
© 2017 Korn Ferry. All rights reserved 10
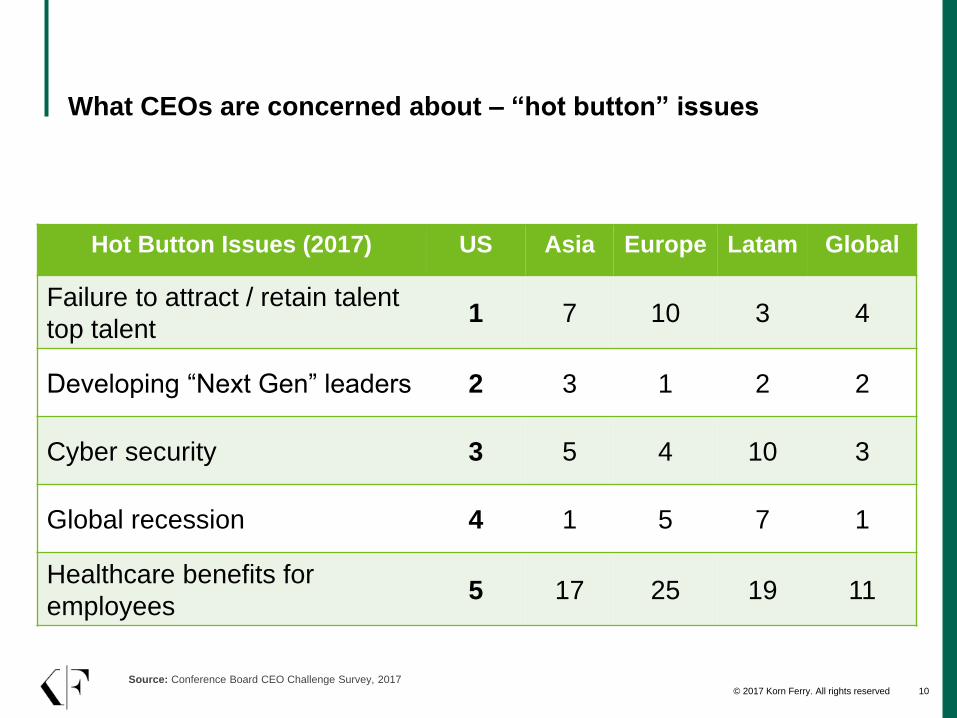
What CEOs are concerned about – “hot button” issues
Source: Conference Board CEO Challenge Survey, 2017
Hot Button Issues (2017) US Asia Europe Latam Global
Failure to attract / retain talent
top talent1 7 10 3 4
Developing “Next Gen” leaders 2 3 1 2 2
Cyber security 3 5 4 10 3
Global recession 4 1 5 7 1
Healthcare benefits for
employees5 17 25 19 11
© 2017 Korn Ferry. All rights reserved 11
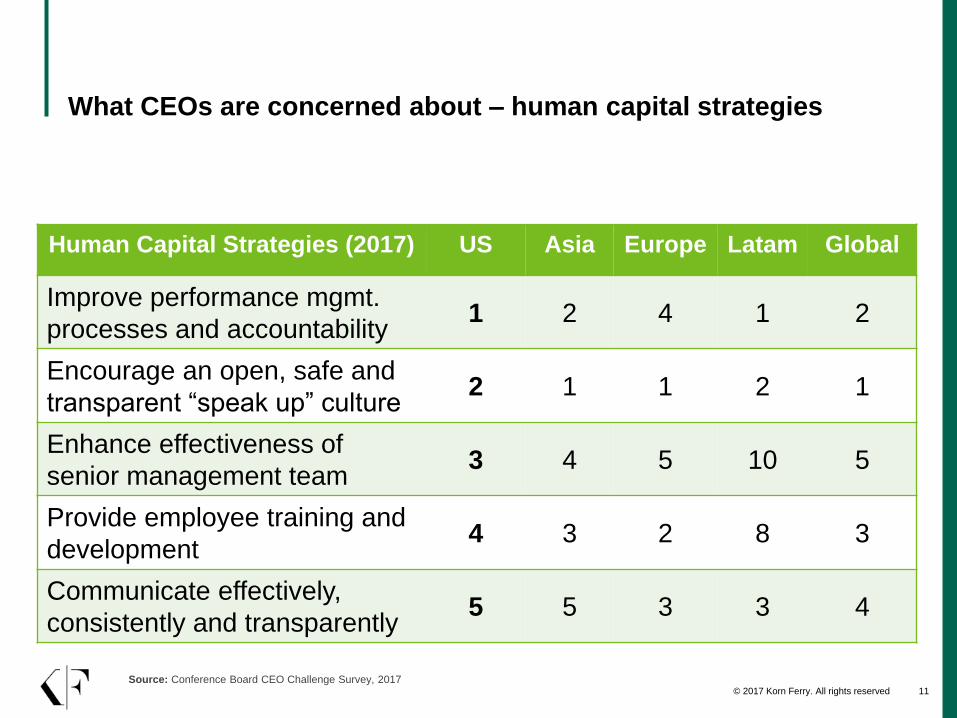
What CEOs are concerned about – human capital strategies
Source: Conference Board CEO Challenge Survey, 2017
Human Capital Strategies (2017) US Asia Europe Latam Global
Improve performance mgmt.
processes and accountability1 2 4 1 2
Encourage an open, safe and
transparent “speak up” culture2 1 1 2 1
Enhance effectiveness of
senior management team3 4 5 10 5
Provide employee training and
development4 3 2 8 3
Communicate effectively,
consistently and transparently5 5 3 3 4
© 2017 Korn Ferry. All rights reserved 12
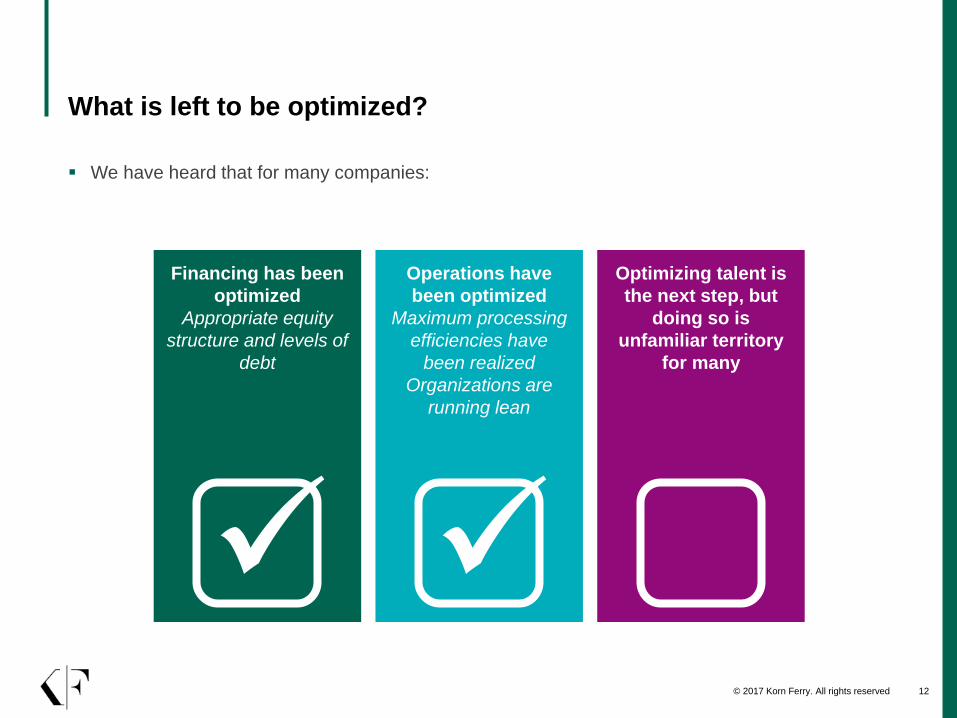
What is left to be optimized?
We have heard that for many companies:
Financing has been
optimized
Appropriate equity
structure and levels of
debt
Operations have
been optimized
Maximum processing
efficiencies have
been realized
Organizations are
running lean
Optimizing talent is
the next step, but
doing so is
unfamiliar territory
for many
© 2017 Korn Ferry. All rights reserved 13
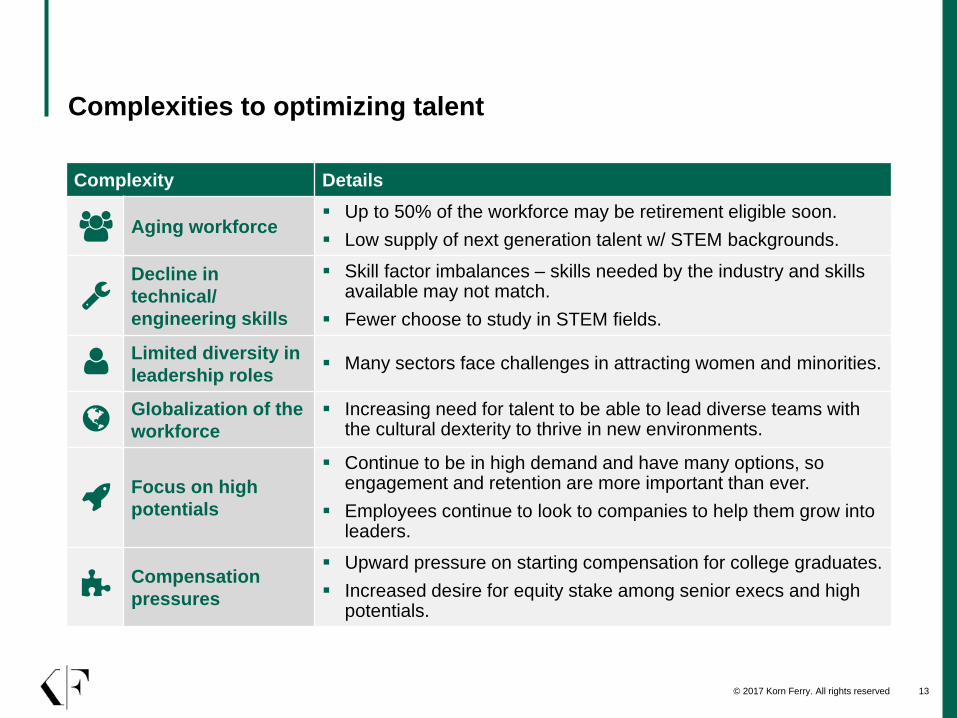
Complexities to optimizing talent
Complexity Details
Aging workforce Up to 50% of the workforce may be retirement eligible soon.
Low supply of next generation talent w/ STEM backgrounds.
Decline in
technical/
engineering skills
Skill factor imbalances – skills needed by the industry and skills available may not match.
Fewer choose to study in STEM fields.
Limited diversity in
leadership roles Many sectors face challenges in attracting women and minorities.
Globalization of the
workforce
Increasing need for talent to be able to lead diverse teams with the cultural dexterity to thrive in new environments.
Focus on high
potentials
Continue to be in high demand and have many options, so engagement and retention are more important than ever.
Employees continue to look to companies to help them grow into leaders.
Compensation
pressures
Upward pressure on starting compensation for college graduates.
Increased desire for equity stake among senior execs and high potentials.
© 2017 Korn Ferry. All rights reserved 14
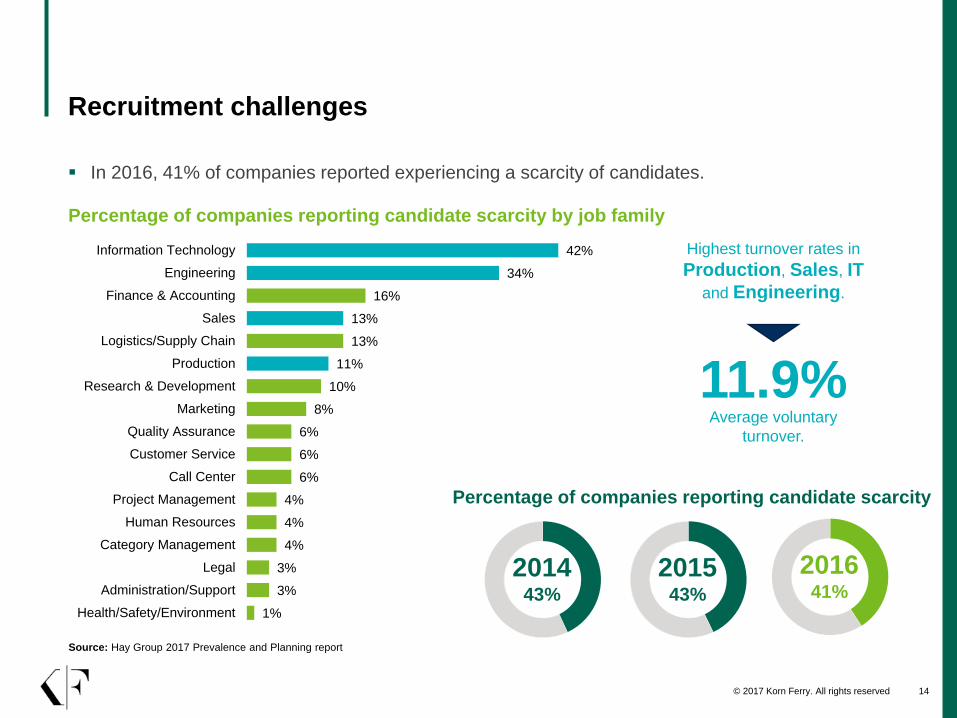
Recruitment challenges
In 2016, 41% of companies reported experiencing a scarcity of candidates.
Source: Hay Group 2017 Prevalence and Planning report
1%
3%
3%
4%
4%
4%
6%
6%
6%
8%
10%
11%
13%
13%
16%
34%
42%
Health/Safety/Environment
Administration/Support
Legal
Category Management
Human Resources
Project Management
Call Center
Customer Service
Quality Assurance
Marketing
Research & Development
Production
Logistics/Supply Chain
Sales
Finance & Accounting
Engineering
Information Technology
201641%
201543%
201443%
Average voluntary
turnover.
11.9%
Highest turnover rates in
Production, Sales, IT
and Engineering.
Percentage of companies reporting candidate scarcity by job family
Percentage of companies reporting candidate scarcity

3Reward Data Headlines
© 2017 Korn Ferry. All rights reserved 16
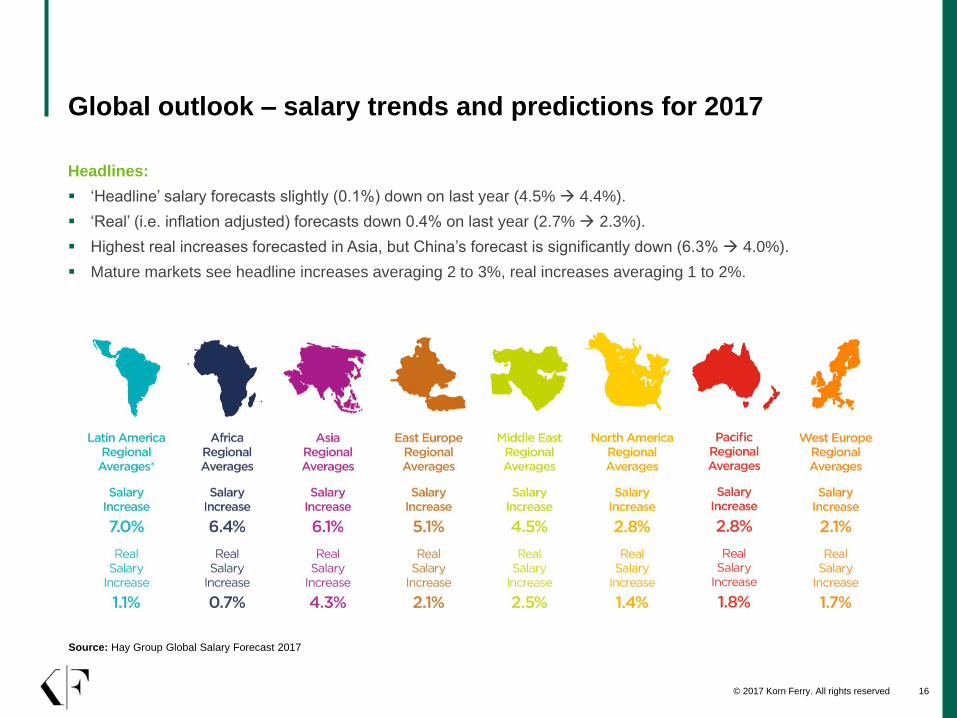
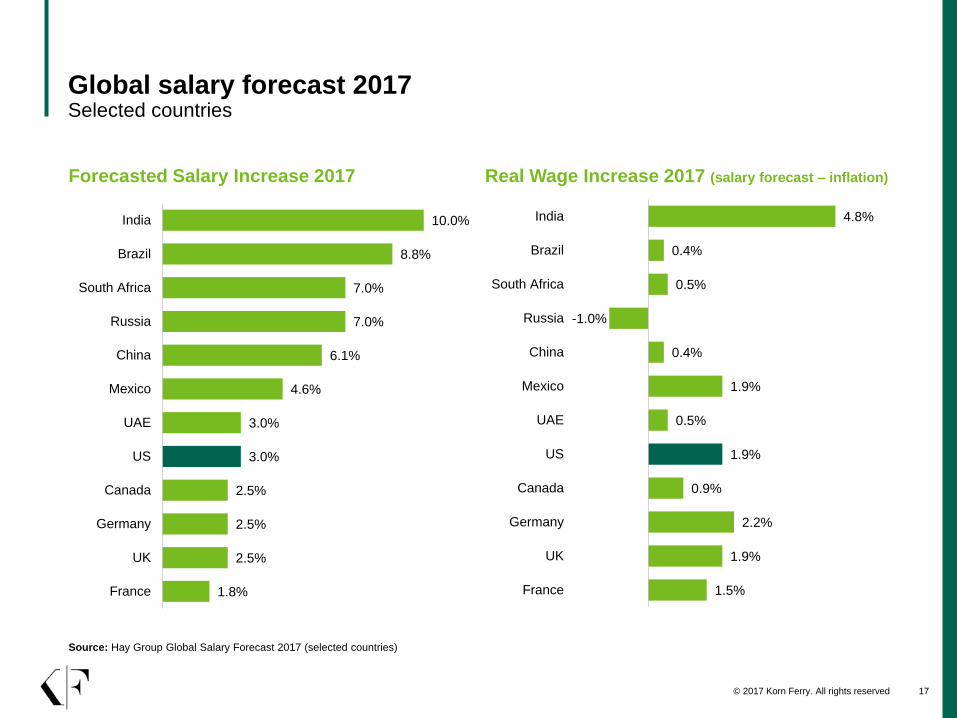
Global outlook – salary trends and predictions for 2017
Headlines:
‘Headline’ salary forecasts slightly (0.1%) down on last year (4.5% 4.4%).
‘Real’ (i.e. inflation adjusted) forecasts down 0.4% on last year (2.7% 2.3%).
Highest real increases forecasted in Asia, but China’s forecast is significantly down (6.3% 4.0%).
Mature markets see headline increases averaging 2 to 3%, real increases averaging 1 to 2%.
Source: Hay Group Global Salary Forecast 2017
© 2017 Korn Ferry. All rights reserved 17
Global salary forecast 2017Selected countries
Source: Hay Group Global Salary Forecast 2017 (selected countries)
1.8%
2.5%
2.5%
2.5%
3.0%
3.0%
4.6%
6.1%
7.0%
7.0%
8.8%
10.0%
France
UK
Germany
Canada
US
UAE
Mexico
China
Russia
South Africa
Brazil
India
Forecasted Salary Increase 2017 Real Wage Increase 2017 (salary forecast – inflation)
1.5%
1.9%
2.2%
0.9%
1.9%
0.5%
1.9%
0.4%
-1.0%
0.5%
0.4%
4.8%
France
UK
Germany
Canada
US
UAE
Mexico
China
Russia
South Africa
Brazil
India
© 2017 Korn Ferry. All rights reserved 18
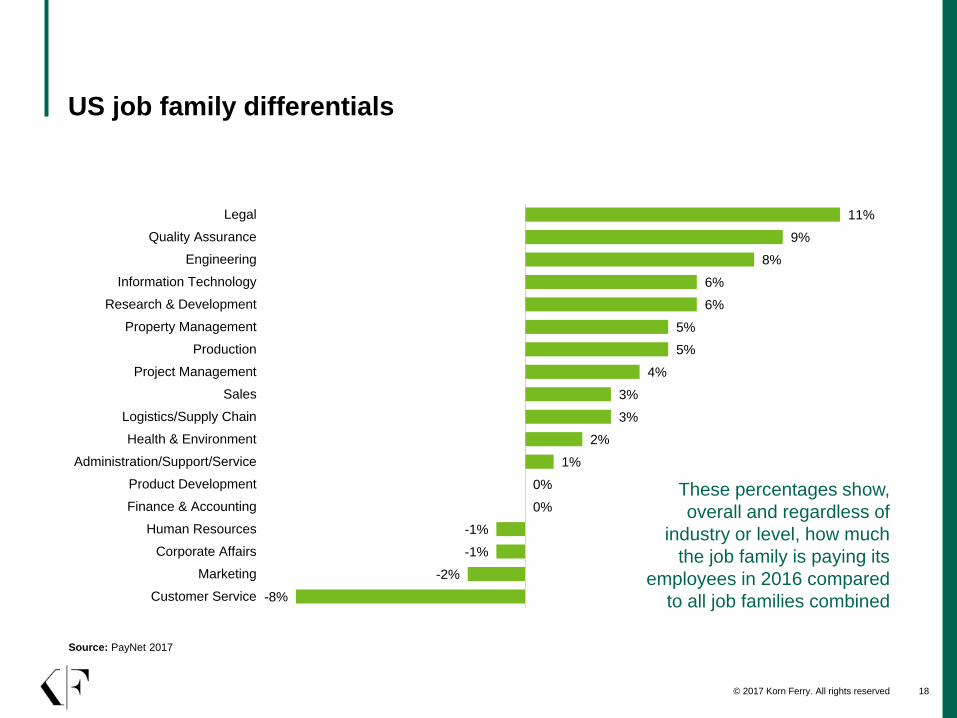
US job family differentials
Source: PayNet 2017
-8%
-2%
-1%
-1%
0%
0%
1%
2%
3%
3%
4%
5%
5%
6%
6%
8%
9%
11%
Customer Service
Marketing
Corporate Affairs
Human Resources
Finance & Accounting
Product Development
Administration/Support/Service
Health & Environment
Logistics/Supply Chain
Sales
Project Management
Production
Property Management
Research & Development
Information Technology
Engineering
Quality Assurance
Legal
These percentages show,
overall and regardless of
industry or level, how much
the job family is paying its
employees in 2016 compared
to all job families combined
© 2017 Korn Ferry. All rights reserved 19
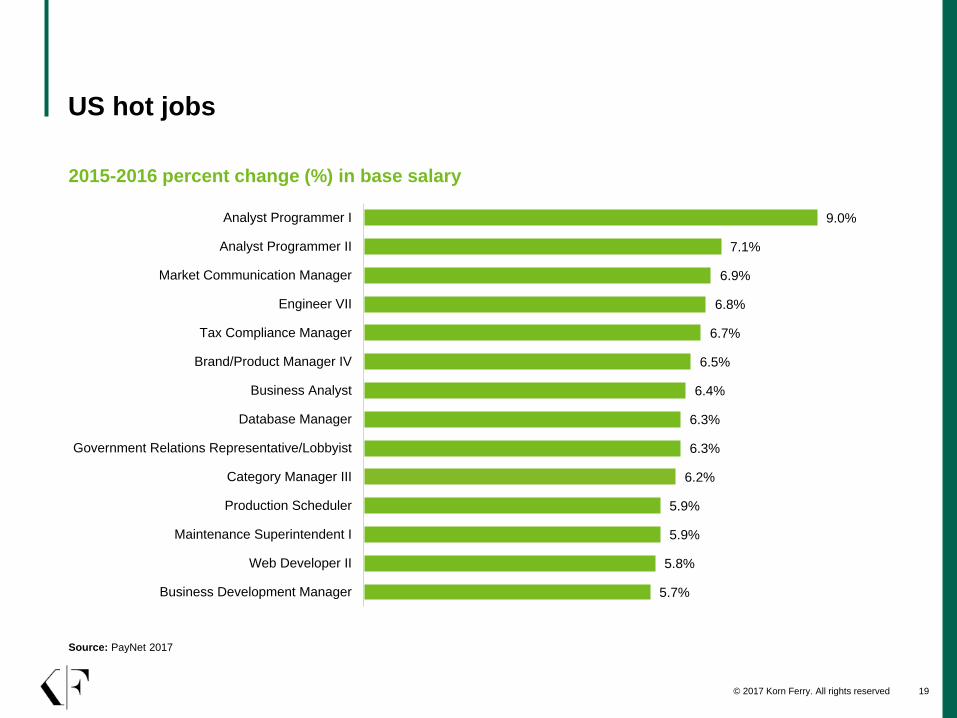
US hot jobs
Source: PayNet 2017
5.7%
5.8%
5.9%
5.9%
6.2%
6.3%
6.3%
6.4%
6.5%
6.7%
6.8%
6.9%
7.1%
9.0%
Business Development Manager
Web Developer II
Maintenance Superintendent I
Production Scheduler
Category Manager III
Government Relations Representative/Lobbyist
Database Manager
Business Analyst
Brand/Product Manager IV
Tax Compliance Manager
Engineer VII
Market Communication Manager
Analyst Programmer II
Analyst Programmer I
2015-2016 percent change (%) in base salary
© 2017 Korn Ferry. All rights reserved 20
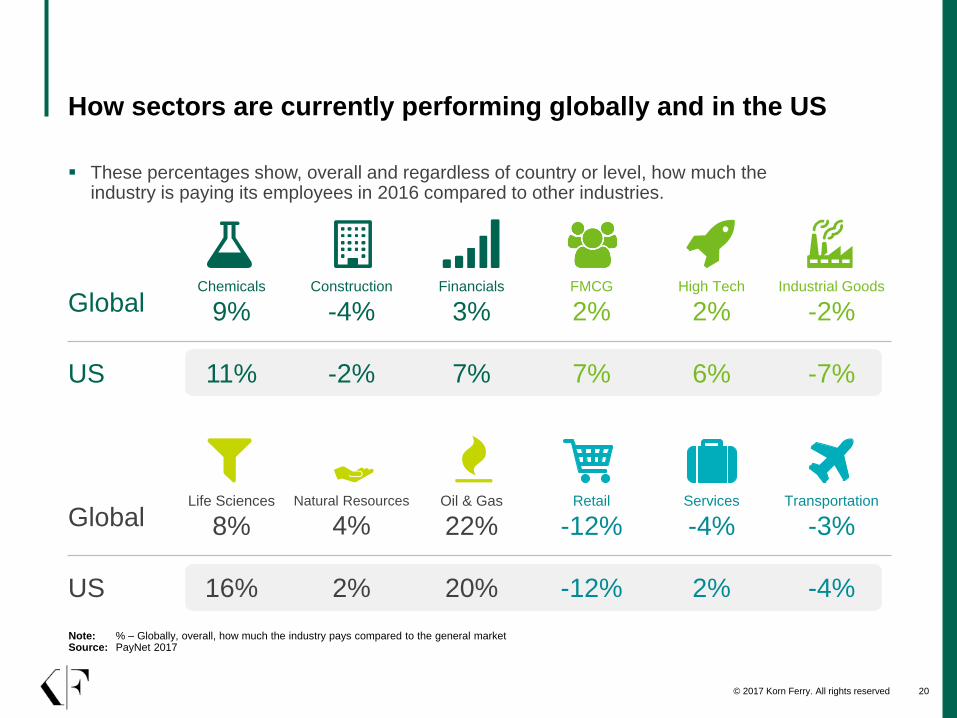
How sectors are currently performing globally and in the US
These percentages show, overall and regardless of country or level, how much the industry is paying its employees in 2016 compared to other industries.
GlobalChemicals
9%Construction
-4%Financials
3%FMCG
2%High Tech
2%Industrial Goods
-2%
US 11% -2% 7% 7% 6% -7%
Note: % – Globally, overall, how much the industry pays compared to the general marketSource: PayNet 2017
GlobalLife Sciences
8%Natural Resources
4%Oil & Gas
22%Retail
-12%Services
-4%Transportation
-3%
US 16% 2% 20% -12% 2% -4%
© 2017 Korn Ferry. All rights reserved 21
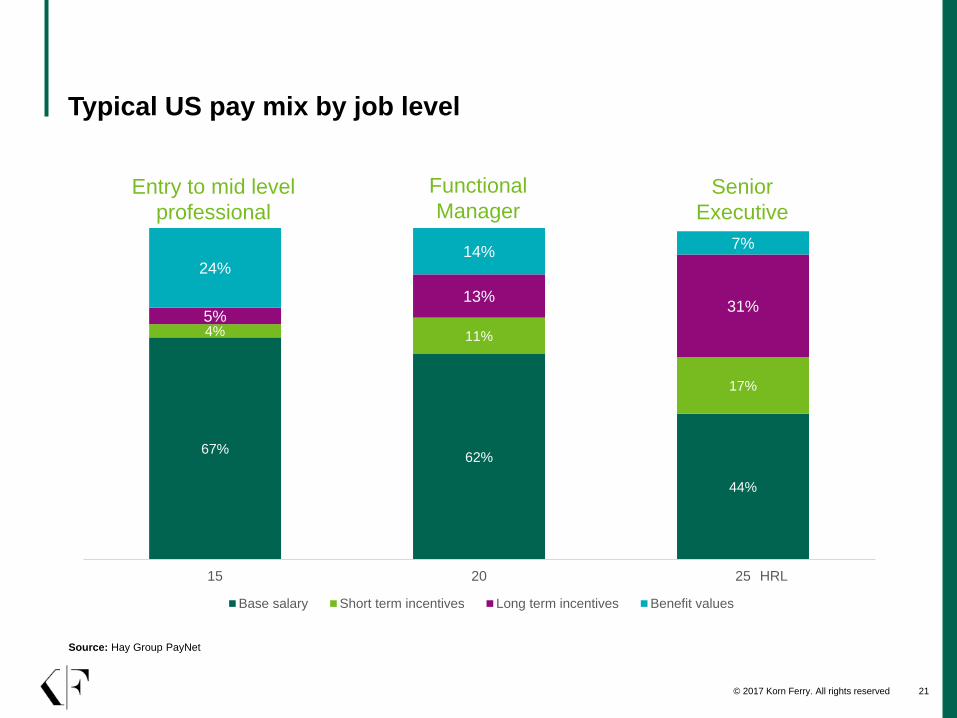
Typical US pay mix by job level
Source: Hay Group PayNet
67%62%
44%
4% 11%
17%
5%
13%31%
24%14%
7%
15 20 25
Base salary Short term incentives Long term incentives Benefit values
Entry to mid level
professional
Functional
ManagerSenior
Executive
HRL
© 2017 Korn Ferry. All rights reserved 22
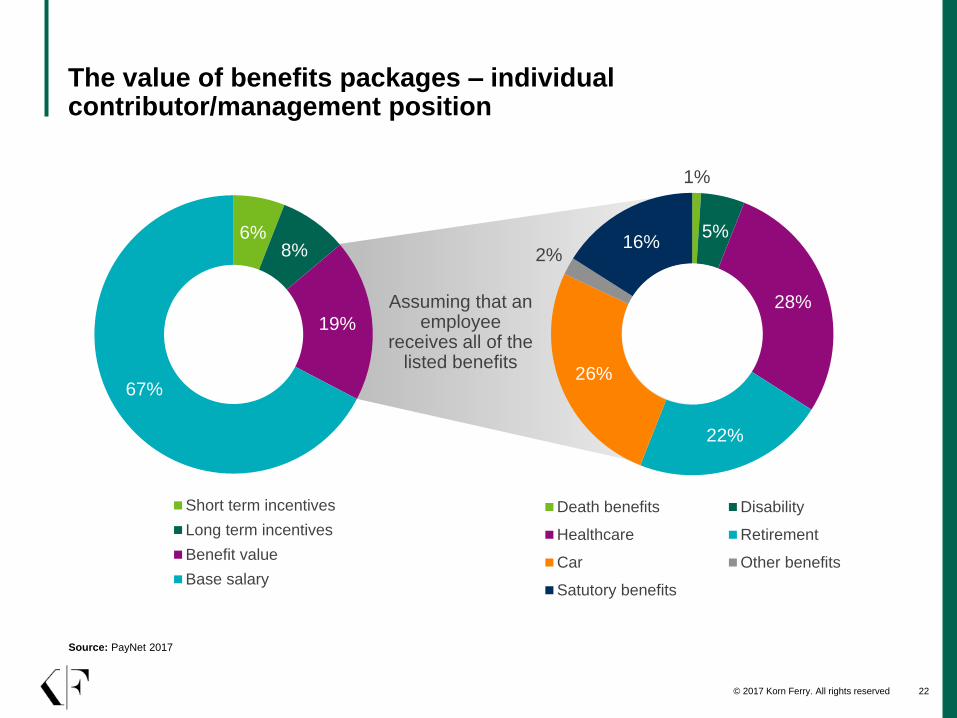
6%8%
19%
67%
Short term incentives
Long term incentives
Benefit value
Base salary
22
The value of benefits packages – individual contributor/management position
Assuming that an employee
receives all of the listed benefits
Source: PayNet 2017
1%
5%
28%
22%
26%
2%16%
Death benefits Disability
Healthcare Retirement
Car Other benefits
Satutory benefits
© 2017 Korn Ferry. All rights reserved 23
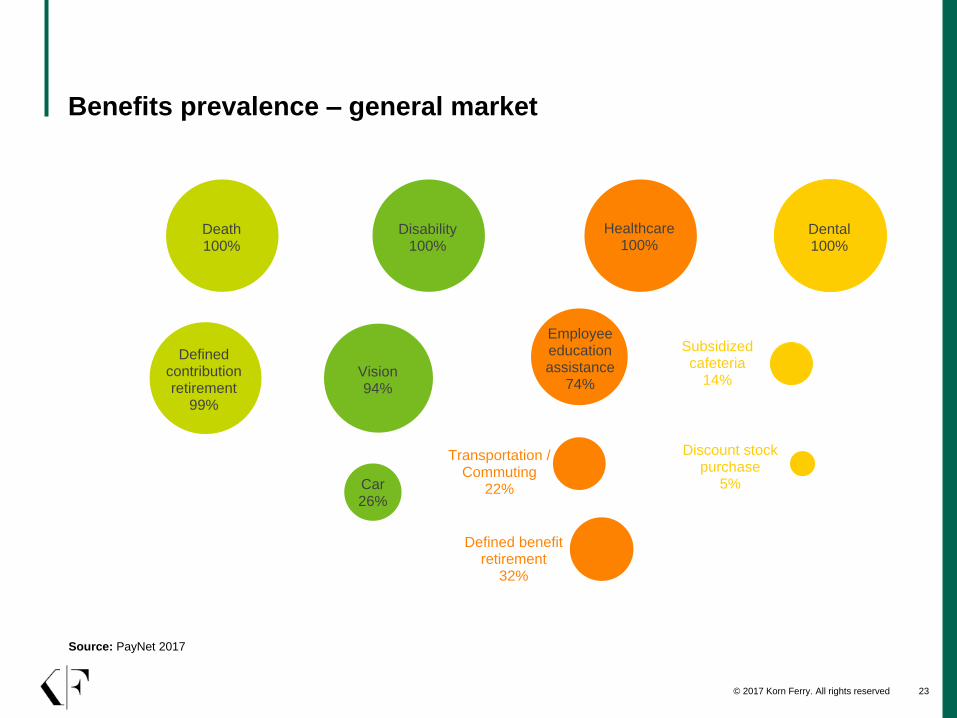
Benefits prevalence – general market
Source: PayNet 2017
Death100%
Defined contribution retirement
99%
Disability100%
Vision94%
Car26%
Healthcare100%
Employee education assistance
74%
Transportation / Commuting
22%
Defined benefit retirement
32%
Dental100%
Subsidized cafeteria
14%
Discount stock purchase
5%
4Reward Trends and Implications
© 2017 Korn Ferry. All rights reserved 25
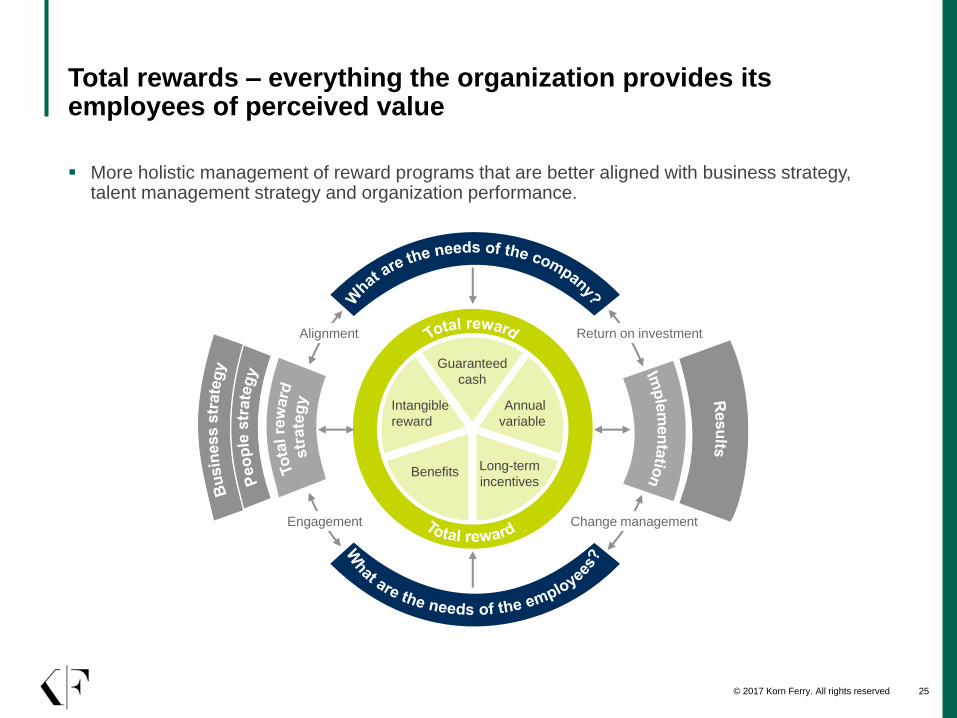
Total rewards – everything the organization provides its employees of perceived value
More holistic management of reward programs that are better aligned with business strategy, talent management strategy and organization performance.
Annual
variable
Intangible
reward
Benefits
Guaranteed
cash
Long-term
incentives
Return on investmentAlignment
Change managementEngagement
© 2017 Korn Ferry. All rights reserved 26
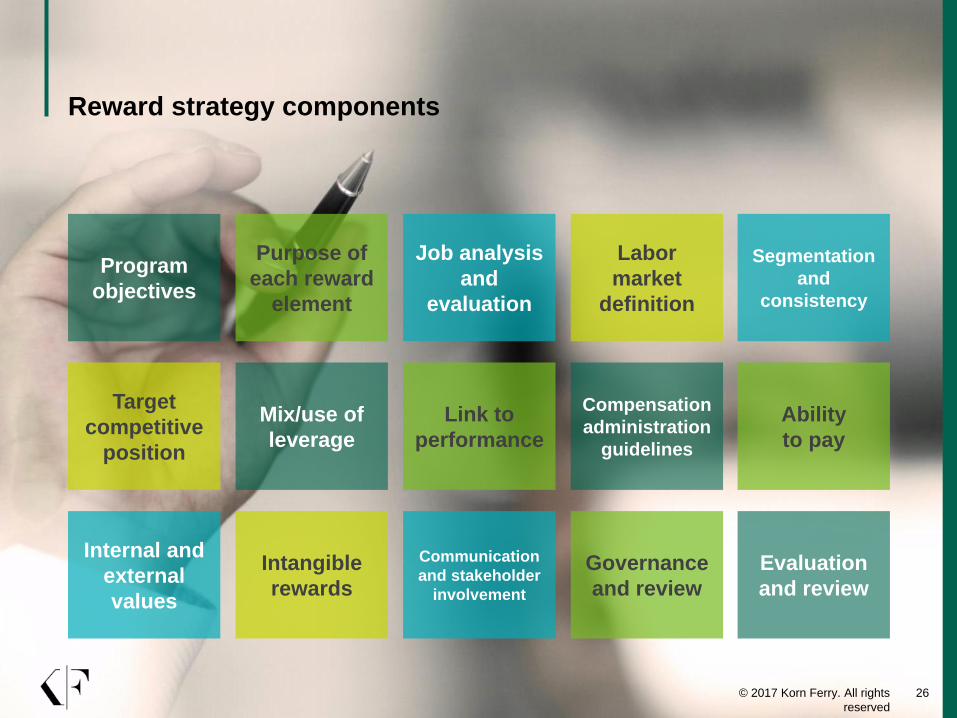
Reward strategy components
© 2017 Korn Ferry. All rights
reserved
26
Program
objectives
Purpose of
each reward
element
Job analysis
and
evaluation
Labor
market
definition
Target
competitive
position
Mix/use of
leverage
Link to
performance
Compensation
administration
guidelines
Intangible
rewards
Communication
and stakeholder
involvement
Governance
and review
Segmentation
and
consistency
Ability
to pay
Evaluation
and review
Internal and
external
values
© 2017 Korn Ferry. All rights reserved 27
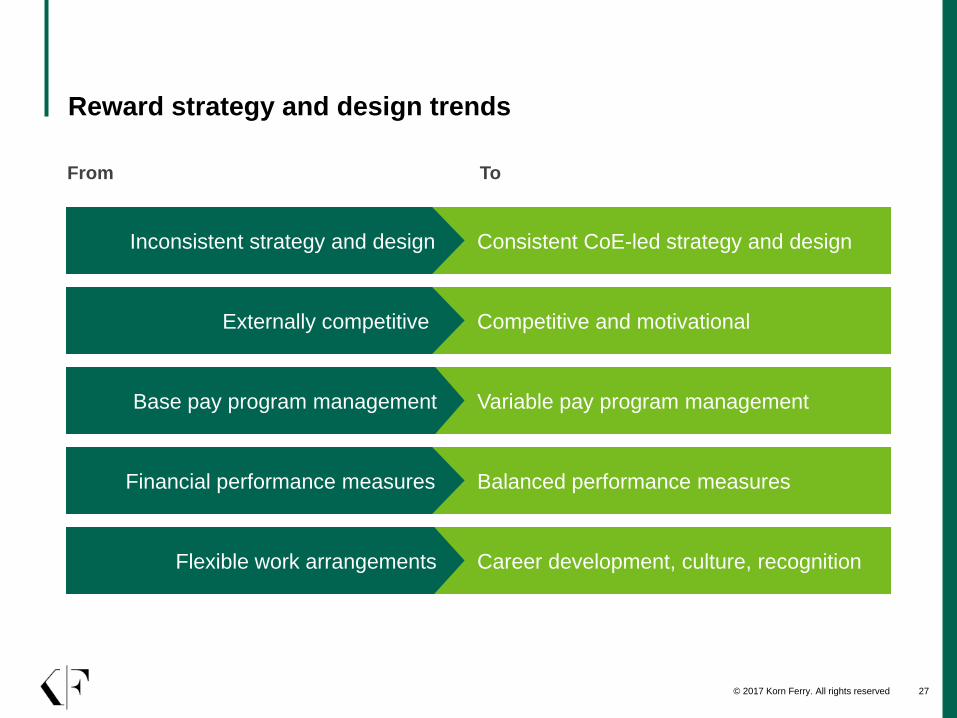
Competitive and motivational
Balanced performance measures
Variable pay program management
Career development, culture, recognition
Consistent CoE-led strategy and design
Reward strategy and design trends
From To
Externally competitive
Financial performance measures
Base pay program management
Flexible work arrangements
Inconsistent strategy and design
© 2017 Korn Ferry. All rights reserved 28
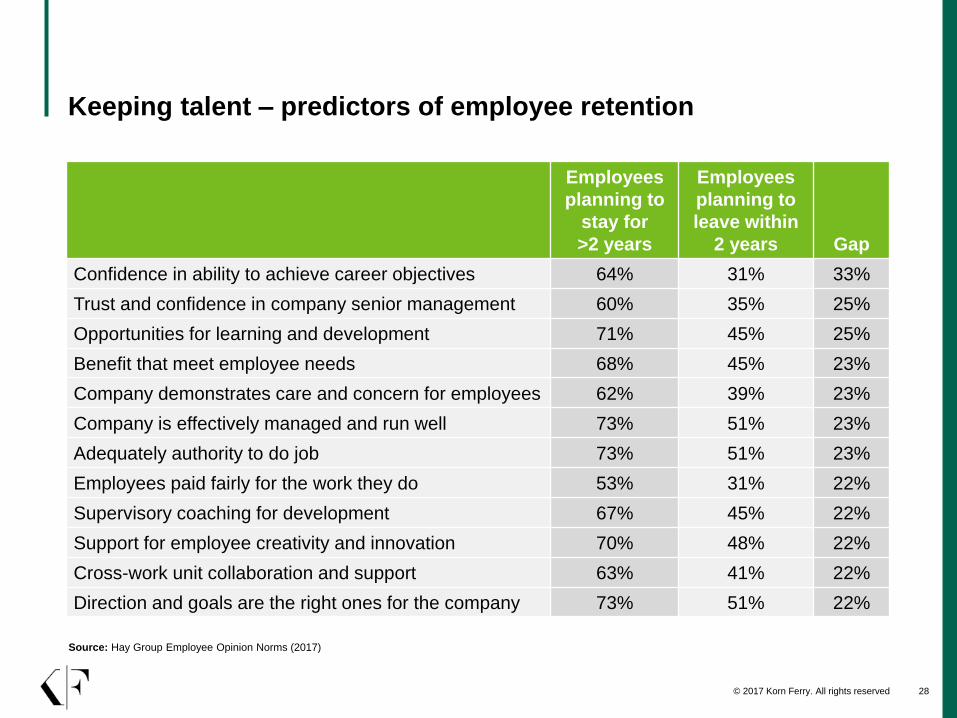
Keeping talent – predictors of employee retention
Employees
planning to
stay for
>2 years
Employees
planning to
leave within
2 years Gap
Confidence in ability to achieve career objectives 64% 31% 33%
Trust and confidence in company senior management 60% 35% 25%
Opportunities for learning and development 71% 45% 25%
Benefit that meet employee needs 68% 45% 23%
Company demonstrates care and concern for employees 62% 39% 23%
Company is effectively managed and run well 73% 51% 23%
Adequately authority to do job 73% 51% 23%
Employees paid fairly for the work they do 53% 31% 22%
Supervisory coaching for development 67% 45% 22%
Support for employee creativity and innovation 70% 48% 22%
Cross-work unit collaboration and support 63% 41% 22%
Direction and goals are the right ones for the company 73% 51% 22%
Source: Hay Group Employee Opinion Norms (2017)
© 2017 Korn Ferry. All rights reserved 29
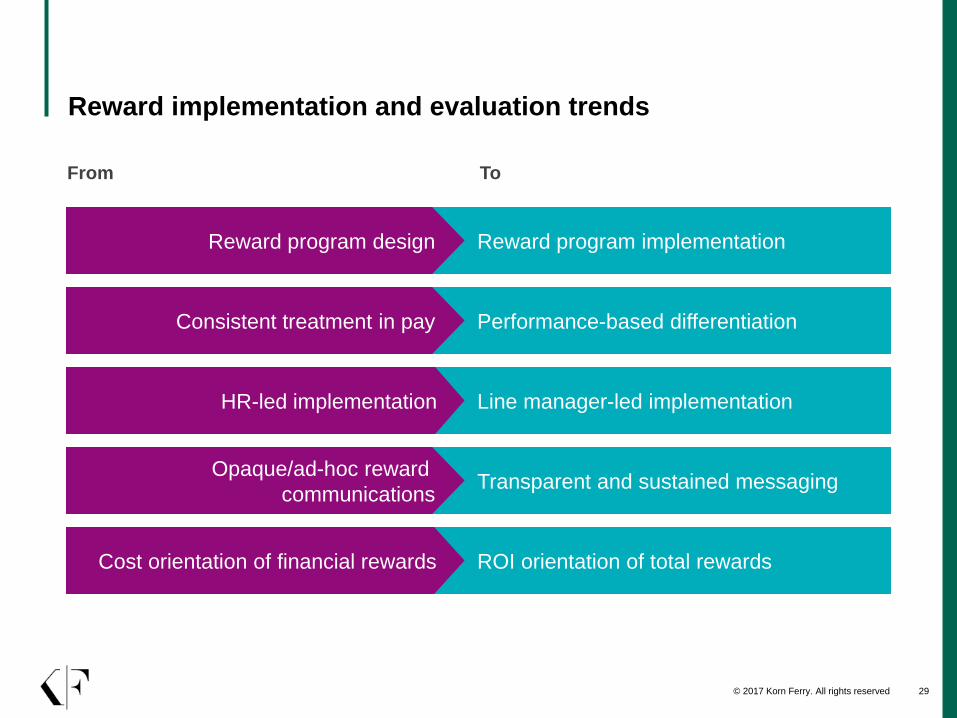
Reward implementation and evaluation trends
Performance-based differentiation
Transparent and sustained messaging
Line manager-led implementation
ROI orientation of total rewards
Reward program implementation
From To
Consistent treatment in pay
Opaque/ad-hoc reward
communications
HR-led implementation
Cost orientation of financial rewards
Reward program design
© 2017 Korn Ferry. All rights reserved 30
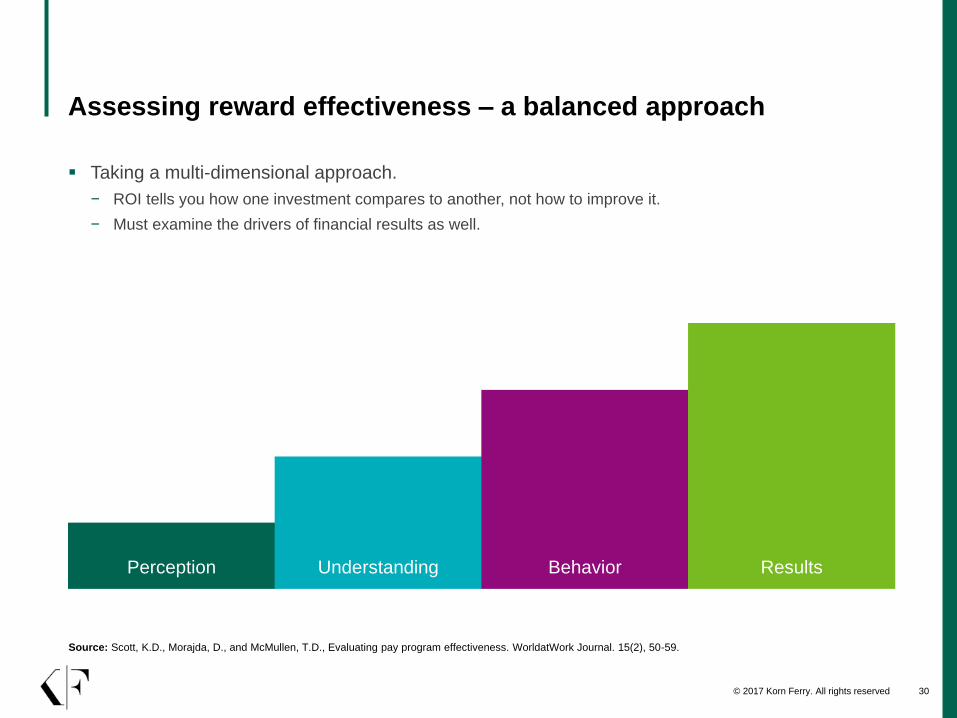
Assessing reward effectiveness – a balanced approach
Taking a multi-dimensional approach.
− ROI tells you how one investment compares to another, not how to improve it.
− Must examine the drivers of financial results as well.
Source: Scott, K.D., Morajda, D., and McMullen, T.D., Evaluating pay program effectiveness. WorldatWork Journal. 15(2), 50-59.
Perception Understanding Behavior Results
© 2017 Korn Ferry. All rights reserved 31
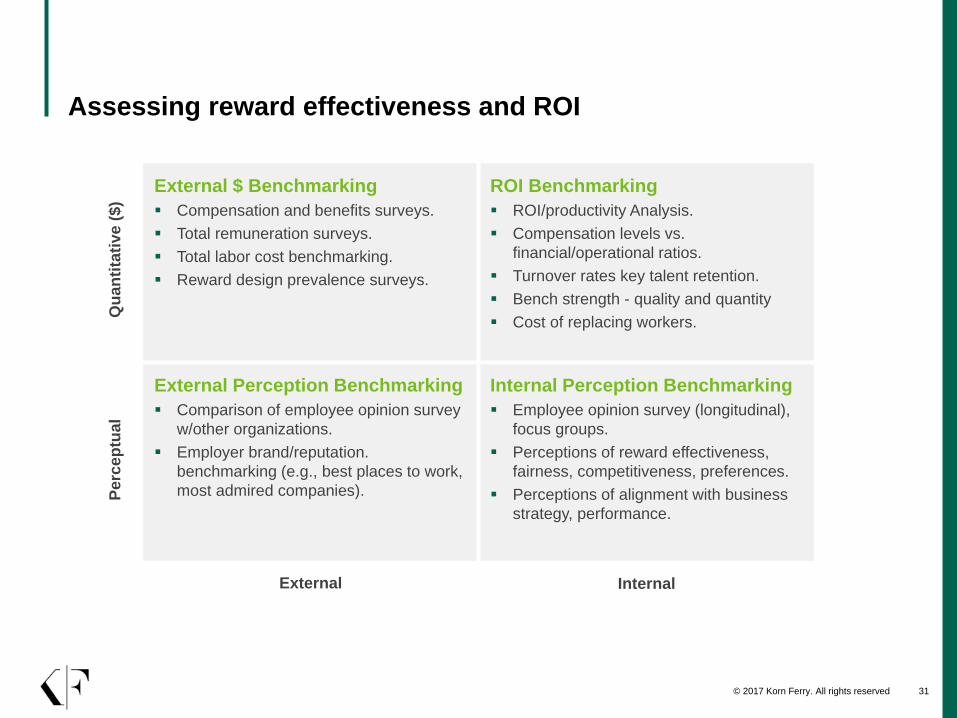
Assessing reward effectiveness and ROIQ
uan
tita
tive (
$)
Perc
ep
tual
External $ Benchmarking
Compensation and benefits surveys.
Total remuneration surveys.
Total labor cost benchmarking.
Reward design prevalence surveys.
ROI Benchmarking
ROI/productivity Analysis.
Compensation levels vs.
financial/operational ratios.
Turnover rates key talent retention.
Bench strength - quality and quantity
Cost of replacing workers.
External Perception Benchmarking
Comparison of employee opinion survey
w/other organizations.
Employer brand/reputation.
benchmarking (e.g., best places to work,
most admired companies).
Internal Perception Benchmarking
Employee opinion survey (longitudinal),
focus groups.
Perceptions of reward effectiveness,
fairness, competitiveness, preferences.
Perceptions of alignment with business
strategy, performance.
External Internal
© 2017 Korn Ferry. All rights reserved 32
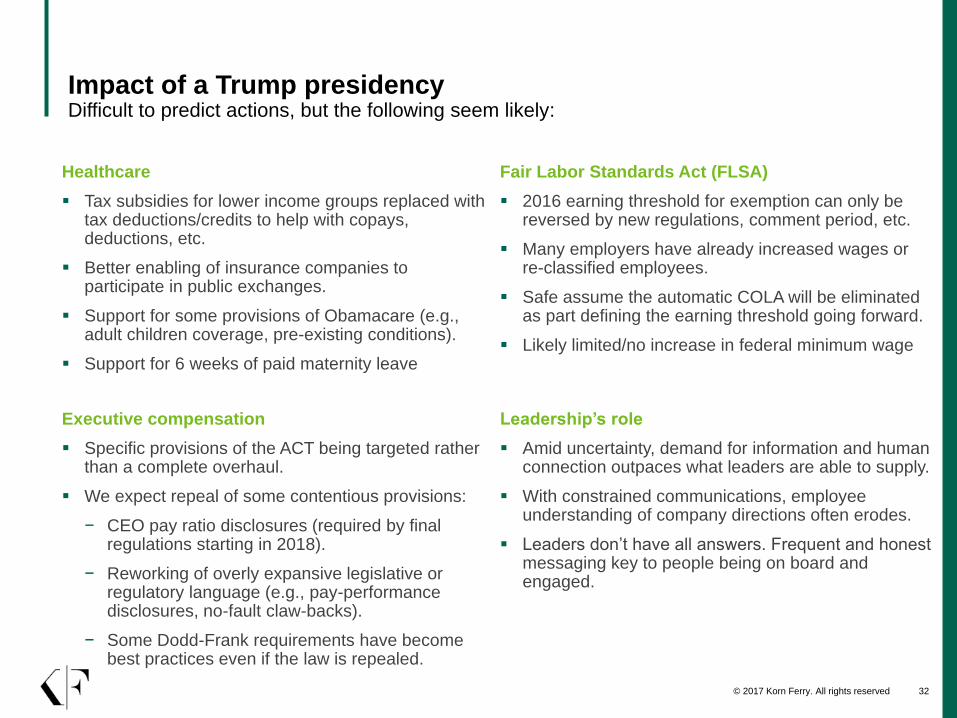
Impact of a Trump presidencyDifficult to predict actions, but the following seem likely:
Healthcare
Tax subsidies for lower income groups replaced with tax deductions/credits to help with copays, deductions, etc.
Better enabling of insurance companies to participate in public exchanges.
Support for some provisions of Obamacare (e.g., adult children coverage, pre-existing conditions).
Support for 6 weeks of paid maternity leave
Fair Labor Standards Act (FLSA)
2016 earning threshold for exemption can only be reversed by new regulations, comment period, etc.
Many employers have already increased wages or re-classified employees.
Safe assume the automatic COLA will be eliminated as part defining the earning threshold going forward.
Likely limited/no increase in federal minimum wage
Executive compensation
Specific provisions of the ACT being targeted rather than a complete overhaul.
We expect repeal of some contentious provisions:
− CEO pay ratio disclosures (required by final regulations starting in 2018).
− Reworking of overly expansive legislative or regulatory language (e.g., pay-performance disclosures, no-fault claw-backs).
− Some Dodd-Frank requirements have become best practices even if the law is repealed.
Leadership’s role
Amid uncertainty, demand for information and human connection outpaces what leaders are able to supply.
With constrained communications, employee understanding of company directions often erodes.
Leaders don’t have all answers. Frequent and honest messaging key to people being on board and engaged.

Thank you for joining our webinar today.
Tom McMullen
Senior partner and reward expertise leader, North America, Korn Ferry Hay Group
Phone: +1-312-228-1848
Email: [email protected]
U.S. product manager – Pay, Korn Ferry Hay Group
Phone: +1.215.861.2587
Email: [email protected]
Kevin Coogan