Embed Size (px)
Citation preview
The Gambia All Schools Tree Nursery Competition:
Promoting Conservation in The Gambia Through Grassroots
Environmental Education
By
Francisca E. Paulete
A REPORT
Submitted in partial fulfillment of the requirements
for the degree of
MASTER OF SCIENCE IN FORESTRY
MICHIGAN TECHNOLOGICAL UNIVERSITY
2006
This report, “The Gambia All Schools Tree Nursery Competition: Promoting
Conservation Through Grassroots Environmental Education,” is hereby approved in
partial fulfillment of the requirements for the Degree of MASTER OF SCIENCE IN
FORESTRY.
School of Forest Resources and Environmental Science
Signatures:
Advisor _______________________________________
Dr. Blair D. Orr
Dean _________________________________________
Dr. Margaret R. Gale
Date _________________________________________
TABLE OF CONTENTS LIST OF FIGURES ……………………………………………………………………… ii LIST OF TABLES ……………………………………………………………………..... iii ACKNOWLEDGEMENTS ………………………………………………………………... iv ABSTRACT …………………………………………………………………………….. vi LIST OF ACRONYMS USED ......…………………………………………………............ viii CHAPTER 1 - INTRODUCTION ………………………………………………………….. 1 CHAPTER 2 – BACKGROUND OF THE GAMBIA …………………………………..…….. 4 General Description ………………………………………………………...... 4 Climate & Topography ……………………………………………………..... 6 History of The Gambia ………………………………………………………. 7 Colonial Control & Slavery ………………………………………………..… 10 Government & Political Conditions ……………………………………….… 12 Economy & Resources ……………………………………………………...... 14 The People ……………………………………………………………………. 15 Environmental Status ….……………………………………………………... 16 Forestry & Environmental Policy ……………………………………………. 21 CHAPTER 3 - METHODS ……………………………………………………………….. 24 Competition Design, Goals & Objectives ……………………………………. 24 Manual Design & Distribution ………………………………………………. 26 School & School District Descriptions ………………………………………. 28 Central River Division Workshop ……………………………………………. 29 Competition Evaluation & Data Collection ………………………………….. 31 CHAPTER 4 – DATA & DATA ANALYSIS ………………………………………………. 36 CHAPTER 5 - RESULTS & DISCUSSION ………………………………………………… 39 Health & Survival ………………………………………..…………...……… 40 Correlation with Number of Species ……………………………….………… 53 Central River Division Workshop Results …………………………………… 54 Fostering Sustainability ……………………....…………….………………... 55 Overview of the Top Three Schools in Each Division ……………………….. 57 UPPER RIVER DIVISION ….……….………………….………………….. 57 CENTRAL RIVER DIVISION ………..……..……………………………….. 62 The Buya Factor ……………………………………..……………………….. 74 Community & Stakeholder Support ………………………………………….. 81 Problems Encountered ……………………………………..………………… 83 Summary ……………………………………………………………………… 84 CHAPTER 6 - CONCLUSIONS & RECOMMENDATIONS …………………………………. 85 LITERATURE CITED …………………………………………………………………… 89 APPENDIX A: SURVEY FORM ….……………………………………………………..... 93 APPENDIX B: DATA ………………………………………………………………….... 94 APPENDIX C: MATRIX OF PEARSON CORRELATION OF COEFFICIENTS ………....…….... 97
ii
LIST OF FIGURES
FIGURE 1: Map of Africa with The Gambia ..…………………….…………………… 4 FIGURE 2: Political map of The Gambia ..…………………………………………..... 5 FIGURE 3: Mangroves in the Western Division ………………..……………………... 7 FIGURE 4: Fort at James Island …...………………………………………………….. 9 FIGURE 5: Arch 22 in Banjul ...……………………………………………………….. 13 FIGURE 6: Groundnut winnowing ............…………………………………………….. 14 FIGURE 7: Tabaski prayer …………………………………………………………….. 16 FIGURE 8: GFPA HIV/AIDS workshop ……………………………………………….. 18 FIGURE 9: Uncontrolled bushfire …………………………………………….............. 20 FIGURE 10: Central River Division tree nursery workshop ….…………...………….. 31 FIGURE 11: Nursery at Methodist LBS ……………………………………………….. 43 FIGURE 12: Hand-sewn polypots ……………………………………………….…….. 44 FIGURE 13: Soda cans used as polypots …………………………………………….... 45 FIGURE 14: Milk containers used as polypots ………………………………………... 46 FIGURE 15: Nursery at Mabali Kuta LBS …………………………………………….. 48 FIGURE 16: Nursery at Jamali LBS ………………….……………………………….. 49 FIGURE 17: Mixing soil ……………………………………………………………….. 51 FIGURE 18: Nursery at Song Kunda LBS ….………………………………………….. 59 FIGURE 19: Wall mural at Song Kunda LBS ………………………………………..... 61 FIGURE 20: Students at Daru LBS ...………………………………………………….. 64 FIGURE 21: Species list at Saruja LBS ……………….……………………………….. 67 FIGURE 22: Extra polypots at Saruja LBS ...………………………………………….. 69 FIGURE 23: Nursery at Saruja LBS ..………………………………………………….. 70 FIGURE 24: Nursery at Saruja LBS ..………………………………………………….. 71 FIGURE 25: Nursery at Saruja LBS ..………………………………………………….. 72 FIGURE 26: Nursery at Saruja LBS ..………………………………………………….. 73 FIGURE 27: Diabugu BCS after competing ………..………………………………….. 79 FIGURE 28: Diabugu BCS before competing ………..……………………….……….. 80 FIGURE 29: GGFP ‘No Trees, No Life’ billboard …...……………………………….. 85
iii
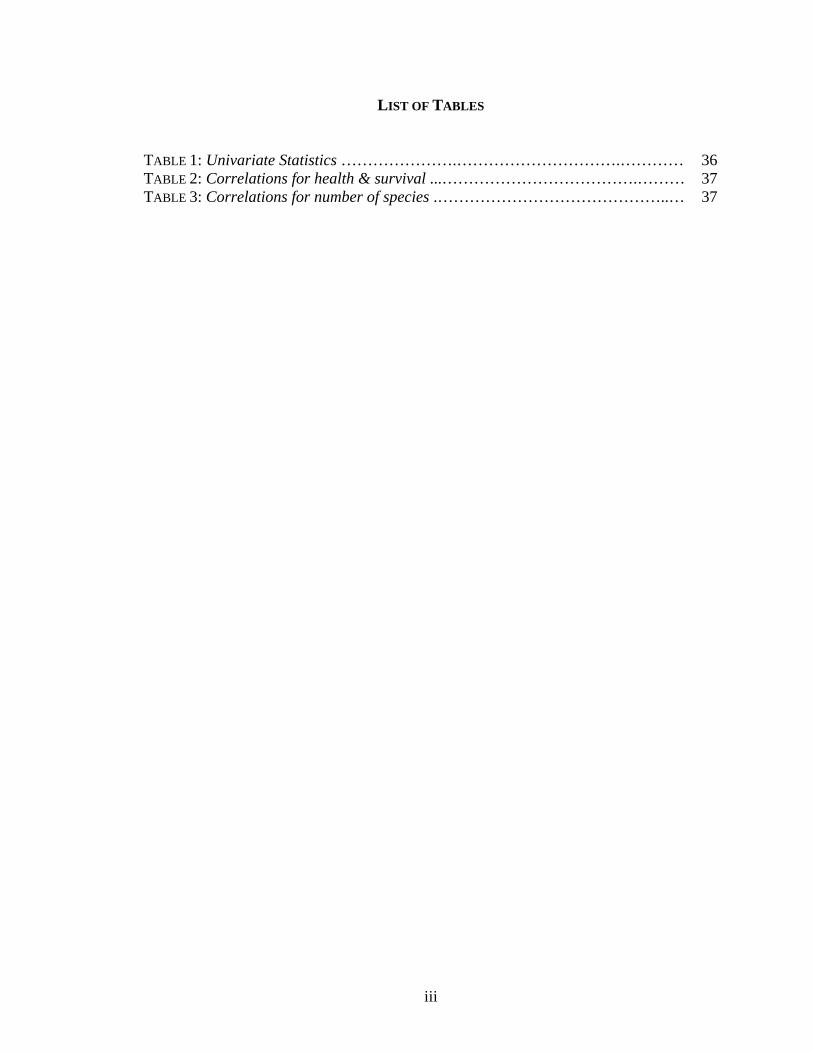
LIST OF TABLES
TABLE 1: Univariate Statistics ………………….………………………….………… 36 TABLE 2: Correlations for health & survival ...……………………………….……… 37 TABLE 3: Correlations for number of species .……………………………………..… 37
iv
ACKNOWLEDGEMENTS
My journey to create this report would have been impossible if not for the support
and help of many people both in America and back in The Gambia.
I would first like to thank my advisor, Blair, for all of his time and patience in the
entire process from the first day I arrived in Houghton until the day I left as a graduate.
His dedication to my work kept me from panicking over the small stuff. You truly go
above and beyond in your role as an advisor.
I would like to thank my committee, Peg Gale, Linda Nagel, and Marilyn Cooper,
for their time and support in this project.
I also need to thank my friends and family back home for letters of
encouragement and care packages received throughout the two years. Knowing the
support I had truly made a difference.
In The Gambia, I would like to relay my unending thanks to the members of the
Georgetown and Basse Regional Educational Directorates and the Departments of
Forestry. The Gambia All Schools Tree Nursery Competition could not have succeeded
without you and I know continues to succeed because of you. Ali abaaraka bake!
I would also like to thank Seikou Samateh of the Department of Forestry in
Banjul for his energies and support.
I would like to thank the members of Peace Corps/The Gambia who supported
and encouraged me and other volunteers in the efforts to have this competition succeed.
And thank you to Diana Sloane for the support you gave this competition and to me.
I must also give my wholehearted thanks to my Peace Corps family and friends
who I will never be the same because of:
v
To the staff members: Nooda, Sarjo, Babucar, Haadi, Isatou, Bah2, and Barbara;
you each supported me in your own ways through laugher and kindness that I remember
and hold as a dear part of my time in The Gambia.
To my fellow PCVs: Yeti, Robot, Ham & Cheese, Donkey Boy, Scotious, Goo,
Isatou Bah, Ali Sallah, Kumba, FT, BJ, Buya, Buba, Malik, and, of course, Troublesome.
All of you - I miss you hundred years! Double seriously! Now get in the car!
I must also thank PCVs Streffy, Shaka, Brower, Blaschke, JCap, and Sainabou,
for helping me out here with pictures, references, and moral support. Jaaraama whay!
But mostly, I would like to thank all the schools, teachers, and students that took
the idea of the Gambia All Schools Tree Nursery Competition and made it their own. It is
because of you that we Peace Corps succeed. And it will be because of you that The
Gambia will someday be covered with trees again.
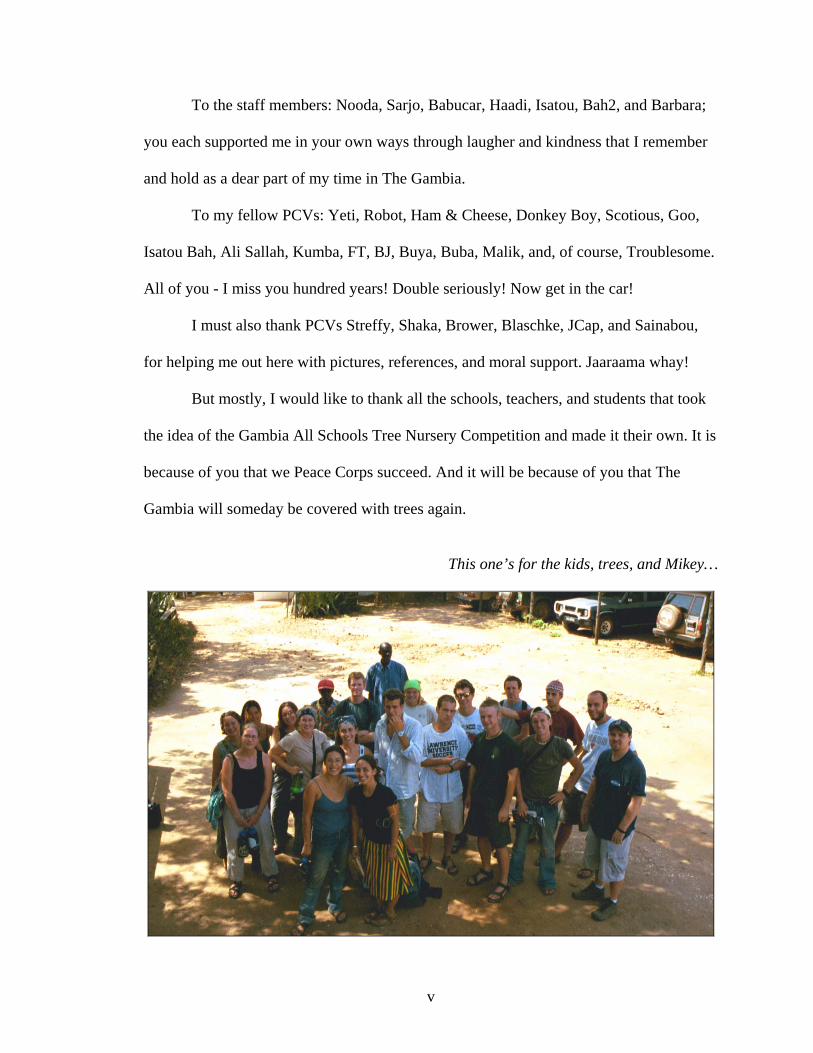
This one’s for the kids, trees, and Mikey…
vi
ABSTRACT
Awareness of the problem of deforestation and what people can do to combat it is
low in The Gambia. As recently as the mid-1940s measurements show that the country’s
forest cover was as high as 81%. Today only about 41.6% (4710 sq.km.) of The Gambia
is forested. The forest cover continues to be reduced by overpopulation through
cultivation, heavy grazing and fires.
This report documents and analyzes the Gambia All Schools Tree Nursery
Competition, a practical environmental education program used to counter environmental
problems in The Gambia. Seventy-five schools in two of The Gambia’s six districts
developed forest nurseries under the guidance of the Department of Forestry, the
Regional Education Directorate, and Peace Corps/The Gambia. It analyzes the methods
taken in implementing grassroots environmental education in The Gambia and discusses
improvements and changes to the methods implemented.
The competition was originally designed in the 2003 – 2004 school year by Peace
Corps Volunteers with cooperation from the Department of Forestry and Regional
Education Directorate in the Upper River Division. The project was designed to have all
schools compete against all other schools in the division to construct and maintain the
best tree nursery. Schools were given only a manual (produced by Peace Corps
Volunteers) to begin and complete the project. The project was expanded in the 2004 –
2005 school year to include the Central River Division.
Data for this report was collected during the evaluation trek for the competition
using a rapid appraisal approach. The data were then broken into four groups of
information: physical aspects (shade, fencing, proximity to watersource, use of natural
vii
pesticides, use of fertilizer, number of species), school demographics (grade levels,
location, size), types of outside help (workshop, Peace Corps Volunteer or forester
assistance), and outcomes (health, survival).
The more technical elements of the competition (shade, fencing, proximity to
watersource, pesticides, fertilizers, number of species, and the regular and weighted
sums) are significant to health and survival of the nursery. Quite obviously, if these
elements fail, the trees will fail to grow; a nursery cannot grow if these elements are
absent.
However, the extent to which they work or the motivation behind them getting
done are heavily reliant on stakeholder support on both the large project level and on the
smaller individual school level. Both levels can be seen in this project. There was greater
participation on the project level in the Central River Division, where stakeholders took a
more active role. Schools with strong support of the communities and teachers produced
bigger and better nurseries.
viii
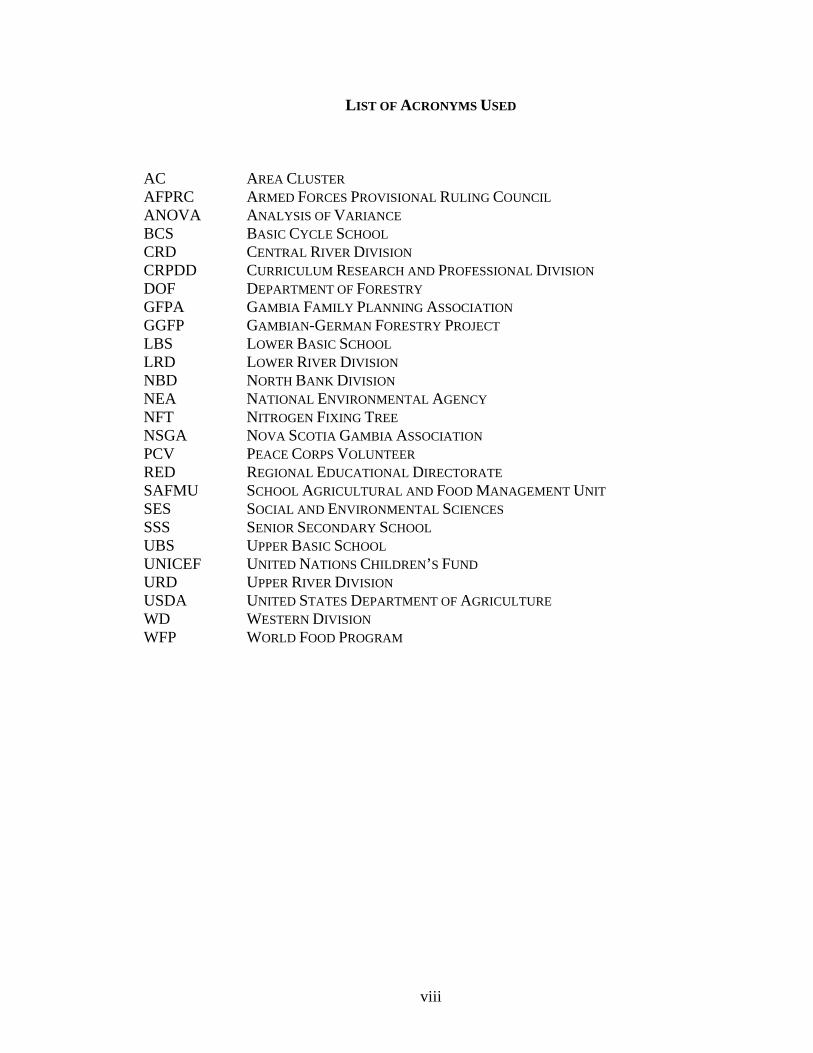
LIST OF ACRONYMS USED
AC AREA CLUSTER AFPRC ARMED FORCES PROVISIONAL RULING COUNCIL ANOVA ANALYSIS OF VARIANCE BCS BASIC CYCLE SCHOOL CRD CENTRAL RIVER DIVISION CRPDD CURRICULUM RESEARCH AND PROFESSIONAL DIVISION DOF DEPARTMENT OF FORESTRY GFPA GAMBIA FAMILY PLANNING ASSOCIATION GGFP GAMBIAN-GERMAN FORESTRY PROJECT LBS LOWER BASIC SCHOOL LRD LOWER RIVER DIVISION NBD NORTH BANK DIVISION NEA NATIONAL ENVIRONMENTAL AGENCY NFT NITROGEN FIXING TREE NSGA NOVA SCOTIA GAMBIA ASSOCIATION PCV PEACE CORPS VOLUNTEER RED REGIONAL EDUCATIONAL DIRECTORATE SAFMU SCHOOL AGRICULTURAL AND FOOD MANAGEMENT UNIT SES SOCIAL AND ENVIRONMENTAL SCIENCES SSS SENIOR SECONDARY SCHOOL UBS UPPER BASIC SCHOOL UNICEF UNITED NATIONS CHILDREN’S FUND URD UPPER RIVER DIVISION USDA UNITED STATES DEPARTMENT OF AGRICULTURE WD WESTERN DIVISION WFP WORLD FOOD PROGRAM
1
CHAPTER 1 - INTRODUCTION
Deforestation and desertification are two of the most glaring problems one
witnesses when visiting The Gambia. For outsiders, it can be difficult to see the country
in such environmental despair with the people, seemingly, not working to reverse the
problems. After spending two years in the country as a Peace Corps Volunteer (PCV) in
the Environmental sector, I began to understand that it was not that Gambians did not
notice or not care about the state of their environment, but that they simply did not know
how they could make a difference, with life being lived from day to day and rainy season
to rainy season.
The Gambia All Schools Tree Nursery Competition was developed to teach
students the value of trees in the environment and how humans contribute to
deforestation. They also learned the relative ease with which trees can be raised to
replenish and supplement the natural environment.
Working with the children of The Gambia to develop this new way of viewing the
environment was attractive to me from the start. The competition’s inaugural year had
been conducted in the district only five kilometers from my village. As a volunteer from
another region, I did not work with the competition, but was able to see several stages of
one volunteer’s efforts at two schools in particular. However, it was not until the day
before the awards ceremony, over a few cucumbers covered in Cheez Whiz and some
Nescafé with my sitemate, that the idea of turning this project into a research topic struck
me.
2
The competition was being moved into my division the next school year. With the
increase in responsibility, I agreed to assist with the coordination of the competition in
the Central River Division, while primarily focusing on how best to collect data for
analysis back at Michigan Technological University. After the awards ceremony, I sat
down with the two other volunteers that would be coordinating the project the next year
and we reviewed the previous year and set goals and objectives for the expansion.
Then, suddenly, there was one.
The two volunteers coordinating the competition suddenly left the country. Left to
plan and conduct the competition on my own, I felt overwhelmed at the idea of making
this my master’s research as well. So the objectives of the research were changed to
accommodate the time constraints and another volunteer joined my effort to help the
competition continue. And a tree grew in The Gambia.
My objective for this report was to evaluate the Gambia All Schools Tree Nursery
Competition and determine which elements of the implementation were most successful
in the outcomes of the competition. From this evaluation, conclusions as to effective uses
of time in the coordination of the project were determined.
Chapter two describes the background of The Gambia, providing a general
overview and covering historical and modern occurrences that have shaped the country. I
also give an overview of the people and their lifestyles. To end the country’s description,
I review the environmental policy in The Gambia and its brief history and effects.
The processes I undertook to coordinate the tree nursery competition and to
collect my data are covered in chapter three. Details of the competition’s design and
3
implementation as well as a description of the school system in The Gambia can be found
here.
Chapter four presents the data collected in conducting this research topic. I also
discuss the statistical methods used in analysis of the data.
Discussion of the results takes place in chapter five. I discuss the two test
variables, health and survival, and correlations found between them and explanatory
variables. Additionally, the correlation between number of species and other variables is
discussed. I review the effect the workshop in the Central River Division held on the
schools in the competition. I look at each of the top three schools in each region and their
achievements. Sustainability of the project on large and individual school scales is further
evaluated. Lastly, I discuss problems encountered in the coordination of a project of this
magnitude in The Gambia.
In chapter six, I review the conclusions revealed from the data. Recommendations
based on this are discussed based on the competition’s progress in The Gambia. Further
considerations when adapting the project to other communities outside of The Gambia
are also considered.
4
CHAPTER 2 - BACKGROUND OF THE GAMBIA
General Description
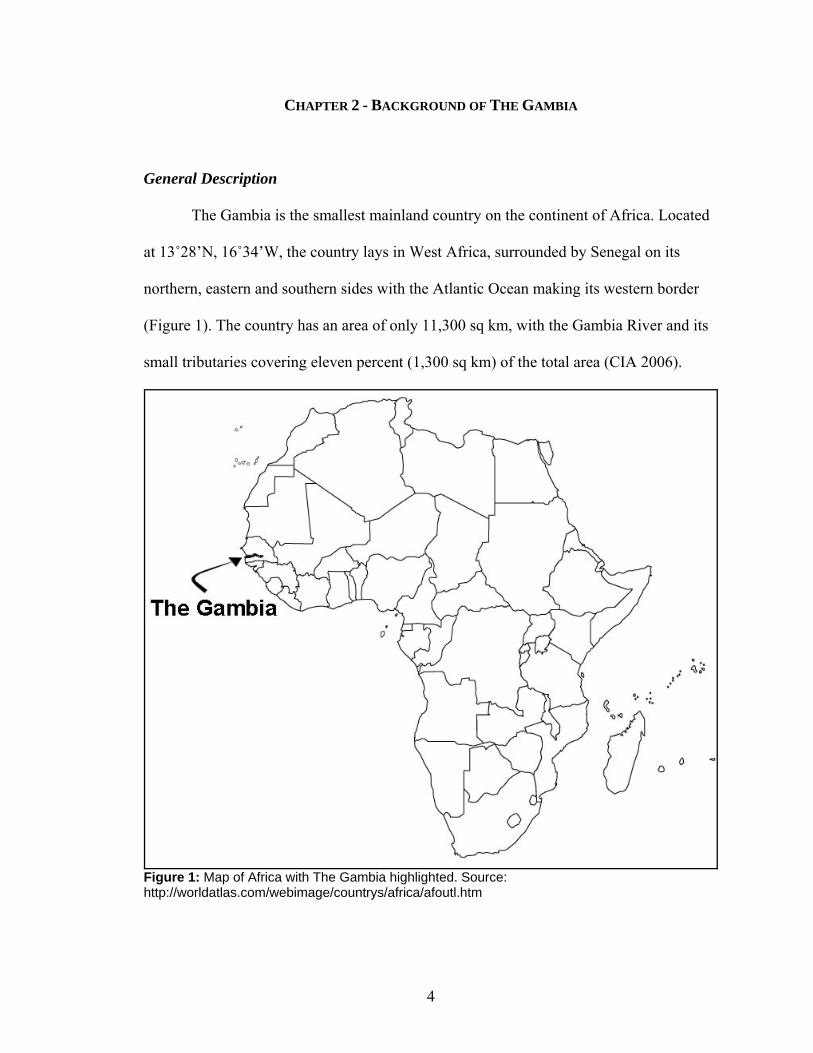
The Gambia is the smallest mainland country on the continent of Africa. Located
at 13˚28’N, 16˚34’W, the country lays in West Africa, surrounded by Senegal on its
northern, eastern and southern sides with the Atlantic Ocean making its western border
(Figure 1). The country has an area of only 11,300 sq km, with the Gambia River and its
small tributaries covering eleven percent (1,300 sq km) of the total area (CIA 2006).
Figure 1: Map of Africa with The Gambia highlighted. Source: http://worldatlas.com/webimage/countrys/africa/afoutl.htm
5
The Gambia River splits the country from east to west into two landmasses,
discharging into the Atlantic and entering through the far end of the country from the
Fouta Djallon region of northeastern Guinea through southwestern Senegal. The width of
the country averages about thirty-five kilometers with a coastline of eighty kilometers
and only six kilometers at the country’s narrowest point (Newton 1988). The Gambia’s
terrain is a river floodplain with a few low hills, its elevation levels range from 0 m.a.s.l
to only 53 m.a.s.l. near Basse in the Upper River Division (CIA 2006; Jones 1994; Grey-
Johnson 1997).
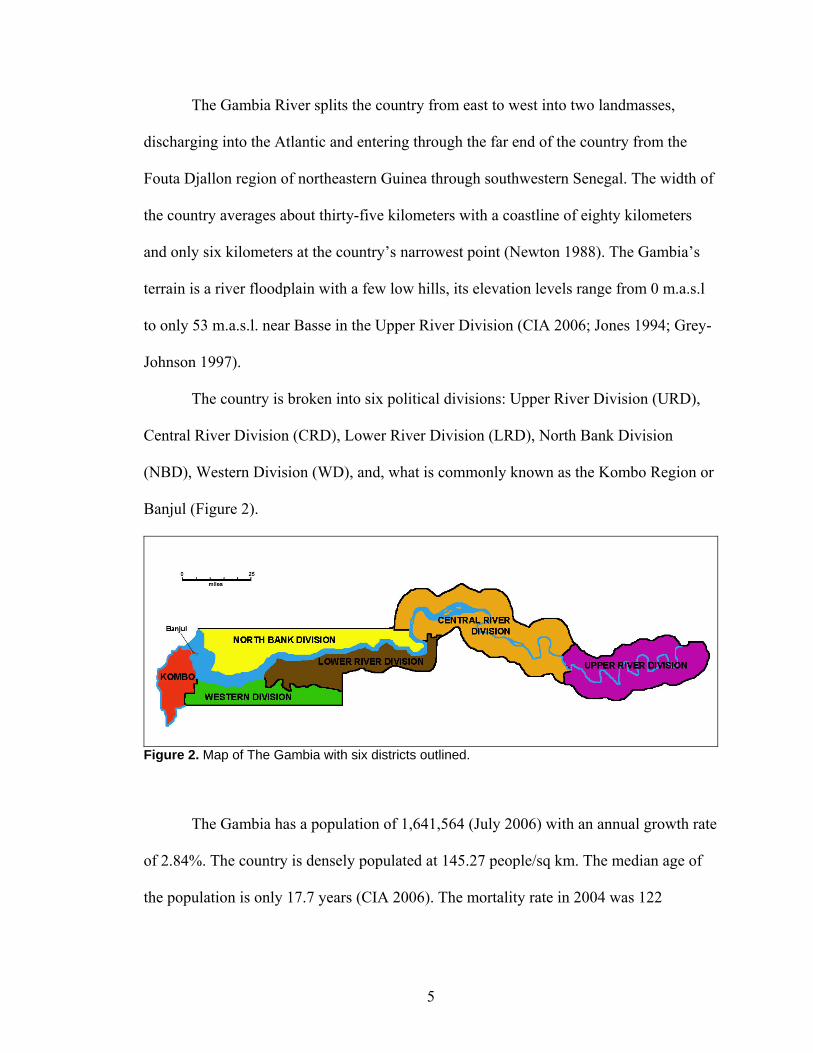
The country is broken into six political divisions: Upper River Division (URD),
Central River Division (CRD), Lower River Division (LRD), North Bank Division
(NBD), Western Division (WD), and, what is commonly known as the Kombo Region or
Banjul (Figure 2).
Figure 2. Map of The Gambia with six districts outlined.
The Gambia has a population of 1,641,564 (July 2006) with an annual growth rate
of 2.84%. The country is densely populated at 145.27 people/sq km. The median age of
the population is only 17.7 years (CIA 2006). The mortality rate in 2004 was 122
6
children under the age of five per 1000 (World Bank 2006). More than half of the people
in the country (59.3%) live on less than $1 US a day (UNDP 2006).
Climate & Topography
The climate of The Gambia technically has only two seasons: a wet season from
June to November; a dry season from November to June. The first months of this dry
season are marked by pleasant days and cool evenings. However, temperatures during the
months of February to June mark a hot, dry season with temperatures reaching above
130˚F and averaging about 110-120˚F. Storms in the rainy season are often intense, with
rainfall exceeding 40 mm in a span of only a few kilometers. Overall rainfall has declined
30% in the last 30 years, with both reduced volume and duration of the rains (Jones 1994;
CIA 2006).
The Gambia is composed of two major soils. Soils formed from the Continental
Terminal are derived from iron-rich sandstone or quartz, tropical soils that sit on a layer
of laterite rock. They have been pressed into ironpans that have been eroded over time,
especially in the eastern region. They have low fertility, a pH of 5.8 – 6.4, and low
organic matter content. Continental Terminal soils formed over millions of years from
eroded soil that has washed back up from the Atlantic Ocean (Jones 1994).
The valley carved by the Gambia River is composed of sand and clay alluvial
deposits. They are fine textured and are predominantly (80% or more) silt and clay.
Furthermore, soils west of Kudang, CRD, have been infiltrated with saline water and are
now mangrove swamps or barren flats (Figure 3) (Jones 1994).
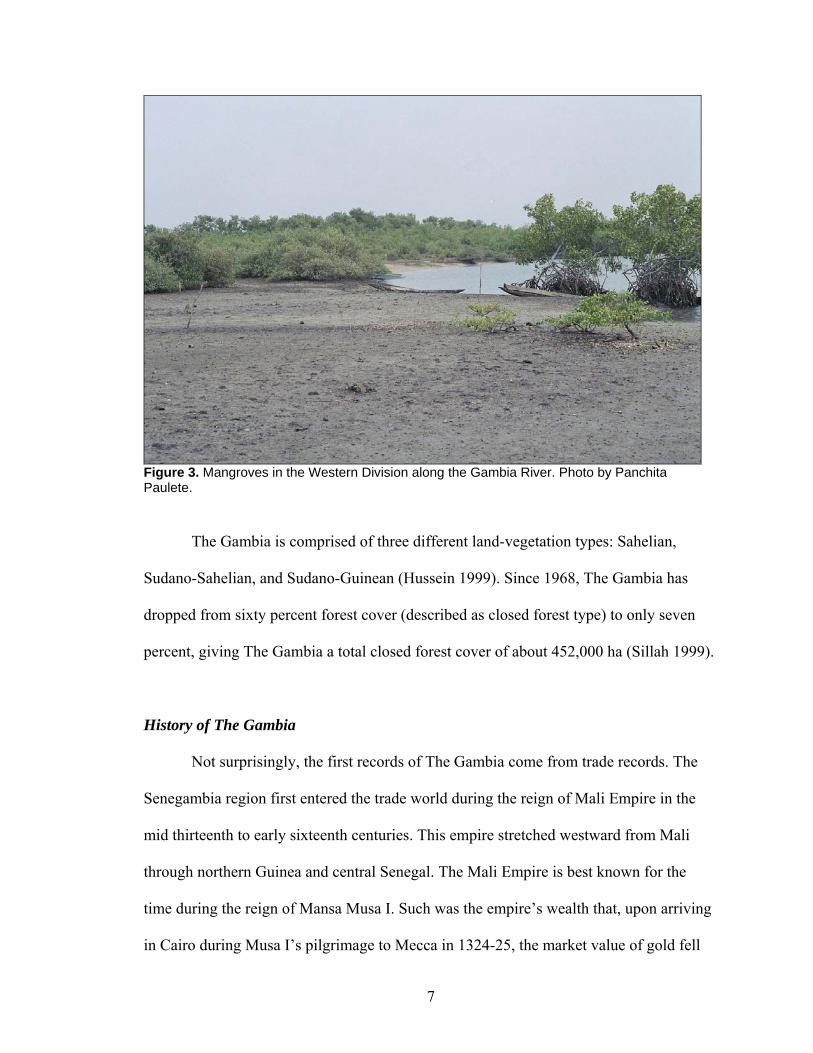
7
Figure 3. Mangroves in the Western Division along the Gambia River. Photo by Panchita Paulete.
The Gambia is comprised of three different land-vegetation types: Sahelian,
Sudano-Sahelian, and Sudano-Guinean (Hussein 1999). Since 1968, The Gambia has
dropped from sixty percent forest cover (described as closed forest type) to only seven
percent, giving The Gambia a total closed forest cover of about 452,000 ha (Sillah 1999).
History of The Gambia
Not surprisingly, the first records of The Gambia come from trade records. The
Senegambia region first entered the trade world during the reign of Mali Empire in the
mid thirteenth to early sixteenth centuries. This empire stretched westward from Mali
through northern Guinea and central Senegal. The Mali Empire is best known for the
time during the reign of Mansa Musa I. Such was the empire’s wealth that, upon arriving
in Cairo during Musa I’s pilgrimage to Mecca in 1324-25, the market value of gold fell
8
by twelve percent. Shortly after the end of Musa I’s reign, the empire went into a decline.
Religious disputes arose between the Islamic traders and animist gold miners and
farmers. The empire fell when Songhai peoples withdrew their allegiance. These traders
were the key to communication through the Niger bend and middle Niger River areas.
Sonni Ali claimed the throne of the new Songhai Empire in 1464 (Fletcher 1977; Wright
2004).
Gaining strength around its capital city of Gao, the Songhai Empire expanded its
reign beyond the borders of the Mali Empire through brutal conquests into northern
Guinea-Bissau, Benin and Nigeria and into western Niger. Animists had given full
support to this new empire that also controlled the trade routes and major cities. The
Songhai Empire at its height in the fifteenth and sixteenth centuries had surpassed the
wealth of the Mali Empire. Askia Muhammed came to rule at the turn of the century. He
revived Islam in the realm, causing tensions with the traditional animists to escalate
again. This left the Songhai open and vulnerable when Moorish leaders sent forces on a
cross-Saharan march to invade Gao, Timbuktu and Djenné. In 1591, the cities and empire
fell to Moroccan rule. Morocco’s rule lasted only 20 years, and the empire fell to smaller
kingdoms (Fletcher 1977; Bovill 1926).
While the Songhai Empire was falling, Europe had found The Gambia. Portugal
was the first country to establish maritime trade with people on the African coast. By
1456, they had reached The Gambia. Slaves, gold and ivory were brought back to
Europe. But in 1588, Portugal sold the exclusive rights to the Gambia River to English
merchants. Shortly after this, part of The Gambia was leased by Courland, part of
modern-day Latvia and Lithuania. They settled a small island 30 km from the mouth of
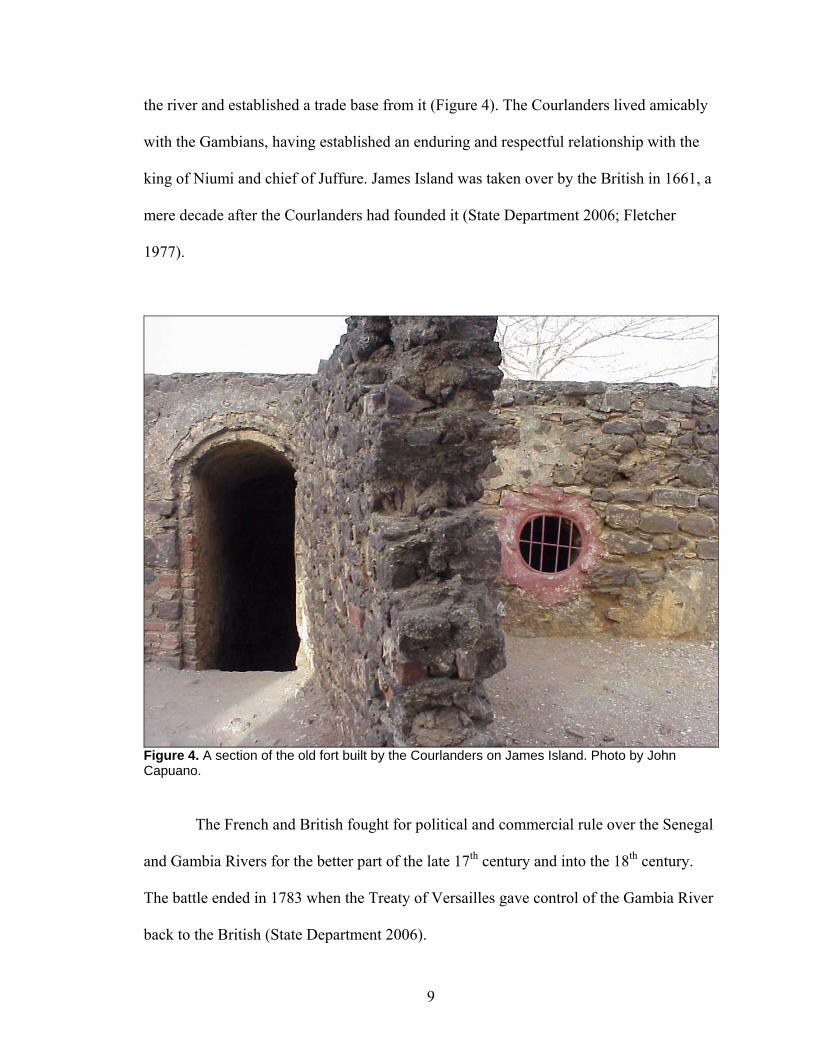
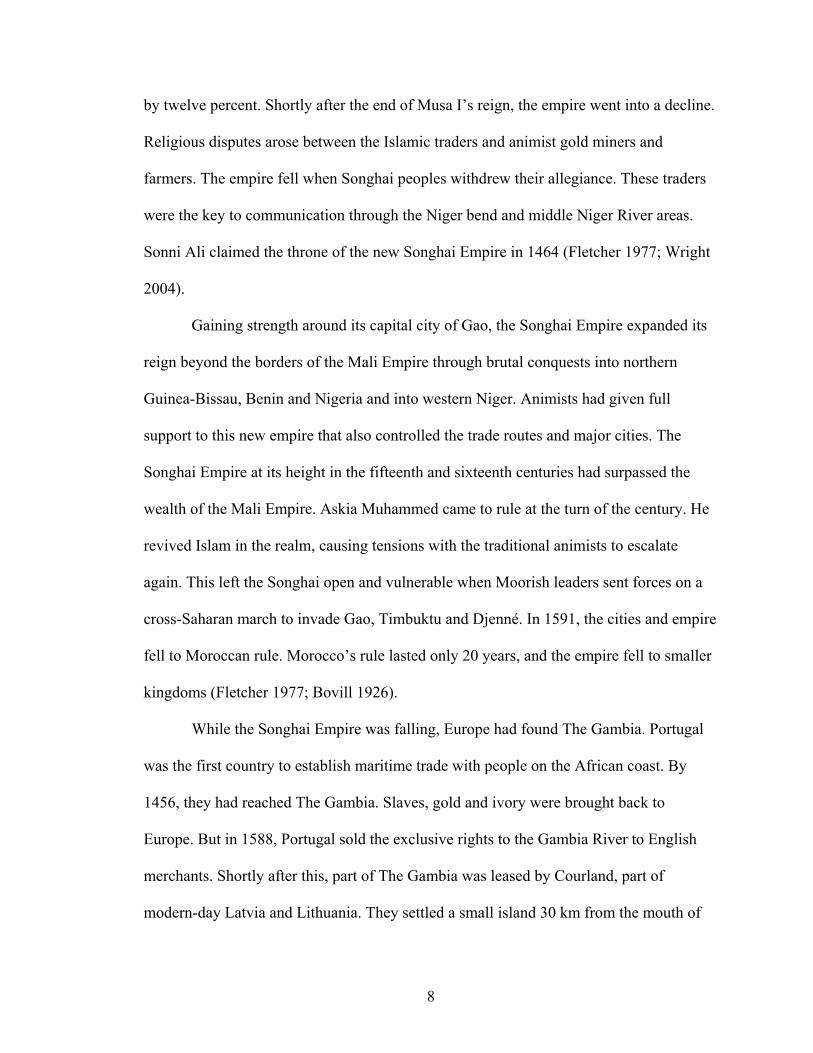
9
the river and established a trade base from it (Figure 4). The Courlanders lived amicably
with the Gambians, having established an enduring and respectful relationship with the
king of Niumi and chief of Juffure. James Island was taken over by the British in 1661, a
mere decade after the Courlanders had founded it (State Department 2006; Fletcher
1977).
Figure 4. A section of the old fort built by the Courlanders on James Island. Photo by John Capuano.
The French and British fought for political and commercial rule over the Senegal
and Gambia Rivers for the better part of the late 17th century and into the 18th century.
The battle ended in 1783 when the Treaty of Versailles gave control of the Gambia River
back to the British (State Department 2006).
10
Colonial Control & Slavery
In 1807, the British Empire abolished slavery. However, their attempts to stop the
slave traffic in The Gambia did not work. Since the early 1500s, the beginning of the
transatlantic slave trading, more than 3 million people had been taken from this region.
James Island had provided a fortress from which traders could dispense smaller boats to
go and collect slaves and other goods while harboring their bigger vessels in sheltered,
deeper waters (State Department 2006; Fletcher 1977).
James Island and Juffure became famous when Alex Haley chronicled his
ancestor, Kunta Kinteh, and the trans-Atlantic slave trade in Roots: The Saga of an
American Family (1976). The historical validity of the village’s description and pre-Civil
War genealogy have since been questioned, but Roots received a Pulitzer Prize for its
influence in raising interest in African-American history (Wright 2004).
Strong evidence of continued slave trade by French, Spanish and American
traders continued well into the decade after Britain’s Abolition Act had made this illegal.
A military post was established to control the slave trade in Bathurst, modern day Banjul,
in 1816. The city was settled, and soldiers were successful in stopping the slave trade
within the year. Ironically, this left Gambians economically worse off than before. Now
having to depend on peanut trade, many rural people saw marked declines in their quality
of life. This spurned internal conflict in The Gambia. The Marabout-Soninke Wars lasted
50 years and left Gambians divided and damaged (Fletcher 1977).
Officially, the country was ruled throughout these wars off and on by the British
governor general in Freetown, Sierra Leone. With the ending of the wars, The Gambia
was in more favorable shape for colonialism. In 1888, it became its own entity, having
11
been separated from the Senegalese territory. The French and British came to an
agreement, allowing the British to control the Gambia River. Thus, in 1889, the present-
day boundaries were drawn and The Gambia became a crown colony (Fletcher 1977;
State Department 2006).
The Gambia was separated into the colony, which consisted of the city of Bathurst
and surrounding towns, and the protectorate. The protectorate was divided into seventeen
administrative divisions, based on geography. Each division was assigned its own chief,
who in turn was directed by the governor in Bathurst. The differences in efficiency of this
theoretical and actual indirect rule of the country were great. British were beginning to
lose interest in their claim. The Gambia and its waterway became less important with the
construction of a rail line from Dakar to Bamako. But Gambians were content with their
British rulers and local leaders enjoyed their new status and wealth. Seeing that they
would not get any trouble from Gambians, the two countries maintained an indifferent
relationship with each other. As a result, few investments were made by the British
outside of Bathurst (Fletcher 1977; State Department 2006).
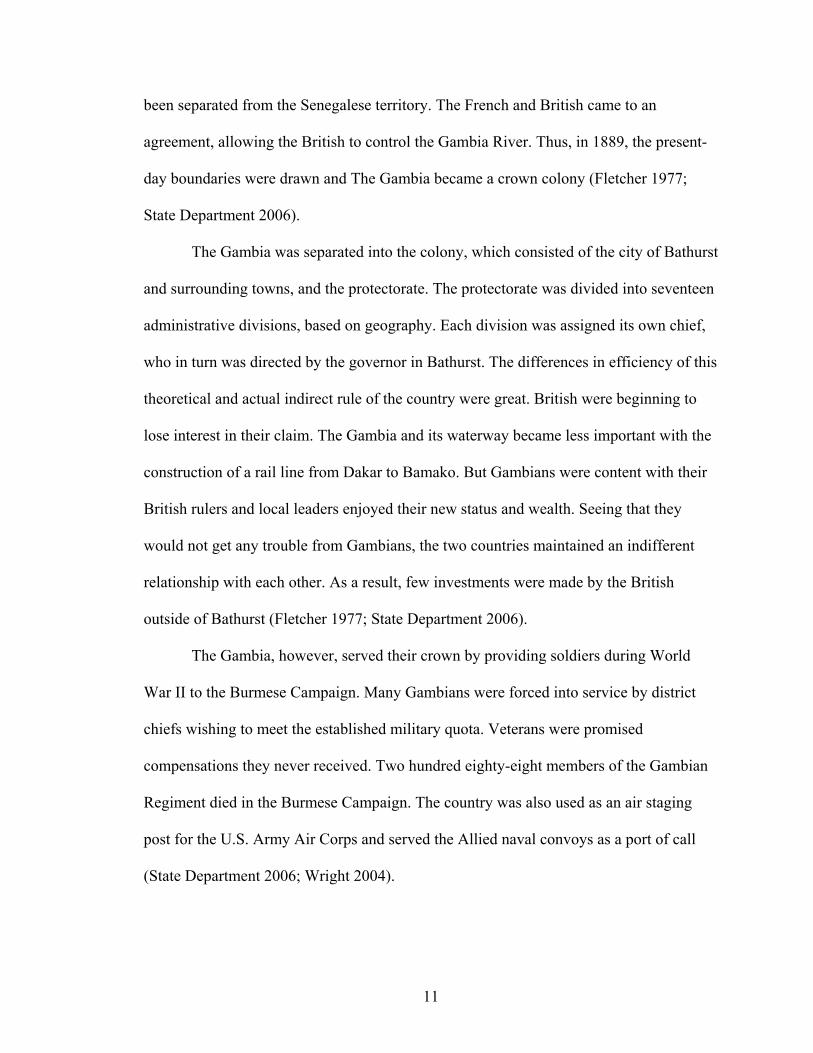
The Gambia, however, served their crown by providing soldiers during World
War II to the Burmese Campaign. Many Gambians were forced into service by district
chiefs wishing to meet the established military quota. Veterans were promised
compensations they never received. Two hundred eighty-eight members of the Gambian
Regiment died in the Burmese Campaign. The country was also used as an air staging
post for the U.S. Army Air Corps and served the Allied naval convoys as a port of call
(State Department 2006; Wright 2004).
12
The Gambia played an understated role in world history during WWII. On
January 14, 1943, aboard a small seaplane, U.S. President Franklin D. Roosevelt stopped
overnight on his way to meet with British Prime Minister Winston Churchill in
Casablanca. Casting his eyes for the first time on the colonial world, Roosevelt was
shocked by its appearance. He told his son, Elliott, of the conditions he saw in Bathurst
when he arrived in Casablanca the next day. It was this night that Elliott remembers his
father first speaking of a “United Nations” that should help in the role of “bringing
education, raising the standards on living, improving the health conditions of all the
backward, depressed colonial areas of the world” (Wright 1995). This visit, and
subsequent naggings of Churchill, inspired the Colonial Office to begin development
projects in the colony.
In 1963, general elections were held and The Gambia was granted full, internal
self-government. It gained independence on February 18, 1965, as a constitutional
monarchy within the Commonwealth of Nations. Five years later, following a
referendum, the country became a republic on April 24, 1970 (State Department 2006).
Government & Political Conditions
In the years that followed, The Gambia was led by President Sir Dawda Kairaba
Jawara. After a violent but unsuccessful coup attempt in 1981, The Gambia signed the
1982 Treaty of Confederation with Senegal, forming the Senegambia Confederation. This
union was short lived, and dissolved in 1989. Jawara remained in office until the coup in
July 1994 when the Armed Forces Provisional Ruling Council (AFPRC) led by Lt. Yahya
13
A.J.J. Jammeh took control. Jawara had been re-elected five times (State Department
2006).
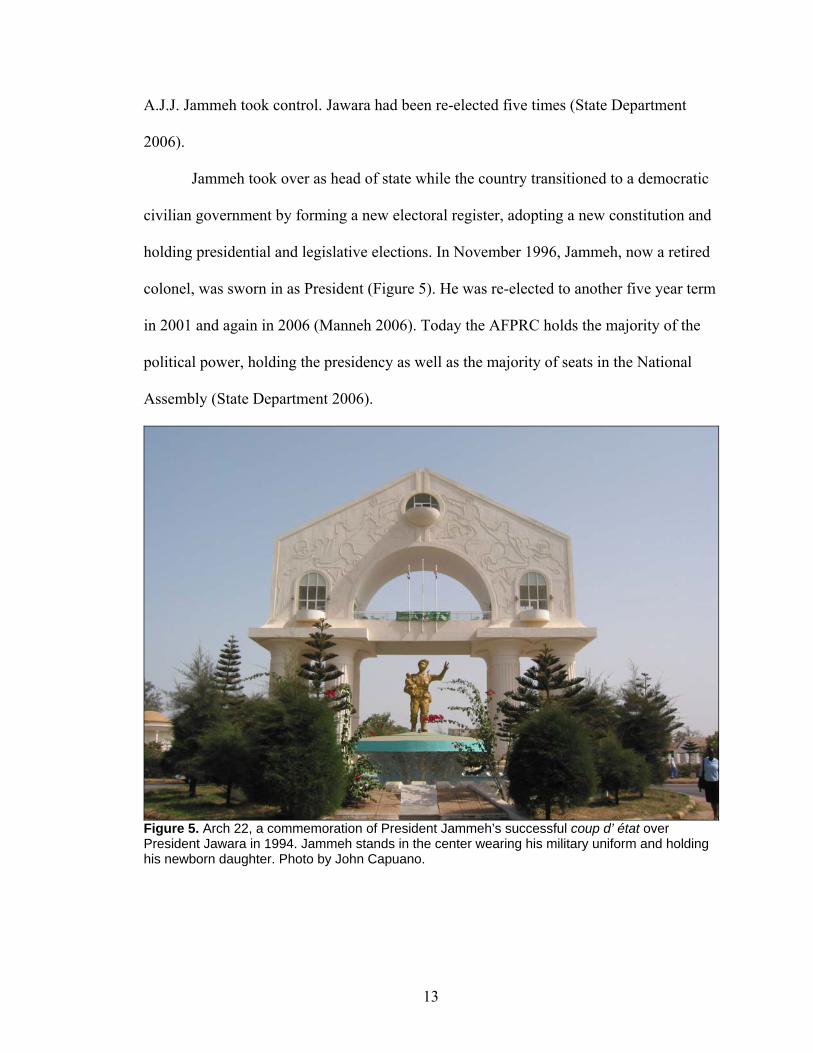
Jammeh took over as head of state while the country transitioned to a democratic
civilian government by forming a new electoral register, adopting a new constitution and
holding presidential and legislative elections. In November 1996, Jammeh, now a retired
colonel, was sworn in as President (Figure 5). He was re-elected to another five year term
in 2001 and again in 2006 (Manneh 2006). Today the AFPRC holds the majority of the
political power, holding the presidency as well as the majority of seats in the National
Assembly (State Department 2006).
Figure 5. Arch 22, a commemoration of President Jammeh’s successful coup d’ état over President Jawara in 1994. Jammeh stands in the center wearing his military uniform and holding his newborn daughter. Photo by John Capuano.
14
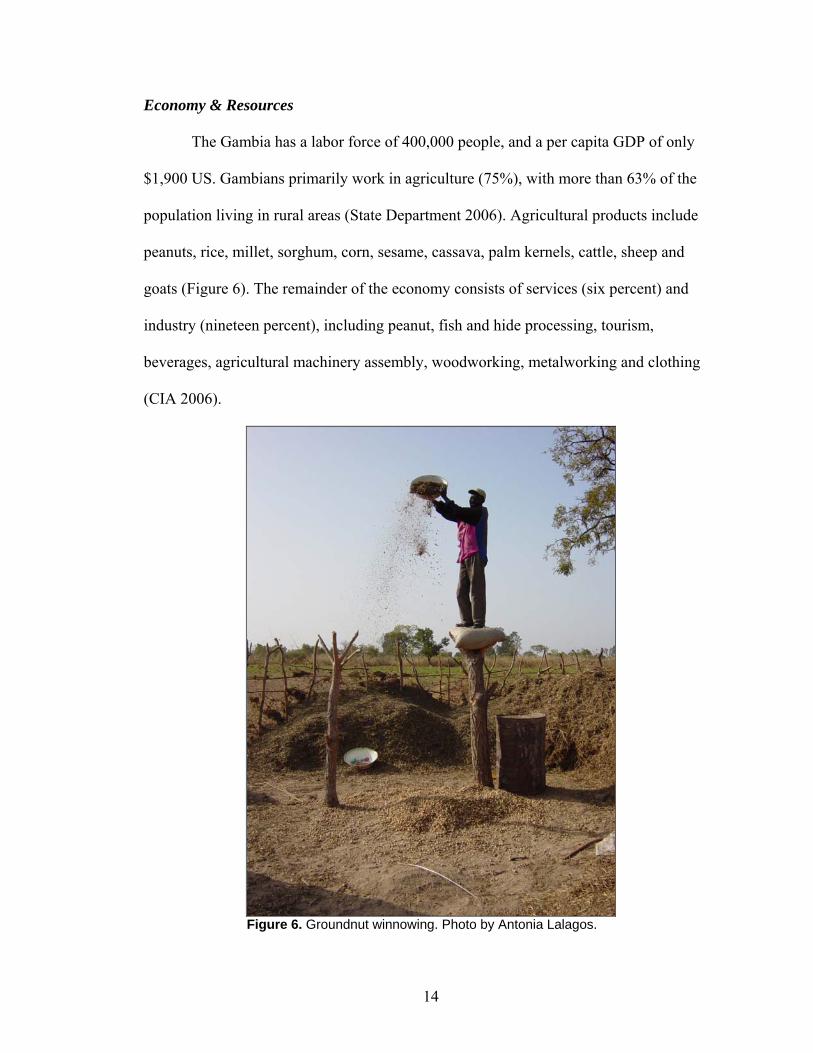
Economy & Resources
The Gambia has a labor force of 400,000 people, and a per capita GDP of only
$1,900 US. Gambians primarily work in agriculture (75%), with more than 63% of the
population living in rural areas (State Department 2006). Agricultural products include
peanuts, rice, millet, sorghum, corn, sesame, cassava, palm kernels, cattle, sheep and
goats (Figure 6). The remainder of the economy consists of services (six percent) and
industry (nineteen percent), including peanut, fish and hide processing, tourism,
beverages, agricultural machinery assembly, woodworking, metalworking and clothing
(CIA 2006).
Figure 6. Groundnut winnowing. Photo by Antonia Lalagos.
15
The People
As a result of its rich history, The Gambia today is a diverse country. With three
prominent and three lesser represented tribes, the streets and markets are often a blend of
languages. The largest tribe, the Mandinkas (42%), came to the region during the reign of
the Mali Empire. Originating from the Malinke peoples, they were attracted to the
Gambia River area because of the thriving trade (Fletcher 1977). The people of the Fula
(eighteen percent) tribes in this area predominately come from the Fouta Djallon region
of Guinea, but also have ties to Mauritania, northern Senegal and other West African
nations. The Wolofs (sixteen percent) are descendants of the Songhai peoples of western
Mali and Niger. These three tribes and the smaller three, Jola (ten percent), Serahule
(nine percent) and Serer (four percent), today live peacefully mixed throughout the
country’s divisions (CIA 2006).
The official language of the country is English, with Mandinka, Pulaar and Wolof
spoken throughout. Although all children are provided free education through grade six,
the enrollment rate is only 81% for primary school. Secondary school enrollment rates
are only 47% (World Bank 2006). Reasons for a low enrollment rates stem from the idea,
in the more traditional and rural villages, that western education is not something of
value. Boys are sent to Islamic schools and girls are rarely educated, especially above
grade six. The common argument received for this was once relayed by what PCVs
warmly call ‘Old Pa’s’ - a man ancient in appearance and rich with humor: “You send
your son to the western schools, he’ll leave you and never return. You send him to study
Allah, he stays with you forever.” In a country where the family is not only important but
key for survival, it is easy to see why western schools are viewed as less important.
16
However, this also leaves the country with a literacy rate of only 37.8% (State
Department 2006).
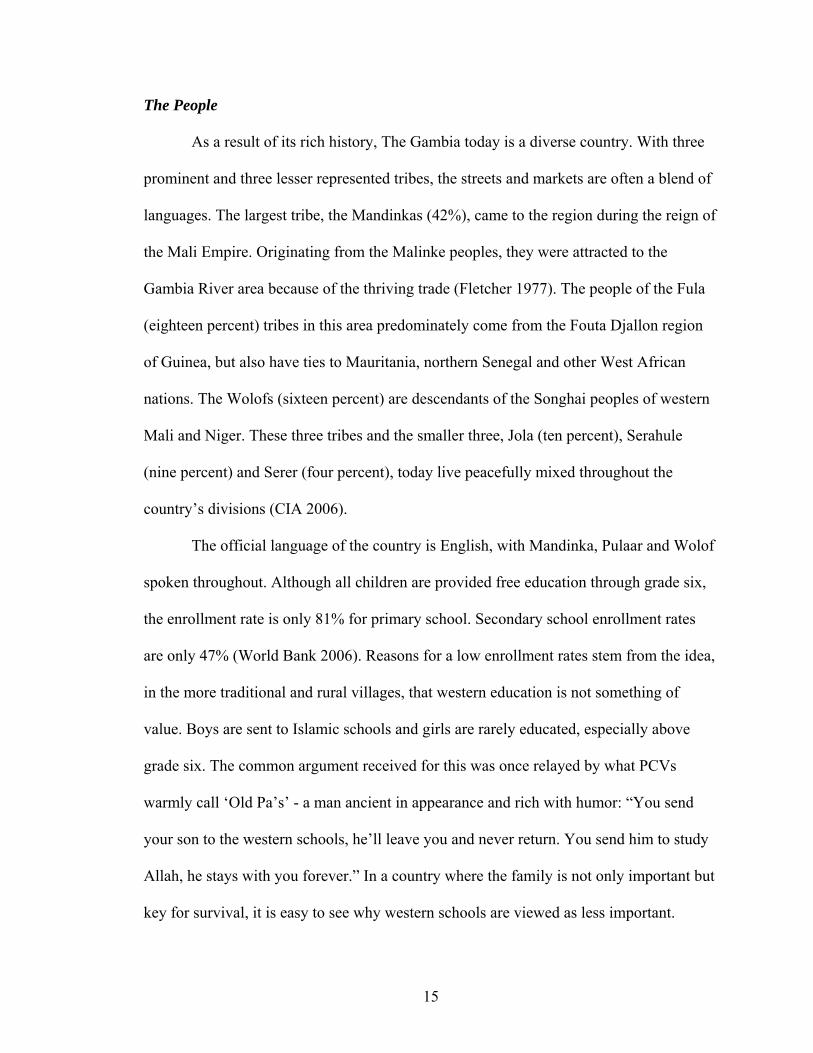
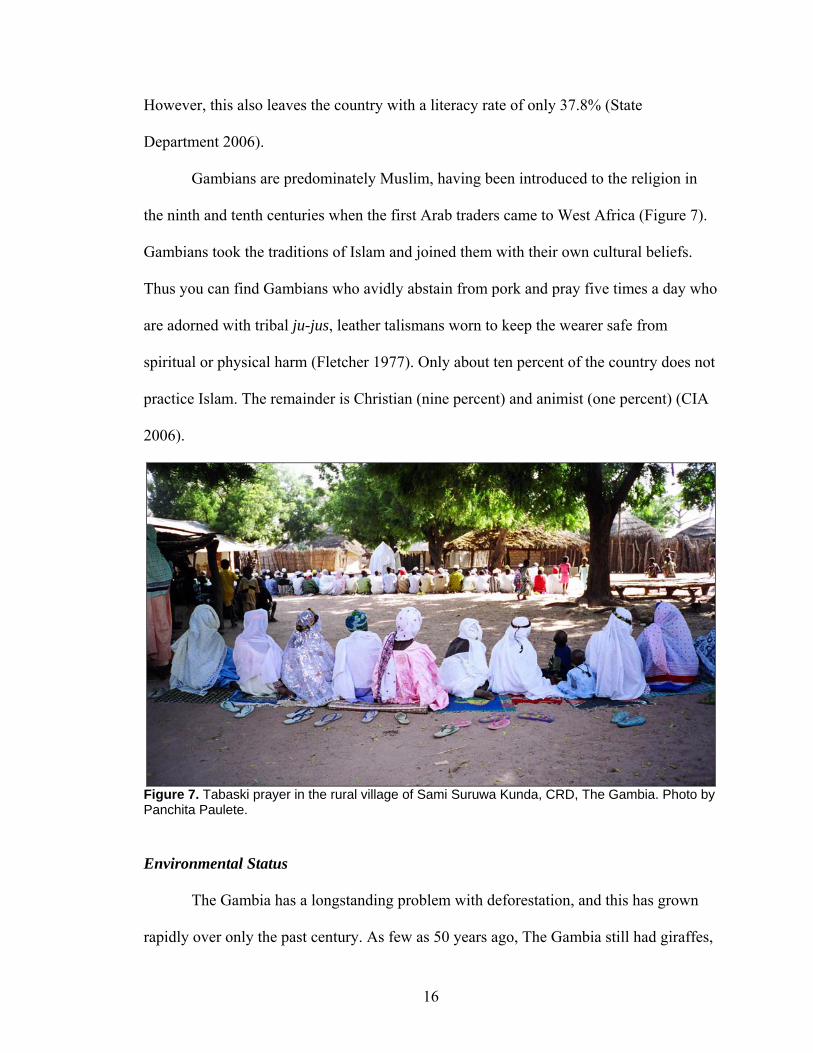
Gambians are predominately Muslim, having been introduced to the religion in
the ninth and tenth centuries when the first Arab traders came to West Africa (Figure 7).
Gambians took the traditions of Islam and joined them with their own cultural beliefs.
Thus you can find Gambians who avidly abstain from pork and pray five times a day who
are adorned with tribal ju-jus, leather talismans worn to keep the wearer safe from
spiritual or physical harm (Fletcher 1977). Only about ten percent of the country does not
practice Islam. The remainder is Christian (nine percent) and animist (one percent) (CIA
2006).
Figure 7. Tabaski prayer in the rural village of Sami Suruwa Kunda, CRD, The Gambia. Photo by Panchita Paulete.
Environmental Status
The Gambia has a longstanding problem with deforestation, and this has grown
rapidly over only the past century. As few as 50 years ago, The Gambia still had giraffes,
17
lions and elephants. Today, these animals are extinct within the country. The
deterioration has been rapid in an environmental sense. Today only about 41.6% (4710
sq.km.) of The Gambia is forested (World Bank 2006). As recently as the mid-1940s
measurements show that the country’s forest cover was as high as 81% (Sillah 1999). The
forest cover continues to be reduced by overpopulation through cultivation, heavy
grazing and uncontrolled fires (Sheehan and Rushin-Bell 1987).
Until the approximate time of The Gambia’s independence, the country’s land
was comprised of Guinea-savanna and Sudan-savanna types. The population in the
country began to increase rapidly beginning in the 1950s. Since then, The Gambia’s
population has increased by almost a million people. The result was an unsustainable
extraction of forest products for fuel and building needs. This, combined with expanding
agriculture and increasing occurrences of fires, has forced many forests into continuous
secondary succession (Sillah 1999).
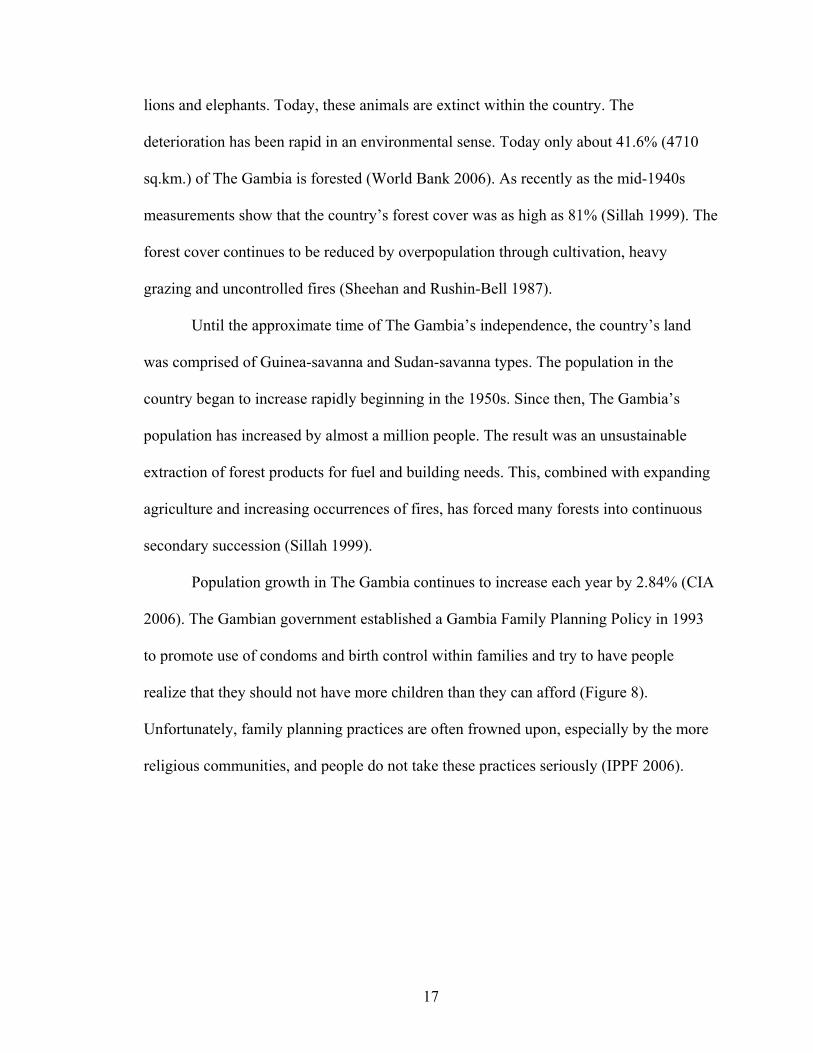
Population growth in The Gambia continues to increase each year by 2.84% (CIA
2006). The Gambian government established a Gambia Family Planning Policy in 1993
to promote use of condoms and birth control within families and try to have people
realize that they should not have more children than they can afford (Figure 8).
Unfortunately, family planning practices are often frowned upon, especially by the more
religious communities, and people do not take these practices seriously (IPPF 2006).
18
Figure 8. Gambia Family Planning Association extension agent conducting a condom demonstration for an HIV/AIDS awareness meeting. Photo by Panchita Paulete.
From 1936 to 1986, the population jumped from 198,000 to 800,000. The
population is currently at such a high point that even if Gambians began practicing zero
population growth practices, it would still be decades before the population stopped
increasing (Sheehan and Rushin-Bell 1987).
With more mouths to feed, people are removing more forest cover to grow crops.
With the removal of trees, the soil begins to deteriorate losing valuable nutrients provided
by leaf litter and fallen branches. Shade no longer exists to help undergrowth grow. Rain
and wind then erode the soil. The soil loses its nutritive value, unable to hold either
19
nutrients or water and hardening in the dry season. With the increasing population,
farmers are no longer able to leave fields fallow as long, if at all (Sheehan and Rushin-
Bell 1987; Sillah 1999).
In 1986, 30% of The Gambia was being continuously cultivated. As a result, lands
lose their fertility and roots and seeds living in the soil become damaged. Crops that are
grown produce less and less food per hectare. Gambians cannot continue to farm the way
their fathers and grandfathers once did. Farmers must put new cropping systems into
practice to prevent soil erosion and soil depletion (Sheehan and Rushin-Bell 1987).
And as the population grows, so does the number of livestock. As the number of
livestock increases, so does the area of land that the animals are grazing. And more
animals mean that they eat more green at a faster rate than it can grow. With no ground
cover, the soil is exposed and dries out. Animals concentrate their grazing and drinking
around areas that people need to collect water for drinking and washing, polluting and
overusing the source. Overgrazing also increases soil compaction, making it all the more
difficult for new plants to start growing in heavily grazed areas (Sheehan and Rushin-Bell
1987).
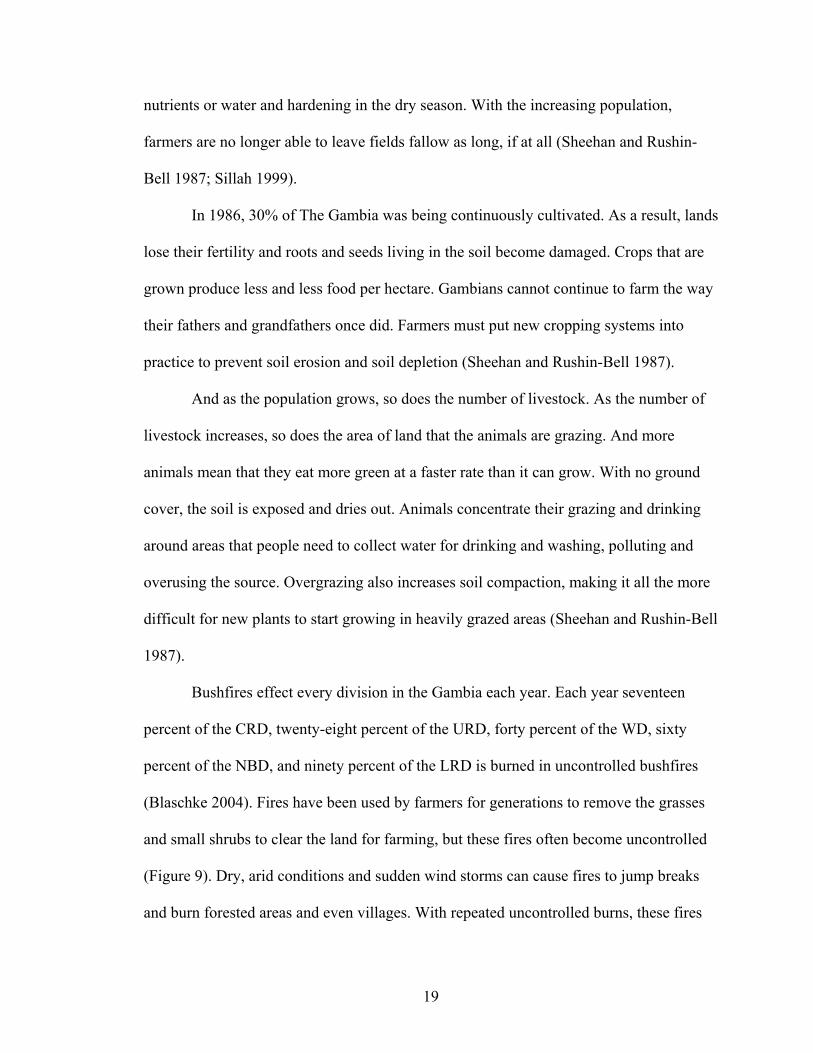
Bushfires effect every division in the Gambia each year. Each year seventeen
percent of the CRD, twenty-eight percent of the URD, forty percent of the WD, sixty
percent of the NBD, and ninety percent of the LRD is burned in uncontrolled bushfires
(Blaschke 2004). Fires have been used by farmers for generations to remove the grasses
and small shrubs to clear the land for farming, but these fires often become uncontrolled
(Figure 9). Dry, arid conditions and sudden wind storms can cause fires to jump breaks
and burn forested areas and even villages. With repeated uncontrolled burns, these fires
20
also consume small trees. Over time, the larger trees die off, but because of burning there
are no small trees left to take their places (Sheehan and Rushin-Bell 1987).
Figure 9. Uncontrolled bushfire on northern bank of the CRD. Photo by Erin Streff.
With the onset of deforestation, the climate of The Gambia has also changed over
the past century. The average rainfall measured in The Gambia prior to 1967 was 119.4
cm per year. In 1967 it was measured at only 68.6 cm and has held at an average of 76.2
cm since. Lower rainfall has caused the water table to drop as much as 4.6 meters in
some wells in the country. With lower water tables, trees and crops have a harder time
surviving through the dry season, further causing deforestation and continuing the cycle
of drier climates and advancing desert (Sheehan and Rushin-Bell 1987).
21
Forestry & Environmental Policy
Prior to colonial government establishment of a forest service in 1950, all forests
were controlled by the district chiefs. In 1976, the Department of Forestry (DOF) was
officially established as a department under the Ministry of Agriculture and Natural
Resources. The next two years involved legislation resulting in the turning over of control
of 66 forest parks identified during colonial rule to the DOF. Additionally, the
department undertook an annual tree planting campaign and promotion of community
woodlots and orchards. Lacking government support, these projects were conducted on
extremely low budgets and were difficult to implement properly. Funding was received
from US Agency for International Development and the European Economic
Commission (Schroeder 1999).
Since the DOF’s establishment, support and funding have come primarily from
the German government. The Gambian-German Forestry Project (GGFP) was established
in 1979 in order to manage The Gambia’s forest parks. Through a series of surveys
conducted during the 1980s and 1990s, the GGFP found the condition of Gambian forests
to be alarming. Aerial surveys conducted confirmed The Gambia’s forest cover to be at
approximately 45%. Prior to these surveys, this number was only an estimate (Schroeder
1999).
This survey concluded that the forests in The Gambia were threatened because of
management practices of rural peoples. The deforestation rate was estimated as six
percent a year. But while the forest resources were degrading, the GGFP determined that
if protected and managed correctly, a 45% forest cover was enough to supply Gambians
with adequate forest products and supply a strong base for reforestation. Based on these
22
surveys and the goal of the GGFP to manage the protected forest areas of the country, an
involved program for community forest management was established in 1987, granting
graduated sovereignty to communities agreeing to adhere to the Community Forestry
Management Agreement contract and conditions (Schroeder 1999).
The 1970s brought about the inception of ideals of environmental education
worldwide. Since this time, The Gambia has been working to increase public awareness,
but with modest gains. The Gambia Environmental Action Plan, adopted in 1992, does
not provide a means by which to measure the awareness levels of Gambians (Allen
2000). However, estimates have been made at the institutional level at 90% awareness
while those in the rural areas would not exceed 20% - 30% (Grey-Johnson 1997).
The National Environmental Agency (NEA) has recognized waste management,
bush fires, settlement patterns, land allocation, and forest and water resource use as
crucial issues needing immediate action. However, awareness of these problems and
legislation (National Environmental Management Act, 1994) to counteract them are poor
(Grey-Johnson 1997).
The NEA has also recognized that many past attempts to improve environmental
conditions have failed because they have been seen as the “government’s” project and not
belonging to the community, a common problem of development work. It has worked to
establish means to have the communities liaise with the government workers to give both
parties input and ownership (Grey-Johnson 1997).
To improve the environmental education provided in the schools, the Curriculum
Research and Professional Division (CRPDD) created a course to incorporate geography,
history, culture and more into one class called Social and Environmental Studies (SES). It
23
also required the introduction of environmental studies into science, population, family
life, and agricultural science. All this was done in 1988; before this date, The Gambia
school curriculum had no reflection of environmental concerns. The NEA has also
continued to work with other groups such as Peace Corps and the Nova Scotia Gambia
Association (NSGA) to improve curriculums and change teaching methods from lecture
based to participatory methods (Grey-Johnson 1997).
While focusing on the school systems to build a solid foundation with the
growing generations, NEA has also worked to increase integration of environmental
education into government institutional policies. Messages are being spread through
newspapers, newsletters, radio announcements, performance groups, posters, songs, and
more. These efforts are to reach the larger portion of the general public who live in rural
areas and have little to no formal education (Grey-Johnson 1997; Allen 2000).
24
CHAPTER 3 - METHODS
Competition Design, Goals & Objectives
The URD and CRD were chosen as the districts to conduct this project in
primarily because of the posted locations of the coordinating PCVs. These districts also
have the most severe degradation of woodland areas and, therefore, were logical places to
establish the competition (Sillah 1999).
Schools were selected as the target group for the competition. Research on
environmental education shows schools to be an effective place for implementing
programs (Athman and Monroe 2001). The coordinating PCVs and DOF members
believed that children would be the most easily influenced and also provide an easy
means to expand education into the communities. Schools also provided a preexisting
structure, allowing an easier means to facilitate communication. By training children to
identify, grow, and manage trees in their own environments, the educational caring
process will have been instilled with the persons who will be growing with the trees.
Schools were also chosen as the target for the competition because each school is
required to have a garden on the property through the School Agricultural and Food
Management Unit (SAFMU) initiative put in place by the World Food Program (WFP).
This initiative was brought forth in The Gambia to “create an enabling environment for
children to learn about food production and use” (WFP 2004). In theory, under this
program, each school would already have an area of land fenced off for its garden and
one teacher responsible for overseeing students in the garden. Schools would have one
less obstacle to overcome with a fenced area already existing on the grounds. In reality,

25
these gardens were sometimes no more than the obligatory fence that has long since
fallen over, with goats eating the remains of any plant that might have been grown during
the school year, but the basic infrastructure was still there to be mended.
Schools were responsible for the development of their own nursery throughout the
year. Each school was given a competition manual to explain all steps necessary to build
and maintain a healthy tree nursery, from seed collection to outplanting; no other
resources were given to the schools. This was to promote creativity in finding resources
and to encourage schools to look for outside resources and to empower the schools with
self-reliance and life skills toward environmental issues, giving schools and students
ownership of the project and making the project more sustainable at the local level
(Athman and Monroe 2001). After receiving the manual it was largely up to the schools
to initiate the project. However, participation in the competition was deemed mandatory
for all CRD schools by the head of the CRD Regional Educational Directorate (RED).
Through the help of the DOF, RED and PCVs, all schools in the URD and CRD
were to be visited throughout the school year. The program included as many of the
schools as possible, including lower basic, basic cycle, and upper basic schools.
Through the cooperation and collaboration of PCVs, the RED and DOF, the
following objectives were developed for the competition:
A competition that is low-to-no-cost and, therefore, sustainable on the local level. Create a program where students will learn the proper construction and
management of a tree nursery, how to identify trees, collect and store seeds, and identify uses for trees.
Incorporate environmental education into the project to allow students and communities alike to further understand the importance of trees in every aspect of life.
Supply the school with an alternative source of income through the sale of the seedlings.
26
The time frame of the competition was developed around the school calendar
year, to take place once annually. The summer term (July to mid-September) was
designated as time for the organizers to edit the existing manual, meet and collaborate
with involved members of RED and DOF, and seek out and apply for funding.
The first school term (mid-September to December) was designated as the
distribution period. This included distributing the manuals and describing the competition
to all headmasters, foresters, and PCVs.
Second term (January to April) was set as the period of nursery construction, seed
collection, and monitoring of the nurseries. The progress of schools was checked by
PCVs, foresters, and RED officers. The workshop conducted for teachers in the CRD was
also held in the second term.
Third term (April to July) was designated for continued technical assistance and
for judging of the nurseries. The judging was done near the end of the term to give
sufficient time for the nurseries to develop and also allow some preparation for the
outplanting of the trees to be done before the evaluating team’s arrival.
Manual Design & Distribution
The project was designed to work with the teachers, children, and communities by
introducing effective and current nursery management techniques. A manual was
developed to instruct schools in best practices for nursery management. The manual
included resources to help schools identify useful species for fruit, live fencing, shade,
and nitrogen fixing trees and appropriate seed collection, nursery management, and
species use techniques.
27
The manual included an overview of the competition, instructions for building
and maintaining a nursery, when and how to collect and prepare seeds for storage and
planting, outplanting and sales, and environmental education club activities. Three
appendices were included. The first covered the 25 most commonly found trees in The
Gambia with their descriptions, uses, seed treatments, and local names. The second
defined terms introduced in the manual. The third provided names and locations for all
Peace Corps Volunteers in the two districts. Technical information was adapted from
Peace Corps/The Gambia Agroforestry Manual and Environmental Education Club
activities from Peace Corps/The Gambia Environmental Education Manual.
The manual was written in English, using a Gambian dialect, to make it easily
understood by both teachers and students. Images of technical procedures were provided
whenever possible to allow younger children to be able to utilize the manual as well.
Using local examples and names provided a familiarity for the participants, allowing the
information to be more effectively shared (Athman and Monroe 2001).
The manuals were printed in the capital and distributed in late November.
Manuals were distributed to the DOF regional headquarters, where forestry Area Cluster
(AC) heads picked them up. PCVs in the URD and CRD received the manual through the
monthly mail distribution delivered to each volunteer’s village by the staff from the
capital. The schools’ copies were delivered to the RED regional headquarters and
distributed when teachers came to collect their paychecks. All manuals were distributed
before the holiday break.
28
School & School District Descriptions
The Gambia has four levels of public schools. Lower basic schools (LBS) teach
first through sixth grades and are free to all children, regardless of gender. Upper basic
schools (UBS) teach students in seventh through ninth grades. Beyond sixth grade, boys
are required to pay school fees. Girls receive free education through UNICEF funding,
but must still pay for books and uniforms. Basic cycle schools (BCS) are schools where
lower and upper are combined, teaching grades one through nine at the same facility.
Tenth through twelfth grades are taught in the senior secondary schools (SSS).
The size of schools varies greatly, depending on population density and outside
sources of income. Lower basic schools are generally the largest since schooling through
these grades is free. Many rural areas of The Gambia will have five or six lower basic
schools with more than 300 students within reasonable distances of one upper basic
school. However, that upper basic school rarely has an enrollment of more than 400 to
500 students. Boys’ fees cannot be paid and the boys’ labor is needed in the fields; girls
are often married off at the age of thirteen or fourteen and commonly do not continue in
school once they are married. Enrollment percentages of the number of children enrolled
in schools in comparison to the gross population count at the respective school age
groupings totaled eighty-one percent in primary level, forty-seven percent at the
secondary level, and only one percent at the tertiary level in 2005 (World Bank 2006).
Schools are governed through the six political divisions with a Regional
Education Directorate office which, in turn, reports to the headquarters in Banjul. Within
the political divisions, each RED sections the schools into clusters.
29
Central River Division Workshop
In April 2005, a workshop was implemented for the teachers in the CRD. Four
one-day workshops were held covering the technical aspects needed to build and operate
a tree nursery. A workshop was not held in the URD because there was no initiative
brought forth by the RED office in Basse, the division capital.
The desire for the workshop in the CRD came from the RED officers overseeing
the competition in the CRD. They felt from some of the observations they had made
when they had visited schools throughout the terms that teachers felt slightly
overwhelmed and were not taking the competition seriously. They asked for assistance,
saying they would organize all the logistics of locations, transportation, and notification
of the workshops if the technical knowledge could be provided. The success of this
workshop can be attributed to the inclusion of stakeholders in the planning processes
from the beginning and throughout (Emerson 2006).
The workshops were held at four schools: Jarumeh Koto Basic Cycle School,
Kaur Lower Basic School, Bansang Lower Basic School, and Jarreng Lower Basic
School. The schools were selected by the RED for both their ability (capacity and
availability of materials and resources) and their ease of transport or central location for
the other schools in the cluster area. All schools provided trainers and participating
teachers with breakfast, lunch, and any materials needed for demonstrations, at no cost to
any of the hosting schools. To reimburse travel costs for teachers who attended the
workshop, teachers were told to go back to their schools and tell the headmasters that
their travel money is to be reimbursed from the SAFMU money.
30
All the technical aspects of making a tree nursery were covered including digging
the beds, mixing soil, sewing polypots from rice bags and ideas for other inexpensive
alternatives, building shade structures, fence construction and maintenance, developing
watering and maintenance schedules, seed treatments and storage, tree identification, tool
construction from inexpensive and available alternative resources, and natural pesticides.
Methods used had been introduced during Peace Corps Pre-Service Training and from
Peace Corps/The Gambia Agroforestry Manual as sustainable practices in The Gambia
and had been adapted for the workshop based on previous experiences of working with
gardening and tree nurseries in country.
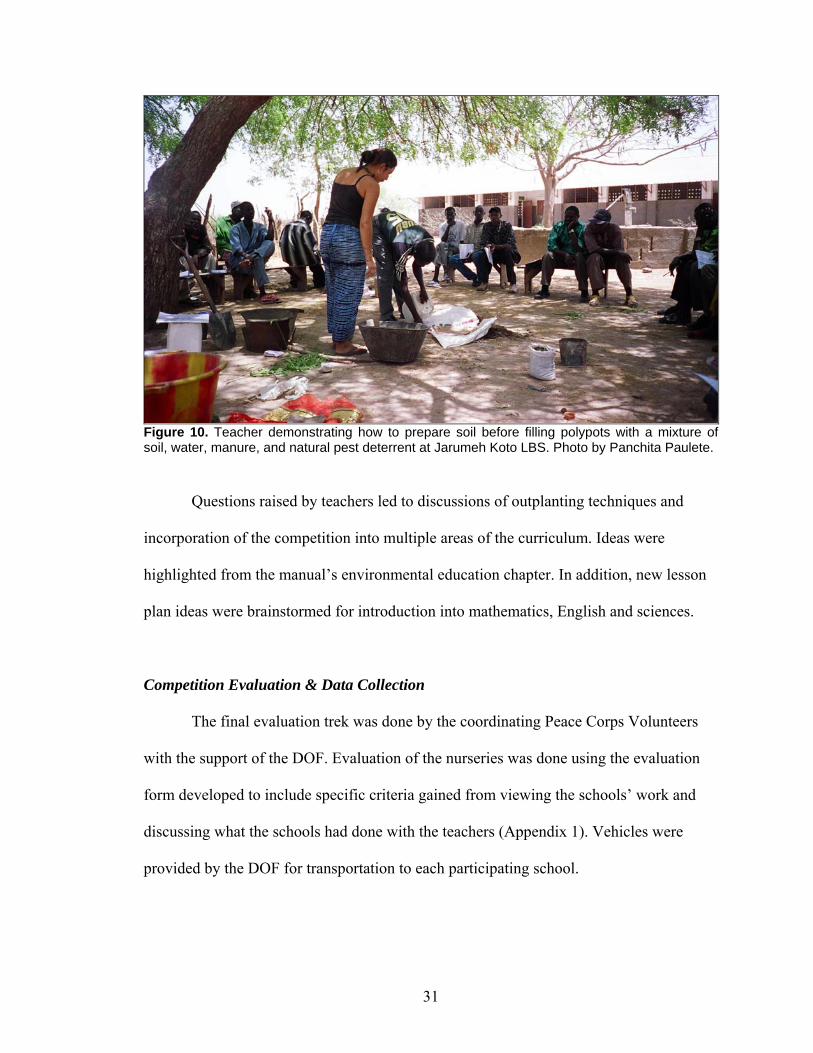
The workshop was made as hands-on as possible for the teachers, using a
combination of discussion and participatory demonstration. Whenever possible,
participants were asked to lead the explanation of the task at hand (Figure 10). More
often than not, the teachers were so eager to participate that controlling the number of
people up front became difficult. All the skills shown and discussed were in the manual.
This point was repeated to reinforce the importance of the manual as a resource when an
extension agent was not nearby.
31
Figure 10. Teacher demonstrating how to prepare soil before filling polypots with a mixture of soil, water, manure, and natural pest deterrent at Jarumeh Koto LBS. Photo by Panchita Paulete.
Questions raised by teachers led to discussions of outplanting techniques and
incorporation of the competition into multiple areas of the curriculum. Ideas were
highlighted from the manual’s environmental education chapter. In addition, new lesson
plan ideas were brainstormed for introduction into mathematics, English and sciences.
Competition Evaluation & Data Collection
The final evaluation trek was done by the coordinating Peace Corps Volunteers
with the support of the DOF. Evaluation of the nurseries was done using the evaluation
form developed to include specific criteria gained from viewing the schools’ work and
discussing what the schools had done with the teachers (Appendix 1). Vehicles were
provided by the DOF for transportation to each participating school.
32
The three-day trek in the URD was accompanied by a forester in Wuli District.
Using a list of participating schools drafted by the RED, 45 schools were visited
throughout the Kantora, Fulladu East, Wuli and Sandu districts.
The trek in the CRD was assisted by each of the forestry AC heads. Three days
were spent in the Yoro Boro Kunda and Kudang clusters, and four days in the Jarumeh
Koto and Bakadaji clusters. All schools in the CRD were visited at the urging of the
RED, which had made this competition mandatory for all schools.
Data were collected during the evaluation trek for the competition. This rapid
appraisal was the only feasible option for collecting the data from all the schools in the
two districts (Kumar 1987). The Gambia is a small country, but roads are poor and
transportation is difficult. Cars can only cross the river at two points in the CRD and two
in the URD on ferries. Even these ferries are not always operational due to seasonal
changes, fuel shortages, or equipment failures. Ideally, evaluations of all the tree
nurseries would have been made throughout the school year, but resources did not allow
it.
The tree nurseries were evaluated using the survey form (Appendix A). The data
were then broken into four groups of information: physical aspects (shade, fencing,
proximity to watersource, use of natural pesticides, use of fertilizer, number of species),
school demographics (grade levels, location, size), types of outside help (workshop, PCV
or forester assistance), and outcomes (health, survival).
Shade was measured on a scale of zero (poor) to two (excellent). Poor was
defined as none provided, average as existing but not adequate or properly maintained,
and excellent as adequate and maintained.
33
Fencing was similarly rated on a scale of zero (extremely poor) to three
(excellent). The extra evaluation ranking was deemed necessary as, through the SAFMU
initiative, each school was required to have a fenced in area on the premises, and
therefore should not have had to worry about the construction of a new fence in order to
compete. Extremely poor was defined as none existing, poor as barely existing and/or not
adequate or maintained, average as present but with significant holes, and excellent as
adequate and maintained.
Proximity of watersource was evaluated from the nursery edge to the nearest
source of water. The distance was estimated and then categorized in order to rapidly
obtain distant measurements. Proximity was ranked on the same scale as shade, with poor
being greater than 100 m, average being 100 to 50 m, and excellent as less than 50 m.
Use of natural pesticides and fertilizers were evaluated as zero (no) or one (yes).
Use of these in either soil preparation or in the maintenance process was counted.
Number of species was a quantitative variable in which each species was counted
once. When multiple varieties of the same species were present, each variety was
counted.
The sum of the above physical aspects excluding number of species was
calculated to further determine the schools’ efforts. A separate weighted sum was also
calculated, determining fencing to be the most important, proximity of watersource and
shade to be next, and use of natural pesticides and fertilizers to be least important.
It should be noted that, due to time constraints, data were only collected from
schools where upon arrival there was at least one tree alive. Some schools had begun
participating in the competition and due to various problems (water, fencing, teacher
34
support) had not carried out the competition to completion. Upon arrival, only collapsed
polypots and various other empty containers were found. In addition, all data was
collected by the same person so as to eliminate inconsistencies in the somewhat
subjective evaluations of the measurements.
School demographics, with the exception of school size, were obtained from the
respective REDs prior to the trek. Size was determined from each school’s records as
number of students attending the school at the time of the data collection.
Outside assistance was measured in two forms: workshop attendance and visits
with PCVs or foresters. The workshop was only provided for schools in the CRD and
attendance was recorded at each area workshop. Schools were asked during the
evaluation trek if they received assistance from a PCV or forester. In addition, some
previous knowledge in this area was known from conversations with and questions from
PCVs about activities in which they were assisting their local schools. This provided a
check on data collected during the trek. Information obtained prior to the evaluation
proved consistent with the data collected during the trek.
Health of trees was evaluated on a zero (extremely poor) to four (excellent) scale.
Extremely poor was defined as all trees critical and dying, poor as most trees critical or
dying, average as most trees alive, above average as all trees alive but some stressed, and
excellent as all trees alive and thriving. Again, all data was collected by the same person
to eliminate inconsistencies across schools.
Survival was a quantitative measure of all trees alive, no matter how poor their
health, at the time of evaluation. Numbers of total trees originally planted at each school
were not collected in the rapid evaluation conducted.
35
The test variables for the project were the health and survival of the trees. A
Pearson Correlation of Coefficients was run to measure the strength of relationship of the
variables in relation to the outcomes (Steel and Torrie 1960). The formula for the Pearson
Correlation Coefficient is:
In addition, an Analysis of Variance (ANOVA) test was run for all six parts of the
physical aspects, their sums and weighted sums, survival and health of the trees to see if
the schools who had the workshop provided (CRD) had performed better than those who
had no workshop provided (URD). District was used as the categorical variable in the
ANOVA test (Steel and Torrie 1960).
36
CHAPTER 4 - DATA & DATA ANALYSIS
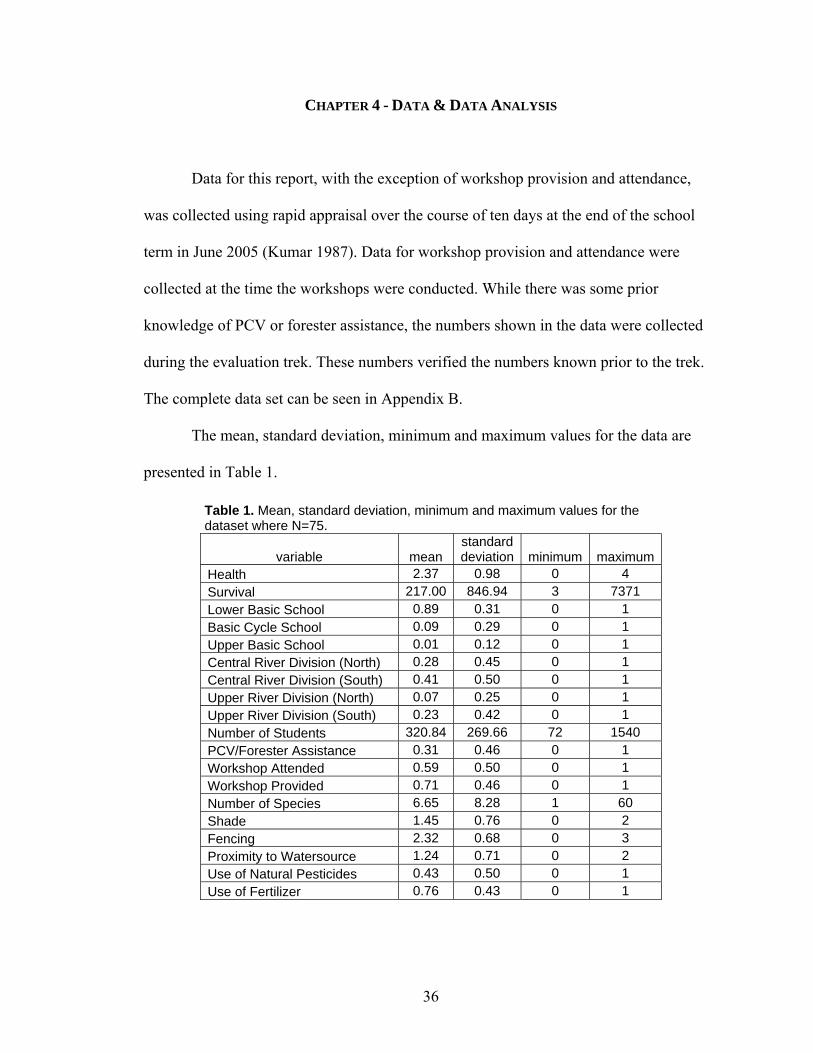
Data for this report, with the exception of workshop provision and attendance,
was collected using rapid appraisal over the course of ten days at the end of the school
term in June 2005 (Kumar 1987). Data for workshop provision and attendance were
collected at the time the workshops were conducted. While there was some prior
knowledge of PCV or forester assistance, the numbers shown in the data were collected
during the evaluation trek. These numbers verified the numbers known prior to the trek.
The complete data set can be seen in Appendix B.
The mean, standard deviation, minimum and maximum values for the data are
presented in Table 1.
Table 1. Mean, standard deviation, minimum and maximum values for the dataset where N=75.
variable mean standard deviation minimum maximum
Health 2.37 0.98 0 4 Survival 217.00 846.94 3 7371 Lower Basic School 0.89 0.31 0 1 Basic Cycle School 0.09 0.29 0 1 Upper Basic School 0.01 0.12 0 1 Central River Division (North) 0.28 0.45 0 1 Central River Division (South) 0.41 0.50 0 1 Upper River Division (North) 0.07 0.25 0 1 Upper River Division (South) 0.23 0.42 0 1 Number of Students 320.84 269.66 72 1540 PCV/Forester Assistance 0.31 0.46 0 1 Workshop Attended 0.59 0.50 0 1 Workshop Provided 0.71 0.46 0 1 Number of Species 6.65 8.28 1 60 Shade 1.45 0.76 0 2 Fencing 2.32 0.68 0 3 Proximity to Watersource 1.24 0.71 0 2 Use of Natural Pesticides 0.43 0.50 0 1 Use of Fertilizer 0.76 0.43 0 1
37
In addition to data collected, a sum of the physical aspects (shade, fencing,
proximity to watersource, use of natural pesticides, use of fertilizer), excluding number of
species, was generated to evaluate these factors as a whole. A weighted sum was also
created to further evaluate the importance of each physical aspect. Fencing was deemed
most valuable (weighted as three), shade and proximity to a watersource equally valued
next in importance (weighted as two), and use of natural pesticides and fertilizers were
also equally valued (weighted as one). These numbers can also be seen in Appendix 2.
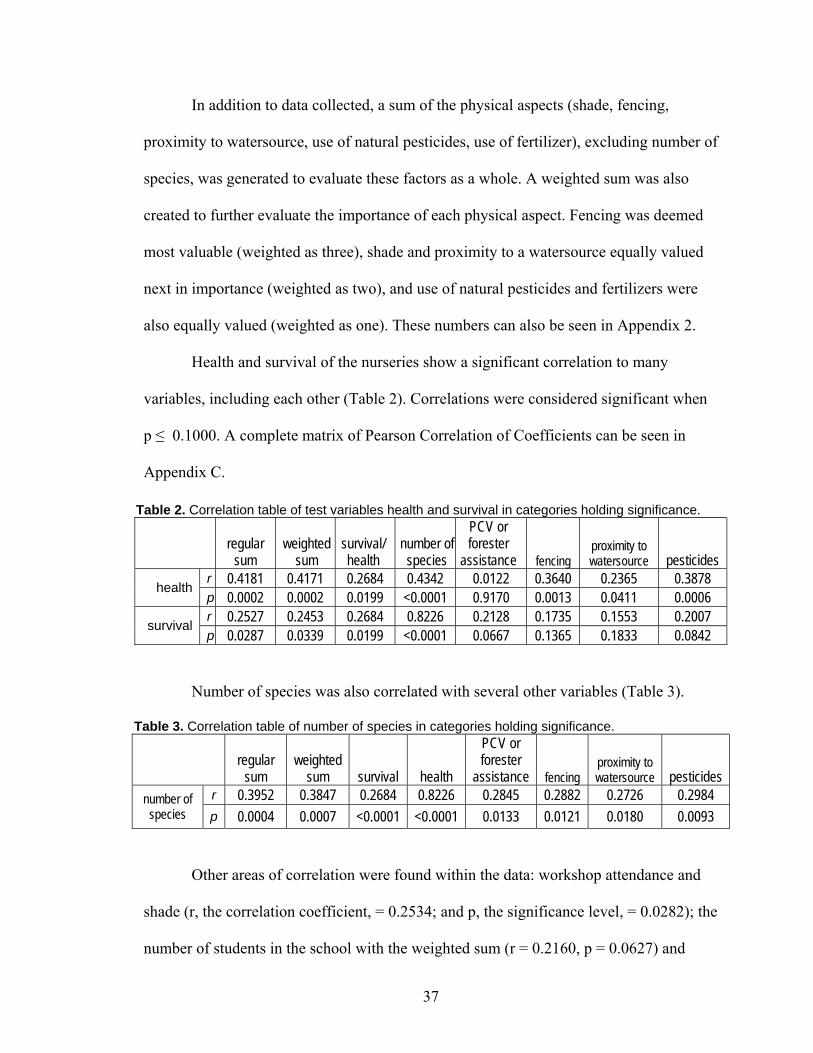
Health and survival of the nurseries show a significant correlation to many
variables, including each other (Table 2). Correlations were considered significant when
p ≤ 0.1000. A complete matrix of Pearson Correlation of Coefficients can be seen in
Appendix C.
Table 2. Correlation table of test variables health and survival in categories holding significance.
regular
sum weighted
sum survival/ health
number of species
PCV or forester
assistance fencing proximity to watersource pesticides
r 0.4181 0.4171 0.2684 0.4342 0.0122 0.3640 0.2365 0.3878 health p 0.0002 0.0002 0.0199 <0.0001 0.9170 0.0013 0.0411 0.0006 r 0.2527 0.2453 0.2684 0.8226 0.2128 0.1735 0.1553 0.2007 survival p 0.0287 0.0339 0.0199 <0.0001 0.0667 0.1365 0.1833 0.0842
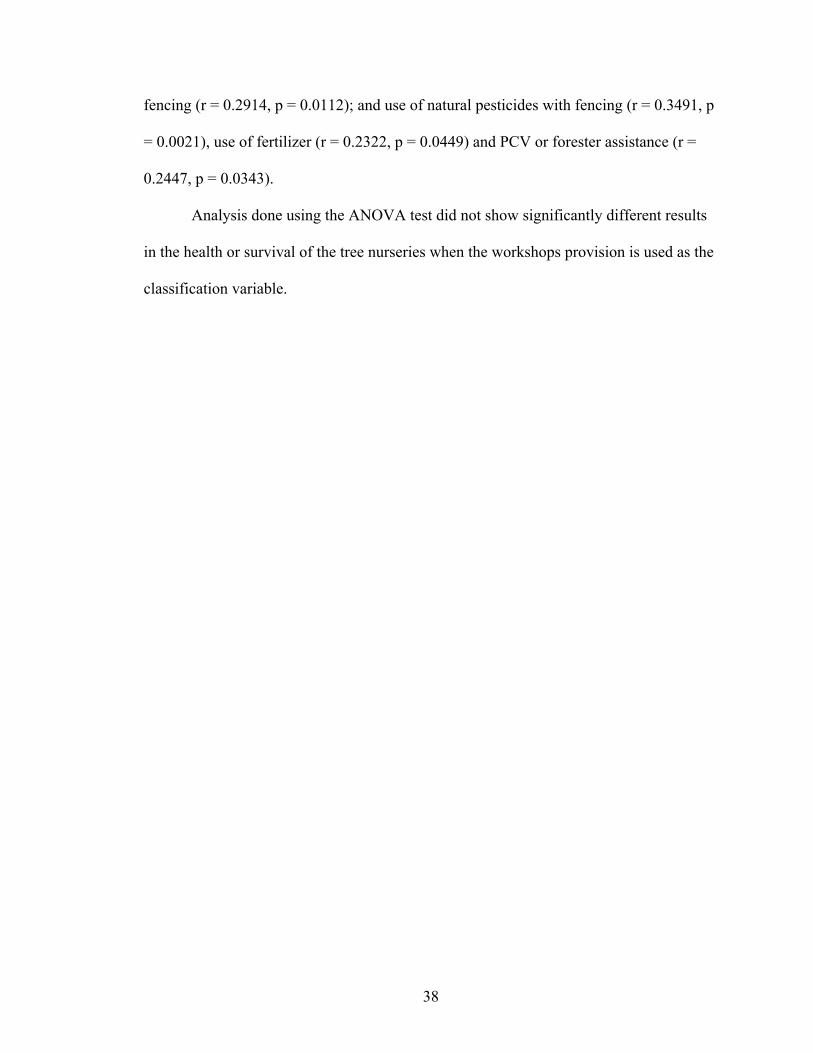
Number of species was also correlated with several other variables (Table 3).
Table 3. Correlation table of number of species in categories holding significance.
regular
sum weighted
sum survival health
PCV or forester
assistance fencing proximity to watersource pesticides
r 0.3952 0.3847 0.2684 0.8226 0.2845 0.2882 0.2726 0.2984 number of species p 0.0004 0.0007 <0.0001 <0.0001 0.0133 0.0121 0.0180 0.0093
Other areas of correlation were found within the data: workshop attendance and
shade (r, the correlation coefficient, = 0.2534; and p, the significance level, = 0.0282); the
number of students in the school with the weighted sum (r = 0.2160, p = 0.0627) and
38
fencing (r = 0.2914, p = 0.0112); and use of natural pesticides with fencing (r = 0.3491, p
= 0.0021), use of fertilizer (r = 0.2322, p = 0.0449) and PCV or forester assistance (r =
0.2447, p = 0.0343).
Analysis done using the ANOVA test did not show significantly different results
in the health or survival of the tree nurseries when the workshops provision is used as the
classification variable.
39
CHAPTER 5 - RESULTS & DISCUSSION
The competition was originally designed in the 2003 – 2004 school year by PCVs
with cooperation from the DOF and RED in the URD. Working with these two Gambian
offices allowed two primary stakeholders in the project to be local authorities who have
ownership and interest. Stakeholders’ involvement in all aspects of the development of
environmental education is essential to the success. It not only creates a means of
ownership, but also provides inputs into the process to ensure that the ideas are culturally
relevant (Athman and Monroe 2001).
The project was designed to have all schools compete against all other schools in
the division to construct and maintain the best tree nursery. Schools were given only a
manual (produced by PCVs) to begin and complete the project. The project was expanded
in the 2004 – 2005 school year to include the CRD. Each school would be competing
only against other schools in the same division.
When the competition was expanded into the CRD, all efforts were made to
ensure that feedback from the two new regional offices were listened to and considered.
While these offices had not been part of the creation of the project, it was accepted by the
new offices with enthusiasm because the URD district offices had played a role in the
original planning. The CRD offices took ownership of the project and were the means
through which all communication and monitoring was done during the school year. This
self-imposed monitoring was what motivated the RED to request a technical workshop
for its teachers.
40
Discussion of the success of this competition involves both technical success of
the individual nurseries and conceptual success and sustainability of the overall project.
As the data shows, many schools performed well and had healthy tree nurseries with
survival in the hundreds. But many of these schools, while having well constructed
nurseries, had not managed to promote the environmental education in the process.
Observations and discussions with the top competing schools indicated several factors
that contributed to the schools’ successes.
This chapter reviews the results of the technical aspects of the nursery (building,
planting, maintaining) in regards to statistical analysis done on all competing schools to
determine which elements influenced health and survival the most. Analysis of the effect
of the workshop is also discussed.
Evidence of sustainability of the project concept is also presented and discussed.
the level of sustainability of the project is analyzed using observations collected during
the evaluation trek, discussions with teachers and PCVs, and observations made during
the author’s visits to neighboring schools throughout the competition’s duration.
Health & Survival
Health and survival of the trees in the nursery at the time of the competition
evaluation were the main factors, along with incorporation of environmental education,
used to evaluate the schools’ success in the project.
Health of the nurseries was evaluated on a scale of zero to four, ranging from
extremely poor to excellent. Extremely poor was defined as all trees critical and dying,
poor as most trees critical or dying, average as most trees alive, above average as all trees
41
alive but some stressed, and excellent as all trees alive and thriving. Health was a
subjective measure taken from appearance of stresses due to insufficient watering, pest or
pathogen attacks, and sun scorching. Survival was a quantitative measure of all remaining
living trees, no matter how poor their health, at the time of evaluation.
The Gambia has a harsh, sub-Sahelian climate, leaving vegetation prone to
dehydration and predation from insects and animals alike. Schools that made an effort to
protect their nurseries from these elements fared best in the competition. Not surprisingly,
the strongest correlations for the two test variables come from some of the physical
aspects (fencing, proximity to watersource, use of natural pesticides, number of species)
and their regular sum (a sum of the physical aspects of shade, fencing, proximity to
watersource, use of natural pesticides, use of fertilizer, excluding number of species) and
weighted sum (a sum of the physical aspects with an importance factor added for
fencing1, shade2 and proximity to a watersource2, and use of natural pesticides3 and
fertilizers3, excluding number of species).
The competition was designed knowing the brutal elements of the climate and,
therefore, education and the training manual focused on the need to protect the young
trees from these factors. Free or otherwise cost efficient means of collecting or making
materials for shade, watering, sowing, fencing, fertilizing, and protecting the trees from
pests were discussed in detail. Obstacles the schools would encounter were brainstormed
during the planning stages of the project by PCVs and members of the RED and DOF.
Through this initial collaborative effort, problems were identified and presented with
solutions that were locally appropriate for the project. Presenting multiple appropriate
1 Weighted as three. 2 Weighted as two. 3 Weighted as one.
42
and simple technologies allowed schools to experiment and develop means most
beneficial to their situation based on what proved to be most useful (Bunch and López
1995).
Containers for the seedlings were one of the first problems for the schools. The
thick, black polypot bags with pre-made drainage holes are expensive, costing up to five
Dalasis ($0.20 US) per bag. In a country were more than 50% of the population lives off
of $1 US a day, purchasing these is not a feasible option. The AC offices of the DOF
have a limited number of these bags that are meant for use by communities these offices
serve. They do not have enough to be able to provide every school with as many as they
would need.
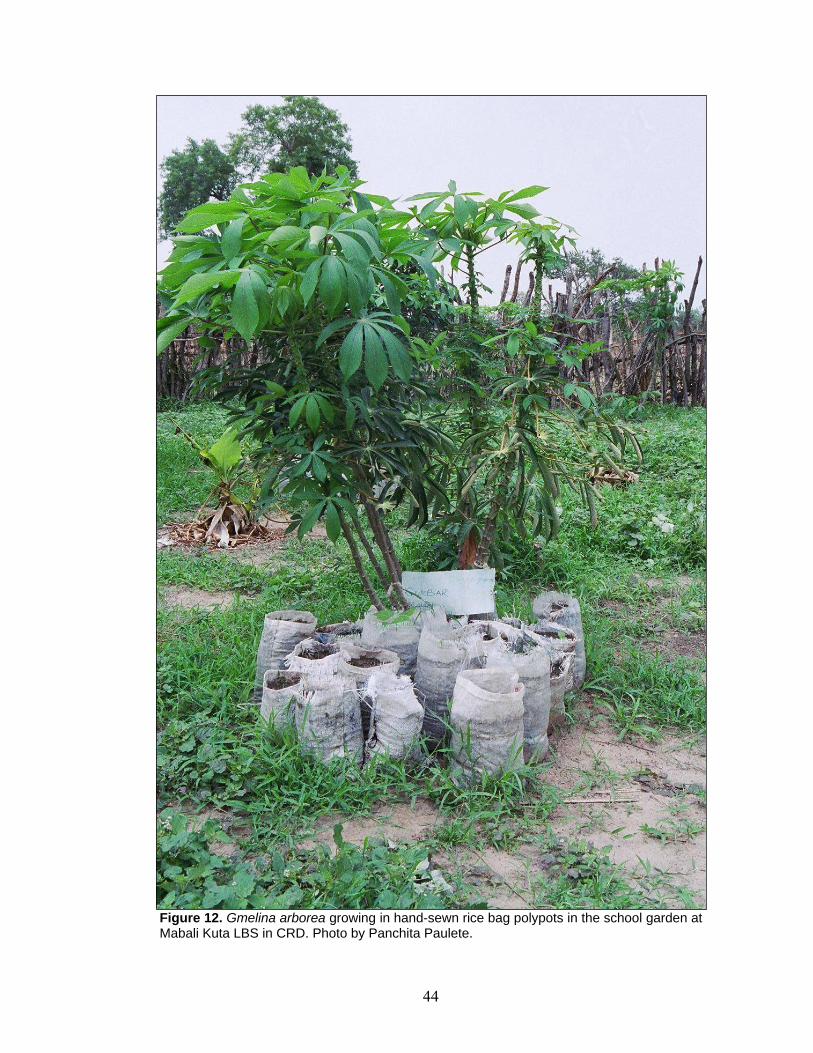
Suggestions of a variety of recyclable containers were listed in the manual.
Instructions on how to sew polypots from rice bags were also described and drawn.
Schools used a variety of containers, with those more remote having to make more while
those along main roads or near large towns were able to collect thrown out containers to
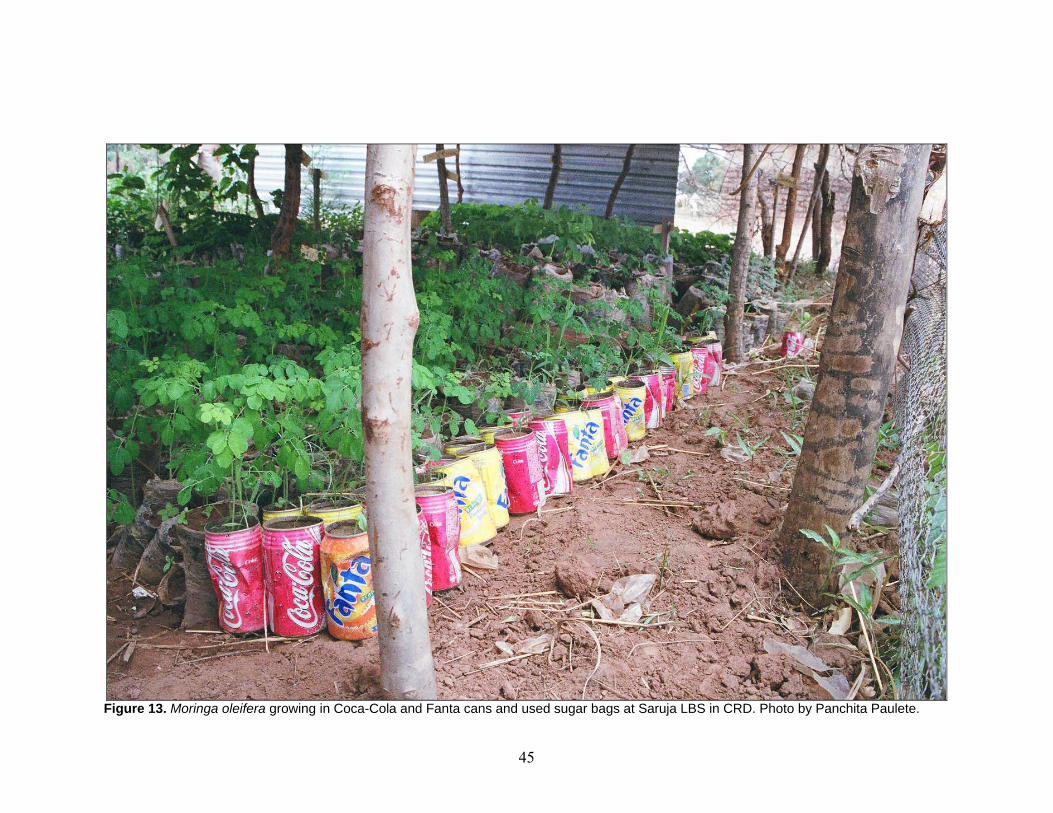
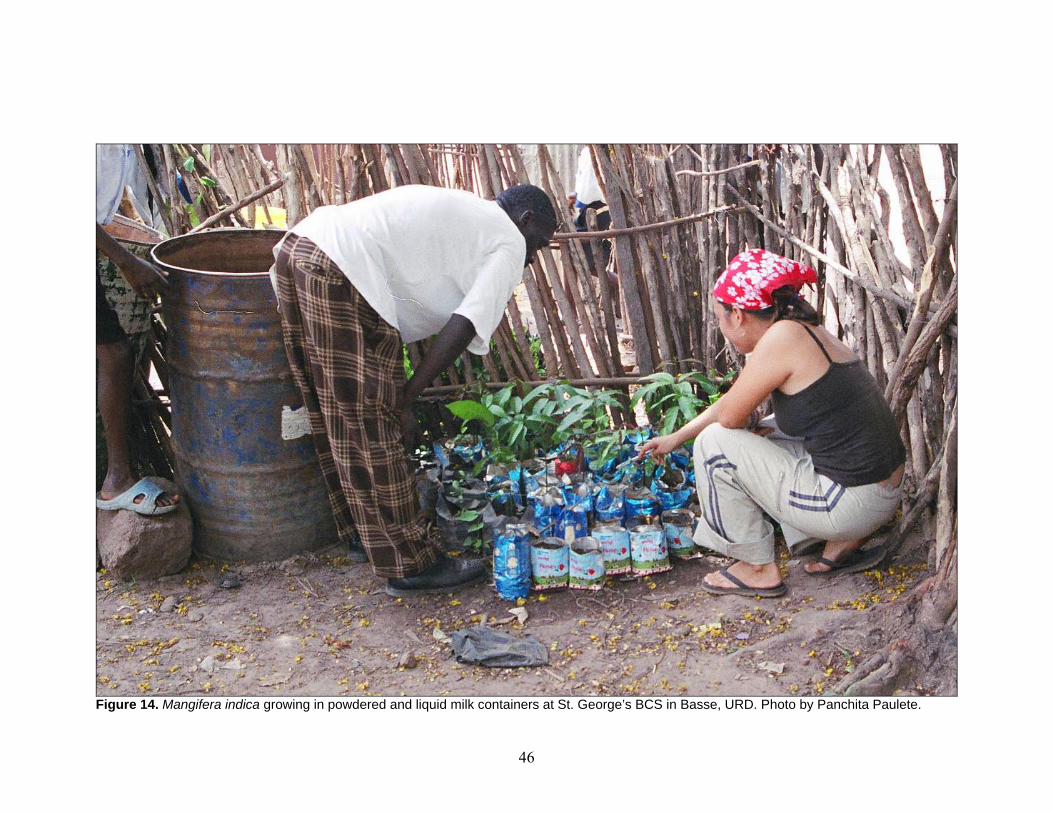
use, adopting the technologies most appropriate for their situations. They used everything
from old, broken bowls to soda cans to make polypots when other resources were
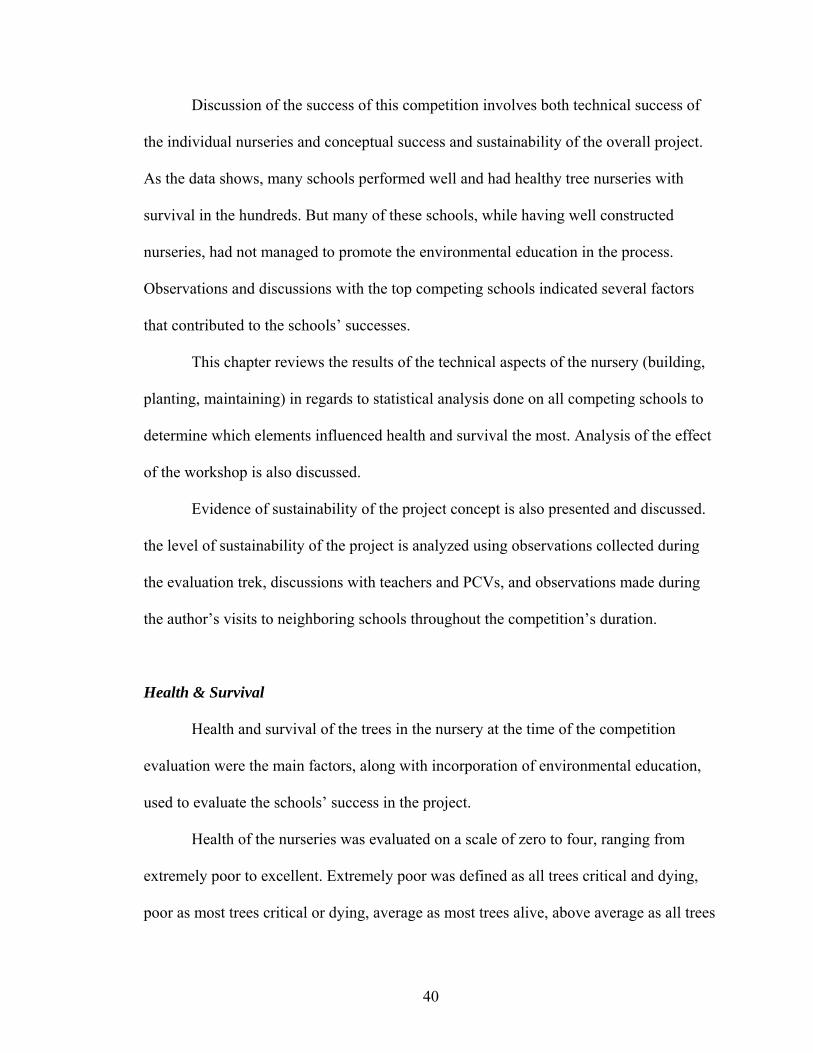
unavailable (Figures 11 - 14).
43
Figure 11. The gardenmaster in the tree nursery for Methodist LBS in Georgetown, CRD. This school used a combination of the black polypot bags and hand-sewn rice bag polypots. Photo by Panchita Paulete.
44
Figure 12. Gmelina arborea growing in hand-sewn rice bag polypots in the school garden at Mabali Kuta LBS in CRD. Photo by Panchita Paulete.
45
Figure 13. Moringa oleifera growing in Coca-Cola and Fanta cans and used sugar bags at Saruja LBS in CRD. Photo by Panchita Paulete.
46
Figure 14. Mangifera indica growing in powdered and liquid milk containers at St. George’s BCS in Basse, URD. Photo by Panchita Paulete.
47
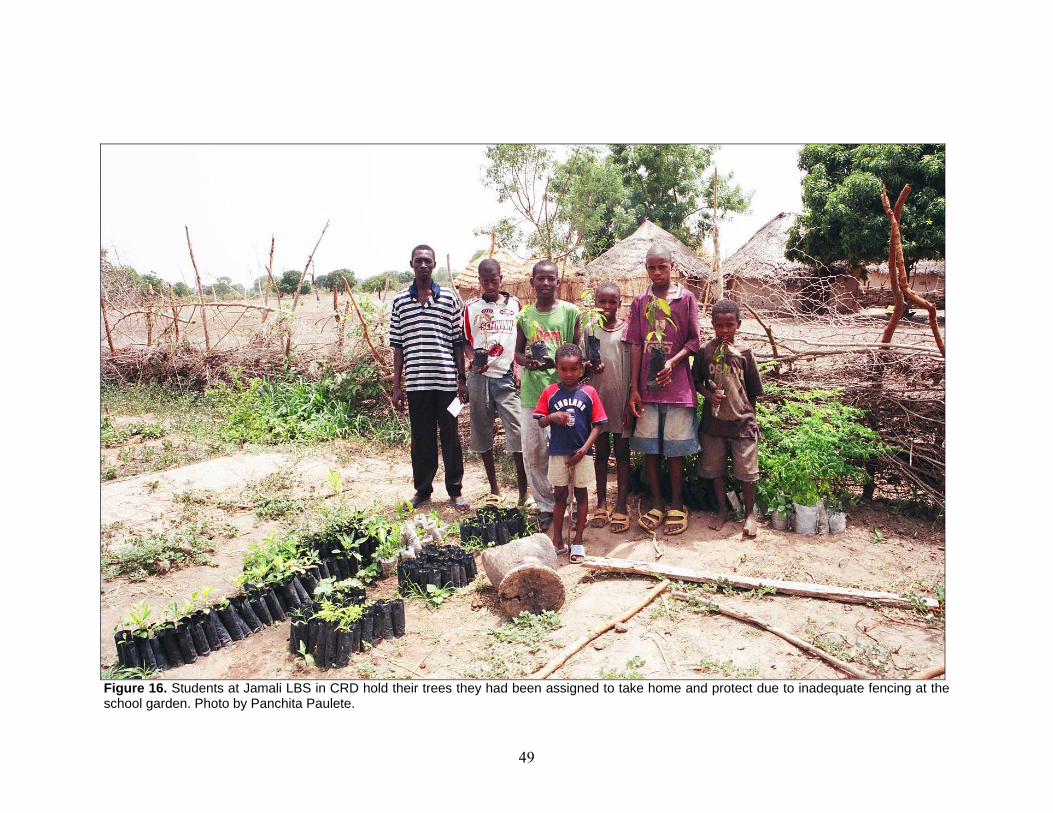
Materials for shade, fencing and watering cans were also issues the schools faced
in producing their nurseries. Fencing and proximity to watersource were significantly
correlated with the health of the nursery (fencing: r = 0.3641, p = 0.0013; water: r =
0.2365, p = 0.0411) and number of species (fencing: r = 0.2882, p = 0.0121; water: r =
0.2726, p = 0.0180). Schools were encouraged to use all resources available to them and
to adopt methods best suited for their situations. Some schools used classrooms to keep
the trees safe from the burning sun and goats. At other schools, when the school fences
were not secure or none existed, students had been assigned to take several trees home to
protect in their own compounds. The manual also held instructions for making watering
cans out of the plastic oil containers the schools used in preparing the student lunches
(Figures 15 - 16).
48
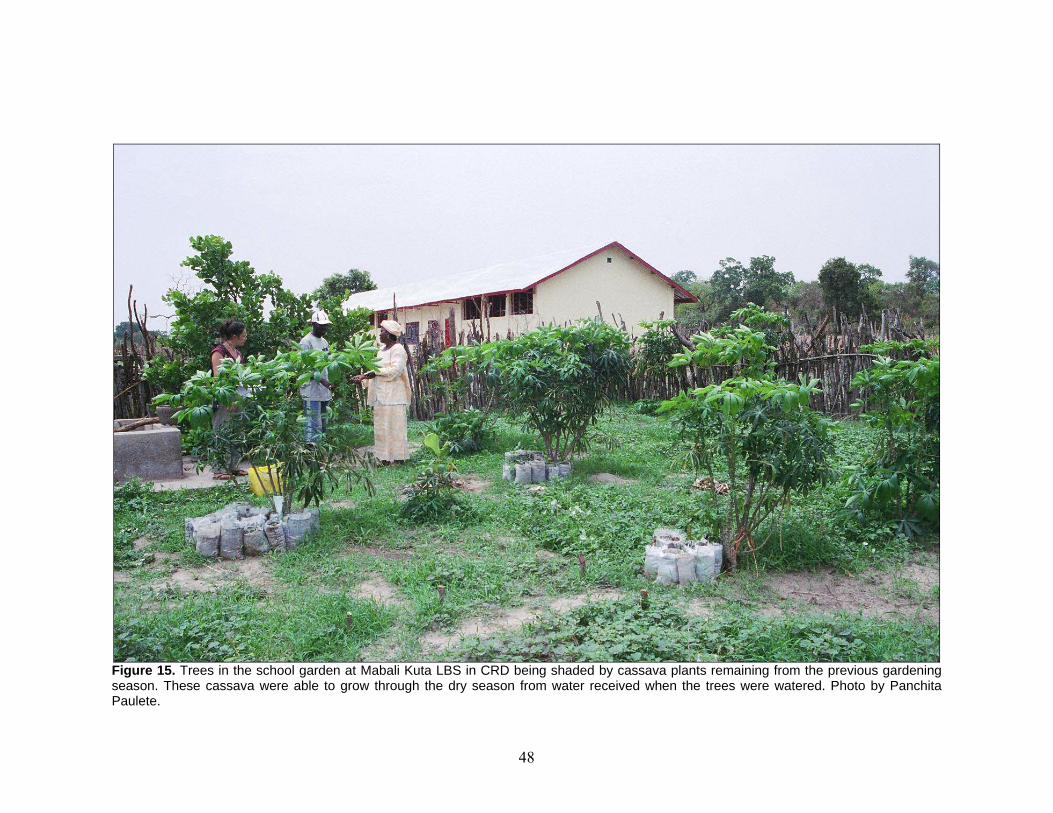
Figure 15. Trees in the school garden at Mabali Kuta LBS in CRD being shaded by cassava plants remaining from the previous gardening season. These cassava were able to grow through the dry season from water received when the trees were watered. Photo by Panchita Paulete.
49
Figure 16. Students at Jamali LBS in CRD hold their trees they had been assigned to take home and protect due to inadequate fencing at the school garden. Photo by Panchita Paulete.
50
Pesticides were a tangible obstacle the schools might face. They also were
significantly correlated with the health (r = 0.3879, p = 0.0006), survival (r = 0.2007, p =
0.0842), number of species (r = 0.2985, p = 0.0093) and PCV or forester assistance (r =
0.2448, p = 0.0343). Although many people knew of and used local means of pest
control, many either used them improperly or refused to believe they would work.
Powdered chemical pesticides available at the local markets in The Gambia are powerful,
dangerous and expensive and improper application burns the leaves of the plants.
Natural pesticides were also encouraged to eliminate the opportunity for these
chemical pesticides to come in contact with children maintaining the nursery. Pesticides
made from soapy water, hot pepper, tobacco and Azadirachta indica leaves were
promoted in the manual. Adding A. indica leaves or wood ash to the soil when preparing
it for the polypots was also encouraged to deter insects that might attack the seeds or
shoots.
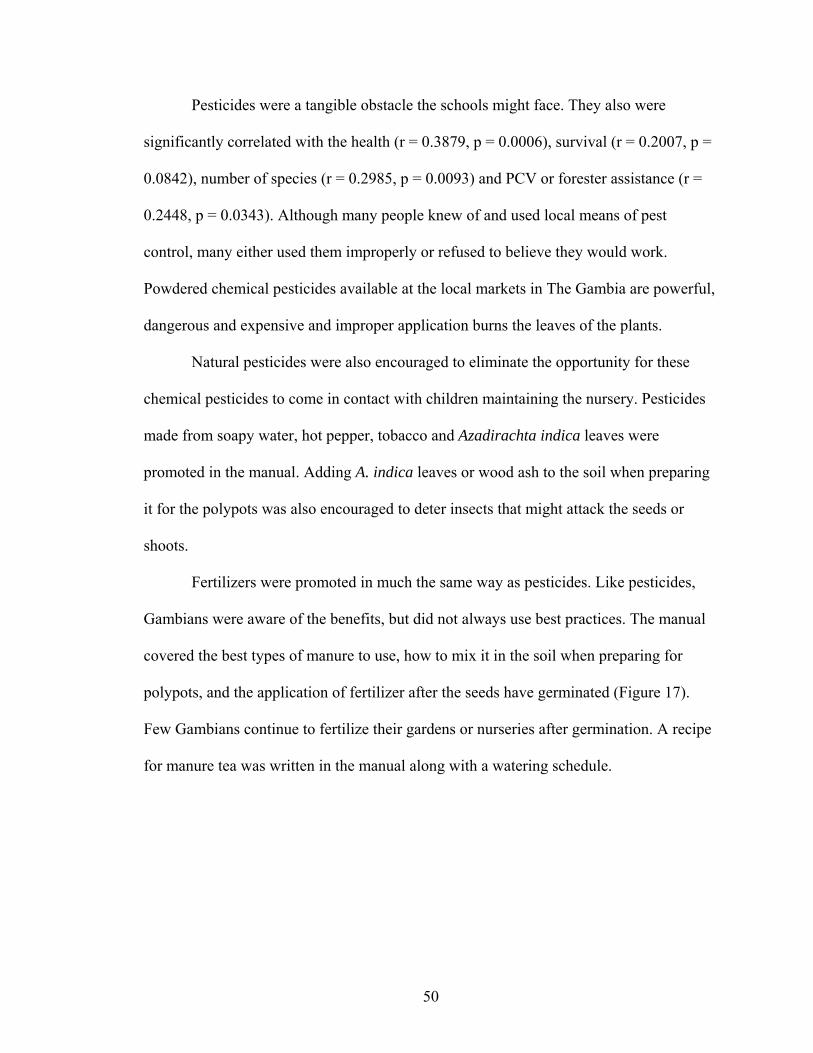
Fertilizers were promoted in much the same way as pesticides. Like pesticides,
Gambians were aware of the benefits, but did not always use best practices. The manual
covered the best types of manure to use, how to mix it in the soil when preparing for
polypots, and the application of fertilizer after the seeds have germinated (Figure 17).
Few Gambians continue to fertilize their gardens or nurseries after germination. A recipe
for manure tea was written in the manual along with a watering schedule.
51
Figure 17. Students at Diabugu BCS in URD pound dry manure and mix soil to prepare polypots for their school garden. Photo by Panchita Paulete.
52
Survival of the trees, in addition to being correlated with the use of natural
pesticides and the regular and weighted sums, is correlated with outside assistance from
PCVs or foresters (r = 0.2128, p = 0.0667). This correlation suggests repeated, small-
scale assistance to be more beneficial than a one-time, large-scale workshop. The schools
that had received PCV or forester assistance also had a better concept of the competition
and its importance in the education of students about deforestation. Conversations with
these teachers during the evaluation trek included plans of outplanting and distribution,
even though the trees still had at least a month more in the nursery before they could be
outplanted.
The better survival of the trees at these schools could also be associated with the
extension agent’s ability to notice stresses in the trees at an earlier time. This way, trees
did not have to completely die before the school noticed and did something about it.
Additionally, many PCVs who lived in villages with schools visited these schools
weekly to oversee the schools’ progress. The schools that had PCVs in particular working
with them held great pride in this. Peace Corps has had a long and overall positive history
in The Gambia. Having a volunteer working in a community or school generates a sense
of pride. A failed tree nursery would have been a failure for them and their PCV.
When each school was evaluated at the end of the school year, it was clear to see
that the schools that fared best had not let cost or supplies interfere with their
implementation. They had used the manual as a resource to find inexpensive alternatives
and adapt these technologies to their needs.
53
Correlation with Number of Species
Number of species is correlated with the largest number of other variables and is
strongly correlated with the two test variables, health (r = 0.8226, p = <0.0001) and
survival (r = 0.2684, p = <0.0001), making number of species an indicator for the success
of a nursery. As seed collection has to be done early in the process of constructing a
nursery, more species shows an early commitment to the process. The top three schools
in each region all had numbers of species above the mean ( = 6.65).
The correlation between number of species and fencing (r = 0.2882, p = 0.0121)
and proximity to watersource (r = 0.2726, p = 0.0180) further substantiates this idea.
Placement near a watersource and protection of the nursery are also correlated with the
health of the nurseries. These are also steps that have to be done early during the
construction of the nursery. Early and proper planning of these factors shows that the
schools were thinking more seriously about the competition and they realized a strong
fence and proximity to a watersource would help them maintain the nursery.
Number of species is also correlated with PCV or forester assistance in the project
(r = 0.2845, p = 0.0133). Seeking outside help from extension agents further shows
seriousness on the part of the schools in the competition. The range of outside help was
different for PCVs and foresters. Forester assistance was more passive; schools initiated
the interaction with foresters. These circumstances included a school group field trip to
local forestry station to see a functioning tree nursery and acquisition of black polypot
bags and seeds. PCVs proactively encouraged schools in their efforts with visits. The
volunteer might provide technical support or help run an Environmental Education Club
during their time at the school. Schools with frequent visits from PCVs would have been
54
further motivated by pride in their volunteer to collect as many seeds as possible to
promote their PCV.
The correlation of number of species with use of natural pesticides (r = 0.2984, p
= 0.0093) and the sums of the physical aspects of the nursery (regular, r = 0.3952, p =
0.0004; weighted, r = 0.3847, p = 0.0007) shows that once this initial effort had been put
in, the schools were motivated to adequately maintain the nursery through to completion,
further supporting the importance of an early commitment to the project.
Central River Division Workshop Results
As attendance of the workshop holds no correlation except with provision of
adequate shade structures (r = 0.2534, p = 0.0282), it seems that a one-time, large-scale
training was not an effective means of support in this project. The further analysis of the
two districts provided by the ANOVA test in regards to the physical aspects, sums and
outcomes further supports this as the URD was not provided a workshop and there was
no significant variation between these two districts in any of the areas evaluated.
However, within the CRD schools there were more schools that had attended the
workshop compared to those that had not that competed in the project. A total of 73
schools (77.7%) in the CRD attended the workshops. Of these, 29 schools did not
participate in the competition and an additional nine schools that did not attend the
workshop did compete. Forty-four schools in the CRD both attended the workshops and
competed.
Attendance at the workshops can be directly attributed to the mandate of the RED
in the CRD of 100% participation of its schools in the competition. The workshop
55
facilitated a technical training, and also enhanced the competition aspect for the school.
Although encouraging neighboring schools to help each other when problems arose, the
emphasis on the competitive aspect was not underplayed. With adversaries in the
competition boasting claims of volumes of trees they would plant during lunch and
departure, the teachers were able to evaluate the schools they were up against and
understand the efforts they would need to make to be contenders. The schools, while
possibly still not having a firm grasp on the technical concepts, were very excited about
the competition after the workshops.
The mandatory participation for the competition put in place by the CRD RED
also affected the participation level in the competition for the district. Where the CRD
had 53 (61.6%) of a possible 94 schools in the district participate, the URD had only 22
(25.6%) out of 86 schools compete. The number of participating schools in the URD
compared to that of the CRD was much lower.
Further, while support from the RED was not a measured variable, efforts were
shown through the initiative in mandating participation, conducting the workshop, and
the level of communication had with schools throughout the year. This knowledge, paired
with the correlation of PCV or forester assistance to survival and number of species
argues that more frequent support on a smaller scale fostered by a supportive community
is a more effective method to both motivating and training schools in this project.
Fostering Sustainability
Research done on sustainability of agricultural development work have produced
some guidelines for technologies and methods that build sustainable practices. These
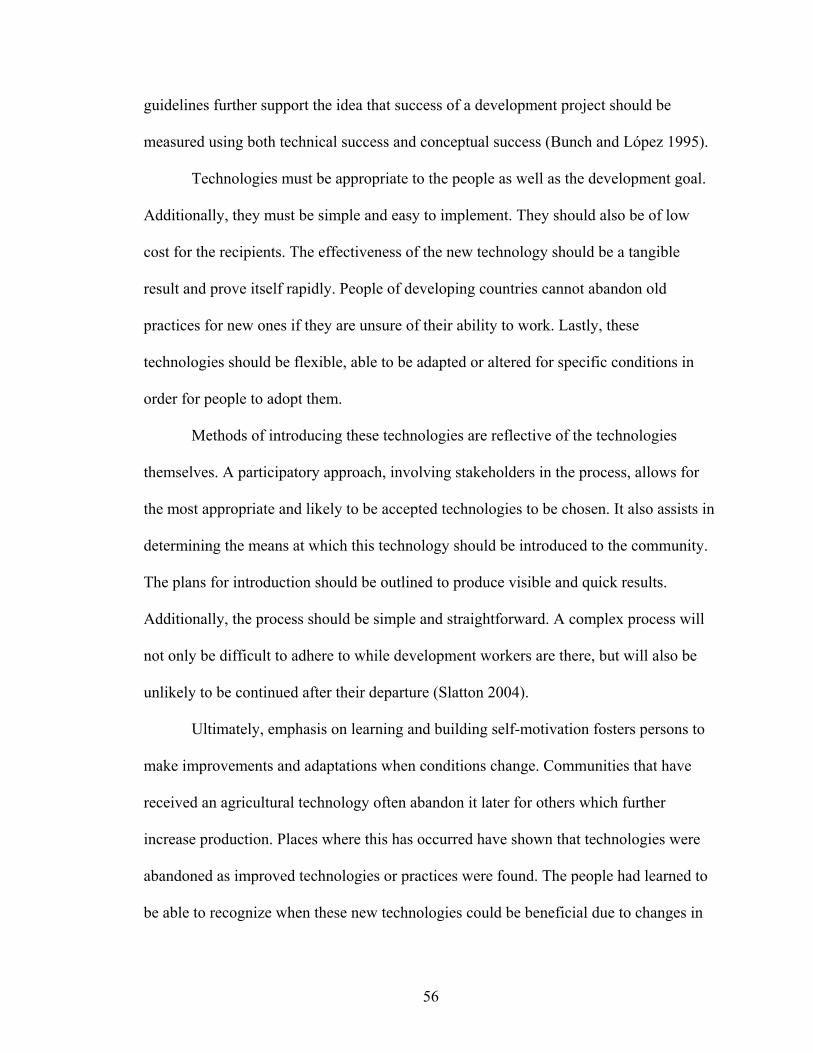
56
guidelines further support the idea that success of a development project should be
measured using both technical success and conceptual success (Bunch and López 1995).
Technologies must be appropriate to the people as well as the development goal.
Additionally, they must be simple and easy to implement. They should also be of low
cost for the recipients. The effectiveness of the new technology should be a tangible
result and prove itself rapidly. People of developing countries cannot abandon old
practices for new ones if they are unsure of their ability to work. Lastly, these
technologies should be flexible, able to be adapted or altered for specific conditions in
order for people to adopt them.
Methods of introducing these technologies are reflective of the technologies
themselves. A participatory approach, involving stakeholders in the process, allows for
the most appropriate and likely to be accepted technologies to be chosen. It also assists in
determining the means at which this technology should be introduced to the community.
The plans for introduction should be outlined to produce visible and quick results.
Additionally, the process should be simple and straightforward. A complex process will
not only be difficult to adhere to while development workers are there, but will also be
unlikely to be continued after their departure (Slatton 2004).
Ultimately, emphasis on learning and building self-motivation fosters persons to
make improvements and adaptations when conditions change. Communities that have
received an agricultural technology often abandon it later for others which further
increase production. Places where this has occurred have shown that technologies were
abandoned as improved technologies or practices were found. The people had learned to
be able to recognize when these new technologies could be beneficial due to changes in
57
circumstances and had built enough motivation from the results of previous technologies
to pursue the new technologies on their own (Bunch and López 1995).
In the Gambia All Schools Tree Nursery Competition, many of these ideas were
incorporated into the planning of the project. Using technologies appropriate and also
simple to follow were essential. Alternatives were suggested repeatedly to encourage
each school to use the resources most easily available to them. All technologies listed
were low to no cost.
Overview of the Top Three Schools in Each Division
The top three schools in each division not only met the basic construction
expectations of the competition, but also incorporated extended ideas of outplanting and
environmental education the tree nursery competition established. Following are
descriptions of the top schools in each district with explanations of the technical methods
and social aspects incorporated that gave these schools greater success and a higher
probability of sustainability.
UPPER RIVER DIVISION
Third place in the URD was awarded to Numuyel Basic Cycle School. The school
planted fourteen species in its nursery, totaling one hundred ninety-eight trees. The
school used a variety of containers for polypots including tin cans, black polypot bags,
old serving bowls, and recycled sugar bags. The nursery was located in the enclosed back
yard of one classroom, giving the nursery cement walls two meters tall as its fencing. The
nursery was shaded by the walls and roof overhang of the school.
58
Students had been in charge of the entire process of the nursery. Six teachers
collaborated together to supervise the students’ activities. Students collected seeds,
prepared the soil and polypots, and were responsible for watering the trees on a daily
schedule.
Numuyel stood out from other competing schools because of their progress in the
outplanting process. The school had designated the Mangifera indica trees for an orchard
on the school grounds. At the time of the evaluation trek, more than a dozen holes had
already been dug and were being prepared with compost the students had made. Other
holes were being dug around the campus to increase shade and as a campus beautification
project. This school had also placed third in the competition the previous year. It did not
have any assistance from PCVs or foresters either year.
Song Kunda Lower Basic School received second place for the URD. One of the
more remote schools to compete, it grew 526 trees of 22 species. This school had not
participated in the competition the previous year.
When the competition started, the school’s garden fence had been damaged and
was inadequate to protect the trees from foraging animals. However, this school had a
supportive community for the project. The community loaned the school chain link
fencing to use to protect the trees through the school year. The students had also
constructed a thick grass shade structure to protect the trees from the sun during the heat
of the day (Figure 18). Trees were planted in a variety of containers including the black
polypot bags, recycled sugar bags, and large ‘mintie’ bags that had contained individually
wrapped sweets. The school was applying manure tea to the trees and had prepared an
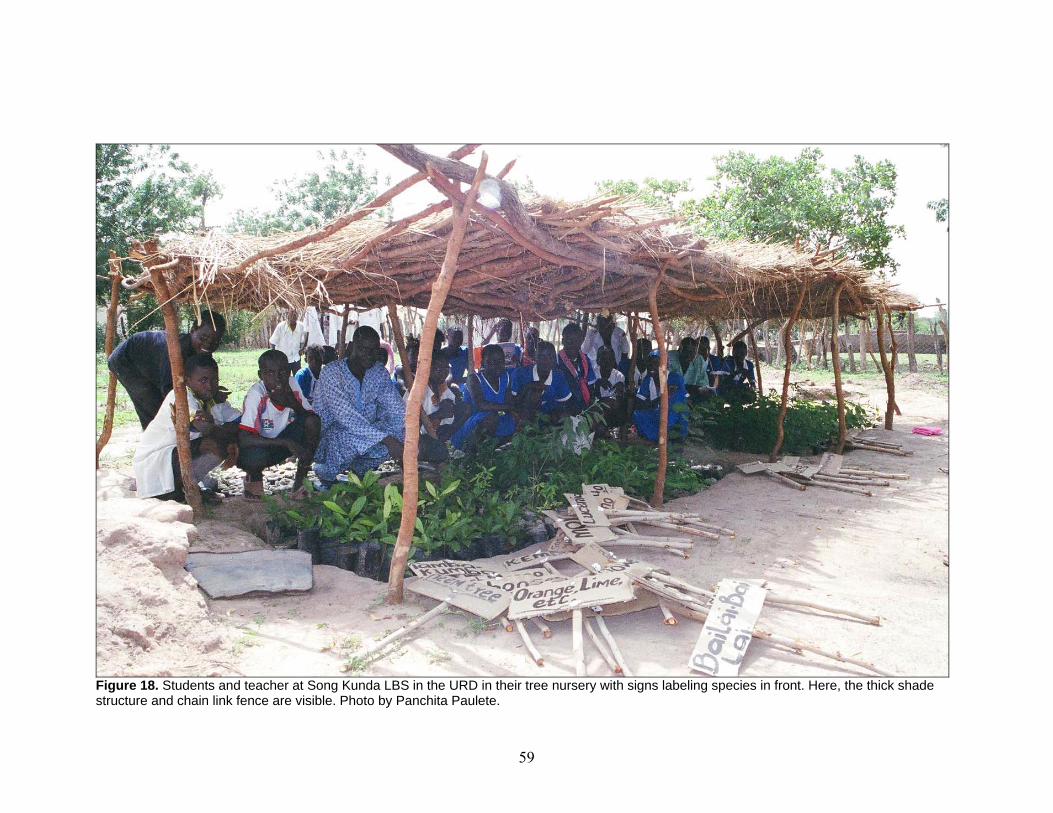
59
Figure 18. Students and teacher at Song Kunda LBS in the URD in their tree nursery with signs labeling species in front. Here, the thick shade structure and chain link fence are visible. Photo by Panchita Paulete.
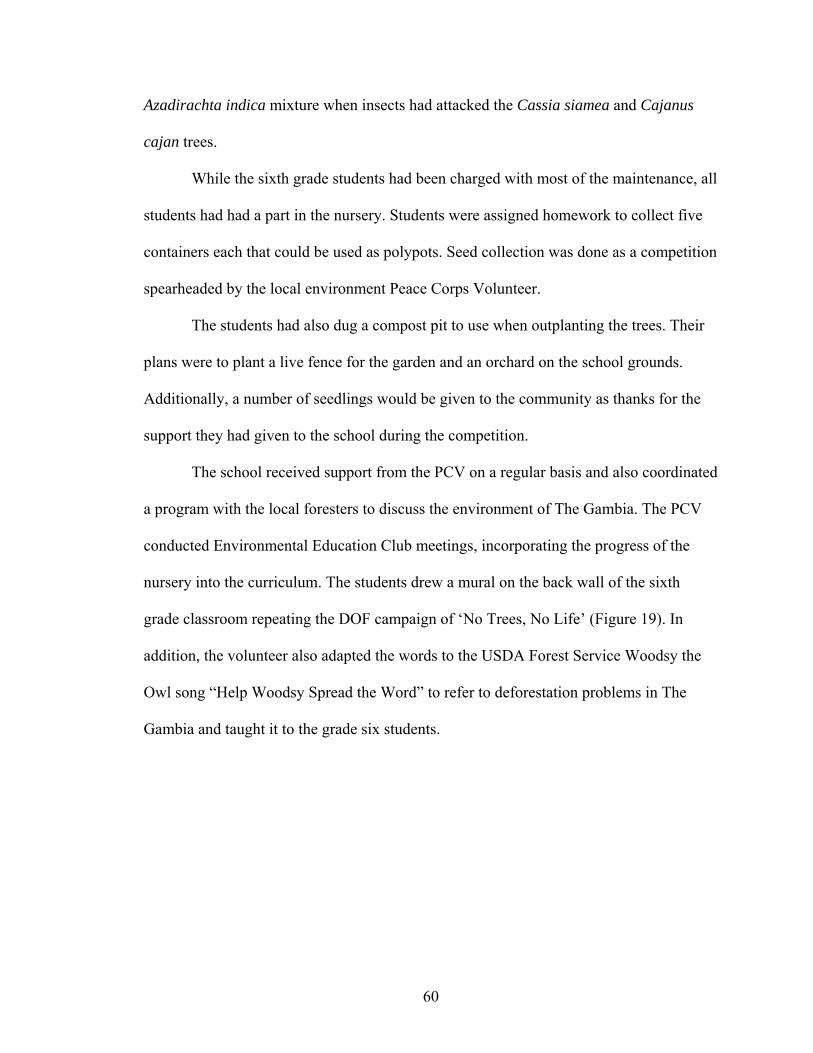
60
Azadirachta indica mixture when insects had attacked the Cassia siamea and Cajanus
cajan trees.
While the sixth grade students had been charged with most of the maintenance, all
students had had a part in the nursery. Students were assigned homework to collect five
containers each that could be used as polypots. Seed collection was done as a competition
spearheaded by the local environment Peace Corps Volunteer.
The students had also dug a compost pit to use when outplanting the trees. Their
plans were to plant a live fence for the garden and an orchard on the school grounds.
Additionally, a number of seedlings would be given to the community as thanks for the
support they had given to the school during the competition.
The school received support from the PCV on a regular basis and also coordinated
a program with the local foresters to discuss the environment of The Gambia. The PCV
conducted Environmental Education Club meetings, incorporating the progress of the
nursery into the curriculum. The students drew a mural on the back wall of the sixth
grade classroom repeating the DOF campaign of ‘No Trees, No Life’ (Figure 19). In
addition, the volunteer also adapted the words to the USDA Forest Service Woodsy the
Owl song “Help Woodsy Spread the Word” to refer to deforestation problems in The
Gambia and taught it to the grade six students.
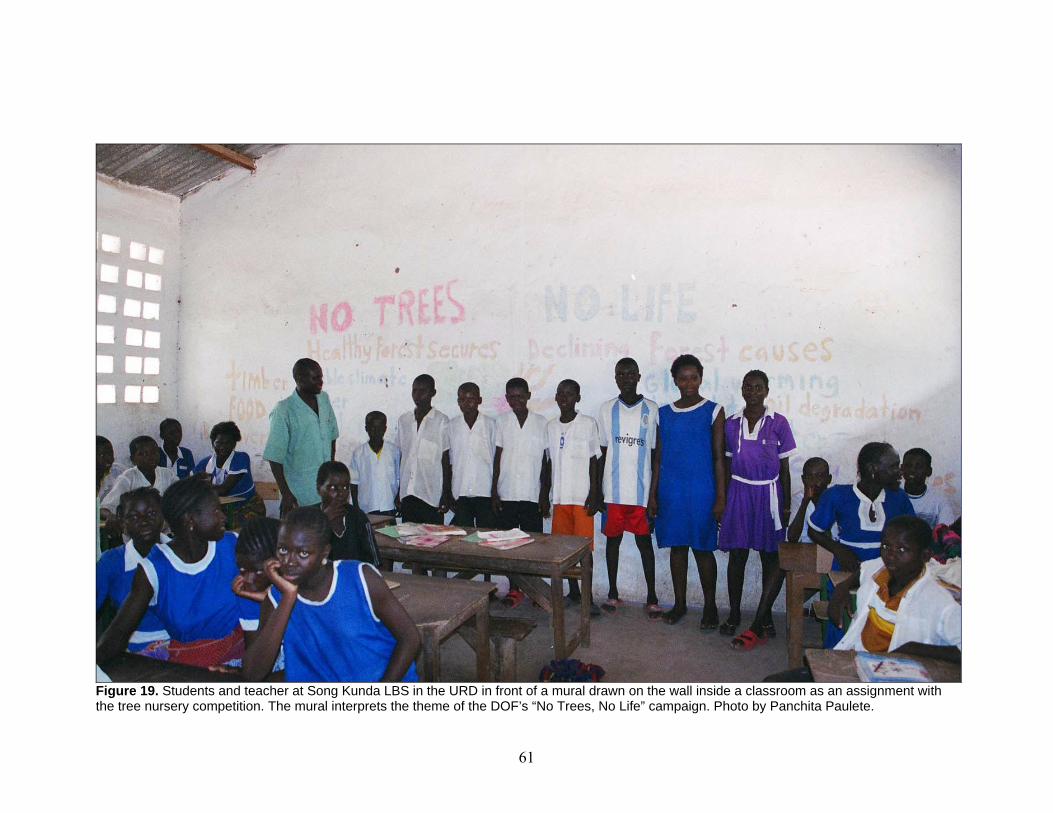
61
Figure 19. Students and teacher at Song Kunda LBS in the URD in front of a mural drawn on the wall inside a classroom as an assignment with the tree nursery competition. The mural interprets the theme of the DOF’s “No Trees, No Life” campaign. Photo by Panchita Paulete.
62
The first place school in the URD was Naude Lower Basic School. This school
had competed in the inaugural year and received second place. For the second year of the
competition, they had grown 471 trees of 37 species.
The school had utilized sugar bags, tin cans, old serving bowls, black polypot
bags, old drinking cups, and even flashlight tubes as containers for the trees in the
nursery. The nursery was located in a fenced in area behind the headmaster’s office on
the school grounds.
Most notable was Naude’s huge effort done with no support. Naude had had an
environment PCV living in the village the previous year. The volunteer had since left and
had not been replaced by the time of the competition. The school used the nursery manual
and followed the methods it had conducted the year before to repeat the actions it had
taken the previous year to construct a successful nursery.
CENTRAL RIVER DIVISION
Daru Lower Basic School took third place in the CRD. In addition to growing
four hundred eleven trees of nine different species, the school also extended the
educational process of the competition with a self-funded field trip.
The Environmental Education Club visited with the local DOF station at Yoro
Boro Kunda to see a working tree nursery before constructing their own. A forester with
the station walked the group through the nursery, identifying species and explaining the
commitment needed in the construction planning, building, and maintaining of the
nursery.
The school produced one of the most well planned and maintained nurseries in the
entire competition. Planned in a protected corner of the school grounds, the nursery was
63
shaded by a mature Cassia siamea and completely enclosed by cement and chicken wire.
Even the evaluators had a difficult time breaching the boundary. The nursery was
constructed with the wall of the school water pump serving as one of the nursery walls,
giving it possibly the closest proximity to a water source of any school’s nursery. The
nursery was also well organized and labeled with each species type (Figure 20).
In addition to the self-motivated assistance, a teacher from Daru attended the
workshop. There was also an environment PCV living in the village and assisting the
school throughout the competition.
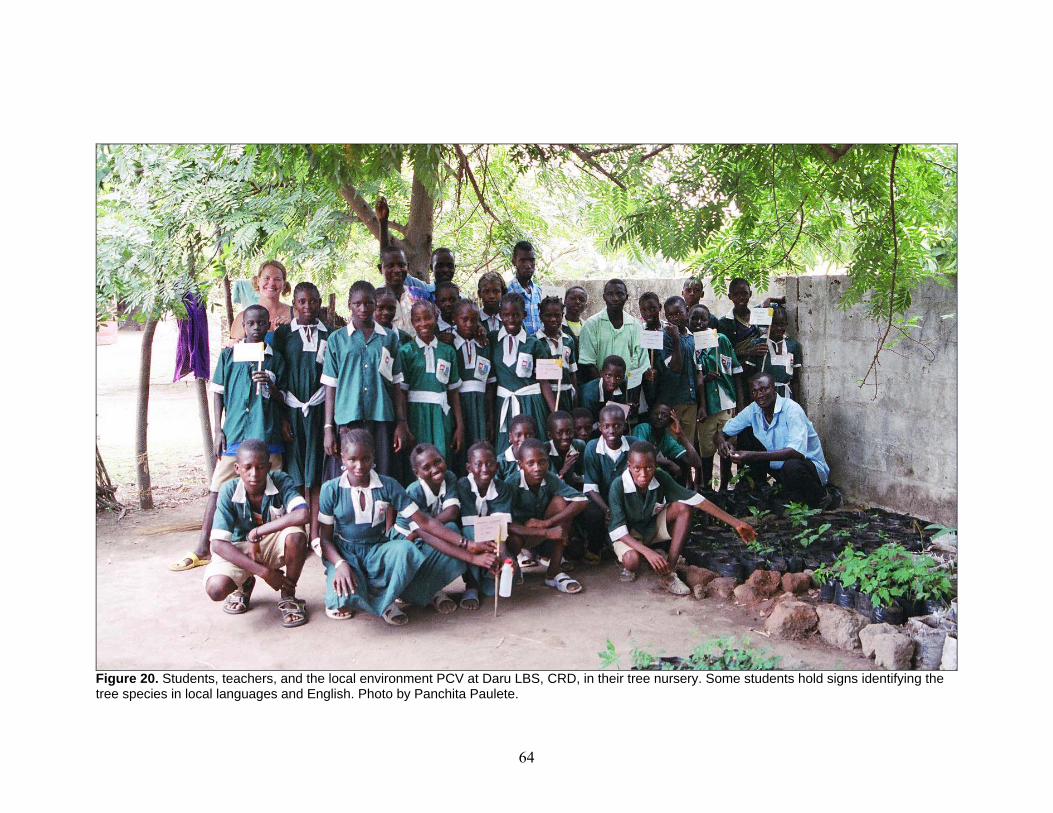
64
Figure 20. Students, teachers, and the local environment PCV at Daru LBS, CRD, in their tree nursery. Some students hold signs identifying the tree species in local languages and English. Photo by Panchita Paulete.
65
The second place school in the CRD was Dalaba Lower Basic School. This school
grew a total of four hundred twenty-one trees with twelve species. Dalaba had attended
the workshop and received visits from a local environment PCV.
The teachers at Dalaba added their own element of competition to the school’s
participation. Under the guidance of each respective teacher, each grade within the school
constructed individual nurseries and competed with each other. Teachers allowed
students to make their own decisions as to the construction and elements of their nursery
and only provided ‘how to’ guidance. Seed collection was also done by grade as part of
the competition. In addition to competing within the school, the students in sixth grade
were also assisting the first year students with the preparation and maintenance of their
nursery.
At the time of the evaluation trek, the inter-school competition had been
completed. Students were able to learn from each others successes and failures. One
grade’s nursery had been sun scorched because they had not wanted to construct a shade
structure and had not placed the nursery near a tree or other natural shade. The students
learned that shade was a vital element of the nursery.
Students were given notebooks and pencils as prizes in the inner-school
competition. These prizes were paid for by the teachers at the school. Teachers in The
Gambia are not well or regularly paid. This monetary commitment by the teachers to the
competition shows the importance to which the teachers at this school valued the
inclusion of environmental education into the project.
By far the most impressive school in both the CRD and URD was the CRD’s first
place winner, Saruja Lower Basic School. Having grown more trees than all other
66
schools in the competition combined, Saruja took the competition to its highest level. The
school grew 7,371 trees of 60 species. This school had attended the workshop and had
assistance from the local health PCV in seed identification.
The entire school was involved in creating a tree nursery of this magnitude. All
the teachers in the school accompanied the evaluation team out to the nursery and could
each respond to the questions regarding maintenance and care for the nursery.
The school was keeping a nursery journal in which the maintenance and watering
schedules were listed for all teachers to know. Problems with the fence or pests were
logged and dated with means used to correct the problem and success of method. Dates of
seed collection and planting by species were also listed in the journal.
Students kept a running board of trees in the nursery listed by name along with
uses and number in the nursery posted in the garden (Figure 21). The numbers were
updated weekly to account for new germination or seedling deaths. With five trees,
students had found the seeds but did not know the names to put on the board. They
reserved a few seeds and leaves in a bag and attached it to the board for students to
identify and in hopes that the evaluating team would be able to help them identify the
species.
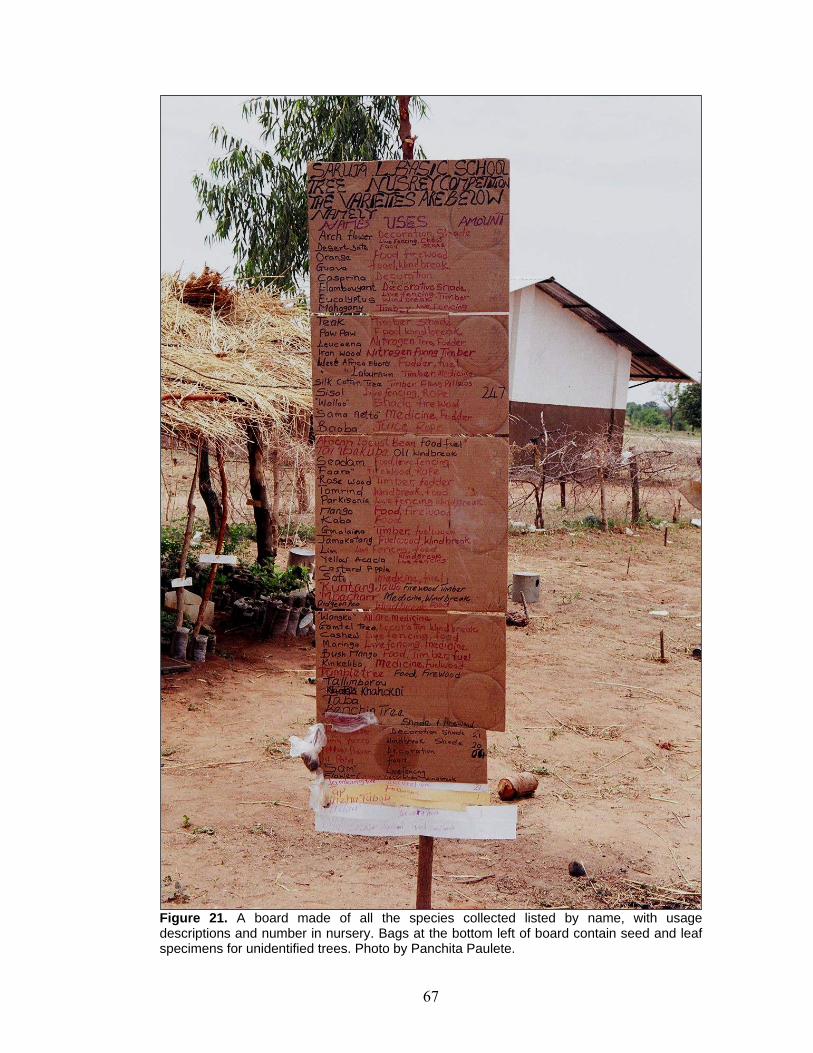
67
Figure 21. A board made of all the species collected listed by name, with usage descriptions and number in nursery. Bags at the bottom left of board contain seed and leaf specimens for unidentified trees. Photo by Panchita Paulete.
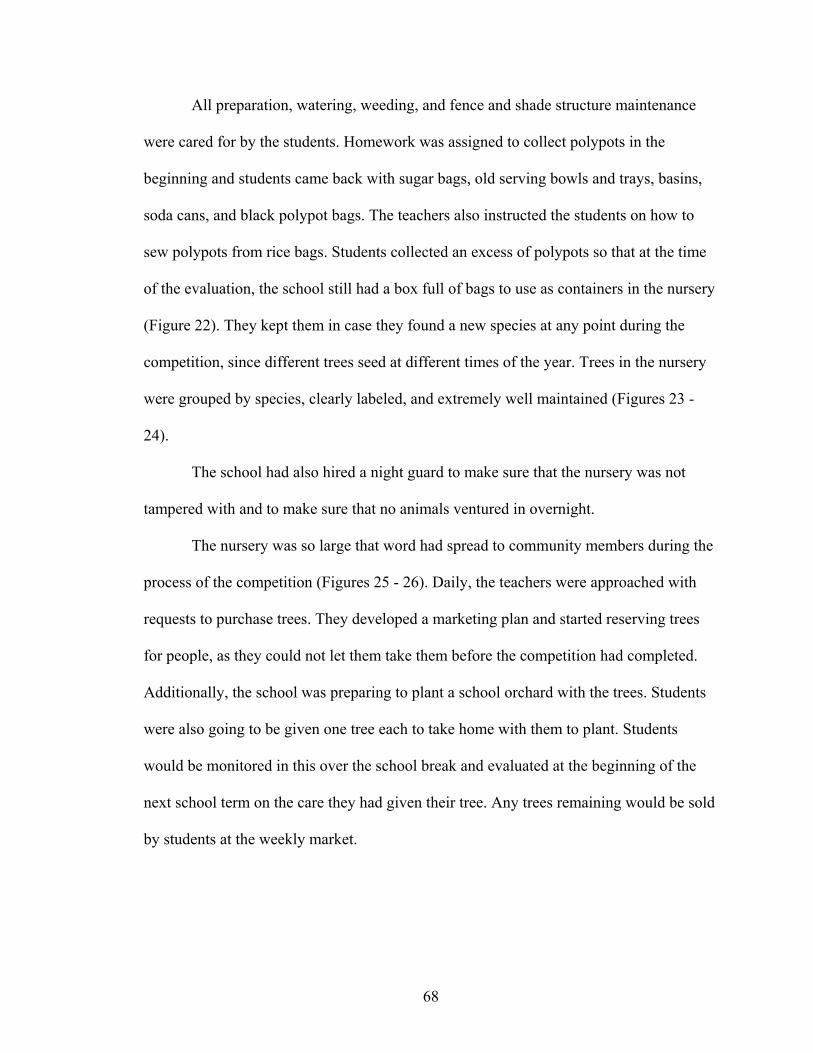
68
All preparation, watering, weeding, and fence and shade structure maintenance
were cared for by the students. Homework was assigned to collect polypots in the
beginning and students came back with sugar bags, old serving bowls and trays, basins,
soda cans, and black polypot bags. The teachers also instructed the students on how to
sew polypots from rice bags. Students collected an excess of polypots so that at the time
of the evaluation, the school still had a box full of bags to use as containers in the nursery
(Figure 22). They kept them in case they found a new species at any point during the
competition, since different trees seed at different times of the year. Trees in the nursery
were grouped by species, clearly labeled, and extremely well maintained (Figures 23 -
24).
The school had also hired a night guard to make sure that the nursery was not
tampered with and to make sure that no animals ventured in overnight.
The nursery was so large that word had spread to community members during the
process of the competition (Figures 25 - 26). Daily, the teachers were approached with
requests to purchase trees. They developed a marketing plan and started reserving trees
for people, as they could not let them take them before the competition had completed.
Additionally, the school was preparing to plant a school orchard with the trees. Students
were also going to be given one tree each to take home with them to plant. Students
would be monitored in this over the school break and evaluated at the beginning of the
next school term on the care they had given their tree. Any trees remaining would be sold
by students at the weekly market.
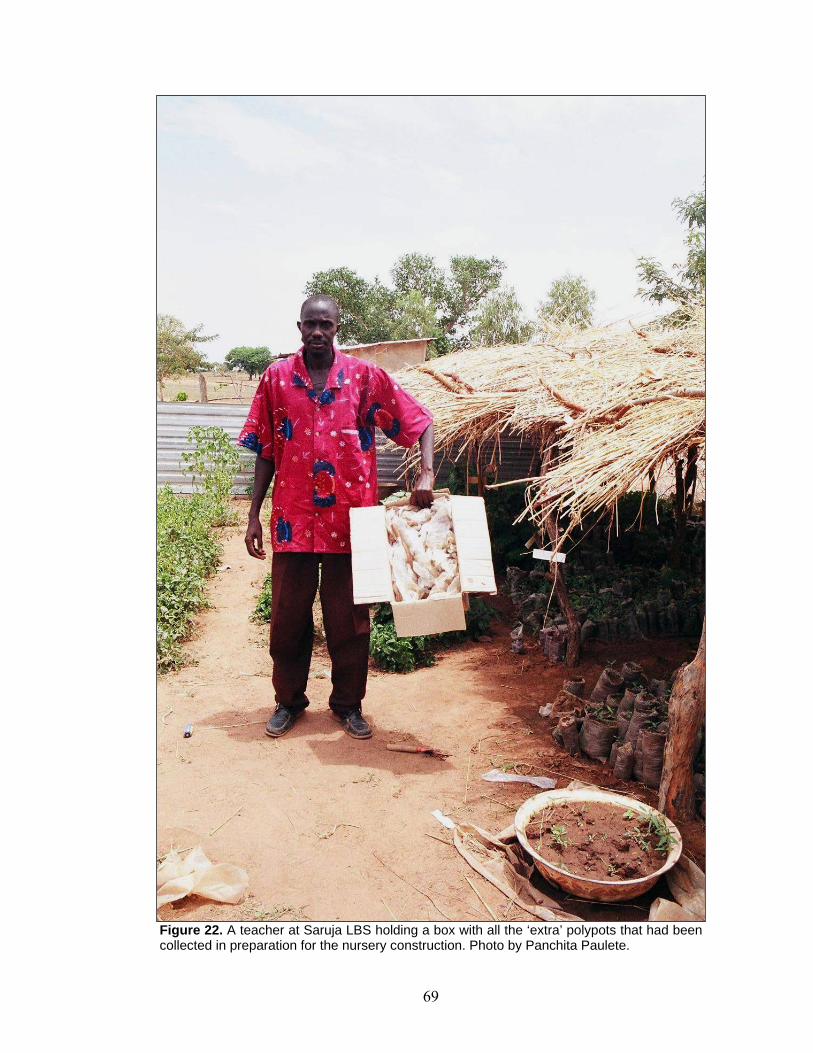
69
Figure 22. A teacher at Saruja LBS holding a box with all the ‘extra’ polypots that had been collected in preparation for the nursery construction. Photo by Panchita Paulete.
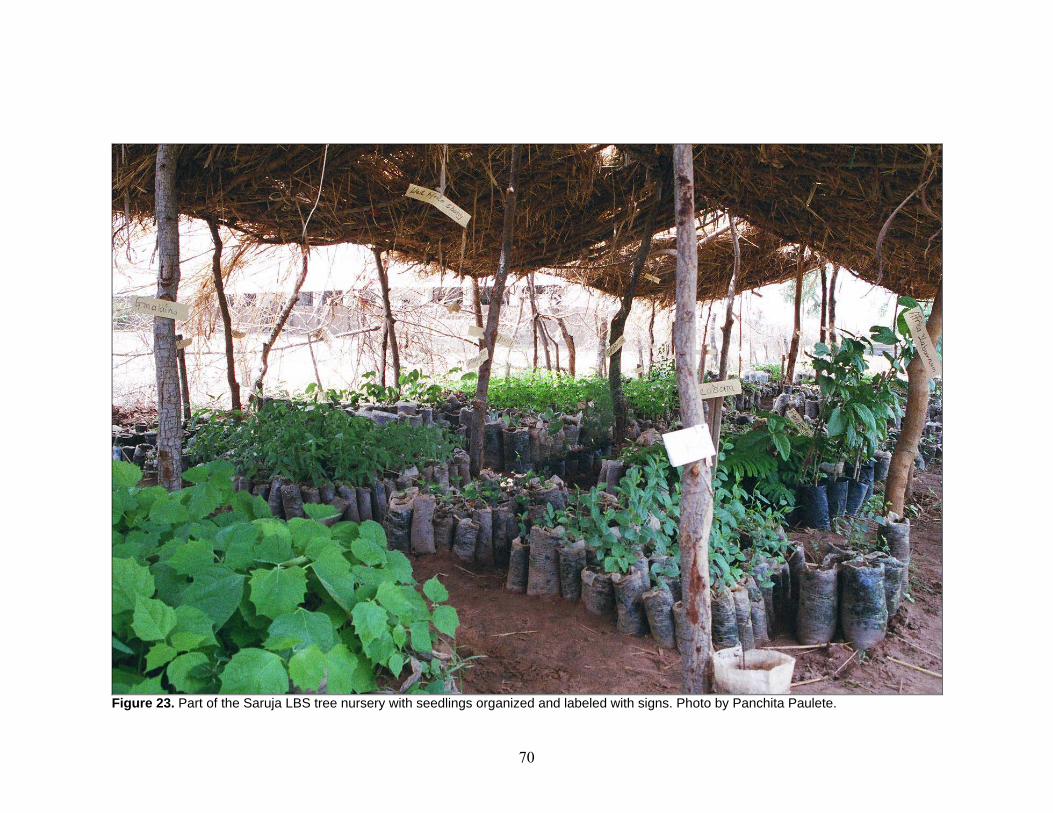
70
Figure 23. Part of the Saruja LBS tree nursery with seedlings organized and labeled with signs. Photo by Panchita Paulete.
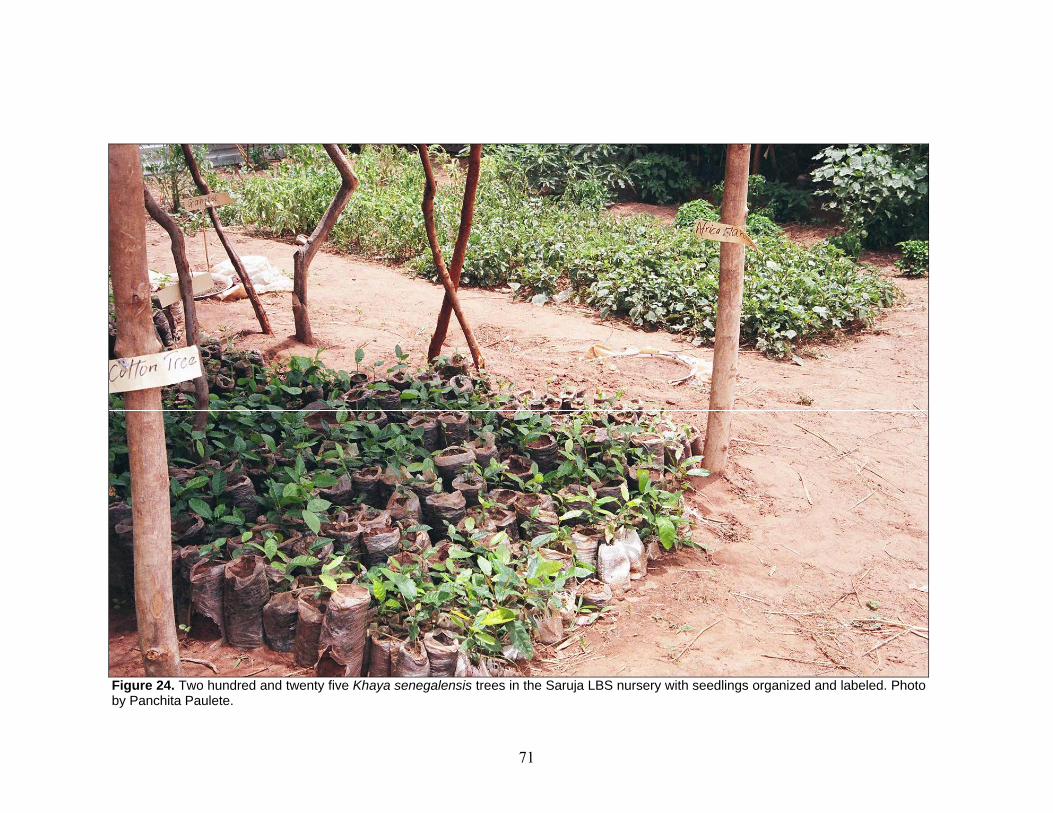
71
Figure 24. Two hundred and twenty five Khaya senegalensis trees in the Saruja LBS nursery with seedlings organized and labeled. Photo by Panchita Paulete.
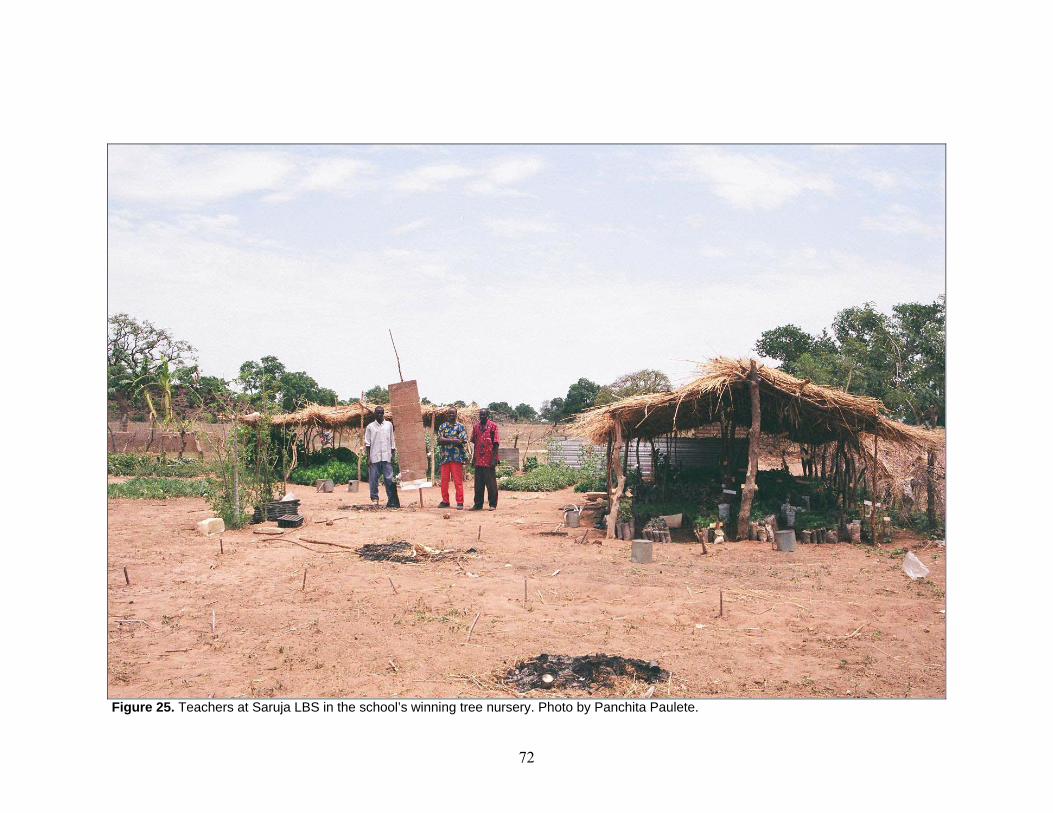
72
Figure 25. Teachers at Saruja LBS in the school’s winning tree nursery. Photo by Panchita Paulete.
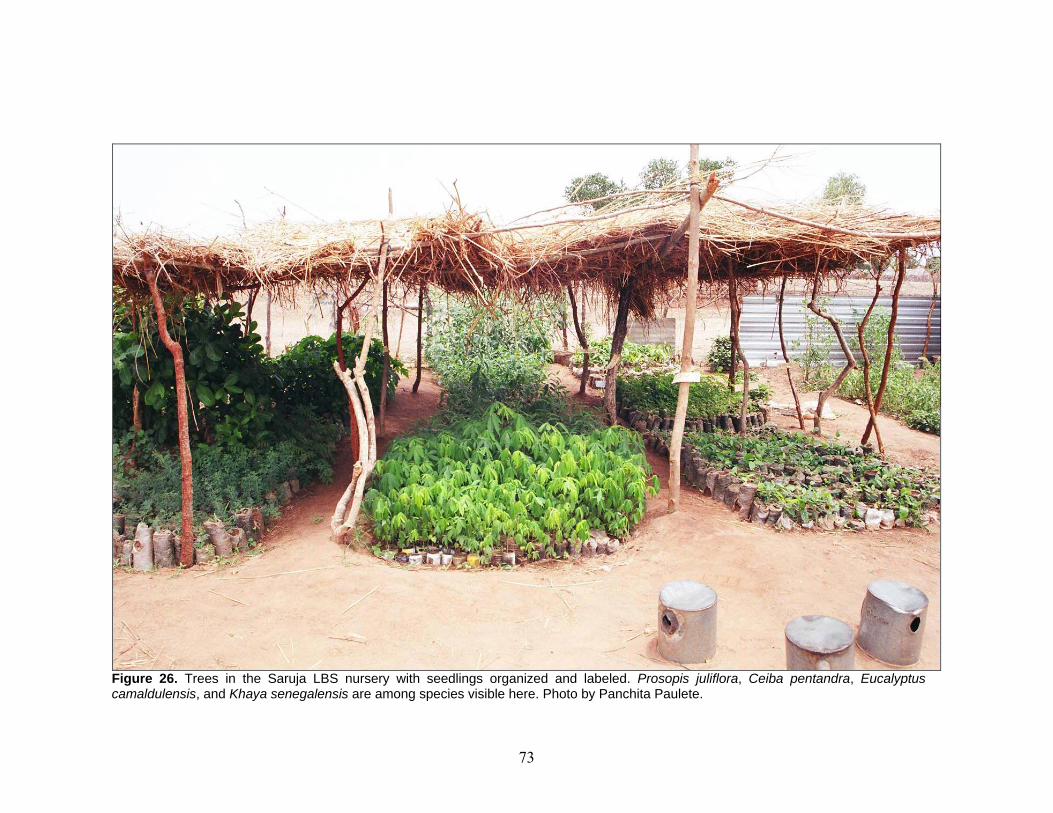
73
Figure 26. Trees in the Saruja LBS nursery with seedlings organized and labeled. Prosopis juliflora, Ceiba pentandra, Eucalyptus camaldulensis, and Khaya senegalensis are among species visible here. Photo by Panchita Paulete.
74
Most impressively, ‘not even one Butut4’ was spent in the school’s work to build
or maintain the nursery. The hired guard was even being paid in trees. One of the most
difficult concepts to convince schools of had been that this project could be done on little
to no money. Seeds and tools are available and adaptable for any needs. Saruja was able
to reinforce this concept.
The Buya Factor
Literature on sustainability in agricultural development provides insight into both
technologies and methods that have been shown to promote sustainability. Commonly
recognized elements include incorporation of appropriate and inexpensive technologies,
inclusion of stakeholders, and immediate and identifiable success for labor employed
(Bunch and López 1995; Slatton 2004). Tangible measures of sustainability in this
project are difficult because of the short amount of time it has been going on. However,
one instance occurred to allow an early indicator measurement.
Buya was a PCV posted to Sandu District, URD, in the village of Naude. During
her time in the country, her efforts were focused on this project and teaching in the
schools. She worked with Diabugu BCS and Naude LBS, the top two schools in the
competition during the 2003 – 2004 school year, while in country. Her involvement at
each school involved weekly visits, during which she would teach Social and
Environmental Sciences (SES) in the classroom, incorporate hands-on lessons, or
consulted with the teachers about the progress of the project.
4 Coin currency in The Gambia where one Butut equals about $0.0003 US.
75
Except for teaching, her involvement was advisory and motivational at each
school. At no time did she work to construct the nurseries herself. When stages of
progress were identified, the task would have been completed by her next visit.
The Buya Factor looks at these two schools and analyze why one participated the
next year and the other did not. Valid comparisons and conclusions about sustainability
measures can be made because the variability of different persons with differing work
methods and ethics has been eliminated from these schools. The differences lie in the
schools and communities themselves.
Diabugu BCS was a politically created school. Having a school of its size and
level (grades one through nine) gives the community a certain level of status among its
surrounding villages and with the regional offices. However, even though the school
gives status to the community, the community gives the school very little support or
approval. The village is a large and wealthy Serahule community. Beyond the
construction of the facilities, the community has put no further efforts into the school,
allowing the front gate to remain broken and one of the walls to be half finished. Further,
the community does not value western education and does not push their children to
invest a good effort into their studies. A large portion of the students in the upper grades
are from neighboring villages.
Naude LBS is a small school located in a small, poor Fula community. The
community takes some level of pride in the school and makes sure the children attend.
This village has a respect for western education, with an unusually large proportion of
families sending their children off to other schools to receive education beyond grade six.
For its rural location, a surprising number of people in the village speak English.
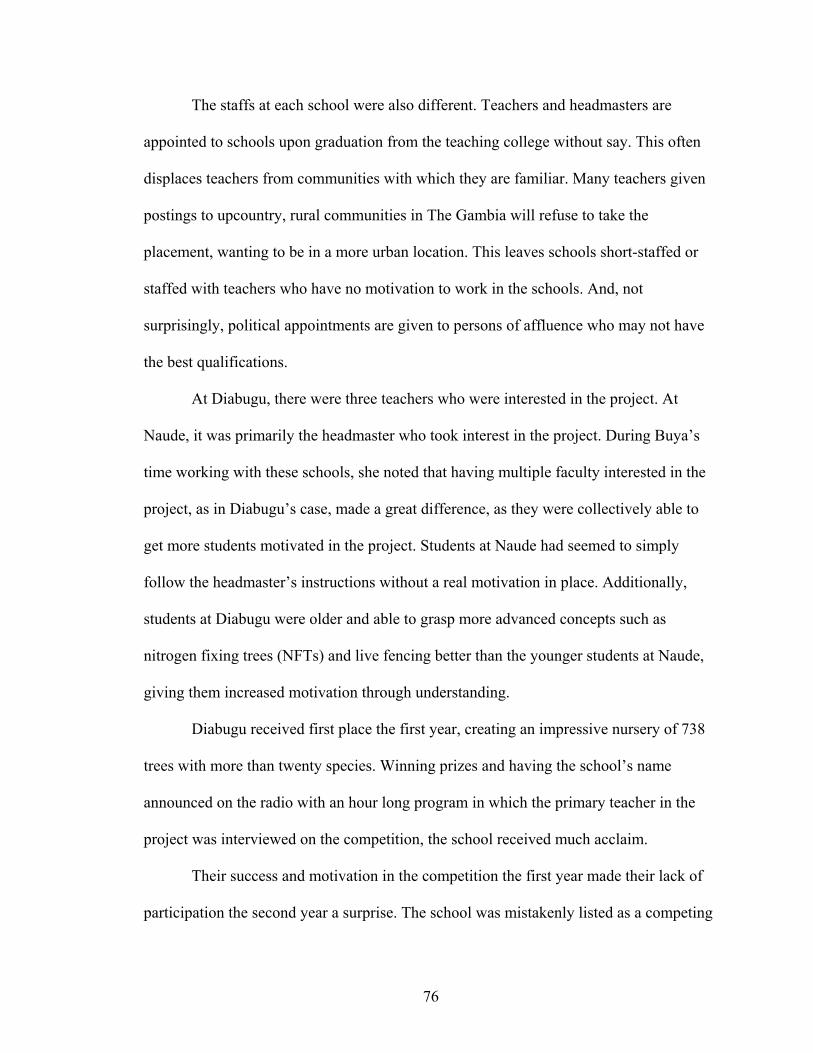
76
The staffs at each school were also different. Teachers and headmasters are
appointed to schools upon graduation from the teaching college without say. This often
displaces teachers from communities with which they are familiar. Many teachers given
postings to upcountry, rural communities in The Gambia will refuse to take the
placement, wanting to be in a more urban location. This leaves schools short-staffed or
staffed with teachers who have no motivation to work in the schools. And, not
surprisingly, political appointments are given to persons of affluence who may not have
the best qualifications.
At Diabugu, there were three teachers who were interested in the project. At
Naude, it was primarily the headmaster who took interest in the project. During Buya’s
time working with these schools, she noted that having multiple faculty interested in the
project, as in Diabugu’s case, made a great difference, as they were collectively able to
get more students motivated in the project. Students at Naude had seemed to simply
follow the headmaster’s instructions without a real motivation in place. Additionally,
students at Diabugu were older and able to grasp more advanced concepts such as
nitrogen fixing trees (NFTs) and live fencing better than the younger students at Naude,
giving them increased motivation through understanding.
Diabugu received first place the first year, creating an impressive nursery of 738
trees with more than twenty species. Winning prizes and having the school’s name
announced on the radio with an hour long program in which the primary teacher in the
project was interviewed on the competition, the school received much acclaim.
Their success and motivation in the competition the first year made their lack of
participation the second year a surprise. The school was mistakenly listed as a competing
77
school the second year and was therefore visited during the evaluation trek. Upon arrival,
the teacher who had been the most motivated the year prior confessed that they had not
been able to begin the project this year; they had not been awarded time in the schedule
to do it. Teachers at the school had been motivated to compete and had done the
competition almost entirely on their own the previous year, but the headmaster of the
school did not see it as a valuable use of time now that the PCV was not there to promote
the competition’s benefit and boost the reputation of the school with her repeated visits.
Naude had received second place in the competition’s inaugural year. Largely
driven by the headmaster, the school grew an impressive nursery, but provided less
motivation to the students during the process. The school was awarded various prizes and
was announced on the radio as well.
The school nursery was almost an exact duplicate of the nursery it had created the
year before, utilizing the same location, polypot alternatives and species as the year
before. The nursery was healthy and well maintained. The scale and effort were
impressive, seeing as there had been no technical assistance to the school other than the
manual this year. When asked if they had had outside assistance, the teachers smiled and
said they had not; the year before they had had Buya, but this year they had done it
themselves.
Diabugu had been motivated to compete in the project, but, at least at the
headmaster’s level, for the wrong reasons. Being a politically defined school, the
motivated teachers could not pursue the competition the following year without the
headmaster’s approval. With the PCV no longer visiting the school, the headmaster’s
motivation to allow the teachers to invest time in the project had left.
78
Recommendations for the development of sustainable projects suggest having
immediate and identifiable success for the participants. Visible results using minimal
efforts encourage persons to continue and expand their efforts for greater results the next
time (Bunch and López 1995). Both schools received similar recognition and awards at
the end of the competition, with Diabugu, having received first place, getting slightly
more. Naude, being a modest school in a supportive community, celebrated their success
and the village took pride in the recognition. The school at Diabugu did not receive as
much praise and support from the community, even though their returns were greater.
In addition to the material prizes and radio time, Diabugu also received a tangible
recognizable reward from the competition on its grounds. The school intercropped a
variety of NFTs, including Cajanus cajan and Moringa oleifera, into the school garden as
well as planting live fencing trees around the perimeter for windbreaks and live fencing.
The plan for outplanting had been discussed with the teachers by the PCV assisting the
school, but all outplanting was done after her departure from the country (Figures 27 -
28). A school woodlot had also been discussed, but the school failed to be allocated land
by the community in order to implement the project.
This would suggest that, all other elements being equal, the greatest factor in the
sustainability of development work is having a supportive community of stakeholders.
While the project has a strong network of stakeholders at the division planning level, the
Buya Factor suggests that the individual school level also needs to have strong
stakeholders for sustainability.
79
Figure 27. Two teachers stand in garden at Diabugu BCS in URD during the first term of the year following the school’s participation in the tree nursery competition. Photo by Panchita Paulete.
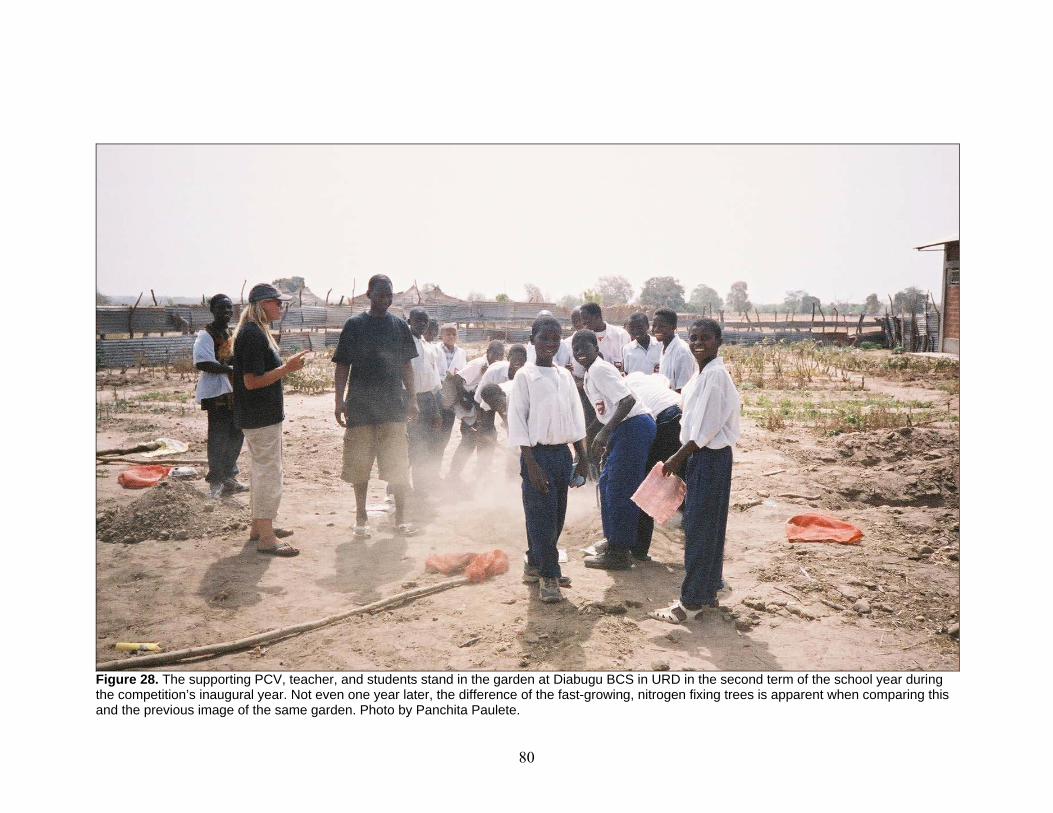
80
Figure 28. The supporting PCV, teacher, and students stand in the garden at Diabugu BCS in URD in the second term of the school year during the competition’s inaugural year. Not even one year later, the difference of the fast-growing, nitrogen fixing trees is apparent when comparing this and the previous image of the same garden. Photo by Panchita Paulete.
81
Community & Stakeholder Support
Community involvement in development projects is not a new concept. Much
research has been done to show the importance of community acceptance and
involvement in a multitude of development aspects. Furthermore, this research shows that
involvement of stakeholders and communities throughout the project promotes
ownership, increases local abilities, and leads to increased self confidence in technologies
(McConville 2006).
Multifaceted stakeholder involvement builds more regionally appropriate
technologies. Additionally, understanding of the need is increased when presented in
relevant terms. In this way interest and ownership develop, allowing the project to
continue and adapt as technologies bring about changes, increasing the educational
benefits to the communities (Bunch and López 1995; McConville 2006).
Expanding on the idea of a need for local community involvement in the schools’
success, three schools in the competition can be analyzed. Saruja LBS and Song Kunda
LBS, the first and second place schools for CRD and URD respectively, are examples of
schools with good community involvement. Fass LBS in the CRD exemplifies a school
with poor, even adverse, community support.
Saruja LBS, the CRD first place school, had high levels of stakeholder
involvement and community support. Every teacher in the school was involved in the
creation of the tree nursery. They also motivated the students to work, instead of merely
ordering them. Students took an interest in the project and learned how to identify trees
and their uses in their environment in addition to how to collect and grow them. The
community supported the school project by showing interest in buying the trees they
82
were growing and by working with the school to make sure a guard was provided and
that children were attending the nursery after school hours for watering and maintenance.
The early support the community showed to Song Kunda LBS, the second place
winner in the URD, helped establish the school’s success. The school would have had a
much more difficult time protecting the nursery had the community not loaned the school
the chain link fencing. The positive response by the community motivated the school to
succeed, as the project was more than just theirs now that the community had invested in
it. The school responded to this support by giving trees to the community to outplant after
the competition.
Conversely, Fass LBS in the CRD reflected the results of negative community
support. The village of Fass was a rural, conservative community that valued Islamic
education more than western education. All the resources in the community went towards
the Islamic school. Upon arriving for the evaluation trek at Fass, the school only had 47
trees of four species still surviving. The teacher showing the nursery was sad to report
that the nursery had been much bigger in the beginning. When asked what had happened,
he reflected that the school’s water pump had broken and that the closest one was in the
village. Furthermore, the community had told the school to stop using its pump to collect
water, not only for the nursery and garden, but also for the basic needs of cooking to feed
the children. Whenever possible, water was brought from a village more than a kilometer
away in large quantities. Additionally, teachers and cooks at the school would bring small
amounts of their personal water supplies to supplement the storage when needed. With
water needing to go to cooking and cleaning, it was difficult to allot much to the nursery.
83
A PCV had been posted to this community and after a year had to be relocated due to
problems resulting from the community’s support.
Problems Encountered
Coordinating the competition had three main complications. Transportation
within The Gambia is not regular. Traveling to the two regional office towns was often an
all-day venture. Foresters were given cars or motorcycles to use in their extension work,
but were often without fuel. Peace Corps Volunteers were issued bicycles, making travel
to the schools in the districts almost impossible unless the school was within biking
distance of the volunteer’s home. This left many schools unattended throughout the
competition. Additionally, transportation became an issue when supplies needed to be
transported for the awards ceremony from the capital. Many times rides were coordinated
at the last minute, making preplanning extremely difficult and often leaving something
unattended in order to move necessary items.
The DOF was able to donate the use of vehicles for the evaluation trek. However,
a second problem arose here. Communication of the REDs with the schools participating
was not the best. In the URD, of the schools on the list provided, only about half had a
nursery upon arrival; some schools had never started one. In the CRD, all schools were
visited at the urging of the RED because of the mandatory participation put into place.
However, this caused travel to many schools that had not competed. Time and fuel were
wasted because of this lack of communication, leaving the evaluators tired and frustrated.
Perhaps the biggest obstacle was a lack of proper funding. Choices constantly had
to be made in order to adjust for unexpected costs. Two of the most significant cutbacks
84
were not being able to have radio announcements and not being able to supply the top
schools with more prizes to have a greater impact of immediate, recognizable success.
Summary
Results of this grassroots environmental education project involve both technical
aspects with quantifiable results and analyses of more conceptual qualitative information
indicating sustainable success.
The more technical elements of the competition (shade, fencing, proximity to
watersource, pesticides, fertilizers, number of species, and the regular and weighted
sums) are significant to health and survival of the nursery. Quite obviously, if these
elements fail, the trees will fail to grow; a nursery cannot grow if these elements are
absent.
However, the extent to which they work or the motivation behind them getting
done are heavily reliant on stakeholder support on both the large, project level and on the
smaller, individual school level. Both levels can be seen in this project. There was greater
participation on the large, project level in the CRD, where stakeholders took a more
active role. Schools such as Song Kunda LBS and Dalaba LBS had strong support of the
communities and teachers, producing bigger and better nurseries at these schools.
Having reviewed these elements, several conclusions and recommendations about
the program can be drawn. These are discussed in chapter six.
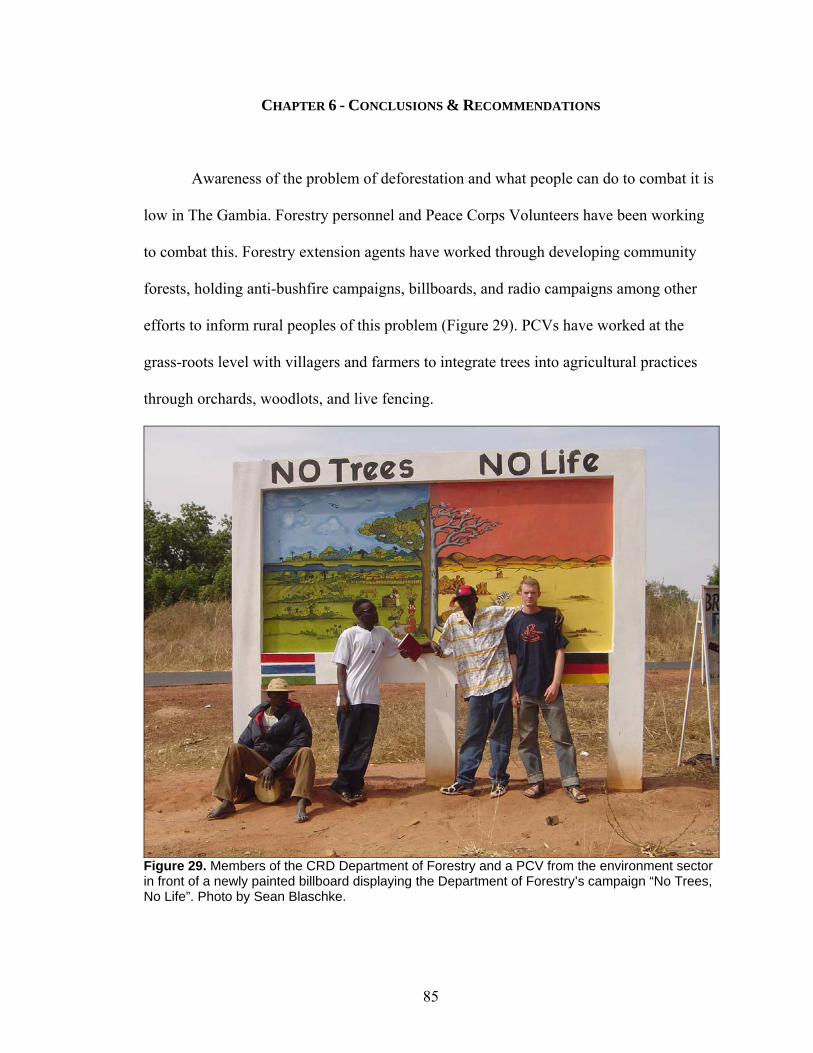
85
CHAPTER 6 - CONCLUSIONS & RECOMMENDATIONS
Awareness of the problem of deforestation and what people can do to combat it is
low in The Gambia. Forestry personnel and Peace Corps Volunteers have been working
to combat this. Forestry extension agents have worked through developing community
forests, holding anti-bushfire campaigns, billboards, and radio campaigns among other
efforts to inform rural peoples of this problem (Figure 29). PCVs have worked at the
grass-roots level with villagers and farmers to integrate trees into agricultural practices
through orchards, woodlots, and live fencing.
Figure 29. Members of the CRD Department of Forestry and a PCV from the environment sector in front of a newly painted billboard displaying the Department of Forestry’s campaign “No Trees, No Life”. Photo by Sean Blaschke.
86
The Gambia has many constraints on their forest and natural resources sectors,
often with resource availability both in personnel and finances. Few people are trained in
the forestry sector to conduct proper research methods needed to evaluate appropriate
ways to sensitize the communities on problems.
The tree nursery competition was designed as a collaborative effort for foresters
and PCVs to work on one project with this same goal. Through the implementation of the
tree nursery competition, it was hoped Gambians would be motivated and educated in
developing tree nurseries while learning different tree species, the importance of forest
management, reforestation practices and ways to generate income.
Analysis of the methods used to develop and implement this competition in The
Gambia has provided some insight into project development and aspects of importance in
the success and sustainability of the project and nurseries.
Success of the competition as a project was completely dependent on involved
and motivated Gambian stakeholders. The involvement from planning to completion was
vital for communication and purpose to be conveyed to the schools. Participation was
greatly improved when the stakeholders took an active role in the progress of the
competition. Additionally, support of the community and the cooperation of all the
teachers within the school, while not quantified, were important characteristics of the top
schools in the competition.
An early commitment to the project had a profound effect on the outcome.
Quantified by quality of the construction, maintenance, and number of species, schools
above the mean in these groupings received multiple benefits from the competition.

87
Consistent interpersonal support of the schools by PCVs or foresters allowed for
interactions to foster relationships. This added a personal element to the school’s
motivation. Not wanting to let down their counterpart, schools worked harder to build
and maintain their nurseries.
Based on these conclusions and the data collected, several recommendations can
be made to improve the project in The Gambia and should be taken into consideration
when adapting the competition to other communities.
First, more publicity of the competition should be conducted through radio spots.
Gambians listen to the radio at all hours of the day and receive all notices and news this
way. Radio announcements to report progress points and results of the competition would
increase community awareness and, hopefully, involvement in the competition. Schools
with large nurseries could also announce trees for sale to expand their market. Radio
announcements would also allow the RED, DOF or PCV coordinators to send notices of
progression and notification of workshops or reports needed, increasing the
communication capabilities of the coordinating persons to the schools.
Increased awareness of the competition could also lead local Gambian companies
to support the competition through funding or donation of prizes. In addition, these
donors could also receive recognition on these radio announcements.
Personnel for the coordination of the competition should also be increased. With
only two PCVs for both divisions, energies were divided and the volunteers were often
exhausted from the traveling required. Persons with responsibilities to only one division
should be allocated to avoid these burnouts.
88
The Gambia All Schools Tree Nursery Competition as presented in this report
outlines the fundamental aspects of the operational and evaluative process. Adaptations
of these methods should make sure to incorporate differences in cultural and geographic
elements. Additionally, The Gambia is a small country, allowing for rapid growth of the
competition throughout the country. Country-wide programs in other areas would not be
feasible options in the first few years of the competition.
As the competition expands across the country, children all over The Gambia will
be influenced by the work done with the Gambia All Schools Tree Nursery Competition.
Family compounds will become shady and cool as the students bring home and plant a
tree each year.
Ideally, twenty years from now, the competition will have moved on to new
levels, having left behind orchards in which students learned grafting and woodlots in
which they learned timber management. Furthermore, the students of today will have
begun incorporating the new concepts and technologies that they learned through the
competition into their daily lives.
While still a generation or more away, by educating the children of The Gambia
today on the effects they can have on the environment, Gambians have the power to stop
the deforestation happening all around them and greatly improve their own quality of life.
At present the forests of The Gambia form the last vegetative frontier towards the desert. Because of its suitable geographic location as a long belt along the River Gambia, it would be comparatively easy to finally stop desertification at this point by safeguarding and rehabilitating the still existing forest lands. If the Gambian forests can be saved, not only the livelihood of the Gambian population will be maintained but also that of the people which are living south of The Gambia.
- Shindele and Bojang, 1995: 7
89
LITERATURE CITED
Allen, Irma. 2000. The Gambia Environmental Awards Scheme – Creating
Environmental Awareness Through Participation. In Brian A. Day and Martha C.
Monroe, eds. 2000. Environmental Education and Communication for a
Sustainable World. Academy for Educational Development, Washington DC;
138pp.
Athman, J. A., and Martha C. Monroe. 2001. Elements of Effective Environmental
Education Programs. In A. Fedler, ed. Defining Best Practices in Boating,
Fishing, and Stewardship Education. Recreational Boating and Fishing
Foundation, Alexandria, VA; 14pp.
Blaschke, Sean. Personal communication. Staff Forester, Ministry of Forestry, The
Gambia. December 17, 2004.
Bovill, E. W. 1926. The Niger and the Songhai Empire. Journal of the Royal African
Society, 25(98); 138-46pp.
Bunch, Roland and Gabinò López. 1995. Soil Recuperation in Central America:
Sustaining Innovation after Innovation. Sustainable Agriculture Programme of the
International Institute for Environment and Development, Gatekeeper Series No.
SA 55; 18pp.
CIA. The World Factbook – Gambia, The. 2006. Available online at
https://www.cia.gov/cia/publications/factbook/geos/ga.html. Page accessed:
September 17, 2006.
90
Emerson, Brock A. 2006. The Development of a Project Management Methodology for
Peace Corps Mauritania. M.S. Report, Environmental Engineering, Michigan
Technological University, Houghton, MI; 124pp.
Fletcher, Andria. 1977. The Gambia. Classic Publications, Covina, CA; 304pp.
Grey-Johnson, Nana, ed. 1997. State of the Environment Report –The Gambia. The
National Environment Agency, Banjul, The Gambia; 125pp.
Hussein, K., N. Sibelet, J. E. Oyep, and J. Zoundi. 1999. CORAF Initiative:
Strengthening Research-Extension-Farmers’ Organisation Linkages in West and
Central Africa. Field Studies: The Gambia. A study prepared for CORAF, UK
DFID and the French Ministère de la Coopération. CORAF/ODI/CIRAD/ITAD.
IPPF (International Planned Parenthood Federation). The Gambia. Available online at
http://www.ippf.org/imspublic/IPPF_CountryProfile/IPPF_CountryProfile.aspx?I
SOCode=GM. Page accessed: September 25, 2006.
Jones, Michael. 1994. Flowering Plants of The Gambia. A.A. Balkema, Rotterdam, the
Netherlands; 99pp.
Kumar, Krishna. 1987. Rapid, Low-Cost Data Collection Methods for A.I.D. A.I.D.
Program Design and Evaluation Methodology Report No. 10. Agency for
International Development; 43pp.
Manneh, Ebrima J. 2006. Jammeh re-elected. The Observer. Banjul, The Gambia. 26
September 2006.
McConville, Jennifer R. 2006. Applying Life Cycle Thinking to International Water and
Sanitation Development Projects: An assessment tool for project managers in
91
sustainable development work. M.S. Report, Environmental Engineering,
Michigan Technological University, Houghton, MI; 147pp.
Newton, Alex. 1988. West Africa: a travel survival kit. Lonely Planet Publications,
Berkley, CA. 459pp.
Schindele, W. and F. Bojang. 1995. Gambian Forest Management Concept I, The Forest
Sector of The Gambia. GGFP Report 29, Feldkirchen: GTZ/Deutsche
Forstservice as quoted in Richard A. Schroeder. 1999. Community, forestry and
conditionality in The Gambia. Africa, 69(1): 1-22.
Schroeder, Richard A. 1999. Community, forestry and conditionality in The Gambia.
Africa, 69(1): 1-22pp.
Sheehan, Nancy, ed. and CarolJo Rushin-Bell. 1987. The Gambia: Forest or Desert?
ActionAid/The Gambia, Banjul; 184pp.
Sillah, Jato S. 1999. Forest resources and plantations of The Gambia. EC-FAO
Partnership Programme, Banjul, The Gambia; 29pp.
Slatton, Russel. 2004. An Evaluation of Agricultural Adoption by Ngöbe Farmers in
Chalite, Panamá. MS Thesis, Forestry, Michigan Technological Universirty,
Houghton, MI; 149pp.
State Department, The. The Gambia. 2006. Available online at
http://www.state.gov/r/pa/ei/bgn/5459.htm. Page accessed: September 17, 2006.
Steel, Robert G. D. and James H. Torrie. 1960. Principles and Procedures of Statistics.
McGraw-Hill, New York; pp.481.
UNDP (United Nations Development Program). 2004. Human Development Reports.
Available online at
92
http://hdr.undp.org/statistics/data/indicators.cfm?x=23&y=1&z=1. Page accessed:
24 October 2006.
World Bank. 2006. World Development Index, Data Query. Available online at
http://devdata.worldbank.org/data-query/. Page accessed: October 24, 2006.
WFP (World Food Program). 2004. Development Project – The Gambia. Projects for
Executive Board Approval. Agenda item 8; 24pp.
Wright, Donald R. 1995. ‘That hell-hole of yours’. American Heritage. 46(6), 47-54pp.
Wright, Donald R. 2004. The World and a Very Small Place in Africa, 2nd ed. M.E.
Sharpe, New York; 351pp.
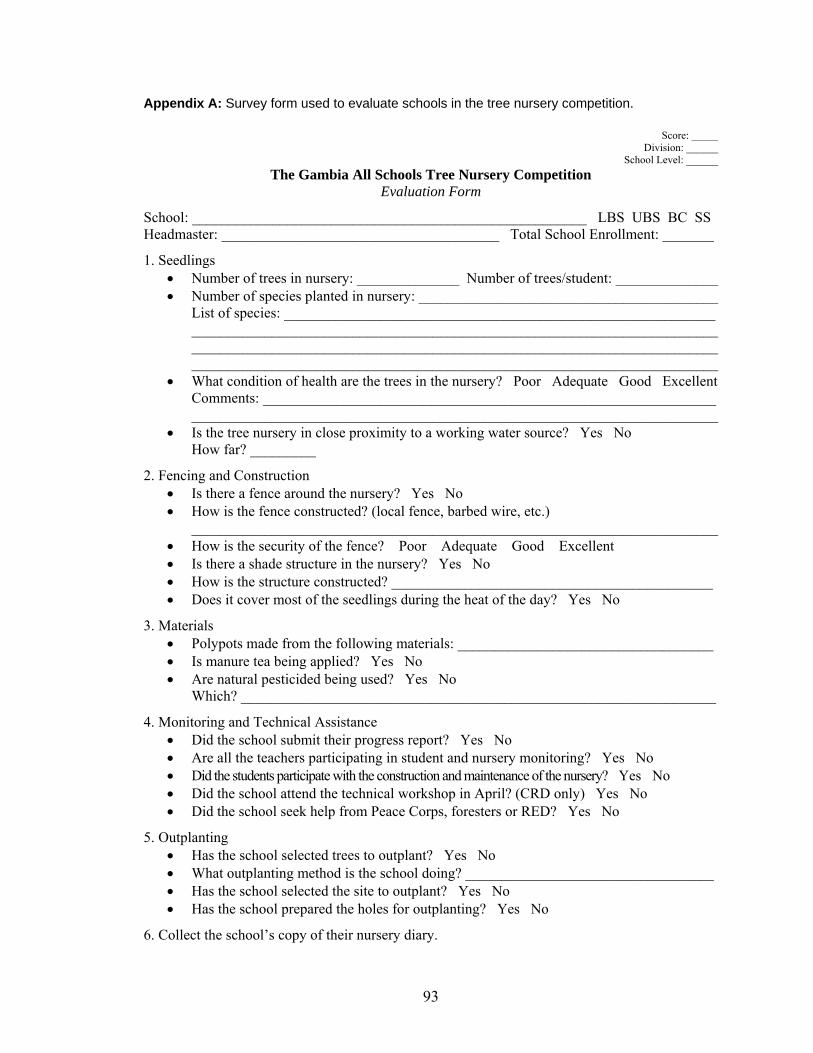
93
Appendix A: Survey form used to evaluate schools in the tree nursery competition.
Score: _____ Division: ______
School Level: ______ The Gambia All Schools Tree Nursery Competition
Evaluation Form
School: ______________________________________________________ LBS UBS BC SS Headmaster: ______________________________________ Total School Enrollment: _______
1. Seedlings • Number of trees in nursery: ______________ Number of trees/student: ______________ • Number of species planted in nursery: _________________________________________
List of species: ___________________________________________________________ ________________________________________________________________________________________________________________________________________________________________________________________________________________________
• What condition of health are the trees in the nursery? Poor Adequate Good Excellent Comments: ______________________________________________________________ ________________________________________________________________________
• Is the tree nursery in close proximity to a working water source? Yes No How far? _________
2. Fencing and Construction • Is there a fence around the nursery? Yes No • How is the fence constructed? (local fence, barbed wire, etc.)
________________________________________________________________________ • How is the security of the fence? Poor Adequate Good Excellent • Is there a shade structure in the nursery? Yes No • How is the structure constructed? ____________________________________________ • Does it cover most of the seedlings during the heat of the day? Yes No
3. Materials • Polypots made from the following materials: ___________________________________ • Is manure tea being applied? Yes No • Are natural pesticided being used? Yes No
Which? _________________________________________________________________
4. Monitoring and Technical Assistance • Did the school submit their progress report? Yes No • Are all the teachers participating in student and nursery monitoring? Yes No • Did the students participate with the construction and maintenance of the nursery? Yes No • Did the school attend the technical workshop in April? (CRD only) Yes No • Did the school seek help from Peace Corps, foresters or RED? Yes No
5. Outplanting • Has the school selected trees to outplant? Yes No • What outplanting method is the school doing? __________________________________ • Has the school selected the site to outplant? Yes No • Has the school prepared the holes for outplanting? Yes No
6. Collect the school’s copy of their nursery diary.
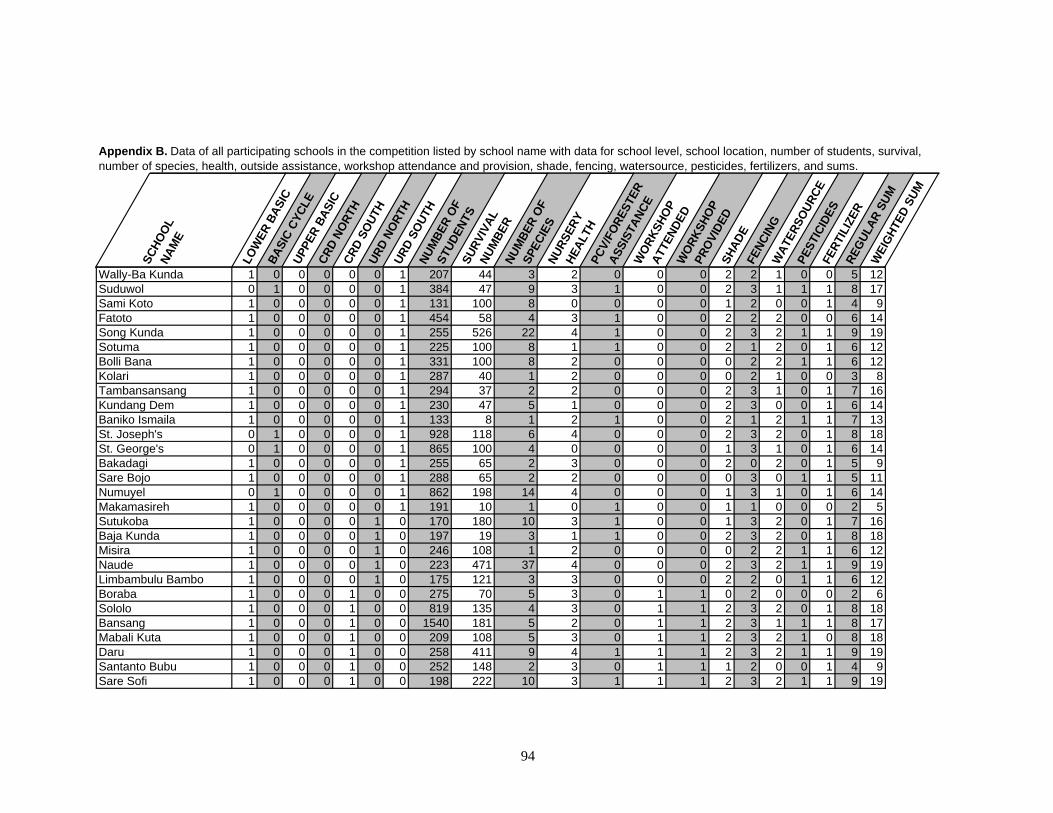
Appendix B. Data of all participating schools in the competition listed by school name with data for school level, school location, number of students, survival, number of species, health, outside assistance, workshop attendance and provision, shade, fencing, watersource, pesticides, fertilizers, and sums.
SCHO
OL
NAM
E
LOW
ER B
ASIC
BASI
C CY
CLE
UPPE
R BA
SIC
CRD
NORT
HCR
D SO
UTH
URD
NORT
HUR
D SO
UTH
NUM
BER
OFST
UDEN
TSSU
RVIV
AL
NUM
BER
NUM
BER
OFSP
ECIE
SNU
RSER
Y HE
ALTH
PCV/
FORE
STER
ASSI
STAN
CEW
ORKS
HOP
ATTE
NDED
WOR
KSHO
P PR
OVID
ED
SHAD
EFE
NCIN
GW
ATER
SOUR
CEPE
STIC
IDES
FERT
ILIZ
ERRE
GULA
R SU
MW
EIGH
TED
SUM
Wally-Ba Kunda 1 0 0 0 0 0 1 207 44 3 2 0 0 0 2 2 1 0 0 5 12Suduwol 0 1 0 0 0 0 1 384 47 9 3 1 0 0 2 3 1 1 1 8 17Sami Koto 1 0 0 0 0 0 1 131 100 8 0 0 0 0 1 2 0 0 1 4 9Fatoto 1 0 0 0 0 0 1 454 58 4 3 1 0 0 2 2 2 0 0 6 14Song Kunda 1 0 0 0 0 0 1 255 526 22 4 1 0 0 2 3 2 1 1 9 19Sotuma 1 0 0 0 0 0 1 225 100 8 1 1 0 0 2 1 2 0 1 6 12Bolli Bana 1 0 0 0 0 0 1 331 100 8 2 0 0 0 0 2 2 1 1 6 12Kolari 1 0 0 0 0 0 1 287 40 1 2 0 0 0 0 2 1 0 0 3 8Tambansansang 1 0 0 0 0 0 1 294 37 2 2 0 0 0 2 3 1 0 1 7 16Kundang Dem 1 0 0 0 0 0 1 230 47 5 1 0 0 0 2 3 0 0 1 6 14Baniko Ismaila 1 0 0 0 0 0 1 133 8 1 2 1 0 0 2 1 2 1 1 7 13St. Joseph's 0 1 0 0 0 0 1 928 118 6 4 0 0 0 2 3 2 0 1 8 18St. George's 0 1 0 0 0 0 1 865 100 4 0 0 0 0 1 3 1 0 1 6 14Bakadagi 1 0 0 0 0 0 1 255 65 2 3 0 0 0 2 0 2 0 1 5 9Sare Bojo 1 0 0 0 0 0 1 288 65 2 2 0 0 0 0 3 0 1 1 5 11Numuyel 0 1 0 0 0 0 1 862 198 14 4 0 0 0 1 3 1 0 1 6 14Makamasireh 1 0 0 0 0 0 1 191 10 1 0 1 0 0 1 1 0 0 0 2 5Sutukoba 1 0 0 0 0 1 0 170 180 10 3 1 0 0 1 3 2 0 1 7 16Baja Kunda 1 0 0 0 0 1 0 197 19 3 1 1 0 0 2 3 2 0 1 8 18Misira 1 0 0 0 0 1 0 246 108 1 2 0 0 0 0 2 2 1 1 6 12Naude 1 0 0 0 0 1 0 223 471 37 4 0 0 0 2 3 2 1 1 9 19Limbambulu Bambo 1 0 0 0 0 1 0 175 121 3 3 0 0 0 2 2 0 1 1 6 12Boraba 1 0 0 0 1 0 0 275 70 5 3 0 1 1 0 2 0 0 0 2 6Sololo 1 0 0 0 1 0 0 819 135 4 3 0 1 1 2 3 2 0 1 8 18Bansang 1 0 0 0 1 0 0 1540 181 5 2 0 1 1 2 3 1 1 1 8 17Mabali Kuta 1 0 0 0 1 0 0 209 108 5 3 0 1 1 2 3 2 1 0 8 18Daru 1 0 0 0 1 0 0 258 411 9 4 1 1 1 2 3 2 1 1 9 19Santanto Bubu 1 0 0 0 1 0 0 252 148 2 3 0 1 1 1 2 0 0 1 4 9Sare Sofi 1 0 0 0 1 0 0 198 222 10 3 1 1 1 2 3 2 1 1 9 19
94
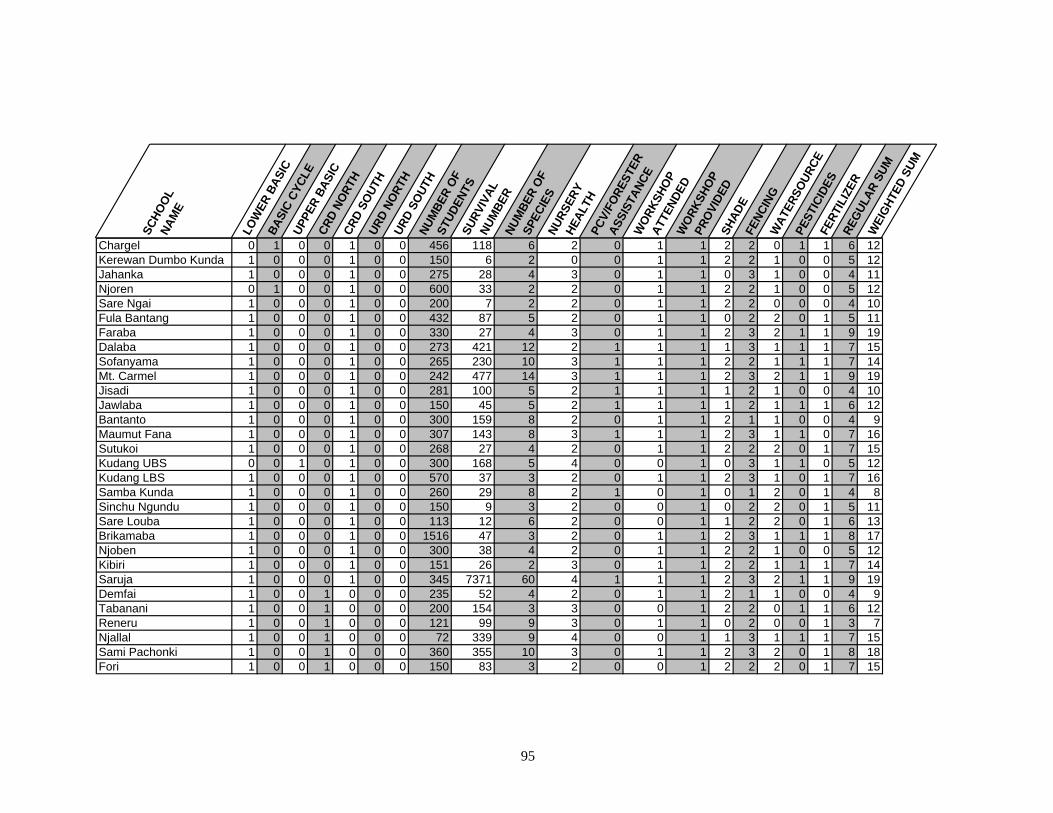
SCHO
OL
NAM
E
LOW
ER B
ASIC
BASI
C CY
CLE
UPPE
R BA
SIC
CRD
NORT
HCR
D SO
UTH
URD
NORT
HUR
D SO
UTH
NUM
BER
OFST
UDEN
TSSU
RVIV
AL
NUM
BER
NUM
BER
OFSP
ECIE
SNU
RSER
Y HE
ALTH
PCV/
FORE
STER
ASSI
STAN
CEW
ORKS
HOP
ATTE
NDED
WOR
KSHO
P PR
OVID
ED
SHAD
EFE
NCIN
GW
ATER
SOUR
CEPE
STIC
IDES
FERT
ILIZ
ERRE
GULA
R SU
MW
EIGH
TED
SUM
Chargel 0 1 0 0 1 0 0 456 118 6 2 0 1 1 2 2 0 1 1 6 12Kerewan Dumbo Kunda 1 0 0 0 1 0 0 150 6 2 0 0 1 1 2 2 1 0 0 5 12Jahanka 1 0 0 0 1 0 0 275 28 4 3 0 1 1 0 3 1 0 0 4 11Njoren 0 1 0 0 1 0 0 600 33 2 2 0 1 1 2 2 1 0 0 5 12Sare Ngai 1 0 0 0 1 0 0 200 7 2 2 0 1 1 2 2 0 0 0 4 10Fula Bantang 1 0 0 0 1 0 0 432 87 5 2 0 1 1 0 2 2 0 1 5 11Faraba 1 0 0 0 1 0 0 330 27 4 3 0 1 1 2 3 2 1 1 9 19Dalaba 1 0 0 0 1 0 0 273 421 12 2 1 1 1 1 3 1 1 1 7 15Sofanyama 1 0 0 0 1 0 0 265 230 10 3 1 1 1 2 2 1 1 1 7 14Mt. Carmel 1 0 0 0 1 0 0 242 477 14 3 1 1 1 2 3 2 1 1 9 19Jisadi 1 0 0 0 1 0 0 281 100 5 2 1 1 1 1 2 1 0 0 4 10Jawlaba 1 0 0 0 1 0 0 150 45 5 2 1 1 1 1 2 1 1 1 6 12Bantanto 1 0 0 0 1 0 0 300 159 8 2 0 1 1 2 1 1 0 0 4 9Maumut Fana 1 0 0 0 1 0 0 307 143 8 3 1 1 1 2 3 1 1 0 7 16Sutukoi 1 0 0 0 1 0 0 268 27 4 2 0 1 1 2 2 2 0 1 7 15Kudang UBS 0 0 1 0 1 0 0 300 168 5 4 0 0 1 0 3 1 1 0 5 12Kudang LBS 1 0 0 0 1 0 0 570 37 3 2 0 1 1 2 3 1 0 1 7 16Samba Kunda 1 0 0 0 1 0 0 260 29 8 2 1 0 1 0 1 2 0 1 4 8Sinchu Ngundu 1 0 0 0 1 0 0 150 9 3 2 0 0 1 0 2 2 0 1 5 11Sare Louba 1 0 0 0 1 0 0 113 12 6 2 0 0 1 1 2 2 0 1 6 13Brikamaba 1 0 0 0 1 0 0 1516 47 3 2 0 1 1 2 3 1 1 1 8 17Njoben 1 0 0 0 1 0 0 300 38 4 2 0 1 1 2 2 1 0 0 5 12Kibiri 1 0 0 0 1 0 0 151 26 2 3 0 1 1 2 2 1 1 1 7 14Saruja 1 0 0 0 1 0 0 345 7371 60 4 1 1 1 2 3 2 1 1 9 19Demfai 1 0 0 1 0 0 0 235 52 4 2 0 1 1 2 1 1 0 0 4 9Tabanani 1 0 0 1 0 0 0 200 154 3 3 0 0 1 2 2 0 1 1 6 12Reneru 1 0 0 1 0 0 0 121 99 9 3 0 1 1 0 2 0 0 1 3 7Njallal 1 0 0 1 0 0 0 72 339 9 4 0 0 1 1 3 1 1 1 7 15Sami Pachonki 1 0 0 1 0 0 0 360 355 10 3 0 1 1 2 3 2 0 1 8 18Fori 1 0 0 1 0 0 0 150 83 3 2 0 0 1 2 2 2 0 1 7 15
95
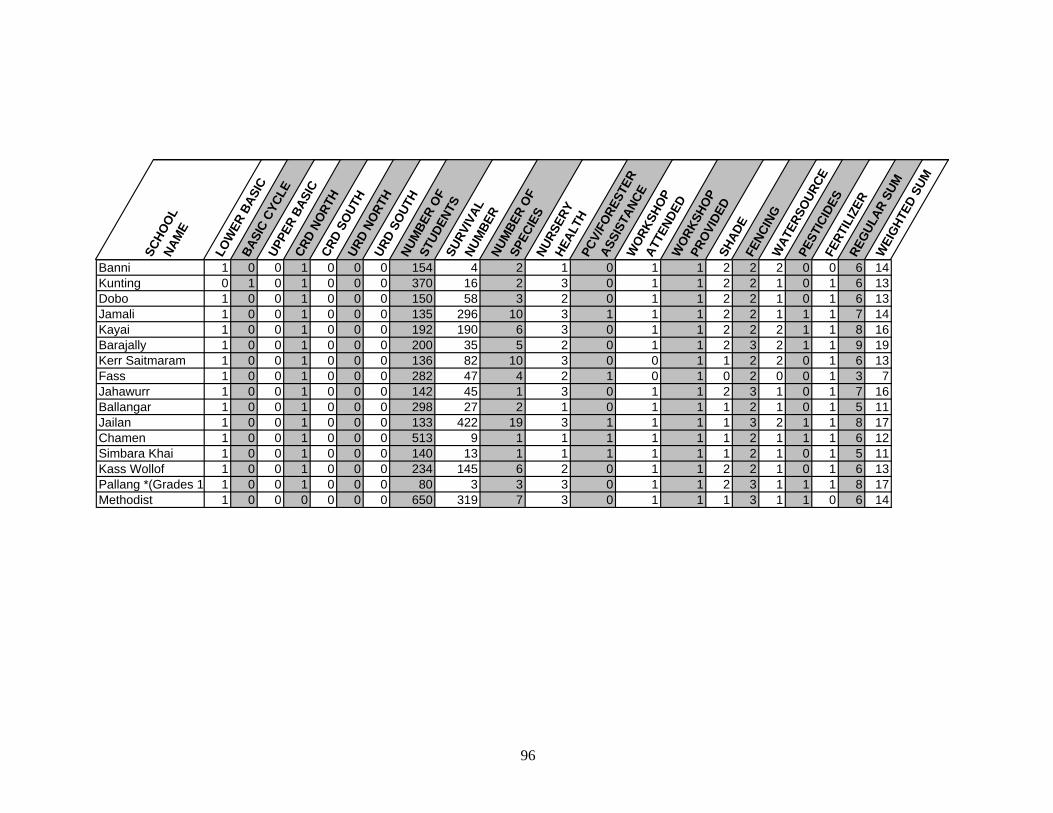
SCHO
OL
NAM
E
LOW
ER B
ASIC
BASI
C CY
CLE
UPPE
R BA
SIC
CRD
NORT
HCR
D SO
UTH
URD
NORT
HUR
D SO
UTH
NUM
BER
OFST
UDEN
TSSU
RVIV
AL
NUM
BER
NUM
BER
OFSP
ECIE
SNU
RSER
Y HE
ALTH
PCV/
FORE
STER
ASSI
STAN
CEW
ORKS
HOP
ATTE
NDED
WOR
KSHO
P PR
OVID
ED
SHAD
EFE
NCIN
GW
ATER
SOUR
CEPE
STIC
IDES
FERT
ILIZ
ERRE
GULA
R SU
MW
EIGH
TED
SUM
Banni 1 0 0 1 0 0 0 154 4 2 1 0 1 1 2 2 2 0 0 6 14Kunting 0 1 0 1 0 0 0 370 16 2 3 0 1 1 2 2 1 0 1 6 13Dobo 1 0 0 1 0 0 0 150 58 3 2 0 1 1 2 2 1 0 1 6 13Jamali 1 0 0 1 0 0 0 135 296 10 3 1 1 1 2 2 1 1 1 7 14Kayai 1 0 0 1 0 0 0 192 190 6 3 0 1 1 2 2 2 1 1 8 16Barajally 1 0 0 1 0 0 0 200 35 5 2 0 1 1 2 3 2 1 1 9 19Kerr Saitmaram 1 0 0 1 0 0 0 136 82 10 3 0 0 1 1 2 2 0 1 6 13Fass 1 0 0 1 0 0 0 282 47 4 2 1 0 1 0 2 0 0 1 3 7Jahawurr 1 0 0 1 0 0 0 142 45 1 3 0 1 1 2 3 1 0 1 7 16Ballangar 1 0 0 1 0 0 0 298 27 2 1 0 1 1 1 2 1 0 1 5 11Jailan 1 0 0 1 0 0 0 133 422 19 3 1 1 1 1 3 2 1 1 8 17Chamen 1 0 0 1 0 0 0 513 9 1 1 1 1 1 1 2 1 1 1 6 12Simbara Khai 1 0 0 1 0 0 0 140 13 1 1 1 1 1 1 2 1 0 1 5 11Kass Wollof 1 0 0 1 0 0 0 234 145 6 2 0 1 1 2 2 1 0 1 6 13Pallang *(Grades 1 1 0 0 1 0 0 0 80 3 3 3 0 1 1 2 3 1 1 1 8 17Methodist 1 0 0 0 0 0 0 650 319 7 3 0 1 1 1 3 1 1 0 6 14
96
Appendix C. A complete matrix of Pearson Correlation of Coefficients where n = 75.
HLTH HealthSURV SurvivalLBS Lower Basic SchoolBCS Basic Cycle SchoolUBS Upper Basic SchoolCRDN Central River Division (North)CRDS Central River Division (South)URDN Upper River Division (North)URDS Upper River Division (South)STUDENTS Number of StudentsNUMSPEC Number of SpeciesPCFASS Peace Corps Volunteer or Forester AssistanceWKSPATTD Workshop AttendedWKSPPRV Workshop ProvidedSHD ShadeFNC FencingWSRC Proximity to WatersourcePST Use of Natural PesticidesFRT Use of FertilizersREGSUM Regular SumWGHTSUM Weighted Sum
97
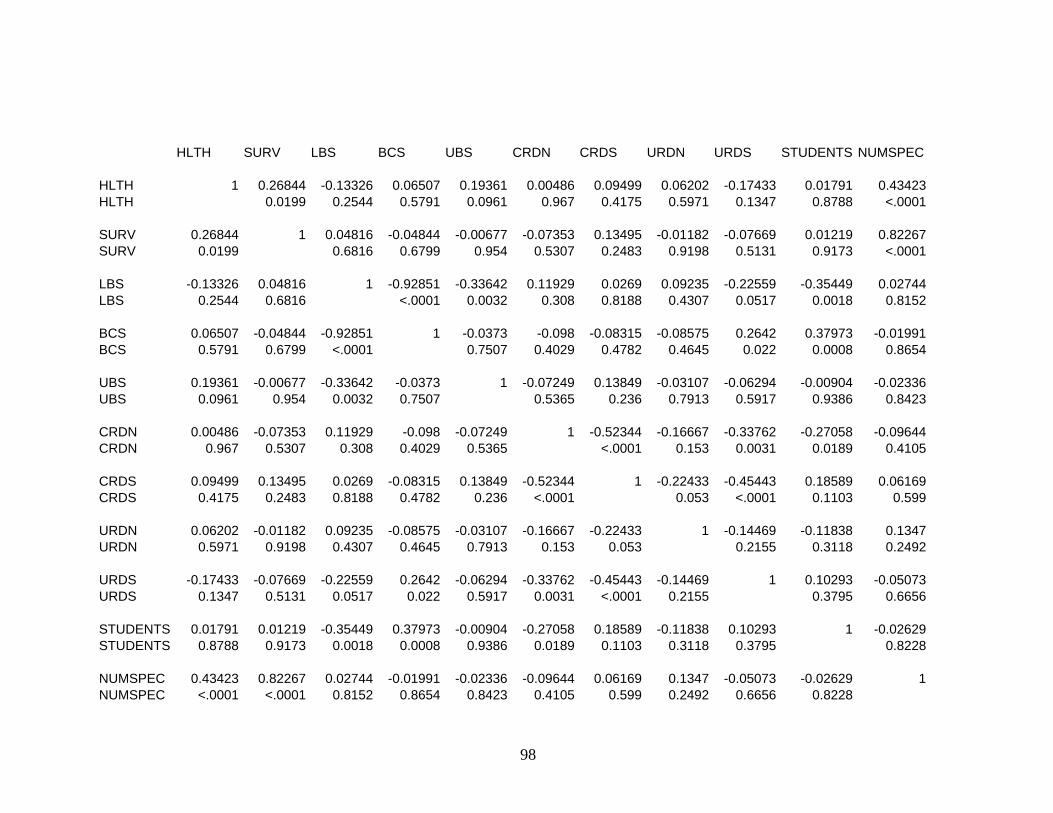
HLTH SURV LBS BCS UBS CRDN CRDS URDN URDS STUDENTS NUMSPEC
HLTH 1 0.26844 -0.13326 0.06507 0.19361 0.00486 0.09499 0.06202 -0.17433 0.01791 0.43423HLTH 0.0199 0.2544 0.5791 0.0961 0.967 0.4175 0.5971 0.1347 0.8788 <.0001
SURV 0.26844 1 0.04816 -0.04844 -0.00677 -0.07353 0.13495 -0.01182 -0.07669 0.01219 0.82267SURV 0.0199 0.6816 0.6799 0.954 0.5307 0.2483 0.9198 0.5131 0.9173 <.0001
LBS -0.13326 0.04816 1 -0.92851 -0.33642 0.11929 0.0269 0.09235 -0.22559 -0.35449 0.02744LBS 0.2544 0.6816 <.0001 0.0032 0.308 0.8188 0.4307 0.0517 0.0018 0.8152
BCS 0.06507 -0.04844 -0.92851 1 -0.0373 -0.098 -0.08315 -0.08575 0.2642 0.37973 -0.01991BCS 0.5791 0.6799 <.0001 0.7507 0.4029 0.4782 0.4645 0.022 0.0008 0.8654
UBS 0.19361 -0.00677 -0.33642 -0.0373 1 -0.07249 0.13849 -0.03107 -0.06294 -0.00904 -0.02336UBS 0.0961 0.954 0.0032 0.7507 0.5365 0.236 0.7913 0.5917 0.9386 0.8423
CRDN 0.00486 -0.07353 0.11929 -0.098 -0.07249 1 -0.52344 -0.16667 -0.33762 -0.27058 -0.09644CRDN 0.967 0.5307 0.308 0.4029 0.5365 <.0001 0.153 0.0031 0.0189 0.4105
CRDS 0.09499 0.13495 0.0269 -0.08315 0.13849 -0.52344 1 -0.22433 -0.45443 0.18589 0.06169CRDS 0.4175 0.2483 0.8188 0.4782 0.236 <.0001 0.053 <.0001 0.1103 0.599
URDN 0.06202 -0.01182 0.09235 -0.08575 -0.03107 -0.16667 -0.22433 1 -0.14469 -0.11838 0.1347URDN 0.5971 0.9198 0.4307 0.4645 0.7913 0.153 0.053 0.2155 0.3118 0.2492
URDS -0.17433 -0.07669 -0.22559 0.2642 -0.06294 -0.33762 -0.45443 -0.14469 1 0.10293 -0.05073URDS 0.1347 0.5131 0.0517 0.022 0.5917 0.0031 <.0001 0.2155 0.3795 0.6656
STUDENTS 0.01791 0.01219 -0.35449 0.37973 -0.00904 -0.27058 0.18589 -0.11838 0.10293 1 -0.02629STUDENTS 0.8788 0.9173 0.0018 0.0008 0.9386 0.0189 0.1103 0.3118 0.3795 0.8228
NUMSPEC 0.43423 0.82267 0.02744 -0.01991 -0.02336 -0.09644 0.06169 0.1347 -0.05073 -0.02629 1NUMSPEC <.0001 <.0001 0.8152 0.8654 0.8423 0.4105 0.599 0.2492 0.6656 0.8228
98

PCFASS WKSPATTD WKSPPRV SHD FNC WSRC PST FRT REGSUM WGHTSUM NUMSPEC
PCFASS 0.01224 0.21286 0.13614 -0.11398 -0.07731 -0.09274 0.02897 0.0541 0.05433 -0.17146 0.28458PCFASS 0.917 0.0667 0.2442 0.3302 0.5097 0.4287 0.8051 0.6448 0.6434 0.1413 0.0133
WKSPATTD 0.04362 0.10434 0.14853 -0.10301 -0.13849 0.22192 0.4846 -0.31841 -0.64499 0.09624 0.00412WKSPATTD 0.7102 0.373 0.2035 0.3792 0.236 0.0557 <.0001 0.0054 <.0001 0.4114 0.972
WKSPPRV 0.12633 0.077 0.15685 -0.19597 0.0749 0.40178 0.54079 -0.41482 -0.84031 -0.0298 -0.02715WKSPPRV 0.2801 0.5114 0.179 0.092 0.5231 0.0004 <.0001 0.0002 <.0001 0.7997 0.8172
SHD 0.09614 0.09827 -0.0214 0.11111 -0.2242 0.05832 -0.00192 -0.01892 -0.02987 0.09449 0.10062SHD 0.4119 0.4016 0.8554 0.3426 0.0531 0.6192 0.987 0.872 0.7992 0.42 0.3904
FNC 0.36406 0.17352 -0.1558 0.11925 0.11686 -0.07551 0.08326 0.11062 -0.11487 0.29146 0.28824FNC 0.0013 0.1365 0.182 0.3082 0.3181 0.5197 0.4776 0.3447 0.3264 0.0112 0.0121
WSRC 0.23651 0.15534 0.117 -0.10864 -0.03936 -0.04357 0.02139 0.13574 -0.04852 -0.01476 0.27262WSRC 0.0411 0.1833 0.3175 0.3535 0.7374 0.7105 0.8554 0.2456 0.6793 0.9 0.018
PST 0.38789 0.20073 0.0361 -0.09144 0.13475 -0.05764 0.09708 0.09366 -0.14509 0.04862 0.29847PST 0.0006 0.0842 0.7585 0.4353 0.249 0.6233 0.4073 0.4241 0.2142 0.6787 0.0093
FRT 0.11891 0.09348 0.00809 0.07298 -0.20686 0.21138 -0.2257 0.15019 0.00597 0.04664 0.18123FRT 0.3096 0.425 0.9451 0.5338 0.075 0.0687 0.0515 0.1984 0.9595 0.6911 0.1197
REGSUM 0.4181 0.25278 -0.00991 0.04206 -0.08001 0.01363 0.01242 0.15328 -0.1169 0.17314 0.39521REGSUM 0.0002 0.0287 0.9328 0.7201 0.495 0.9076 0.9158 0.1892 0.3179 0.1374 0.0004
WGHTSUM 0.41717 0.24535 -0.04602 0.0689 -0.05087 -0.01865 0.04225 0.14239 -0.11877 0.21605 0.38477WGHTSUM 0.0002 0.0339 0.695 0.557 0.6647 0.8738 0.7189 0.223 0.3102 0.0627 0.0007
99
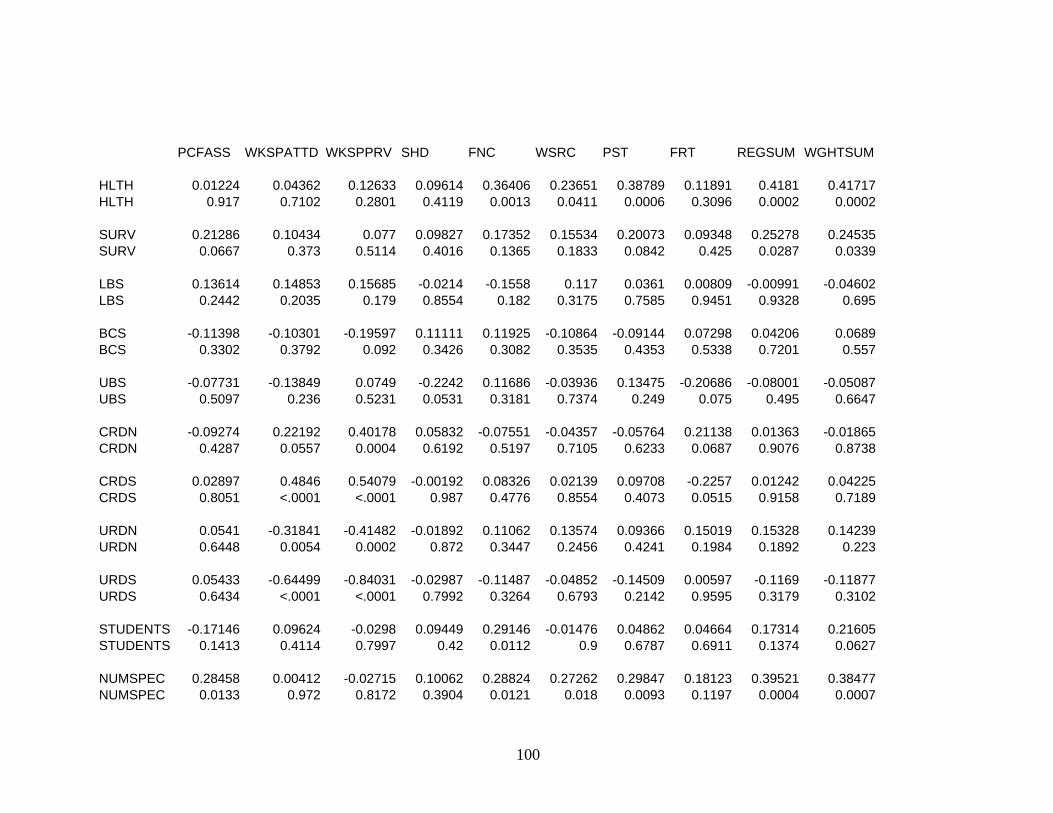
PCFASS WKSPATTD WKSPPRV SHD FNC WSRC PST FRT REGSUM WGHTSUM
HLTH 0.01224 0.04362 0.12633 0.09614 0.36406 0.23651 0.38789 0.11891 0.4181 0.41717HLTH 0.917 0.7102 0.2801 0.4119 0.0013 0.0411 0.0006 0.3096 0.0002 0.0002
SURV 0.21286 0.10434 0.077 0.09827 0.17352 0.15534 0.20073 0.09348 0.25278 0.24535SURV 0.0667 0.373 0.5114 0.4016 0.1365 0.1833 0.0842 0.425 0.0287 0.0339
LBS 0.13614 0.14853 0.15685 -0.0214 -0.1558 0.117 0.0361 0.00809 -0.00991 -0.04602LBS 0.2442 0.2035 0.179 0.8554 0.182 0.3175 0.7585 0.9451 0.9328 0.695
BCS -0.11398 -0.10301 -0.19597 0.11111 0.11925 -0.10864 -0.09144 0.07298 0.04206 0.0689BCS 0.3302 0.3792 0.092 0.3426 0.3082 0.3535 0.4353 0.5338 0.7201 0.557
UBS -0.07731 -0.13849 0.0749 -0.2242 0.11686 -0.03936 0.13475 -0.20686 -0.08001 -0.05087UBS 0.5097 0.236 0.5231 0.0531 0.3181 0.7374 0.249 0.075 0.495 0.6647
CRDN -0.09274 0.22192 0.40178 0.05832 -0.07551 -0.04357 -0.05764 0.21138 0.01363 -0.01865CRDN 0.4287 0.0557 0.0004 0.6192 0.5197 0.7105 0.6233 0.0687 0.9076 0.8738
CRDS 0.02897 0.4846 0.54079 -0.00192 0.08326 0.02139 0.09708 -0.2257 0.01242 0.04225CRDS 0.8051 <.0001 <.0001 0.987 0.4776 0.8554 0.4073 0.0515 0.9158 0.7189
URDN 0.0541 -0.31841 -0.41482 -0.01892 0.11062 0.13574 0.09366 0.15019 0.15328 0.14239URDN 0.6448 0.0054 0.0002 0.872 0.3447 0.2456 0.4241 0.1984 0.1892 0.223
URDS 0.05433 -0.64499 -0.84031 -0.02987 -0.11487 -0.04852 -0.14509 0.00597 -0.1169 -0.11877URDS 0.6434 <.0001 <.0001 0.7992 0.3264 0.6793 0.2142 0.9595 0.3179 0.3102
STUDENTS -0.17146 0.09624 -0.0298 0.09449 0.29146 -0.01476 0.04862 0.04664 0.17314 0.21605STUDENTS 0.1413 0.4114 0.7997 0.42 0.0112 0.9 0.6787 0.6911 0.1374 0.0627
NUMSPEC 0.28458 0.00412 -0.02715 0.10062 0.28824 0.27262 0.29847 0.18123 0.39521 0.38477NUMSPEC 0.0133 0.972 0.8172 0.3904 0.0121 0.018 0.0093 0.1197 0.0004 0.0007
100
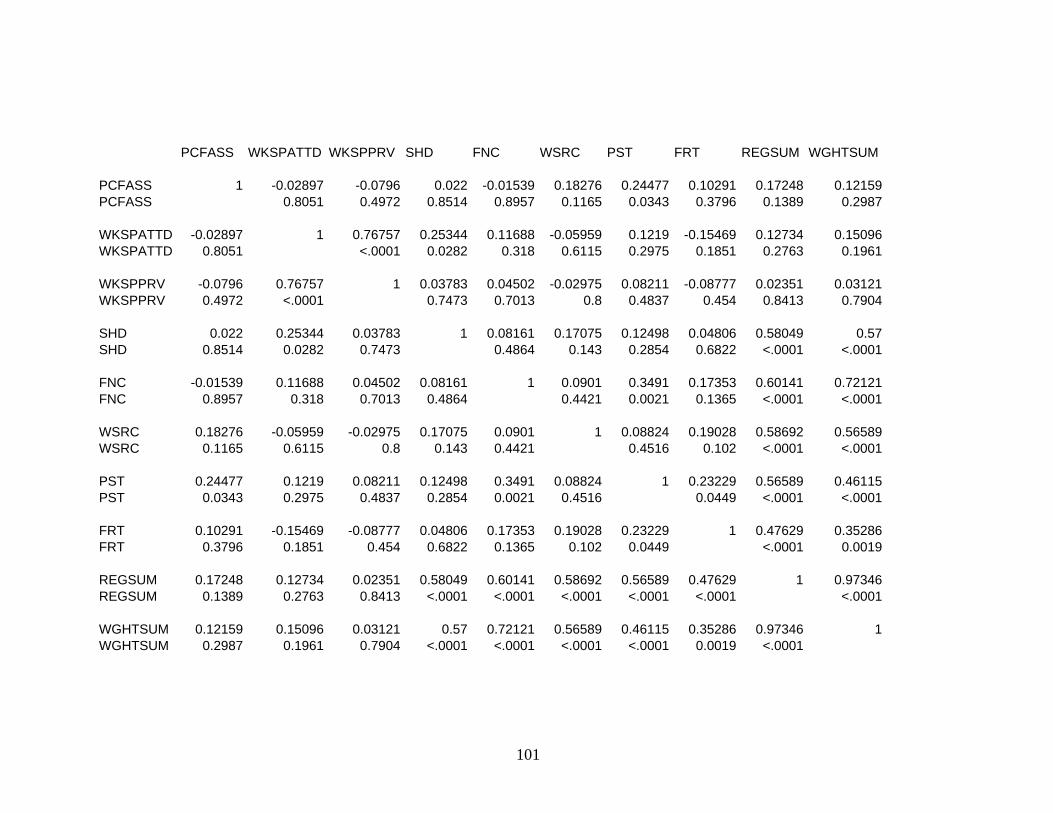
PCFASS WKSPATTD WKSPPRV SHD FNC WSRC PST FRT REGSUM WGHTSUM
PCFASS 1 -0.02897 -0.0796 0.022 -0.01539 0.18276 0.24477 0.10291 0.17248 0.12159PCFASS 0.8051 0.4972 0.8514 0.8957 0.1165 0.0343 0.3796 0.1389 0.2987
WKSPATTD -0.02897 1 0.76757 0.25344 0.11688 -0.05959 0.1219 -0.15469 0.12734 0.15096WKSPATTD 0.8051 <.0001 0.0282 0.318 0.6115 0.2975 0.1851 0.2763 0.1961
WKSPPRV -0.0796 0.76757 1 0.03783 0.04502 -0.02975 0.08211 -0.08777 0.02351 0.03121WKSPPRV 0.4972 <.0001 0.7473 0.7013 0.8 0.4837 0.454 0.8413 0.7904
SHD 0.022 0.25344 0.03783 1 0.08161 0.17075 0.12498 0.04806 0.58049 0.57SHD 0.8514 0.0282 0.7473 0.4864 0.143 0.2854 0.6822 <.0001 <.0001
FNC -0.01539 0.11688 0.04502 0.08161 1 0.0901 0.3491 0.17353 0.60141 0.72121FNC 0.8957 0.318 0.7013 0.4864 0.4421 0.0021 0.1365 <.0001 <.0001
WSRC 0.18276 -0.05959 -0.02975 0.17075 0.0901 1 0.08824 0.19028 0.58692 0.56589WSRC 0.1165 0.6115 0.8 0.143 0.4421 0.4516 0.102 <.0001 <.0001
PST 0.24477 0.1219 0.08211 0.12498 0.3491 0.08824 1 0.23229 0.56589 0.46115PST 0.0343 0.2975 0.4837 0.2854 0.0021 0.4516 0.0449 <.0001 <.0001
FRT 0.10291 -0.15469 -0.08777 0.04806 0.17353 0.19028 0.23229 1 0.47629 0.35286FRT 0.3796 0.1851 0.454 0.6822 0.1365 0.102 0.0449 <.0001 0.0019
REGSUM 0.17248 0.12734 0.02351 0.58049 0.60141 0.58692 0.56589 0.47629 1 0.97346REGSUM 0.1389 0.2763 0.8413 <.0001 <.0001 <.0001 <.0001 <.0001 <.0001
WGHTSUM 0.12159 0.15096 0.03121 0.57 0.72121 0.56589 0.46115 0.35286 0.97346 1WGHTSUM 0.2987 0.1961 0.7904 <.0001 <.0001 <.0001 <.0001 0.0019 <.0001
101