Embed Size (px)
Citation preview
Global Car Rental Market to 2018 Page 1
© Travel & Tourism Intelligence Center. This product is licensed and is not to be photocopied Published: December 2014
The Global Car Rental Market
To 2018
Report Code: TT0203MR
Publication Date: December 2014
www.tourism-ic.com
John Carpenter House
7 Carmelite Street
London
EC4Y 0BS
United Kingdom
Tel: +44 (0)20 7936 6400
Fax: +44 (0)20 7336 6813
SUMMARY
Global Car Rental Market to 2018 Page 2
© Travel & Tourism Intelligence Center. This product is licensed and is not to be photocopied Published: December 2014
1 SUMMARY
According to the Travel &Tourism intelligence center (TTIC) analysis based on 40 countries around
the world, the US was the leader in the car rental market in terms of both market value and fleet size.
The US recorded US$XX.XX billion market value in 2013, which is more than six times that of its
competitor, Japan, which recorded US$ XX.XX billion market value in 2013.
The Eurozone crisis had a negative impact on the Travel and Tourism sector in European countries.
However, car rental KPIs showed resilience in many countries (with the exception of Italy and Spain)
with overall growth recorded in KPIs during the historic period. The hosting of international events
such as Olympic Games in London in 2012 and Winter Olympic Games in Russia in 2014 have
partially supported the growth.
Challenging economic conditions and fierce competition have resulted in a large number of deals
recorded in the global car rental market during the historic period as a means for operators to improve
profitability and remain competitive. Some of the biggest deals in the car rental market were recorded
in the US such as the acquisition of Dollar Thrifty Automotive Group by Hertz. Several leading car
rental operators from North American and Europeans market are trying to expand their business in
Asia–Pacific, Africa, and South and Central America by entering into joint ventures and partnerships to
develop new hotels and benefit from the growing demand for car rental in these emerging markets.
2 SYNOPSIS
The report provides detailed market analysis, information and insights, including:
Historic and forecast revenue of the global car rental market, covering 40 countries
Detailed analysis, region-wise (Americas, Asia-Pacific, Europe, Middle East & Africa),of car
rental companies' key performance indicators such as market value by business travelers,
market value by leisure travelers, market value at airports, market value at non-airports, fleet
size, number of rental occasions, number of rental days, average rental length, utilization rate,
and average revenue per day for the historic and forecast periods
Brief analysis of the global car rental market and the present scenario
Detailed analysis of the market trends in key car rental markets
3 REASONS TO BUY
Make strategic business decisions using historic and forecast market data related to the global
car rental market
Understand the key market trends and growth opportunities in the global car rental market
Gain strategic insights on the leading global car rental companies
GLOBAL CAR RENTAL KPIS – THE AMERICAS
Global Car Rental Market to 2018 Page 3
© Travel & Tourism Intelligence Center. This product is licensed and is not to be photocopied Published: December 2014
4 GLOBAL CAR RENTAL KPIS – THE AMERICAS
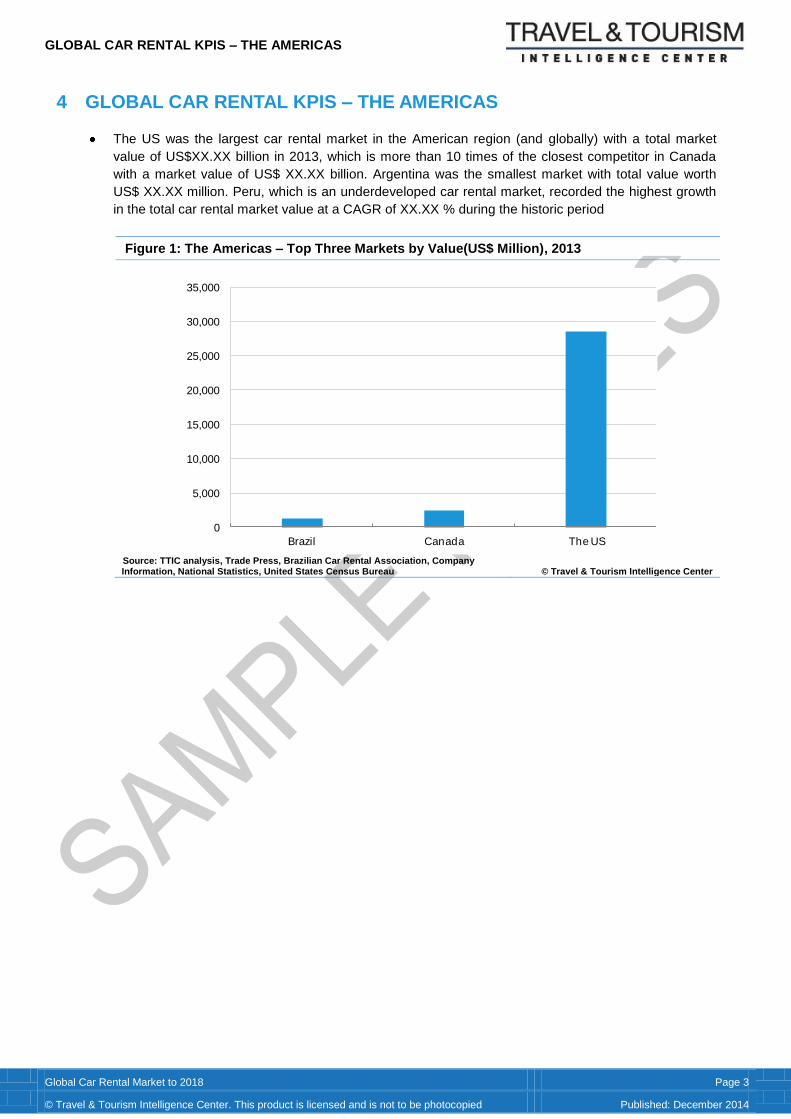
The US was the largest car rental market in the American region (and globally) with a total market
value of US$XX.XX billion in 2013, which is more than 10 times of the closest competitor in Canada
with a market value of US$ XX.XX billion. Argentina was the smallest market with total value worth
US$ XX.XX million. Peru, which is an underdeveloped car rental market, recorded the highest growth
in the total car rental market value at a CAGR of XX.XX % during the historic period
Figure 1: The Americas – Top Three Markets by Value(US$ Million), 2013
Source: TTIC analysis, Trade Press, Brazilian Car Rental Association, Company Information, National Statistics, United States Census Bureau © Travel & Tourism Intelligence Center
0
5,000
10,000
15,000
20,000
25,000
30,000
35,000
Brazil Canada The US
GLOBAL CAR RENTAL KPIS – THE AMERICAS
Global Car Rental Market to 2018 Page 4
© Travel & Tourism Intelligence Center. This product is licensed and is not to be photocopied Published: December 2014
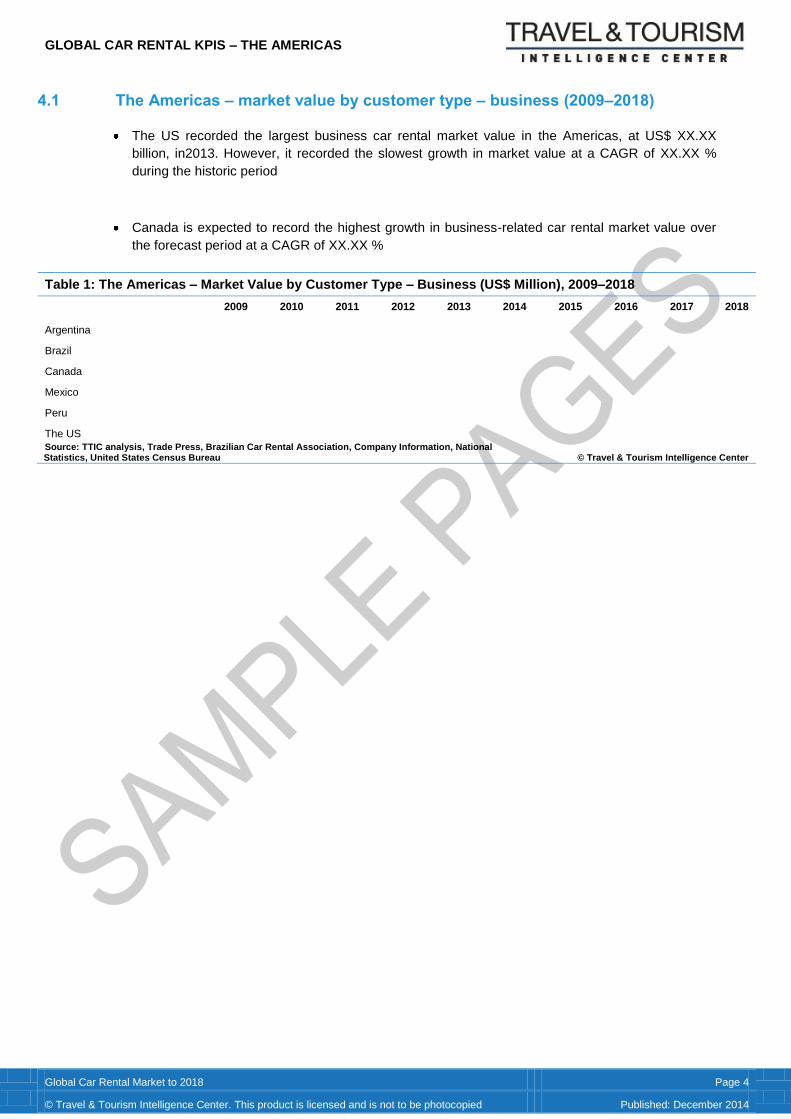
4.1 The Americas – market value by customer type – business (2009–2018)
The US recorded the largest business car rental market value in the Americas, at US$ XX.XX
billion, in2013. However, it recorded the slowest growth in market value at a CAGR of XX.XX %
during the historic period
Canada is expected to record the highest growth in business-related car rental market value over
the forecast period at a CAGR of XX.XX %
Table 1: The Americas – Market Value by Customer Type – Business (US$ Million), 2009–2018
2009 2010 2011 2012 2013 2014 2015 2016 2017 2018
Argentina
Brazil
Canada
Mexico
Peru
The US
Source: TTIC analysis, Trade Press, Brazilian Car Rental Association, Company Information, National Statistics, United States Census Bureau © Travel & Tourism Intelligence Center
GLOBAL CAR RENTAL KPIS – THE AMERICAS
Global Car Rental Market to 2018 Page 5
© Travel & Tourism Intelligence Center. This product is licensed and is not to be photocopied Published: December 2014
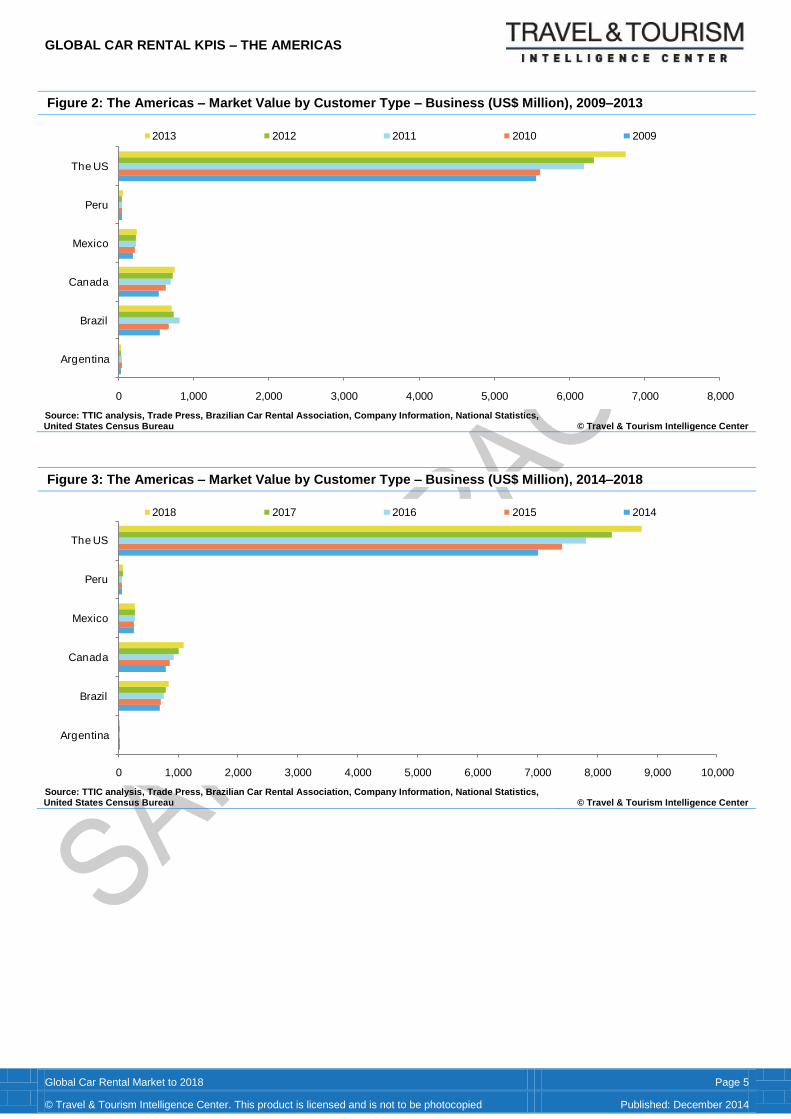
Figure 2: The Americas – Market Value by Customer Type – Business (US$ Million), 2009–2013
Source: TTIC analysis, Trade Press, Brazilian Car Rental Association, Company Information, National Statistics, United States Census Bureau © Travel & Tourism Intelligence Center
Figure 3: The Americas – Market Value by Customer Type – Business (US$ Million), 2014–2018
Source: TTIC analysis, Trade Press, Brazilian Car Rental Association, Company Information, National Statistics, United States Census Bureau © Travel & Tourism Intelligence Center
0 1,000 2,000 3,000 4,000 5,000 6,000 7,000 8,000
Argentina
Brazil
Canada
Mexico
Peru
The US
2013 2012 2011 2010 2009
0 1,000 2,000 3,000 4,000 5,000 6,000 7,000 8,000 9,000 10,000
Argentina
Brazil
Canada
Mexico
Peru
The US
2018 2017 2016 2015 2014
GLOBAL CAR RENTAL KPIS – THE AMERICAS
Global Car Rental Market to 2018 Page 6
© Travel & Tourism Intelligence Center. This product is licensed and is not to be photocopied Published: December 2014
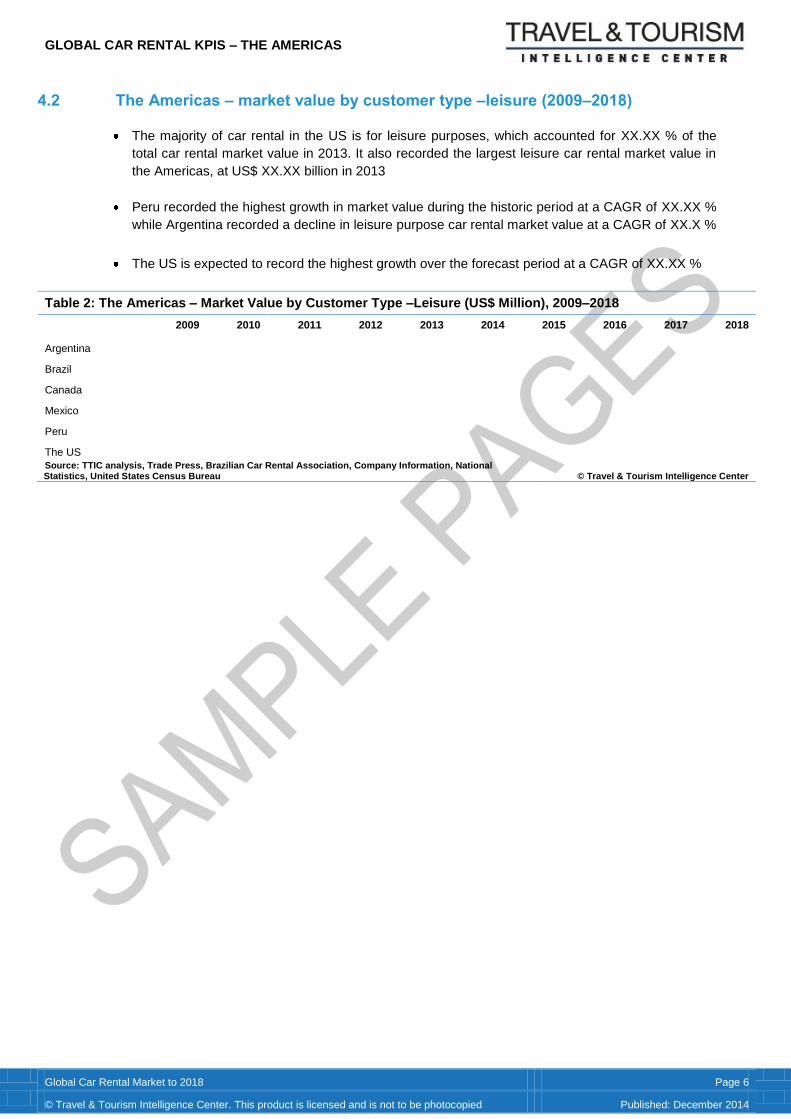
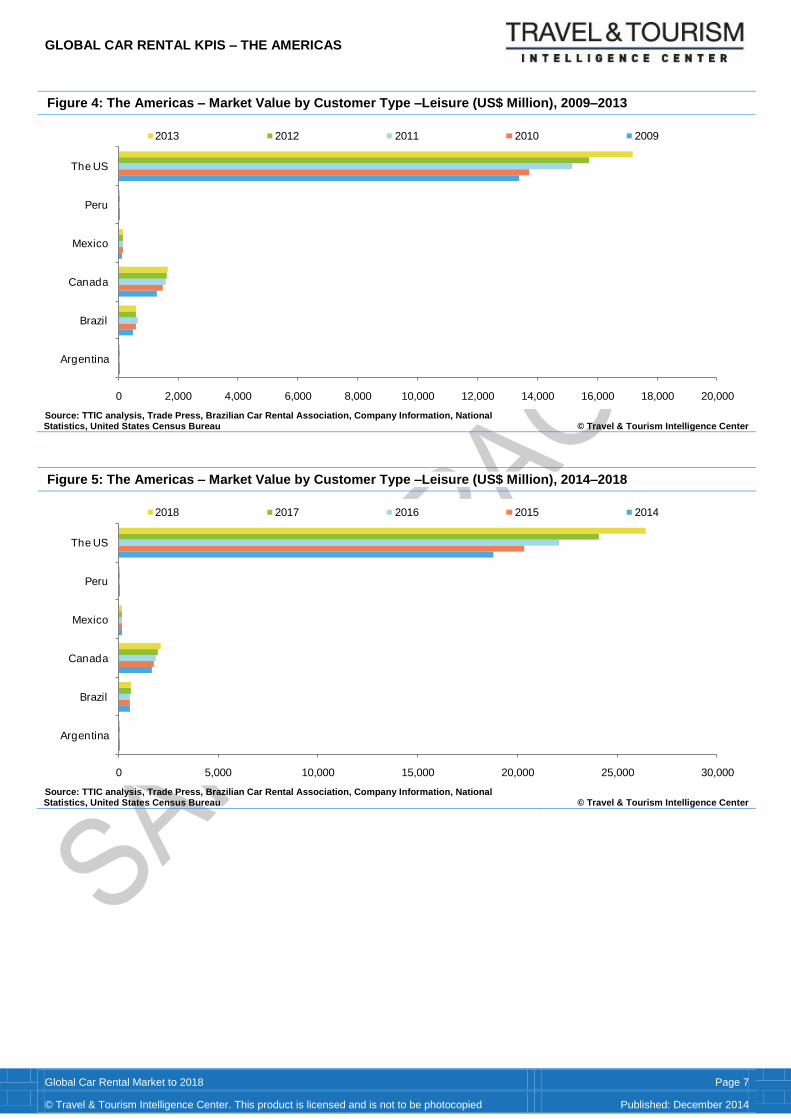
4.2 The Americas – market value by customer type –leisure (2009–2018)
The majority of car rental in the US is for leisure purposes, which accounted for XX.XX % of the
total car rental market value in 2013. It also recorded the largest leisure car rental market value in
the Americas, at US$ XX.XX billion in 2013
Peru recorded the highest growth in market value during the historic period at a CAGR of XX.XX %
while Argentina recorded a decline in leisure purpose car rental market value at a CAGR of XX.X %
The US is expected to record the highest growth over the forecast period at a CAGR of XX.XX %
Table 2: The Americas – Market Value by Customer Type –Leisure (US$ Million), 2009–2018
2009 2010 2011 2012 2013 2014 2015 2016 2017 2018
Argentina
Brazil
Canada
Mexico
Peru
The US
Source: TTIC analysis, Trade Press, Brazilian Car Rental Association, Company Information, National Statistics, United States Census Bureau © Travel & Tourism Intelligence Center
GLOBAL CAR RENTAL KPIS – THE AMERICAS
Global Car Rental Market to 2018 Page 7
© Travel & Tourism Intelligence Center. This product is licensed and is not to be photocopied Published: December 2014
Figure 4: The Americas – Market Value by Customer Type –Leisure (US$ Million), 2009–2013
Source: TTIC analysis, Trade Press, Brazilian Car Rental Association, Company Information, National Statistics, United States Census Bureau © Travel & Tourism Intelligence Center
Figure 5: The Americas – Market Value by Customer Type –Leisure (US$ Million), 2014–2018
Source: TTIC analysis, Trade Press, Brazilian Car Rental Association, Company Information, National Statistics, United States Census Bureau © Travel & Tourism Intelligence Center
0 2,000 4,000 6,000 8,000 10,000 12,000 14,000 16,000 18,000 20,000
Argentina
Brazil
Canada
Mexico
Peru
The US
2013 2012 2011 2010 2009
0 5,000 10,000 15,000 20,000 25,000 30,000
Argentina
Brazil
Canada
Mexico
Peru
The US
2018 2017 2016 2015 2014
GLOBAL CAR RENTAL KPIS – THE AMERICAS
Global Car Rental Market to 2018 Page 8
© Travel & Tourism Intelligence Center. This product is licensed and is not to be photocopied Published: December 2014
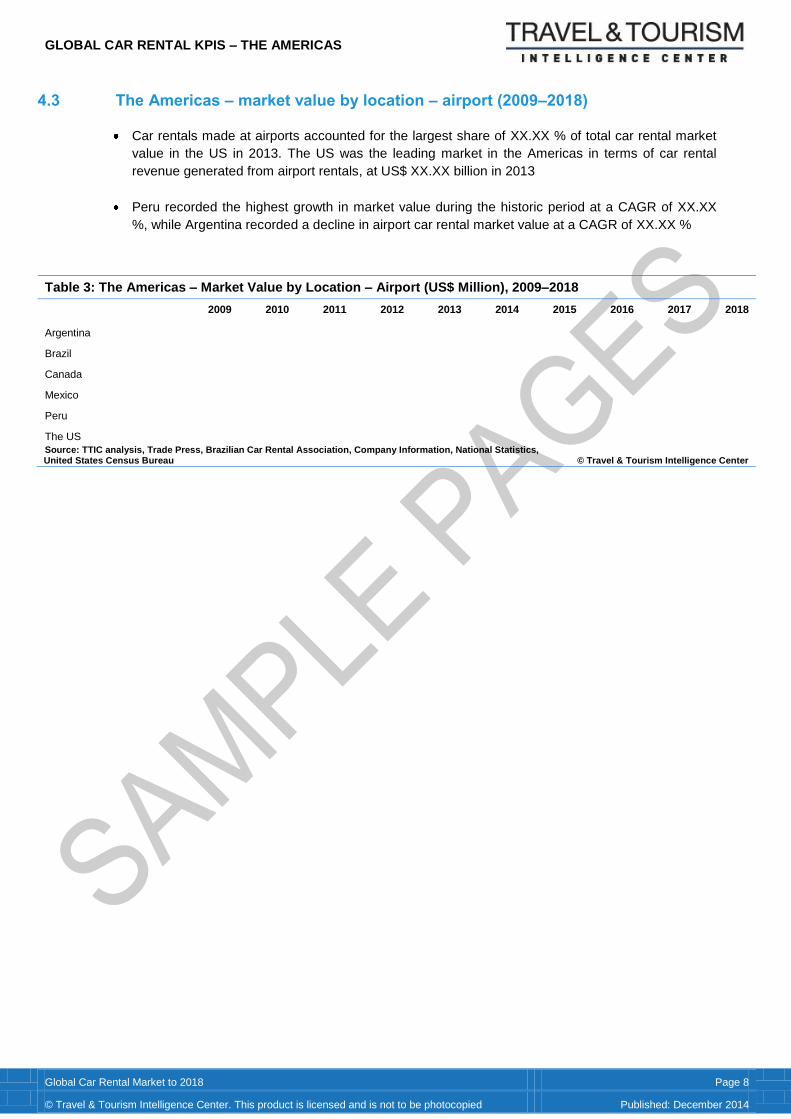
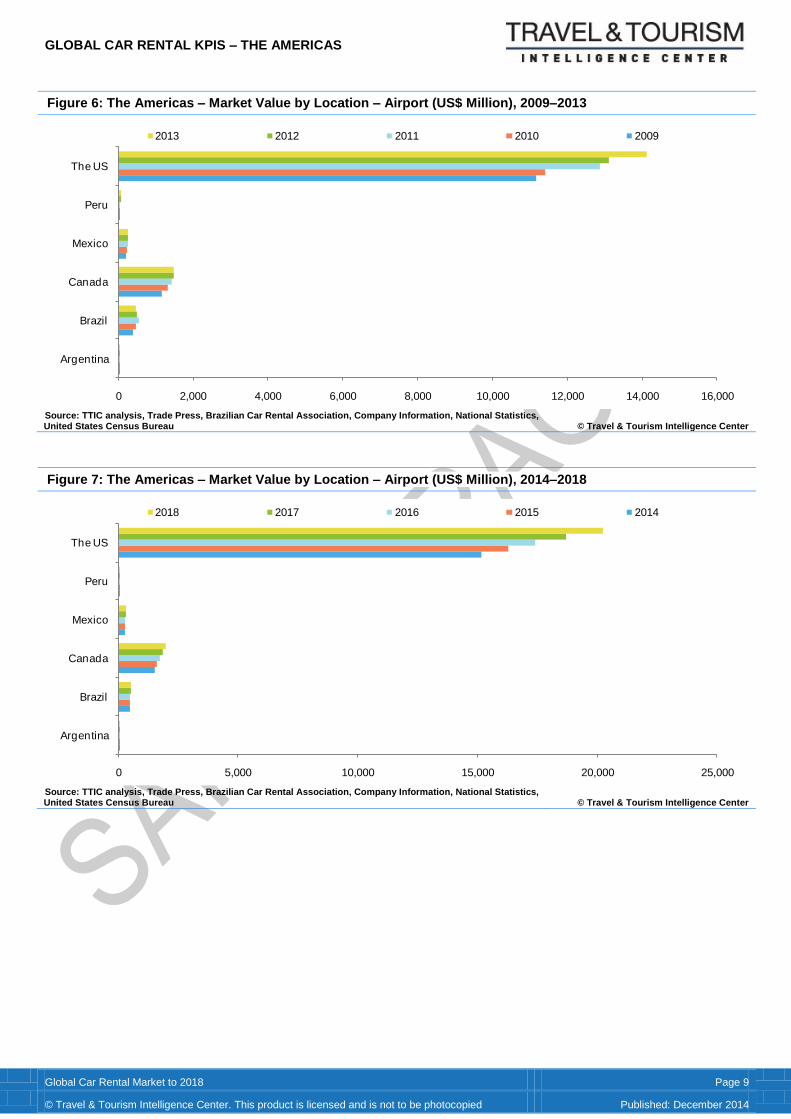
4.3 The Americas – market value by location – airport (2009–2018)
Car rentals made at airports accounted for the largest share of XX.XX % of total car rental market
value in the US in 2013. The US was the leading market in the Americas in terms of car rental
revenue generated from airport rentals, at US$ XX.XX billion in 2013
Peru recorded the highest growth in market value during the historic period at a CAGR of XX.XX
%, while Argentina recorded a decline in airport car rental market value at a CAGR of XX.XX %
Table 3: The Americas – Market Value by Location – Airport (US$ Million), 2009–2018
2009 2010 2011 2012 2013 2014 2015 2016 2017 2018
Argentina
Brazil
Canada
Mexico
Peru
The US
Source: TTIC analysis, Trade Press, Brazilian Car Rental Association, Company Information, National Statistics, United States Census Bureau © Travel & Tourism Intelligence Center
GLOBAL CAR RENTAL KPIS – THE AMERICAS
Global Car Rental Market to 2018 Page 9
© Travel & Tourism Intelligence Center. This product is licensed and is not to be photocopied Published: December 2014
Figure 6: The Americas – Market Value by Location – Airport (US$ Million), 2009–2013
Source: TTIC analysis, Trade Press, Brazilian Car Rental Association, Company Information, National Statistics, United States Census Bureau © Travel & Tourism Intelligence Center
Figure 7: The Americas – Market Value by Location – Airport (US$ Million), 2014–2018
Source: TTIC analysis, Trade Press, Brazilian Car Rental Association, Company Information, National Statistics, United States Census Bureau © Travel & Tourism Intelligence Center
0 2,000 4,000 6,000 8,000 10,000 12,000 14,000 16,000
Argentina
Brazil
Canada
Mexico
Peru
The US
2013 2012 2011 2010 2009
0 5,000 10,000 15,000 20,000 25,000
Argentina
Brazil
Canada
Mexico
Peru
The US
2018 2017 2016 2015 2014
GLOBAL CAR RENTAL KPIS – THE AMERICAS
Global Car Rental Market to 2018 Page 10
© Travel & Tourism Intelligence Center. This product is licensed and is not to be photocopied Published: December 2014
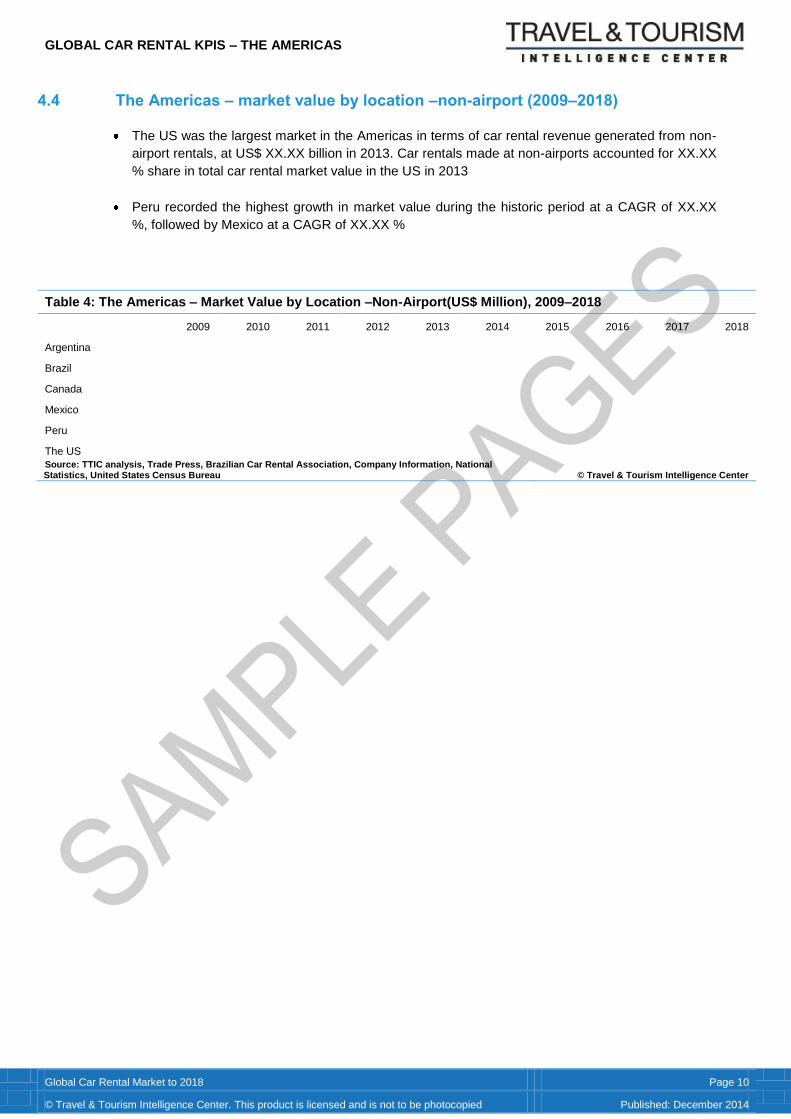
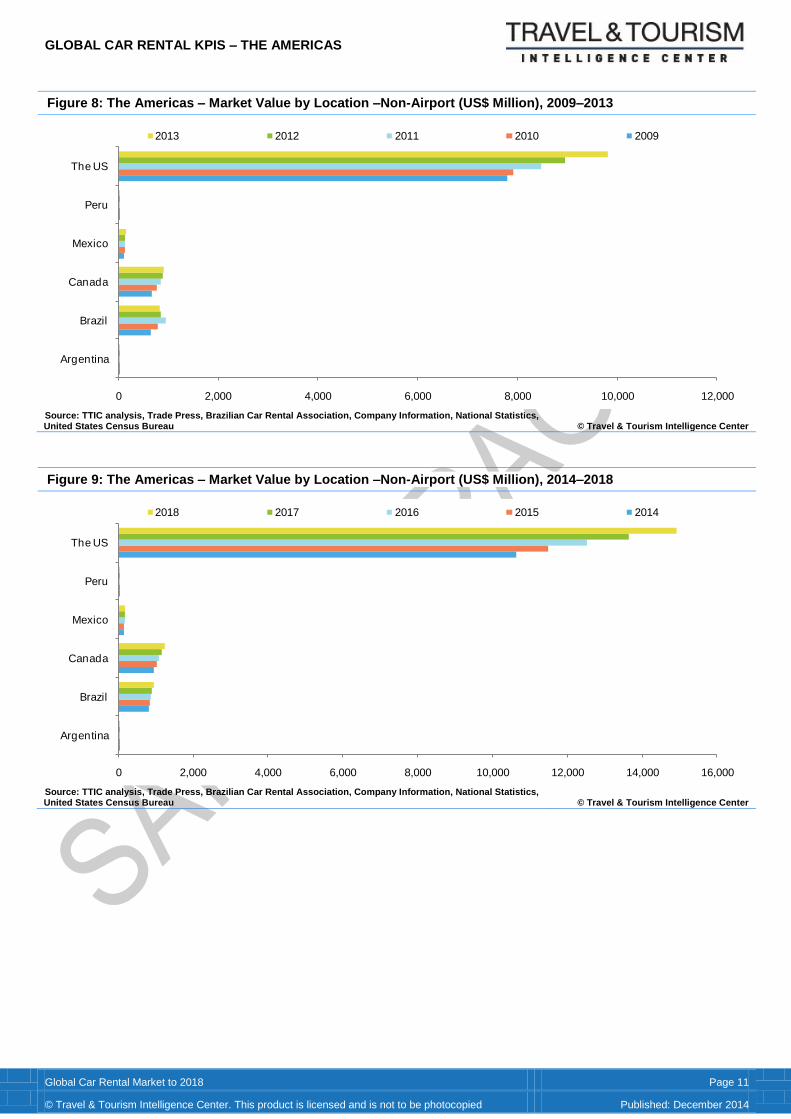
4.4 The Americas – market value by location –non-airport (2009–2018)
The US was the largest market in the Americas in terms of car rental revenue generated from non-
airport rentals, at US$ XX.XX billion in 2013. Car rentals made at non-airports accounted for XX.XX
% share in total car rental market value in the US in 2013
Peru recorded the highest growth in market value during the historic period at a CAGR of XX.XX
%, followed by Mexico at a CAGR of XX.XX %
Table 4: The Americas – Market Value by Location –Non-Airport(US$ Million), 2009–2018
2009 2010 2011 2012 2013 2014 2015 2016 2017 2018
Argentina
Brazil
Canada
Mexico
Peru
The US
Source: TTIC analysis, Trade Press, Brazilian Car Rental Association, Company Information, National Statistics, United States Census Bureau © Travel & Tourism Intelligence Center
GLOBAL CAR RENTAL KPIS – THE AMERICAS
Global Car Rental Market to 2018 Page 11
© Travel & Tourism Intelligence Center. This product is licensed and is not to be photocopied Published: December 2014
Figure 8: The Americas – Market Value by Location –Non-Airport (US$ Million), 2009–2013
Source: TTIC analysis, Trade Press, Brazilian Car Rental Association, Company Information, National Statistics, United States Census Bureau © Travel & Tourism Intelligence Center
Figure 9: The Americas – Market Value by Location –Non-Airport (US$ Million), 2014–2018
Source: TTIC analysis, Trade Press, Brazilian Car Rental Association, Company Information, National Statistics, United States Census Bureau © Travel & Tourism Intelligence Center
0 2,000 4,000 6,000 8,000 10,000 12,000
Argentina
Brazil
Canada
Mexico
Peru
The US
2013 2012 2011 2010 2009
0 2,000 4,000 6,000 8,000 10,000 12,000 14,000 16,000
Argentina
Brazil
Canada
Mexico
Peru
The US
2018 2017 2016 2015 2014
GLOBAL CAR RENTAL KPIS – THE AMERICAS
Global Car Rental Market to 2018 Page 12
© Travel & Tourism Intelligence Center. This product is licensed and is not to be photocopied Published: December 2014
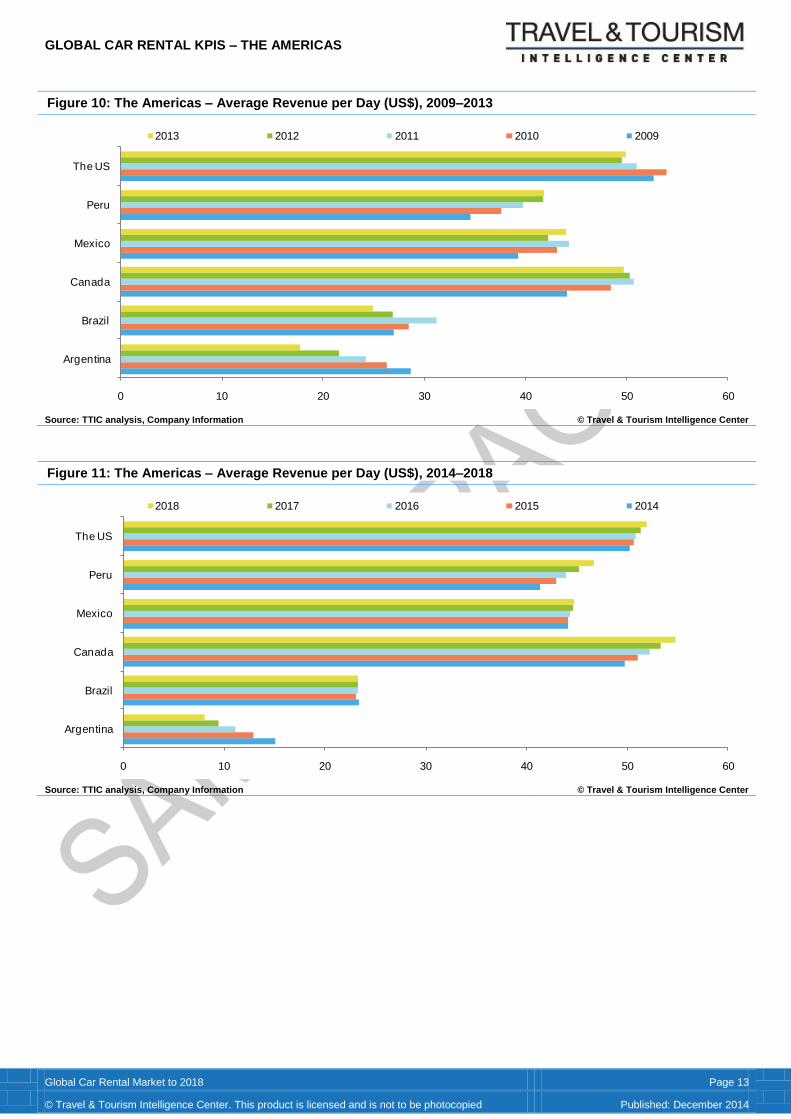
4.5 The Americas –average revenue per day (2009–2018)
The US was the market leader in terms of average revenue per day at US$ XX.XX
Canada is expected to emerge as the market leader by 2018 with average revenue per day of US$
XX.XX
Table 5: The Americas – Average Revenue per Day (US$), 2009–2018
2009 2010 2011 2012 2013 2014 2015 2016 2017 2018
Argentina
Brazil
Canada
Mexico
Peru
The US
Source: TTIC analysis, Company Information © Travel & Tourism Intelligence Center
GLOBAL CAR RENTAL KPIS – THE AMERICAS
Global Car Rental Market to 2018 Page 13
© Travel & Tourism Intelligence Center. This product is licensed and is not to be photocopied Published: December 2014
Figure 10: The Americas – Average Revenue per Day (US$), 2009–2013
Source: TTIC analysis, Company Information © Travel & Tourism Intelligence Center
Figure 11: The Americas – Average Revenue per Day (US$), 2014–2018
Source: TTIC analysis, Company Information © Travel & Tourism Intelligence Center
0 10 20 30 40 50 60
Argentina
Brazil
Canada
Mexico
Peru
The US
2013 2012 2011 2010 2009
0 10 20 30 40 50 60
Argentina
Brazil
Canada
Mexico
Peru
The US
2018 2017 2016 2015 2014
METHODOLOGY
Global Car Rental Market to 2018 Page 14
© Travel & Tourism Intelligence Center. This product is licensed and is not to be photocopied Published: December 2014
5 METHODOLOGY
TTIC’s dedicated research and analysis teams consist of experienced professionals with industry
backgrounds in marketing, market research, consulting, and advanced statistical expertise.
TTIC adheres to the Codes of Practice of the Market Research Society (www.mrs.org.uk) and the
Society of Competitive Intelligence Professionals (www.scip.org).
All TTIC databases are continuously updated and revised.
All Travel and Tourism reports are created by following a comprehensive, four-stage methodology.
This includes market study, research, analysis, and quality control.
1) Market Study
A. Standardization
Definitions are specified using recognized industry classifications. The same definition is used for
every country. Annual average currency exchange rates are used for the latest completed year. These
are then applied across both historical and forecast data to remove exchange rate fluctuations.
B. Internal Audit
Review of in-house databases to gather existing data:
o Historic market databases and reports
o Company database
C. Trend monitoring
Review of the latest Travel and Tourism companies, and industry trends
2) Research
A. Sources
Collection of the latest market-specific data from a wide variety of industry sources:
o Government statistics
o Industry associations
o Company filings
o International organizations
o Travel and tourism agencies
B. Expert opinion
Collation of opinions taken from leading Travel and Tourism industry experts
Analysis of third-party opinion and forecasts:
o Broker reports
o Media
o Official government sources
C. Data consolidation and verification
Consolidation of data and opinions to create historical datasets
Creation of models to benchmark data across categories and geographies
METHODOLOGY
Global Car Rental Market to 2018 Page 15
© Travel & Tourism Intelligence Center. This product is licensed and is not to be photocopied Published: December 2014
3) Analysis
A. Market forecasts
Feeding forecast data in to market models:
o Macroeconomic indicators
o Industry-specific drivers
Analysis of Travel and Tourism industry database to identify trends:
o Latest Travel and Tourism trends
o Key drivers of the Travel and Tourism industry
B. Report writing
Analysis of market data
Discussion of company and industry trends and issues
Review of financial deals, and Travel and Tourism trends
4) Quality Control
A. Templates
Detailed process manuals
Standardized report templates and accompanying style guides
Complex forecasting tools to ensure that forecast methodologies are applied consistently
Quality-control checklists
B. Quality control process
Peer review
Senior-level QC
Random spot checks on data integrity
Benchmark checks across databases
Market data cross-checked for consistency with accumulated data from:
o Company filings
o Government sources
RELATED REPORTS
Global Car Rental Market to 2018 Page 16
© Travel & Tourism Intelligence Center. This product is licensed and is not to be photocopied Published: December 2014
RELATED REPORTS
The Global Budget Hotels Market to 2018
The Global Luxury Hotels Market to 2018
The Global Low-Cost Airline Market to 2018
The Global Full-Service Airline Market to 2018
Travel and Tourism in the US to 2018
Travel and Tourism in France to 2018
Travel and Tourism in Spain to 2018
Travel and Tourism in Italy to 2018
Travel and Tourism in Brazil to 2018
Travel and Tourism in Kenya to 2018
Travel and Tourism in Qatar to 2018
Travel and Tourism in Singapore to 2018
Travel and Tourism in Ecuador to 2018
Travel and Tourism in India to 2018
Travel and Tourism in Malaysia to 2018
TABLE OF CONTENTS
Global Car Rental Market to 2018 Page 17
© Travel & Tourism Intelligence Center. This product is licensed and is not to be photocopied Published: December 2014
TABLE OF CONTENTS
1 Global Car Rental Market – Key Trends and Issues .............................................................................. 9
2 Global Car RentalMarket – Deals .......................................................................................................... 11
3 Global Car Rental KPIs – the Americas ................................................................................................ 13
3.1 The Americas – market value by customer type – business (2009–2018) ................................................................................... 15
3.2 The Americas – market value by customer type – leisure (2009–2018)....................................................................................... 17
3.3 The Americas – market value by location – airport (2009–2018) ................................................................................................. 19
3.4 The Americas – market value by location – non-airport (2009–2018) .......................................................................................... 21
3.5 The Americas – fleet size (2009–2018) ........................................................................................................................................ 23
3.6 The Americas – number of rental occasions (2009–2018) ........................................................................................................... 25
3.7 The Americas – number of rental days (2009–2018) ................................................................................................................... 27
3.8 The Americas – average rental length (2009–2018) .................................................................................................................... 29
3.9 The Americas – utilization rate (2009–2018) ................................................................................................................................ 31
3.10 The Americas –average revenue per day (2009–2018) ............................................................................................................... 33
4 Global Car Rental KPIs – Asia-Pacific .................................................................................................. 35
4.1 Asia-Pacific – market value by customer type – business (2009–2018) ...................................................................................... 37
4.2 Asia-Pacific – market value by customer type – leisure (2009–2018) .......................................................................................... 39
4.3 Asia-Pacific – market value by location – airport (2009–2018) .................................................................................................... 41
4.4 Asia-Pacific – market value by location – non-airport (2009–2018) ............................................................................................. 43
4.5 Asia-Pacific – fleet size (2009–2018) ........................................................................................................................................... 45
4.6 Asia-Pacific – number of rental occasions (2009–2018) .............................................................................................................. 46
4.7 Asia-Pacific – number of rental days (2009–2018) ...................................................................................................................... 48
4.8 Asia-Pacific –average rental length (2009–2018) ........................................................................................................................ 50
4.9 Asia-Pacific – utilization rate (2009–2018) ................................................................................................................................... 52
4.10 Asia-Pacific –average revenue per day (2009–2018) .................................................................................................................. 54
5 Global Car Rental KPIs – Europe .......................................................................................................... 57
5.1 Europe – market value by customer type – business (2009–2018) ............................................................................................. 59
5.2 Europe – market value by customer type – leisure (2009–2018) ................................................................................................. 60
5.3 Europe – market value by location – airport (2009–2018) ............................................................................................................ 62
5.4 Europe – market value by location –non-airport (2009–2018) ..................................................................................................... 64
5.5 Europe – fleet size (2009–2018) .................................................................................................................................................. 67
5.6 Europe – number of rental occasions (2009–2018) ..................................................................................................................... 68
5.7 Europe – number of rental days (2009–2018) .............................................................................................................................. 71
5.8 Europe –average rental length (2009–2018) ................................................................................................................................ 73
5.9 Europe – utilization rate (2009–2018) .......................................................................................................................................... 75
5.10 Europe – average revenue per day (2009–2018) ........................................................................................................................ 76
6 Global Car Rental KPIs – the Middle East and Africa .......................................................................... 79
6.1 The Middle East and Africa – market value by customer type – business (2009–2018) .............................................................. 81
6.2 The Middle East and Africa – market value by customer type – leisure (2009–2018) .................................................................. 83
6.3 The Middle East and Africa – market value by location – airport (2009–2018) ............................................................................ 85
6.4 The Middle East and Africa – market value by location –non-airport (2009–2018) ...................................................................... 87
6.5 The Middle East and Africa – fleet size (2009–2018) ................................................................................................................... 89
6.6 The Middle East and Africa – number of rental occasions (2009–2018) ...................................................................................... 91
6.7 The Middle East and Africa – number of rental days (2009–2018) .............................................................................................. 93
6.8 The Middle East and Africa – average rental length (2009–2018) ............................................................................................... 95
6.9 The Middle East and Africa – utilization rate (2009–2018) ........................................................................................................... 97
6.10 The Middle East and Africa – average revenue per day (2009–2018) ......................................................................................... 99
TABLE OF CONTENTS
Global Car Rental Market to 2018 Page 18
© Travel & Tourism Intelligence Center. This product is licensed and is not to be photocopied Published: December 2014
7 Global Car Rental Profiles ................................................................................................................... 101
7.1 Company Profile: Enterprise Holdings, Inc. ................................................................................................................................ 101
7.1.1 Enterprise Holdings, Inc. – company overview ..................................................................................................................................... 101
7.1.2 Enterprise Holdings, Inc. – business description .................................................................................................................................. 101
7.1.3 Enterprise Holdings, Inc. – main services ............................................................................................................................................. 102
7.1.4 Enterprise Holdings, Inc. – history ........................................................................................................................................................ 102
7.1.5 Enterprise Holdings, Inc. – SWOT analysis .......................................................................................................................................... 105
7.1.6 Enterprise Holdings, Inc. – strengths .................................................................................................................................................... 105
7.1.7 Enterprise Holdings, Inc. – weaknesses ............................................................................................................................................... 106
7.1.8 Enterprise Holdings, Inc. – opportunities .............................................................................................................................................. 106
7.1.9 Enterprise Holdings, Inc. – threats ....................................................................................................................................................... 107
7.1.10 Enterprise Holdings, Inc. – key employees ........................................................................................................................................... 108
7.2 Company Profile: Hertz Global Holdings, Inc. ............................................................................................................................ 109
7.2.1 Hertz Global Holdings, Inc. – company overview .................................................................................................................................. 109
7.2.2 Hertz Global Holdings, Inc. – business description ............................................................................................................................... 109
7.2.3 Hertz Global Holdings, Inc. – main services ......................................................................................................................................... 110
7.2.4 Hertz Global Holdings, Inc. – history .................................................................................................................................................... 112
7.2.5 Hertz Global Holdings, Inc. – SWOT analysis ...................................................................................................................................... 115
7.2.6 Hertz Global Holdings, Inc. – strengths ................................................................................................................................................ 115
7.2.7 Hertz Global Holdings, Inc. – weaknesses ........................................................................................................................................... 117
7.2.8 Hertz Global Holdings, Inc. – opportunities ........................................................................................................................................... 118
7.2.9 Hertz Global Holdings, Inc. – threats .................................................................................................................................................... 118
7.2.10 Hertz Global Holdings, Inc. – key employees ....................................................................................................................................... 120
7.3 Company Profile: Avis Budget Group, Inc. ................................................................................................................................. 121
7.3.1 Avis Budget Group, Inc. – company overview ...................................................................................................................................... 121
7.3.2 Avis Budget Group, Inc. – business description.................................................................................................................................... 121
7.3.3 Avis Budget Group, Inc. – main services .............................................................................................................................................. 122
7.3.4 Avis Budget Group, Inc. – history ......................................................................................................................................................... 122
7.3.5 Avis Budget Group, Inc. – SWOT analysis ........................................................................................................................................... 126
7.3.6 Avis Budget Group, Inc. – strengths ..................................................................................................................................................... 126
7.3.7 Avis Budget Group, Inc. – weaknesses ................................................................................................................................................ 127
7.3.8 Avis Budget Group, Inc. – opportunities ............................................................................................................................................... 128
7.3.9 Avis Budget Group, Inc. – threats ......................................................................................................................................................... 129
7.3.10 Avis Budget Group, Inc. – key employees ............................................................................................................................................ 129
7.4 Company Profile: kt Kumho Rent-A-car ..................................................................................................................................... 130
7.4.1 kt Kumho Rent-A-car – company overview........................................................................................................................................... 130
7.4.2 kt Kumho Rent-A-car– main services ................................................................................................................................................... 130
7.4.3 kt Kumho Rent-A-car– key employees ................................................................................................................................................. 130
7.5 Company Profile: TOYOTA Rent-A-Car ..................................................................................................................................... 131
7.5.1 TOYOTA Rent-A-Car – company overview .......................................................................................................................................... 131
7.5.2 TOYOTA Rent-A-Car – main services .................................................................................................................................................. 131
7.6 Company Profile: Europcar International S.A.S.U ...................................................................................................................... 132
7.6.1 Europcar International S.A.S.U – company overview ........................................................................................................................... 132
7.6.2 Europcar International S.A.S.U – main services ................................................................................................................................... 132
7.6.3 Europcar International S.A.S.U – key employees ................................................................................................................................. 132
7.7 Company Profile: Sixt SE ........................................................................................................................................................... 133
7.7.1 Sixt SE – company overview ................................................................................................................................................................ 133
7.7.2 Sixt SE – business description ............................................................................................................................................................. 133
7.7.3 Sixt SE – main services ....................................................................................................................................................................... 135
7.7.4 Sixt SE – history................................................................................................................................................................................... 135
7.7.5 Sixt SE – SWOT analysis ..................................................................................................................................................................... 137
7.7.6 Sixt SE – strengths .............................................................................................................................................................................. 137
7.7.7 Sixt SE – weaknesses.......................................................................................................................................................................... 138
TABLE OF CONTENTS
Global Car Rental Market to 2018 Page 19
© Travel & Tourism Intelligence Center. This product is licensed and is not to be photocopied Published: December 2014
7.7.8 Sixt SE – opportunities ......................................................................................................................................................................... 138
7.7.9 Sixt SE – threats .................................................................................................................................................................................. 139
7.7.10 Sixt SE – key employees ..................................................................................................................................................................... 139
7.8 Company Profile: Localiza Rent-A-Car SA ................................................................................................................................. 140
7.8.1 Localiza Rent-A-Car SA – company overview ...................................................................................................................................... 140
7.8.2 Localiza Rent-A-Car SA – business description ................................................................................................................................... 140
7.8.3 Localiza Rent-A-Car SA – main services .............................................................................................................................................. 141
7.8.4 Localiza Rent-A-Car SA – history ......................................................................................................................................................... 141
7.8.5 Localiza Rent-A-Car SA – SWOT analysis ........................................................................................................................................... 142
7.8.6 Localiza Rent-A-Car SA – strengths ..................................................................................................................................................... 142
7.8.7 Localiza Rent-A-Car SA – weaknesses ................................................................................................................................................ 142
7.8.8 Localiza Rent-A-Car SA – opportunities ............................................................................................................................................... 143
7.8.9 Localiza Rent-A-Car SA – threats ........................................................................................................................................................ 143
7.8.10 Localiza Rent-A-Car SA – key employees ............................................................................................................................................ 144
7.9 Company Profile: China Auto Rental Ltd .................................................................................................................................... 145
7.9.1 China Auto Rental Ltd – company overview ......................................................................................................................................... 145
7.9.2 China Auto Rental Ltd – main services ................................................................................................................................................. 145
7.9.3 China Auto Rental Ltd – key employees ............................................................................................................................................... 145
7.10 Company Profile: Carzonrent India Pvt., Ltd .............................................................................................................................. 146
7.10.1 Carzonrent India Pvt., Ltd – company overview.................................................................................................................................... 146
7.10.2 Carzonrent India Pvt., Ltd– main services ............................................................................................................................................ 146
7.10.3 Carzonrent India Pvt., Ltd – key employees ......................................................................................................................................... 147
8 Appendix .............................................................................................................................................. 148
8.1 What is this Report About? ........................................................................................................................................................ 148
8.2 Definitions .................................................................................................................................................................................. 148
8.3 Methodology .............................................................................................................................................................................. 150
8.4 Contact Travel & Tourism Intelligence Center ............................................................................................................................ 152
8.5 About Travel & Tourism Intelligence Center ............................................................................................................................... 152
8.6 Travel & Tourism Intelligence Center Services .......................................................................................................................... 152
8.7 Disclaimer .................................................................................................................................................................................. 153
LIST OF TABLES
Global Car Rental Market to 2018 Page 20
© Travel & Tourism Intelligence Center. This product is licensed and is not to be photocopied Published: December 2014
LIST OF TABLES
Table 1: The Americas – Market Value by Customer Type – Business (US$ Million), 2009–2018 ................................................................................... 18 Table 2: The Americas – Market Value by Customer Type – Leisure (US$ Million), 2009–2018 ...................................................................................... 20 Table 3: The Americas – Market Value by Location – Airport (US$ Million), 2009–2018 ................................................................................................. 22 Table 4: The Americas – Market Value by Location –Non-Airport (US$ Million), 2009–2018 ........................................................................................... 24 Table 5: The Americas – Fleet Size (Thousand), 2009–2018 .......................................................................................................................................... 26 Table 6: The Americas – Number of Rental Occasions (Thousand), 2009–2018 ............................................................................................................. 28 Table 7: The Americas – Number of Rental Days (Million), 2009–2018 ........................................................................................................................... 30 Table 8: The Americas – Average Rental Length (Days), 2009–2018 ............................................................................................................................. 32 Table 9: The Americas – Utilization Rate (%), 2009–2018 .............................................................................................................................................. 34 Table 10: The Americas – Average Revenue per Day (US$), 2009–2018 ....................................................................................................................... 36 Table 11: Asia-Pacific – Market Value by Customer Type – Business (US$ Million), 2009–2018 .................................................................................... 40 Table 12: Asia-Pacific – Market Value by Customer Type – Leisure (US$ Million), 2009–2018 ....................................................................................... 42 Table 13: Asia-Pacific – Market Value by Location – Airport (US$ Million), 2009–2018 ................................................................................................... 44 Table 14: Asia-Pacific – Market Value by Location – Non-Airport (US$ Million), 2009–2018 ........................................................................................... 46 Table 15: Asia-Pacific – Fleet Size (Thousand), 2009–2018 ........................................................................................................................................... 48 Table 16: Asia-Pacific – Number of Rental Occasions (Thousand), 2009–2018 .............................................................................................................. 50 Table 17: Asia-Pacific – Number of Rental Days (Million), 2009–2018 ............................................................................................................................ 52 Table 18: Asia-Pacific – Average Rental Length (Days), 2009–2018............................................................................................................................... 54 Table 19: Asia-Pacific – Utilization Rate (%), 2009–2018 ................................................................................................................................................ 56 Table 20: Asia-Pacific – Average Revenue per Day (US$), 2009–2018 .......................................................................................................................... 58 Table 21: Europe – Market Value by Customer Type – Business (US$ Million), 2009–2018 ........................................................................................... 62 Table 22: Europe – Market Value by Customer Type –Leisure (US$ Million), 2009–2018 ............................................................................................... 64 Table 23: Europe – Market Value by Location – Airport (US$ Million), 2009–2018 .......................................................................................................... 66 Table 24: Europe – Market Value by Location –Non-Airport (US$ Million), 2009–2018 ................................................................................................... 68 Table 25: Europe – Fleet Size (Thousand), 2009–2018 .................................................................................................................................................. 70 Table 26: Europe – Number of Rental Occasions (Thousand), 2009–2018 ..................................................................................................................... 72 Table 27: Europe – Number of Rental Days (Million), 2009–2018 ................................................................................................................................... 74 Table 28: Europe – Average Rental Length (Days), 2009–2018 ...................................................................................................................................... 76 Table 29: Europe – Utilization Rate (%), 2009–2018 ....................................................................................................................................................... 78 Table 30: Europe – Average Revenue per Day (US$), 2009–2018 ................................................................................................................................. 80 Table 31: The Middle East and Africa – Market Value by Customer Type – Business (US$ Million), 2009–2018 ............................................................ 84 Table 32: The Middle East and Africa – Market Value by Customer Type –Leisure (US$ Million), 2009–2018 ................................................................ 86 Table 33: The Middle East and Africa – Market Value by Location – Airport (US$ Million), 2009–2018 ........................................................................... 88 Table 34: The Middle East and Africa – Market Value by Location –Non-Airport (US$ Million), 2009–2018 .................................................................... 90 Table 35: The Middle East and Africa – Fleet Size (Actual), 2009–2018 ......................................................................................................................... 92 Table 36: The Middle East and Africa – Number of Rental Occasions (Thousand), 2009–2018 ...................................................................................... 94 Table 37: The Middle East and Africa – Number of Rental Days (Million), 2009–2018 .................................................................................................... 96 Table 38: The Middle East and Africa – Average Rental Length (Days), 2009–2018 ....................................................................................................... 98 Table 39: The Middle East and Africa – Utilization Rate (%), 2009–2018 ...................................................................................................................... 100 Table 40: The Middle East and Africa – Average Revenue per Day (US$), 2009–2018 ................................................................................................ 102 Table 41: Enterprise Holdings, Inc., Key Facts .............................................................................................................................................................. 104 Table 42: Enterprise Holdings, Inc., Main Services and Brands .................................................................................................................................... 105 Table 44: Enterprise Holdings, Inc., Key Employees ..................................................................................................................................................... 111 Table 45: Hertz Global Holdings, Inc., Key Facts .......................................................................................................................................................... 112 Table 46: Hertz Global Holdings, Inc., Main Services and Brands ................................................................................................................................. 113 Table 48: Hertz Global Holdings, Inc., Key Employees ................................................................................................................................................. 123 Table 49: Avis Budget Group, Inc., Key Facts ............................................................................................................................................................... 124 Table 50: Avis Budget Group, Inc., Main Services and Brands...................................................................................................................................... 125 Table 52: Avis Budget Group, Inc., Key Employees ...................................................................................................................................................... 132 Table 53: kt Kumho Rent-A-car, Key Facts ................................................................................................................................................................... 133 Table 54: kt Kumho Rent-A-car, Main Services ............................................................................................................................................................. 133 Table 55: kt Kumho Rent-A-car, Key Employees .......................................................................................................................................................... 133 Table 56: TOYOTA Rent-A-Car, Key Facts ................................................................................................................................................................... 134 Table 57: TOYOTA Rent-A-Car, Main Services ............................................................................................................................................................ 134 Table 58: Europcar International S.A.S.U, Key Facts .................................................................................................................................................... 135 Table 59: Europcar International S.A.S.U, Main Services.............................................................................................................................................. 135 Table 60: Europcar International S.A.S.U, Key Employees ........................................................................................................................................... 135 Table 61: Sixt SE, Key Facts ........................................................................................................................................................................................ 136 Table 62: Sixt SE, Main Services and Brands ............................................................................................................................................................... 138 Table 63: Sixt SE, History ............................................................................................................................................................................................. 138 Table 64: Sixt SE, Key Employees ................................................................................................................................................................................ 142 Table 65: Localiza Rent-A-Car SA, Key Facts ............................................................................................................................................................... 143 Table 66: Localiza Rent-A-Car SA, Main Services ........................................................................................................................................................ 144 Table 67: Localiza Rent-A-Car SA, History ................................................................................................................................................................... 144 Table 68: Localiza Rent-A-Car SA, Key Employees ...................................................................................................................................................... 147 Table 69: China Auto Rental Ltd, Key Facts .................................................................................................................................................................. 148
LIST OF TABLES
Global Car Rental Market to 2018 Page 21
© Travel & Tourism Intelligence Center. This product is licensed and is not to be photocopied Published: December 2014
Table 70: China Auto Rental Ltd, Main Services ........................................................................................................................................................... 148 Table 71: China Auto Rental Ltd, Key Employees ......................................................................................................................................................... 148 Table 72: Carzonrent India Pvt., Ltd, Key Facts ............................................................................................................................................................ 149 Table 73: Carzonrent India Pvt., Ltd, Main Services ...................................................................................................................................................... 149 Table 74: Carzonrent India Pvt., Ltd, Key Employees ................................................................................................................................................... 150 Table 75: TTIC –Global Car Rental Market Definitions .................................................................................................................................................. 151
LIST OF FIGURES
Global Car Rental Market to 2018 Page 22
© Travel & Tourism Intelligence Center. This product is licensed and is not to be photocopied Published: December 2014
LIST OF FIGURES
Figure 1: Top 10 Car Rental Markets by Value (US$ Million) with Utilization Rates (%), 2013 ......................................................................................... 13 Figure 2: The Americas – Top Three Markets by Value (US$ Million), 2013 .................................................................................................................... 17 Figure 3: The Americas – Market Value by Customer Type – Business (US$ Million), 2009–2013 .................................................................................. 20 Figure 4: The Americas – Market Value by Customer Type – Business (US$ Million), 2014–2018 .................................................................................. 20 Figure 5: The Americas – Market Value by Customer Type –Leisure (US$ Million), 2009–2013 ..................................................................................... 22 Figure 6: The Americas – Market Value by Customer Type –Leisure (US$ Million), 2014–2018 ..................................................................................... 22 Figure 7: The Americas – Market Value by Location – Airport (US$ Million), 2009–2013 ................................................................................................ 24 Figure 8: The Americas – Market Value by Location – Airport (US$ Million), 2014–2018 ................................................................................................ 24 Figure 9: The Americas – Market Value by Location – Non-Airport (US$ Million), 2009–2013 ......................................................................................... 26 Figure 10: The Americas – Market Value by Location – Non-Airport (US$ Million), 2014–2018 ....................................................................................... 26 Figure 11: The Americas – Fleet Size (Thousand), 2009–2013 ....................................................................................................................................... 28 Figure 12: The Americas – Fleet Size (Thousand), 2014–2018 ....................................................................................................................................... 28 Figure 13: The Americas – Number of Rental Occasions (Thousand), 2009–2013.......................................................................................................... 30 Figure 14: The Americas – Number of Rental Occasions (Thousand), 2014–2018.......................................................................................................... 30 Figure 15: The Americas – Number of Rental Days (Million), 2009–2013 ........................................................................................................................ 32 Figure 16: The Americas – Number of Rental Days (Million), 2014–2018 ........................................................................................................................ 32 Figure 17: The Americas – Average Rental Length (Days), 2009–2013 .......................................................................................................................... 34 Figure 18: The Americas – Average Rental Length (Days), 2014–2018 .......................................................................................................................... 34 Figure 19: The Americas – Utilization Rate (%), 2009–2013 ........................................................................................................................................... 36 Figure 20: The Americas – Utilization Rate (%), 2014–2018 ........................................................................................................................................... 36 Figure 21: The Americas – Average Revenue per Day (US$), 2009–2013 ...................................................................................................................... 38 Figure 22: The Americas – Average Revenue per Day (US$), 2014–2018 ...................................................................................................................... 38 Figure 23: Asia-Pacific – Top Five Markets by Value (US$ Million), 2013 ........................................................................................................................ 39 Figure 24: Asia-Pacific – Market Value by Customer Type – Business (US$ Million), 2009–2013 ................................................................................... 42 Figure 25: Asia-Pacific – Market Value by Customer Type – Business (US$ Million), 2014–2018 ................................................................................... 42 Figure 26: Asia-Pacific – Market Value by Customer Type – Leisure (US$ Million), 2009–2013 ...................................................................................... 44 Figure 27: Asia-Pacific – Market Value by Customer Type – Leisure (US$ Million), 2014–2018 ...................................................................................... 44 Figure 28: Asia-Pacific – Market Value by Location – Airport (US$ Million), 2009–2013 .................................................................................................. 46 Figure 29: Asia-Pacific – Market Value by Location – Airport (US$ Million), 2014–2018 .................................................................................................. 46 Figure 30: Asia-Pacific – Market Value by Location – Non-Airport (US$ Million), 2009–2013 .......................................................................................... 48 Figure 31: Asia-Pacific – Market Value by Location – Non-Airport (US$ Million), 2014–2018 .......................................................................................... 48 Figure 32: Asia-Pacific – Fleet Size (Thousand), 2009–2013 .......................................................................................................................................... 50 Figure 33: Asia-Pacific – Fleet Size (Thousand), 2014–2018 .......................................................................................................................................... 50 Figure 34: Asia-Pacific – Number of Rental Occasions (Thousand), 2009–2013 ............................................................................................................. 52 Figure 35: Asia-Pacific – Number of Rental Occasions (Thousand), 2014–2018 ............................................................................................................. 52 Figure 36: Asia-Pacific – Number of Rental Days (Million), 2009–2013 ........................................................................................................................... 54 Figure 37: Asia-Pacific – Number of Rental Days (Million), 2014–2018 ........................................................................................................................... 54 Figure 38: Asia-Pacific – Average Rental Length (Days), 2009–2013 ............................................................................................................................. 56 Figure 39: Asia-Pacific – Average Rental Length (Days), 2014–2018 ............................................................................................................................. 56 Figure 40: Asia-Pacific – Utilization Rate (%), 2009–2013 ............................................................................................................................................... 58 Figure 41: Asia-Pacific – Utilization Rate (%), 2014–2018 ............................................................................................................................................... 58 Figure 42: Asia-Pacific – Total Revenue of Car Rental (US$ Million), 2009–2013 ........................................................................................................... 60 Figure 43: Asia-Pacific – Total Revenue of Car Rental (US$ Million), 2014–2018 ........................................................................................................... 60 Figure 44: Europe – Top Five Markets by Value (US$ Million), 2013............................................................................................................................... 61 Figure 45: Europe – Market Value by Customer Type – Business (US$ Million), 2009–2013 .......................................................................................... 64 Figure 46: Europe – Market Value by Customer Type – Business (US$ Million), 2014–2018 .......................................................................................... 64 Figure 47: Europe – Market Value by Customer Type – Leisure (US$ Million), 2009–2013 ............................................................................................. 66 Figure 48: Europe – Market Value by Customer Type –Leisure (US$ Million), 2014–2018 .............................................................................................. 66 Figure 49: Europe – Market Value by Location – Airport (US$ Million), 2009–2013 ......................................................................................................... 68 Figure 50: Europe – Market Value by Location – Airport (US$ Million), 2014–2018 ......................................................................................................... 68 Figure 51: Europe – Market Value by Location –Non-Airport (US$ Million), 2009–2013 .................................................................................................. 70 Figure 52: Europe – Market Value by Location –Non-Airport (US$ Million), 2014–2018 .................................................................................................. 70 Figure 53: Europe – Fleet Size (Thousand), 2009–2013 ................................................................................................................................................. 72 Figure 54: Europe – Fleet Size (Thousand), 2014–2018 ................................................................................................................................................. 72 Figure 55: Europe – Number of Rental Occasions (Thousand), 2009–2013 .................................................................................................................... 74 Figure 56: Europe – Number of Rental Occasions (Thousand), 2014–2018 .................................................................................................................... 74 Figure 57: Europe – Number of Rental Days (Million), 2009–2013 .................................................................................................................................. 76 Figure 58: Europe – Number of Rental Days (Million), 2014–2018 .................................................................................................................................. 76 Figure 59: Europe – Average Rental Length (Days), 2009–2013 .................................................................................................................................... 78 Figure 60: Europe – Average Rental Length (Days), 2014–2018 .................................................................................................................................... 78 Figure 61: Europe – Utilization Rate (%), 2009–2013 ...................................................................................................................................................... 80 Figure 62: Europe – Utilization Rate (%), 2014–2018 ...................................................................................................................................................... 80 Figure 63: Europe – Average Revenue per Day (US$), 2009–2013 ................................................................................................................................ 82 Figure 64: Europe – Average Revenue per Day (US$), 2014–2018 ................................................................................................................................ 82 Figure 65: The Middle East and Africa – Top Three Markets by Value (US$ Million), 2013 ............................................................................................. 83
LIST OF FIGURES
Global Car Rental Market to 2018 Page 23
© Travel & Tourism Intelligence Center. This product is licensed and is not to be photocopied Published: December 2014
Figure 66: The Middle East and Africa – Market Value by Customer Type – Business (US$ Million), 2009–2013 ........................................................... 86 Figure 67: The Middle East and Africa – Market Value by Customer Type – Business (US$ Million), 2014–2018 ........................................................... 86 Figure 68: The Middle East and Africa – Market Value by Customer Type –Leisure (US$ Million), 2009–2013 ............................................................... 88 Figure 69: The Middle East and Africa – Market Value by Customer Type –Leisure (US$ Million), 2014–2018 ............................................................... 88 Figure 70: The Middle East and Africa – Market Value by Location – Airport (US$ Million), 2009–2013 .......................................................................... 90 Figure 71: The Middle East and Africa – Market Value by Location – Airport (US$ Million), 2014–2018 .......................................................................... 90 Figure 72: The Middle East and Africa – Market Value by Location –Non-Airport (US$ Million), 2009–2013 ................................................................... 92 Figure 73: The Middle East and Africa – Market Value by Location –Non-Airport (US$ Million), 2014–2018 ................................................................... 92 Figure 74: The Middle East and Africa – Fleet Size (Actual), 2009–2013 ........................................................................................................................ 94 Figure 75: The Middle East and Africa – Fleet Size (Actual), 2014–2018 ........................................................................................................................ 94 Figure 76: The Middle East and Africa – Number of Rental Occasions (Thousand), 2009–2013 ..................................................................................... 96 Figure 77: The Middle East and Africa – Number of Rental Occasions (Thousand), 2014–2018 ..................................................................................... 96 Figure 78: The Middle East and Africa – Number of Rental Days (Million), 2009–2013 ................................................................................................... 98 Figure 79: The Middle East and Africa – Number of Rental Days (Million), 2014–2018 ................................................................................................... 98 Figure 80: The Middle East and Africa – Average Rental Length (Days), 2009–2013 .................................................................................................... 100 Figure 81: The Middle East and Africa – Average Rental Length (Days), 2014–2018 .................................................................................................... 100 Figure 82: The Middle East and Africa – Utilization Rate (%), 2009–2013 ..................................................................................................................... 102 Figure 83: The Middle East and Africa – Utilization Rate (%), 2014–2018 ..................................................................................................................... 102 Figure 84: The Middle East and Africa – Average Revenue per Day (US$), 2009–2013 ............................................................................................... 104 Figure 85: The Middle East and Africa – Average Revenue per Day (US$), 2014–2018 ............................................................................................... 104