Embed Size (px)
Citation preview
[ " 8 ]
THE GROWTH OF BROWN TROUT (SALMO TRUTTA LINN.)
I. FACTORS INFLUENCING THE GROWTH OF TROUT FRY
BY MARGARET E. BROWN, Zoological Laboratory, Cambridge
(Received i October 1945)
(With Five Text-figures)
INTRODUCTIONIt has long been known that brown trout (Salmotrutta Linn.) grow to different sizes in differentwaters, and there has been much speculation con-cerning the factors determining these differences.Dahl (1918-19) suggested that the food supplyand the degree of crowding were important; alsothat small, slowly growing trout were derived fromsmaller ova than those growing more rapidly.Southern (1932, 1935) demonstrated that, in Ireland,the rapidly growing fish are found in hard or alkalinewaters, while those growing slowly live in soft, acidwaters. This correlation has been upheld by thework of Frost (1939, 1945), Went & Frost (1942) andWent (1943) for Ireland, and by that of Raymond(1938) and Swynnerton & Worthington (1939) forGreat Britain, though exceptions were reported inthe Salmon and Freshwater Fisheries Report for 1936.
The greatest differences between the length andweight increments of trout living in hard and softwaters occur during the fourth year of life, but theannual specific growth rates show the most strikingdifferences during the first year. After this, theaverage specific growth rates may be very similar inthe two types of water although the fish are ofmarkedly different sizes. They begin to spawn at anearlier age in some waters, and fish which spawnhave a lower average specific growth rate for thatyear than fish of the same age which do not. Thus,the size attained by trout in different waters dependson (1) their rate of growth during the first year oflife, (2) the age at which they begin to spawn, and(3) their average length of life. In soft waters, troutgrow slowly during the first year, begin to spawnwhen 3 or 4 years old, and seldom live more than5 years; in hard waters, they generally have a highspecific growth rate during the first year, begin tospawn when older and may live for 12 years orlonger.
The effect of environmental factors on troutgrowth is, therefore, of special interest during thefirst year of life, since there must be a factor orfactors which inhibit growth in the soft watersduring this year. A number of observations on trout
growth are available from experimental hatcheries(McCay & Tunison, 1935, 1937) and from labora-tories (Pentelow, 1939; Wingfield, 1940), but theyconcern fish more than 8 months old. It is generallyadmitted that a number of environmental factorsmay affect trout growth, but it has so far -been im-possible to correlate differences in growth rate withany particular factor, since several environmentalfactors have varied simultaneously without beingmeasured accurately.
The present experiments were designed as an in-vestigation of the rate of growth of individual troutin environments where as many factors as possiblewere controlled. Temperature, amount and intensityof illumination, chemical composition and aerationof the water, rate of water flow and quality of foodsupply were maintained as constant as possible, andthe fish were allowed to eat as much as they would.Under these conditions it was hoped that the growthrates of the fish would vary in a definite and orderlyway. Any changes in growth rate common to all theindividuals should be the result of more or less in-trinsic physiological factors, such as periodic secre-tion of endocrine organs. Any differences in growthrate exhibited by individuals in the same groupmight be ascribed to genetical differences or to theeffect of the group on the individuals of which it iscomposed. When one environmental factor is variedand the others maintained constant, changes in thegrowth rate, compared with control fish, shouldindicate the effect of the varying factor.
The present paper is concerned with the growth oftrout fry during the 8 months following the begin-ning of feeding. Although it is recognized that theconclusions derived from this study of the effect ofgenetical constitution, alevin weight, crowding andintraspecific relationships on specific growth rate arebased on limited data, they are presented becausethey indicate some interesting possibilities.
APPARATUS AND TECHNIQUE
Trout ova were obtained from The Midland Fishery,Nailsworth, Gloucestershire. On 10 December 1943,Mr Stevens stripped two 4-year-old brown trout,
The .growth of brown trout 119
A and B, of their ova, and fertilized each lotfrom the same 4-year-old male fish. The
fertilized ova were incubated at the hatchery inspring water at a temperature of about io° C. Thetwo sets of 'eyed ova' were sent to Cambridge byrail on 14 January 1944, and were there kept introughs supplied with tap water at about 130 C. Themajority of the ova obtained from female A hadhatched by 21 January, while those from female B
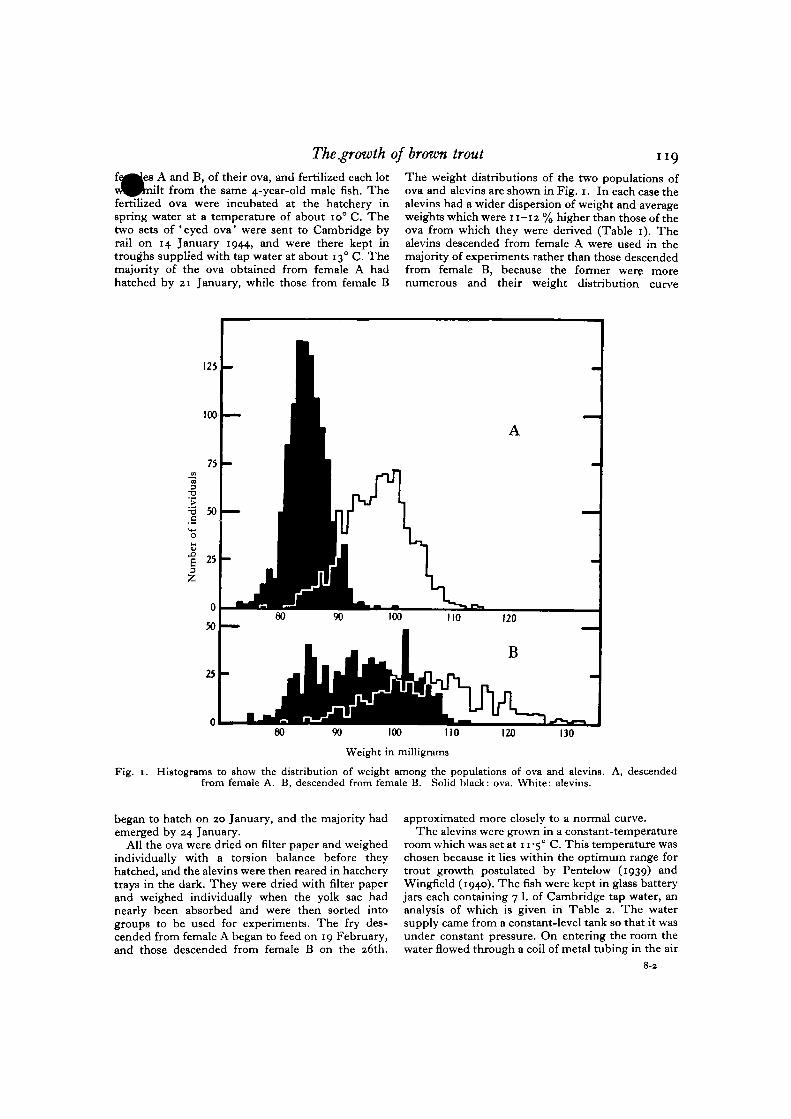
The weight distributions of the two populations ofova and alevins are shown in Fig. 1. In each case thealevins had a wider dispersion of weight and averageweights which were 11-12% higher than those of theova from which they were derived (Table 1). Thealevins descended from female A were used in themajority of experiments rather than those descendedfrom female B, because the former were morenumerous and their weight distribution curve
60 90
Weight in milligrams
Fig. 1. Histograms to show the distribution of weight among the populations of ova and alevins. A, descendedfrom female A. B, descended from female B. Solid black: ova. White: alevins.
began to hatch on 20 January, and the majority hademerged by 24 January.
All the ova were dried on filter paper and weighedindividually with a torsion balance before theyhatched, and the alevins were then reared in hatcherytrays in the dark. They were dried with filter paperand weighed individually when the yolk sac hadnearly been absorbed and were then sorted intogroups to be used for experiments. The fry des-cended from female A began to feed on 19 February,and those descended from female B on the 26th.
approximated more closely to a normal curve.The alevins were grown in a constant-temperature
room which was set at 11 -5° C. This temperature waschosen because it lies within the optimum range fortrout growth postulated by Pentelow (1939) andWingfield (1940). The fish were kept in glass batteryjars each containing 7 1. of Cambridge tap water, ananalysis of which is given in Table 2. The watersupply came from a constant-level tank so that it wasunder constant pressure. On entering the room thewater flowed through a coil of metal tubing in the air
8-2
1 2 0 MARGARET E. BROWN
and then through another coil immersed in standingwater. This reduced its temperature to that of theroom, and it seldom varied more than 0-2° fromII -5° C.
Each battery jar had its own water supply whichsprayed through a jet and overflowed through aconstant-level siphon into a gutter which ran towaste. The water in the jars was stirred continuouslywith compressed air. The room was free from day-light ; the fish were illuminated by 40 W. electricbulbs suspended 36 cm. above the water surface andso arranged that there was one bulb for each 20 sq.cm.of surface area. The lights were controlled by a clock-work time switch so that the fish were illuminatedfor 12 hr. and in darkness for 12 hr. each day.
and faeces were siphoned out of the tanks ebut there was no attempt to measure the actuaconsumption of the fry.
At intervals all the fry in each jar were removed;each fish was placed in 2'5 % urethane solution untilit rolled over on to its side, and it was then dried onfilter paper and weighed. Those weighing less than350 mg. were weighed with a torsion balance to thenearest milligram, and heavier fish were weighed on achemical balance to the nearest 5 mg. After weigh-ing, the fry were placed in a shallow dish of waterwith ice floating in it, and they generally recoveredwithin 2 min. There were very few deaths as a resultof weighing; these were caused by the use of toostrong a solution of urethane.
Table 1. Summary of data about ova and alevins
Date of fertilizationTime of hatching as days after fertilizationTime of beginning of feeding as days after fertilizationNo. of ova weighedNo. of ova died before hatchingNo. of alevins died before weighingNo. of abnormalitiesNo. of alevins weighedAverage weight of ova (mg.)Average weight of alevins (mg.)Percentage increase in average weight
Derived fromfemale A
10 Dec. 194340-42
7i1093
7i1712
993843394'3no
Derived fromfemale B
10 Dec. 194341-45
787611423327
5599494
105-4112
Table 2. An analysis of Cambridge tap water(on 3 March 1944)
(By courtesy of the Cambridge University andTown Waterworks Co.)
Chemical composition as parts per million
Total dried solids: 305.Chlorides: 15.Alkali reserve (as calcium carbonate): 200.Total hardness: 130.(all temporary, no permanent hardness).
Calcium as Ca: 590. Magnesium as Mg: i-6.Nitrogen as nitrates: 6-4.. Nitrogen as nitrites: o.Ammonia: o. Albuminoid ammonia: o.Iron as Fe: 007. No other metals present.Oxygen absorbed in 4 hr. at 27° C.: o.Free chlorine reaction: absent.pH: 7-3.
' Very high standard of organic and bacterial purity.'
The fry were fed on finely minced raw liver andwere always given more than they would eat. Theb'ver was dropped into the water, and the fry took itreadily as it sank slowly to the bottom. At first theywere fed twice daily, but after 3 months of feedingthey were fed only once daily. The remains of food
THE GROWTH OF INDIVIDUAL TROUTFRY IN CONSTANT ENVIRONMENTAL
CONDITIONSSome of the alevins descended from female A weresorted into five batches of fifty individuals, eachgroup with a limited range of individual weight, butcovering between them the total range in weight ofthis family. Others were grown in similar environ-mental conditions but with different numbers ofindividuals in each tank. Two sets of fifty alevinsdescended from female B were also grown in thesame environmental conditions. One of these groupsincluded a range in weight which was the same asthat of the majority of the alevins descended fromfemale A, while the other consisted of individuals ofgreater weight.
At the beginning of the experiments some frybegan to feed before the others and some never fed atall. The latter died within the first 3 weeks and othersdied at intervals later, but over 50 % of the indi-viduals in each group survived for more than 8months. The record for each tank showed a pro-gressive decrease in the number of surviving fry, butonly the smallest individuals died. Certain indi-viduals were marked, and these remained in approxi-
The growth of brown trout 1 2 1
the same numerical position if the weights ofh were tabulated in descending order of size
after each weighing.It was decided not to use the mean weights for the
groups in comparing the performance of fry indifferent tanks, since the weight distributions werenot normal. The median value depended on thenumber of fry surviving at any date and would giveno useful data for individual growth, though themedians and interquartile ranges indicated the dis-persion of weight within a group. In order toestimate the growth of individuals, it has beenassumed that each individual remained in the sameposition in order of descending weight for the group,so that, for instance, the values that were first, fifth,tenth, fifteenth and twentieth in successive weightrecords showed the change in weight of individualsoccupying these positions in the order of size. Withthis assumption, individual specific growth rateswere calculated from the formula
where G = specific (or incremental, geometric, in-stantaneous or multiplicative) growth rate, YT
= weight at time T, Yt = weight at time t, and Tislater than t. The time was expressed as weeks, so thatthe specific growth rate is expressed as percentageweight per week.
When the growth records of the five groups offifty fry descended from female A were compared, itwas clear that the individuals did not all grow at thesame specific rate, although they had the sameparents and were living in the same environmentalconditions. The dispersion of individual weights in-creased with time (Table 3), and individual specificgrowth rates were generally higher for the fish whichgrew most rapidly during the first period than forthe smaller fry (Table 4). Thus, for the first fewmonths, the order of descending weight was alsoan order of decreasing specific growth rate for thegroup. All the fi9h showed decrease in their specificgrowth rates as they grew older, and the difference inrate between the members of a group decreased withtime.
The effect of 'grading' on individualspecific growth rates
The difference between the rates of growth oflarge and small individuals in the same group mightbe the result of two different causes: (1) some frymight be hereditarily incapable of as high a specificgrowth rate as others, since the individuals were notnecessarily identical genetically although they werethe offspring of the same parents and these camefrom an inbred hatchery stock; (2) the differencesmight result from some fish beginning to feed earlierthan others and thus acquiring an initial advantage insize. Mutual reaction between fish of different sizes
might then result in the larger fish growing faster andthe smaller ones being retarded. Since the fish wereallowed as much food as they would eat, competitionfor a limited food supply cannot be the factor in-volved.
In order to test this second hypothesis, two groupsof fifty alevins descended from female A were grownunder similar environmental conditions for 8 weeks,
Table 3. Dispersion of individual weightswithin groups of trout fry
M, median
No. of daysafter beginning
of feeding
0
21
355696
1 1 91 4 0
1631832 0 6
2 3 1
value IqR, interquartile
Weight
Small
M
861 3 2
1582533803994335 2 07 2 0
7951120
IqR
53857
1 4 0
264283377433586755
i°45
in mg
Medium
M
951 6 0
2472 8 0
48259°6517619 1 0
8781305
IqR
0
441 0 2
98188328445486803
10941620
range
Large
M
1 0 4
1662 3 23 1 0
53 i616684945
147013702180
IqR
559
IOI
2454525345939 0 0
154012022375
Table 4. Mean specific growth rates (as percentageweight per week) of individual trout fry descendedfrom female A
The aleVin8 all weighed 95 mg. before they began to feed.
Position in sizeorder
Specific growthrate during weeks
0- 33- 88-14
14-2020—2626-33
1
2 6 01 6 8n - 64'59 5
io-6
5
23-313-7n - 54-38-66 3
Fish
1 0
21-71 2 0
8-56 96 75'7
no.
15
2 0 9
9 29 1
6 36-52 5
2 0
2 0 08 19 1
2-73 9
- 0 9
25
16-57-97 43'53-5—
and all the fish in one group were marked by amputa-tion of the adipose fin. The two groups were thencombined, and the individuals were graded intoequal numbers of 'large' and 'small' fry, i.e. thoseweighing more and less than 350 mg. respectively.These two groups were grown under the same en-vironmental conditions as the original groups, andwere weighed at intervals so that specific growthrates might be calculated.
Within each group, the larger individuals grew
122 MARGARET E. BROWN
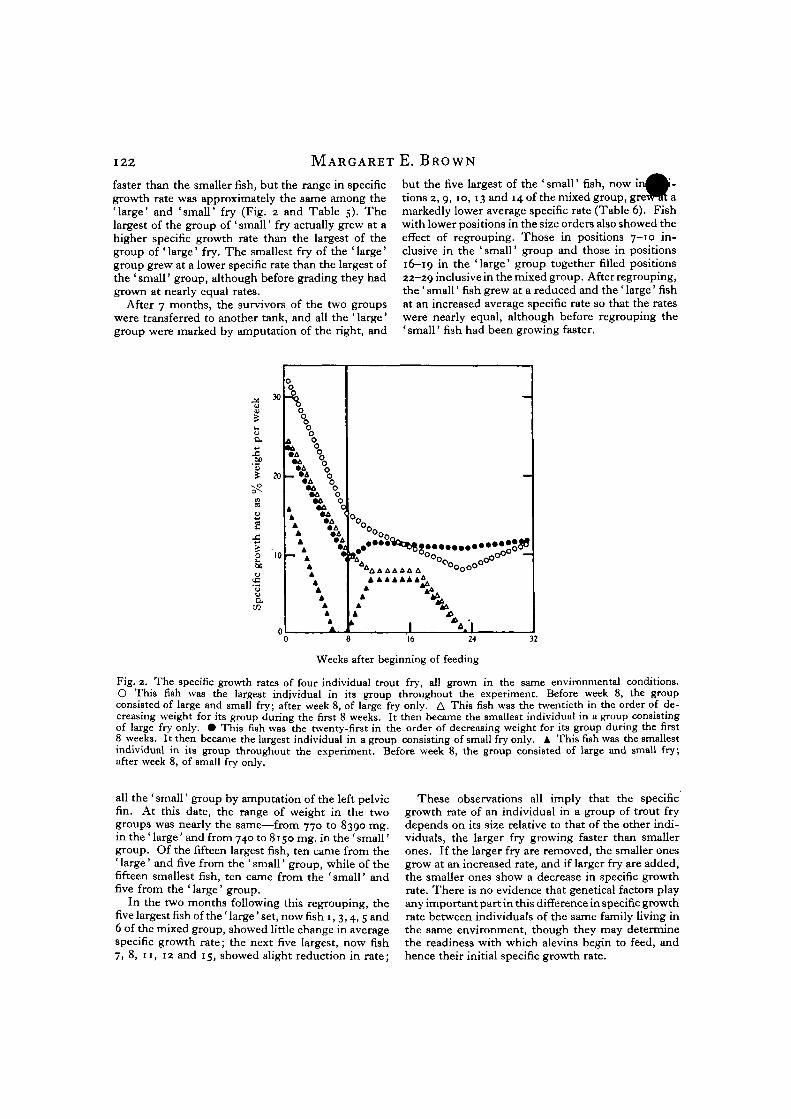
faster than the smaller fish, but the range in specificgrowth rate was approximately the same among the'large' and 'small' fry (Fig. 2 and Table 5). Thelargest of the group of ' small' fry actually grew at ahigher specific growth rate than the largest of thegroup of ' large' fry. The smallest fry of the ' large'group grew at a lower specific rate than the largest ofthe 'small' group, although before grading they hadgrown at nearly equal rates.
After 7 months, the survivors of the two groupswere transferred to another tank, and all the ' large'group were marked by amputation of the right, and
but the five largest of the ' small' fish, now i ^tions 2, 9, 10, 13 and 14 of the mixed group, grewTrt amarkedly lower average specific rate (Table 6). Fishwith lower positions in the size orders also showed theeffect of regrouping. Those in positions 7-10 in-clusive in the 'small' group and those in positions16-19 in the 'large' group together filled positions22-29 inclusive in the mixed group. After regrouping,the ' small' fish grew at a reduced and the ' large' fishat an increased average specific rate so that the rateswere nearly equal, although before regrouping the' small' fish had been growing faster.
30
20 -
aC/3
o
0
00
A 0̂
\ °oo_ V A °O
• A 0•A 0•A 0•A 0
A ^".
* »aA »AA »A
"~ \ *AAAAAAAAA
' \ 8°0*A AAAAAA*.
A A*
A
' 1
-
• • • • • • • • * J o S ° ^10 —
24 32
Weeks after beginning of feeding
Fig. 2. The specific growth rates of four individual trout fry, all grown in the same environmental conditions.O This fish was the largest individual in its group throughout the experiment. Before week 8, the groupconsisted of large and small fry; after week 8, of large fry only. A This fish was the twentieth in the order of de-creasing weight for its group during the first 8 weeks. It then became the smallest individual in a group consistingof large fry only. • This fish was the twenty-first in the order of decreasing weight for its group during the first8 weeks. It then became the largest individual in a group consisting of small fry only. A. This fish was the smallestindividual in its group throughout the experiment. Before week 8, the group consisted of large and small fry;after week 8, of small fry only.
all the ' small' group by amputation of the left pelvicfin. At this date, the range of weight in the twogroups was nearly the same—from 770 to 8390 mg.in the ' large' and from 740 to 8150 mg. in the ' small'group. Of the fifteen largest fish, ten came from the' large' and five from the ' small' group, while of thefifteen smallest fish, ten came from the 'small' andfive from the 'large' group.
In the two months following this regrouping, thefive largest fish of the' large' set, now fish 1,3,4,5 and6 of the mixed group, showed little change in averagespecific growth rate; the next five largest, now fish7, 8, 11, 12 and 15, showed slight reduction in rate;
These observations all imply that the specificgrowth rate of an individual in a group of trout frydepends on its size relative to that of the other indi-viduals, the larger fry growing faster than smallerones. If the larger fry are removed, the smaller onesgrow at an increased rate, and if larger fry are added,the smaller ones show a decrease in specific growthrate. There is no evidence that genetical factors playany important part in this difference in specific growthrate between individuals of the same family living inthe same environment, though they may determinethe readiness with which alevins begin to feed, andhence their initial specific growth rate.
The growth of brown trout
Tame 5. Comparison of the specific growth rates (aspercentage weight per week) of large and small fry ofthe same age and with the same positions in the ordersof size for their groups
Age asweeks after
beginning offeeding
8-14
14-20
20-26
26-33
Positionin orderof size
1
5
JO
15
2 0
25
I
5
1 0
15
2 0
25
1
5
1 0
15
2 0
1
5
1 0
15
2 0
Initialweight in
mg.
36058933849631747629445°2764 2 1
244402
720
1310620
1002
55°8624918234607494 2 0
67514022500
1032
1880904
1550812
1410
67313552670400514802146I I I O
1880950
1675740
1390
Specificgrowth
rate
n - 313-31 0 2
n - 79 19 9
io-o.1 0 0
9-69 68-68-6
I I - I
10-78-5
10-58-39 78 98 99 99 99 39 3
1 0 77'95 92 - 1
3 43-22 62 8I-50-3
n - 6io-6
9-2IO-2
5-65-22 - 1
4 2i-51'5
The effect of crowding on individualspecific growth rates
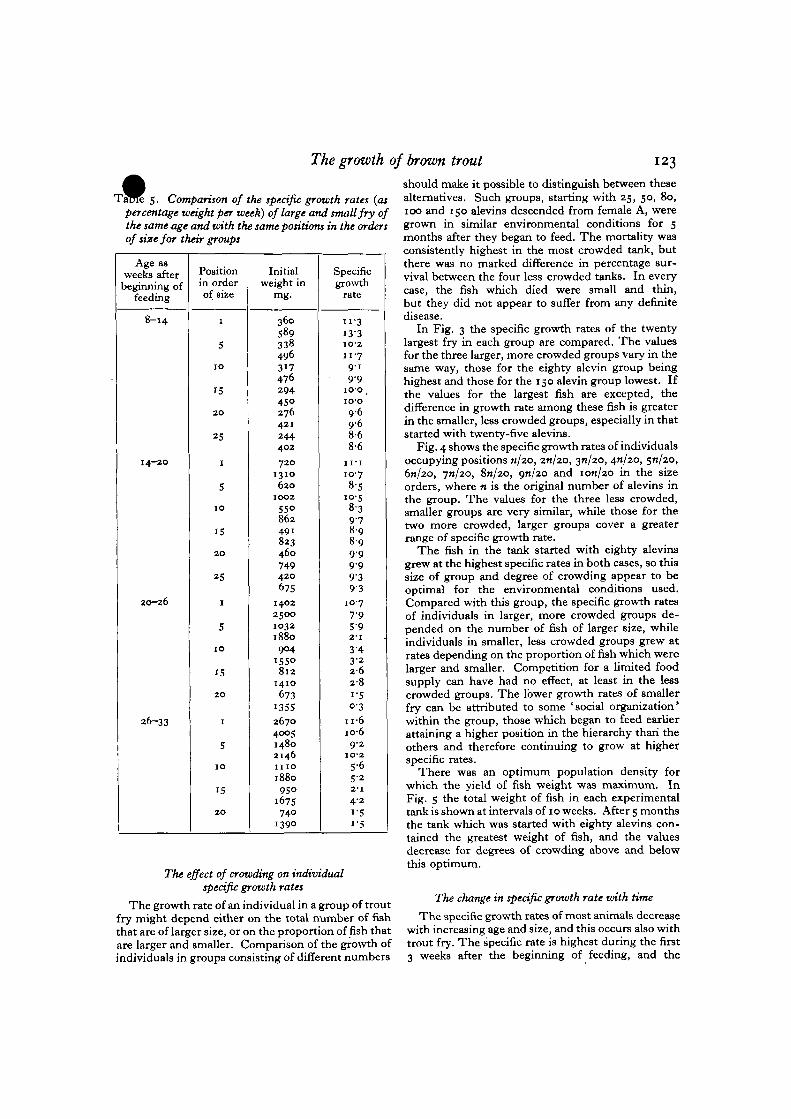
The growth rate of an individual in a group of troutfry might depend either on the total number of fishthat are of larger size, or on the proportion offish thatare larger and smaller. Comparison of the growth ofindividuals in groups consisting of different numbers
123
should make it possible to distinguish between thesealternatives. Such groups, starting with 25, 50, 80,100 and 150 alevins descended from female A, weregrown in similar environmental conditions for 5months after they began to feed. The mortality wasconsistently highest in the most crowded tank, butthere was no marked difference in percentage sur-vival between the four less crowded tanks. In everycase, the fish which died were small and thin,but they did not appear to suffer from any definitedisease.
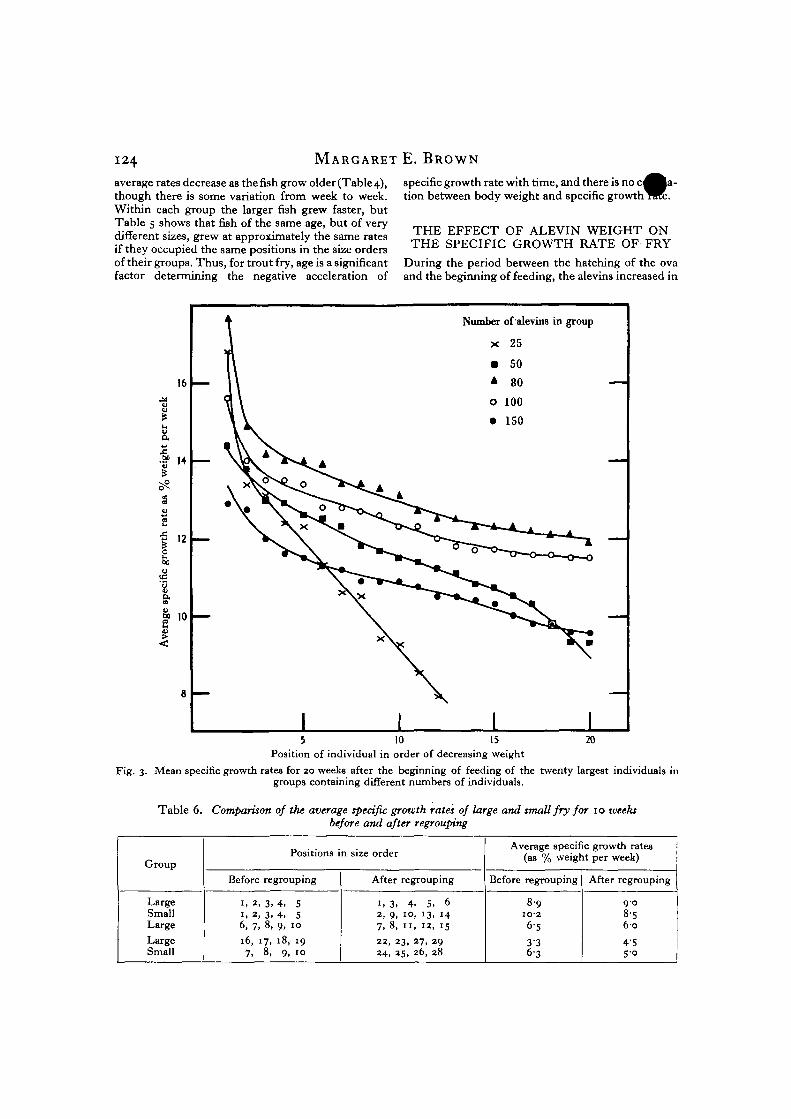
In Fig. 3 the specific growth rates of the twentylargest fry in each group are compared. The valuesfor the three larger, more crowded groups vary in thesame way, those for the eighty alevin group beinghighest and those for the 150 alevin group lowest. Ifthe values for the largest fish are excepted, thedifference in growth rate among these fish is greaterin the smaller, less crowded groups, especially in thatstarted with twenty-five alevins.
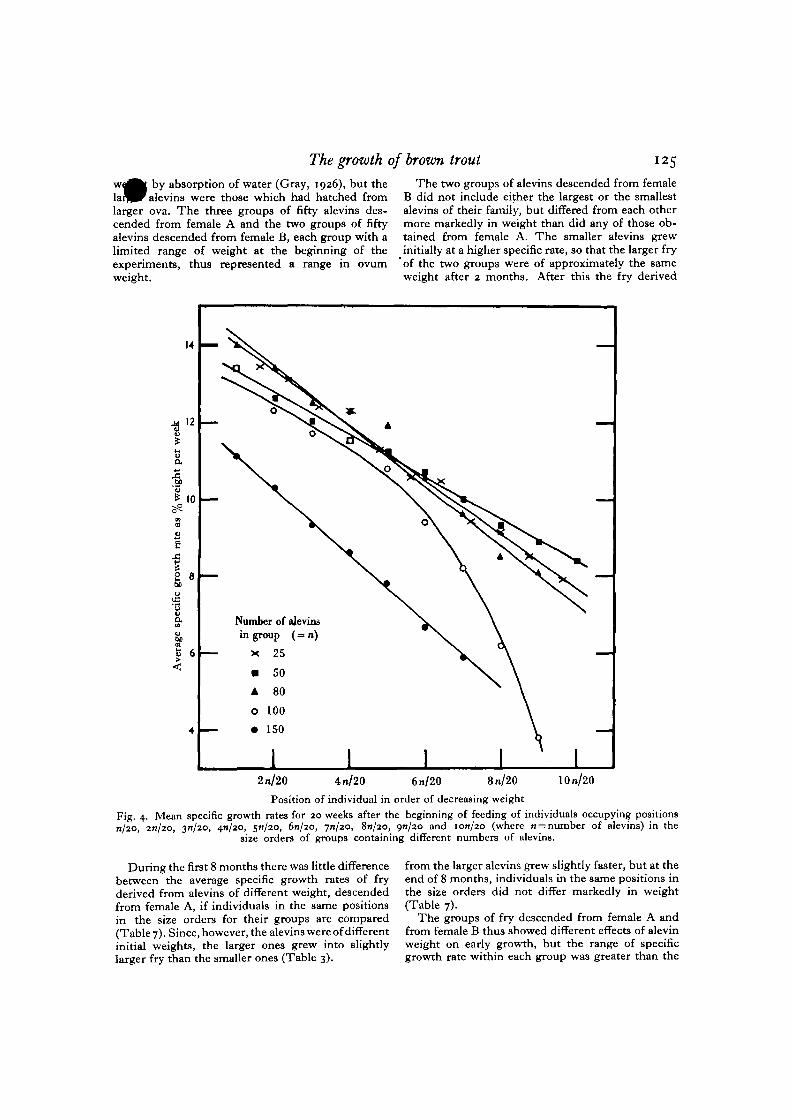
Fig. 4 shows the specific growth rates of individualsoccupying positions n/20, 20/20, 31/20, 4J1/20, 5/1/20,6n/2O, 7*1/20, Sn/20, 9/1/20 and ion/20 in the sizeorders, where n is the original number of alevins inthe group. The values for the three less crowded,smaller groups are very similar, while those for thetwo more crowded, larger groups cover a greaterrange of specific growth rate.
The fish in the tank started with eighty alevinsgrew at the highest specific rates in both cases, so thissize of group and degree of crowding appear to beoptimal for the environmental conditions used.Compared with this group, the specific growth ratesof individuals in larger, more crowded groups de-pended on the number of fish of larger size, whileindividuals in smaller, less crowded groups grew atrates depending on the proportion of fish which werelarger and smaller. Competition for a limited foodsupply can have had no effect, at least in the lesscrowded groups. The lower growth rates of smallerfry can be attributed to some 'social organization*within the group, those which began to feed earlierattaining a higher position in the hierarchy than theothers and therefore continuing to grow at higherspecific rates.
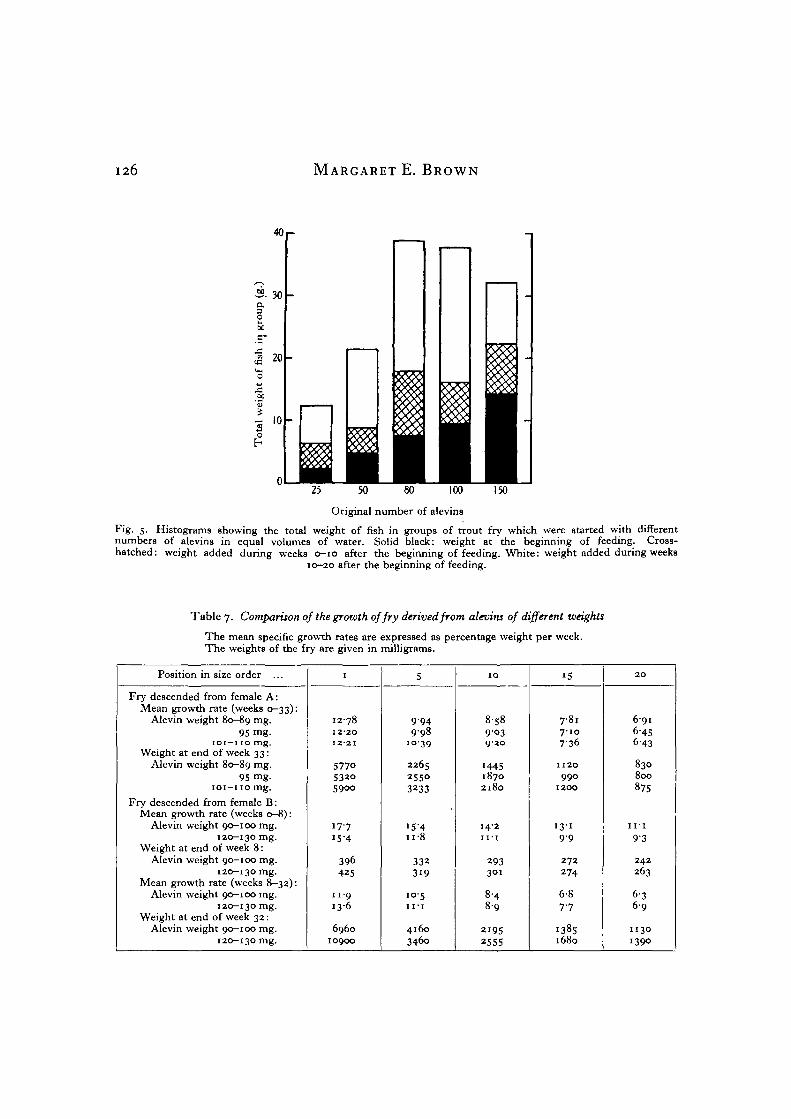
There was an optimum population density forwhich the yield of fish weight was maximum. InFig. 5 the total weight of fish in each experimentaltank is shown at intervals of 10 weeks. After 5 monthsthe tank which was started with eighty alevins con-tained the greatest weight of fish, and the valuesdecrease for degrees of crowding above and belowthis optimum.
The change in specific growth rate with time
The specific growth rates of most animals decreasewith increasing age and size, and this occurs also withtrout fry. The specific rate is highest during the first3 weeks after the beginning of feeding, and the
124 MARGARET E. BROWN
average rates decrease as the fish grow older(Table 4),though there is some variation from week to week.Within each group the larger fish grew faster, butTable 5 shows that fish of the same age, but of verydifferent sizes, grew at approximately the same ratesif they occupied the same positions in the size ordersof their groups. Thus, for trout fry, age is a significantfactor determining the negative acceleration of
specific growth rate with time, and there is no ction between body weight and specific growth
THE EFFECT OF ALEVIN WEIGHT ONTHE SPECIFIC GROWTH RATE OF FRY
During the period between the hatching of the ovaand the beginning of feeding, the alevins increased in
16 I—
1i•n 14 I—
G
I
\
\
i\
>
1
1 TO*
1
Number
X
•A
O
•
°̂ --o.
\
1
of alevins in group
25
50
80
100
150
-w-o-o—o_o
•v •N
1
12 —
8 —
5 10 15 20Position of individual in order of decreasing weight
Fig. 3. Mean specific growth rates for 20 weeks after the beginning of feeding of the twenty largest individuals ingroups containing different numbers of individuals.
Table 6. Comparison of the average specific growth rates of large and small fry for 10 weeksbefore and after regrouping
Group
LargeSmallLargeLargeSmall
Positions in size order
Before regrouping
1, 2. 3. 4. S1, 2, 3, 4, 56, 7, 8, 9, 10
16, 17, 18, 197, 8, 9, 10
After regrouping
1, 3. 4. 5. 62, 9, 10, 13, 147, 8, 11, 12, 15
22, 23, 27, 2924, 25, 26, 28
Average specific growth rates(as % weight per week)
Before regrouping
8-91026-53363
After regrouping
908-560
4550
The growth of brown trout
by absorption of water (Gray, 1926), but theevins were those which had hatched from
larger ova. The three groups of fifty alevins des-cended from female A and the two groups of fiftyalevins descended from female B, each group with alimited range of weight at the beginning of theexperiments, thus represented a range in ovumweight.
" 5The two groups of alevins descended from female
B did not include either the largest or the smallestalevins of their family, but differed from each othermore markedly in weight than did any of those ob-tained from female A. The smaller alevins grewinitially at a higher specific rate, so that the larger fryof the two groups were of approximately the sameweight after 2 months. After this the fry derived
14
12
s
•5a
S 6<
Number of ajevimin group (= n)
X 25
• 50
A 80
O 100
• 150
2n/20 4n/20 6n/20 8n/20 10n/20
Position of individual in order of decreasing weightFig. 4. Mean specific growth rates for 20 weeks after the beginning of feeding of individuals occupying positionsn/20, 20/20, 30/20, 4*1/20, 571/20, 6n/2O, 7*1/20, 8n/2o, on/20 and 1 on/20 (where n = number of alevins) in the
size orders of groups containing different numbers of alevins.
During the first 8 months there was little differencebetween the average specific growth rates of fryderived from alevins of different weight, descendedfrom female A, if individuals in the same positionsin the size orders for their groups are compared(Table 7). Since, however, the alevins were of differentinitial weights, the larger ones grew into slightlylarger fry than the smaller ones (Table 3).
from the larger alevins grew slightly faster, but at theend of 8 months, individuals in the same positions inthe size orders did not differ markedly in weight(Table 7).
The groups of fry descended from female A andfrom female B thus showed different effects of alevinweight on early growth, but the range of specificgrowth rate within each group was greater than the
126 MARGARET E. BROWN
40 r-
30O.O
20
•a
a l0
oh
Original number of alevin3
Fig. 5. Histograms showing the total weight of fish in groups of trout fry which were started with differentnumbers of alevins in equal volumes of water. Solid black: weight at the beginning of feeding. Cross-hatched: weight added during weeks 0-10 after the beginning of feeding. White: weight added during weeks
10-20 after the beginning of feeding.
Table 7. Comparison of the growth of fry derived from alevins of different weights
The mean specific growth rates are expressed as percentage weight per week.The weights of the fry are given in milligrams.
Position in size order
Fry descended from female A:Mean growth rate (weeks 0—33):
Alevin weight 80—89 mg-95 mg.
101—110 mg.Weight at end of week 33:
Alevin weight 80-89 m 8 -95 mg-
IOI-IIO mg.
Fry descended from female B:Mean growth rate (weeks 0—8):
Alevin weight 90-100 mg.120—130 mg.
Weight at end of week 8:Alevin weight 90-100 mg.
120—130 mg.Mean growth rate (weeks 8-32):
Alevin weight 90-100 mg.120—130 mg.
Weight at end of week 32:Alevin weight 90—100 mg.
120—130 mg.
1
12-78I2-2O12-21
577O532O59O0
17-715-4
396425
n - 91 3 6
696010900
5
9 9 49 9 8
10-39
2265*55°3233
' 5 4n - 8
3323 i 9
1 0 5H I
4160340O
1 0
8 5 8
9'°39 2 0
144518702180
14-2I I - I
293301
8-48 9
21952555
15
7-8i7-107 3 6
1120990
1200
i3 ' i9-9
272
274
6-87-7
13851680
2 0
6 9 1
6-456 43
830800
875
i i - i
9-3
242263
6-36 9
11301390
The growth of brown troutes between the rates of individuals of similarin different groups. There were greater
differences in size between larger and smaller fry inthe same group than between fry of similar position,but derived from alevins of different weight.
THE EFFECT OF HEREDITY ON THEEARLY GROWTH OF FRY
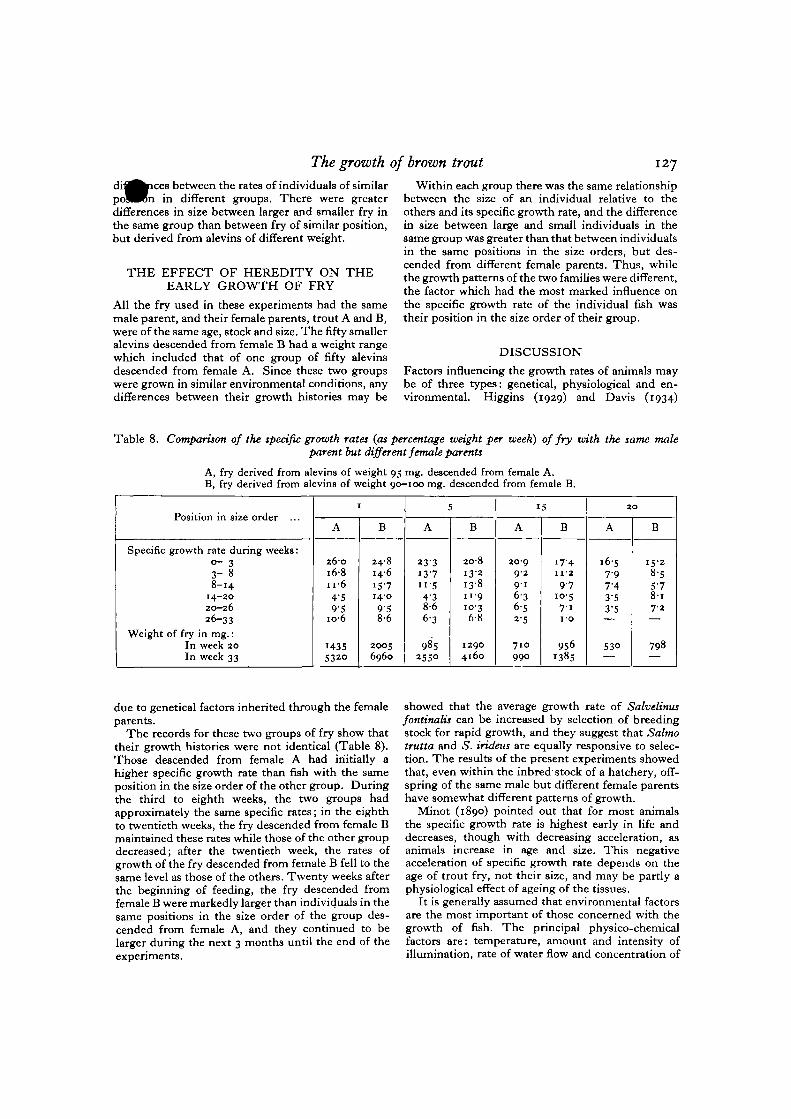
All the fry used in these experiments had the samemale parent, and their female parents, trout A and B,were of the same age, stock and size. The fifty smalleralevins descended from female B had a weight rangewhich included that of one group of fifty alevinsdescended from female A. Since these two groupswere grown in similar environmental conditions, anydifferences between their growth histories may be
127Within each group there was the same relationship
between the size of an individual relative to theothers and its specific growth rate, and the differencein size between large and small individuals in thesame group was greater than that between individualsin the same positions in the size orders, but des-cended from different female parents. Thus, whilethe growth patterns of the two families were different,the factor which had the most marked influence onthe specific growth rate of the individual fish wastheir position in the size order of their group.
DISCUSSIONFactors influencing the growth rates of animals maybe of three types: genetical, physiological and en-vironmental. Higgins (1929) and Davis (1934)
Table 8. Comparison of the specific growth rates (as percentage weight per week) of fry with the same maleparent but different female parents
A, fry derived from alevins of weight 95 mg. descended from female A.B, fry derived from alevins of weight 90-100 mg. descended from female B.
Position in size order
Specific growth rate during weeks:0- 33" 88-14
14-2020-2626-33
Weight of fry in mg.:In week 20In week 33
1
A
260168n-64'595
106
H35S32O
B
24-8146157140958-6
20056960
S
A
23313-7" • 54'38-663
9852S5O
B
20813-213-8n-91036-8
12904160
15
A
20992916-3652-S
71099O
B
17-411297
10-57 110
95°1385
2 0
A
16-5797'43-53-5
530
B
15-28-55'78-i7-2
798
due to genetical factors inherited through the femaleparents.
The records for these two groups of fry show thattheir growth histories were not identical (Table 8).Those descended from female A had initially ahigher specific growth rate than fish with the sameposition in the size order of the other group. Duringthe third to eighth weeks, the two groups hadapproximately the same specific rates; in the eighthto twentieth weeks, the fry descended from female Bmaintained these rates while those of the other groupdecreased; after the twentieth week, the rates ofgrowth of the fry descended from female B fell to thesame level as those of the others. Twenty weeks afterthe beginning of feeding, the fry descended fromfemale B were markedly larger than individuals in thesame positions in the size order of the group des-cended from female A, and they continued to belarger during the next 3 months until the end of theexperiments.
showed that the average growth rate of Salvelinusfontinalis can be increased by selection of breedingstock for rapid growth, and they suggest that Salmotrutta and S. irideus are equally responsive to selec-tion. The results of the present experiments showedthat, even within the inbred'stock of a hatchery, off-spring of the same male but different female parentshave somewhat different patterns of growth.
Minot (1890) pointed out that for most animalsthe specific growth rate is highest early in life anddecreases, though with decreasing acceleration, asanimals increase in age and size. This negativeacceleration of specific growth rate depends on theage of trout fry, not their size, and may be partly aphysiological effect of ageing of the tissues.
It is generally assumed that environmental factorsare the most important of those concerned with thegrowth of fish. The principal physico-chemicalfactors are: temperature, amount and intensity ofillumination, rate of water flow and concentration of
128 MARGARET E. BROWN
gases and chemical substance in solution; the chiefbiotic factors are: quality and quantity of food andinter- and intraspecific relationships with other fish.Experimental work with salmonid fry has shown theimportance of light (Tryon, 1942) and of rate of waterflow (Washbourn, 1936). The effect of artificial foodson fry growth has been investigated in many hatch-eries, and Coleman (1930) found that raw liver wasthe best food.
Gray (1928) and Wood (1932) showed the im-portance of temperature during the development oftrout ova, and Gray (1926, 1928) also found a correla-tion between the embryonic specific growth rate ofS. fario, the amount of yolk and the size of the em-bryo. Ova with less yolk grew into perfect fish ofsmaller size than normal. Dahl (1918-19), Richmond(1924), Wilier, Quednau & Keller (1930) and Higgs(1942) all concluded that the size of the ova affects thegrowth rate of fry, larger ova giving rise to fry whichgrow faster. In the present experiments, alevinweight had little effect on specific growth rate. In onefamily, alevins of different sizes grew at the sameaverage specific rates, so that the larger alevins be-came slightly larger fry than the others; in the otherfamily, the smaller alevins had initially a higherspecific growth rate and grew into fry of the samesize as those derived from the larger alevins. How-ever, the range of aleyin weight used in these experi-ments was not so great as in those quoted above, andall the fish in the present experiments were closelyrelated to each other. The average size of ova isprobably characteristic of the female parent undernatural conditions (Richmond, 1924) and may beassociated with genetical factors which affect thegrowth rate of the fry.
The most important factor influencing the specificgrowth rates of individual fry proved to be the sizeof a fish relative to that of the others in the tank.Removal of larger fry resulted in increased specificgrowth rates of smaller ones, while addition of largerfry depressed the specific growth rates of smaller fry.This difference in growth rate, with the larger* fishgrowing faster than smaller ones, was found in everyexperimental group. Since the fry were allowed toeat as much as they would, competition for foodshould not have been the factor producing this effect,and, indeed, the smaller fish appeared to feed asreadily as larger ones. It seems possible that a'social hierarchy', depending on size, soon de-veloped within each group of trout fry, and that thisinfluenced the specific growth rates of the indi-viduals.
Observations on teleost fish with aggressive intra-specific behaviour have demonstrated that socialhierarchies may exist in groups of fish, as they do ingroups of other vertebrates such as hens (Schjelderup-Ebbe, 1922; Guhl & Allee, 1944). Noble and hiscollaborators (1938, 1939) have experimented withXiphopliorus, Hemickronds, Damo and other genera,while Braddock (1945) used Platypoecilus maculatus.
When two individuals of these species ^' challenge' each other and one may bite or ' rupHneother. After several encounters one becomes ' domi-nant' to the other and will nip it without beingnipped in return. Where several fish are kept together,they soon arrange themselves in a 'nip order', whichmay be a straight-line order or more complicated.Dominant fish tend to be larger than their subordi-nates, and may have better access to food and mates.They lose less weight during periods of starvation.Hierarchies of Platypoecilus last only 2 days on theaverage, but those of Xiphophorus may last for 2 or3 weeks. Fish which normally swim in schools areless aggressive and their hierarchies are probablymore complex and less easily investigated.
No aggressive behaviour comparable with nippingwas observed among trout fry, but soon after theybegan to feed they developed the habit of remainingin definite positions in each tank unless disturbed.When some range in size had been established, it waspossible to recognize individuals by their restingpositions. Moon (1936) records similar behaviouramong salmon parr in aquaria. Young trout fry aresometimes found in shoals in streams, and there is arange in specific growth rate among fry in the samestream. This can be shown by calculating their size atthe end of the first year, using the annuii on the scales.For Straffan (River Liffey), for example, Went &Frost (1942) record a minimum length of 3-8 cm.and a maximum length of 14-2 cm. (the averagebeing 8-6 cm.) at the end of the first year's growth.This difference in growth rate might be the result ofgenetical factors, or of the selective action of a factorsuch as food supply, but it might also result from theexistence of a size hierarchy in a stream, with correla-tion between the position of an individual and itsspecific growth rate. There is no evidence to indicatehow the specific growth rate of a fish may be affectedby its position in the hierarchy, either in streams or intanks. In smaller, less crowded groups, however, anindividual's specific growth rate depends not only onthe number of fish which are larger than itself, but onthe proportion of fish which are larger and smaller.
There is also an effect of crowding on specificgrowth rates, and those fry which are more crowdedthan the optimum density have a lower level ofgrowth rate. Retardation of growth by overcrowdingmay be caused by: (1) competition for a limited foodsupply, (2) mutual mechanical disturbance causingincreased activity and thus increased food require-ments, (3) accumulation in the water of excreta andother metabolic products. This last factor, the 'con-ditioning of the medium', occurs especially in con-fined spaces such as aquaria and fry ponds, and maybe beneficial to some extent (Allee et al. 1934, 1936,1940). The first factor, competition for a limited foodsupply, should not have been operative in the presentexperiments, but the second or third factor mightexplain the retarded growth of the more crowdedfish.
The growth of brown trout 129
*elow (1944) suggested that the population• of trout is greater in soft than in hard waters,
because of the superiority of spawning grounds andabsence of predatory species of fish. Frost (1945),however, found no evidence in support of thissuggestion for the River Liffey. The productivity ofthe limited volume of water in an aquarium is greatestfor a medium population density, if the food supply isnot limited, and increase in density leads to decreasein the level of specific growth rate. If the soft watersreally are overcrowded with trout fry, this could beone factor contributing to the differences in specificgrowth rate between fry in the two types of water.Since, however, fry in hatcheries grow less rapidly insoft waters, there may be a direct effect of thechemical composition of the water on the growth oftrout fry.
SUMMARY1. Groups of trout fry of the same parentage were
grown in environments where the following factorswere controlled: temperature, amount and intensityof illumination, rate of water flow, aeration andchemical composition of the water, amount of livingspace and quality of food supply. They were allowedto eat as much as they would, and individual weightswere recorded during the first 8 months after thebeginning of feeding.
2. There was soon an increase in the range of indi-vidual weight in each group of fry, and thereafter thelarger fry grew faster than smaller ones. When thelarger fry were removed, the smaller ones grew at an
increased specific rate, and when larger fry wereadded, the smaller ones grew more slowly. It issuggested that a ' size hierarchy' was establishedwithin each group, and an individual's specificgrowth rate depended on its position in the order ofdecreasing weight.
3. There was an optimum degree of crowding formaximum productivity. Compared with the fry inthis group, the specific growth rates of individuals inlarger, more crowded groups depended on thenumber of fish of larger size, while in smaller, lesscrowded groups, individuals grew at rates dependingon the proportion of fish which were larger andsmaller.
4. Alevin weight had little effect on the specificgrowth rates of fry.
5. There were differences between the growthhistories of fry derived from alevins of the same weightand descended from the same father but differentmothers (all of the same stock, age and size).
6. The specific growth rates decreased as the frygrew older, but there was no correlation betweenbody weight and specific growth rate, except for thesize hierarchy effect within each group. This effecthad a greater influence on the size of individual frythan had either alevin weight or heredity.
This work was carried out while holding a Re-search Studentship and later an Assistant Lectureshipat Girton College, Cambridge. I should like to thankProf. J. Gray, F.R.S., for his advice and encourage-ment throughout.
REFERENCES
ALL-EE, W. C , BOWEN, E. S., WELTY, J. C. & OESTING,R. B. (1934). J. Exp. Zool. 68, 183.
ALLEE, W. C , FINKEL, A. J. & HOSKINS, W. H. (1940).J. Exp. Zool. 84, 417.
ALLEE, W. C , OESTING, R. B. & HOSKINS, W. H. (1936).Pkytiol. ZoSl. 9, 409.
BRADDOCK, J. C. (1945). Phytiol. Z06I. 18, 176.COLEMAN, G. E. (1930). Calif. Fish Game, 16, 1.DAHL, K. (1918-19). Salm. Trout Mas. 17, 18. (English
summary of Studier og Forsok over Orret og Orretvand,1917.)
DAVIS, H. S. (1934). Trans. Amer. Fish. Soc. 64, 197.FROST, W. E. (1939). Proc. R. Irish Acad. B, 45, no. 7.FROST, W. E. (1945). Proc. R. Irish Acad. B, 50, no. 19.GRAY, J. (1926). J. Exp. Biol. 4, 215.GRAY, J. (1928). J. Exp. Biol. 6, n o , 125.GUHL, A. M. & ALLEE, W. C. (1944). PhysiolZodl. 17,320.HIGGINS, E. (1929). U.S. Dep. Commerce Fisheries
Document, 1096.HIGGS, O. (1942). Salm. Trout Mag. 106, 216.MCCAY, C. M. & TUNISON, A. V. (1935). Rep. Cortland
Hatchery, no. 3.MCCAY, C. M. & TUNISON, A. V. (1937). Rep. Cortland
Hatchery, no. 5.MINOT, C. S. (1890). Proc. Amer. Ass. 39, 21.MOON, H. P. (1936). Ann. Rep. Avon Biol. Res. 1935-36,
P-74-
NOBLE, G. K. (1939). Amer. Nat. 73, 113.NOBLE, G. K. & BORNE, R. (1938). Bull. Ecol. Soc. Amer.
19 (2), 14.NOBLE, G. K. & CURTIS, B. (1939). Bull. Amer. Mus.
Nat. Hist. 76, 1.PENTELOW, F. T. K. (1939). J. Exp. Biol. 16, 445.PENTELOW, F. T. K. (1944). Nature, Land., 153, 464.RAYMOND, C. J. (1938). Salm. Trout Mag. 93, 329.RICHMOND, F. G. (1924). Salm. Trout Mag. 31, 48.Salmon and Freshwater Fisheries Report (1936), p. 28.SCHJELDERUP-EBBE, T . (1922). Z. Psychol. 88, 225.SOUTHERN, R. (1932). Salm. Trout Mag. 67, 68
and 69.SOUTHERN, R. (1935). Proc. R. Irish Acad. 42, 87.SWYNNERTON, G. & WORTHINGTON, E. B. ,(1939). Salm.
Trout Mag. 97, 337.TRYON, C. A. (1942). Trans. Amer. Fish. Soc. 7a, 145.WASHBOURN, R. M. (1936). J. Exp. Biol. 13, 145.WENT, A. E. J. (1943). Proc. R. Irish Acad. 49, 269.WENT, A. E. J. & FROST, W. E. (1942). Proc. R. Irish
Acad. 48, 67.WlLLER, A., QUEDNAU, W. & KELLER, A. (1930). Z.
Fisch. 28, 565.WINGFIELD, C. A. (1940). J. Exp. Biol. 17, 435.WOOD, A. H. (1932). J. Exp. Biol. 9, 271.