Embed Size (px)
Citation preview
24 Marine Fisheries Review
The Humpback Whale
Introduction
The humpback whale, Megapteranovaeangliae Borowski 1781, is amember of the Balaenopteridae family,a group of baleen whales commonlyknown as rorquals. The humpbackwhale is of medium size relative to theother large whales, reaching a length of15 m and a weight of about 34 metrictons (t) at maturity. Humpback whalesare characterized by wing-like pectoralflippers that are from one-fourth to one-third their total body length, heads cov-ered in bumps known as tubercles, andtail flukes with individually identifiabletrailing-edge patterns (Fig. 15). Likeother balaenopterids, they have fringedbaleen plates instead of teeth which al-low for the filtering of small crustaceansand fish. Deep grooves on the ventralsurface allow for throat expansion, in-creasing the volume of water that canbe engulfed and then filtered throughthe baleen.
Humpback whales display a widerange of above-water behaviors, such aswhole-body breaches, lob-tailing, andlunging. These behaviors are usuallyassociated with breeding and feedingactivities (Ward, 1995) (Fig. 16). These
whales also have a distinctive and var-ied acoustic repertoire consisting ofcomplex “songs” that may last severalhours and contain phrases which aredistinct between individuals and varyamong geographic areas.
In general, most humpback whalesspend the summer feeding in high-lati-tude waters and then migrate long dis-tances into low-latitude tropical watersfor the winter where they breed andcalve. Calving takes place in shallowcoastal waters along continental shelvesand off some oceanic islands.
Distribution and Migration
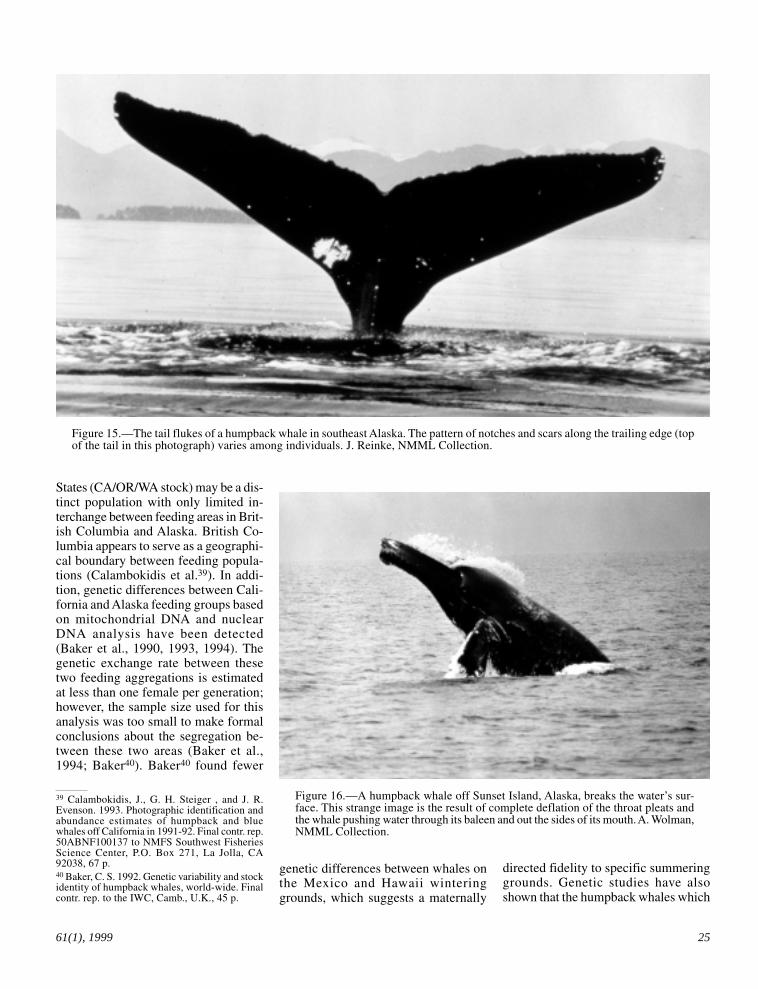
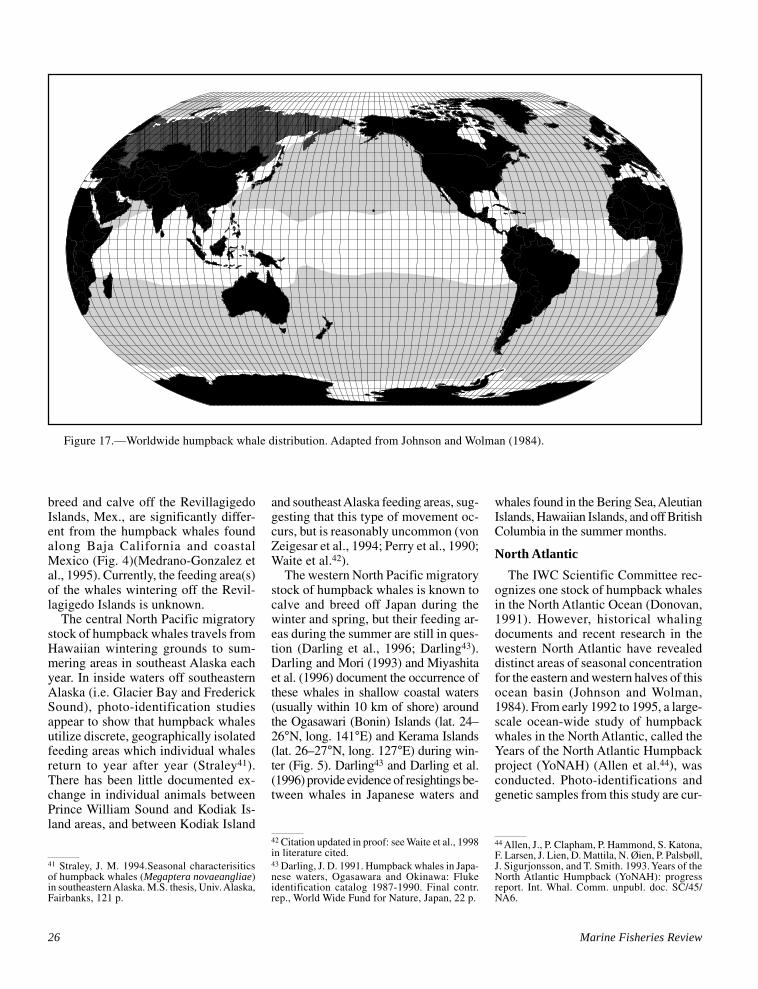
Humpback whales inhabit all majorocean basins from the equator to sub-polar latitudes (Fig. 17). They generallyfollow a predictable migratory patternin both hemispheres, feeding during thesummer in the higher near-polar lati-tudes and then during the winter migrat-ing to the lower latitudes where calv-ing and breeding takes place. Their mi-gratory movements have been tracedthrough recovery of Discovery tags38
during commercial whaling operations.More recently, comparisons of photo-graphs, songs, and genetic material be-tween different geographical areas have
led scientists toward a better understand-ing of the stock structure of these whales.
North Pacific
The IWC has designated one stockof humpback whales in the North Pa-cific Ocean (Donovan, 1991). Thesewhales range widely across the entireNorth Pacific during the summermonths—south to Point Conception,Calif., and north into the Bering Sea(Johnson and Wolman, 1984).
Recent, on-going photo-identifica-tion and genetic studies reveal what maybe separate stocks of humpback whaleswithin the North Pacific basin that arenot apparent from any geographicalseparation. There are known calvingand breeding grounds off Mexico,among the Hawaiian Islands, and offJapan. Known feeding grounds exist offCalifornia, Oregon, and Washington(CA/OR/WA), in the Bering Sea, alongthe Aleutian Islands, and in southeast-ern Alaska (Fig. 4). Barlow (1994b) listsfour separate migratory stocks of hump-back whales in the North Pacific basedon current resightings, genetic analysis,and historical whaling records (Table 8).
Calambokidis et al. (1996) haveshown through photographic mark-re-capture analysis that the summer feed-ing aggregations off the western United
38 Discovery tags were shot into individual whalesduring whaling operations. The tag was a steelrod 23 cm in length and 1.5 cm in diameter witha lead tip and was fired from a modified 12-gaugeshotgun. Such marking began in 1949, althoughit was geographically limited to the SouthernHemisphere (until 1979) and North Pacific (un-til 1980) (Brown, 1981; Ivashin, 1983).
Table 8.—North Pacific humpback whale stocks.
Winter areas (breeding/calving) Summer areas (feeding) Source
Mexico (Mainland, Baja California, CA/OR/WA Steiger et al., 1991; Barlow et al., 1997;Gulf of California), Costa Rica Clapham et al., 1997
Offshore Mexico-Islas Revillagigedo Unknown Medrano-Gonzalez et al., 1995
Central North Pacific–Hawaii Alaska–Prince William Sound Baker et al., 1994; Barlow et al., 1997to British Columbia
Western North Pacific–Japan, Taiwan Bering Sea, Aleutian Islands– Darling et al., 1996west of Kodiak Archipelago
61(1), 1999 25
Figure 15.—The tail flukes of a humpback whale in southeast Alaska. The pattern of notches and scars along the trailing edge (topof the tail in this photograph) varies among individuals. J. Reinke, NMML Collection.
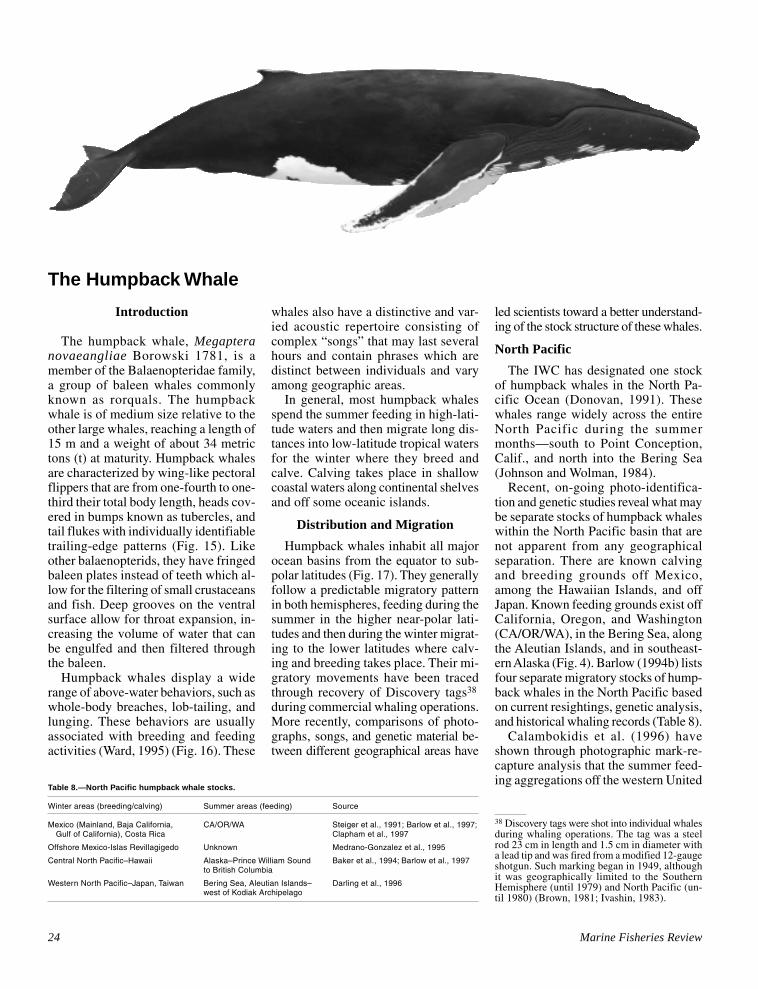
Figure 16.—A humpback whale off Sunset Island, Alaska, breaks the water’s sur-face. This strange image is the result of complete deflation of the throat pleats andthe whale pushing water through its baleen and out the sides of its mouth. A. Wolman,NMML Collection.
39 Calambokidis, J., G. H. Steiger , and J. R.Evenson. 1993. Photographic identification andabundance estimates of humpback and bluewhales off California in 1991-92. Final contr. rep.50ABNF100137 to NMFS Southwest FisheriesScience Center, P.O. Box 271, La Jolla, CA92038, 67 p.40 Baker, C. S. 1992. Genetic variability and stockidentity of humpback whales, world-wide. Finalcontr. rep. to the IWC, Camb., U.K., 45 p.
States (CA/OR/WA stock) may be a dis-tinct population with only limited in-terchange between feeding areas in Brit-ish Columbia and Alaska. British Co-lumbia appears to serve as a geographi-cal boundary between feeding popula-tions (Calambokidis et al.39). In addi-tion, genetic differences between Cali-fornia and Alaska feeding groups basedon mitochondrial DNA and nuclearDNA analysis have been detected(Baker et al., 1990, 1993, 1994). Thegenetic exchange rate between thesetwo feeding aggregations is estimatedat less than one female per generation;however, the sample size used for thisanalysis was too small to make formalconclusions about the segregation be-tween these two areas (Baker et al.,1994; Baker40). Baker40 found fewer
genetic differences between whales onthe Mexico and Hawaii winteringgrounds, which suggests a maternally
directed fidelity to specific summeringgrounds. Genetic studies have alsoshown that the humpback whales which
26 Marine Fisheries Review
Figure 17.—Worldwide humpback whale distribution. Adapted from Johnson and Wolman (1984).
breed and calve off the RevillagigedoIslands, Mex., are significantly differ-ent from the humpback whales foundalong Baja California and coastalMexico (Fig. 4)(Medrano-Gonzalez etal., 1995). Currently, the feeding area(s)of the whales wintering off the Revil-lagigedo Islands is unknown.
The central North Pacific migratorystock of humpback whales travels fromHawaiian wintering grounds to sum-mering areas in southeast Alaska eachyear. In inside waters off southeasternAlaska (i.e. Glacier Bay and FrederickSound), photo-identification studiesappear to show that humpback whalesutilize discrete, geographically isolatedfeeding areas which individual whalesreturn to year after year (Straley41).There has been little documented ex-change in individual animals betweenPrince William Sound and Kodiak Is-land areas, and between Kodiak Island
42 Citation updated in proof: see Waite et al., 1998in literature cited.43 Darling, J. D. 1991. Humpback whales in Japa-nese waters, Ogasawara and Okinawa: Flukeidentification catalog 1987-1990. Final contr.rep., World Wide Fund for Nature, Japan, 22 p.
and southeast Alaska feeding areas, sug-gesting that this type of movement oc-curs, but is reasonably uncommon (vonZeigesar et al., 1994; Perry et al., 1990;Waite et al.42).
The western North Pacific migratorystock of humpback whales is known tocalve and breed off Japan during thewinter and spring, but their feeding ar-eas during the summer are still in ques-tion (Darling et al., 1996; Darling43).Darling and Mori (1993) and Miyashitaet al. (1996) document the occurrence ofthese whales in shallow coastal waters(usually within 10 km of shore) aroundthe Ogasawari (Bonin) Islands (lat. 24–26°N, long. 141°E) and Kerama Islands(lat. 26–27°N, long. 127°E) during win-ter (Fig. 5). Darling43 and Darling et al.(1996) provide evidence of resightings be-tween whales in Japanese waters and
whales found in the Bering Sea, AleutianIslands, Hawaiian Islands, and off BritishColumbia in the summer months.
North Atlantic
The IWC Scientific Committee rec-ognizes one stock of humpback whalesin the North Atlantic Ocean (Donovan,1991). However, historical whalingdocuments and recent research in thewestern North Atlantic have revealeddistinct areas of seasonal concentrationfor the eastern and western halves of thisocean basin (Johnson and Wolman,1984). From early 1992 to 1995, a large-scale ocean-wide study of humpbackwhales in the North Atlantic, called theYears of the North Atlantic Humpbackproject (YoNAH) (Allen et al.44), wasconducted. Photo-identifications andgenetic samples from this study are cur-
44 Allen, J., P. Clapham, P. Hammond, S. Katona,F. Larsen, J. Lien, D. Mattila, N. Øien, P. Palsbøll,J. Sigurjonsson, and T. Smith. 1993. Years of theNorth Atlantic Humpback (YoNAH): progressreport. Int. Whal. Comm. unpubl. doc. SC/45/NA6.
41 Straley, J. M. 1994.Seasonal characterisiticsof humpback whales (Megaptera novaeangliae)in southeastern Alaska. M.S. thesis, Univ. Alaska,Fairbanks, 121 p.
61(1), 1999 27
rently being analyzed in order to betterdetermine the current population statusand genetic relationships of North At-lantic humpback whales.
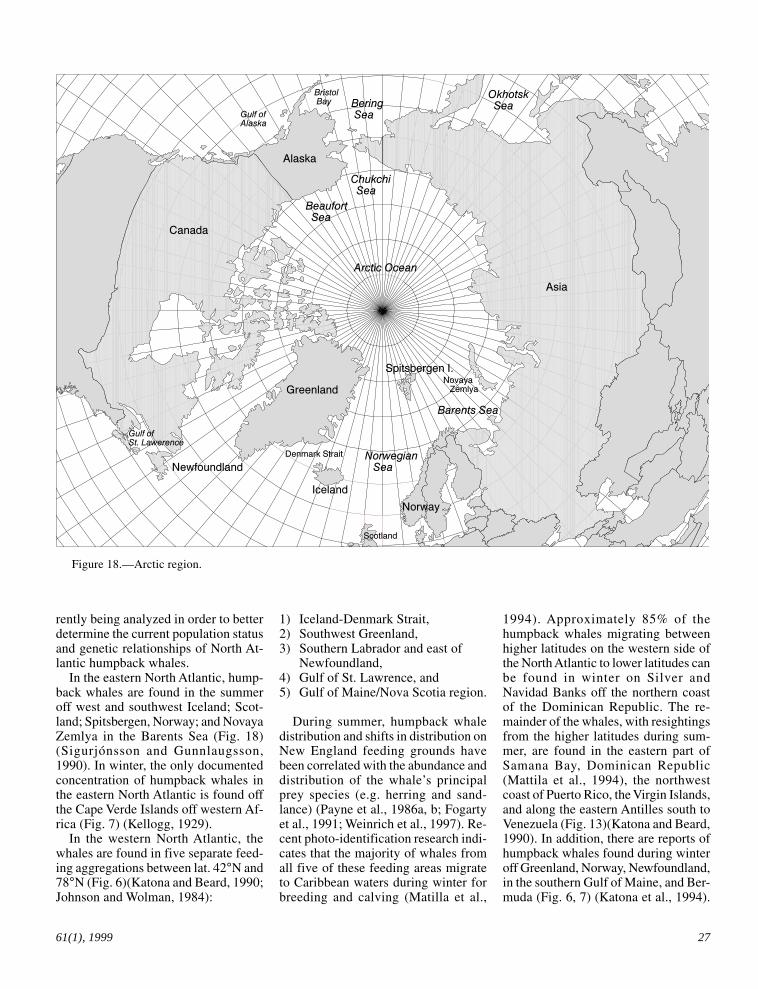
In the eastern North Atlantic, hump-back whales are found in the summeroff west and southwest Iceland; Scot-land; Spitsbergen, Norway; and NovayaZemlya in the Barents Sea (Fig. 18)(Sigurjónsson and Gunnlaugsson,1990). In winter, the only documentedconcentration of humpback whales inthe eastern North Atlantic is found offthe Cape Verde Islands off western Af-rica (Fig. 7) (Kellogg, 1929).
In the western North Atlantic, thewhales are found in five separate feed-ing aggregations between lat. 42°N and78°N (Fig. 6)(Katona and Beard, 1990;Johnson and Wolman, 1984):
Figure 18.—Arctic region.
1) Iceland-Denmark Strait,2) Southwest Greenland,3) Southern Labrador and east of
Newfoundland,4) Gulf of St. Lawrence, and5) Gulf of Maine/Nova Scotia region.
During summer, humpback whaledistribution and shifts in distribution onNew England feeding grounds havebeen correlated with the abundance anddistribution of the whale’s principalprey species (e.g. herring and sand-lance) (Payne et al., 1986a, b; Fogartyet al., 1991; Weinrich et al., 1997). Re-cent photo-identification research indi-cates that the majority of whales fromall five of these feeding areas migrateto Caribbean waters during winter forbreeding and calving (Matilla et al.,
1994). Approximately 85% of thehumpback whales migrating betweenhigher latitudes on the western side ofthe North Atlantic to lower latitudes canbe found in winter on Silver andNavidad Banks off the northern coastof the Dominican Republic. The re-mainder of the whales, with resightingsfrom the higher latitudes during sum-mer, are found in the eastern part ofSamana Bay, Dominican Republic(Mattila et al., 1994), the northwestcoast of Puerto Rico, the Virgin Islands,and along the eastern Antilles south toVenezuela (Fig. 13)(Katona and Beard,1990). In addition, there are reports ofhumpback whales found during winteroff Greenland, Norway, Newfoundland,in the southern Gulf of Maine, and Ber-muda (Fig. 6, 7) (Katona et al., 1994).
28 Marine Fisheries Review
These reports from higher latitudes dur-ing winter suggest that not all whalesmigrate each year, perhaps taking ad-vantage of unusual prey occurrences ordemonstrating year-round, regional sitefidelity (Clapham et al., 1993).
In addition to photo-identificationstudies, genetic research into the influ-ence of seasonal migration on the geo-graphic distribution of mitochondrialDNA haplotypes revealed what appearsto be a maternally directed site fidelityto specific feeding grounds (Baker etal., 1990), as in the North Pacific. How-ever, resightings have shown that inter-breeding could be occurring during win-ter, when whales that were segregated onthe summer feeding grounds (Claphamet al., 1992; Katona, 1986) congregatein the tropical latitudes.
Northern Indian Ocean
The humpback whale population inthe Arabian Sea (Fig. 14), unlike otherpopulations, does not migrate to tem-perate waters as part of their annualcycle. Instead, they both feed and breedin tropical waters (Mikhaliev, 1997).However, little or no research has beenconducted on this unique population, soinformation on their current abundanceand trends does not exist.
Southern Hemisphere
The six baleen whale areas desig-nated by the IWC (Donovan, 1991) forstock management purposes are alsoused to separate Southern Hemispherehumpback whale stocks (Fig. 9). Theseareas loosely correspond to knownhumpback whale wintering and sum-mering areas from sighting and mark-recapture data (Mackintosh, 1942). Inthe austral winter, the whales are foundalong the tropical and western sides ofeach continent, along eastern coastlines,and around island groups. One suchwintering area exists off Brazil onAbrolhos Bank (Siciliano, 1995). Dur-ing the austral summer months, they arefound in South Georgia, the SouthShetlands, and along the west and eastcoasts of Africa, Australia, and SouthAmerica (Dawbin, 1966). Most migra-tory paths for the southern humpbackwhales are unknown. Movements ofhumpback whales along the South Af-
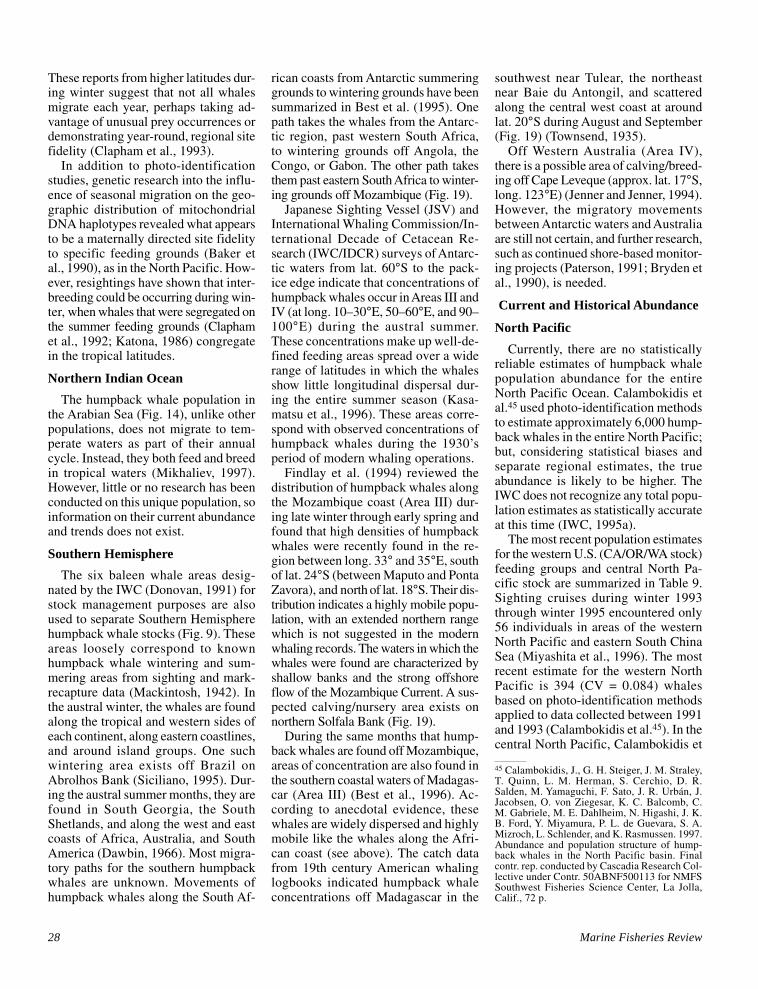
rican coasts from Antarctic summeringgrounds to wintering grounds have beensummarized in Best et al. (1995). Onepath takes the whales from the Antarc-tic region, past western South Africa,to wintering grounds off Angola, theCongo, or Gabon. The other path takesthem past eastern South Africa to winter-ing grounds off Mozambique (Fig. 19).
Japanese Sighting Vessel (JSV) andInternational Whaling Commission/In-ternational Decade of Cetacean Re-search (IWC/IDCR) surveys of Antarc-tic waters from lat. 60°S to the pack-ice edge indicate that concentrations ofhumpback whales occur in Areas III andIV (at long. 10–30°E, 50–60°E, and 90–100°E) during the austral summer.These concentrations make up well-de-fined feeding areas spread over a widerange of latitudes in which the whalesshow little longitudinal dispersal dur-ing the entire summer season (Kasa-matsu et al., 1996). These areas corre-spond with observed concentrations ofhumpback whales during the 1930’speriod of modern whaling operations.
Findlay et al. (1994) reviewed thedistribution of humpback whales alongthe Mozambique coast (Area III) dur-ing late winter through early spring andfound that high densities of humpbackwhales were recently found in the re-gion between long. 33° and 35°E, southof lat. 24°S (between Maputo and PontaZavora), and north of lat. 18°S. Their dis-tribution indicates a highly mobile popu-lation, with an extended northern rangewhich is not suggested in the modernwhaling records. The waters in which thewhales were found are characterized byshallow banks and the strong offshoreflow of the Mozambique Current. A sus-pected calving/nursery area exists onnorthern Solfala Bank (Fig. 19).
During the same months that hump-back whales are found off Mozambique,areas of concentration are also found inthe southern coastal waters of Madagas-car (Area III) (Best et al., 1996). Ac-cording to anecdotal evidence, thesewhales are widely dispersed and highlymobile like the whales along the Afri-can coast (see above). The catch datafrom 19th century American whalinglogbooks indicated humpback whaleconcentrations off Madagascar in the
southwest near Tulear, the northeastnear Baie du Antongil, and scatteredalong the central west coast at aroundlat. 20°S during August and September(Fig. 19) (Townsend, 1935).
Off Western Australia (Area IV),there is a possible area of calving/breed-ing off Cape Leveque (approx. lat. 17°S,long. 123°E) (Jenner and Jenner, 1994).However, the migratory movementsbetween Antarctic waters and Australiaare still not certain, and further research,such as continued shore-based monitor-ing projects (Paterson, 1991; Bryden etal., 1990), is needed.
Current and Historical Abundance
North Pacific
Currently, there are no statisticallyreliable estimates of humpback whalepopulation abundance for the entireNorth Pacific Ocean. Calambokidis etal.45 used photo-identification methodsto estimate approximately 6,000 hump-back whales in the entire North Pacific;but, considering statistical biases andseparate regional estimates, the trueabundance is likely to be higher. TheIWC does not recognize any total popu-lation estimates as statistically accurateat this time (IWC, 1995a).
The most recent population estimatesfor the western U.S. (CA/OR/WA stock)feeding groups and central North Pa-cific stock are summarized in Table 9.Sighting cruises during winter 1993through winter 1995 encountered only56 individuals in areas of the westernNorth Pacific and eastern South ChinaSea (Miyashita et al., 1996). The mostrecent estimate for the western NorthPacific is 394 (CV = 0.084) whalesbased on photo-identification methodsapplied to data collected between 1991and 1993 (Calambokidis et al.45). In thecentral North Pacific, Calambokidis et
45 Calambokidis, J., G. H. Steiger, J. M. Straley,T. Quinn, L. M. Herman, S. Cerchio, D. R.Salden, M. Yamaguchi, F. Sato, J. R. Urbán, J.Jacobsen, O. von Ziegesar, K. C. Balcomb, C.M. Gabriele, M. E. Dahlheim, N. Higashi, J. K.B. Ford, Y. Miyamura, P. L. de Guevara, S. A.Mizroch, L. Schlender, and K. Rasmussen. 1997.Abundance and population structure of hump-back whales in the North Pacific basin. Finalcontr. rep. conducted by Cascadia Research Col-lective under Contr. 50ABNF500113 for NMFSSouthwest Fisheries Science Center, La Jolla,Calif., 72 p.
61(1), 1999 29
Figure 19.—Possible humpback whale migratory paths around southern Africa. Adapted from Best et al. (1995).
al.45 used the same photo-identificationmethods applied to the western NorthPacific whales and arrived at an estimateof 4,005 (CV = 0.095) in this region.
Before 1905, there were an estimated15,000 humpback whales in the entireNorth Pacific (Rice, 1978a). Afterheavy exploitation, in 1966 this popu-lation was estimated at between 1,000(Rice, 1978a) and 1,200 animals (Johnsonand Wolman, 1984), although it is notclear whether these estimates representthe entire North Pacific or only the east-ern North Pacific.
North Atlantic
Current estimates of North Atlantichumpback whale abundance are sum-
marized in Table 9 by geographic area.In 1986, the IWC recognized a current“best” estimate of 5,561 (S.E. = 570,CV = 0.103) whales for the North At-lantic west of Iceland (IWC, 1986b). Incontrast, Gunnlaugsson and Sigur-jónsson (1990) estimated from sightingsurveys west and southwest of Iceland,that less than 2,000 humpback whalesinhabited those waters. Smith et al.46
summarized some of the main findingsfrom the YoNAH project, as well as
other regionally based studies in theNorth Atlantic. For example, Palsbøllet al. (1997) used genetic data to esti-mate 7,698 humpback whales in theeastern North Atlantic. In the Smith etal.46 summary, it is suggested that thenew data generated by the YoNAHproject may provide a solid base for acomprehensive assessment of the NorthAtlantic humpback whale’s status by theIWC’s Scientific Committee. In 1999,Smith et al.11 arrived at an estimate of10,600 (CV=0.067) humpback whalesin the North Atlantic based on mark-recapture analysis of photographicallyidentified animals.
An initial population estimate of4,700 whales was derived from all whal-
46 Smith, T. D., P. S. Hammond, N. Friday, andP. J. Clapham. 1997. Status of information onthe North Atlantic humpback whale. Unpubl. doc.SC/49/NA8, submitted to Rep. Int. Whal. Comm.,4 p.
30 Marine Fisheries Review
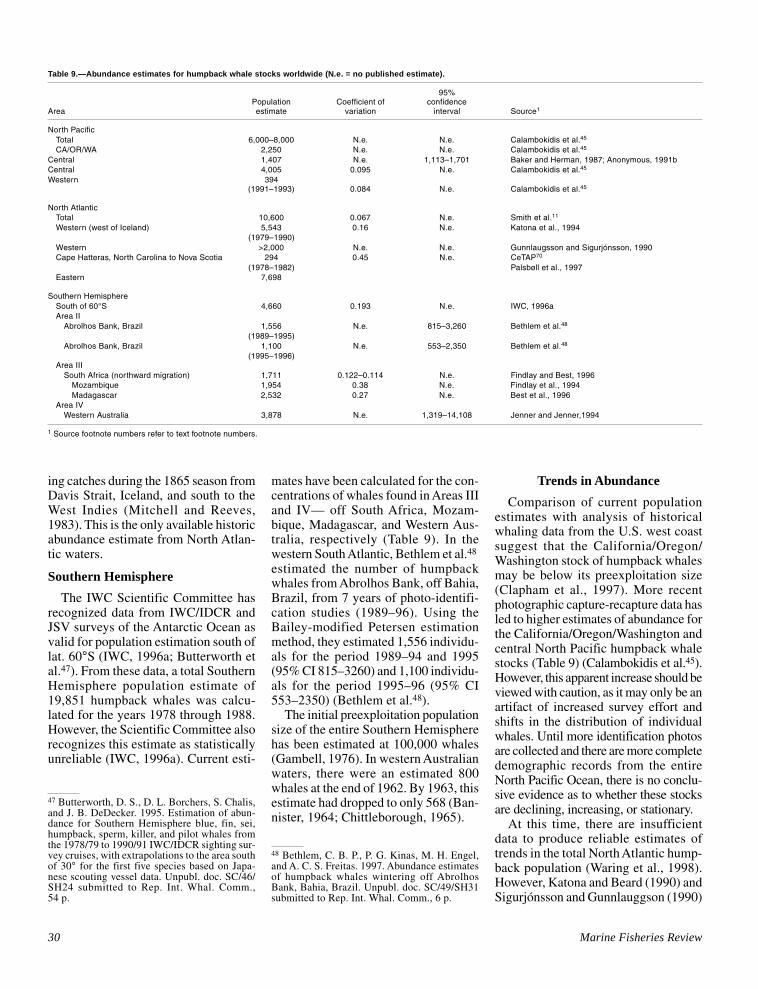
Table 9.—Abundance estimates for humpback whale stocks worldwide (N.e. = no published estimate).
95%Population Coefficient of confidence
Area estimate variation interval Source1
North PacificTotal 6,000–8,000 N.e. N.e. Calambokidis et al.45
CA/OR/WA 2,250 N.e. N.e. Calambokidis et al.45
Central 1,407 N.e. 1,113–1,701 Baker and Herman, 1987; Anonymous, 1991bCentral 4,005 0.095 N.e. Calambokidis et al.45
Western 394(1991–1993) 0.084 N.e. Calambokidis et al.45
North AtlanticTotal 10,600 0.067 N.e. Smith et al.11
Western (west of Iceland) 5,543 0.16 N.e. Katona et al., 1994(1979–1990)
Western >2,000 N.e. N.e. Gunnlaugsson and Sigurjónsson, 1990Cape Hatteras, North Carolina to Nova Scotia 294 0.45 N.e. CeTAP70
(1978–1982) Palsbøll et al., 1997Eastern 7,698
Southern HemisphereSouth of 60°S 4,660 0.193 N.e. IWC, 1996aArea II
Abrolhos Bank, Brazil 1,556 N.e. 815–3,260 Bethlem et al.48
(1989–1995)Abrolhos Bank, Brazil 1,100 N.e. 553–2,350 Bethlem et al.48
(1995–1996)Area III
South Africa (northward migration) 1,711 0.122–0.114 N.e. Findlay and Best, 1996Mozambique 1,954 0.38 N.e. Findlay et al., 1994Madagascar 2,532 0.27 N.e. Best et al., 1996
Area IVWestern Australia 3,878 N.e. 1,319–14,108 Jenner and Jenner,1994
1 Source footnote numbers refer to text footnote numbers.
ing catches during the 1865 season fromDavis Strait, Iceland, and south to theWest Indies (Mitchell and Reeves,1983). This is the only available historicabundance estimate from North Atlan-tic waters.
Southern Hemisphere
The IWC Scientific Committee hasrecognized data from IWC/IDCR andJSV surveys of the Antarctic Ocean asvalid for population estimation south oflat. 60°S (IWC, 1996a; Butterworth etal.47). From these data, a total SouthernHemisphere population estimate of19,851 humpback whales was calcu-lated for the years 1978 through 1988.However, the Scientific Committee alsorecognizes this estimate as statisticallyunreliable (IWC, 1996a). Current esti-
mates have been calculated for the con-centrations of whales found in Areas IIIand IV— off South Africa, Mozam-bique, Madagascar, and Western Aus-tralia, respectively (Table 9). In thewestern South Atlantic, Bethlem et al.48
estimated the number of humpbackwhales from Abrolhos Bank, off Bahia,Brazil, from 7 years of photo-identifi-cation studies (1989–96). Using theBailey-modified Petersen estimationmethod, they estimated 1,556 individu-als for the period 1989–94 and 1995(95% CI 815–3260) and 1,100 individu-als for the period 1995–96 (95% CI553–2350) (Bethlem et al.48).
The initial preexploitation populationsize of the entire Southern Hemispherehas been estimated at 100,000 whales(Gambell, 1976). In western Australianwaters, there were an estimated 800whales at the end of 1962. By 1963, thisestimate had dropped to only 568 (Ban-nister, 1964; Chittleborough, 1965).
Trends in Abundance
Comparison of current populationestimates with analysis of historicalwhaling data from the U.S. west coastsuggest that the California/Oregon/Washington stock of humpback whalesmay be below its preexploitation size(Clapham et al., 1997). More recentphotographic capture-recapture data hasled to higher estimates of abundance forthe California/Oregon/Washington andcentral North Pacific humpback whalestocks (Table 9) (Calambokidis et al.45).However, this apparent increase should beviewed with caution, as it may only be anartifact of increased survey effort andshifts in the distribution of individualwhales. Until more identification photosare collected and there are more completedemographic records from the entireNorth Pacific Ocean, there is no conclu-sive evidence as to whether these stocksare declining, increasing, or stationary.
At this time, there are insufficientdata to produce reliable estimates oftrends in the total North Atlantic hump-back population (Waring et al., 1998).However, Katona and Beard (1990) andSigurjónsson and Gunnlauggson (1990)
47 Butterworth, D. S., D. L. Borchers, S. Chalis,and J. B. DeDecker. 1995. Estimation of abun-dance for Southern Hemisphere blue, fin, sei,humpback, sperm, killer, and pilot whales fromthe 1978/79 to 1990/91 IWC/IDCR sighting sur-vey cruises, with extrapolations to the area southof 30° for the first five species based on Japa-nese scouting vessel data. Unpubl. doc. SC/46/SH24 submitted to Rep. Int. Whal. Comm.,54 p.
48 Bethlem, C. B. P., P. G. Kinas, M. H. Engel,and A. C. S. Freitas. 1997. Abundance estimatesof humpback whales wintering off AbrolhosBank, Bahia, Brazil. Unpubl. doc. SC/49/SH31submitted to Rep. Int. Whal. Comm., 6 p.
61(1), 1999 31
have suggested annual rates of increasefrom 9.0% to 14.8%, respectively.Barlow and Clapham (1997) used birthintervals to estimate a populationgrowth rate of 6.5% (±1.2) for the Gulfof Maine humpback whale population.Estimated rates of net increase rangefrom 3.9% to 11.8% for the westernNorth Atlantic (Whitehead, 1982).
Trends in abundance in the SouthernHemisphere show an annual rate of in-crease in both western Australia (Ban-nister et al., 1991; Bannister, 1994) andsouthern Madagascar (Best et al., 1996).The western Australian population’srecovery has been well documented,with a “best” estimate of annual ratesof increase at 8.8% (±5.8%) for theyears 1963–76, and at 10.9% (±3.0%)for the years 1963–91. Within Areas IVand V, annual rates of increase havebeen estimated at 8.9% and 56.6%, re-spectively, for the years 1988–96 (IWC,1996a). The Southern Hemisphere AreaIV stock has shown rates of increasebetween 10.3% and 13.1% since themid 1960’s (Chittleborough, 1965). Allof these rates are considered unreliablepending greater accuracy in determin-ing age at sexual maturity and exactcalving intervals for this species.
Historic Exploitation Patterns
North Pacific
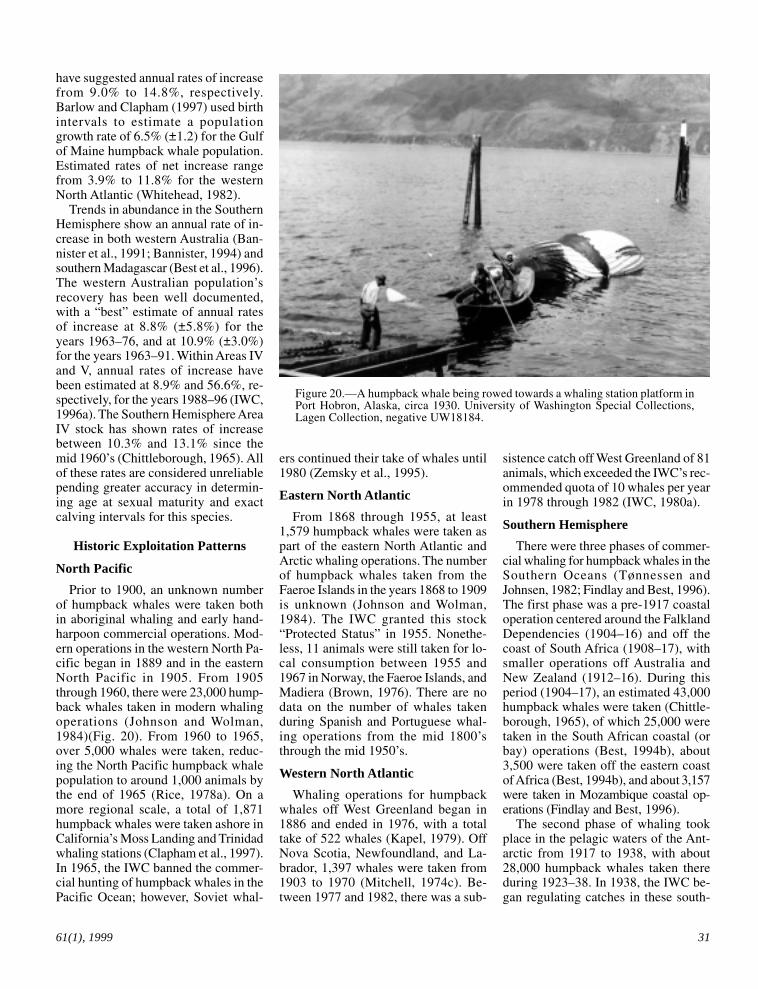
Prior to 1900, an unknown numberof humpback whales were taken bothin aboriginal whaling and early hand-harpoon commercial operations. Mod-ern operations in the western North Pa-cific began in 1889 and in the easternNorth Pacific in 1905. From 1905through 1960, there were 23,000 hump-back whales taken in modern whalingoperations (Johnson and Wolman,1984)(Fig. 20). From 1960 to 1965,over 5,000 whales were taken, reduc-ing the North Pacific humpback whalepopulation to around 1,000 animals bythe end of 1965 (Rice, 1978a). On amore regional scale, a total of 1,871humpback whales were taken ashore inCalifornia’s Moss Landing and Trinidadwhaling stations (Clapham et al., 1997).In 1965, the IWC banned the commer-cial hunting of humpback whales in thePacific Ocean; however, Soviet whal-
ers continued their take of whales until1980 (Zemsky et al., 1995).
Eastern North Atlantic
From 1868 through 1955, at least1,579 humpback whales were taken aspart of the eastern North Atlantic andArctic whaling operations. The numberof humpback whales taken from theFaeroe Islands in the years 1868 to 1909is unknown (Johnson and Wolman,1984). The IWC granted this stock“Protected Status” in 1955. Nonethe-less, 11 animals were still taken for lo-cal consumption between 1955 and1967 in Norway, the Faeroe Islands, andMadiera (Brown, 1976). There are nodata on the number of whales takenduring Spanish and Portuguese whal-ing operations from the mid 1800’sthrough the mid 1950’s.
Western North Atlantic
Whaling operations for humpbackwhales off West Greenland began in1886 and ended in 1976, with a totaltake of 522 whales (Kapel, 1979). OffNova Scotia, Newfoundland, and La-brador, 1,397 whales were taken from1903 to 1970 (Mitchell, 1974c). Be-tween 1977 and 1982, there was a sub-
sistence catch off West Greenland of 81animals, which exceeded the IWC’s rec-ommended quota of 10 whales per yearin 1978 through 1982 (IWC, 1980a).
Southern Hemisphere
There were three phases of commer-cial whaling for humpback whales in theSouthern Oceans (Tønnessen andJohnsen, 1982; Findlay and Best, 1996).The first phase was a pre-1917 coastaloperation centered around the FalklandDependencies (1904–16) and off thecoast of South Africa (1908–17), withsmaller operations off Australia andNew Zealand (1912–16). During thisperiod (1904–17), an estimated 43,000humpback whales were taken (Chittle-borough, 1965), of which 25,000 weretaken in the South African coastal (orbay) operations (Best, 1994b), about3,500 were taken off the eastern coastof Africa (Best, 1994b), and about 3,157were taken in Mozambique coastal op-erations (Findlay and Best, 1996).
The second phase of whaling tookplace in the pelagic waters of the Ant-arctic from 1917 to 1938, with about28,000 humpback whales taken thereduring 1923–38. In 1938, the IWC be-gan regulating catches in these south-
Figure 20.—A humpback whale being rowed towards a whaling station platform inPort Hobron, Alaska, circa 1930. University of Washington Special Collections,Lagen Collection, negative UW18184.
32 Marine Fisheries Review
ern waters (Findlay and Best, 1996;Mizroch et al.49).
The third phase of whaling in theSouthern Hemisphere was marked bypost-1938 coastal whaling operations.These operations were centered in Aus-tralian and New Zealand waters, whereapproximately 22,000 humpback whaleswere taken. From 1937 to 1950, therewere 5,019 humpback whales taken offsouthern Madagascar (Best et al., 1996;
Table 10.—Total number of whales killed in the NorthAtlantic from 1988 to 1995 (IWC Ann. Rep., 1988–89 to1994–95)
North Atlantic stocks Humpback Fin Sei
Denmark 4West Greenland 1 103East Greenland 2
Iceland1 136 10
St. Vincent and the Grenadines 4
Total strikes 9 239 12
Total kills 8 239 12
1 Iceland did not report to the IWC after the 1989–90 season.
49 Mizroch, S. A., D. W. Rice, and S. Larson.1992. Distribution of rorquals in the SouthernOcean: an atlas based on pelagic catch data.Unpubl. doc. SC/44/SHB17 submitted to Rep.Int. Whal. Comm., 40 p.
Findlay and Best, 1996). From 1953 to1963, the pelagic whaling operations inthe Antarctic were limited to only 4 daysper year by IWC regulations (Findlayand Best, 1996; Mizroch et al.49).
Current Exploitation
Table 10 summarizes the North At-lantic take of humpback whales in theseasons 1988–89 to 1994–95. Duringthis period, there were reports of eighthumpback whales taken and one struckand lost in the western North Atlanticfor subsistence purposes50 off West andEast Greenland and St. Vincent and TheGrenadines (IWC, 1996a).
Worldwide protection of humpbackwhales began in 1966, although by 1963the IWC had already given these whales“Protected Status” in the SouthernHemisphere. Despite the official end toSouthern Hemisphere whaling forhumpback whales in 1963, some takesstill occurred until 1980. In 1978, therewas an aboriginal catch of 12 animals,including 3 calves, in the western South
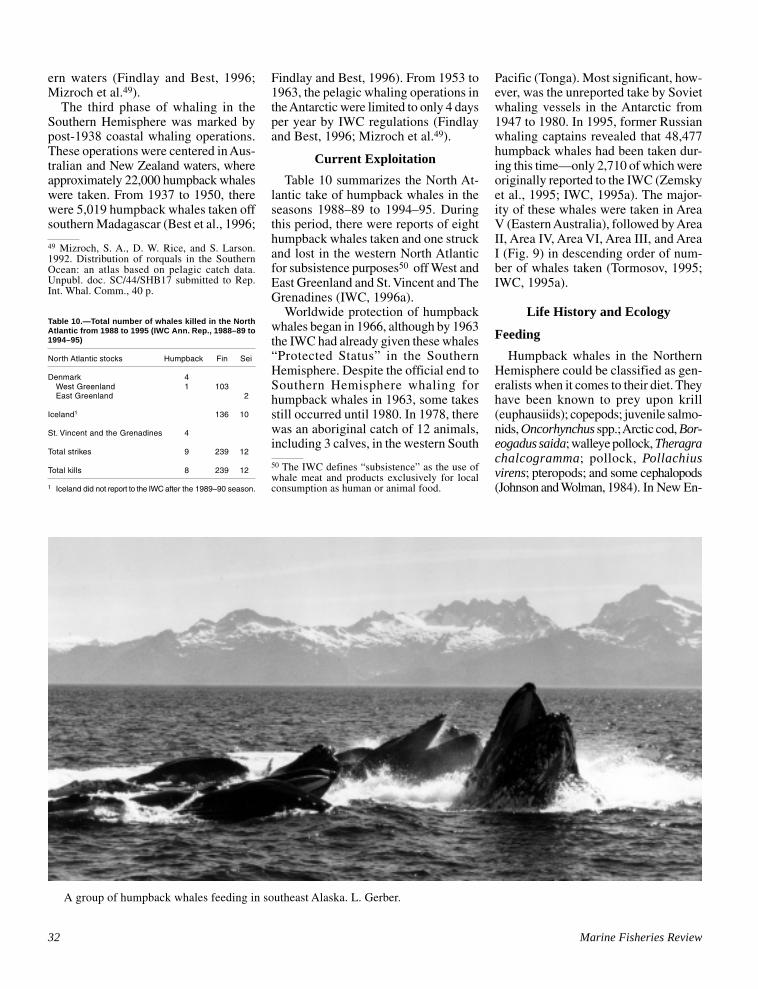
A group of humpback whales feeding in southeast Alaska. L. Gerber.
Pacific (Tonga). Most significant, how-ever, was the unreported take by Sovietwhaling vessels in the Antarctic from1947 to 1980. In 1995, former Russianwhaling captains revealed that 48,477humpback whales had been taken dur-ing this time—only 2,710 of which wereoriginally reported to the IWC (Zemskyet al., 1995; IWC, 1995a). The major-ity of these whales were taken in AreaV (Eastern Australia), followed by AreaII, Area IV, Area VI, Area III, and AreaI (Fig. 9) in descending order of num-ber of whales taken (Tormosov, 1995;IWC, 1995a).
Life History and Ecology
Feeding
Humpback whales in the NorthernHemisphere could be classified as gen-eralists when it comes to their diet. Theyhave been known to prey upon krill(euphausiids); copepods; juvenile salmo-nids, Oncorhynchus spp.; Arctic cod, Bor-eogadus saida; walleye pollock, Theragrachalcogramma; pollock, Pollachiusvirens; pteropods; and some cephalopods(Johnson and Wolman, 1984). In New En-
50 The IWC defines “subsistence” as the use ofwhale meat and products exclusively for localconsumption as human or animal food.
61(1), 1999 33
gland waters of the North Atlantic, 95%of their diets consist of fish species. Themost common prey item is the Atlanticsandlance, Ammodytes dubius; withAtlantic herring, Clupea harengus;capelin, Mallotus villosus; Atlanticmackerel, Scomber scombrus; and otherschooling species also found in theirdiets (Kenney et al., 1985). On theAlaska feeding grounds in the NorthPacific, krill, herring, and capelin makeup the majority of prey items in thestomachs of humpback whales (Bryantet al., 1981; Dolphin and McSweeney,1983). In contrast, Southern Hemi-sphere humpback whales feed almostexclusively on Antarctic krill, Euphausiasuperba (Kawamura, 1994).
Humpback whales generally do notfeed when on their wintering grounds(Slijper, 1962; Lockyer, 1981). How-ever, there have been some documentedevents in low-latitude waters of whalesexhibiting their characteristic feedingbehaviors both in the Dominican Re-
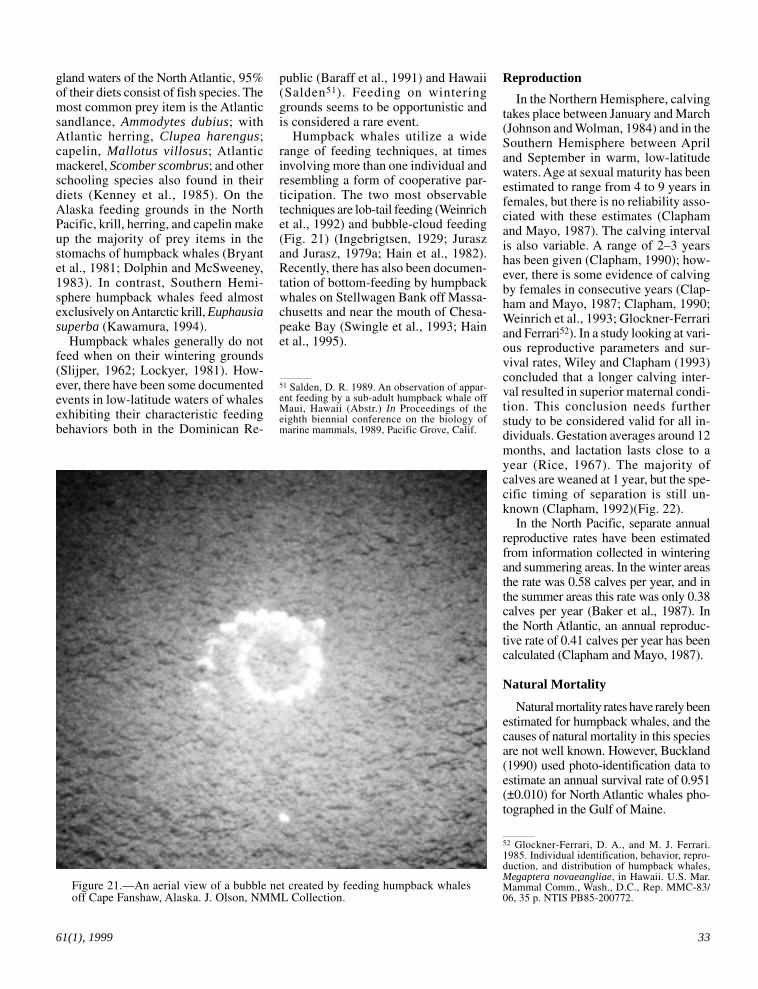
Figure 21.—An aerial view of a bubble net created by feeding humpback whalesoff Cape Fanshaw, Alaska. J. Olson, NMML Collection.
public (Baraff et al., 1991) and Hawaii(Salden51). Feeding on winteringgrounds seems to be opportunistic andis considered a rare event.
Humpback whales utilize a widerange of feeding techniques, at timesinvolving more than one individual andresembling a form of cooperative par-ticipation. The two most observabletechniques are lob-tail feeding (Weinrichet al., 1992) and bubble-cloud feeding(Fig. 21) (Ingebrigtsen, 1929; Juraszand Jurasz, 1979a; Hain et al., 1982).Recently, there has also been documen-tation of bottom-feeding by humpbackwhales on Stellwagen Bank off Massa-chusetts and near the mouth of Chesa-peake Bay (Swingle et al., 1993; Hainet al., 1995).
51 Salden, D. R. 1989. An observation of appar-ent feeding by a sub-adult humpback whale offMaui, Hawaii (Abstr.) In Proceedings of theeighth biennial conference on the biology ofmarine mammals, 1989, Pacific Grove, Calif.
Reproduction
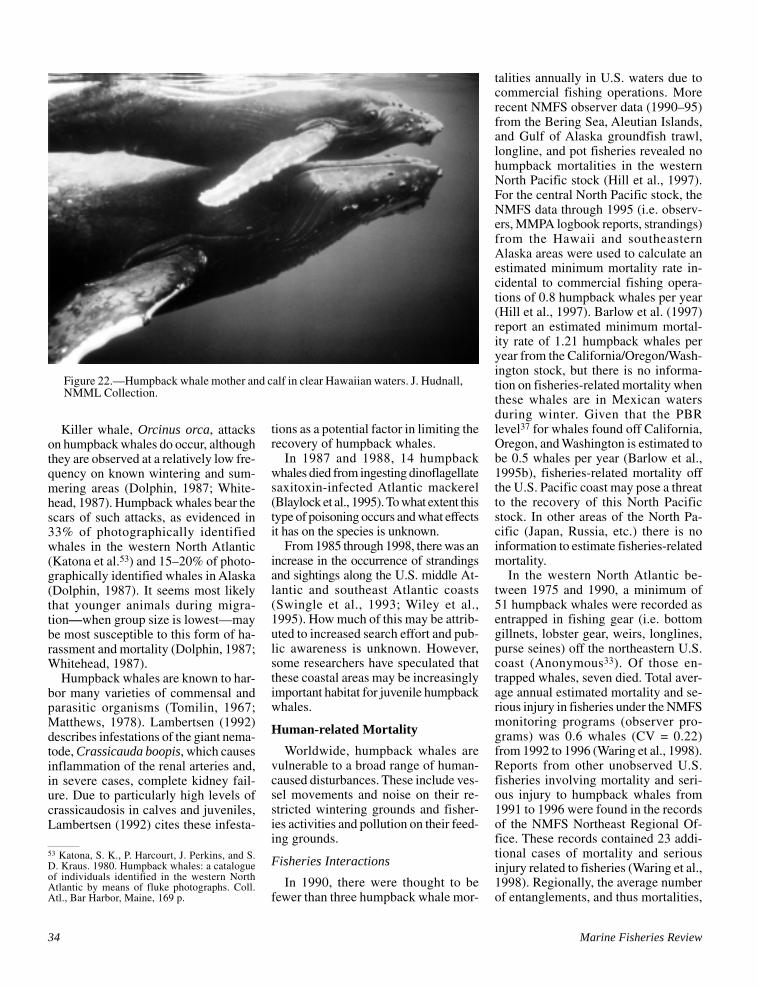
In the Northern Hemisphere, calvingtakes place between January and March(Johnson and Wolman, 1984) and in theSouthern Hemisphere between Apriland September in warm, low-latitudewaters. Age at sexual maturity has beenestimated to range from 4 to 9 years infemales, but there is no reliability asso-ciated with these estimates (Claphamand Mayo, 1987). The calving intervalis also variable. A range of 2–3 yearshas been given (Clapham, 1990); how-ever, there is some evidence of calvingby females in consecutive years (Clap-ham and Mayo, 1987; Clapham, 1990;Weinrich et al., 1993; Glockner-Ferrariand Ferrari52). In a study looking at vari-ous reproductive parameters and sur-vival rates, Wiley and Clapham (1993)concluded that a longer calving inter-val resulted in superior maternal condi-tion. This conclusion needs furtherstudy to be considered valid for all in-dividuals. Gestation averages around 12months, and lactation lasts close to ayear (Rice, 1967). The majority ofcalves are weaned at 1 year, but the spe-cific timing of separation is still un-known (Clapham, 1992)(Fig. 22).
In the North Pacific, separate annualreproductive rates have been estimatedfrom information collected in winteringand summering areas. In the winter areasthe rate was 0.58 calves per year, and inthe summer areas this rate was only 0.38calves per year (Baker et al., 1987). Inthe North Atlantic, an annual reproduc-tive rate of 0.41 calves per year has beencalculated (Clapham and Mayo, 1987).
Natural Mortality
Natural mortality rates have rarely beenestimated for humpback whales, and thecauses of natural mortality in this speciesare not well known. However, Buckland(1990) used photo-identification data toestimate an annual survival rate of 0.951(±0.010) for North Atlantic whales pho-tographed in the Gulf of Maine.
52 Glockner-Ferrari, D. A., and M. J. Ferrari.1985. Individual identification, behavior, repro-duction, and distribution of humpback whales,Megaptera novaeangliae, in Hawaii. U.S. Mar.Mammal Comm., Wash., D.C., Rep. MMC-83/06, 35 p. NTIS PB85-200772.
34 Marine Fisheries Review
Figure 22.—Humpback whale mother and calf in clear Hawaiian waters. J. Hudnall,NMML Collection.
Killer whale, Orcinus orca, attackson humpback whales do occur, althoughthey are observed at a relatively low fre-quency on known wintering and sum-mering areas (Dolphin, 1987; White-head, 1987). Humpback whales bear thescars of such attacks, as evidenced in33% of photographically identifiedwhales in the western North Atlantic(Katona et al.53) and 15–20% of photo-graphically identified whales in Alaska(Dolphin, 1987). It seems most likelythat younger animals during migra-tion—when group size is lowest—maybe most susceptible to this form of ha-rassment and mortality (Dolphin, 1987;Whitehead, 1987).
Humpback whales are known to har-bor many varieties of commensal andparasitic organisms (Tomilin, 1967;Matthews, 1978). Lambertsen (1992)describes infestations of the giant nema-tode, Crassicauda boopis, which causesinflammation of the renal arteries and,in severe cases, complete kidney fail-ure. Due to particularly high levels ofcrassicaudosis in calves and juveniles,Lambertsen (1992) cites these infesta-
tions as a potential factor in limiting therecovery of humpback whales.
In 1987 and 1988, 14 humpbackwhales died from ingesting dinoflagellatesaxitoxin-infected Atlantic mackerel(Blaylock et al., 1995). To what extent thistype of poisoning occurs and what effectsit has on the species is unknown.
From 1985 through 1998, there was anincrease in the occurrence of strandingsand sightings along the U.S. middle At-lantic and southeast Atlantic coasts(Swingle et al., 1993; Wiley et al.,1995). How much of this may be attrib-uted to increased search effort and pub-lic awareness is unknown. However,some researchers have speculated thatthese coastal areas may be increasinglyimportant habitat for juvenile humpbackwhales.
Human-related Mortality
Worldwide, humpback whales arevulnerable to a broad range of human-caused disturbances. These include ves-sel movements and noise on their re-stricted wintering grounds and fisher-ies activities and pollution on their feed-ing grounds.
Fisheries Interactions
In 1990, there were thought to befewer than three humpback whale mor-
talities annually in U.S. waters due tocommercial fishing operations. Morerecent NMFS observer data (1990–95)from the Bering Sea, Aleutian Islands,and Gulf of Alaska groundfish trawl,longline, and pot fisheries revealed nohumpback mortalities in the westernNorth Pacific stock (Hill et al., 1997).For the central North Pacific stock, theNMFS data through 1995 (i.e. observ-ers, MMPA logbook reports, strandings)from the Hawaii and southeasternAlaska areas were used to calculate anestimated minimum mortality rate in-cidental to commercial fishing opera-tions of 0.8 humpback whales per year(Hill et al., 1997). Barlow et al. (1997)report an estimated minimum mortal-ity rate of 1.21 humpback whales peryear from the California/Oregon/Wash-ington stock, but there is no informa-tion on fisheries-related mortality whenthese whales are in Mexican watersduring winter. Given that the PBRlevel37 for whales found off California,Oregon, and Washington is estimated tobe 0.5 whales per year (Barlow et al.,1995b), fisheries-related mortality offthe U.S. Pacific coast may pose a threatto the recovery of this North Pacificstock. In other areas of the North Pa-cific (Japan, Russia, etc.) there is noinformation to estimate fisheries-relatedmortality.
In the western North Atlantic be-tween 1975 and 1990, a minimum of51 humpback whales were recorded asentrapped in fishing gear (i.e. bottomgillnets, lobster gear, weirs, longlines,purse seines) off the northeastern U.S.coast (Anonymous33). Of those en-trapped whales, seven died. Total aver-age annual estimated mortality and se-rious injury in fisheries under the NMFSmonitoring programs (observer pro-grams) was 0.6 whales (CV = 0.22)from 1992 to 1996 (Waring et al., 1998).Reports from other unobserved U.S.fisheries involving mortality and seri-ous injury to humpback whales from1991 to 1996 were found in the recordsof the NMFS Northeast Regional Of-fice. These records contained 23 addi-tional cases of mortality and seriousinjury related to fisheries (Waring et al.,1998). Regionally, the average numberof entanglements, and thus mortalities,
53 Katona, S. K., P. Harcourt, J. Perkins, and S.D. Kraus. 1980. Humpback whales: a catalogueof individuals identified in the western NorthAtlantic by means of fluke photographs. Coll.Atl., Bar Harbor, Maine, 169 p.
61(1), 1999 35
may be even greater. For example, inthe 1980’s, 50 (range 26–66) whales peryear were entangled in Canadian wa-ters, especially in Newfoundland (Lienet al.54). Given the information currentlyavailable on fishing interactions in thewestern North Atlantic and the currentlevels of PBR37 set by the NMFS (Table3), commercial fishing activities maypose a significant threat to the status ofthis stock. In other regions with knownhumpback whale occurrence, such asIceland and the Denmark Strait, south-west Greenland, and southern Labrador,fisheries interaction data are scarce.
Like other baleen species, the hump-back whale’s distribution and healthrelies upon the distribution, abundance,and health of their prey. This meanswhale distributions shift depending onthe cyclical abundance and distributionof prey items (Weinrich et al., 1997).
54 Lien, J., W. Ledwell, and J. Naven. 1988. Inci-dental entrapment in inshore fishing gear during1988: A preliminary report to the Newfoundlandand Labrador Department of Fisheries andOceans, Canada, 15 p.
The details of these biological/environ-mental changes should be a factor intheir conservation status and affect thesteps that are taken towards proactivemanagement. One documented exampleof such an environmental change oc-curred in Newfoundland waters duringthe late 1970’s when a shift in the dis-tribution of capelin stocks caused a re-distribution of humpback whales intoinshore waters, where they encounteredfishing gear for Atlantic cod, Gadusmorhua, and the incidence of entangle-ments increased (Lien and White-head55).
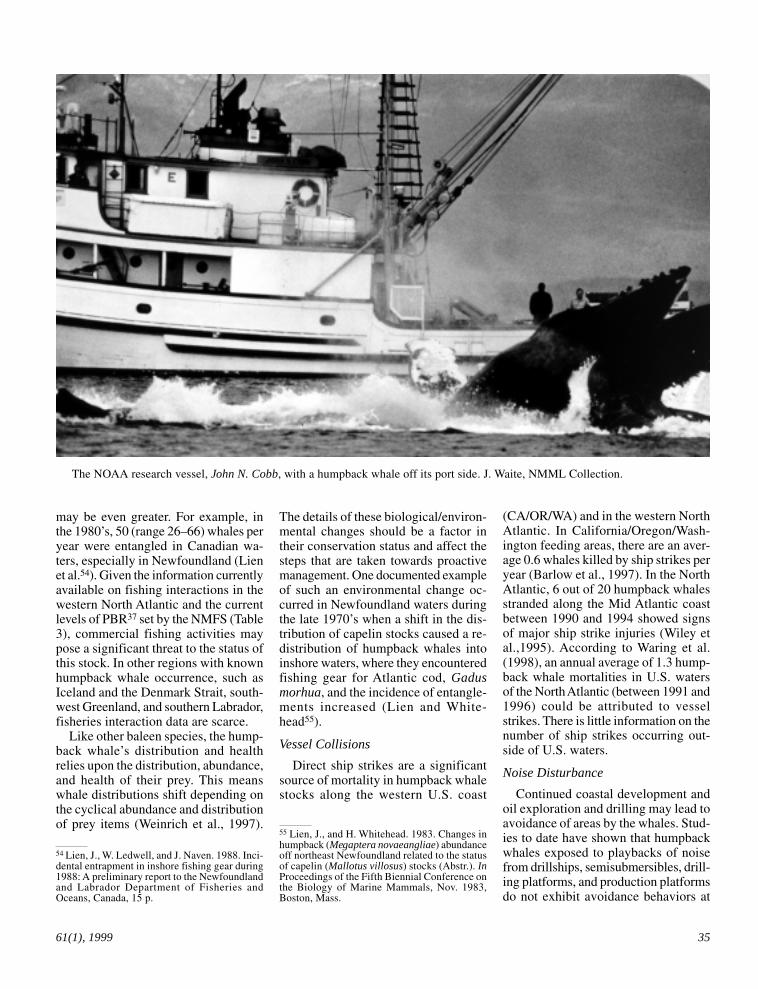
Vessel Collisions
Direct ship strikes are a significantsource of mortality in humpback whalestocks along the western U.S. coast
55 Lien, J., and H. Whitehead. 1983. Changes inhumpback (Megaptera novaeangliae) abundanceoff northeast Newfoundland related to the statusof capelin (Mallotus villosus) stocks (Abstr.). InProceedings of the Fifth Biennial Conference onthe Biology of Marine Mammals, Nov. 1983,Boston, Mass.
(CA/OR/WA) and in the western NorthAtlantic. In California/Oregon/Wash-ington feeding areas, there are an aver-age 0.6 whales killed by ship strikes peryear (Barlow et al., 1997). In the NorthAtlantic, 6 out of 20 humpback whalesstranded along the Mid Atlantic coastbetween 1990 and 1994 showed signsof major ship strike injuries (Wiley etal.,1995). According to Waring et al.(1998), an annual average of 1.3 hump-back whale mortalities in U.S. watersof the North Atlantic (between 1991 and1996) could be attributed to vesselstrikes. There is little information on thenumber of ship strikes occurring out-side of U.S. waters.
Noise Disturbance
Continued coastal development andoil exploration and drilling may lead toavoidance of areas by the whales. Stud-ies to date have shown that humpbackwhales exposed to playbacks of noisefrom drillships, semisubmersibles, drill-ing platforms, and production platformsdo not exhibit avoidance behaviors at
The NOAA research vessel, John N. Cobb, with a humpback whale off its port side. J. Waite, NMML Collection.
36 Marine Fisheries Review
levels up to 116 dB (Malme et al.56).However, two whales were found deadnear the site of repeated subbottomblasting in a Newfoundland inlet. Stud-ies showed no signs of avoidance or dis-turbance from the noise pulses, but bothwhales suffered severe mechanicaldamage to their ears (Ketten et al., 1993;Lien et al., 1993; Ketten, 1995).
Humpback whales appear most re-sponsive to moving sound sources, suchas whale-watching vessels, fishing ves-sels, recreational vessels, and low-fly-ing aircraft (Anonymous, 1987; Atkinsand Swartz, 1989; Beach and Weinrich,1989; Clapham et al., 1993; Tinney57;Green and Green58). Responses to noiseare variable, and the level and type ofresponse exhibited by whales has beencorrelated to group size and composi-tion and apparent behaviors at the timeof possible disturbance (Watkins et al.,1981; Krieger and Wing, 1986; Glockner-Ferrari, 1990; Herman et al.59; Glockner-Ferrari and Ferrari52).
56 Malme, C. I., P. R. Miles, P. Tyack, C. W. Clark,and J. E. Bird.1985. Investigation of the poten-tial effects of underwater noise from petroleumindustry activities on feeding humpback whalebehavior. Rep. from BBN Labs Inc., Cambridge,Mass., for U.S. Minerals Manage. Serv., Anchor-age, Alaska. BBN Rep. 5851; OCS Study MMS85-0019.57 Tinney, R. T., Jr. 1988. Review of informationbearing upon the conservation and protection ofhumpback whales in Hawaii. Rep. for U.S. Mar.Mammal Comm., Wash., D.C., 56 p. NTIS PB88-195359.58 Green, M. L., and R. G. Green. 1990. Short-term impact of vessel traffic on the Hawaiianhumpback whale (Megaptera novaeangliae), 9p. Pres. at Annu. Meet. Anim. Behav. Soc., June1990, Buffalo, N.Y.59 Herman, L. M., P. H. Forestell, and R. C.Antinoja. 1980. The 1976/1977 migration ofhumpback whales into Hawaiian waters: com-posite description. Rep. MMC-77/19 for the U.S.Mar. Mammal Comm., Wash., D.C., 55 p. NTISPB80-162332.
There is the possibility that long-termdisplacement may have resulted fromvessel noise disturbance in the centralNorth Pacific stock, where researchershave noted a decline in the use of Gla-cier Bay, Alaska, during feeding seasons(Jurasz and Jurasz60; Dean et al.61) andavoidance of near-shore waters by moth-ers and calves in Hawaii (Salden, 1988;Glockner-Ferrari, 1990; Glockner-Ferrari and Ferrari52). Humpbackwhales may also become habituated tovessel traffic and its associated noise(Watkins, 1986; Belt et al.62), whichmay leave them more vulnerable to ves-sel strikes (Swingle et al., 1993; Wileyet al., 1995). In Hawaii, regulations pro-hibit boats from approaching within 91m of adult whales and within 274 m inareas designated mother/calf areas(Anonymous, 1987). Likewise, inAlaska, the number of cruise ships en-tering Glacier Bay has been limited toreduce possible disturbance (Baker etal., 1988).
Classification Status
The humpback whale was listed asendangered under the ESA in 1973 anddesignated as depleted under theMMPA. Endangered status is applied to
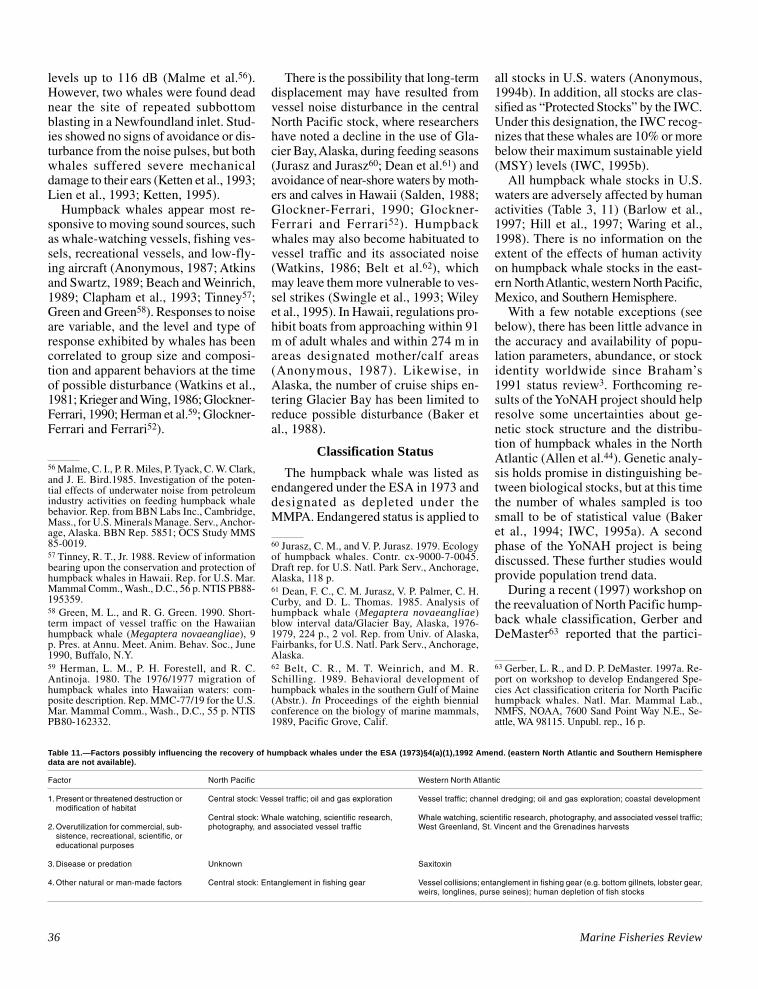
Western North Atlantic
Vessel traffic; channel dredging; oil and gas exploration; coastal development
Whale watching, scientific research, photography, and associated vessel traffic;West Greenland, St. Vincent and the Grenadines harvests
Saxitoxin
Vessel collisions; entanglement in fishing gear (e.g. bottom gillnets, lobster gear,weirs, longlines, purse seines); human depletion of fish stocks
North Pacific
Central stock: Vessel traffic; oil and gas exploration
Central stock: Whale watching, scientific research,photography, and associated vessel traffic
Unknown
Central stock: Entanglement in fishing gear
Factor
1. Present or threatened destruction ormodification of habitat
2. Overutilization for commercial, sub-sistence, recreational, scientific, oreducational purposes
3. Disease or predation
4. Other natural or man-made factors
Table 11.—Factors possibly influencing the recovery of humpback whales under the ESA (1973)§4(a)(1),1992 Amend. (eastern North Atlantic and Southern Hemispheredata are not available).
all stocks in U.S. waters (Anonymous,1994b). In addition, all stocks are clas-sified as “Protected Stocks” by the IWC.Under this designation, the IWC recog-nizes that these whales are 10% or morebelow their maximum sustainable yield(MSY) levels (IWC, 1995b).
All humpback whale stocks in U.S.waters are adversely affected by humanactivities (Table 3, 11) (Barlow et al.,1997; Hill et al., 1997; Waring et al.,1998). There is no information on theextent of the effects of human activityon humpback whale stocks in the east-ern North Atlantic, western North Pacific,Mexico, and Southern Hemisphere.
With a few notable exceptions (seebelow), there has been little advance inthe accuracy and availability of popu-lation parameters, abundance, or stockidentity worldwide since Braham’s1991 status review3. Forthcoming re-sults of the YoNAH project should helpresolve some uncertainties about ge-netic stock structure and the distribu-tion of humpback whales in the NorthAtlantic (Allen et al.44). Genetic analy-sis holds promise in distinguishing be-tween biological stocks, but at this timethe number of whales sampled is toosmall to be of statistical value (Bakeret al., 1994; IWC, 1995a). A secondphase of the YoNAH project is beingdiscussed. These further studies wouldprovide population trend data.
During a recent (1997) workshop onthe reevaluation of North Pacific hump-back whale classification, Gerber andDeMaster63 reported that the partici-
60 Jurasz, C. M., and V. P. Jurasz. 1979. Ecologyof humpback whales. Contr. cx-9000-7-0045.Draft rep. for U.S. Natl. Park Serv., Anchorage,Alaska, 118 p.61 Dean, F. C., C. M. Jurasz, V. P. Palmer, C. H.Curby, and D. L. Thomas. 1985. Analysis ofhumpback whale (Megaptera novaeangliae)blow interval data/Glacier Bay, Alaska, 1976-1979, 224 p., 2 vol. Rep. from Univ. of Alaska,Fairbanks, for U.S. Natl. Park Serv., Anchorage,Alaska.62 Belt, C. R., M. T. Weinrich, and M. R.Schilling. 1989. Behavioral development ofhumpback whales in the southern Gulf of Maine(Abstr.). In Proceedings of the eighth biennialconference on the biology of marine mammals,1989, Pacific Grove, Calif.
63 Gerber, L. R., and D. P. DeMaster. 1997a. Re-port on workshop to develop Endangered Spe-cies Act classification criteria for North Pacifichumpback whales. Natl. Mar. Mammal Lab.,NMFS, NOAA, 7600 Sand Point Way N.E., Se-attle, WA 98115. Unpubl. rep., 16 p.
61(1), 1999 37
64 Gerber, L. R., and D. P. DeMaster. 1997b. Anapproach to Endangered Species Act classifica-tion of North Pacific humpback whales. Avail.from Leah Gerber, Natl. Mar. Mammal Lab.,NMFS, NOAA, 7600 Sand Point Way N.E., Se-attle, WA 98115.
pants had concluded that the criteriaused to classify humpback whalesshould incorporate uncertainties fromthe available data (e.g. abundance,trends in abundance) and be flexibleenough to accommodate multiple popu-lation structure scenarios. Gerber andDeMaster64 developed classificationcriteria based on abundance, trends inabundance, changes in distribution, and
regulatory status. Trends in populationabundance over time were used to gen-erate a probability distribution aroundthe population’s underlying rate ofchange, which could be used to desig-nate potential thresholds for endangeredand threatened status. According tothresholds generated by their model, arecommendation to downlist to threat-ened the central North Pacific hump-back whale stock would be warranted.However, they also noted that more ac-curate information on life history pa-rameters, trends in abundance, sex ra-tio, environmental variability, and stockstructure must continue to be collected
and applied to such classification mod-els in order to make accurate status de-terminations. Reliable abundance esti-mates exist for the central North Pacifichumpback whale stock, and there areindications of its continued growth.
Assuming that abundance levels areaccurate and continue to increase, an-thropogenic threats are reduced, ad-equate monitoring plans are developedand implemented, and information onpopulation trends continue to be col-lected, the western North Atlantic andcentral North Pacific stocks should beconsidered for downlisting to threat-ened status.