Embed Size (px)
Citation preview
The Impact of Collective Bargaining on Teacher Transfer Rates in Urban High-Poverty Schools F. Howard Nelson, Ph.D. American Federation of Teachers October, 2006
The Impact of Collective Bargaining on Teacher Transfer Rates in Urban High-Poverty Schools1
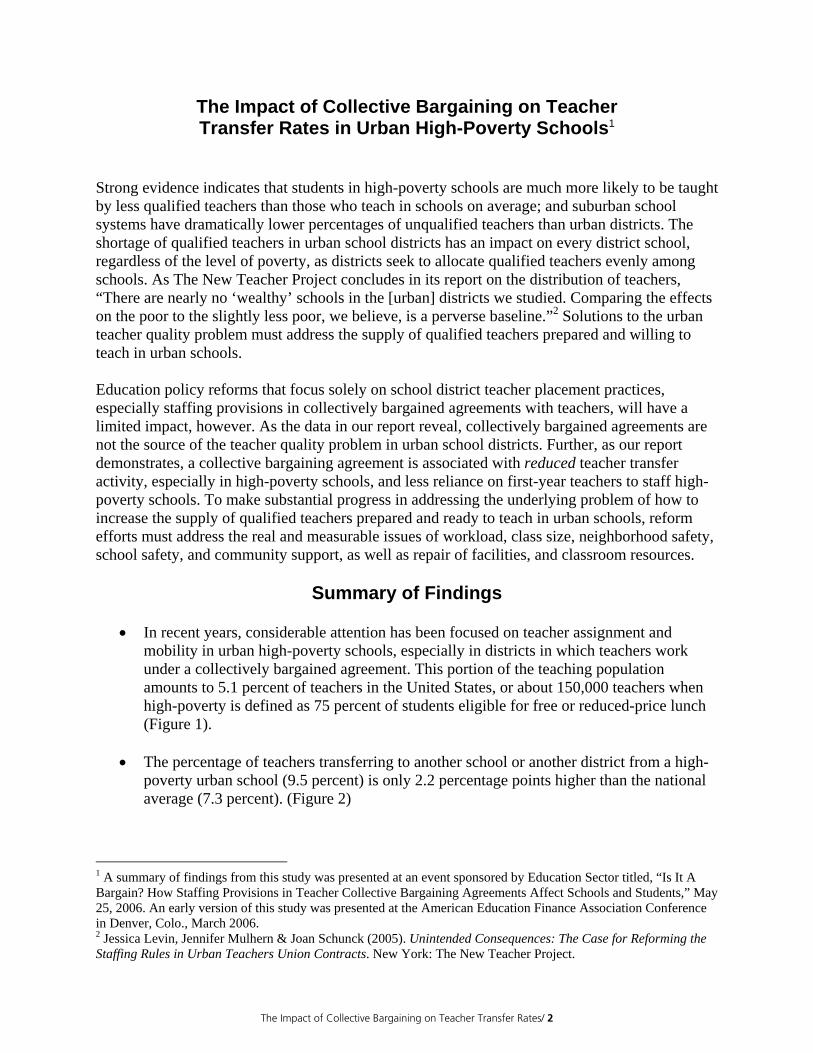
Strong evidence indicates that students in high-poverty schools are much more likely to be taught by less qualified teachers than those who teach in schools on average; and suburban school systems have dramatically lower percentages of unqualified teachers than urban districts. The shortage of qualified teachers in urban school districts has an impact on every district school, regardless of the level of poverty, as districts seek to allocate qualified teachers evenly among schools. As The New Teacher Project concludes in its report on the distribution of teachers, “There are nearly no ‘wealthy’ schools in the [urban] districts we studied. Comparing the effects on the poor to the slightly less poor, we believe, is a perverse baseline.”2 Solutions to the urban teacher quality problem must address the supply of qualified teachers prepared and willing to teach in urban schools. Education policy reforms that focus solely on school district teacher placement practices, especially staffing provisions in collectively bargained agreements with teachers, will have a limited impact, however. As the data in our report reveal, collectively bargained agreements are not the source of the teacher quality problem in urban school districts. Further, as our report demonstrates, a collective bargaining agreement is associated with reduced teacher transfer activity, especially in high-poverty schools, and less reliance on first-year teachers to staff high-poverty schools. To make substantial progress in addressing the underlying problem of how to increase the supply of qualified teachers prepared and ready to teach in urban schools, reform efforts must address the real and measurable issues of workload, class size, neighborhood safety, school safety, and community support, as well as repair of facilities, and classroom resources.
Summary of Findings
• In recent years, considerable attention has been focused on teacher assignment and mobility in urban high-poverty schools, especially in districts in which teachers work under a collectively bargained agreement. This portion of the teaching population amounts to 5.1 percent of teachers in the United States, or about 150,000 teachers when high-poverty is defined as 75 percent of students eligible for free or reduced-price lunch (Figure 1).
• The percentage of teachers transferring to another school or another district from a high-
poverty urban school (9.5 percent) is only 2.2 percentage points higher than the national average (7.3 percent). (Figure 2)
1 A summary of findings from this study was presented at an event sponsored by Education Sector titled, “Is It A Bargain? How Staffing Provisions in Teacher Collective Bargaining Agreements Affect Schools and Students,” May 25, 2006. An early version of this study was presented at the American Education Finance Association Conference in Denver, Colo., March 2006. 2 Jessica Levin, Jennifer Mulhern & Joan Schunck (2005). Unintended Consequences: The Case for Reforming the Staffing Rules in Urban Teachers Union Contracts. New York: The New Teacher Project.
The Impact of Collective Bargaining on Teacher Transfer Rates/ 2
• A collective bargaining agreement is associated with reducing teacher transfers. In high-poverty schools where teachers have a collectively bargained agreement, the transfer rate to another school or another district is 7.5 percent, which is on par with the national average transfer rate of 7.3 percent. In high-poverty schools where teachers do not have a collective bargaining agreement, the transfer rate to another school is 11.3 percent. (Figure 3)
• A collective bargaining agreement is also associated with reduced teacher transfers from
urban high-poverty schools, where teachers with a collectively bargained agreement have a transfer rate of 8.4 percent compared to 13 percent for similar schools in states that do not allow collective bargaining agreements. (Figure 4)
• In urban school districts with a collective bargaining agreement, low-poverty schools (6.1
percent) are about as likely as high-poverty schools (5.7 percent) to replace transferring teachers with first-year teachers, but without a collective bargaining agreement, high-poverty schools hire first-year teachers at three times the rate of low-poverty schools (10.1 percent versus 3.3 percent). (Figure 5)
• Urban high-poverty schools with collective bargaining (4.4 percent) are more likely than
low-poverty schools in the district (2.4 percent) to hire transfers from within the school district. (Figure 6)
• In 1999–2000, most teachers transferred voluntarily, and contract language rarely, if ever,
restricts the flexibility of principals or site-based committees in these situations. Contrary to conventional wisdom, more senior teachers do not have an unfettered right to a vacant position. (See Appendix C). Only 0.7 percent of teachers in the SASS sample reported being laid off or involuntarily transferred and remained in teaching the following year in another school or another district. (Figure 7)
• Of the teachers that transfer, just one in 10 is an involuntary transfer, (e.g. “displacement”
or “excessing” resulting from enrollment changes or budget cuts in a particular school or “layoffs” if the reductions are system wide). The language in collective bargaining agreements addressing layoffs and involuntary transfers varies widely from district to district, as does the implementation of the processes established by the language, which is why this report examines the data to understand teacher transfer activity rather than relying only on an analysis of language. Less senior teachers are the first to be displaced or excessed, and most contracts provide administrators with significant flexibility in filling vacant positions elsewhere in the system (Appendix D).
• Collectively bargained agreements do not address issues of teacher transfer to a different
school district. Approximately 50 percent of teachers who transferred from urban high-poverty schools moved to a different district, as did 60 percent of transfers from low-poverty schools. (Figure 8)
• School district transfer policies pertain only to the approximately one in 20 teachers who
transfer from one district school to another district school in any given year. After excluding teachers who transferred due to layoffs and teachers who transferred to another
The Impact of Collective Bargaining on Teacher Transfer Rates/ 3
school district, the within-district transfer rate in urban schools was relatively low—only 3 percent for low-poverty schools and 5.3 in high-poverty schools. (Figure 9)
• The within-district voluntary transfer rate in high-poverty urban schools where teachers
work under a collective bargaining agreement was 4 percent, compared to 5.6 percent in high-poverty urban schools without a collective bargaining agreement. (Figure 10)
• Charter schools seldom have a collectively bargained agreement with their teachers.
Teachers in urban charter schools report much higher transfer rates (13.2 percent) than teachers in urban schools with collectively bargained agreements (6.4 percent). (Figure 11)
• Urban charter schools are more than three times as likely to hire first-year teachers (17.6
percent) than urban schools with teachers working under a collective bargaining agreement (5.2 percent). (Figure 12)
• The most common reason teachers reported for transferring was the opportunity to teach
a different grade or subject. Teachers in high-poverty urban schools cited this as their third most common reason. (Figure 13)
• Teachers on average cited similar reasons for transferring to a different school as teachers
in high-poverty urban schools. However, teachers in urban high-poverty schools reported higher dissatisfaction with administrative support than teachers on average (43 percent, compared with 38 percent), as well as higher dissatisfaction with working conditions (45 percent versus 32 percent) and change of residence (30 percent versus 23 percent). (Figure 13)
• Both on average and in urban high-poverty schools, the most senior teachers are not
transferring to other schools. Teachers who continue teaching in high-poverty schools where teachers work under a collective bargaining agreement are more experienced (14.1 years of experience) than teachers who voluntarily transferred to another school in the district (10.2 years of experience) or switched to another school district (only 4.6 years of experience). (Figure 15)
• Teachers transferring from a school under the provisions of a collective bargaining
agreement are about as likely to be certified as teachers continuing in the same school. In the United States as a whole, teachers who transferred to another school in the same district are less likely to be certified than teachers who continued to teach in the same school. With collective bargaining agreements, teachers continuing in high-poverty schools (84 percent) were just as likely to be certified as teachers who transferred to another school in the district (83 percent) or switched to another district (85 percent). In schools without a collective bargaining agreement, teachers transferring out of high-poverty schools are more likely to be uncertified than teachers continuing in the same school. (Figure 16)
The Impact of Collective Bargaining on Teacher Transfer Rates/ 4
The Impact of Collective Bargaining on Teacher Transfer Rates in Urban High-Poverty Schools
I. Background Strong evidence indicates that students in high-poverty schools are much more likely to be taught by less qualified teachers. Because suburban school systems have dramatically lower percentages of unqualified teachers than urban districts, solutions to the urban teacher quality problem must address the limited supply of qualified teachers prepared and willing to teach in urban schools.3 The urban teacher shortage has an impact on every district school regardless of poverty as school districts seek to allocate qualified teachers evenly among schools. As The New Teacher Project concludes, “There are nearly no ‘wealthy’ schools in the [urban] districts we studied. Comparing the effects on the poor to the slightly less poor, we believe, is a perverse baseline.”4 Policy reforms that focus solely on school district teacher assignment, including staffing provisions in collectively bargained agreements with teachers, will have a minimal impact because that represents just a small part of a much larger teacher quality problem. The policy debate, however, has often been characterized by assumptions rather than evidence. Recommendations are routinely issued to policymakers that are not informed by data on the actual transfer activity of teachers within and between school districts, including the characteristics of teachers who transfer, what types of schools they leave and where they move. It is often assumed without question that high-poverty urban schools have fewer qualified teachers than low-poverty urban schools, that teachers have seniority rights under collective bargaining agreements to claim vacant jobs, and that when they have the opportunity, teachers transfer to schools in more middle-income neighborhoods. For example, the Hoover Institute’s Terry Moe asserts that “hard evidence or no, there are compelling reasons for thinking that transfer rights should have profoundly negative effects on the schools. … transfer rights give senior teachers much more latitude in choosing where to teach, and they can be expected to use it to leave … schools filled with disadvantaged kids … . In districts with transfer rules, then, disadvantaged schools should find themselves burdened with even more inexperienced teachers than they otherwise would.”5 Based on anecdotal evidence, but calling it “easy to see,” Paul Hill describes a scenario in which senior teachers, on their own or at the behest of a principal, have first claim on vacant jobs that become available, preventing principals from making their own hires.6 When senior teachers are displaced by school closings or enrollment shifts, they invoke seniority to dislocate less senior 3 For example, in New York state as a whole, a nonwhite student is four times as likely to have an uncertified teacher as a white student (16.6 percent vs. 4 percent), but in New York City, the disparity is only a few percentage points (21.2 percent vs. 16 percent), and in Rochester and Syracuse there were no disparities. Don Boyd, Hanp Lankford, Susanna Loeb & Jim Wycoff (2003). “Understanding Teacher Labor Markets” in School Finance and Teacher Quality (Eds. Margaret Plieki and David Monk) Eye on Education Press. 4 Jessica Levin, Jennifer Mulhern & Joan Schunck (2005). 5Terry Moe (2006). “Union Powers and the Education of Children” in Collective Bargaining in Education (Eds. Jane Hanaway and Andrew Rotherham), Harvard Education Press, p. 238. 6 Paul Hill (2006). “The Cost of Collective Bargaining Agreements and Related District Policies” in Collective Bargaining in Education (Eds. Jane Hanaway and Andrew Rotherham), Harvard Education Press.
The Impact of Collective Bargaining on Teacher Transfer Rates/ 5
teachers, who in turn “bump” even less experienced teachers. Hill argues that this cycle of displacement is especially harmful in urban districts because new teachers cannot be hired until the rounds of displacements end. Suburban districts are considered “simpler,” even if unionized, so they can begin hiring first, leaving less qualified teachers for the city. According to Hill, seniority rights mean that principals in even the most attractive schools in a district must oversee staffs they do not hire and cannot fire. Like Moe, Hill asserts that teachers always prefer to work in more attractive schools and neighborhoods, and that they use their seniority to pick those jobs. Moreover, they claim, after one or two years at a “bottom-of-the-barrel school,” relatively new teachers use their seniority to move to slightly more attractive schools in the district. Roza, Miller and Hill at the Center for Reinventing Public Education also argue that “it has long been acknowledged that teacher preferences dictate the assignment of teachers across schools within a district because teacher preferences are usually honored according to seniority, frequently backed up by labor contracts.”7 Additionally, it is argued, the most experienced (and highest-paid) teachers are assigned to schools with the fewest teaching challenges, while the “greenest” teachers (and lowest-paid) are generally assigned to struggling schools. They cite as evidence of these patterns modest average salary differentials of about $2,000 per teacher, or $80 per pupil for a class of 25 students, between low-poverty and high-poverty schools within a school district. This amount approximates the difference between a teacher with 13.7 years of experience and one with 15.4 years of experience, which is the difference in experience between average teachers in high- and low-poverty schools in the 1999–2000 SASS. The small salary differential also could result from higher rates of teachers leaving the profession in low-poverty schools or transfers to another school district. Relying on Roza and Hill, in part, Leigh and Mead (Progressive Policy Institute) also claim that seniority-based collective bargaining provisions encourage senior teachers to choose placements in less challenging schools, rather than letting administrators assign them where their skills are most needed.8 In their studies of New York state, Lankford, Loeb and Wyckoff find little difference in the qualifications of teachers who continue in the same schools and those who transfer to other schools in the same district.9 This similarity, they conclude, may be due to district rules or collective bargaining agreements that regulate which teachers may transfer. After studying two large school districts, the Harvard Civil Rights Project claims that teacher distribution is determined by seniority rules, teacher preferences and principal discretion.10 Citing Hanushek et al.11 in a study of Texas—a state which prohibits collective bargaining—the project concludes there is evidence that teachers favor higher achieving, non-minority, non-low-
7 Marguerite Roza with Larry Miller & Paul Hill (2005). Strengthening Title I to Help High-Poverty Schools, Center on Reinventing Public Education, Evans School of Public Affairs. 8 Andrew Leigh & Sara Mead (2005). Lifting Teacher Performance. Washington, D.C: Progressive Policy Institute. http://www.ppionline.org/ppi_ci.cfm?contentid=253286&knlgAreaID=110&subsecid=135. 9 Hamilton Lankford, Susanna Loeb & James Wyckoff (2002). “Teacher Sorting and the Plight of Urban Schools: A Descriptive Analysis” Education Evaluation and Policy Analysis 24 (1): 37–62. http://www.teacherpolicyresearch.org/portals/1/pdfs/Teacher_Sorting_and_Urban_Schools_EEPA.pdf. 10 Gail Sunderman & Jimmy Kim (2005). Teacher Quality: Equalizing Educational Opportunities and Outcomes. Cambridge, Mass.: The Civil Rights Project at Harvard University. 11 Eric Hanushek, John Kain & Steven Rivkin (2004). “Why Public Schools Lose Teachers” Journal of Human Resources 39(2). http://edpro.stanford.edu/Hanushek/admin/pages/files/uploads/lose%20teachers.jhr.pdf.
The Impact of Collective Bargaining on Teacher Transfer Rates/ 6
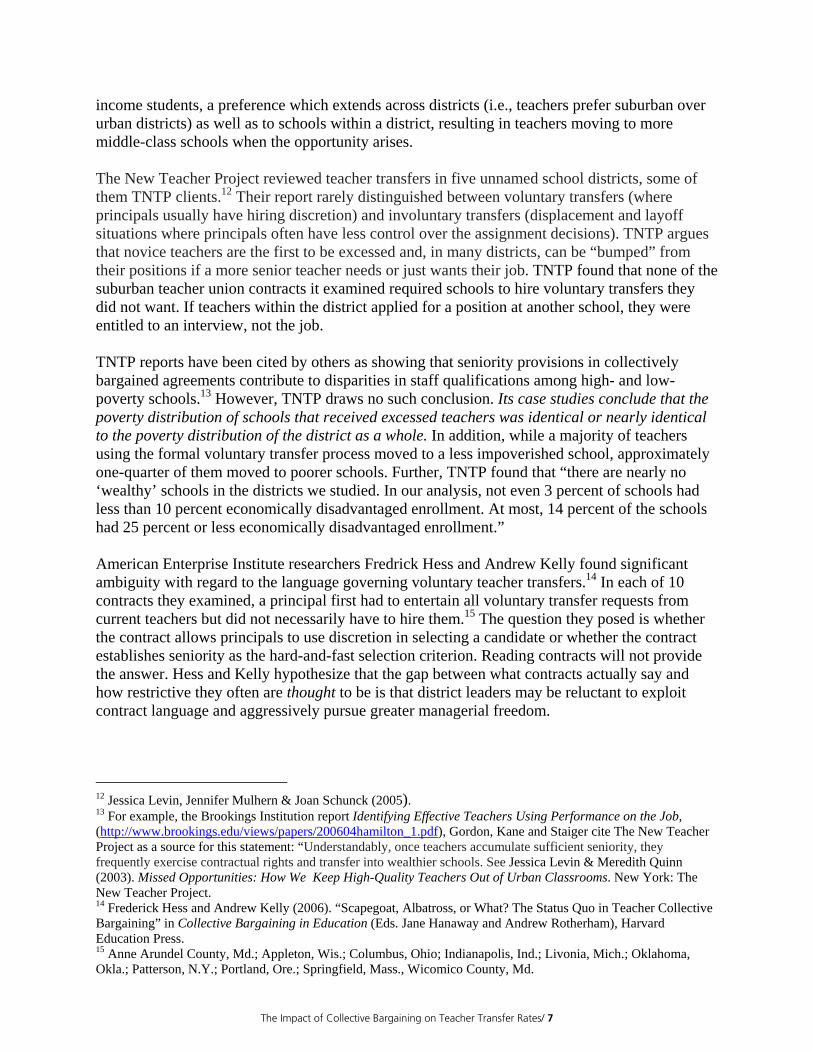
income students, a preference which extends across districts (i.e., teachers prefer suburban over urban districts) as well as to schools within a district, resulting in teachers moving to more middle-class schools when the opportunity arises. The New Teacher Project reviewed teacher transfers in five unnamed school districts, some of them TNTP clients.12 Their report rarely distinguished between voluntary transfers (where principals usually have hiring discretion) and involuntary transfers (displacement and layoff situations where principals often have less control over the assignment decisions). TNTP argues that novice teachers are the first to be excessed and, in many districts, can be “bumped” from their positions if a more senior teacher needs or just wants their job. TNTP found that none of the suburban teacher union contracts it examined required schools to hire voluntary transfers they did not want. If teachers within the district applied for a position at another school, they were entitled to an interview, not the job. TNTP reports have been cited by others as showing that seniority provisions in collectively bargained agreements contribute to disparities in staff qualifications among high- and low-poverty schools.13 However, TNTP draws no such conclusion. Its case studies conclude that the poverty distribution of schools that received excessed teachers was identical or nearly identical to the poverty distribution of the district as a whole. In addition, while a majority of teachers using the formal voluntary transfer process moved to a less impoverished school, approximately one-quarter of them moved to poorer schools. Further, TNTP found that “there are nearly no ‘wealthy’ schools in the districts we studied. In our analysis, not even 3 percent of schools had less than 10 percent economically disadvantaged enrollment. At most, 14 percent of the schools had 25 percent or less economically disadvantaged enrollment.” American Enterprise Institute researchers Fredrick Hess and Andrew Kelly found significant ambiguity with regard to the language governing voluntary teacher transfers.14 In each of 10 contracts they examined, a principal first had to entertain all voluntary transfer requests from current teachers but did not necessarily have to hire them.15 The question they posed is whether the contract allows principals to use discretion in selecting a candidate or whether the contract establishes seniority as the hard-and-fast selection criterion. Reading contracts will not provide the answer. Hess and Kelly hypothesize that the gap between what contracts actually say and how restrictive they often are thought to be is that district leaders may be reluctant to exploit contract language and aggressively pursue greater managerial freedom.
12 Jessica Levin, Jennifer Mulhern & Joan Schunck (2005). 13 For example, the Brookings Institution report Identifying Effective Teachers Using Performance on the Job, (http://www.brookings.edu/views/papers/200604hamilton_1.pdf), Gordon, Kane and Staiger cite The New Teacher Project as a source for this statement: “Understandably, once teachers accumulate sufficient seniority, they frequently exercise contractual rights and transfer into wealthier schools. See Jessica Levin & Meredith Quinn (2003). Missed Opportunities: How We Keep High-Quality Teachers Out of Urban Classrooms. New York: The New Teacher Project. 14 Frederick Hess and Andrew Kelly (2006). “Scapegoat, Albatross, or What? The Status Quo in Teacher Collective Bargaining” in Collective Bargaining in Education (Eds. Jane Hanaway and Andrew Rotherham), Harvard Education Press. 15 Anne Arundel County, Md.; Appleton, Wis.; Columbus, Ohio; Indianapolis, Ind.; Livonia, Mich.; Oklahoma, Okla.; Patterson, N.Y.; Portland, Ore.; Springfield, Mass., Wicomico County, Md.
The Impact of Collective Bargaining on Teacher Transfer Rates/ 7
The background literature indicates considerable conjecture about the role of collective bargaining agreements in contributing to the inequitable distribution of experienced teachers between low- and high-poverty schools. Using a national data set, this study seeks to answer the following questions:
• Is the transfer rate out of urban high-poverty schools with collective bargaining greater than for similar schools without collective bargaining?
• How does the transfer rate out of urban high-poverty schools differ from the transfer rate
in low-poverty schools with collective bargaining and without?
• Are first-year teachers more likely to be hired in urban high-poverty schools where teachers work under a collective bargaining agreement than in similar schools not covered by a collective bargaining agreement?
• How do urban charter school teacher transfer rates and the hiring of first-year teachers
compare to those in other urban schools with collective bargaining?
• Are the reasons for transferring from an urban high-poverty school different than the reasons given by transferring teachers in general?
• Are the most experienced and well-credentialed teachers in high-poverty schools
transferring out? II. Data and Analytical Procedure Most of the following analysis is based on the 1999–2000 Schools and Staffing Survey (SASS) and the related 2000–01 Teacher Follow-Up Survey (TFS). The 1999–2000 SASS, administered between September 1999 and June 2000, asked a nationally representative sample of more than 50,000 public and private school teachers about their work environment, classroom teaching, teaching qualifications, and other individual characteristics. The 2000–01 TFS, administered between January and May 2001, asked a representative sample of more than 5,000 SASS participants (of which about 1,200 were public school teacher transfers). This straightforward analysis uses categories and definitions that match the exact questions in SASS or the conventional presentation of data by NCES so that the results can be verified or replicated by other researchers.16 The definition of urban, suburban and rural schools is the same as the one used in the SASS data set. Poverty is defined exactly as it is defined in NCES analyses, which is the percentage of K-12 enrollment eligible for free or reduced-price lunch. Collective bargaining status is determined using data from the SASS school district survey. The appendices provide greater detail on information presented in figures and tables in the main text.
16 For example, Stephen Provasnik & Scott Dorfman (2005). Mobility in the Teacher Workforce Condition of Education 2005, Special Analysis, National Center for Education Statistics.
The Impact of Collective Bargaining on Teacher Transfer Rates/ 8
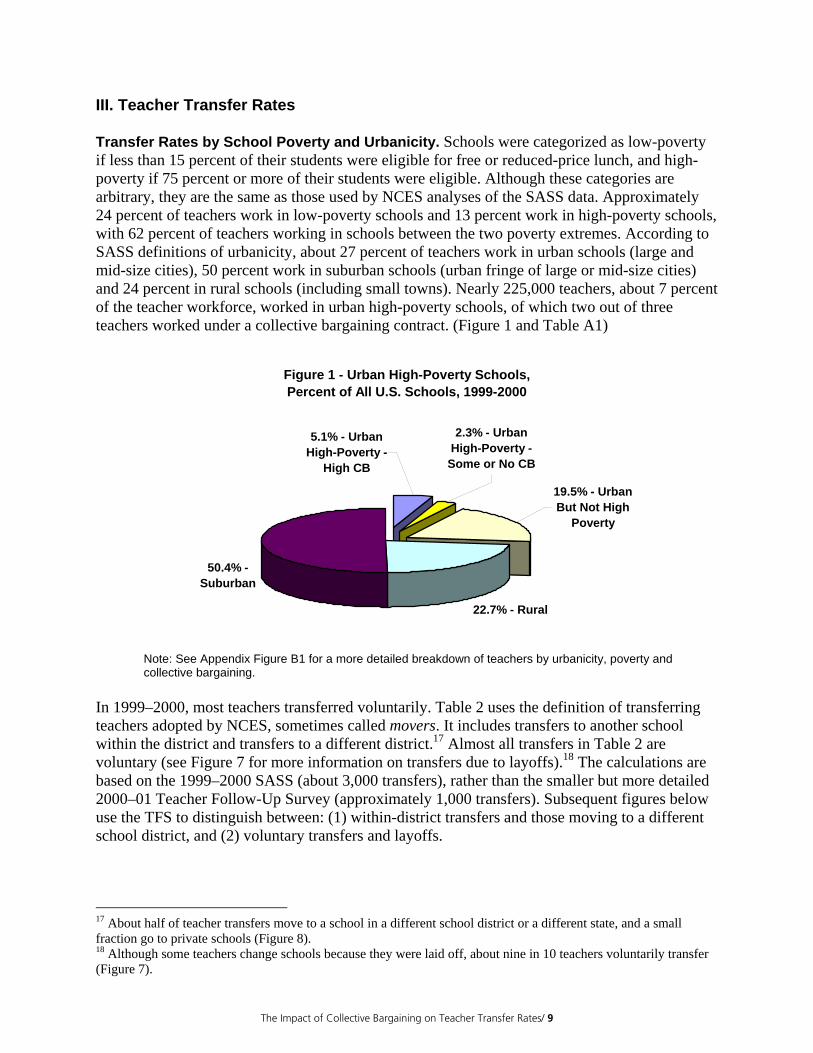
III. Teacher Transfer Rates Transfer Rates by School Poverty and Urbanicity. Schools were categorized as low-poverty if less than 15 percent of their students were eligible for free or reduced-price lunch, and high-poverty if 75 percent or more of their students were eligible. Although these categories are arbitrary, they are the same as those used by NCES analyses of the SASS data. Approximately 24 percent of teachers work in low-poverty schools and 13 percent work in high-poverty schools, with 62 percent of teachers working in schools between the two poverty extremes. According to SASS definitions of urbanicity, about 27 percent of teachers work in urban schools (large and mid-size cities), 50 percent work in suburban schools (urban fringe of large or mid-size cities) and 24 percent in rural schools (including small towns). Nearly 225,000 teachers, about 7 percent of the teacher workforce, worked in urban high-poverty schools, of which two out of three teachers worked under a collective bargaining contract. (Figure 1 and Table A1)
Figure 1 - Urban High-Poverty Schools, Percent of All U.S. Schools, 1999-2000
50.4% - Suburban
22.7% - Rural
2.3% - Urban High-Poverty -
Some or No CB
19.5% - Urban But Not High
Poverty
5.1% - Urban High-Poverty -
High CB
Note: See Appendix Figure B1 for a more detailed breakdown of teachers by urbanicity, poverty and collective bargaining.
In 1999–2000, most teachers transferred voluntarily. Table 2 uses the definition of transferring teachers adopted by NCES, sometimes called movers. It includes transfers to another school within the district and transfers to a different district.17 Almost all transfers in Table 2 are voluntary (see Figure 7 for more information on transfers due to layoffs).18 The calculations are based on the 1999–2000 SASS (about 3,000 transfers), rather than the smaller but more detailed 2000–01 Teacher Follow-Up Survey (approximately 1,000 transfers). Subsequent figures below use the TFS to distinguish between: (1) within-district transfers and those moving to a different school district, and (2) voluntary transfers and layoffs.
17 About half of teacher transfers move to a school in a different school district or a different state, and a small fraction go to private schools (Figure 8). 18 Although some teachers change schools because they were laid off, about nine in 10 teachers voluntarily transfer (Figure 7).
The Impact of Collective Bargaining on Teacher Transfer Rates/ 9
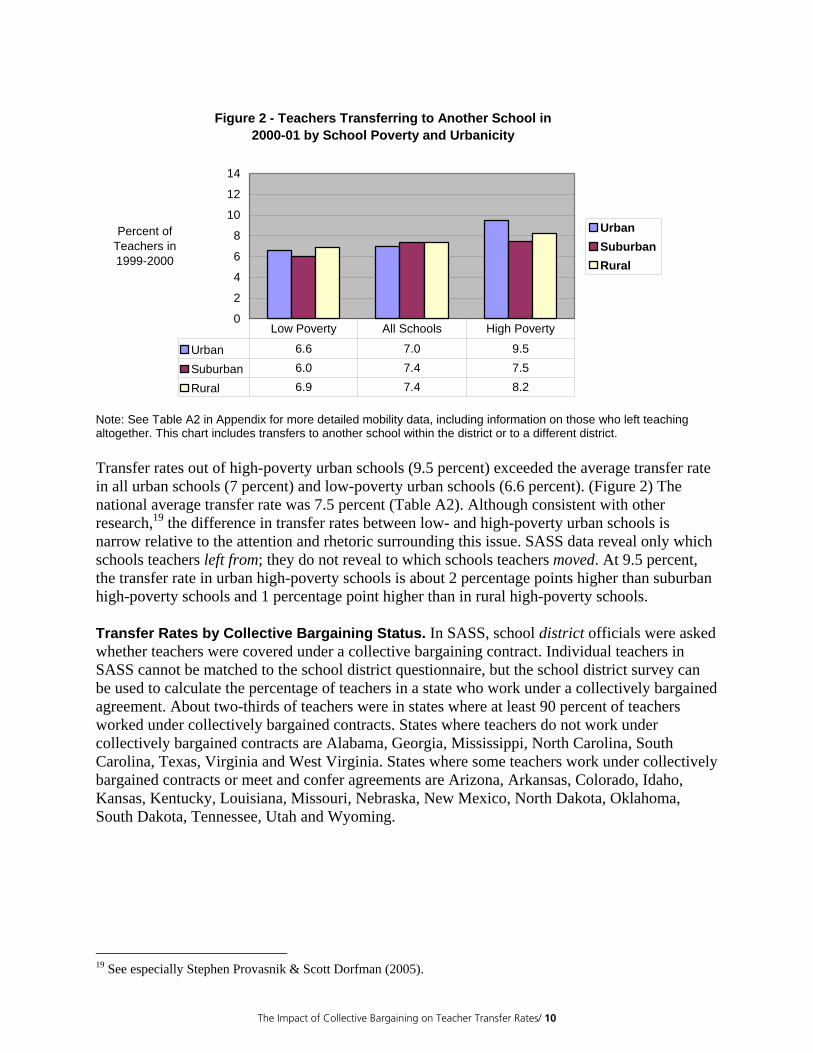
Figure 2 - Teachers Transferring to Another School in 2000-01 by School Poverty and Urbanicity
0
2
4
6
8
10
12
14
Percent of Teachers in 1999-2000
UrbanSuburbanRural
Urban 6.6 7.0 9.5
Suburban 6.0 7.4 7.5
Rural 6.9 7.4 8.2
Low Poverty All Schools High Poverty
Note: See Table A2 in Appendix for more detailed mobility data, including information on those who left teaching altogether. This chart includes transfers to another school within the district or to a different district. Transfer rates out of high-poverty urban schools (9.5 percent) exceeded the average transfer rate in all urban schools (7 percent) and low-poverty urban schools (6.6 percent). (Figure 2) The national average transfer rate was 7.5 percent (Table A2). Although consistent with other research,19 the difference in transfer rates between low- and high-poverty urban schools is narrow relative to the attention and rhetoric surrounding this issue. SASS data reveal only which schools teachers left from; they do not reveal to which schools teachers moved. At 9.5 percent, the transfer rate in urban high-poverty schools is about 2 percentage points higher than suburban high-poverty schools and 1 percentage point higher than in rural high-poverty schools. Transfer Rates by Collective Bargaining Status. In SASS, school district officials were asked whether teachers were covered under a collective bargaining contract. Individual teachers in SASS cannot be matched to the school district questionnaire, but the school district survey can be used to calculate the percentage of teachers in a state who work under a collectively bargained agreement. About two-thirds of teachers were in states where at least 90 percent of teachers worked under collectively bargained contracts. States where teachers do not work under collectively bargained contracts are Alabama, Georgia, Mississippi, North Carolina, South Carolina, Texas, Virginia and West Virginia. States where some teachers work under collectively bargained contracts or meet and confer agreements are Arizona, Arkansas, Colorado, Idaho, Kansas, Kentucky, Louisiana, Missouri, Nebraska, New Mexico, North Dakota, Oklahoma, South Dakota, Tennessee, Utah and Wyoming.
19 See especially Stephen Provasnik & Scott Dorfman (2005).
The Impact of Collective Bargaining on Teacher Transfer Rates/ 10
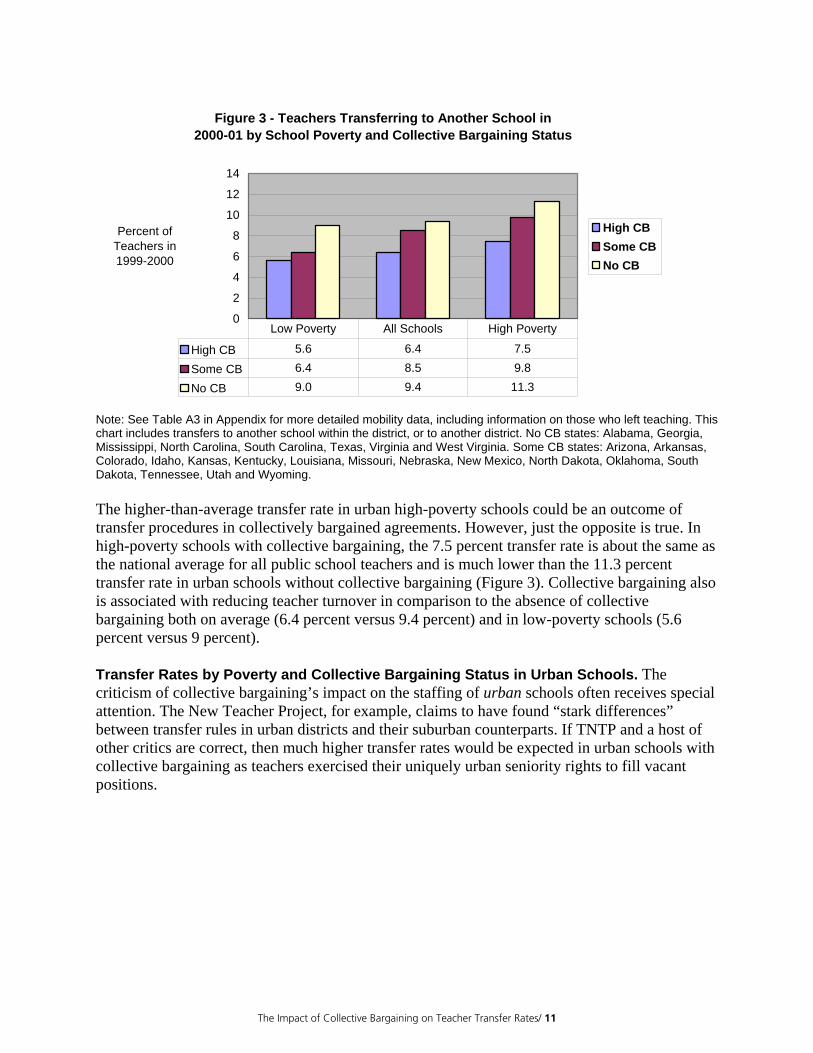
Figure 3 - Teachers Transferring to Another School in 2000-01 by School Poverty and Collective Bargaining Status
0
2
4
6
8
10
12
14
Percent of Teachers in1999-2000
High CBSome CBNo CB
High CB 5.6 6.4 7.5
Some CB 6.4 8.5 9.8
No CB 9.0 9.4 11.3
Low Poverty All Schools High Poverty
Note: See Table A3 in Appendix for more detailed mobility data, including information on those who left teaching. This chart includes transfers to another school within the district, or to another district. No CB states: Alabama, Georgia, Mississippi, North Carolina, South Carolina, Texas, Virginia and West Virginia. Some CB states: Arizona, Arkansas, Colorado, Idaho, Kansas, Kentucky, Louisiana, Missouri, Nebraska, New Mexico, North Dakota, Oklahoma, South Dakota, Tennessee, Utah and Wyoming. The higher-than-average transfer rate in urban high-poverty schools could be an outcome of transfer procedures in collectively bargained agreements. However, just the opposite is true. In high-poverty schools with collective bargaining, the 7.5 percent transfer rate is about the same as the national average for all public school teachers and is much lower than the 11.3 percent transfer rate in urban schools without collective bargaining (Figure 3). Collective bargaining also is associated with reducing teacher turnover in comparison to the absence of collective bargaining both on average (6.4 percent versus 9.4 percent) and in low-poverty schools (5.6 percent versus 9 percent). Transfer Rates by Poverty and Collective Bargaining Status in Urban Schools. The criticism of collective bargaining’s impact on the staffing of urban schools often receives special attention. The New Teacher Project, for example, claims to have found “stark differences” between transfer rules in urban districts and their suburban counterparts. If TNTP and a host of other critics are correct, then much higher transfer rates would be expected in urban schools with collective bargaining as teachers exercised their uniquely urban seniority rights to fill vacant positions.
The Impact of Collective Bargaining on Teacher Transfer Rates/ 11
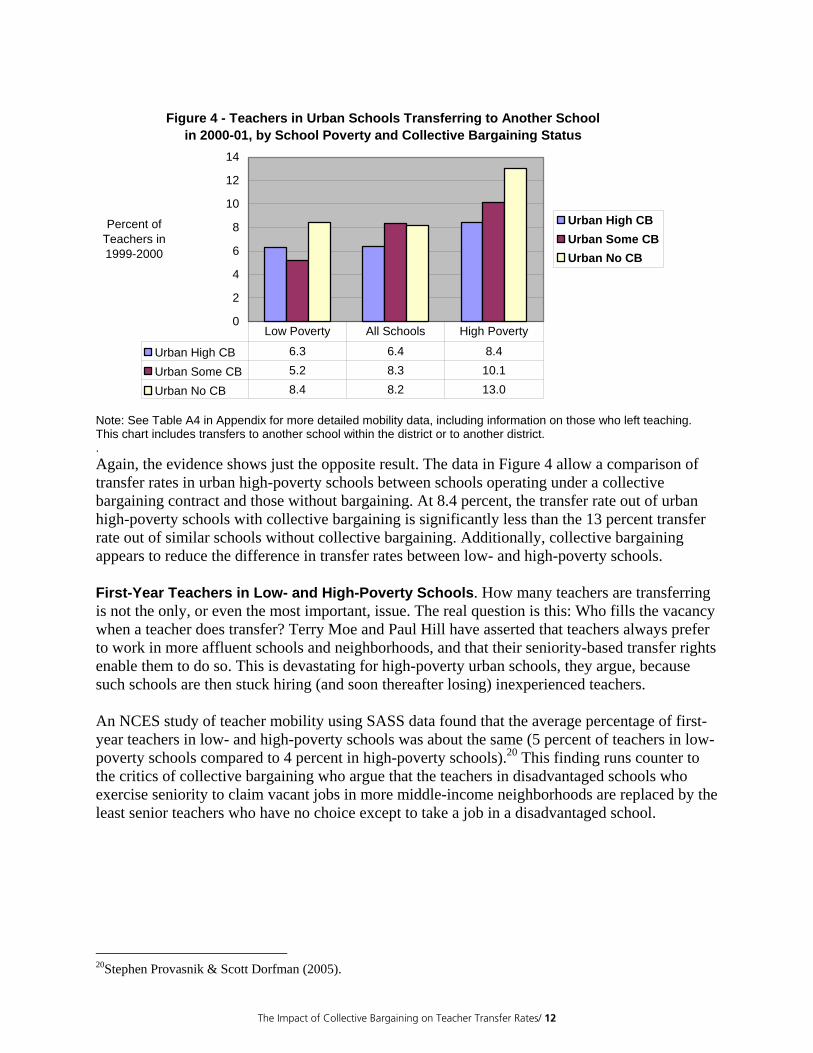
Figure 4 - Teachers in Urban Schools Transferring to Another School in 2000-01, by School Poverty and Collective Bargaining Status
0
2
4
6
8
10
12
14
Percent of Teachers in1999-2000
Urban High CBUrban Some CBUrban No CB
Urban High CB 6.3 6.4 8.4
Urban Some CB 5.2 8.3 10.1
Urban No CB 8.4 8.2 13.0
Low Poverty All Schools High Poverty
Note: See Table A4 in Appendix for more detailed mobility data, including information on those who left teaching. This chart includes transfers to another school within the district or to another district. . Again, the evidence shows just the opposite result. The data in Figure 4 allow a comparison of transfer rates in urban high-poverty schools between schools operating under a collective bargaining contract and those without bargaining. At 8.4 percent, the transfer rate out of urban high-poverty schools with collective bargaining is significantly less than the 13 percent transfer rate out of similar schools without collective bargaining. Additionally, collective bargaining appears to reduce the difference in transfer rates between low- and high-poverty schools. First-Year Teachers in Low- and High-Poverty Schools. How many teachers are transferring is not the only, or even the most important, issue. The real question is this: Who fills the vacancy when a teacher does transfer? Terry Moe and Paul Hill have asserted that teachers always prefer to work in more affluent schools and neighborhoods, and that their seniority-based transfer rights enable them to do so. This is devastating for high-poverty urban schools, they argue, because such schools are then stuck hiring (and soon thereafter losing) inexperienced teachers. An NCES study of teacher mobility using SASS data found that the average percentage of first-year teachers in low- and high-poverty schools was about the same (5 percent of teachers in low-poverty schools compared to 4 percent in high-poverty schools).20 This finding runs counter to the critics of collective bargaining who argue that the teachers in disadvantaged schools who exercise seniority to claim vacant jobs in more middle-income neighborhoods are replaced by the least senior teachers who have no choice except to take a job in a disadvantaged school.
20Stephen Provasnik & Scott Dorfman (2005).
The Impact of Collective Bargaining on Teacher Transfer Rates/ 12
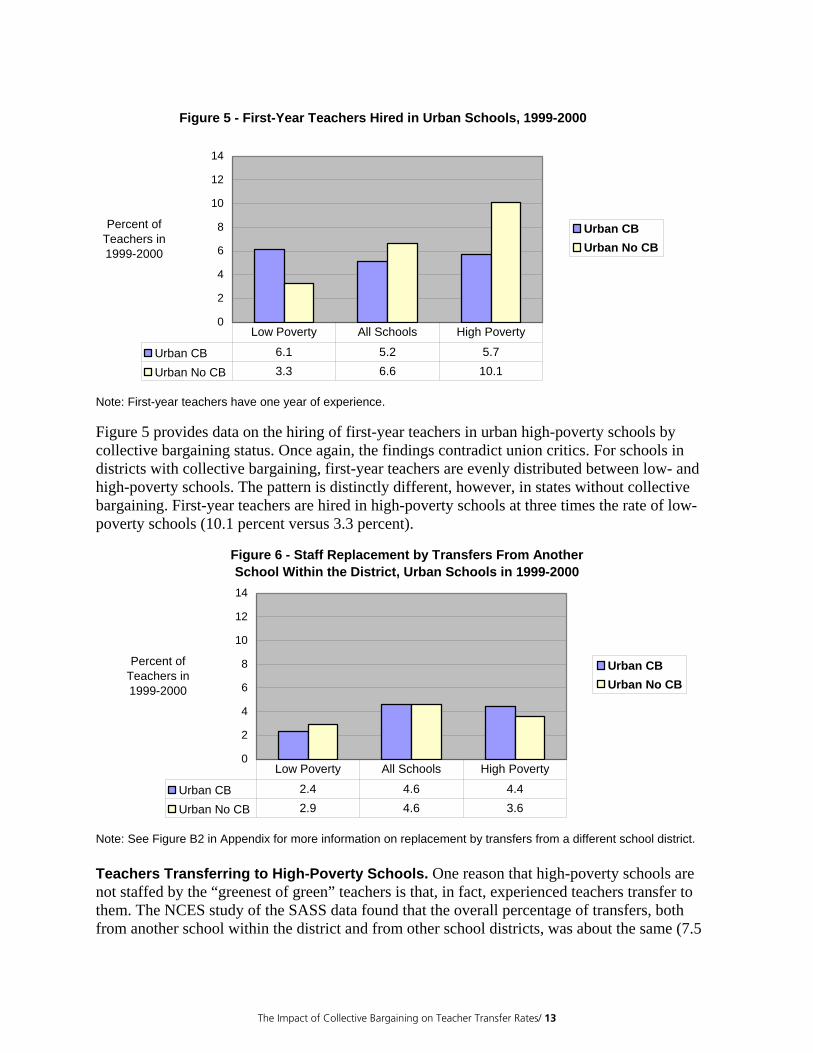
Figure 5 - First-Year Teachers Hired in Urban Schools, 1999-2000
0
2
4
6
8
10
12
14
Percent of Teachers in1999-2000
Urban CBUrban No CB
Urban CB 6.1 5.2 5.7
Urban No CB 3.3 6.6 10.1
Low Poverty All Schools High Poverty
Note: First-year teachers have one year of experience. Figure 5 provides data on the hiring of first-year teachers in urban high-poverty schools by collective bargaining status. Once again, the findings contradict union critics. For schools in districts with collective bargaining, first-year teachers are evenly distributed between low- and high-poverty schools. The pattern is distinctly different, however, in states without collective bargaining. First-year teachers are hired in high-poverty schools at three times the rate of low-poverty schools (10.1 percent versus 3.3 percent).
Figure 6 - Staff Replacement by Transfers From AnotherSchool Within the District, Urban Schools in 1999-2000
0
2
4
6
8
10
12
14
Percent of Teachers in1999-2000
Urban CBUrban No CB
Urban CB 2.4 4.6 4.4
Urban No CB 2.9 4.6 3.6
Low Poverty All Schools High Poverty
Note: See Figure B2 in Appendix for more information on replacement by transfers from a different school district. Teachers Transferring to High-Poverty Schools. One reason that high-poverty schools are not staffed by the “greenest of green” teachers is that, in fact, experienced teachers transfer to them. The NCES study of the SASS data found that the overall percentage of transfers, both from another school within the district and from other school districts, was about the same (7.5
The Impact of Collective Bargaining on Teacher Transfer Rates/ 13
percent in low-poverty schools compared to 8.5 percent in high-poverty schools).21 These findings are opposite of what one would find if teachers were using seniority to claim positions in more middle-class schools. Figure 6 presents the percent of teachers who transferred into low- and high-poverty schools in 1999–2000 from another school in the same district—the transfers that would be influenced by collective bargaining agreements. The findings reveal that high-poverty schools are more likely than low-poverty schools to fill vacancies with transfers from another school in the district. Transfers Attributable to Layoffs. Paul Hill and others argue that seniority-based layoffs lead to chain-reaction teacher turnover as the more senior teachers who are laid off or excessed displace less experienced teachers, who become involuntary transfers and in turn displace even less senior teachers. However, this description incorrectly describes how displacement and layoffs actually work and the evidence shows only modest involuntary transfer activity. The transfers examined in Figures 1 through 6 include both voluntary transfers and involuntary transfers created by layoffs or “excessing.” As shown in Figure 7, when the two categories of transfers are disaggregated, 6.6 percent of teachers reported that their transfers were voluntary and 0.7 percent of teachers said that a layoff was the reason for their transfer to another school or another district. In voluntary transfers, teachers initiate the transfer by applying for a vacant teaching position at another school. Senior teachers cannot displace a teacher with less seniority from a job held by a less senior teacher just because they “want” that assignment. When filling a vacant position, principals or administrators choose a teacher based on a number of factors, (e.g. subject area specialization, grade level, experience and certification). In some collectively bargained agreements, the most senior applicant is guaranteed and interview but not the job. In other agreements, seniority is sometimes specified as a “tie-breaker” when two or more candidates are equally qualified based on the other factors (Appendix C). When a teacher is laid off (or, when due to school-level enrollment declines or budget cutbacks a teacher is “excessed” or “displaced”), seniority provisions in the collective bargaining agreement are designed to provide a fair and orderly process for the layoffs. In general, displaced teachers first seek vacant positions for which they are qualified, and they usually have priority over voluntary transfers. After exhausting that avenue, many school districts administratively place displaced teachers. Generally, the least senior teachers lose their jobs only in the event of system-wide staff reduction or layoffs. However, even in staff reduction situations, more senior teachers cannot claim jobs for which they are not qualified by specialization, certification and other factors. In addition, Hill’s scenario that chain-reaction displacement caused by excessing has a disproportionate impact on hard-to-staff schools is inconsistent with the fact that those schools tend to have more vacancies. Therefore, if there is seniority-driven placement of laid-off teachers, it has the effect, if any, of improving the distribution of experienced teachers, especially if the laid-off teacher took a position that would otherwise be filled by a first-year teacher. 21Stephen Provasnik & Scott Dorfman (2005).
The Impact of Collective Bargaining on Teacher Transfer Rates/ 14
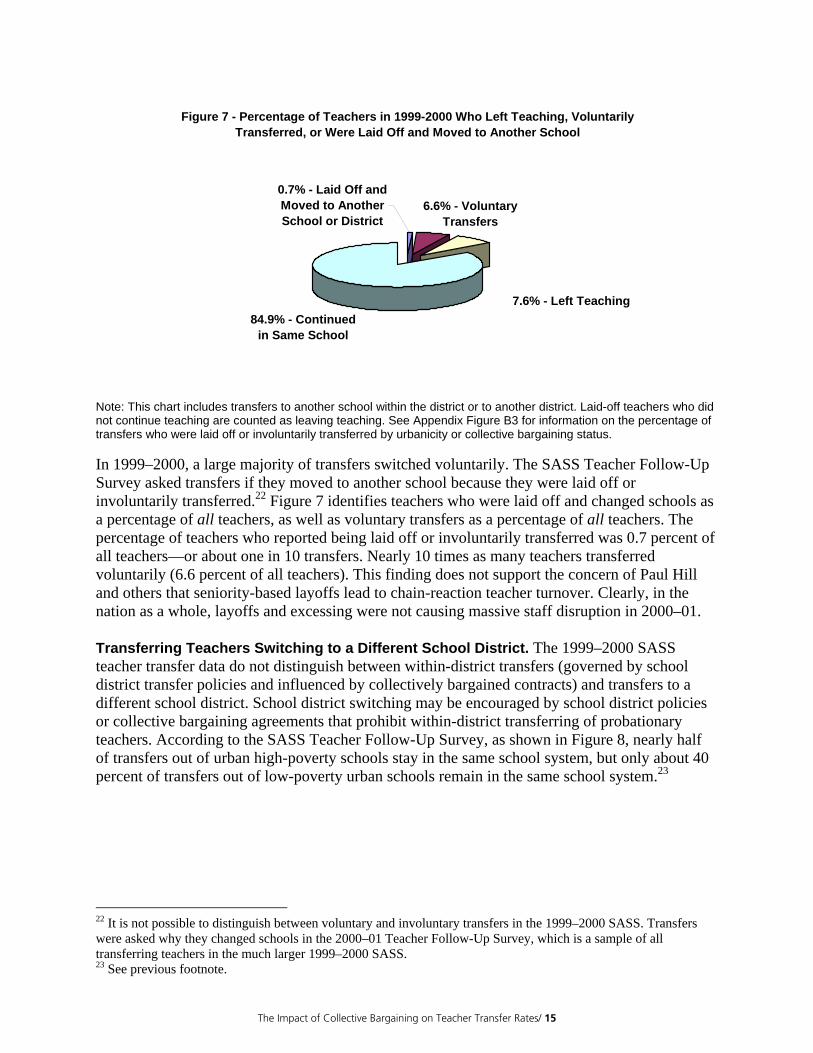
Figure 7 - Percentage of Teachers in 1999-2000 Who Left Teaching, Voluntarily Transferred, or Were Laid Off and Moved to Another School
6.6% - Voluntary Transfers
84.9% - Continued in Same School
7.6% - Left Teaching
0.7% - Laid Off and Moved to Another School or District
Note: This chart includes transfers to another school within the district or to another district. Laid-off teachers who did not continue teaching are counted as leaving teaching. See Appendix Figure B3 for information on the percentage of transfers who were laid off or involuntarily transferred by urbanicity or collective bargaining status. In 1999–2000, a large majority of transfers switched voluntarily. The SASS Teacher Follow-Up Survey asked transfers if they moved to another school because they were laid off or involuntarily transferred.22 Figure 7 identifies teachers who were laid off and changed schools as a percentage of all teachers, as well as voluntary transfers as a percentage of all teachers. The percentage of teachers who reported being laid off or involuntarily transferred was 0.7 percent of all teachers—or about one in 10 transfers. Nearly 10 times as many teachers transferred voluntarily (6.6 percent of all teachers). This finding does not support the concern of Paul Hill and others that seniority-based layoffs lead to chain-reaction teacher turnover. Clearly, in the nation as a whole, layoffs and excessing were not causing massive staff disruption in 2000–01. Transferring Teachers Switching to a Different School District. The 1999–2000 SASS teacher transfer data do not distinguish between within-district transfers (governed by school district transfer policies and influenced by collectively bargained contracts) and transfers to a different school district. School district switching may be encouraged by school district policies or collective bargaining agreements that prohibit within-district transferring of probationary teachers. According to the SASS Teacher Follow-Up Survey, as shown in Figure 8, nearly half of transfers out of urban high-poverty schools stay in the same school system, but only about 40 percent of transfers out of low-poverty urban schools remain in the same school system.23
22 It is not possible to distinguish between voluntary and involuntary transfers in the 1999–2000 SASS. Transfers were asked why they changed schools in the 2000–01 Teacher Follow-Up Survey, which is a sample of all transferring teachers in the much larger 1999–2000 SASS. 23 See previous footnote.
The Impact of Collective Bargaining on Teacher Transfer Rates/ 15
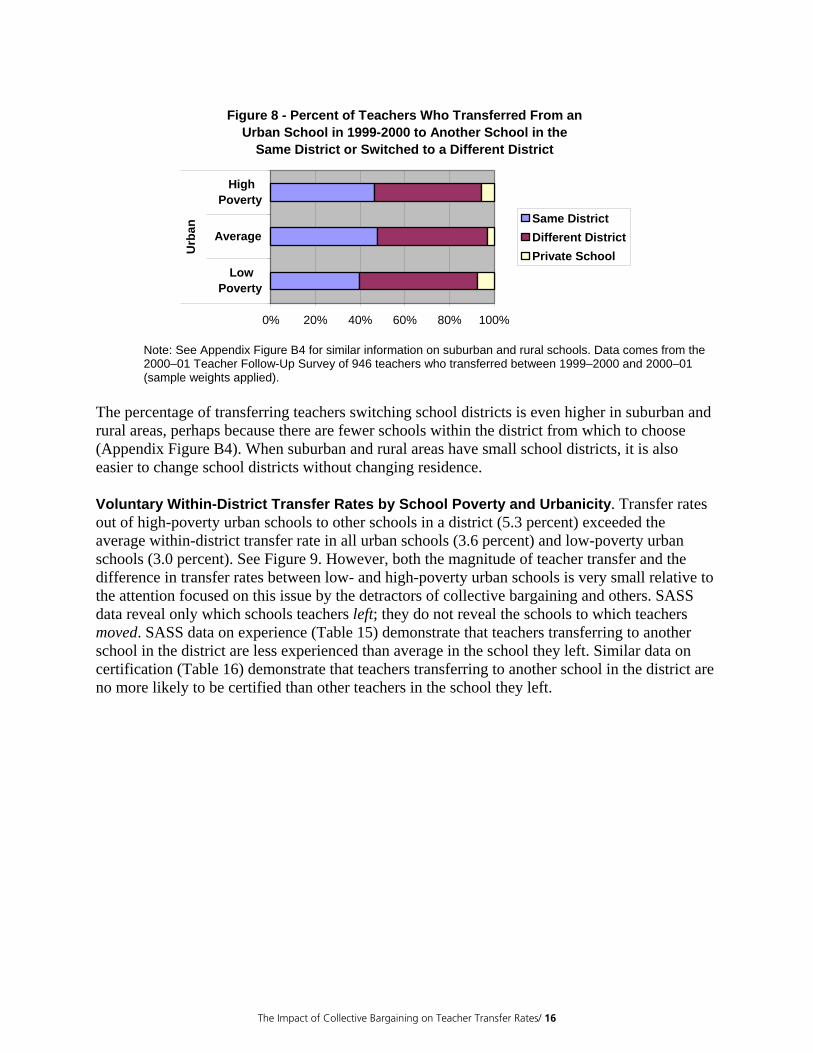
Figure 8 - Percent of Teachers Who Transferred From an Urban School in 1999-2000 to Another School in the
Same District or Switched to a Different District
0% 20% 40% 60% 80% 100%
LowPoverty
Average
HighPoverty
Urb
an
Same DistrictDifferent DistrictPrivate School
Note: See Appendix Figure B4 for similar information on suburban and rural schools. Data comes from the 2000–01 Teacher Follow-Up Survey of 946 teachers who transferred between 1999–2000 and 2000–01 (sample weights applied).
The percentage of transferring teachers switching school districts is even higher in suburban and rural areas, perhaps because there are fewer schools within the district from which to choose (Appendix Figure B4). When suburban and rural areas have small school districts, it is also easier to change school districts without changing residence. Voluntary Within-District Transfer Rates by School Poverty and Urbanicity. Transfer rates out of high-poverty urban schools to other schools in a district (5.3 percent) exceeded the average within-district transfer rate in all urban schools (3.6 percent) and low-poverty urban schools (3.0 percent). See Figure 9. However, both the magnitude of teacher transfer and the difference in transfer rates between low- and high-poverty urban schools is very small relative to the attention focused on this issue by the detractors of collective bargaining and others. SASS data reveal only which schools teachers left; they do not reveal the schools to which teachers moved. SASS data on experience (Table 15) demonstrate that teachers transferring to another school in the district are less experienced than average in the school they left. Similar data on certification (Table 16) demonstrate that teachers transferring to another school in the district are no more likely to be certified than other teachers in the school they left.
The Impact of Collective Bargaining on Teacher Transfer Rates/ 16
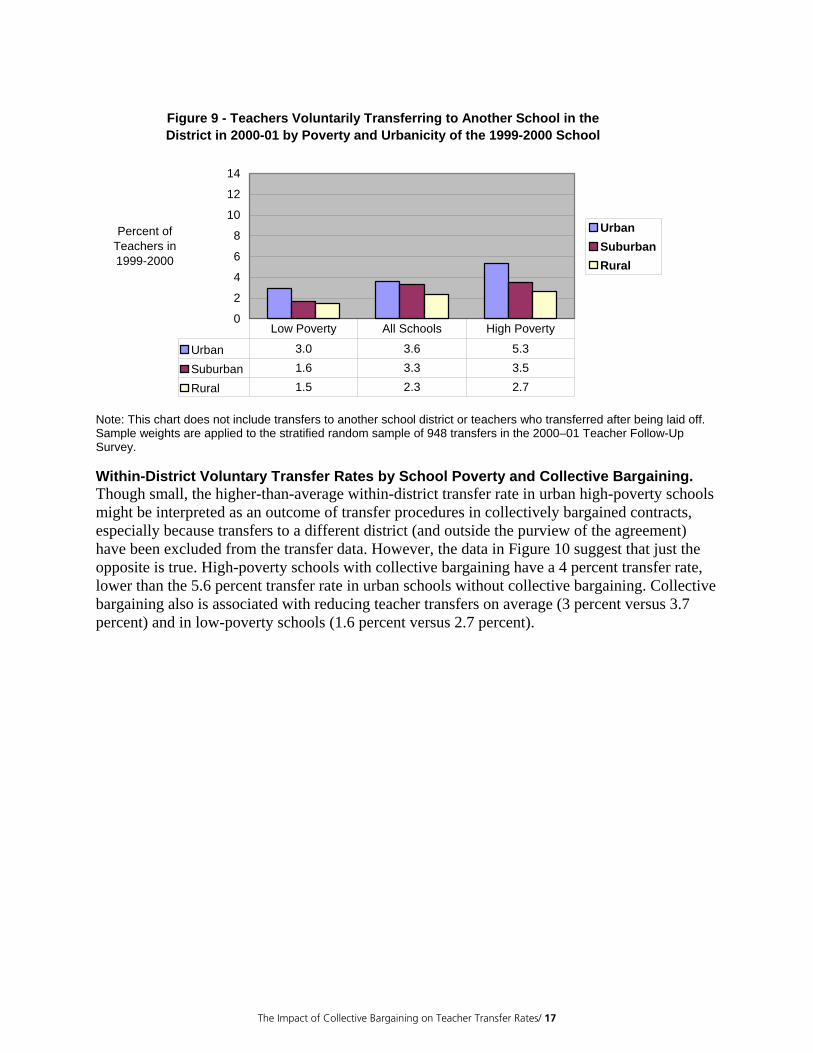
Figure 9 - Teachers Voluntarily Transferring to Another School in the District in 2000-01 by Poverty and Urbanicity of the 1999-2000 School
0
2
4
6
8
10
12
14
Percent of Teachers in 1999-2000
UrbanSuburbanRural
Urban 3.0 3.6 5.3
Suburban 1.6 3.3 3.5
Rural 1.5 2.3 2.7
Low Poverty All Schools High Poverty
Note: This chart does not include transfers to another school district or teachers who transferred after being laid off. Sample weights are applied to the stratified random sample of 948 transfers in the 2000–01 Teacher Follow-Up Survey. Within-District Voluntary Transfer Rates by School Poverty and Collective Bargaining. Though small, the higher-than-average within-district transfer rate in urban high-poverty schools might be interpreted as an outcome of transfer procedures in collectively bargained contracts, especially because transfers to a different district (and outside the purview of the agreement) have been excluded from the transfer data. However, the data in Figure 10 suggest that just the opposite is true. High-poverty schools with collective bargaining have a 4 percent transfer rate, lower than the 5.6 percent transfer rate in urban schools without collective bargaining. Collective bargaining also is associated with reducing teacher transfers on average (3 percent versus 3.7 percent) and in low-poverty schools (1.6 percent versus 2.7 percent).
The Impact of Collective Bargaining on Teacher Transfer Rates/ 17
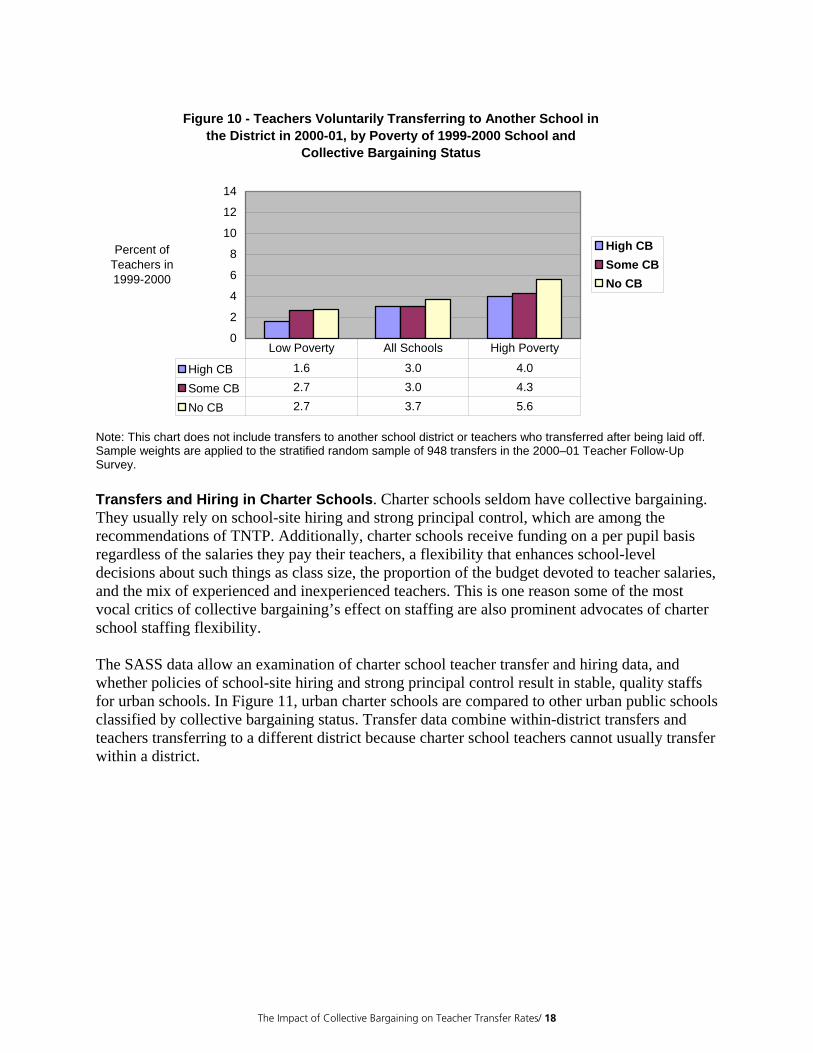
Figure 10 - Teachers Voluntarily Transferring to Another School in the District in 2000-01, by Poverty of 1999-2000 School and
Collective Bargaining Status
0
2
4
6
8
10
12
14
Percent of Teachers in1999-2000
High CBSome CBNo CB
High CB 1.6 3.0 4.0
Some CB 2.7 3.0 4.3
No CB 2.7 3.7 5.6
Low Poverty All Schools High Poverty
Note: This chart does not include transfers to another school district or teachers who transferred after being laid off. Sample weights are applied to the stratified random sample of 948 transfers in the 2000–01 Teacher Follow-Up Survey. Transfers and Hiring in Charter Schools. Charter schools seldom have collective bargaining. They usually rely on school-site hiring and strong principal control, which are among the recommendations of TNTP. Additionally, charter schools receive funding on a per pupil basis regardless of the salaries they pay their teachers, a flexibility that enhances school-level decisions about such things as class size, the proportion of the budget devoted to teacher salaries, and the mix of experienced and inexperienced teachers. This is one reason some of the most vocal critics of collective bargaining’s effect on staffing are also prominent advocates of charter school staffing flexibility. The SASS data allow an examination of charter school teacher transfer and hiring data, and whether policies of school-site hiring and strong principal control result in stable, quality staffs for urban schools. In Figure 11, urban charter schools are compared to other urban public schools classified by collective bargaining status. Transfer data combine within-district transfers and teachers transferring to a different district because charter school teachers cannot usually transfer within a district.
The Impact of Collective Bargaining on Teacher Transfer Rates/ 18
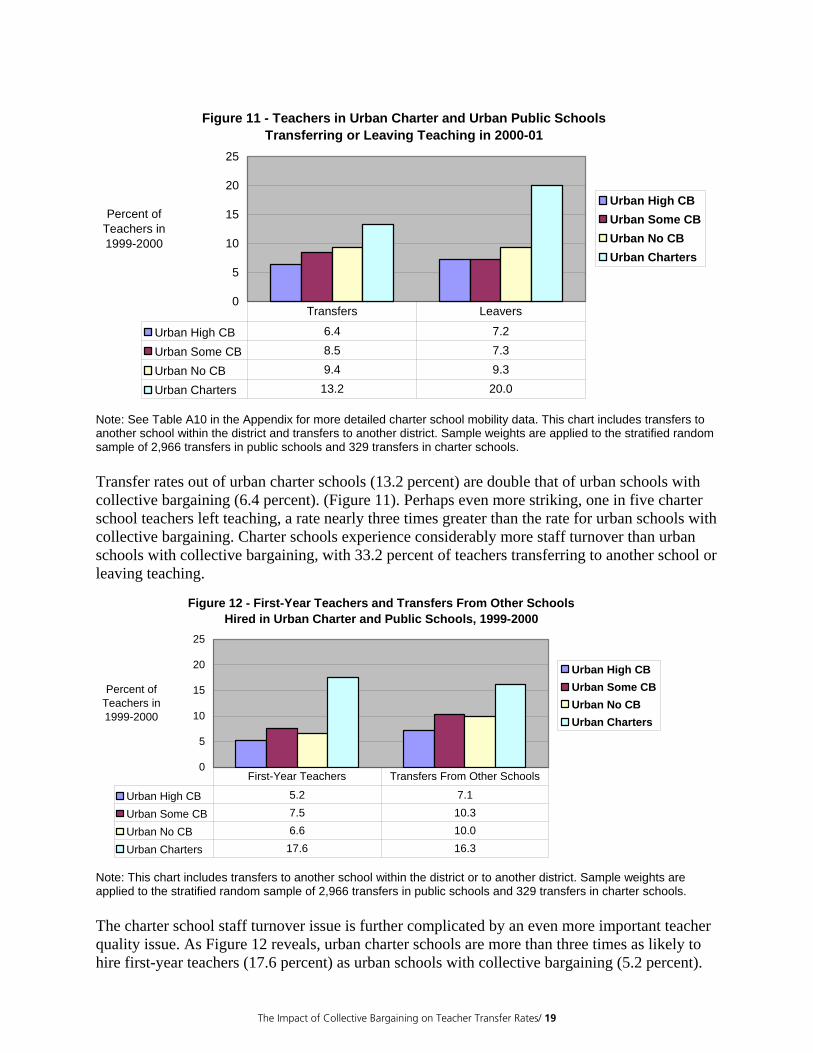
Figure 11 - Teachers in Urban Charter and Urban Public Schools Transferring or Leaving Teaching in 2000-01
0
5
10
15
20
25
Percent of Teachers in1999-2000
Urban High CBUrban Some CBUrban No CBUrban Charters
Urban High CB 6.4 7.2
Urban Some CB 8.5 7.3
Urban No CB 9.4 9.3
Urban Charters 13.2 20.0
Transfers Leavers
Note: See Table A10 in the Appendix for more detailed charter school mobility data. This chart includes transfers to another school within the district and transfers to another district. Sample weights are applied to the stratified random sample of 2,966 transfers in public schools and 329 transfers in charter schools. Transfer rates out of urban charter schools (13.2 percent) are double that of urban schools with collective bargaining (6.4 percent). (Figure 11). Perhaps even more striking, one in five charter school teachers left teaching, a rate nearly three times greater than the rate for urban schools with collective bargaining. Charter schools experience considerably more staff turnover than urban schools with collective bargaining, with 33.2 percent of teachers transferring to another school or leaving teaching.
Figure 12 - First-Year Teachers and Transfers From Other Schools Hired in Urban Charter and Public Schools, 1999-2000
0
5
10
15
20
25
Percent of Teachers in1999-2000
Urban High CBUrban Some CBUrban No CBUrban Charters
Urban High CB 5.2 7.1
Urban Some CB 7.5 10.3
Urban No CB 6.6 10.0
Urban Charters 17.6 16.3
First-Year Teachers Transfers From Other Schools
Note: This chart includes transfers to another school within the district or to another district. Sample weights are applied to the stratified random sample of 2,966 transfers in public schools and 329 transfers in charter schools. The charter school staff turnover issue is further complicated by an even more important teacher quality issue. As Figure 12 reveals, urban charter schools are more than three times as likely to hire first-year teachers (17.6 percent) as urban schools with collective bargaining (5.2 percent).
The Impact of Collective Bargaining on Teacher Transfer Rates/ 19

IV. Why Teachers Transfer from Urban High-Poverty Schools Those who argue that teachers exercise seniority provisions in collective bargaining agreements to claim positions in another school make the assumption that, ahead of most other considerations, teachers seek out schools in more middle-class neighborhoods. However, teacher decisions to transfer involve a variety of factors, including finding a job closer to home, changing residence, or wanting to work with a different principal. The 2000–01 Teacher Follow-Up Survey (TFS) asked teachers who had transferred to identify which of 17 reasons on the list shown below was extremely or very important in their decision to leave “last year’s school.”
• I changed my residence. • Salary or benefits are better at this year’s school. • I felt job security would be higher at this year’s school. • I had an opportunity for a better teaching assignment (subject area or grade level) at this
year’s school. • I was dissatisfied with workplace conditions (e.g., facilities, classroom resources, school
safety, student behavior, parent and community support) at last year’s school. • I was dissatisfied with support from administrators at last year’s school. • I was dissatisfied with changes in my job description or responsibilities. • I did not feel prepared to implement new reform measures. • I did not agree with new reform measures. • I was laid off or involuntarily transferred. • I did not have enough autonomy over my classroom at last year’s school. • I was dissatisfied with opportunities for professional development at last year’s school. • I was dissatisfied with last year’s school for other reasons not included above.
Figure 13 ranks the reasons from most to least important for all transfers and then compares the results to transfers who had taught in a high-poverty school in 1999–2000.
The Impact of Collective Bargaining on Teacher Transfer Rates/ 20
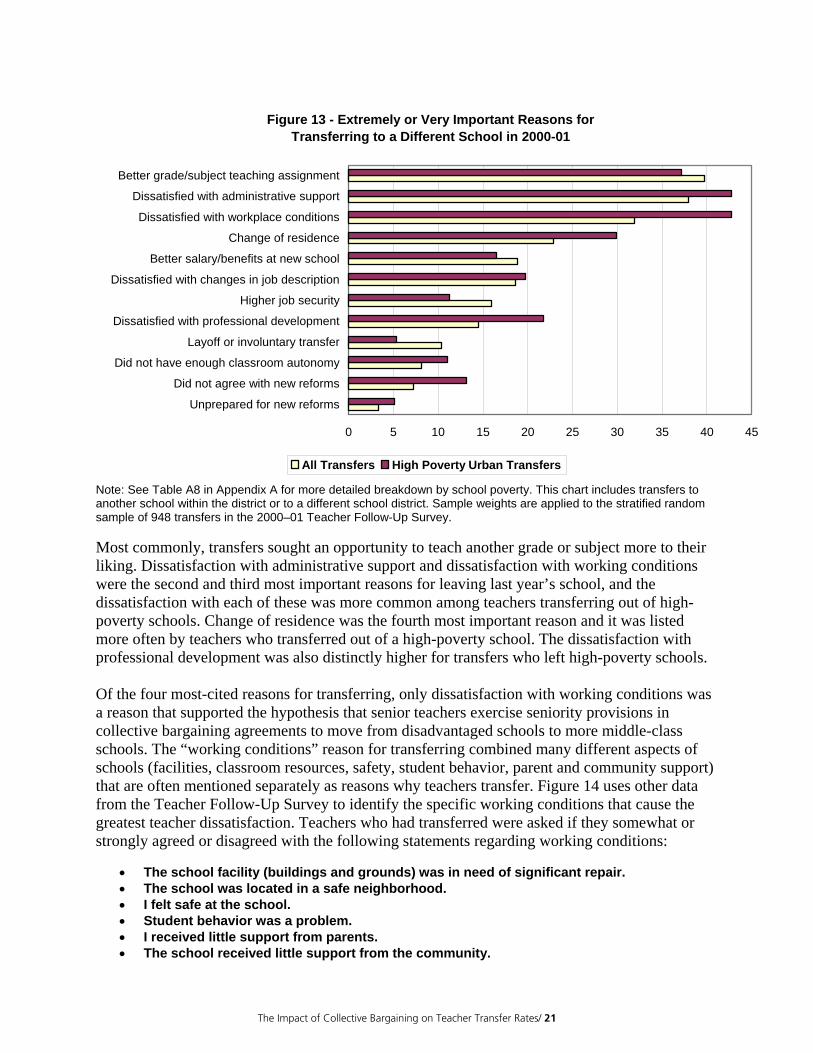
Figure 13 - Extremely or Very Important Reasons for Transferring to a Different School in 2000-01
0 5 10 15 20 25 30 35 40 45
Unprepared for new reforms
Did not agree with new reforms
Did not have enough classroom autonomy
Layoff or involuntary transfer
Dissatisfied with professional development
Higher job security
Dissatisfied with changes in job description
Better salary/benefits at new school
Change of residence
Dissatisfied with workplace conditions
Dissatisfied with administrative support
Better grade/subject teaching assignment
All Transfers High Poverty Urban Transfers
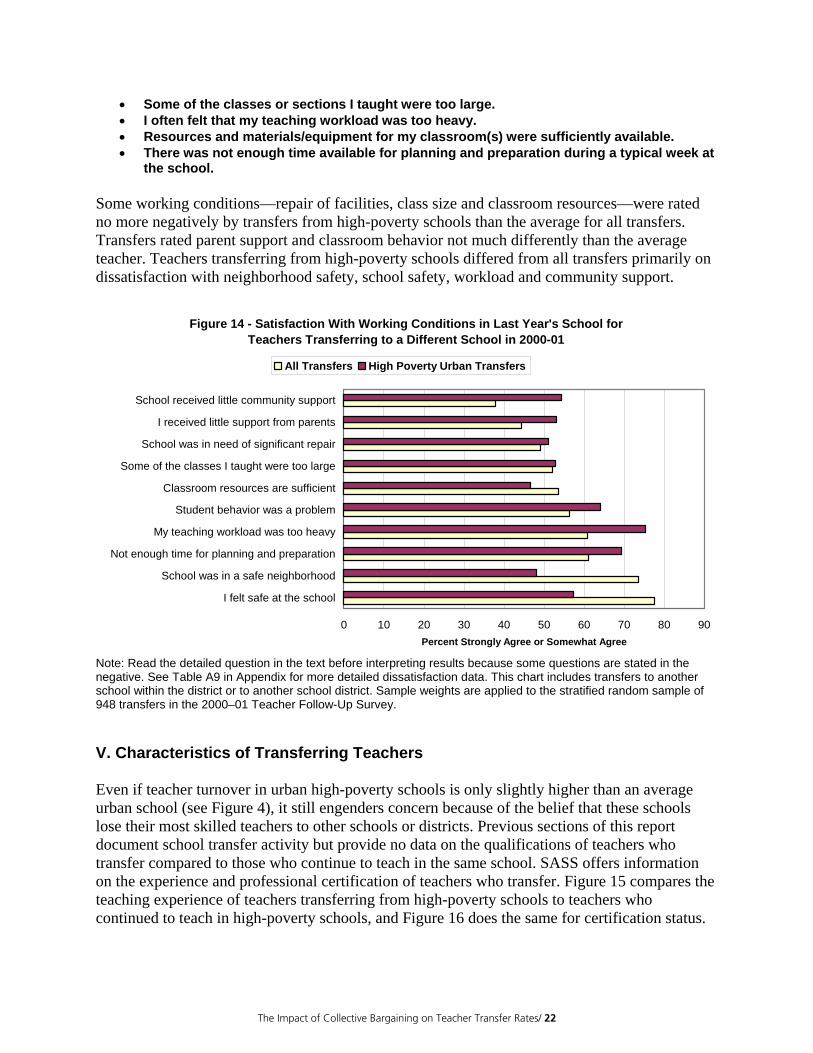
Note: See Table A8 in Appendix A for more detailed breakdown by school poverty. This chart includes transfers to another school within the district or to a different school district. Sample weights are applied to the stratified random sample of 948 transfers in the 2000–01 Teacher Follow-Up Survey. Most commonly, transfers sought an opportunity to teach another grade or subject more to their liking. Dissatisfaction with administrative support and dissatisfaction with working conditions were the second and third most important reasons for leaving last year’s school, and the dissatisfaction with each of these was more common among teachers transferring out of high-poverty schools. Change of residence was the fourth most important reason and it was listed more often by teachers who transferred out of a high-poverty school. The dissatisfaction with professional development was also distinctly higher for transfers who left high-poverty schools. Of the four most-cited reasons for transferring, only dissatisfaction with working conditions was a reason that supported the hypothesis that senior teachers exercise seniority provisions in collective bargaining agreements to move from disadvantaged schools to more middle-class schools. The “working conditions” reason for transferring combined many different aspects of schools (facilities, classroom resources, safety, student behavior, parent and community support) that are often mentioned separately as reasons why teachers transfer. Figure 14 uses other data from the Teacher Follow-Up Survey to identify the specific working conditions that cause the greatest teacher dissatisfaction. Teachers who had transferred were asked if they somewhat or strongly agreed or disagreed with the following statements regarding working conditions:
• The school facility (buildings and grounds) was in need of significant repair. • The school was located in a safe neighborhood. • I felt safe at the school. • Student behavior was a problem. • I received little support from parents. • The school received little support from the community.
The Impact of Collective Bargaining on Teacher Transfer Rates/ 21
• Some of the classes or sections I taught were too large. • I often felt that my teaching workload was too heavy. • Resources and materials/equipment for my classroom(s) were sufficiently available. • There was not enough time available for planning and preparation during a typical week at
the school. Some working conditions—repair of facilities, class size and classroom resources—were rated no more negatively by transfers from high-poverty schools than the average for all transfers. Transfers rated parent support and classroom behavior not much differently than the average teacher. Teachers transferring from high-poverty schools differed from all transfers primarily on dissatisfaction with neighborhood safety, school safety, workload and community support.
Figure 14 - Satisfaction With Working Conditions in Last Year's School for Teachers Transferring to a Different School in 2000-01
0 10 20 30 40 50 60 70 80 9
I felt safe at the school
School was in a safe neighborhood
Not enough time for planning and preparation
My teaching workload was too heavy
Student behavior was a problem
Classroom resources are sufficient
Some of the classes I taught were too large
School was in need of significant repair
I received little support from parents
School received little community support
Percent Strongly Agree or Somewhat Agree0
All Transfers High Poverty Urban Transfers
Note: Read the detailed question in the text before interpreting results because some questions are stated in the negative. See Table A9 in Appendix for more detailed dissatisfaction data. This chart includes transfers to another school within the district or to another school district. Sample weights are applied to the stratified random sample of 948 transfers in the 2000–01 Teacher Follow-Up Survey. V. Characteristics of Transferring Teachers Even if teacher turnover in urban high-poverty schools is only slightly higher than an average urban school (see Figure 4), it still engenders concern because of the belief that these schools lose their most skilled teachers to other schools or districts. Previous sections of this report document school transfer activity but provide no data on the qualifications of teachers who transfer compared to those who continue to teach in the same school. SASS offers information on the experience and professional certification of teachers who transfer. Figure 15 compares the teaching experience of teachers transferring from high-poverty schools to teachers who continued to teach in high-poverty schools, and Figure 16 does the same for certification status.
The Impact of Collective Bargaining on Teacher Transfer Rates/ 22
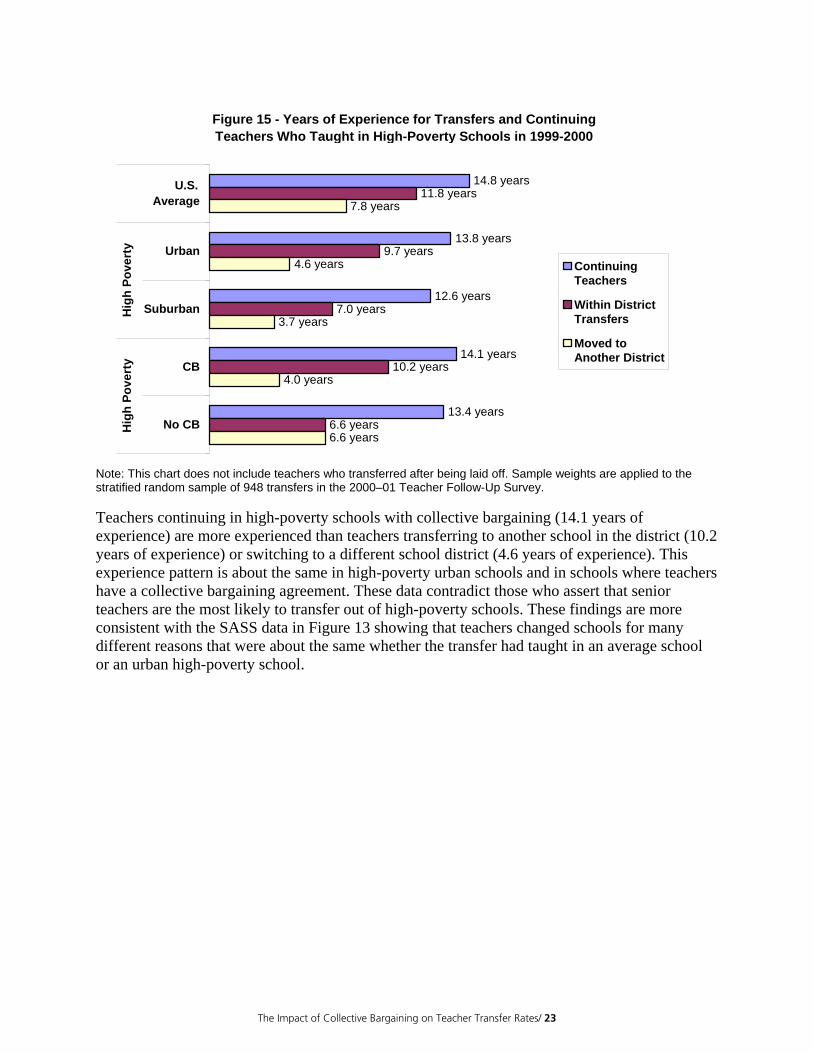
Figure 15 - Years of Experience for Transfers and ContinuingTeachers Who Taught in High-Poverty Schools in 1999-2000
13.4 years
14.1 years
12.6 years
13.8 years
14.8 years
6.6 years
10.2 years
7.0 years
9.7 years
11.8 years
6.6 years
4.0 years
3.7 years
4.6 years
7.8 years
U.S.Average
Urban
Suburban
CB
No CB
Hig
h Po
vert
yH
igh
Pove
rty
ContinuingTeachers
Within DistrictTransfers
Moved toAnother District
Note: This chart does not include teachers who transferred after being laid off. Sample weights are applied to the stratified random sample of 948 transfers in the 2000–01 Teacher Follow-Up Survey. Teachers continuing in high-poverty schools with collective bargaining (14.1 years of experience) are more experienced than teachers transferring to another school in the district (10.2 years of experience) or switching to a different school district (4.6 years of experience). This experience pattern is about the same in high-poverty urban schools and in schools where teachers have a collective bargaining agreement. These data contradict those who assert that senior teachers are the most likely to transfer out of high-poverty schools. These findings are more consistent with the SASS data in Figure 13 showing that teachers changed schools for many different reasons that were about the same whether the transfer had taught in an average school or an urban high-poverty school.
The Impact of Collective Bargaining on Teacher Transfer Rates/ 23
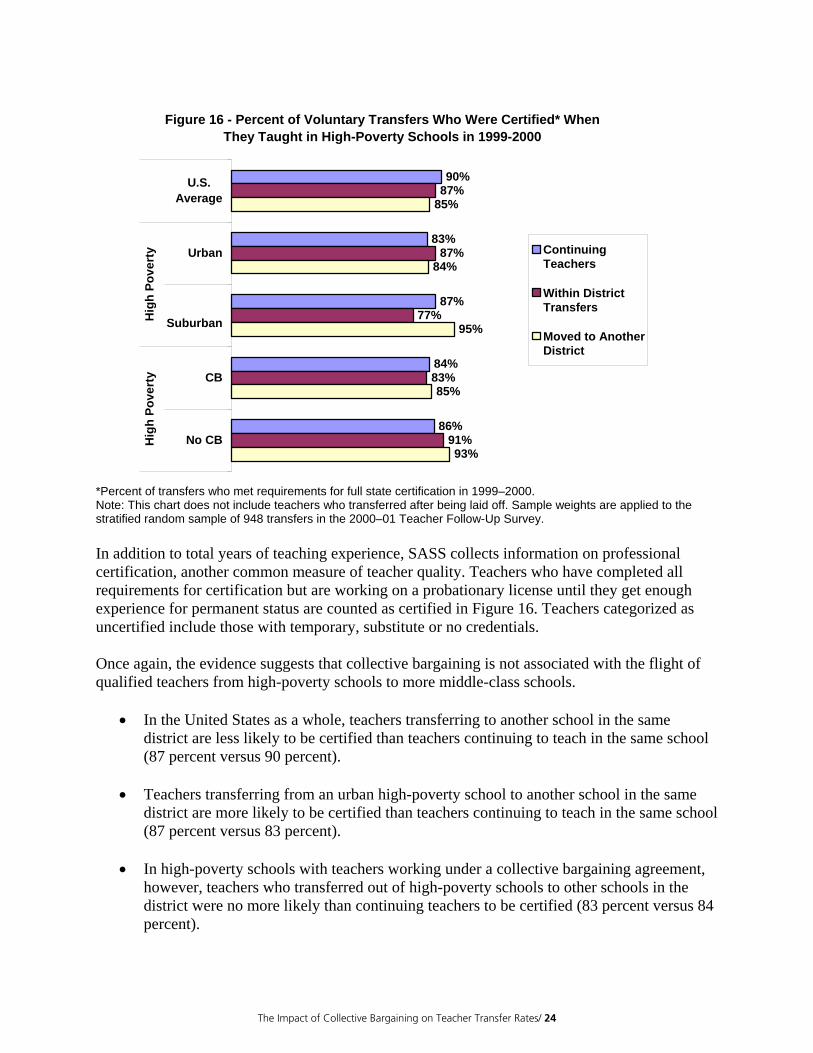
Figure 16 - Percent of Voluntary Transfers Who Were Certified* When They Taught in High-Poverty Schools in 1999-2000
90%
83%
87%
84%
86%
87%
87%
77%
83%
91%
85%
84%
95%
85%
93%
U.S.Average
Urban
Suburban
CB
No CB
Hig
h Po
vert
yH
igh
Pove
rty
ContinuingTeachers
Within DistrictTransfers
Moved to AnotherDistrict
*Percent of transfers who met requirements for full state certification in 1999–2000. Note: This chart does not include teachers who transferred after being laid off. Sample weights are applied to the stratified random sample of 948 transfers in the 2000–01 Teacher Follow-Up Survey. In addition to total years of teaching experience, SASS collects information on professional certification, another common measure of teacher quality. Teachers who have completed all requirements for certification but are working on a probationary license until they get enough experience for permanent status are counted as certified in Figure 16. Teachers categorized as uncertified include those with temporary, substitute or no credentials. Once again, the evidence suggests that collective bargaining is not associated with the flight of qualified teachers from high-poverty schools to more middle-class schools.
• In the United States as a whole, teachers transferring to another school in the same district are less likely to be certified than teachers continuing to teach in the same school (87 percent versus 90 percent).
• Teachers transferring from an urban high-poverty school to another school in the same
district are more likely to be certified than teachers continuing to teach in the same school (87 percent versus 83 percent).
• In high-poverty schools with teachers working under a collective bargaining agreement,
however, teachers who transferred out of high-poverty schools to other schools in the district were no more likely than continuing teachers to be certified (83 percent versus 84 percent).
The Impact of Collective Bargaining on Teacher Transfer Rates/ 24
• Without collective bargaining, teachers who transferred out of high-poverty schools to other schools in the district were more likely to be certified than continuing teachers (91 percent versus 86 percent).
VI. Conclusion Using a large national database, our report found no evidence that collective bargaining agreements contribute to shortages of qualified teachers in urban high-poverty schools. If anything, the evidence indicates that collective bargaining is associated with lower transfer rates out of urban high-poverty schools to another school in the district or to a school in a different district. Perhaps more important, in urban school districts with a collective bargaining agreement, low-poverty schools are about as likely as high-poverty schools to replace transferring teachers with first-year teachers. Without a collective bargaining agreement, high-poverty schools hire first-year teachers at three times the rate of low-poverty schools. The attention focused on teacher seniority and collective bargaining as causes of the urban teacher shortage needs to be redirected to solutions for the real problem: attracting and retaining teachers who are prepared to teach in urban schools. To make substantial progress in addressing the underlying problem of how to increase the supply of qualified teachers ready to teach in urban schools, reform efforts must address the real and measurable issues of improving school and neighborhood safety, establishing and maintaining orderly schools, and providing teachers with necessary professional and administrative support, reasonable workloads and class sizes, as well as attractive facilities and well-stocked classrooms. Our findings should not be entirely unexpected. Collective bargaining agreements do not have any direct impact on a teacher’s decision to leave the profession, to move to a school in a different district, or on a school district’s decision to hire a teacher. Collective bargaining agreements rely on seniority as a fair and orderly way to reduce staff in a school or lay off teachers during a district-wide staff reduction (about one in 10 transfers resulted from a displacement or layoff). However, the agreements vary substantially in specific language on the role of seniority, if any, in voluntary transfers (approximately nine of 10 transfers). The effects of collective bargaining on teacher transfers cannot be determined by analyzing language in a small number of collective bargaining agreements due to ambiguity in language and variations in implementation. It is important to know how the bargaining agreement actually works and to get data on the actual impact—as is done in this report. The association of collective bargaining with lower rates of transferring in high-poverty schools, as well as less reliance on first-year teachers, indicates that collective bargaining agreements add objectivity and order to teacher hiring and transfers. Collective bargaining agreements require posting of vacant positions, and typically do not allow voluntary transfers until a teacher has completed a probationary period (usually around three years). Seniority often plays no role in voluntary transfers and seldom is the decisive factor in filling a vacancy. Additionally, almost all agreements give the personnel office or superintendent authority to deny transfers that would adversely affect racial balance, experience balance and program or operational needs.
The Impact of Collective Bargaining on Teacher Transfer Rates/ 25
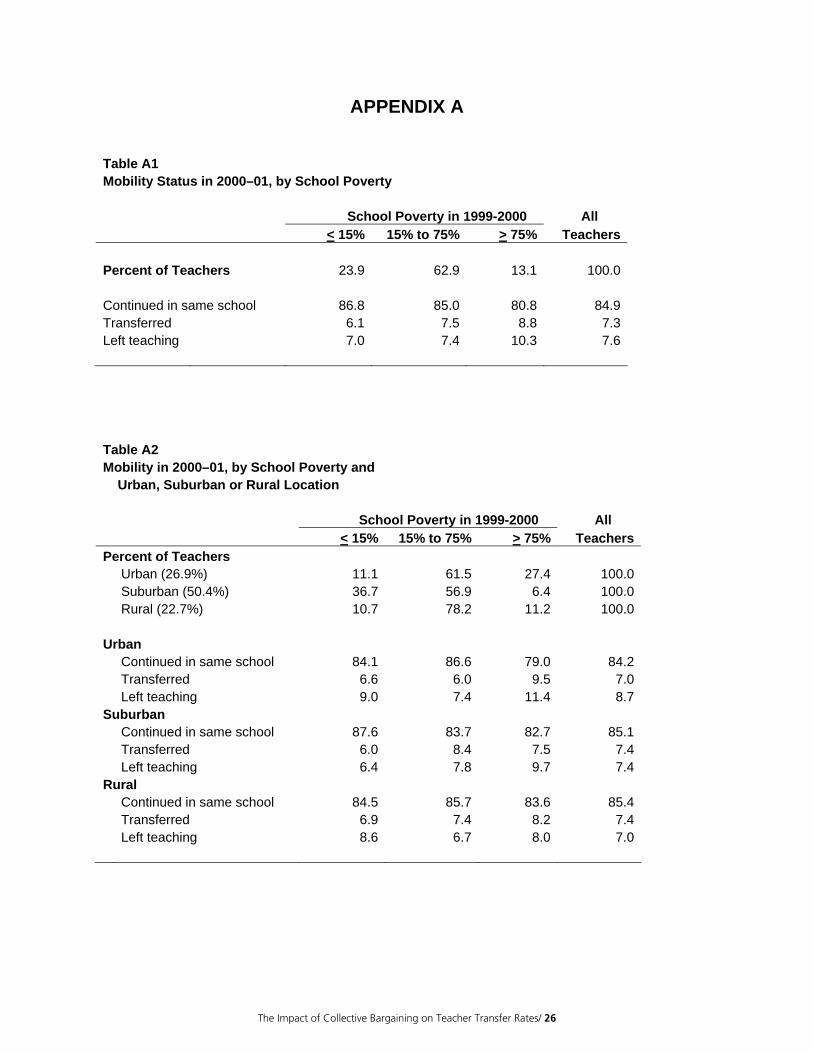
APPENDIX A Table A1 Mobility Status in 2000–01, by School Poverty School Poverty in 1999-2000 All < 15% 15% to 75% > 75% Teachers
Percent of Teachers 23.9 62.9 13.1 100.0 Continued in same school 86.8 85.0 80.8 84.9 Transferred 6.1 7.5 8.8 7.3 Left teaching 7.0 7.4 10.3 7.6
Table A2 Mobility in 2000–01, by School Poverty and Urban, Suburban or Rural Location School Poverty in 1999-2000 All < 15% 15% to 75% > 75% Teachers Percent of Teachers Urban (26.9%) 11.1 61.5 27.4 100.0 Suburban (50.4%) 36.7 56.9 6.4 100.0 Rural (22.7%) 10.7 78.2 11.2 100.0 Urban Continued in same school 84.1 86.6 79.0 84.2 Transferred 6.6 6.0 9.5 7.0 Left teaching 9.0 7.4 11.4 8.7 Suburban Continued in same school 87.6 83.7 82.7 85.1 Transferred 6.0 8.4 7.5 7.4 Left teaching 6.4 7.8 9.7 7.4 Rural Continued in same school 84.5 85.7 83.6 85.4 Transferred 6.9 7.4 8.2 7.4 Left teaching 8.6 6.7 8.0 7.0
The Impact of Collective Bargaining on Teacher Transfer Rates/ 26
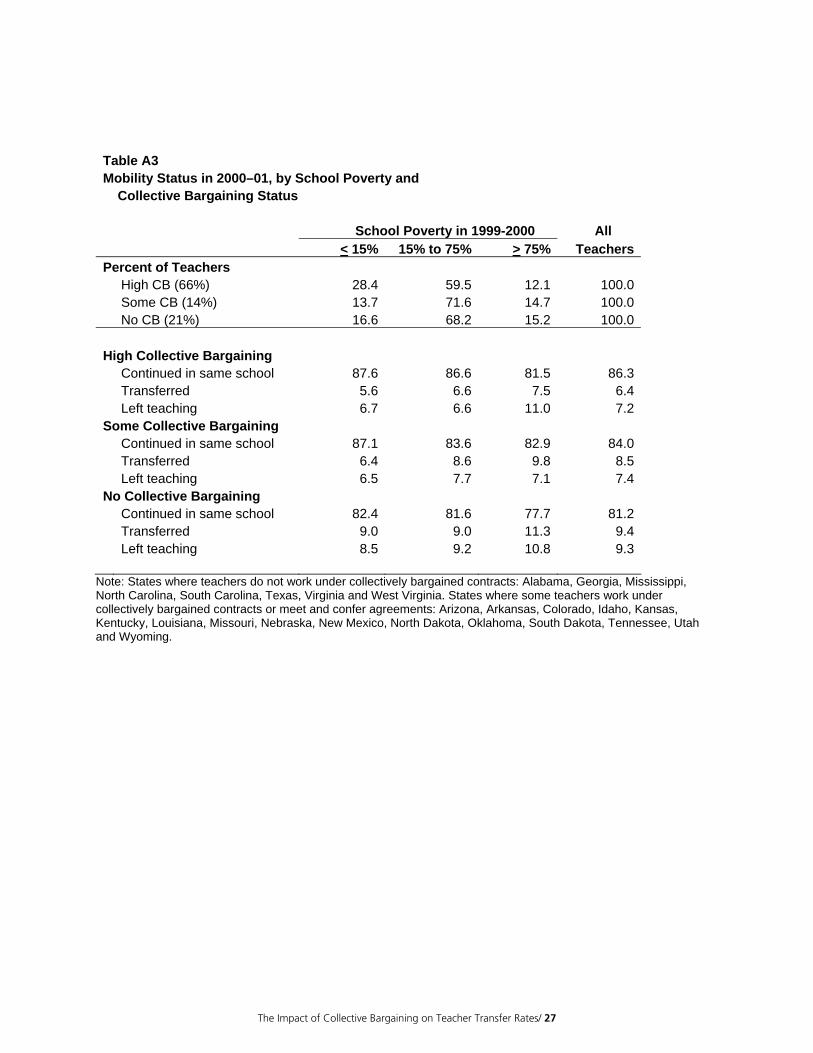
Table A3 Mobility Status in 2000–01, by School Poverty and Collective Bargaining Status School Poverty in 1999-2000 All < 15% 15% to 75% > 75% Teachers Percent of Teachers High CB (66%) 28.4 59.5 12.1 100.0 Some CB (14%) 13.7 71.6 14.7 100.0 No CB (21%) 16.6 68.2 15.2 100.0 High Collective Bargaining Continued in same school 87.6 86.6 81.5 86.3 Transferred 5.6 6.6 7.5 6.4 Left teaching 6.7 6.6 11.0 7.2 Some Collective Bargaining Continued in same school 87.1 83.6 82.9 84.0 Transferred 6.4 8.6 9.8 8.5 Left teaching 6.5 7.7 7.1 7.4 No Collective Bargaining Continued in same school 82.4 81.6 77.7 81.2 Transferred 9.0 9.0 11.3 9.4 Left teaching 8.5 9.2 10.8 9.3
Note: States where teachers do not work under collectively bargained contracts: Alabama, Georgia, Mississippi, North Carolina, South Carolina, Texas, Virginia and West Virginia. States where some teachers work under collectively bargained contracts or meet and confer agreements: Arizona, Arkansas, Colorado, Idaho, Kansas, Kentucky, Louisiana, Missouri, Nebraska, New Mexico, North Dakota, Oklahoma, South Dakota, Tennessee, Utah and Wyoming.
The Impact of Collective Bargaining on Teacher Transfer Rates/ 27
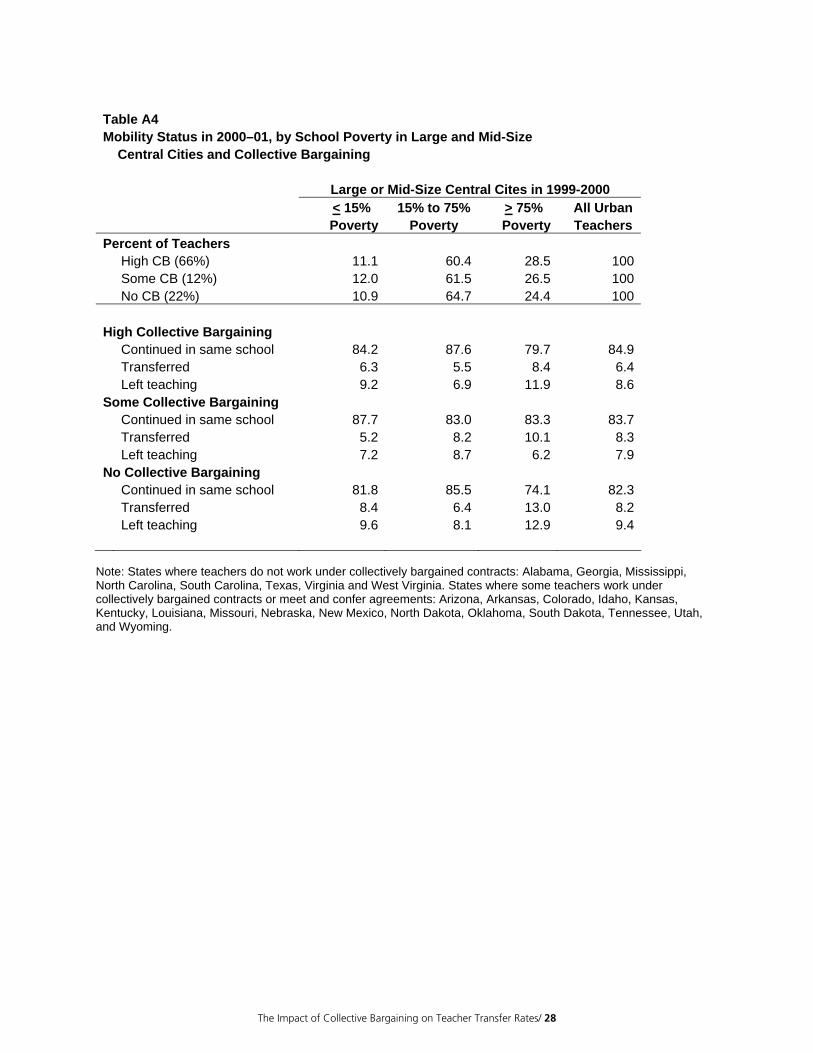
Table A4 Mobility Status in 2000–01, by School Poverty in Large and Mid-Size Central Cities and Collective Bargaining Large or Mid-Size Central Cites in 1999-2000 < 15% 15% to 75% > 75% All Urban Poverty Poverty Poverty Teachers Percent of Teachers High CB (66%) 11.1 60.4 28.5 100 Some CB (12%) 12.0 61.5 26.5 100 No CB (22%) 10.9 64.7 24.4 100 High Collective Bargaining Continued in same school 84.2 87.6 79.7 84.9 Transferred 6.3 5.5 8.4 6.4 Left teaching 9.2 6.9 11.9 8.6 Some Collective Bargaining Continued in same school 87.7 83.0 83.3 83.7 Transferred 5.2 8.2 10.1 8.3 Left teaching 7.2 8.7 6.2 7.9 No Collective Bargaining Continued in same school 81.8 85.5 74.1 82.3 Transferred 8.4 6.4 13.0 8.2 Left teaching 9.6 8.1 12.9 9.4
Note: States where teachers do not work under collectively bargained contracts: Alabama, Georgia, Mississippi, North Carolina, South Carolina, Texas, Virginia and West Virginia. States where some teachers work under collectively bargained contracts or meet and confer agreements: Arizona, Arkansas, Colorado, Idaho, Kansas, Kentucky, Louisiana, Missouri, Nebraska, New Mexico, North Dakota, Oklahoma, South Dakota, Tennessee, Utah, and Wyoming.
The Impact of Collective Bargaining on Teacher Transfer Rates/ 28
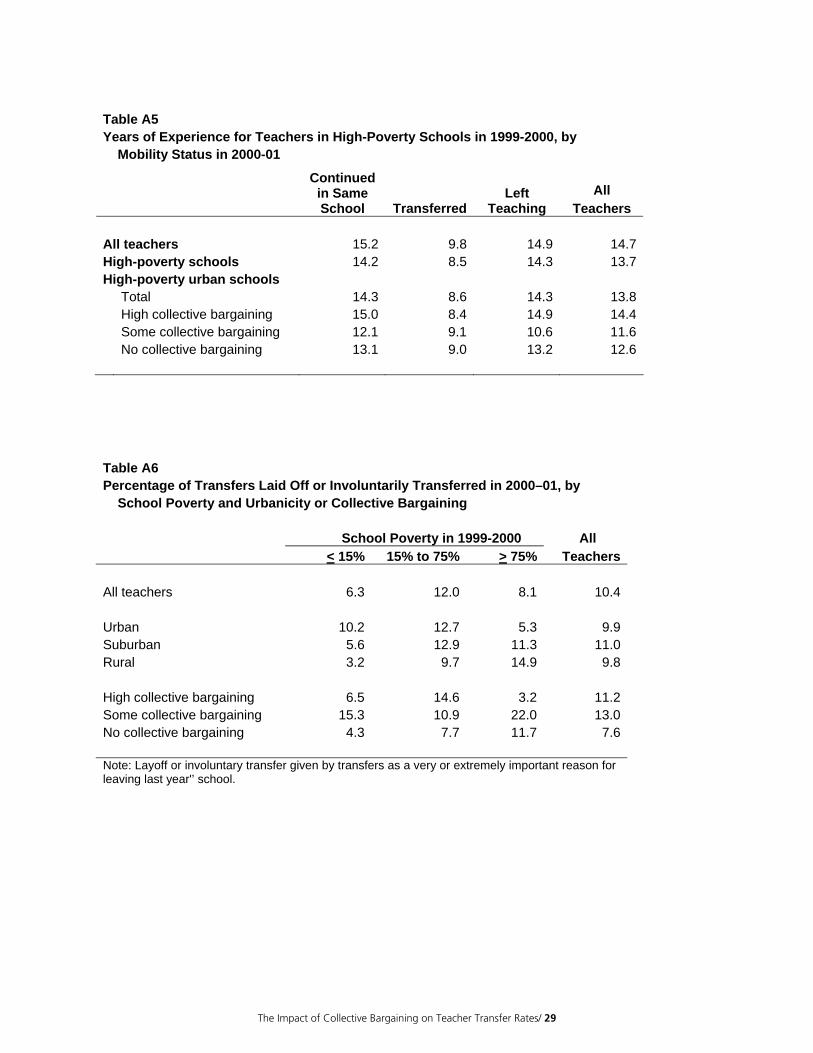
Table A5 Years of Experience for Teachers in High-Poverty Schools in 1999-2000, by Mobility Status in 2000-01 All
Continued in Same School Transferred
Left Teaching Teachers
All teachers 15.2 9.8 14.9 14.7 High-poverty schools 14.2 8.5 14.3 13.7 High-poverty urban schools Total 14.3 8.6 14.3 13.8 High collective bargaining 15.0 8.4 14.9 14.4 Some collective bargaining 12.1 9.1 10.6 11.6 No collective bargaining 13.1 9.0 13.2 12.6
Table A6 Percentage of Transfers Laid Off or Involuntarily Transferred in 2000–01, by School Poverty and Urbanicity or Collective Bargaining School Poverty in 1999-2000 All < 15% 15% to 75% > 75% Teachers All teachers 6.3 12.0 8.1 10.4 Urban 10.2 12.7 5.3 9.9 Suburban 5.6 12.9 11.3 11.0 Rural 3.2 9.7 14.9 9.8 High collective bargaining 6.5 14.6 3.2 11.2 Some collective bargaining 15.3 10.9 22.0 13.0 No collective bargaining 4.3 7.7 11.7 7.6 Note: Layoff or involuntary transfer given by transfers as a very or extremely important reason for leaving last year'’ school.
The Impact of Collective Bargaining on Teacher Transfer Rates/ 29
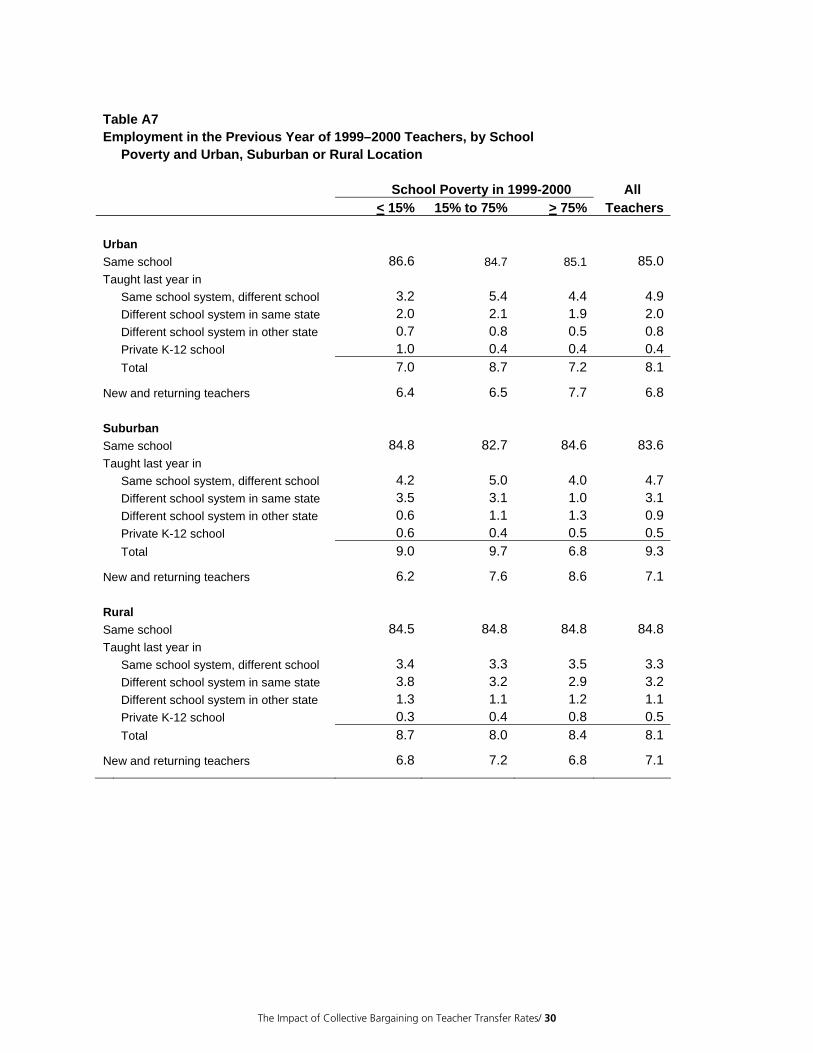
Table A7 Employment in the Previous Year of 1999–2000 Teachers, by School Poverty and Urban, Suburban or Rural Location School Poverty in 1999-2000 All < 15% 15% to 75% > 75% Teachers Urban Same school 86.6 84.7 85.1 85.0Taught last year in Same school system, different school 3.2 5.4 4.4 4.9 Different school system in same state 2.0 2.1 1.9 2.0 Different school system in other state 0.7 0.8 0.5 0.8 Private K-12 school 1.0 0.4 0.4 0.4 Total 7.0 8.7 7.2 8.1
New and returning teachers 6.4 6.5 7.7 6.8 Suburban Same school 84.8 82.7 84.6 83.6Taught last year in Same school system, different school 4.2 5.0 4.0 4.7 Different school system in same state 3.5 3.1 1.0 3.1 Different school system in other state 0.6 1.1 1.3 0.9 Private K-12 school 0.6 0.4 0.5 0.5 Total 9.0 9.7 6.8 9.3
New and returning teachers 6.2 7.6 8.6 7.1 Rural Same school 84.5 84.8 84.8 84.8Taught last year in Same school system, different school 3.4 3.3 3.5 3.3 Different school system in same state 3.8 3.2 2.9 3.2 Different school system in other state 1.3 1.1 1.2 1.1 Private K-12 school 0.3 0.4 0.8 0.5 Total 8.7 8.0 8.4 8.1
New and returning teachers 6.8 7.2 6.8 7.1
The Impact of Collective Bargaining on Teacher Transfer Rates/ 30
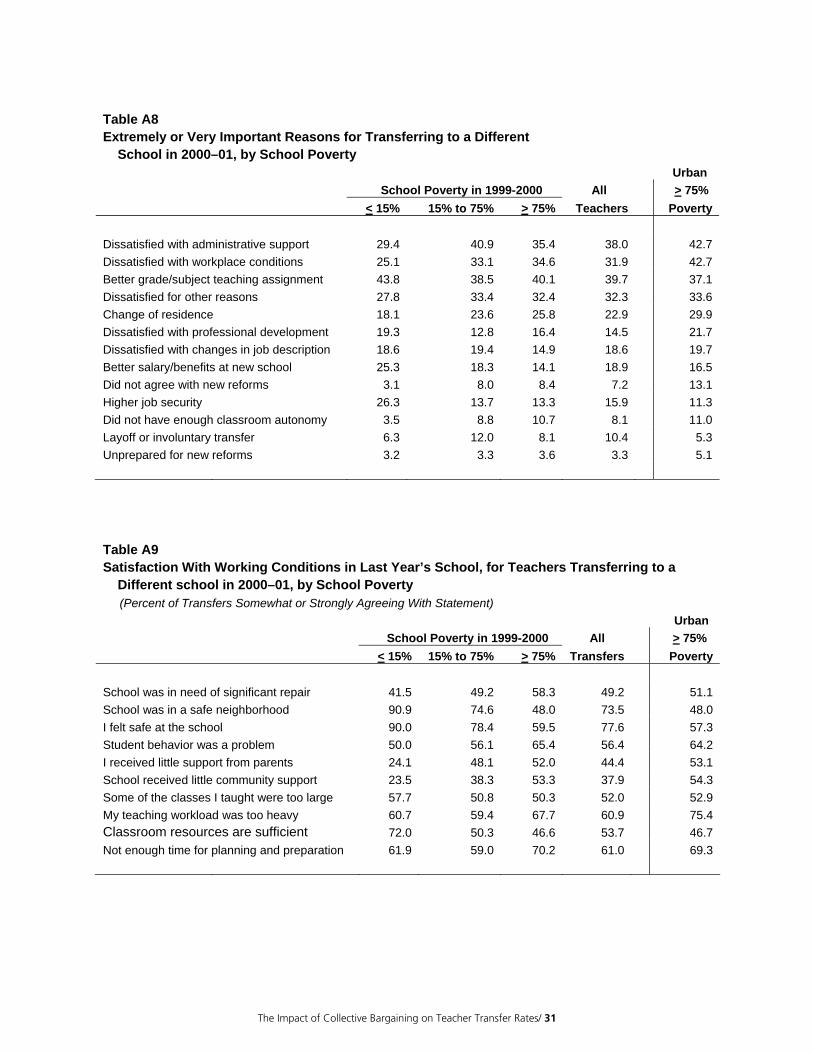
Table A8 Extremely or Very Important Reasons for Transferring to a Different School in 2000–01, by School Poverty Urban School Poverty in 1999-2000 All > 75% < 15% 15% to 75% > 75% Teachers Poverty Dissatisfied with administrative support 29.4 40.9 35.4 38.0 42.7 Dissatisfied with workplace conditions 25.1 33.1 34.6 31.9 42.7 Better grade/subject teaching assignment 43.8 38.5 40.1 39.7 37.1 Dissatisfied for other reasons 27.8 33.4 32.4 32.3 33.6 Change of residence 18.1 23.6 25.8 22.9 29.9 Dissatisfied with professional development 19.3 12.8 16.4 14.5 21.7 Dissatisfied with changes in job description 18.6 19.4 14.9 18.6 19.7 Better salary/benefits at new school 25.3 18.3 14.1 18.9 16.5 Did not agree with new reforms 3.1 8.0 8.4 7.2 13.1 Higher job security 26.3 13.7 13.3 15.9 11.3 Did not have enough classroom autonomy 3.5 8.8 10.7 8.1 11.0 Layoff or involuntary transfer 6.3 12.0 8.1 10.4 5.3 Unprepared for new reforms 3.2 3.3 3.6 3.3 5.1
Table A9 Satisfaction With Working Conditions in Last Year’s School, for Teachers Transferring to a Different school in 2000–01, by School Poverty (Percent of Transfers Somewhat or Strongly Agreeing With Statement) Urban School Poverty in 1999-2000 All > 75% < 15% 15% to 75% > 75% Transfers Poverty School was in need of significant repair 41.5 49.2 58.3 49.2 51.1 School was in a safe neighborhood 90.9 74.6 48.0 73.5 48.0 I felt safe at the school 90.0 78.4 59.5 77.6 57.3 Student behavior was a problem 50.0 56.1 65.4 56.4 64.2 I received little support from parents 24.1 48.1 52.0 44.4 53.1 School received little community support 23.5 38.3 53.3 37.9 54.3 Some of the classes I taught were too large 57.7 50.8 50.3 52.0 52.9 My teaching workload was too heavy 60.7 59.4 67.7 60.9 75.4 Classroom resources are sufficient 72.0 50.3 46.6 53.7 46.7 Not enough time for planning and preparation 61.9 59.0 70.2 61.0 69.3
The Impact of Collective Bargaining on Teacher Transfer Rates/ 31
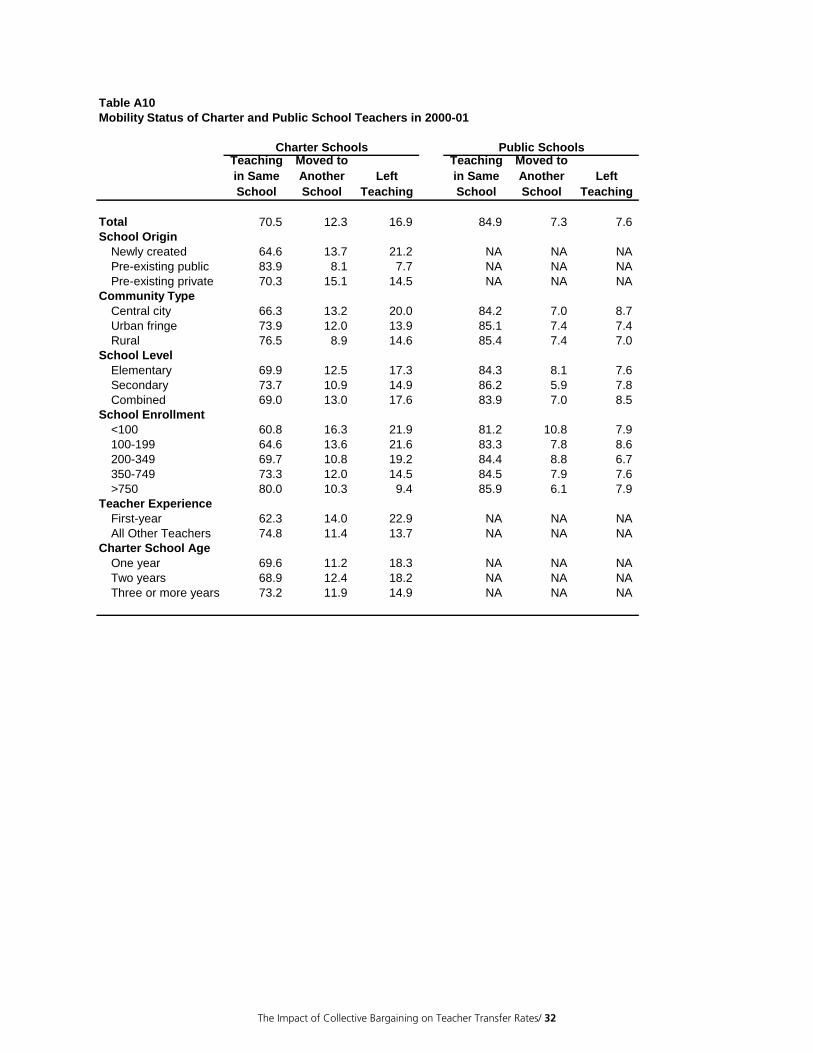
Table A10Mobility Status of Charter and Public School Teachers in 2000-01
Charter Schools Public SchoolsTeaching in Same School
Moved to Another School
Left Teaching
Teaching in Same School
Moved to Another School
Left Teaching
Total 70.5 12.3 16.9 84.9 7.3 7.6 School Origin
Newly created 64.6 13.7 21.2 NA NA NAPre-existing public 83.9 8.1 7.7 NA NA NAPre-existing private 70.3 15.1 14.5 NA NA NA
Community TypeCentral city 66.3 13.2 20.0 84.2 7.0 8.7 Urban fringe 73.9 12.0 13.9 85.1 7.4 7.4 Rural 76.5 8.9 14.6 85.4 7.4 7.0
School LevelElementary 69.9 12.5 17.3 84.3 8.1 7.6 Secondary 73.7 10.9 14.9 86.2 5.9 7.8 Combined 69.0 13.0 17.6 83.9 7.0 8.5
School Enrollment<100 60.8 16.3 21.9 81.2 10.8 7.9 100-199 64.6 13.6 21.6 83.3 7.8 8.6 200-349 69.7 10.8 19.2 84.4 8.8 6.7 350-749 73.3 12.0 14.5 84.5 7.9 7.6 >750 80.0 10.3 9.4 85.9 6.1 7.9
Teacher ExperienceFirst-year 62.3 14.0 22.9 NA NA NAAll Other Teachers 74.8 11.4 13.7 NA NA NA
Charter School AgeOne year 69.6 11.2 18.3 NA NA NATwo years 68.9 12.4 18.2 NA NA NAThree or more years 73.2 11.9 14.9 NA NA NA
The Impact of Collective Bargaining on Teacher Transfer Rates/ 32
APPENDIX B
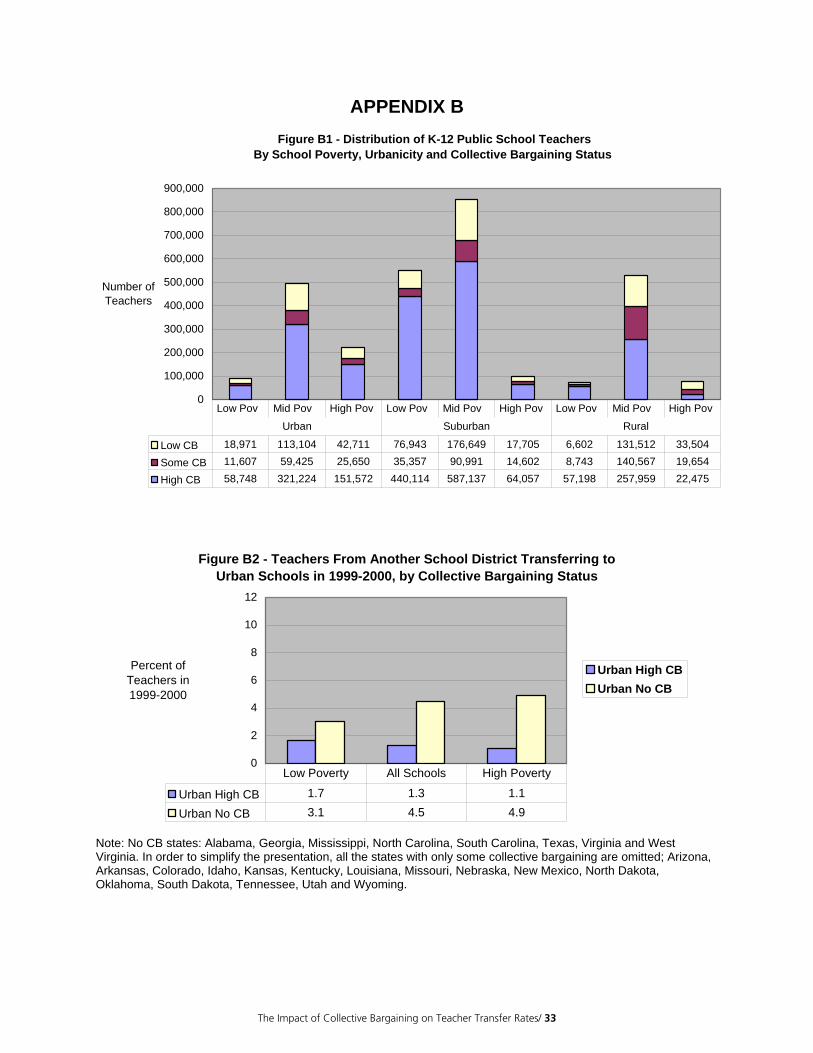
Figure B1 - Distribution of K-12 Public School Teachers By School Poverty, Urbanicity and Collective Bargaining Status
0
100,000
200,000
300,000
400,000
500,000
600,000
700,000
800,000
900,000
Number ofTeachers
Low CB 18,971 113,104 42,711 76,943 176,649 17,705 6,602 131,512 33,504
Some CB 11,607 59,425 25,650 35,357 90,991 14,602 8,743 140,567 19,654
High CB 58,748 321,224 151,572 440,114 587,137 64,057 57,198 257,959 22,475
Low Pov Mid Pov High Pov Low Pov Mid Pov High Pov Low Pov Mid Pov High PovUrban Suburban Rural
Figure B2 - Teachers From Another School District Transferring to Urban Schools in 1999-2000, by Collective Bargaining Status
0
2
4
6
8
10
12
Percent of Teachers in1999-2000
Urban High CBUrban No CB
Urban High CB 1.7 1.3 1.1
Urban No CB 3.1 4.5 4.9
Low Poverty All Schools High Poverty
Note: No CB states: Alabama, Georgia, Mississippi, North Carolina, South Carolina, Texas, Virginia and West Virginia. In order to simplify the presentation, all the states with only some collective bargaining are omitted; Arizona, Arkansas, Colorado, Idaho, Kansas, Kentucky, Louisiana, Missouri, Nebraska, New Mexico, North Dakota, Oklahoma, South Dakota, Tennessee, Utah and Wyoming.
The Impact of Collective Bargaining on Teacher Transfer Rates/ 33
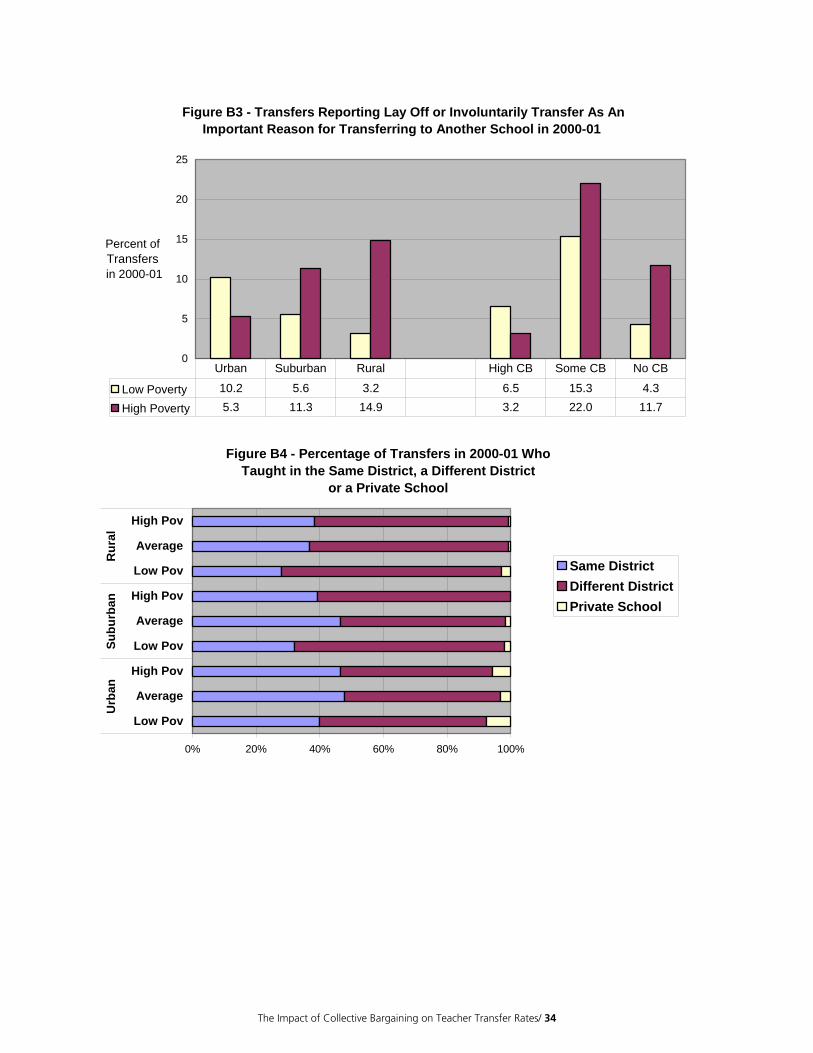
Figure B3 - Transfers Reporting Lay Off or Involuntarily Transfer As An Important Reason for Transferring to Another School in 2000-01
0
5
10
15
20
25
Percent of Transfers
in 2000-01
Low Poverty 10.2 5.6 3.2 6.5 15.3 4.3
High Poverty 5.3 11.3 14.9 3.2 22.0 11.7
Urban Suburban Rural High CB Some CB No CB
Figure B4 - Percentage of Transfers in 2000-01 Who Taught in the Same District, a Different District
or a Private School
0% 20% 40% 60% 80% 100%
Low Pov
Average
High Pov
Low Pov
Average
High Pov
Low Pov
Average
High Pov
Urb
anSu
burb
anR
ural
Same DistrictDifferent DistrictPrivate School
The Impact of Collective Bargaining on Teacher Transfer Rates/ 34
Appendix C
Review of Collective Bargaining Agreement Language Addressing Voluntary Transfers
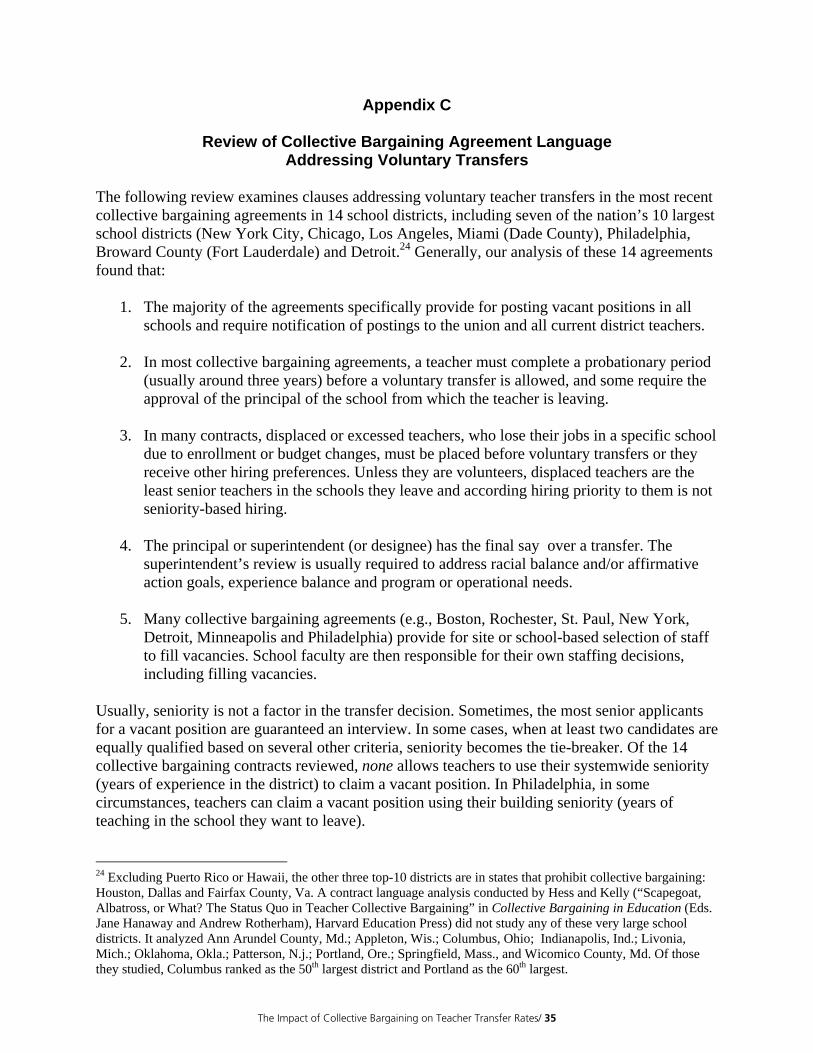
The following review examines clauses addressing voluntary teacher transfers in the most recent collective bargaining agreements in 14 school districts, including seven of the nation’s 10 largest school districts (New York City, Chicago, Los Angeles, Miami (Dade County), Philadelphia, Broward County (Fort Lauderdale) and Detroit.24 Generally, our analysis of these 14 agreements found that:
1. The majority of the agreements specifically provide for posting vacant positions in all schools and require notification of postings to the union and all current district teachers.
2. In most collective bargaining agreements, a teacher must complete a probationary period
(usually around three years) before a voluntary transfer is allowed, and some require the approval of the principal of the school from which the teacher is leaving.
3. In many contracts, displaced or excessed teachers, who lose their jobs in a specific school
due to enrollment or budget changes, must be placed before voluntary transfers or they receive other hiring preferences. Unless they are volunteers, displaced teachers are the least senior teachers in the schools they leave and according hiring priority to them is not seniority-based hiring.
4. The principal or superintendent (or designee) has the final say over a transfer. The
superintendent’s review is usually required to address racial balance and/or affirmative action goals, experience balance and program or operational needs.
5. Many collective bargaining agreements (e.g., Boston, Rochester, St. Paul, New York,
Detroit, Minneapolis and Philadelphia) provide for site or school-based selection of staff to fill vacancies. School faculty are then responsible for their own staffing decisions, including filling vacancies.
Usually, seniority is not a factor in the transfer decision. Sometimes, the most senior applicants for a vacant position are guaranteed an interview. In some cases, when at least two candidates are equally qualified based on several other criteria, seniority becomes the tie-breaker. Of the 14 collective bargaining contracts reviewed, none allows teachers to use their systemwide seniority (years of experience in the district) to claim a vacant position. In Philadelphia, in some circumstances, teachers can claim a vacant position using their building seniority (years of teaching in the school they want to leave).
24 Excluding Puerto Rico or Hawaii, the other three top-10 districts are in states that prohibit collective bargaining: Houston, Dallas and Fairfax County, Va. A contract language analysis conducted by Hess and Kelly (“Scapegoat, Albatross, or What? The Status Quo in Teacher Collective Bargaining” in Collective Bargaining in Education (Eds. Jane Hanaway and Andrew Rotherham), Harvard Education Press) did not study any of these very large school districts. It analyzed Ann Arundel County, Md.; Appleton, Wis.; Columbus, Ohio; Indianapolis, Ind.; Livonia, Mich.; Oklahoma, Okla.; Patterson, N.j.; Portland, Ore.; Springfield, Mass., and Wicomico County, Md. Of those they studied, Columbus ranked as the 50th largest district and Portland as the 60th largest.
The Impact of Collective Bargaining on Teacher Transfer Rates/ 35
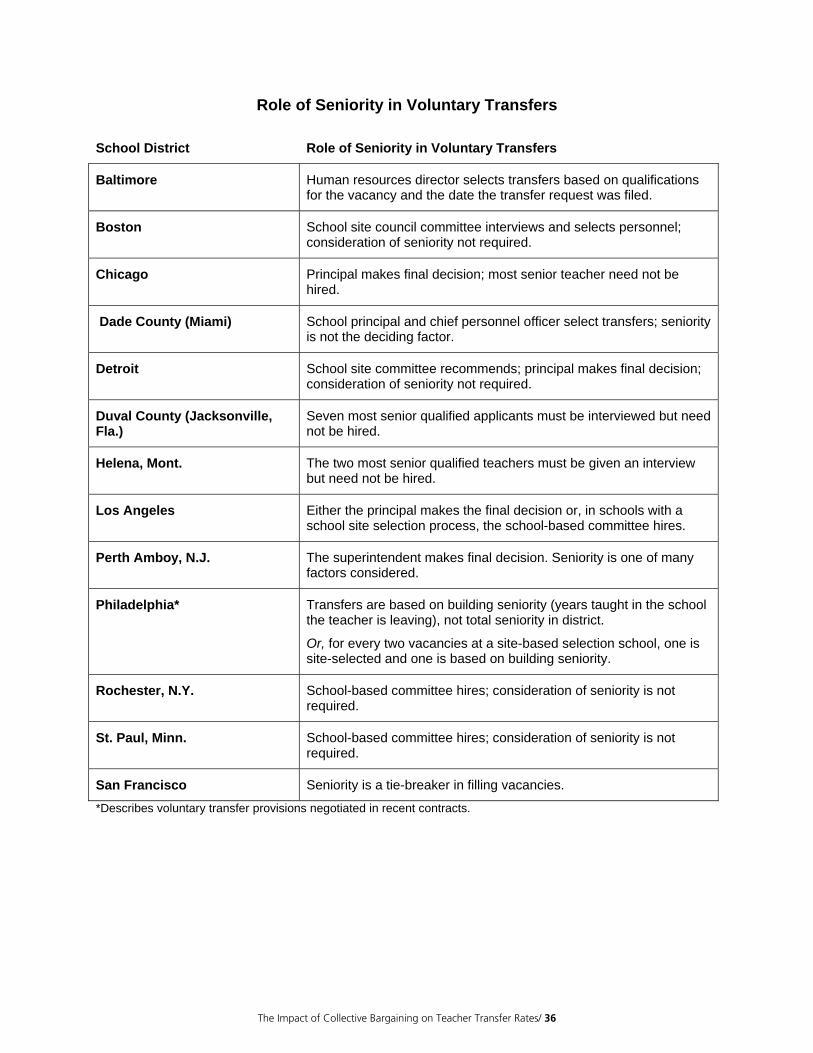
Role of Seniority in Voluntary Transfers School District Role of Seniority in Voluntary Transfers
Baltimore Human resources director selects transfers based on qualifications for the vacancy and the date the transfer request was filed.
Boston School site council committee interviews and selects personnel; consideration of seniority not required.
Chicago Principal makes final decision; most senior teacher need not be hired.
Dade County (Miami) School principal and chief personnel officer select transfers; seniority is not the deciding factor.
Detroit School site committee recommends; principal makes final decision; consideration of seniority not required.
Duval County (Jacksonville, Fla.)
Seven most senior qualified applicants must be interviewed but need not be hired.
Helena, Mont. The two most senior qualified teachers must be given an interview but need not be hired.
Los Angeles Either the principal makes the final decision or, in schools with a school site selection process, the school-based committee hires.
Perth Amboy, N.J. The superintendent makes final decision. Seniority is one of many factors considered.
Philadelphia*
Transfers are based on building seniority (years taught in the school the teacher is leaving), not total seniority in district.
Or, for every two vacancies at a site-based selection school, one is site-selected and one is based on building seniority.
Rochester, N.Y. School-based committee hires; consideration of seniority is not required.
St. Paul, Minn. School-based committee hires; consideration of seniority is not required.
San Francisco Seniority is a tie-breaker in filling vacancies.
*Describes voluntary transfer provisions negotiated in recent contracts.
The Impact of Collective Bargaining on Teacher Transfer Rates/ 36
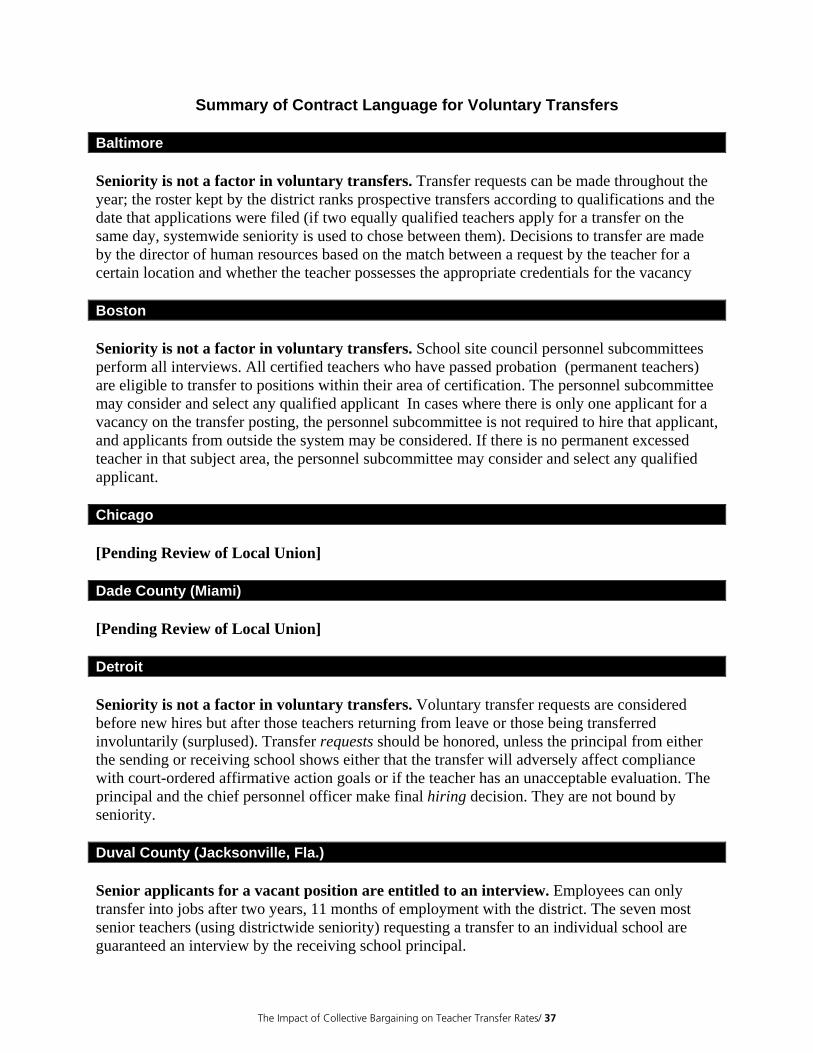
Summary of Contract Language for Voluntary Transfers Baltimore Seniority is not a factor in voluntary transfers. Transfer requests can be made throughout the year; the roster kept by the district ranks prospective transfers according to qualifications and the date that applications were filed (if two equally qualified teachers apply for a transfer on the same day, systemwide seniority is used to chose between them). Decisions to transfer are made by the director of human resources based on the match between a request by the teacher for a certain location and whether the teacher possesses the appropriate credentials for the vacancy Boston Seniority is not a factor in voluntary transfers. School site council personnel subcommittees perform all interviews. All certified teachers who have passed probation (permanent teachers) are eligible to transfer to positions within their area of certification. The personnel subcommittee may consider and select any qualified applicant In cases where there is only one applicant for a vacancy on the transfer posting, the personnel subcommittee is not required to hire that applicant, and applicants from outside the system may be considered. If there is no permanent excessed teacher in that subject area, the personnel subcommittee may consider and select any qualified applicant. Chicago [Pending Review of Local Union] Dade County (Miami) [Pending Review of Local Union] Detroit Seniority is not a factor in voluntary transfers. Voluntary transfer requests are considered before new hires but after those teachers returning from leave or those being transferred involuntarily (surplused). Transfer requests should be honored, unless the principal from either the sending or receiving school shows either that the transfer will adversely affect compliance with court-ordered affirmative action goals or if the teacher has an unacceptable evaluation. The principal and the chief personnel officer make final hiring decision. They are not bound by seniority. Duval County (Jacksonville, Fla.) Senior applicants for a vacant position are entitled to an interview. Employees can only transfer into jobs after two years, 11 months of employment with the district. The seven most senior teachers (using districtwide seniority) requesting a transfer to an individual school are guaranteed an interview by the receiving school principal.
The Impact of Collective Bargaining on Teacher Transfer Rates/ 37
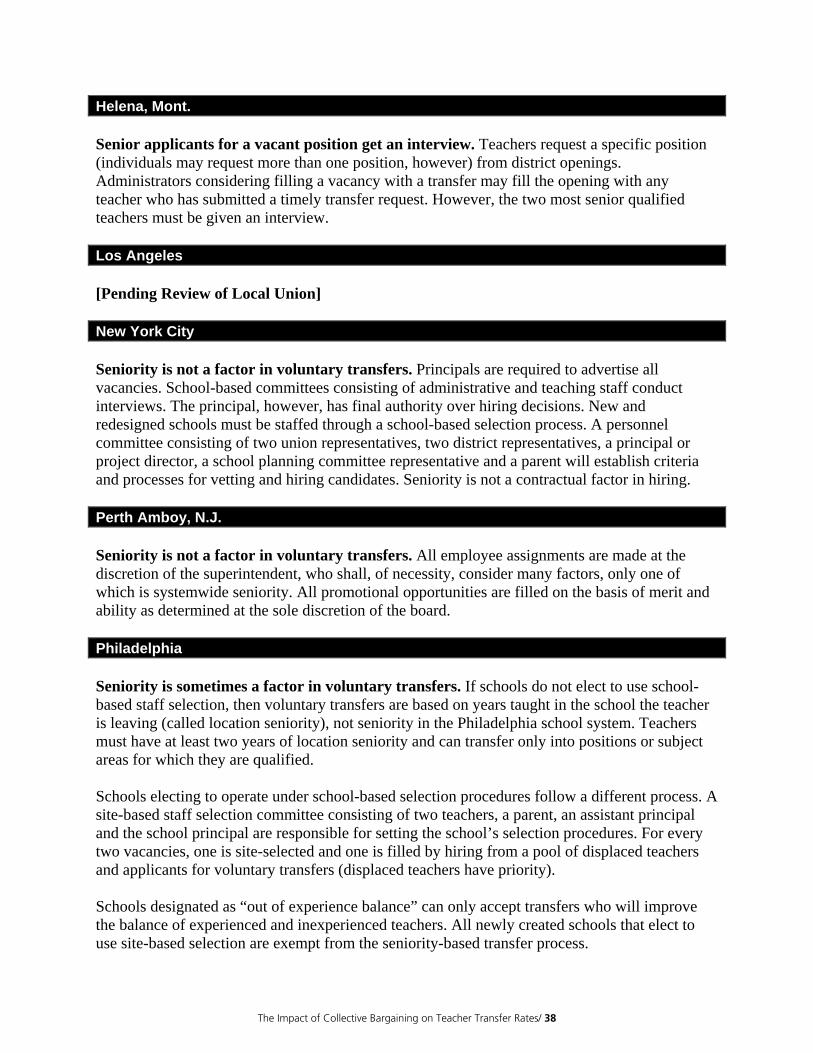
Helena, Mont. Senior applicants for a vacant position get an interview. Teachers request a specific position (individuals may request more than one position, however) from district openings. Administrators considering filling a vacancy with a transfer may fill the opening with any teacher who has submitted a timely transfer request. However, the two most senior qualified teachers must be given an interview. Los Angeles [Pending Review of Local Union] New York City Seniority is not a factor in voluntary transfers. Principals are required to advertise all vacancies. School-based committees consisting of administrative and teaching staff conduct interviews. The principal, however, has final authority over hiring decisions. New and redesigned schools must be staffed through a school-based selection process. A personnel committee consisting of two union representatives, two district representatives, a principal or project director, a school planning committee representative and a parent will establish criteria and processes for vetting and hiring candidates. Seniority is not a contractual factor in hiring. Perth Amboy, N.J. Seniority is not a factor in voluntary transfers. All employee assignments are made at the discretion of the superintendent, who shall, of necessity, consider many factors, only one of which is systemwide seniority. All promotional opportunities are filled on the basis of merit and ability as determined at the sole discretion of the board. Philadelphia Seniority is sometimes a factor in voluntary transfers. If schools do not elect to use school-based staff selection, then voluntary transfers are based on years taught in the school the teacher is leaving (called location seniority), not seniority in the Philadelphia school system. Teachers must have at least two years of location seniority and can transfer only into positions or subject areas for which they are qualified. Schools electing to operate under school-based selection procedures follow a different process. A site-based staff selection committee consisting of two teachers, a parent, an assistant principal and the school principal are responsible for setting the school’s selection procedures. For every two vacancies, one is site-selected and one is filled by hiring from a pool of displaced teachers and applicants for voluntary transfers (displaced teachers have priority). Schools designated as “out of experience balance” can only accept transfers who will improve the balance of experienced and inexperienced teachers. All newly created schools that elect to use site-based selection are exempt from the seniority-based transfer process.
The Impact of Collective Bargaining on Teacher Transfer Rates/ 38
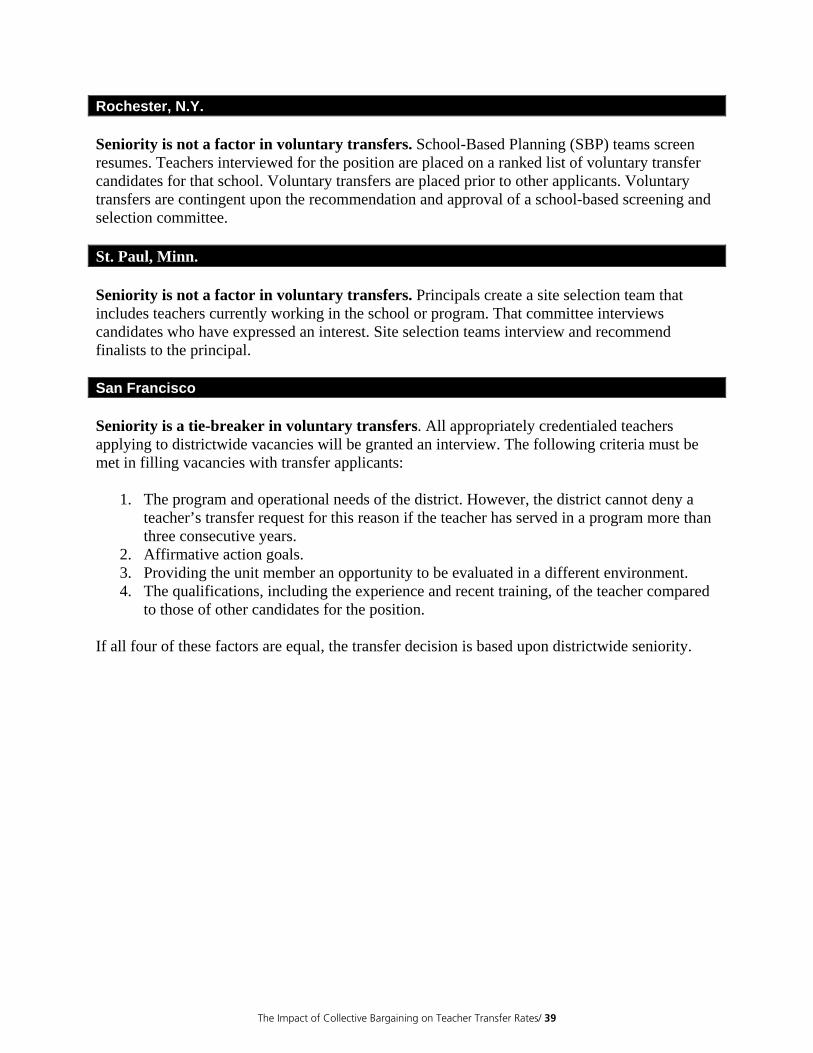
Rochester, N.Y. Seniority is not a factor in voluntary transfers. School-Based Planning (SBP) teams screen resumes. Teachers interviewed for the position are placed on a ranked list of voluntary transfer candidates for that school. Voluntary transfers are placed prior to other applicants. Voluntary transfers are contingent upon the recommendation and approval of a school-based screening and selection committee. St. Paul, Minn. Seniority is not a factor in voluntary transfers. Principals create a site selection team that includes teachers currently working in the school or program. That committee interviews candidates who have expressed an interest. Site selection teams interview and recommend finalists to the principal. San Francisco Seniority is a tie-breaker in voluntary transfers. All appropriately credentialed teachers applying to districtwide vacancies will be granted an interview. The following criteria must be met in filling vacancies with transfer applicants:
1. The program and operational needs of the district. However, the district cannot deny a teacher’s transfer request for this reason if the teacher has served in a program more than three consecutive years.
2. Affirmative action goals. 3. Providing the unit member an opportunity to be evaluated in a different environment. 4. The qualifications, including the experience and recent training, of the teacher compared
to those of other candidates for the position.
If all four of these factors are equal, the transfer decision is based upon districtwide seniority.
The Impact of Collective Bargaining on Teacher Transfer Rates/ 39
Appendix D
Review of Collective Bargaining Agreement Language Addressing Involuntary Transfers, Displacements and Layoffs
The following review examines clauses addressing involuntary teacher transfers in the most recent collective bargaining agreements in 14 school districts, including six of the nation’s 10 largest school districts: New York City, Chicago, Los Angeles, Dade County ( Miami), Philadelphia and Detroit.25 When a teacher is displaced (sometimes known as being excessed or involuntarily transferred) due to school-level enrollment declines or budget cutbacks that lead to fewer positions for teachers, or when entire schools are closed, seniority provisions negotiated in the collective bargaining agreement are designed to provide a fair and orderly process for the layoffs. When displacements result in job loss for some teachers in the school district, this is generally referred to as a layoff or reduction in force. Generally, our analysis of the contract language agreed to by the schools districts and the unions found that:
1. Teachers with more experience cannot exercise their seniority to avoid displacement or fill vacant positions in other schools if they are not qualified by specialization, certification, grade level, program or other factors.
2. Almost all contracts specifically allow teachers to volunteer for displacement.
3. In each of the collective bargaining agreements analyzed, the district and the union agree
that seniority will be the most important criteria in displacing and laying off staff, although many contracts provide for limited exceptions to the seniority principle. Almost all contracts specify that teachers will be recalled from a layoff list by seniority.
4. Teachers who are displaced are assigned to vacant positions in various ways in the
reviewed contracts. In some contracts, the more senior of the displaced teachers may have the first pick of vacancies for which they are qualified; in others, displaced teachers are placed into a district’s voluntary transfer pool. In many contracts, displaced teachers looking for jobs in the voluntary transfer pool have a priority status.
5. During staff reductions, displaced senior teachers do not pick a specific junior teacher to
bump out of a job. In all contracts reviewed, a layoff results in the least qualified (e.g., uncertified or emergency credentialed) teachers in the school system losing their jobs first followed by the least senior teachers. Vacancies created by the layoffs are then filled through the transfer process by more-senior teachers who were displaced by the staff reduction but had not been laid off.
25 Excluding Puerto Rico or Hawaii, three top-10 districts are located in states that prohibit collective bargaining: Houston, Dallas and Fairfax County, Va. Broward County, Fla., has bargaining but is not in this analysis.
The Impact of Collective Bargaining on Teacher Transfer Rates/ 40
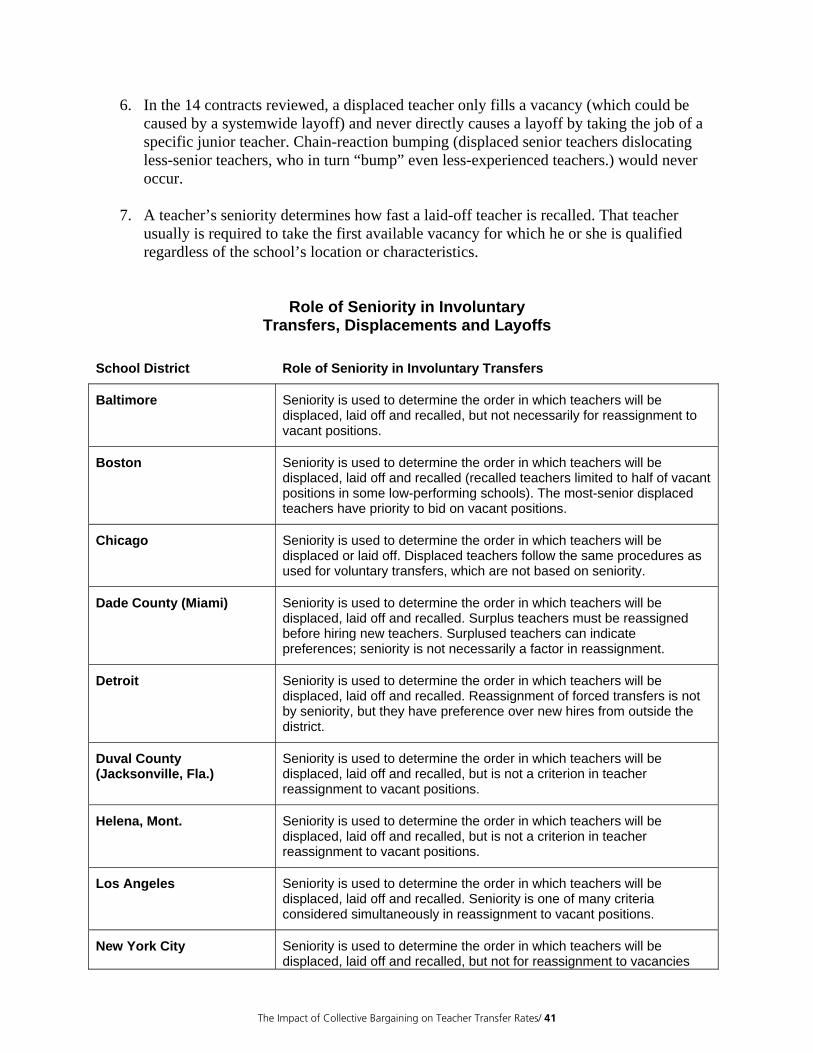
6. In the 14 contracts reviewed, a displaced teacher only fills a vacancy (which could be caused by a systemwide layoff) and never directly causes a layoff by taking the job of a specific junior teacher. Chain-reaction bumping (displaced senior teachers dislocating less-senior teachers, who in turn “bump” even less-experienced teachers.) would never occur.
7. A teacher’s seniority determines how fast a laid-off teacher is recalled. That teacher
usually is required to take the first available vacancy for which he or she is qualified regardless of the school’s location or characteristics.
Role of Seniority in Involuntary Transfers, Displacements and Layoffs
School District Role of Seniority in Involuntary Transfers
Baltimore Seniority is used to determine the order in which teachers will be displaced, laid off and recalled, but not necessarily for reassignment to vacant positions.
Boston Seniority is used to determine the order in which teachers will be displaced, laid off and recalled (recalled teachers limited to half of vacant positions in some low-performing schools). The most-senior displaced teachers have priority to bid on vacant positions.
Chicago Seniority is used to determine the order in which teachers will be displaced or laid off. Displaced teachers follow the same procedures as used for voluntary transfers, which are not based on seniority.
Dade County (Miami) Seniority is used to determine the order in which teachers will be displaced, laid off and recalled. Surplus teachers must be reassigned before hiring new teachers. Surplused teachers can indicate preferences; seniority is not necessarily a factor in reassignment.
Detroit Seniority is used to determine the order in which teachers will be displaced, laid off and recalled. Reassignment of forced transfers is not by seniority, but they have preference over new hires from outside the district.
Duval County (Jacksonville, Fla.)
Seniority is used to determine the order in which teachers will be displaced, laid off and recalled, but is not a criterion in teacher reassignment to vacant positions.
Helena, Mont. Seniority is used to determine the order in which teachers will be displaced, laid off and recalled, but is not a criterion in teacher reassignment to vacant positions.
Los Angeles Seniority is used to determine the order in which teachers will be displaced, laid off and recalled. Seniority is one of many criteria considered simultaneously in reassignment to vacant positions.
New York City Seniority is used to determine the order in which teachers will be displaced, laid off and recalled, but not for reassignment to vacancies
The Impact of Collective Bargaining on Teacher Transfer Rates/ 41
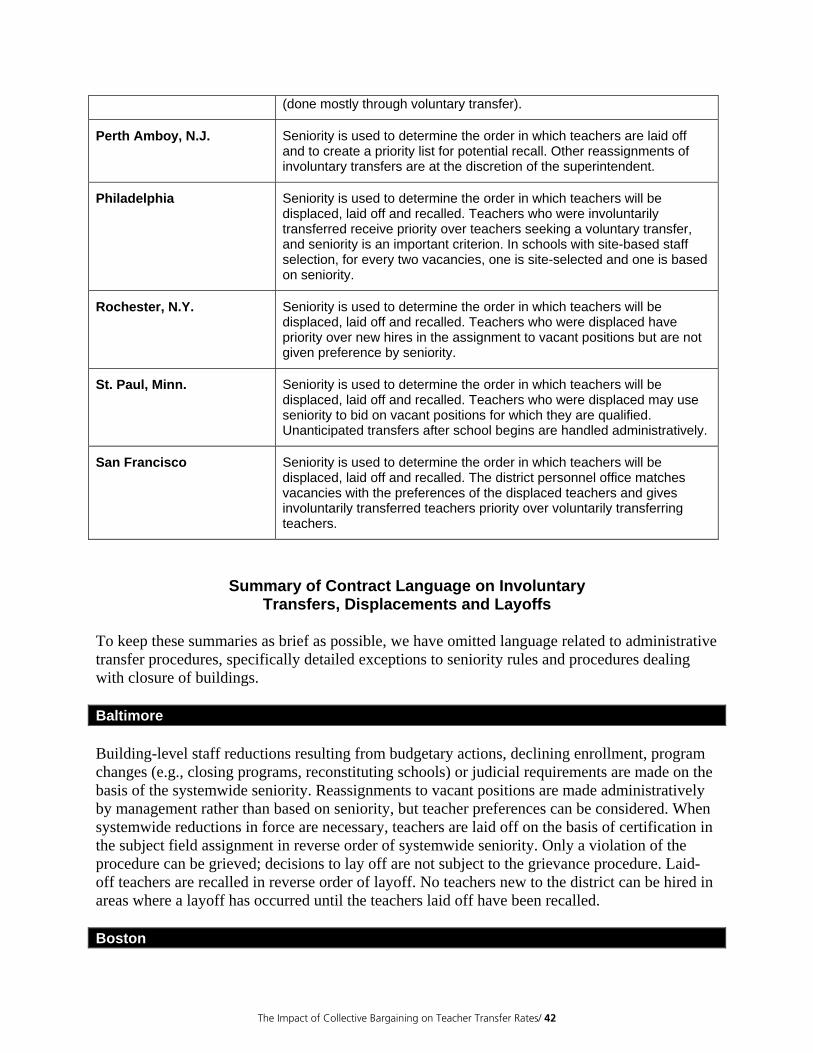
(done mostly through voluntary transfer).
Perth Amboy, N.J. Seniority is used to determine the order in which teachers are laid off and to create a priority list for potential recall. Other reassignments of involuntary transfers are at the discretion of the superintendent.
Philadelphia
Seniority is used to determine the order in which teachers will be displaced, laid off and recalled. Teachers who were involuntarily transferred receive priority over teachers seeking a voluntary transfer, and seniority is an important criterion. In schools with site-based staff selection, for every two vacancies, one is site-selected and one is based on seniority.
Rochester, N.Y. Seniority is used to determine the order in which teachers will be displaced, laid off and recalled. Teachers who were displaced have priority over new hires in the assignment to vacant positions but are not given preference by seniority.
St. Paul, Minn. Seniority is used to determine the order in which teachers will be displaced, laid off and recalled. Teachers who were displaced may use seniority to bid on vacant positions for which they are qualified. Unanticipated transfers after school begins are handled administratively.
San Francisco Seniority is used to determine the order in which teachers will be displaced, laid off and recalled. The district personnel office matches vacancies with the preferences of the displaced teachers and gives involuntarily transferred teachers priority over voluntarily transferring teachers.
Summary of Contract Language on Involuntary Transfers, Displacements and Layoffs
To keep these summaries as brief as possible, we have omitted language related to administrative transfer procedures, specifically detailed exceptions to seniority rules and procedures dealing with closure of buildings. Baltimore Building-level staff reductions resulting from budgetary actions, declining enrollment, program changes (e.g., closing programs, reconstituting schools) or judicial requirements are made on the basis of the systemwide seniority. Reassignments to vacant positions are made administratively by management rather than based on seniority, but teacher preferences can be considered. When systemwide reductions in force are necessary, teachers are laid off on the basis of certification in the subject field assignment in reverse order of systemwide seniority. Only a violation of the procedure can be grieved; decisions to lay off are not subject to the grievance procedure. Laid-off teachers are recalled in reverse order of layoff. No teachers new to the district can be hired in areas where a layoff has occurred until the teachers laid off have been recalled. Boston
The Impact of Collective Bargaining on Teacher Transfer Rates/ 42
In the case of enrollment decline or budget reductions, and after asking for volunteers, teachers are displaced in reverse order of seniority within a certification and program area (mainly, various subject matter areas). Within a program area, excessed teachers bid on listed vacancies (there is no bumping) in order of seniority. Excessed teachers who are not matched to vacancies are assigned in a suitable professional capacity, including substitute service. For systemwide staff reduction, teachers are laid off in reverse order of seniority within a program area. Recall is by seniority, and they have first preference in filling permanent vacancies. The superintendent may fill, at his or her discretion up to 50 percent of all vacancies of underperforming schools. However, for every new teacher hired by the superintendent under this provision, a laid-off teacher is recalled to a vacancy in a program area for which he or she is qualified. Chicago [Pending Review of Local Union] Dade County (Miami) [Pending Review of Local Union] Detroit A teacher forced to transfer due to reduction in staffing needed at a school is offered more than one school for transfer. The placement of forced transfers takes priority over hiring teachers new to the district. Teachers are laid off in inverse order of systemwide seniority within programs/subject/school grade level. Laid-off teachers are recalled in reverse order of layoff and administratively placed consistent with balance of staff requirements. No teacher can be hired in areas where staff reduction has occurred until laid-off teachers have been recalled. The superintendent may close and reconstitute schools in some circumstances and declare all positions vacant. The vacant positions are filled through the normal hiring and voluntary transfer process. Duval County (Jacksonville, Fla.) In order to reduce staff within a building, and after seeking volunteers, teachers are surplused by seniority. At the discretion of the superintendent or designee, personnel who are in unique programs or who meet special needs may be exempt from the surplus. Transfers are made administratively by management in consultation with the union. If a reduction in force is necessary, the criteria for determining who is laid off or recalled are certification, satisfactory performance and seniority. The superintendent may close and reconstitute schools in some circumstances and in consultation with the union can administratively reassign staff back to the school based on the following priorities: certification, teacher had originally been selected by the current principal and principal’s request of a waiver through the shared decision-making process. Helena, Mont. Involuntary transfers resulting from a need for staff reduction within a building are filled first by a request for qualified volunteers from within the building. Absent qualified volunteers, the
The Impact of Collective Bargaining on Teacher Transfer Rates/ 43
qualified teacher (certified to teach the subject or grade level) with the least district seniority from within the building is involuntarily transferred. After discussions with the laid-off employee, teachers are administratively transferred by management to vacant jobs in other schools. Laid-off teachers are recalled in reverse order of layoff. No teachers new to the district can be hired in areas where a layoff has occurred until the teachers laid off have been recalled. Los Angeles [Pending Review of Local Union] New York City If no senior teacher volunteers, the following excessing rules are used: Within the school, district or other organizational unit, the teacher with the least seniority within license and program (e.g., early childhood, bilingual, and several other program categories specifically) is the first to be excessed, and probationary teachers are excessed before those who have completed probation. Bumping is not allowed. If a school is closed, all teachers in the school are treated as excessed teachers regardless of seniority. Teachers at risk of excessing must be notified by June 15 and may apply for vacancies citywide. Excessed teachers unable to find jobs are: (a) placed in a vacancy in district or, if none is available, in the region (New York is divided into regions, each containing several districts), or (b) retained in the home school or one nearby as an absent-teacher reserve. Excessed teachers unable to find a position may receive job-seeking assistance from the Division of Human Resources or the union’s Peer Intervention Program. According to state law, excessed nonprobationary teachers cannot be terminated from employment. Perth Amboy, N.J. Reductions in force are based on district seniority within a category (e.g., certification, subject or program) with the least senior being laid off first. Laid-off teachers are put on a preferred eligibility list for possible recall when categorical openings for which they are qualified occur. If an assignment is in effect an involuntary transfer (administrative transfer), the teacher has a right to discuss the assignment with the superintendent. Philadelphia Involuntary transfers due to decreased pupil enrollment are based on building seniority, provided such a transfer does not adversely affect the racial balance of the school. When displaced teachers seek vacant positions, teachers with at least five years of experience have preference over voluntary transfers and use systemwide seniority; involuntary transfers with fewer than five years of experience use building seniority. Involuntary transfers have preference over voluntary transfers in the transfer pool. In a school that operates with site-based selection, for every two vacancies, one is site-selected and one is selected by seniority. Reduction in force is by reverse seniority. To the extent that vacancies subsequently occur, the district reassigns laid-off teachers. Rochester, N.Y.
The Impact of Collective Bargaining on Teacher Transfer Rates/ 44
For transfers necessitated by a reduction in staff or shifting pupil population, volunteers are requested to the extent possible; then reductions are by seniority in a certification area. Involuntarily displaced unit members seeking jobs through the transfer process may choose a position in round two and four of the transfer process. Involuntary transfers select from available openings based on seniority. A more senior staff member may choose to displace themselves saving the least senior person from displacement. Exceptions to the vacancies-and-transfers policy may be initiated by the district after showing established special criteria or requirements in the area of academic or extracurricular need or Title I comparability standards. For purposes of transfer, unit members who have been recalled from layoff are treated as new hires for assignment purposes. St. Paul, Minn. When involuntary transfers are necessary, the district first requests volunteers. Then, teachers within the building, department or program being reduced are displaced in inverse order of seniority and placed on the involuntary transfer list in the same order of their seniority. Teachers indicate from a vacancy listing their priority of preferred assignments, and the reassignments are made by using their preferences by order of seniority. Seniority rights are limited to the vacancies existing at the time the teacher is contacted for reassignment or recalled. If a position previously closed is reopened prior to the first duty day, teachers with the most seniority who were previously required to leave have the option of returning to that assignment. Involuntary transfers of teachers after the beginning of the school year that were not anticipated are individually processed in a manner consistent with the general intent that seniority and qualification should govern. San Francisco After asking for volunteers, selection of teachers for consolidation is based on district seniority, credentials and qualifications, consistent with the principle of maintaining or improving the racial and ethnic balance at each school. Teachers designated for consolidation indicate preferences from the list of all anticipated openings. In filling openings, displaced teachers are given priority over teachers seeking voluntary transfer and over new hires. No teacher is involuntarily transferred for two consecutive years. If a position previously closed is reopened prior to the first duty day, a teacher with the most seniority who was previously required to leave has the option of returning to that assignment.
The Impact of Collective Bargaining on Teacher Transfer Rates/ 45

The Impact of Collective Bargaining on Teacher Transfer Rates/ 46