Embed Size (px)
Citation preview
The Impact of Culture on Knowledge Sharing
by
Nirusha Brijball
29589632
A research project submitted to the Gordon Institute of Business Science,
University of Pretoria, in partial fulfilment of the requirements for the degree of
MASTER OF BUSINESS ADMINISTRATION
10 November 2010
©© UUnniivveerrssiittyy ooff PPrreettoorriiaa
i
ABSTRACT
In the new global economy, knowledge is recognised as one of the most
valuable organisational assets and an important competitive advantage.
Therefore organisations need to concede that knowledge sharing is imperative
in order to survive and compete effectively in the global economy. This study
examined the extent to which culture impacted the effectiveness of knowledge
sharing in an organisation. There were four dimensions of culture identified that
influence knowledge sharing namely individualism/collectivism, power distance,
masculinity/feminity and uncertainty avoidance.
This research was quantitative in nature. A web based questionnaire was
administered to a sample of 96 respondents in top and middle management by
means of convenience sampling.
The findings in this study indicate that age, gender and work experience have
no influence on the impact of culture on knowledge sharing. It was further found
that three out of the four cultural dimensions impacted knowledge sharing
positively. They were low individualism and high collectivism, low power
distance and low masculinity and high feminity. The fourth cultural dimension
uncertainty avoidance was found to be high indicating a negative impact on
knowledge sharing. Recommendations for future research include a larger
sample size for a more comprehensive study, a comparative study with other
chrome manufacturing operations and identifying the necessary tools required
to reduce high uncertainty avoidance cultures.
©© UUnniivveerrssiittyy ooff PPrreettoorriiaa
ii
DECLARATION
I declare that this research project is my own work. It is submitted in partial
fulfilment of the requirements for the degree of Master of Business
Administration at the Gordon Institute of Business Science, University of
Pretoria. It has not been submitted before for any degree or examination in any
other University. I further declare that I have obtained the necessary
authorisation and consent to carry out this research.
------------------------------------------
Nirusha Brijball
10 November 2010
©© UUnniivveerrssiittyy ooff PPrreettoorriiaa
iii
ACKNOWLEDGEMENTS
I wish to express my sincere appreciation and thanks to everyone who
supported me through the completion of my dissertation. I am most grateful to
the following people that have made this dissertation possible:
� Foremost, I would like to thank my supervisor Dr. Peter Tobin who
shared with me a lot of his expertise and research insight in the last year.
His thoughtful advice often served to give me a better sense of direction
in my dissertation.
� My special appreciation goes to my mum and dad for their support and
guidance during my years of studies. You have always encouraged me
to do the best in all matters of life. I am who I am today, because of your
love and faith in me. I love you very much and thank you for being the
parents that you are.
� My special gratitude goes to my in laws for their loving support.
� To my dear sisters Eshika, Kerusha, Jayshree and Sureka thanks guys
for your motivation and encouragement through my dissertation and
� Lastly, to my husband Vikesh your support, love and encouragement has
stimulated me to keep going on and have this dissertation completed.
You have been my strength in the last two years and I love you very
much. Thank you for your patience and understanding. (No more long
evening drives after lectures )
©© UUnniivveerrssiittyy ooff PPrreettoorriiaa
iv
Contents
ABSTRACT .................................................................................................................... i
DECLARATION ............................................................................................................. ii
ACKNOWLEDGEMENTS ............................................................................................. iii
CHAPTER ONE ........................................................................................................... 1
INTRODUCTION AND OVERVIEW OF STUDY .......................................................... 1
1.1. INTRODUCTION ............................................................................................ 1
1.2. RESEARCH OBJECTIVES ............................................................................ 4
1.3. RESEARCH AIM ............................................................................................ 4
1.4. CHAPTER CONCLUSION ............................................................................. 5
CHAPTER 2 ................................................................................................................. 6
LITERATURE REVIEW ................................................................................................ 6
2.1. INTRODUCTION ............................................................................................ 6
2.2. KNOWLEDGE SHARING ............................................................................... 7
2.2.1. The Concept of Knowledge ......................................................................... 7
2.2.2. What is Knowledge Sharing? ...................................................................... 9
2.3. CULTURE .....................................................................................................14
2.3.1. Organisational Culture ...............................................................................16
2.3.2. National Culture .........................................................................................18
2.3.2.1. Individualism/Collectivism ......................................................................20
2.3.2.2. Power Distance ......................................................................................21
2.3.2.3. Masculinity/Feminity ...............................................................................22
2.3.2.4. Uncertainty Avoidance ...........................................................................23
2.3.2.5. Long Term Short Term Orientation .........................................................25
2.4. CHAPTER CONCLUSION ............................................................................26
CHAPTER 3 ................................................................................................................28
RESEARCH HYPOTHESES .......................................................................................28
3.1. INTRODUCTION ...........................................................................................28
©© UUnniivveerrssiittyy ooff PPrreettoorriiaa
v
3.2. RESEARCH HYPOTHESES .........................................................................29
3.2.1. Hypothesis One .........................................................................................29
3.2.2. Hypothesis Two .........................................................................................29
3.2.3. Hypothesis Three ......................................................................................29
3.2.4. Hypothesis Four ........................................................................................30
3.2.5. Hypothesis Five .........................................................................................30
3.3. CHAPTER CONCLUSION ............................................................................30
CHAPTER 4 ................................................................................................................31
RESEARCH METHODOLOGY ...................................................................................31
4.1. INTRODUCTION ...........................................................................................31
4.2. FOCUS OF THE STUDY ..............................................................................31
4.3. RESEARCH DESIGN....................................................................................32
4.4. RESEARCH PURPOSE ................................................................................32
4.4.1. Descriptive Research .................................................................................33
4.4.2. Explanatory (Causal) Research .................................................................33
4.5. SAMPLING DESIGN .....................................................................................33
4.5.1. Unit of Analysis ..........................................................................................34
4.5.2. Population and Sample ..............................................................................34
4.5.3. Sample Size ..............................................................................................35
4.5.4. Sampling Techniques ................................................................................36
4.6. DATA COLLECTION TECHNIQUES .............................................................37
4.6.1. The Questionnaire .....................................................................................37
4.6.1.1. Questionnaire Construction ....................................................................38
4.6.1.2. Administration of the Questionnaire........................................................40
4.6.1.3. Reliability ...............................................................................................41
4.6.1.4. Validity ...................................................................................................41
4.7. ANALYSIS OF DATA ....................................................................................42
4.7.1. Descriptive Statistics ..................................................................................42
4.7.1.1. Frequency Distributions..........................................................................42
©© UUnniivveerrssiittyy ooff PPrreettoorriiaa
vi
4.7.1.2. Measures of Central Tendency ..............................................................43
4.7.2. Ranking .....................................................................................................43
4.7.3. Factor Analysis ..........................................................................................44
4.7.4. Inferential Statistics....................................................................................44
4.7.4.1. Chi-Square .............................................................................................45
4.8. PRESENTATION OF DATA ..........................................................................45
4.8.1. Text Presentation ......................................................................................46
4.8.2. Semi-tabular Form .....................................................................................46
4.8.3. Tables and Graphs ....................................................................................46
4.9. RESEARCH LIMITATIONS ...........................................................................47
4.10. CHAPTER CONCLUSION .........................................................................47
CHAPTER 5 ................................................................................................................48
PRESENTATION OF RESULTS .................................................................................48
5.1. INTRODUCTION ...........................................................................................48
5.2. BIOGRAPHICAL DATA .................................................................................48
5.2.1. Gender ......................................................................................................48
5.2.2. Age ............................................................................................................49
5.2.3. Work Experience .......................................................................................50
5.3. HYPOTHESIS ONE ......................................................................................50
5.4. HYPOTHESIS TWO ......................................................................................53
5.5. HYPOTHESIS THREE ..................................................................................57
5.6. HYPOTHESIS FOUR ....................................................................................61
5.7. HYPOTHESIS FIVE ......................................................................................65
5.8. STATISTICAL ANALYSIS OF QUESTIONNAIRE - RELIABILITY .................69
5.9. FACTOR ANALYSIS – ROTATED MATRIX ..................................................70
5.10. FORCED RANKING ..................................................................................71
5.11. CHAPTER CONCLUSION .........................................................................72
CHAPTER 6 ................................................................................................................74
DISCUSSION OF RESULTS .......................................................................................74
©© UUnniivveerrssiittyy ooff PPrreettoorriiaa
vii
6.1. INTRODUCTION ...........................................................................................74
6.2. HYPOTHESIS ONE ......................................................................................74
6.3. HYPOTHESIS TWO ......................................................................................76
6.4. HYPOTHESIS THREE ..................................................................................80
6.5. HYPOTHESIS FOUR ....................................................................................83
6.6. HYPOTHESIS FIVE ......................................................................................86
6.7. BIOGRAPHICAL DATA .................................................................................88
6.8. FORCED RANKING – KNOWLEDGE SHARING ..........................................88
6.9. CHAPTER CONCLUSION ............................................................................90
CHAPTER 7 ................................................................................................................93
CONCLUSION AND RECOMMENDATIONS ..............................................................93
7.1. INTRODUCTION ...........................................................................................93
7.2. RECOMMENDATIONS OF THE STUDY ......................................................93
7.2.1. Recommendations based on the Results of the Study ...............................93
7.2.2. Recommendations for Future Research ....................................................96
7.3. CHAPTER CONCLUSION ............................................................................97
REFERENCE LIST ......................................................................................................99
APPENDIX 1 – QUESTIONNAIRE ............................................................................ 106
LIST OF TABLES
Table 1: Frequency Distribution of the Sample by Gender...........................................48
Table 2: Frequency Distribution of the Sample by Age ................................................49
Table 3: Frequency Distribution of the Sample by Work Experience ...........................50
Table 4: Results of the Chi Square and Crosstabs between the Biographical Data of
Employees and the Four Cultural Dimensions ......................................................52
Table 5: Chi Square Test - Individual Statements ........................................................53
Table 6: Mean Analysis of Individualism/Collectivism impacting knowledge sharing in
an organisation .....................................................................................................54
Table 7: Mean Analysis of Power Distance impacting knowledge sharing in an
organisation .........................................................................................................58
©© UUnniivveerrssiittyy ooff PPrreettoorriiaa
viii
Table 8: Mean Analysis of Masculinity/Feminity impacting knowledge sharing in an
organisation .........................................................................................................61
Table 9: Mean Analysis of Uncertainty Avoidance impacting knowledge sharing in an
organisation .........................................................................................................65
Table 10: Reliability Analysis .......................................................................................69
Table 11: Factor Analysis - Rotated Matrix ..................................................................70
Table 12: Forced Ranking ...........................................................................................72
LIST OF FIGURES
Figure 1: Cultural Elements Influencing Knowledge Sharing .......................................19
Figure 2: Response Indication level: A1 - Employees like to work in a group rather than
by themselves ......................................................................................................54
Figure 3: Response Indication level: A2 - If a group is slowing me down, it is better to
leave it and work ..................................................................................................55
Figure 4: Response Indication level: A3 - One does better work when working alone
than in a group .....................................................................................................55
Figure 5: Response Indication level: A4 - Problem solving by groups gives better
results than problem solving by individuals ...........................................................56
Figure 6: Response Indication level: A5 - An employee should accept the group's
decision even he/she has a different opinion ........................................................57
Figure 7: Response indication level: B1 - I am not afraid to share my ideas with my
direct superior ......................................................................................................58
Figure 8: Response Indication Level: B2 - I am consulted my direct superior in his/her
decisions ..............................................................................................................59
Figure 9: Response Indication Level: B3 - My direct superior only shares his/her
insights with colleagues of the same stature ........................................................59
Figure 10: Response Indication Level: B4 - I have a good working relationship with my
direct superior ......................................................................................................60
Figure 11: Response Indication Level: B5 - Decision making in my department only
occurs top down ...................................................................................................60
Figure 12: Response Indication Level: C1 - Competition between employees usually
does more harm than good ..................................................................................62
Figure 13: Response Indication Level: C2 - Everyone is paranoid that someone else
can do the job better and quick so there is very little knowledge sharing ..............63
©© UUnniivveerrssiittyy ooff PPrreettoorriiaa
ix
Figure 14: Response Indication Level: C3 - I am secure to share my knowledge with
others in the organisation .....................................................................................63
Figure 15: Response Indication Level: C4 - I am selfish and do not share my expertise
with others in the organisation ..............................................................................64
Figure 16: Response Indication Level: C5 - My knowledge sharing will help others in
the organisation to solve problems .......................................................................64
Figure 17: Response Indication Level: D1 - My organisation is very much in “status
quo” and takes the “do not rock the boat” approach to management style ............66
Figure 18: Response Indication Level: D2 - I often feel nervous or tense at work ........67
Figure 19: Response Indication Level: D3 - Adopting something new in the organisation
is seen as risky and having the potential to create significant problems ...............67
Figure 20: Response Indication Level: D4 - There is a standard operating procedure in
handling work tasks in my department .................................................................68
Figure 21: Response Indication Level: D5 - A host of work rules spell out ways to
handle work tasks in my department ....................................................................68
©© UUnniivveerrssiittyy ooff PPrreettoorriiaa
1
CHAPTER ONE
INTRODUCTION AND OVERVIEW OF STUDY
1.1. INTRODUCTION
In the new global economy, knowledge is recognised as one of its most
valuable assets and is an important competitive factor. Knowledge is a
critical resource in an organisation that is required to ensure and sustain a
competitive advantage. Therefore, organisations need to concede that
knowledge sharing has to be recognised as an imperative strategic route
which businesses have to acquire, in order to survive and compete
effectively in the global environment. For companies to participate actively in
the global economy they need to initiate ways to share information and
create new knowledge.
Drucker (2001) claimed for companies today to sustain competitive
advantage they have to effectively manage knowledge. Their success is also
dependent on how well the organisation taps into human knowledge
(intellectual capital) and how they share it within the organisation and across
national borders (Wei, Stankosky, Calabrese, & Lu, 2008; Rivera-Vazquez,
Ortiz-Fournier, & Flores, 2009).
Davenport & Prusak (1998) also argued that organisations can no longer rely
on their previous successes to ensure a definite future success.
©© UUnniivveerrssiittyy ooff PPrreettoorriiaa
2
Research has concentrated on factors such as trust, collaboration, open
communication, corporate culture and organisational values that has lead to
effective knowledge management (De Long & Fahey, 2000; Gold, Malhotra,
& Segars, 2001; Ciganek, Mao, & Srite, 2008). Their studies suggested that
organisational culture can significantly promote or impede knowledge
management initiatives.
However, (Hofstede, 1980) argued that organisations cannot ignore the fact
that organisational cultures exist independently of national cultures.
Furthermore, distinct qualities and diverse languages arise from different
national cultures (Ford & Chan, 2003). These additional factors need to be
evaluated by organisations so that they can influence its capability in
achieving successful knowledge sharing.
Gupta & Govindarajan (2000) in their research regarding knowledge transfer
between units of multinational corporations discussed the various factors in
international knowledge sharing. There have been several other studies that
explicitly concentrated on cultural factors that influence knowledge
management and transfer (Chow, Deng, & Ho, 2000; Ford & Chan, 2003;
Hutchings & Michailova, 2004; Hauke, 2006; Minbaeva, 2007), however, no
previous research was identified in South Africa. This was later confirmed by
(Tong & Mitra, 2009; Wilkesmann, Fischer, & Wilkesmann, 2009) in their
studies which demonstrated that knowledge sharing, learning in
organisations and communication are greatly influenced by cultural values of
©© UUnniivveerrssiittyy ooff PPrreettoorriiaa
3
individual employees. As a result it is apparent that the four cultural
dimensions derived by (Hofstede, 2001) namely, individualism versus
collectivism, power distance, uncertainty avoidance and masculinty versus
feminity; either impede or promote knowledge sharing in organisations.
Studies have been conducted in countries that are rapidly moving towards
stability such as Russia, China and Turkey (Hutchings & Michailova, 2004;
Nayır & Uzunçarşılı, 2008; Tong & Mitra, 2009) by gradually building up
businesses; taking steps towards knowledge sharing both internally within
the organisation and externally to clients, customers and suppliers (Burke,
2010). There is very little research concentrating on South Africa and the
impact that culture has on knowledge sharing. King, Kruger, & Pretorius’
(2007) study of knowledge sharing in South Africa found that the diversity of
cultures in South African companies acted as barriers to knowledge sharing
and focused only on an organisational context.
More research is required in South Africa to focus primarily on the impact of
national culture on knowledge sharing. Consequently, this study investigates
whether the four dimensions of culture will promote or impede knowledge
sharing in organisations.
©© UUnniivveerrssiittyy ooff PPrreettoorriiaa
4
1.2. RESEARCH OBJECTIVES
The following objectives have been formulated:
� To obtain an understanding of employees perceptions of knowledge
sharing
� To evaluate the extent to which the cultural dimensions influence the
organisation
� To assess the impact that culture has on knowledge sharing:
• To assess the extent to which individualism/collectivism
influence knowledge sharing.
• To assess the extent to which power distance impacts on
knowledge sharing.
• To assess the extent to which uncertainty avoidance affects
knowledge sharing.
• To assess the extent to which masculinity/feminity influences
knowledge sharing.
• To assess the extent to which long term short term orientation
impacts knowledge sharing.
1.3. RESEARCH AIM
The fundamental aim of this research was to answer the question: “To what
extent can culture have an impact on the effectiveness of knowledge sharing
in organisations in general?” The research has been built on the theoretical
©© UUnniivveerrssiittyy ooff PPrreettoorriiaa
5
framework presented and investigated the variables identified in the
literature. Primary data was obtained by administering an online
questionnaire among a selection of employees in an organisation. From the
findings, suitable recommendations were made to address the impact of
culture on knowledge sharing.
1.4. CHAPTER CONCLUSION
This chapter discussed the research problem and the importance as to why
the study has to be accomplished, together with the objectives and research
aim.
The next chapter (chapter 2) includes a review of the literature which
incorporates an in depth discussion in the areas of knowledge sharing and
culture.
©© UUnniivveerrssiittyy ooff PPrreettoorriiaa
6
CHAPTER 2
LITERATURE REVIEW
2.1. INTRODUCTION
This chapter exhibits an overview of the literature applicable to knowledge
sharing and culture. The literature review begins by addressing the first main
theme, knowledge sharing. The concept of knowledge is defined by different
authors to obtain an understanding of the term, in the context of knowledge
sharing. The term knowledge sharing is then described by several authors, after
which, is a discussion on why knowledge sharing should be utilised and its
importance to businesses today.
The second main theme culture is then defined by various authors. The
literature then moves onto a brief overview of organisational culture and its
impact on knowledge sharing. National culture is then examined where an in-
depth discussion on the various dimensions of culture are discussed. Herein are
many views and arguments by authors on the subject of national culture in
terms of its different dimensions and how it influences knowledge flow between
individuals (Gupta & Govindarajan, 2000; Ford & Chan, 2003).
©© UUnniivveerrssiittyy ooff PPrreettoorriiaa
7
2.2. KNOWLEDGE SHARING
2.2.1. The Concept of Knowledge
Knowledge has become one of the factors of micro competitiveness, which can
be characterised as the ability of a company to increase productivity and
develop new products and markets in terms of, more fierce competition (Hauke,
2006). Therefore, it is crucial for enterprises that want to reach a competitive
advantage to have good knowledge transfer and a culture promoting knowledge
sharing among employees (Rivera-Vazquez, Ortiz-Fournier, & Flores, 2009).
Davenport and Prusak (1998, p. 5) define knowledge as:
“A fluid mix of framed experience, values, contextual information, and
expert insight that provides a framework for evaluating and incorporating
new experiences and information. It originates and is applied in the
minds of knowers”.
As highlighted by CEN (2004, p.10) the definition of knowledge is:
“A set of data and information (when seen from an Information
Technology point of view), and a combination of, for example know-how,
experience, emotion, believes, values, ideas, intuition, curiosity,
motivation, learning styles, attitude, ability to trust, ability to deal with
complexity, ability to synthesise, openness, networking skills,
communication skills, attitude to risk and entrepreneurial spirit to result in
©© UUnniivveerrssiittyy ooff PPrreettoorriiaa
8
a valuable asset which can be used to improve the capacity to act and
support decision making”.
According to (Davenport & Prusak, 1998) knowledge is unlike information, it is a
function of a particular perspective of an individual and it is all about beliefs,
values, attitudes and commitment.
Harris (2001) described knowledge as a resource that is contained within the
minds of employees, and is perhaps the only resource that when utilised can
augment the value of other capital and does not diminish in time. For a
company to maintain a competitive advantage it must create, share and utilise
the knowledge it possesses (Nayır & Uzunçarşılı, 2008). There are two types of
knowledge that an individual or an organisation can have i.e. tacit or explicit
knowledge. (Nonaka, 1994) pointed out that explicit knowledge is easily
articulated, coded and transferred whereas tacit knowledge is more difficult to
articulate as it has a personal quality to it.
A second classification of knowledge as described by (Nonaka, 1994) is
individual and organisational knowledge. Organisational knowledge is
developed and created within groups of individuals (Alavi & Leidner, 2001),
which leads to a gap between the knowledge in individuals and the
organisation. Ford & Chan (2003) mention that for organisations to gain the
advantage of knowledge management, they need to capitalise on an individual’s
knowledge and turn as much of it into organisational knowledge. According to
©© UUnniivveerrssiittyy ooff PPrreettoorriiaa
9
(Zakaria, Amelinckx, & Wilemon, 2004, p. 16) “knowledge is filtered through
cultural lenses, whether we are aware of such filters or not”.
As a result it has become clear that knowledge originates within an individual
and is an important resource for organisations to benefit from for maintaining
competitive advantage. From the literature, it is apparent that the way an
individual thinks and interprets information is partially influenced by his or her
beliefs and values.
2.2.2. What is Knowledge Sharing?
An examination of the literature that concentrates on knowledge sharing reveals
that there are many facets to understanding exactly what knowledge sharing is.
Gupta & Govindarajan (2000) described knowledge sharing as a process of
identification, outflow, transmission and inflow of knowledge in an organisation.
Lee (2001, p. 324) explained knowledge sharing in terms of “activities of
transferring or disseminating knowledge from one person, group, or
organisation to another.”
Furthermore the concept of knowledge sharing was defined by (Bartol &
Srivistava, 2002) as involving the sharing of ideas, facts, suggestions and
proficiency among employees relevant for an organisation’s performance. This
exchange can take place both informally in places like the corridor and formally
in meetings, seminars and presentations (Bircham, 2003). Bock & Kim (2002)
©© UUnniivveerrssiittyy ooff PPrreettoorriiaa
10
described it as the transmission or distribution of individual knowledge in an
organisation. As discussed earlier (Zakaria et al, 2004) were of the opinion that
the knowledge of an individual is filtered through cultural lenses. Usoro & Kuofie
2006, p. 16) validated this view in their definition of knowledge sharing:
“Knowledge sharing is generally conceived as an exchange (of
knowledge) from a giver to a receiver. The receiver is not passively
taking knowledge. The receiver’s perception of what is shared is
influenced, inter alia, by his or her cultural background”.
Ipe (2003) reinforced the point discussed by (Lee, 2001) that knowledge sharing
is a process by which the knowledge held by an individual is transformed into a
form that can be understood, absorbed and utilised by other individuals. In
addition, (Ipe, 2003) goes on further to assert that sharing implied that the
process of presenting individual knowledge in the form that can be used by
others involves some conscious action on the part of the individual who
possesses the knowledge. This process is essential in translating individual
knowledge into organisational knowledge.
Davenport (1997) defined sharing as a voluntary act. This was confirmed by
(Ford & Chan, 2003) in their study as they found that sharing of solutions
between suborbinates in an organisation was primarily a voluntary activity.
Whenever knowledge sharing occurs (Ford & Chan, 2003) were of the view that
knowledge flowed between two individuals or from an individual to a team of
©© UUnniivveerrssiittyy ooff PPrreettoorriiaa
11
individuals. They made mention of various ways in which knowledge flows
occur such as meetings, email or other versions of documentation (i.e. intranet
web pages). Another observation made by (Ford & Chan, 2003) in their study
was that knowledge flowed in different directions such as from top to bottom,
across co-workers and bottom up. Furthermore they pointed out that problem
solving was an example of knowledge sharing. Jackson, Chuang, Harden, &
Jiang (2006) are of the view that knowledge sharing, as a knowledge-centered
activity, is one of the fundamental means through which employees can play a
significant part in the innovation, knowledge application and ultimately the
competitive advantage of an organisation.
Knowledge sharing was defined by (Wei, Stankosky, Calabrese, & Lu, 2008) as
a process consisting of one’s knowledge being transferred and provided to
others through a range of methods. These subject matter specialists said this
process is capable of allowing numerous individuals to benefit from the expert
knowledge of a few, and in turn leverage the power of individual knowledge to
become the whole organisational power.
Finally (Rivera-Vazquez et al, 2009) defined knowledge sharing as a process
where individuals mutually exchange both tacit and explicit knowledge to jointly
create a new knowledge. It is evident that there are several dimensions to
understanding exactly what knowledge sharing is. However for the purpose of
this study the definition of knowledge sharing by (Bartol & Srivistava, 2002) will
be adopted.
©© UUnniivveerrssiittyy ooff PPrreettoorriiaa
12
2.2.3. Why make use of Knowledge Sharing?
Knowledge sharing creates opportunities to maximise an organisation’s
capability to generate solutions and efficiencies that provide a business with a
competitive advantage (Reid, 2003). Research has revealed that knowledge
sharing is positively related to team performance, a decline in production costs,
firm innovation capabilities, firm performance including sales growth and a
much quicker completion of new product development projects (Arthur &
Huntley, 2005; Collins & Smith, 2006; Cummings, 2004; Hansen, 2002; Lin H.-
F. , 2007; Mesmer-Magnus & DeChurch, 2009).
Jackson et al, (2006 p. 31) said that “No individual knows everything, and no
individual can keep up with all of the relevant new knowledge continually being
created”. Knowledge sharing among employees conserves resources and frees
up time for people to apply the knowledge they have. Hence, they point out that
another benefit of knowledge sharing is efficiency.
Knowledge sharing practices can bring a great deal of benefits to a company
(Ndlela & du Toit, 2001). They pointed out that through sharing and capturing of
experiences and information, better exploitation and collection of knowledge
within individuals, organisations and professional bodies can be accomplished.
By sharing information and knowledge, individual employees can learn from the
work experience and know-how of others in the organisation (Kang, Kim, &
©© UUnniivveerrssiittyy ooff PPrreettoorriiaa
13
Chang, 2008). In addition to this Kang et al (2008, p. 1549) said “this is not only
a cost effective learning strategy but can also validate individual employees’
accumulated knowledge.”
Furthermore Riesenberger (1998) cited another five reasons as to why
practicing knowledge sharing is beneficial to organisations in maintaining a
competitive advantage:
� Learning about customers
� Understanding effective processes and best practices
� Internal competencies and products
� Awareness of emerging market trends and
� To attain competitive intelligence
With these knowledge sharing practices the expectations are that employees
are more proactive in generating ideas and improving their problem solving
abilities; thus making them far more responsible. Subsequently there will be an
increased understanding of the value of learning within the organisation.
Employees will share best practices, which will bring continuous improvement in
products, services and their performance as a company on a whole (Fong &
Chu, 2006). Furthermore, they stated for enterprises to accomplish stability in
daily operations knowledge needs to be retained from the workforce.
©© UUnniivveerrssiittyy ooff PPrreettoorriiaa
14
Michailova & Husted (2003) confirmed what (Riesenberger, 1998) revealed by
arguing that the processes of identifying, capturing, and leveraging knowledge
inside organisations contributes substantially to creating competitive advantage.
Furthermore, they said that the systematic sharing of knowledge between
employees in an organisation avoids and lessens redundancy in knowledge
production and problem solving processes. Calantone, Cavusgil, & Zhao (2002)
and (Scarbrough, 2003) agreed with (Michailova & Husted, 2003) as both their
studies demonstrated that knowledge sharing is very important, since it enables
organisations to reduce redundant learning attempts and enhances innovation
performance.
According to (Ford & Chan, 2003) knowledge sharing assists in organisational
learning and in its absence the distance between individual and organisation
gets larger. It is one of the most challenging processes for a knowledge-based
enterprise due to employees’ possible reluctance to share what they know.
2.3. CULTURE
The term culture may refer to two dimensions in the context of knowledge
sharing i.e. organisational culture or national culture (Ford & Chan, 2003).
Organisational culture is increasingly being recognised as a major barrier to
effective knowledge sharing (De Long & Fahey, 2000).
©© UUnniivveerrssiittyy ooff PPrreettoorriiaa
15
Hofstede (1980, p. 25) describes national culture as
[…] “the collective programming of the mind which distinguishes one group or
category of people from another. Also, as mental programming patterns of
thinking and feeling, and potentially acting.”
By using the word ‘mind’, it is clear that culture has to do with the way an
individual thinks and how information is interpreted by that individual. Research
by (Ipe, 2003; Ford & Chan, 2003; Tong & Mitra, 2009) confirmed this, as their
studies illustrated that knowledge sharing, communication and learning in
organisations are profoundly influenced by cultural values of individual
employees. This theory by (Hofstede, 1980), explains that an organisation’s
culture is nested within a national culture. Ford & Chan (2003, p. 15) argue that
“organisational culture can act as a mediator for national culture and knowledge
management processes.” Culture in this sense is a system of collectively held
values. The overall characteristics of a country are displayed by the cultural
dimensions and they may significantly impact the knowledge transfer within
enterprises as well as among business partners (Hofstede, 1983).
Cultural differences still play a very important role in achieving success in a
business relationship. They may influence positively, by facilitating
communication between employees and business partners. However, these
differences may also inhibit knowledge transfer and as a result, deter the
competitive position of an enterprise (Hauke, 2006). Therefore it is essential to
©© UUnniivveerrssiittyy ooff PPrreettoorriiaa
16
recognise, that culture influences meaningfully the will to share knowledge in
organisations.
2.3.1. Organisational Culture
Organisational culture can be defined as the shared, basic assumptions that an
organisation has developed while coping with the environment and solving
everyday challenges that are taught to new members as the correct way to
solve those problems (Park, Ribiere, & Schulte, 2004). It is affected by internal
factors such as corporate vision, mission and values in the organisation; the
organisational structure; the operational technology within the organisation; the
leadership as well as external factors such as the social environment of the
organisation (Lemon & Sahota, 2003). Many studies have examined the effect
of organisational culture on knowledge sharing (Gupta & Govindarajan, 2000;
Gold, Malhotra, & Segars, 2001; McDermott & O'Dell, 2001).
Each organisation has its distinctive culture, which develops over time to reflect
the organisation’s identity in two dimensions namely visible and invisible. The
visible dimension of culture is noticable in the espoused values, philosophy and
mission of the organisation whilst the invisible dimension lies in the unspoken
set of values that guide employees’ actions and perceptions in the organisation
(McDermott & O'Dell, 2001). There are a number of cultural dimensions that
have been identified that could have an influence on knowledge sharing. De
Long & Fahey (2000) identified the following aspects of organisational culture
that have an impact on knowledge sharing – culture shapes assumptions about
©© UUnniivveerrssiittyy ooff PPrreettoorriiaa
17
what knowledge is and which knowledge is important, it defines and controls the
relationships between the different levels of knowledge (organisational, group
and individual), and it creates the context for social interaction. Culture also
suggests what to do and what not to do regarding processing of knowledge and
communication in an organisation (Davenport, 1997).
Gold et al (2001) pointed out that corporate culture is an important component
of culture within an organisation. They also mentioned that it provided people in
the organisation with a sense of purpose and created a system of organisational
values. De Long & Fahey (2000) identified specific organisational values they
believed hindered or facilitated knowledge sharing. They argued that values
such as trust and collaboration would lead to employee willingness to share
insights with each other. On the contrary, organisations that have value systems
based on individual power and competition among employees may pose as a
barrier to knowledge sharing. According to (De Long & Fahey, 2000)
organisational culture is regarded by most managers as an important hurdle to
creating and leveraging knowledge assets. They were also of the viewpoint that
culture shapes the creation of new knowledge in an organisation.
It is apparent that organisational culture is an important parameter that
influences knowledge sharing. However, for the purposes of this research,
organisational culture is not being considered as studies conducted in this area
have already focussed on the organisational dimensions that affect knowledge
sharing in South Africa (Finestone & Snyman, 2005; King, Kruger, & Pretorius,
2007).
©© UUnniivveerrssiittyy ooff PPrreettoorriiaa
18
2.3.2. National Culture
Very few research studies have explicitly concentrated on the discussion of
national cultural factors that influence knowledge transfer (Hofstede, 2001;
Bhagat, Kedia, Harveston, & Triandis, 2002; Ford & Chan, 2003; Hutchings &
Michailova, 2004; Wilkesmann, Fischer, & Wilkesmann, 2009).
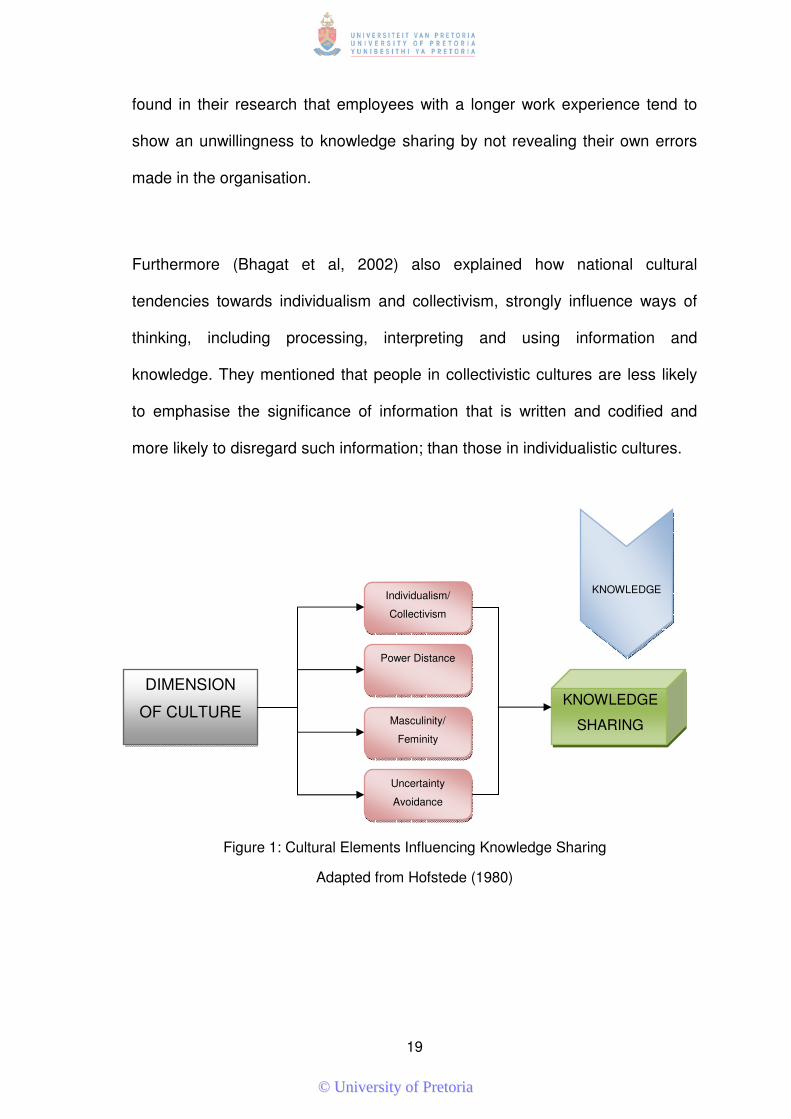
Hofstede (2001) contributed to the dimension of national culture with his five
cultural dimension framework. He classified cultures into individualism versus
collectivism, power distance, uncertainty avoidance, and masculinity versus
femininity and long term short term orientation as shown in Figure 1. When the
fifth dimension i.e. long term short term orientation was developed by (Hofstede
& Bond, 1988) it was based on Confucianism. After a thorough scan of relevant
literature on the fifth cultural dimension the researcher has identified very little
or no inferences on its impact on influencing knowledge sharing (Ford & Chan,
2003; Ardichvili, Maurer, Li, Wentling, & Stuedemann, 2006; Lucas, 2006;
Rivera-Vazquez et al, 2009). Therefore, for the purpose of this study the
researcher has conceded to omit the fifth dimension.
Research by (Gupta & Govindarajan, 2000; Hofstede, 2001; Ford & Chan,
2003) has demonstrated that these factors also influence knowledge flows
between individuals. Ford & Chan (2003) and (Minbaeva, 2007) shared the
opinion that employees with different national cultures and languages in
multinational organisations certainly pose challenges for knowledge sharing.
Previous research has also found that there is a relationship between scores on
the cultural dimensions to gender and age (Hofstede, 1991). Chow et al, (2000)
©© UUnniivveerrssiittyy ooff PPrreettoorriiaa
19
found in their research that employees with a longer work experience tend to
show an unwillingness to knowledge sharing by not revealing their own errors
made in the organisation.
Furthermore (Bhagat et al, 2002) also explained how national cultural
tendencies towards individualism and collectivism, strongly influence ways of
thinking, including processing, interpreting and using information and
knowledge. They mentioned that people in collectivistic cultures are less likely
to emphasise the significance of information that is written and codified and
more likely to disregard such information; than those in individualistic cultures.
Figure 1: Cultural Elements Influencing Knowledge Sharing
Adapted from Hofstede (1980)
KNOWLEDGE
SHARING
DIMENSION
OF CULTURE
Individualism/
Collectivism
Power Distance
Masculinity/
Feminity
Uncertainty
Avoidance
KNOWLEDGE
©© UUnniivveerrssiittyy ooff PPrreettoorriiaa
20
2.3.2.1. Individualism/Collectivism
Individualism describes the tendency of people to place their personal goals
ahead of the goals of a larger social group, such as an organisation (Ardichvili,
Maurer, Li, Wentling, & Stuedemann, 2006). Hofstede (2001) on the other hand
mentioned that individuals in collectivistic cultures tend to give priority to the
goals of the larger collective or group that they belong to. Ford & Chan (2003) in
their study mentioned that in individualistic cultures there is a possibility that it is
more difficult to share knowledge as individuals view knowledge as a source of
power and a tool for success for oneself. In addition, they stated that in
collectivistic cultures knowledge sharing is much easier especially if the group
sees a benefit from it. Triandis (1995) made a further distinction between
individualism and collectivism on the basis of the definition of self.
In a study by (Chow, Deng, & Ho, 2000) they compared the Chinese and Anglo
American culture. Their study concurred with (Hofstede, 2001; Ardichvili et al,
2006) as they suggested that employees from a Chinese culture tended to
share infomation for the good of the organisation even when sharing was
personally disadvantageous (for example, sharing past mistakes on the job).
According to (Bhagat et al, 2002) members of individualistic and collectivistic
cultures are characterised by distinctively dissimilar ways of processing
information and constructing knowledge. For instance, (Ardichvili et al, 2006)
mentioned in individualistic cultures e.g. the United States, individuals tend to
©© UUnniivveerrssiittyy ooff PPrreettoorriiaa
21
see each piece of information independent of its context, emphasise information
in written and codified form, and are more likely to accept such information.
While (Bhagat et al, 2002) point out that in collectivistic cultures e.g. China
members look for contextual cues in information and tend to disregard written
information. Furthermore, in their research (Bhagat et al, 2002) and (Triandis’,
1996) have included that the distinction between horizontal and vertical cultures
have made an important contribution to this facet of literature, by postulating a
theoretical framework. This framework presents the importance of the four
transacting cultural patterns, defined in terms of the dimensions of
individualism-collectivism and verticalness-horizontalness.
2.3.2.2. Power Distance
It is the extent to which the less powerful members of institutions and
organisations within a country expect and accept that power is distributed
unequally (Hofstede, 2001). Triandis (1995) identifies four distinctive cultural
patterns namely vertical and horizontal collectivism and vertical and horizontal
individualism. Ardichvili et al (2006) stated that the horizontal – vertical
distinction is very similar to (Hofstede’s, 2001) power distance dimension. They
also said that in vertical cultures equality is not valued by people and they view
themselves as different from others in social status.
However, in high power distance cultures it is expected and accepted that there
is a difference in status (Hofstede, 2001). In horizontal cultures (Ardichvili et al,
©© UUnniivveerrssiittyy ooff PPrreettoorriiaa
22
2006) point out that power distance is low, which implies that differences in
status are less explicit. Davenport & Prusak (1998) mention that smaller power
distance brings down the gap between superior and the employees, which has
a positive effect on the knowledge sharing process in the enterprise. The lack of
formal distance makes the information flow in both directions much better. This
implies that employees in lower positions are not afraid to show their ideas to
the organisation.
Bhagat et al (2002) went further to argue that the difference between horizontal
and vertical cultures is useful in explaining cross border knowledge transfer,
because information in vertical cultures usually flows from top to bottom,
whereas information flows in both directions in horizontal culture. Likewise
(Hofstede, 2001) suggests that in high power distance cultures information
flows are restricted by hierarchy which could lead to lower level employees
being prohibited from certain types of information. Such structures could act as
an obstacle to knowledge sharing.
2.3.2.3. Masculinity/Feminity
“When Masculinity–Femininity is applied to the national culture as a whole, the
gender role view (social role for the different sexes) is the appropriate
interpretation. However, when the Masculinity – Femininity dimension is applied
to the workplace, the following interpretation is fitting: “Masculine countries
stressed pay security, and job content; feminine countries stressed relationships
and physical conditions” Hofstede (2001, p. 313) (cf. Ford and Chan, 2003).
©© UUnniivveerrssiittyy ooff PPrreettoorriiaa
23
Ford & Chan (2003) also argued that cultures that are high in masculinity may
have less knowledge sharing taking place among individuals in an organisation
if the competitiveness is individually based. Rivera-Vazquez et al (2009) defined
feminity as an environment of cooperation where employees feel secure to
share their knowledge with other colleagues. It shows an atmosphere of
understanding, not one of aggression and self-accomplishment (Hauke, 2006).
2.3.2.4. Uncertainty Avoidance
“Uncertainty Avoidance is the extent to which the members of a culture feel
threatened by uncertain or unknown situations, and is the third dimension,
measured from weak to strong.” Hofstede (1980, p. 110). On the other hand
(Lucas, 2006, p. 267) mentioned this dimension is the “reluctance to deal with
ambiguity and is directly related to the willingness to embrace change.”
According to (Wilkesmann et al, 2009) uncertainty avoidance is the degree to
which members of an organisation strive to avoid uncertainty by relying on
established social norms, rituals and bureaucratic practices. It is also mentioned
in the (Wilkesmann et al, 2009) study, that people in high uncertainty avoidance
cultures eagerly seek to decrease the probability of unpredictable future events
that could adversely affect the operation of an organisation.
Hauke (2006) states that low level of uncertainty avoidance is correlated with a
lack of rules and regulations in a company. Hauke (2006) argues that when
employees in an organisation are willing to take risk, they feel more accountable
©© UUnniivveerrssiittyy ooff PPrreettoorriiaa
24
for their decisions, which results in better satisfaction of achieved success and a
higher self-esteem. In consequence, (Hauke, 2006, p. 8) mentions “they build
informal networks, which enable knowledge sharing across people. These
informal networks are also being built on the basis of ongoing cooperation
between different companies, which is positively correlated with knowledge
sharing process among them.”
Therefore good relationships outside and inside an organisation with a good
social network have a considerable influence on knowledge sharing between
employees. Ford and Chan (2003) in their study between Japanese and North
Americans employees argue that national cultures and knowledge transfer
intersect in the following ways:
• Cultures that are high on individualism may have more trouble in
knowledge transfer than cultures that are high on collectivism;
• Higher power distance in cultures may have a more top-down flow of
knowledge than cultures that are low on power distance;
• A high masculinity in culture may have less knowledge transfer between
organisational members if the competitiveness is individually based, then
there may be no difference if competitiveness is organisationally based;
and
©© UUnniivveerrssiittyy ooff PPrreettoorriiaa
25
• Knowledge transfer between heterogeneous cultural groups may be
trickier or require more time and effort than knowledge transfer within a
homogenous cultural group.
2.3.2.5. Long Term Short Term Orientation
Long term orientation is defined by (Ford & Chan, 2003) as cultures that have
their virtues oriented towards future rewards. In a long term orientation culture,
individuals of that culture are keener to work for long term goals (Hofstede,
2001).
The definition of short term orientation by Ford & Chan (2003, p. 14) is the
“fostering of virtues related to the past and present, in particular, respect for
tradition, preservation of ‘face’, and fulfilling social obligations”. Therefore in a
culture like this individuals may ‘give up’ on knowledge management processes
as a result of the lack of instant affirmation of its effectiveness (Ford & Chan,
2003).
From the literature reviewed there is limited scope on the relevance of this
dimension on knowledge sharing. The definitions cited by (Hofstede, 2001) and
(Ford & Chan, 2003) are only to serve to elucidate the specific traits of long
term short term orientation. However despite the lack of literature on this
cultural dimension in the context of knowledge sharing the limited scope
reduces the elusiveness of this term.
©© UUnniivveerrssiittyy ooff PPrreettoorriiaa
26
2.4. CHAPTER CONCLUSION
This chapter has presented the researcher with vast findings from numerous
studies on the impact of culture on knowledge sharing. The literature takes one
through the critical components that knowledge, knowledge sharing and culture
consist of. Despite the definitional debate of knowledge sharing for the purpose
of this study the researcher has adopted the definition given by (Bartol &
Srivistava, 2002) due to its applicability to knowledge sharing.
It is evident from the literature, that knowledge sharing has the following positive
impacts within an organisation – improved team performance, a decline in
production costs, firm innovative capabilities, gaining competitive intelligence,
continuous improvement of products and services and a much quicker
completion of new product development projects.
The presented cultural factors that influence knowledge sharing in an
organisation provides a better understanding as to why it is an imperative for an
organisation to exploit these cultural aspects, if effective knowledge sharing is
to be achieved.
From the literature it has been shown by several authors that knowledge
sharing in an organisation is profoundly influenced by the cultural values of
individual employees (Bhagat et al, 2002; Ford & Chan, 2003; Hofstede, 2001;
Hutchings & Michailova, 2004; Triandis, 1995). The cultural factors that need to
be taken into consideration in an organisation for effective knowledge sharing to
©© UUnniivveerrssiittyy ooff PPrreettoorriiaa
27
occur, as identified in the literature are individualism/collectivism, power
distance, uncertainty avoidance and masculinity/feminity. For the purpose of
this study the researcher has conceded to omit the fifth cultural dimension, long
term short term orientation due to inadequate literature on how it influences
knowledge sharing (Ford & Chan, 2003; Ardichvili, Maurer, Li, Wentling, &
Stuedemann, 2006; Lucas, 2006; Rivera-Vazquez et al, 2009).
Therefore, determining the impact of culture on knowledge sharing is crucial for
ensuring that successful knowledge sharing takes place amongst employees.
Such research will assist an organisation to align its decisions with employees’
values and perceptions which are shaped by a particular cultural background.
Despite the growing recognition of the importance of culture on knowledge
sharing there is very little research on the impact of national culture on
knowledge sharing.
The next chapter (Chapter 3) will discuss the research hypotheses for this
study.
©© UUnniivveerrssiittyy ooff PPrreettoorriiaa
28
CHAPTER 3
RESEARCH HYPOTHESES
3.1. INTRODUCTION
This chapter outlines the research hypotheses developed from the relevant
literature on knowledge sharing and culture in Chapter 2. The literature review
in Chapter 2 takes one through the critical components that knowledge,
knowledge sharing and culture comprise of and subsequently the impact that
culture has on knowledge sharing. From the various studies by several authors
it is evident that the differences in individualism/collectivism, power distance,
uncertainty avoidance and masculinity/feminity are the most commonly used
universal criteria that may impact knowledge sharing in organisations.
It appears there is not enough research on the impact of national culture on
knowledge sharing; the researcher developed the research hypotheses in an
attempt to determine the effect that culture has on knowledge sharing. Each
cultural dimension is tested by a hypothesis to determine whether there is a
cultural impact on knowledge sharing.
©© UUnniivveerrssiittyy ooff PPrreettoorriiaa
29
3.2. RESEARCH HYPOTHESES
3.2.1. Hypothesis One
H0: There is a no difference in employee perceptions varying in biographical
profiles (age, gender, work experience) regarding the impact of the dimensions
of culture (individualism/collectivism, power distance, uncertainty avoidance
and masculinity/feminity) on knowledge sharing.
H1: There is a difference in employee perceptions varying in biographical
profiles (age, gender, work experience) regarding the impact of the dimensions
of culture (individualism/collectivism, power distance, uncertainty avoidance and
masculinity/feminity) on knowledge sharing.
3.2.2. Hypothesis Two
H0: High individualism and low collectivism impedes knowledge sharing.
H1: Low individualism and high collectivism promotes knowledge sharing.
3.2.3. Hypothesis Three
H0: High power distance negatively impacts on knowledge sharing.
H1: Low power distance positively impacts on knowledge sharing.
©© UUnniivveerrssiittyy ooff PPrreettoorriiaa
30
3.2.4. Hypothesis Four
H0: High masculinity and low feminity impedes knowledge sharing.
H1: Low masculinity and high feminity promotes knowledge sharing.
3.2.5. Hypothesis Five
H0: High uncertainty avoidance negatively impacts on knowledge sharing.
H1: Low uncertainty avoidance positively impacts on knowledge sharing.
3.3. CHAPTER CONCLUSION
This chapter discussed the research hypotheses to be used in this research
study.
The next chapter (Chapter 4) focuses on the research methodology section.
©© UUnniivveerrssiittyy ooff PPrreettoorriiaa
31
CHAPTER 4
RESEARCH METHODOLOGY
4.1. INTRODUCTION
This chapter focuses on the research approach and other investigative methods
that were used to address the research problem in Chapter 1. These include the
research design, research purpose, sampling design (unit of analysis,
population and sample and sampling techniques used), data collection
methods, analysis of data and research limitations. Furthermore it will be
illustrated in the research purpose how the research problem is defined as a
cause and effect relationship. Quantitative methods were used to collect data to
analyse the research problem identified Chapter 1.
4.2. FOCUS OF THE STUDY
This study concentrated on the impact of culture on knowledge sharing in an
organisation. The two main aspects examined were the perceptions and
attitudes of employees in an organisation towards the influence of culture on
knowledge sharing.
©© UUnniivveerrssiittyy ooff PPrreettoorriiaa
32
4.3. RESEARCH DESIGN
Zikmund (2003, p. 65) described a research design as a “master plan specifying
the methods and procedures for collecting and analysing the needed
information”. There are two approaches that can be applied to this research
study, according to (Cooper & Schindler, 2001). These are qualitative and
quantitative methods. In a qualitative approach the idea is to get a greater
understanding of a concept rather than providing specific measurements
(Zikmund, 2003). The focus on this type of approach is mainly on words and
observations: namely intrepretations and meaningful characterisations.
Alternatively, data is collected in a quantitative approach to be measured and
calculated at a later stage in the research study so that conclusions can be
drawn (Cooper & Schindler, 2001). The researcher has adopted the quantitative
approach for this study to assist with the assessment of the different dimensions
of culture on knowledge sharing.
4.4. RESEARCH PURPOSE
Research designs can be classified in terms of their purpose. Cooper &
Schindler (2001) defined some of the common forms of research design as
descriptive, explanatory (causal) and exploratory. For this research study the
researcher adopted a descriptive and causal approach.
©© UUnniivveerrssiittyy ooff PPrreettoorriiaa
33
4.4.1. Descriptive Research
Descriptive research describes the characteristics of an existing phenomenon.
According to (Cooper & Schindler, 2001) it is a study that tries to discover
answers to the questions who, what, where and sometimes how that define the
research subject.
4.4.2. Explanatory (Causal) Research
The fundamental aim of causal research is to study a problem and to collect
data on the phenomenon. This is realised through an analytical and deductive
process often involving statistical analyses to describe the relationship between
the variables (Hussey & Hussey, 1997). Furthermore (Zikmund, 2003)
mentioned that this type of research is utilised to identify cause – and – effect
relationships among variables.
For example in this study the researcher assessed how each dimension of
culture affected knowledge sharing.
4.5. SAMPLING DESIGN
The techniques discussed in this section include the unit of analysis, population
and sample and sampling techniques.
©© UUnniivveerrssiittyy ooff PPrreettoorriiaa
34
4.5.1. Unit of Analysis
Zikmund (2003) stated that the unit of analysis is a crucial aspect of a problem
definition. It assists the researcher to focus on the correct level of investigation
and ensures the appropiate collection of data.
In order to answer the hypotheses stated earlier, the unit of analysis for this
research study was all individuals from top and middle management at
Samancor Chrome. Samancor Chrome was identified as the chosen
organisation, as it was a convenient sample with easy access to privileged data.
4.5.2. Population and Sample
Sekaran (2003, p. 265) defines a population as “the entire group of people,
events, or things of interest that the researcher wishes to investigate”. Due to
difficulty in researching entire populations, a sample was extracted. The
population for this study included all the employees in top and middle
management positions at Samancor Chrome. Top management included
individuals responsible for overseeing the whole organisation and who were
more involved in the strategic matters of the business, rather than day to day
operations. Middle managers consisted of individuals that reported to top
management and were in charge of a particular department.
©© UUnniivveerrssiittyy ooff PPrreettoorriiaa
35
A sample is a subset of the population (Saunders, Lewis, & Thornhill, 2003).
Zikmund (2003, p. 369) describes sampling as “a process of using a small
number of items or parts of a larger population to make conclusions about the
whole population”. Samples give the researcher the opportunity to generalise to
the population. Therefore it is essential that the sample chosen is representative
of the population it is expected to characterise (Sekaran, 2003).
4.5.3. Sample Size
Zikmund (2003) warns that the determination of an appropiate sample size is a
crucial aspect of business research.
The following sampling size issues must be considered when determining the
amount of respondents required for the research study (Cooper & Schindler,
2001):
� The confidence level that the researcher wants in the estimate together
with the size of the interval estimate.
� The researcher then determines the expected dispersion in the
population.
� An approximate standard deviation of the population
Considering all of the above issues, the researcher established a 95%
confidence level with an estimated 10% desired interval range. The expected
©© UUnniivveerrssiittyy ooff PPrreettoorriiaa
36
dispersion of the population approximated to be 30% with a standard error of
proportion equaling 0.051. The sample size calculated was ninety-six (96).
A total of ninety-six (96) respondents from Samancor Chrome will form the
sample for this study.
4.5.4. Sampling Techniques
The two basic groups of sampling are probability and non–probability sampling.
Probability sampling is based on the concept of random selection (Zikmund,
2003). Probability techniques include simple random sampling, stratified
sampling, systematic sampling, cluster sampling and multistage sampling. Non
probability sampling is arbitrary (non random) and subjective. Each member
does not have a known zero chance of being included. Non-probability
techniques include quota sampling, convenience sampling, judgement sampling
and snowball sampling (Zikmund, 2003).
The sampling technique used in this study is convenience sampling. In
convenience sampling, the researcher has the freedom to choose whoever is
available for inclusion in the sample (Cooper & Schindler, 2001).
©© UUnniivveerrssiittyy ooff PPrreettoorriiaa
37
4.6. DATA COLLECTION TECHNIQUES
Researchers can utilise several data collection techniques (Sekaran, 2003).
These include personal interviews such as face-to-face and door-to-door
interviews, telephonic interviews and self-administered questionnaires that are
either personally administered, web based, sent through mail, or electronically
administered (Zikmund, 2003).
The data collection method will be discussed by describing the questionnaire in
detail.
4.6.1. The Questionnaire
Self-administered questionnaires posted on the web were used in this study to
collect information. The questionnaire is one of the most widely used survey
data collection technique (Saunders, Lewis, & Thornhill, 2003). Zikmund (2003)
details some of the advantages of self-administered questionnaires. These
include, speed and cost effectiveness, high response rate, respondent
participation and cooperation and minimum interviewer bias.
Sekaran (2003) and Cooper & Schindler (2001) mentioned that a questionnaire
is a effective research tool as the researcher knows precisely what is required
and how to measure the variables of interest. The questions asked in the
questionnaire are based on the research question (Cooper & Schindler, 2001).
The questionnaire used in this research study was constructed by the
researcher.
©© UUnniivveerrssiittyy ooff PPrreettoorriiaa
38
4.6.1.1. Questionnaire Construction
A good questionnaire of sound quality should flow seamlessly and be well
integrated (Saunders, Lewis, & Thornhill, 2003). The researcher developed a
questionnaire based on questions designed to assess knowledge sharing
according to respondent’s opinions and perceptions regarding each of the
cultural factors. Independent variables were measured, by obtaining the
respondents extent of agreement with the existence of corresponding indicators
in the work environment. The extent of agreement was measured using the
Likert scale assessment ranging from 5 = strongly agree to 1 = strongly
disagree.
The questionnaire comprised of the following:
a) Biographical data, which comprised of age, work experience, gender.
b) Perception. This section intended to gauge the level of understanding of
knowledge sharing among respondents, - which was achieved using
forced ranking. Respondents had to rank ten statements according to
their perceived level of importance.
c) Attitudes. Questions 8 to 11 were formulated to assess attitudes
towards knowledge sharing relevant to the four dimensions of culture
namely individualism/collectivism, power distance, masculinity/feminity
and uncertainty avoidance. Independent variables were measured by
obtaining the respondents extent of agreement with the corresponding
indicators in the work environment. The extent of agreement was
measured through Likert scale assessment ranging from 5 = strongly
agree to 1 = strongly disagree. Such levels of agreement or
©© UUnniivveerrssiittyy ooff PPrreettoorriiaa
39
disagreement illustrate the impact of a particular cultural dimension on
knowledge sharing that being a positive or negative impact. Example:
“Employees like to work in a group rather than by themselves” Agree or
strongly agree indicates that low individualism and high collectivism
positively impacts knowledge sharing.
Sekaran (2003) argues that well constructed questionnaire should focus on
three areas, issues related to variables, wording and appearance of the
questionnaire.
a) Wording
The researcher initially determined the nature of the variables (was it objective
or subjective) in terms of content and purpose of the questionnaire, in order to
decide on the questions to be asked.
It was essential that the language of the questionnaire was appropriate to the
level of understanding of the respondents. The researcher ensured that the
choice of wording reflected the educational level of the subjects.
b) Type
This refers to whether the question will be closed or open-ended. In this
research study the researcher used closed questions. This kind of question
presented the respondents with a selection of options from which they made a
choice.
©© UUnniivveerrssiittyy ooff PPrreettoorriiaa
40
In terms of form, this refers to positively or negatively worded questions. The
researcher utilised both these types in the questionnaire. This ensured that the
respondents remained involved and alert when answering the questions.
Furthermore the researcher constructed the questionnaire taking cognisance of
the following errors identified by (Zikmund, 2003):
1. The researcher avoided the use of technical jargon and abbreviations, as
not all respondents have a college vocabulary and abbreviated terms can
hold different meanings for some respondents.
2. When constructing the questionnaire the researcher had to avoid the use
of leading and loading questions. These questions could lead the
respondents to a certain answer.
3. The questionnaire was constructed such that indefinite words that can be
interpreted in many ways were avoided. This assisted the researcher in
avoiding ambiguity and vagueness.
4. Double barrelled questions were avoided by the researcher during the
construction of the questionnaire.
5. The researcher had to avoid making assumptions about issues.
4.6.1.2. Administration of the Questionnaire
The questionnaires were administered at Samancor Chrome. General
Managers of the different work units were approached for approval. Once this
©© UUnniivveerrssiittyy ooff PPrreettoorriiaa
41
approval was attained, the web address of the online questionnaire was
emailed to the general managers to distribute to their sections.
4.6.1.3. Reliability
Reliability tells the researcher the degree to which measures are error free and
will yield consistency in results (Zikmund, 2003). There are several kinds of
reliability namely test-retest method, split-half method and equivalent-form
method. Cronbach’s alpha will be used in this research study to determine the
inter-item reliability.
4.6.1.4. Validity
Validity lets the researcher know whether a measure actually captures the
meaning of the construct it claims to measure (Zikmund, 2003). There are
several types of validity namely face validity, criterion validity, concurrent
validity, predictive validity, discriminant validity and construct validity.
Face validity was ensured by the researcher. This was done by reading the
relevant literature and extracting the dimensions applicable to the research
questions.
The researcher ensured construct validity by formulating suitable items that
appropriately measured the constructs being studied and which directly related
to the objectives of the research study.
©© UUnniivveerrssiittyy ooff PPrreettoorriiaa
42
4.7. ANALYSIS OF DATA
After the data was collected, the researcher had a considerable volume of
information. The key aim was to analyse this information to test the research
hypothesis (Sekaran, 2003). The data was captured using MS Excel. The
descriptive and inferential statistical analysis of data was analysed utilising the
statistical software SPSS Statistics 17.0. The dependent variable in this
research study was knowledge sharing. The independent variables were
individualism/collectivism, power distance, uncertainly avoidance and
masculinity/feminity.
4.7.1. Descriptive Statistics
The aim of descriptive statistics is to “provide summary measures of data
contained in all elements of a sample” Zikmund (2003, p. 402). Frequency
distribution was adopted for this study.
4.7.1.1. Frequency Distributions
Frequency distributions are the easiest way to describe the numerical data of
one variable (Zikmund, 2003). The number of times various sub categories’ of a
certain phenomenon occur, from which the percentage and cumulative
percentage of the occurrence of the sub categories can be easily calculated are
referred to as frequencies (Cooper & Schindler, 2001).
©© UUnniivveerrssiittyy ooff PPrreettoorriiaa
43
4.7.1.2. Measures of Central Tendency
Researchers find it necessary to summarise the information about one variable
into a single number. There are three measures of central tendency: the mean,
the median and the mode (Zikmund, 2003).
The mean of a collection of observations is the sum of the observations divided
by the number of observations (also known as the average). It is the location
measure most frequently used for interval-ration data, but can be misleading
when the distribution contains extreme high scores, large or small (Cooper &
Schindler, 2001).
4.7.2. Ranking
Ranking is a measurment task that needs that the respondents rank order a
“small number of items on the basis of overall preference of some charateristic
of the stimulus” Zikmund (2003, p. 309). There are several types of ranking
paired-comparison scale, forced ranking scale and comparative scale (Cooper
& Schindler, 2001). For example for this study knowledge sharing was force
ranked from 1 to 10 to determine whether there was a common agreement on
what knowledge sharing actually entailed.
©© UUnniivveerrssiittyy ooff PPrreettoorriiaa
44
4.7.3. Factor Analysis
Factor analysis is important as it is a statistical technique whose main goal is
data reduction (Sekaran, 2003). A typical use of factor analysis is in survey
research, where a researcher wishes to represent a number of questions with a
small number of hypothetical factors. For example, as part of a national survey
on political opinions, participants may answer three separate questions
regarding environmental policy, reflecting issues at the local, state and national
level. Each question, by itself, would be an inadequate measure of attitude
towards environmental policy, but together they may provide a better measure
of the attitude. Factor analysis can be used to establish whether the three
measures do, in fact, measure the same thing. If so, they can then be combined
to create a new variable, a factor score variable that contains a score for each
respondent on the factor (Cooper & Schindler, 2001). For this study a factor
analysis was performed.
4.7.4. Inferential Statistics
Inferential statistics allow the researcher to use information from the sample to
draw conclusions about the characteristics of the population based on the
corresponding characteristics of the sample (Cooper & Schindler, 2001).
Inferential statistics may be classed as parametric or non parametric.
Parametric statistics is based on the assumption that the population from which
the sample is drawn is normally distributed. Parametric statistics can be used
©© UUnniivveerrssiittyy ooff PPrreettoorriiaa
45
only when data is collected on an interval or ratio scale. Non – parametric
statistics, on the other hand, makes no assumption about the normality of
distribution in the population. This can be used when data is on a nominal of
ordinal scale (Zikmund, 2003).
The types of inferential statistics that will be used in this research will be
described below:
4.7.4.1. Chi-Square
The chi-square is widely used and a powerful tool. It can be applied to both
nominal and ordinal data. This technique involves testing the significant
differences between the observed distribution of data among categories and the
expected distribution based on the null hypothesis (Cooper & Schindler, 2001).
For example in this study chi-square was conducted to assess whether there
existed a significant difference between the four cultural dimensions and
knowledge sharing.
4.8. PRESENTATION OF DATA
There are four basic ways to present data in a research report; they are a text
paragraph, semi-tabular form, tables or graphs (Cooper & Schindler, 2001).
©© UUnniivveerrssiittyy ooff PPrreettoorriiaa
46
4.8.1. Text Presentation
Text presentation is the most commonly used when there is only a few
statistics. In this type of presentation, the writer directs the reader’s attention to
certain comparisons or numbers to highlight a point (Cooper & Schindler, 2001).
4.8.2. Semi-tabular Form
In this type of presentation due to the small of amount of figures, the figures
may be removed from the text and listed in a table (Cooper & Schindler, 2001).
4.8.3. Tables and Graphs
Tables and graphs are pictorial representations of data and may simplify
research data (Zikmund, 2003). The main objective of each table or graph is to
“facilitate the summarisation and communication of the meaning of data”
Zikmund (2003, p.483)
For example in study the data was presented using both tabular and graphical
representations. Bar charts were used for frequency analysis and tables were
used for mean values. The results will be discussed narratively in terms of the
four cultural dimensions and the impact that they have on knowledge sharing.
©© UUnniivveerrssiittyy ooff PPrreettoorriiaa
47
4.9. RESEARCH LIMITATIONS
This research will have the following limitations:
� Only a single organisation within one industry was used, therefore,
the results might not be relevant to other companies or industries.
� As a result of using non probability sampling, the results of this study
will not be generalisable.
� Another limitation will be a predominantly male demographic within
the organisation.
� The common limitations of a research questionnaire apply namely
non response bias and response bias.
� Language barriers could be another limitation where respondents do
not understand the questions as they are presented in English.
4.10. CHAPTER CONCLUSION
The research methodology issues were explained through descriptions of the
research design, research purpose, sample, population, data collection
techniques and statistical techniques used.
In the next chapter (Chapter 5) results presented will obtained from the
statistical techniques, described in this chapter.
©© UUnniivveerrssiittyy ooff PPrreettoorriiaa
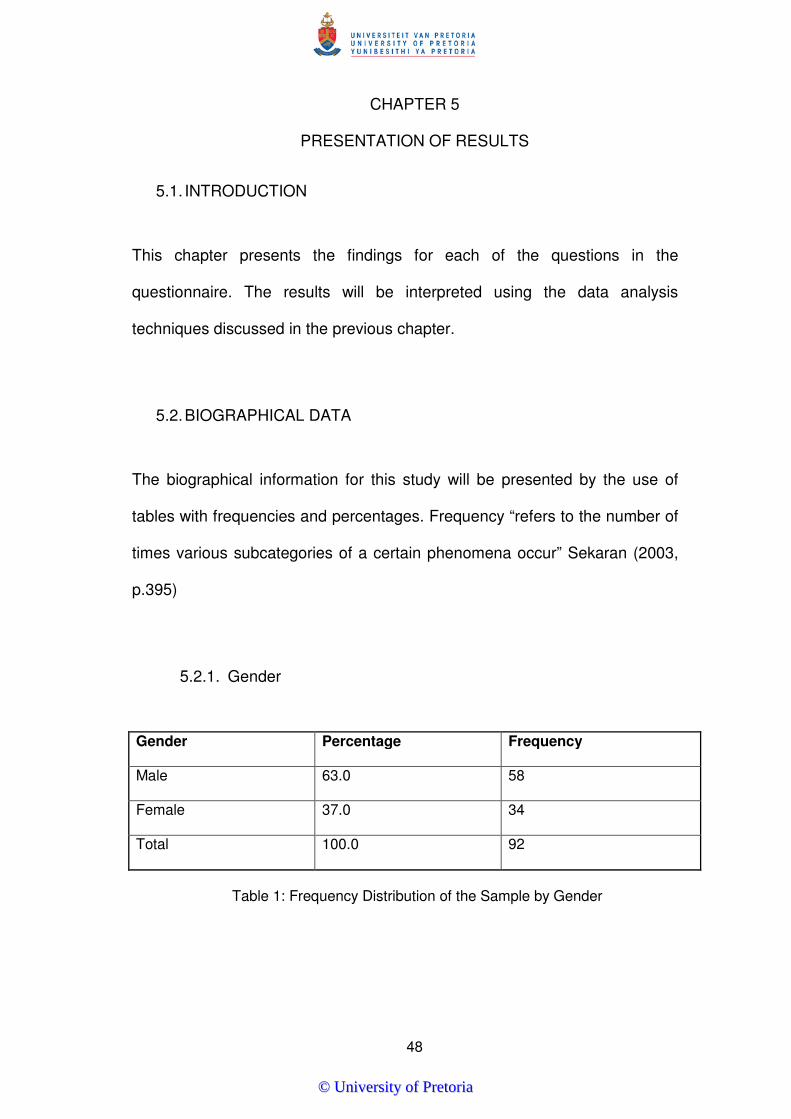
48
CHAPTER 5
PRESENTATION OF RESULTS
5.1. INTRODUCTION
This chapter presents the findings for each of the questions in the
questionnaire. The results will be interpreted using the data analysis
techniques discussed in the previous chapter.
5.2. BIOGRAPHICAL DATA
The biographical information for this study will be presented by the use of
tables with frequencies and percentages. Frequency “refers to the number of
times various subcategories of a certain phenomena occur” Sekaran (2003,
p.395)
5.2.1. Gender
Gender Percentage Frequency
Male 63.0 58
Female 37.0 34
Total 100.0 92
Table 1: Frequency Distribution of the Sample by Gender
©© UUnniivveerrssiittyy ooff PPrreettoorriiaa
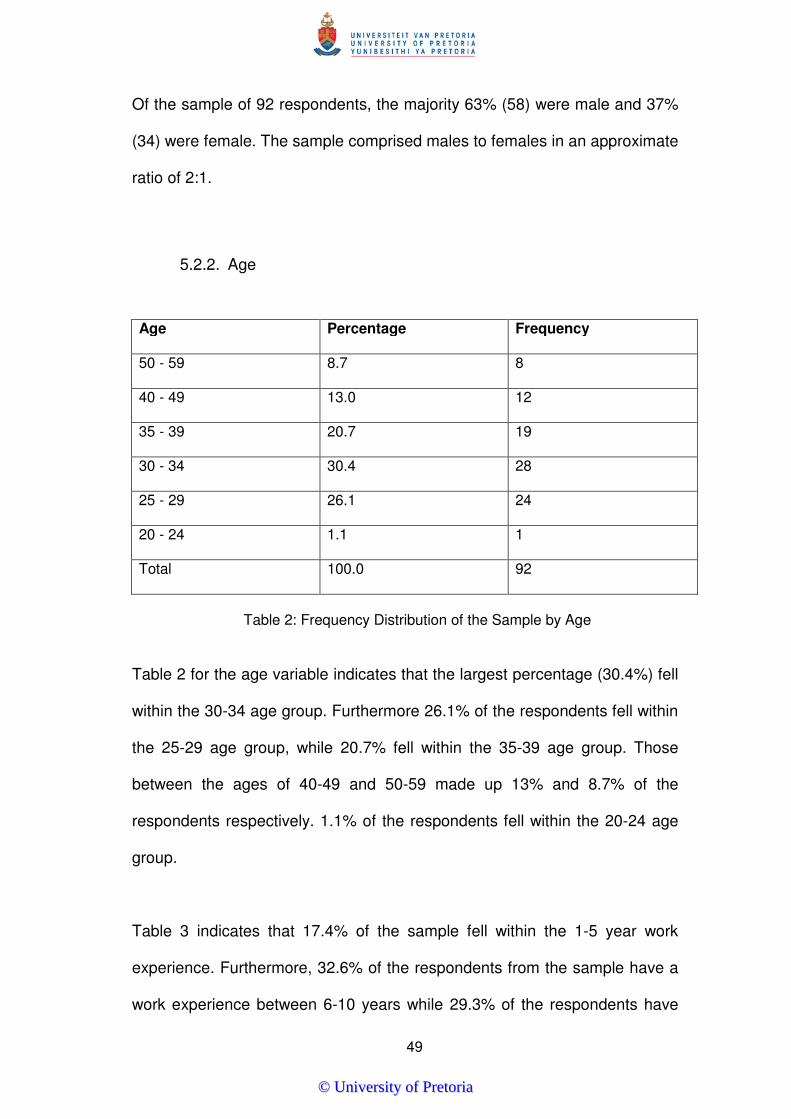
49
Of the sample of 92 respondents, the majority 63% (58) were male and 37%
(34) were female. The sample comprised males to females in an approximate
ratio of 2:1.
5.2.2. Age
Age Percentage Frequency
50 - 59 8.7 8
40 - 49 13.0 12
35 - 39 20.7 19
30 - 34 30.4 28
25 - 29 26.1 24
20 - 24 1.1 1
Total 100.0 92
Table 2: Frequency Distribution of the Sample by Age
Table 2 for the age variable indicates that the largest percentage (30.4%) fell
within the 30-34 age group. Furthermore 26.1% of the respondents fell within
the 25-29 age group, while 20.7% fell within the 35-39 age group. Those
between the ages of 40-49 and 50-59 made up 13% and 8.7% of the
respondents respectively. 1.1% of the respondents fell within the 20-24 age
group.
Table 3 indicates that 17.4% of the sample fell within the 1-5 year work
experience. Furthermore, 32.6% of the respondents from the sample have a
work experience between 6-10 years while 29.3% of the respondents have
©© UUnniivveerrssiittyy ooff PPrreettoorriiaa
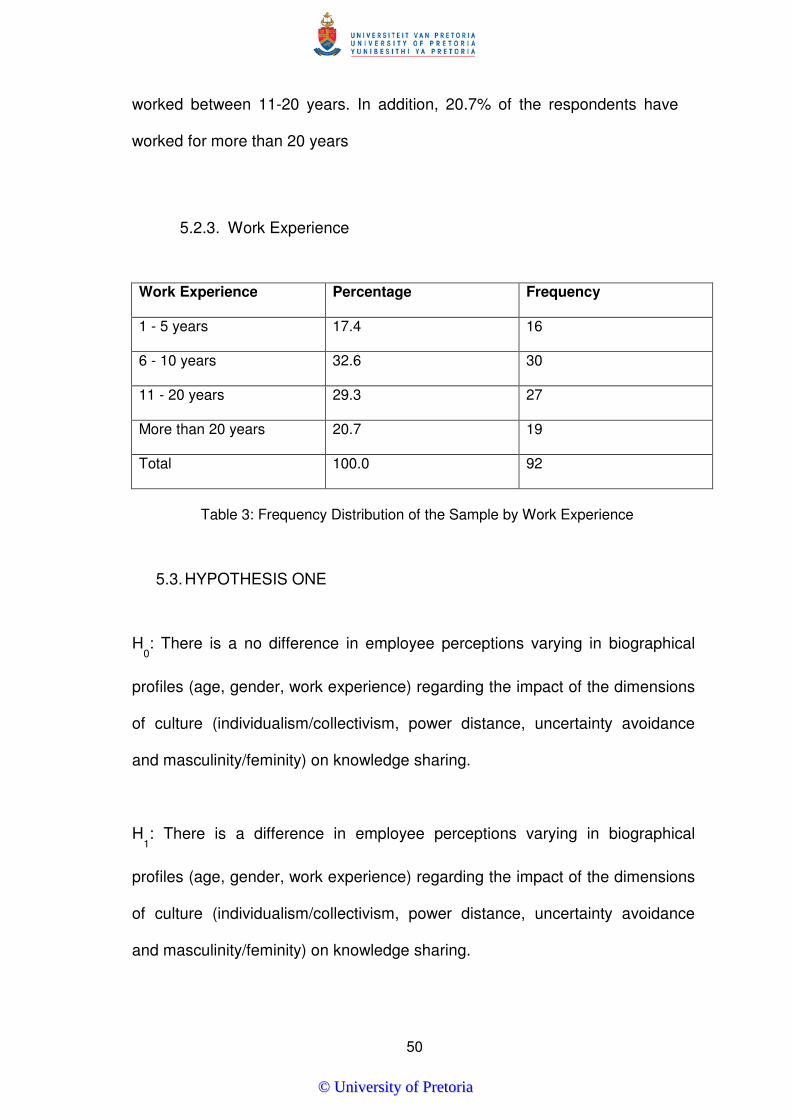
50
worked between 11-20 years. In addition, 20.7% of the respondents have
worked for more than 20 years
5.2.3. Work Experience
Work Experience Percentage Frequency
1 - 5 years 17.4 16
6 - 10 years 32.6 30
11 - 20 years 29.3 27
More than 20 years 20.7 19
Total 100.0 92
Table 3: Frequency Distribution of the Sample by Work Experience
5.3. HYPOTHESIS ONE
H0: There is a no difference in employee perceptions varying in biographical
profiles (age, gender, work experience) regarding the impact of the dimensions
of culture (individualism/collectivism, power distance, uncertainty avoidance
and masculinity/feminity) on knowledge sharing.
H1: There is a difference in employee perceptions varying in biographical
profiles (age, gender, work experience) regarding the impact of the dimensions
of culture (individualism/collectivism, power distance, uncertainty avoidance
and masculinity/feminity) on knowledge sharing.
©© UUnniivveerrssiittyy ooff PPrreettoorriiaa
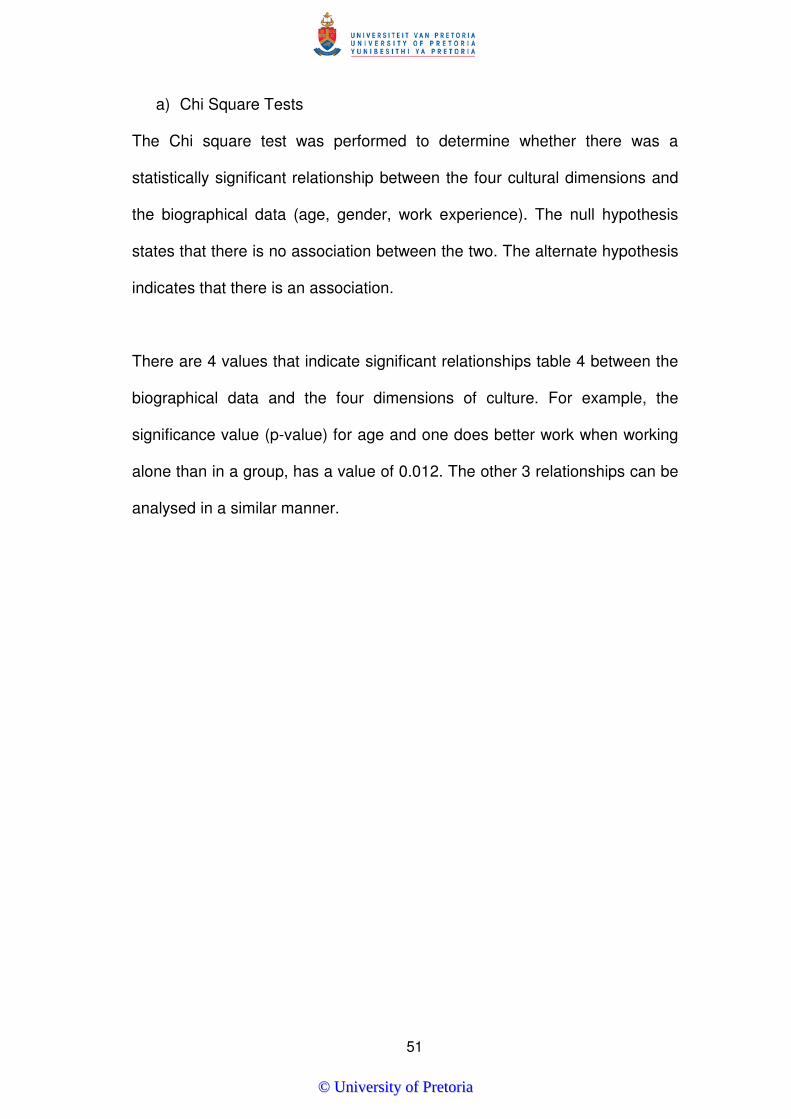
51
a) Chi Square Tests
The Chi square test was performed to determine whether there was a
statistically significant relationship between the four cultural dimensions and
the biographical data (age, gender, work experience). The null hypothesis
states that there is no association between the two. The alternate hypothesis
indicates that there is an association.
There are 4 values that indicate significant relationships table 4 between the
biographical data and the four dimensions of culture. For example, the
significance value (p-value) for age and one does better work when working
alone than in a group, has a value of 0.012. The other 3 relationships can be
analysed in a similar manner.
©© UUnniivveerrssiittyy ooff PPrreettoorriiaa
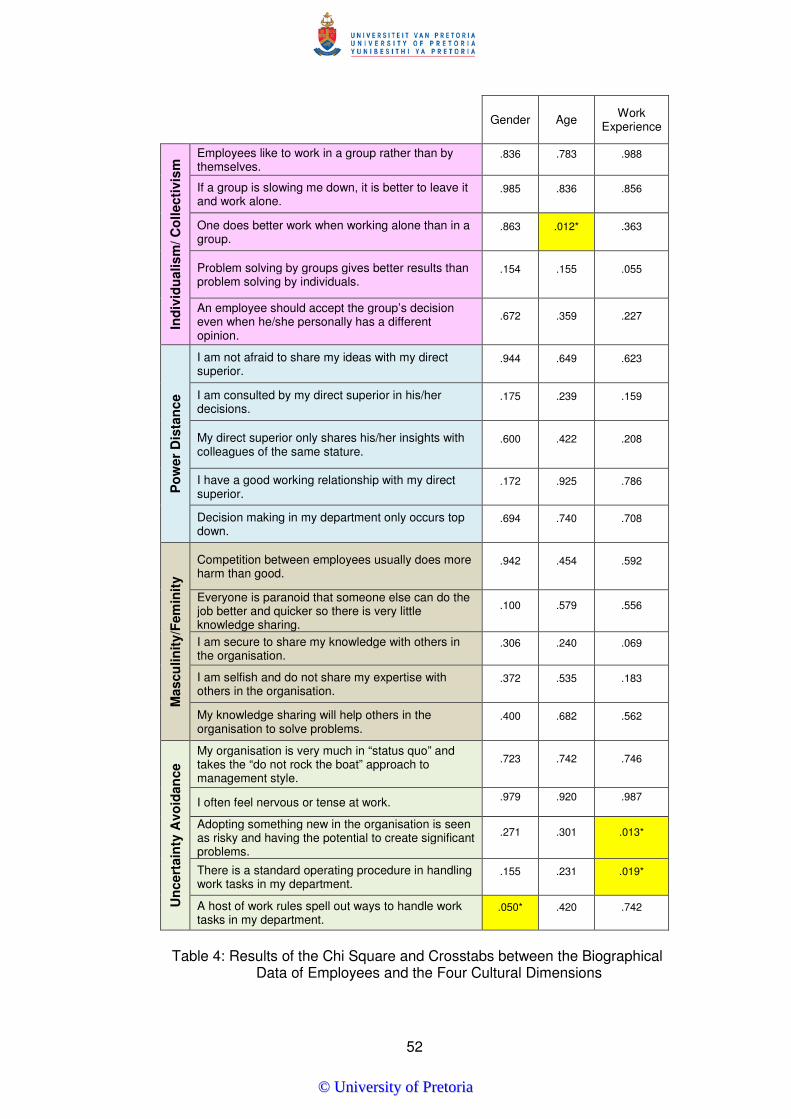
52
Gender Age Work
Experience
Ind
ivid
ualis
m/ C
oll
ecti
vis
m Employees like to work in a group rather than by
themselves. .836 .783 .988
If a group is slowing me down, it is better to leave it and work alone.
.985 .836 .856
One does better work when working alone than in a group.
.863 .012* .363
Problem solving by groups gives better results than problem solving by individuals.
.154 .155 .055
An employee should accept the group’s decision even when he/she personally has a different opinion.
.672 .359 .227
Po
wer
Dis
tan
ce
I am not afraid to share my ideas with my direct superior.
.944 .649 .623
I am consulted by my direct superior in his/her decisions.
.175 .239 .159
My direct superior only shares his/her insights with colleagues of the same stature.
.600 .422 .208
I have a good working relationship with my direct superior.
.172 .925 .786
Decision making in my department only occurs top down.
.694 .740 .708
Mascu
lin
ity/F
em
init
y
Competition between employees usually does more harm than good.
.942 .454 .592
Everyone is paranoid that someone else can do the job better and quicker so there is very little knowledge sharing.
.100 .579 .556
I am secure to share my knowledge with others in the organisation.
.306 .240 .069
I am selfish and do not share my expertise with others in the organisation.
.372 .535 .183
My knowledge sharing will help others in the organisation to solve problems.
.400 .682 .562
Un
cert
ain
ty A
vo
idan
ce
My organisation is very much in “status quo” and takes the “do not rock the boat” approach to management style.
.723 .742 .746
I often feel nervous or tense at work. .979 .920 .987 Adopting something new in the organisation is seen as risky and having the potential to create significant problems.
.271 .301 .013*
There is a standard operating procedure in handling work tasks in my department.
.155 .231 .019*
A host of work rules spell out ways to handle work tasks in my department.
.050* .420 .742
Table 4: Results of the Chi Square and Crosstabs between the Biographical
Data of Employees and the Four Cultural Dimensions
©© UUnniivveerrssiittyy ooff PPrreettoorriiaa
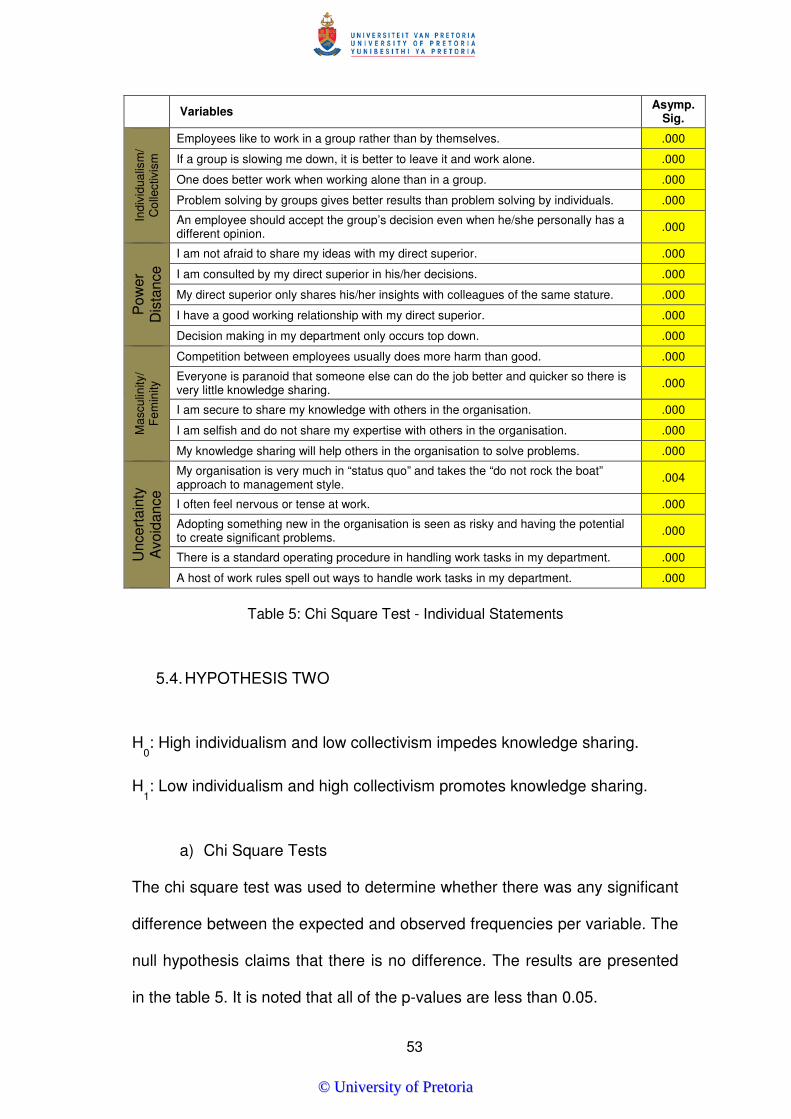
53
Variables
Asymp. Sig.
Indi
vidu
alis
m/
Col
lect
ivis
m
Employees like to work in a group rather than by themselves. .000
If a group is slowing me down, it is better to leave it and work alone. .000
One does better work when working alone than in a group. .000
Problem solving by groups gives better results than problem solving by individuals. .000
An employee should accept the group’s decision even when he/she personally has a different opinion.
.000
Pow
er
Dis
tanc
e
I am not afraid to share my ideas with my direct superior. .000
I am consulted by my direct superior in his/her decisions. .000
My direct superior only shares his/her insights with colleagues of the same stature. .000
I have a good working relationship with my direct superior. .000
Decision making in my department only occurs top down. .000
Mas
culin
ity/
F
emin
ity
Competition between employees usually does more harm than good. .000
Everyone is paranoid that someone else can do the job better and quicker so there is very little knowledge sharing.
.000
I am secure to share my knowledge with others in the organisation. .000
I am selfish and do not share my expertise with others in the organisation. .000
My knowledge sharing will help others in the organisation to solve problems. .000
Unc
erta
inty
A
void
ance
My organisation is very much in “status quo” and takes the “do not rock the boat” approach to management style.
.004
I often feel nervous or tense at work. .000
Adopting something new in the organisation is seen as risky and having the potential to create significant problems.
.000
There is a standard operating procedure in handling work tasks in my department. .000
A host of work rules spell out ways to handle work tasks in my department. .000
Table 5: Chi Square Test - Individual Statements
5.4. HYPOTHESIS TWO
H0: High individualism and low collectivism impedes knowledge sharing.
H1: Low individualism and high collectivism promotes knowledge sharing.
a) Chi Square Tests
The chi square test was used to determine whether there was any significant
difference between the expected and observed frequencies per variable. The
null hypothesis claims that there is no difference. The results are presented
in the table 5. It is noted that all of the p-values are less than 0.05.
©© UUnniivveerrssiittyy ooff PPrreettoorriiaa
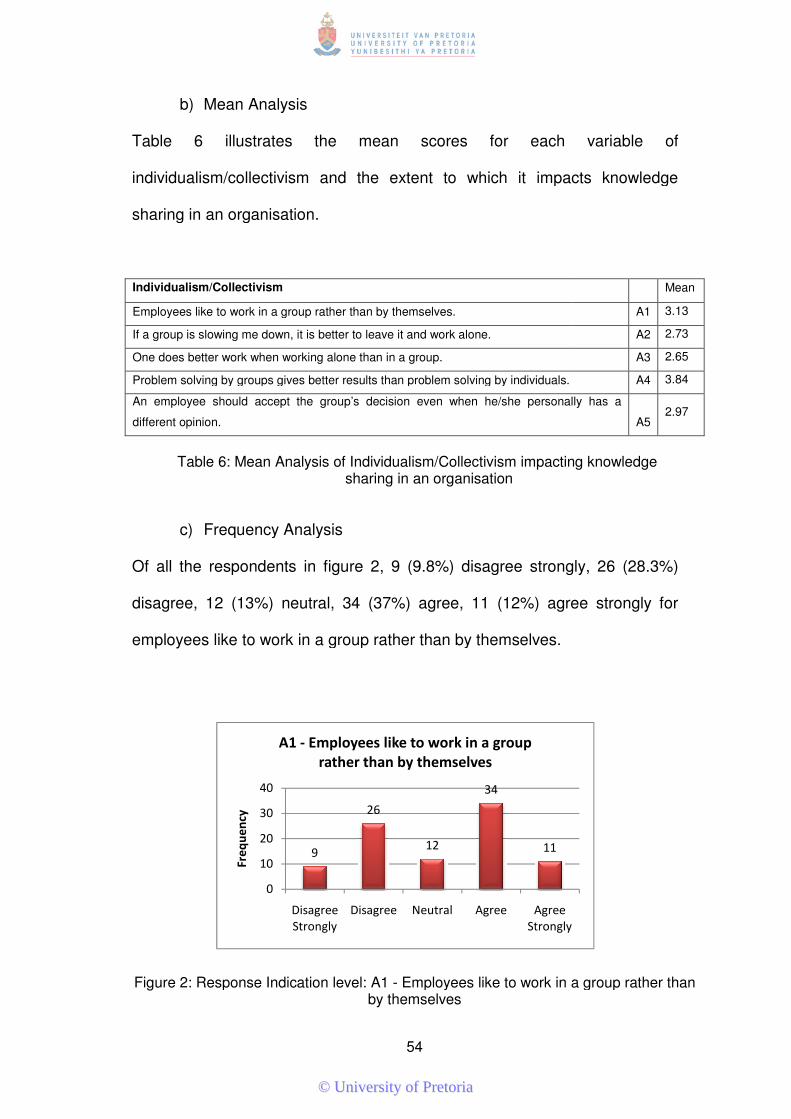
b) Mean Analysis
Table 6 illustrates the mean scores for each variable of
individualism/collectivism and the extent to which it impacts knowledge
sharing in an organisation.
Individualism/Collectivism
Employees like to work in a group rather than by themselves.
If a group is slowing me down, it is better to leave it and work alone.
One does better work when working alone than in a group.
Problem solving by groups gives better results than problem solving by individuals.
An employee should accept the group’s decision even when he/she personally has a
different opinion.
Table 6: Mean Analysis of
c) Frequency Analysis
Of all the respondents
disagree, 12 (13%) neutral, 34 (37%) agree, 11 (12%) agree strongly for
employees like to work in a group rather than by themselves.
Figure 2: Response Indication level: A1
0
10
20
30
40
Fre
qu
en
cy
A1
54
lysis
illustrates the mean scores for each variable of
individualism/collectivism and the extent to which it impacts knowledge
sharing in an organisation.
Employees like to work in a group rather than by themselves.
If a group is slowing me down, it is better to leave it and work alone.
One does better work when working alone than in a group.
Problem solving by groups gives better results than problem solving by individuals.
An employee should accept the group’s decision even when he/she personally has a
: Mean Analysis of Individualism/Collectivism impacting knowledge
sharing in an organisation
Frequency Analysis
Of all the respondents in figure 2, 9 (9.8%) disagree strongly, 26 (28.3%)
disagree, 12 (13%) neutral, 34 (37%) agree, 11 (12%) agree strongly for
to work in a group rather than by themselves.
: Response Indication level: A1 - Employees like to work in a group rather than by themselves
9
26
12
34
11
Disagree
Strongly
Disagree Neutral Agree Agree
Strongly
A1 - Employees like to work in a group
rather than by themselves
illustrates the mean scores for each variable of
individualism/collectivism and the extent to which it impacts knowledge
Mean
Employees like to work in a group rather than by themselves. A1 3.13
A2 2.73
A3 2.65
A4 3.84
An employee should accept the group’s decision even when he/she personally has a
A5 2.97
Individualism/Collectivism impacting knowledge
, 9 (9.8%) disagree strongly, 26 (28.3%)
disagree, 12 (13%) neutral, 34 (37%) agree, 11 (12%) agree strongly for
Employees like to work in a group rather than
©© UUnniivveerrssiittyy ooff PPrreettoorriiaa
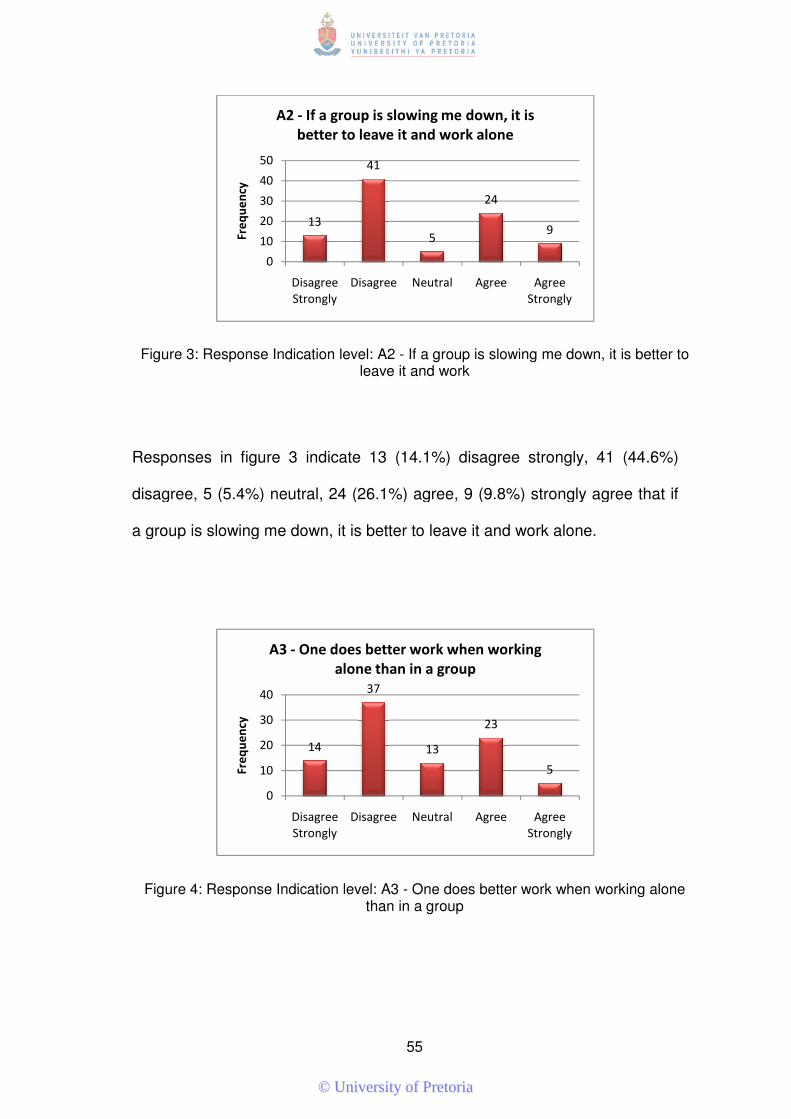
Figure 3: Response Indication level: A2
Responses in figure 3
disagree, 5 (5.4%) neutral, 24 (26.1%) agree, 9 (9.8%) strongly agree that if
a group is slowing me down, it is better to leave it and work alone.
Figure 4: Response Indication
0
10
20
30
40
50
Fre
qu
en
cy
A2
0
10
20
30
40
Fre
qu
en
cy
A3
55
: Response Indication level: A2 - If a group is slowing me down, it is better to leave it and work
in figure 3 indicate 13 (14.1%) disagree strongly, 41 (44.6%)
disagree, 5 (5.4%) neutral, 24 (26.1%) agree, 9 (9.8%) strongly agree that if
a group is slowing me down, it is better to leave it and work alone.
: Response Indication level: A3 - One does better work when working alone than in a group
13
41
5
24
9
Disagree
Strongly
Disagree Neutral Agree Agree
Strongly
A2 - If a group is slowing me down, it is
better to leave it and work alone
14
37
13
23
5
Disagree
Strongly
Disagree Neutral Agree Agree
Strongly
A3 - One does better work when working
alone than in a group
is slowing me down, it is better to
indicate 13 (14.1%) disagree strongly, 41 (44.6%)
disagree, 5 (5.4%) neutral, 24 (26.1%) agree, 9 (9.8%) strongly agree that if
a group is slowing me down, it is better to leave it and work alone.
One does better work when working alone
©© UUnniivveerrssiittyy ooff PPrreettoorriiaa
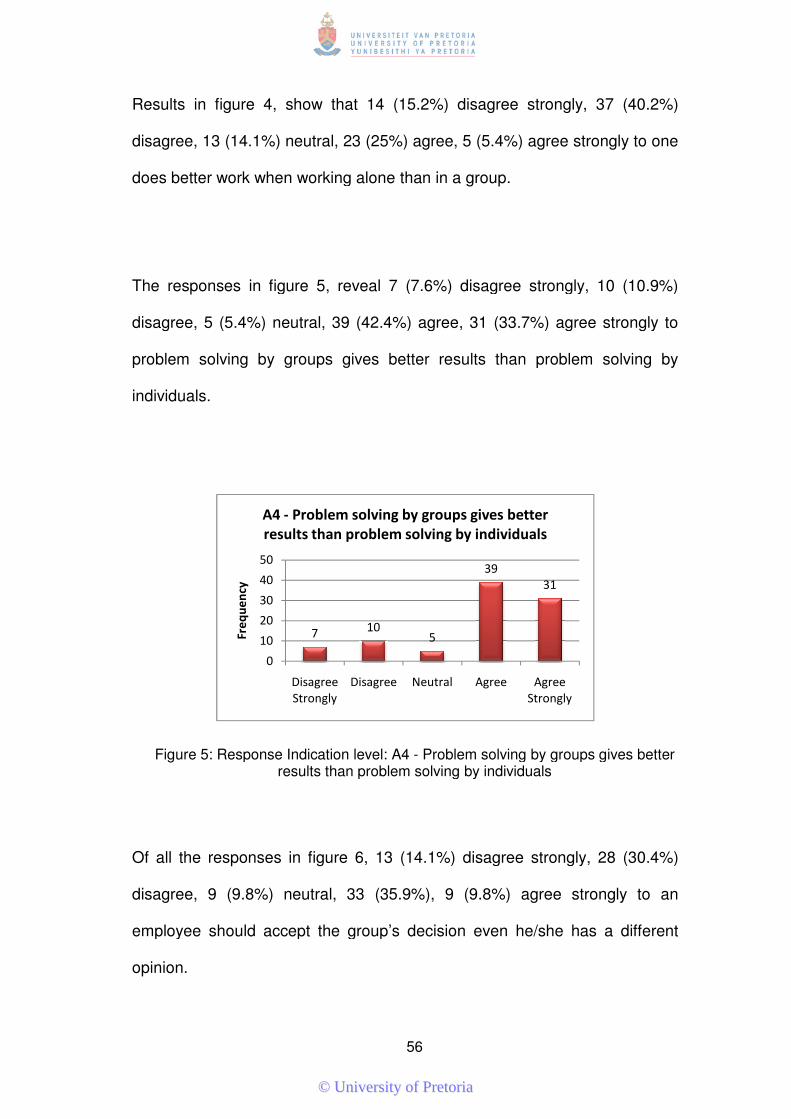
Results in figure 4, show that 14 (15.2%) disagree strongly, 37 (40.2%)
disagree, 13 (14.1%) neutral, 23 (25%) agree, 5 (5.4%) agree strongly to one
does better work when working alone
The responses in figure 5
disagree, 5 (5.4%) neutral, 39 (42.4%) agree, 31 (33.7%) agree strongly to
problem solving by groups gives better results than problem solving by
individuals.
Figure 5: Response Indication level: A4 results than problem solving by individuals
Of all the responses
disagree, 9 (9.8%) neutral, 33
employee should accept the group’s decision even he/she has a different
opinion.
0
10
20
30
40
50
Fre
qu
en
cy
A4 -
results than problem solving by individuals
56
, show that 14 (15.2%) disagree strongly, 37 (40.2%)
disagree, 13 (14.1%) neutral, 23 (25%) agree, 5 (5.4%) agree strongly to one
does better work when working alone than in a group.
in figure 5, reveal 7 (7.6%) disagree strongly, 10 (10.9%)
disagree, 5 (5.4%) neutral, 39 (42.4%) agree, 31 (33.7%) agree strongly to
problem solving by groups gives better results than problem solving by
: Response Indication level: A4 - Problem solving by groups gives better results than problem solving by individuals
in figure 6, 13 (14.1%) disagree strongly, 28 (30.4%)
disagree, 9 (9.8%) neutral, 33 (35.9%), 9 (9.8%) agree strongly to an
employee should accept the group’s decision even he/she has a different
710
5
39
31
Disagree
Strongly
Disagree Neutral Agree Agree
Strongly
- Problem solving by groups gives better
results than problem solving by individuals
, show that 14 (15.2%) disagree strongly, 37 (40.2%)
disagree, 13 (14.1%) neutral, 23 (25%) agree, 5 (5.4%) agree strongly to one
, reveal 7 (7.6%) disagree strongly, 10 (10.9%)
disagree, 5 (5.4%) neutral, 39 (42.4%) agree, 31 (33.7%) agree strongly to
problem solving by groups gives better results than problem solving by
Problem solving by groups gives better
, 13 (14.1%) disagree strongly, 28 (30.4%)
(35.9%), 9 (9.8%) agree strongly to an
employee should accept the group’s decision even he/she has a different
©© UUnniivveerrssiittyy ooff PPrreettoorriiaa
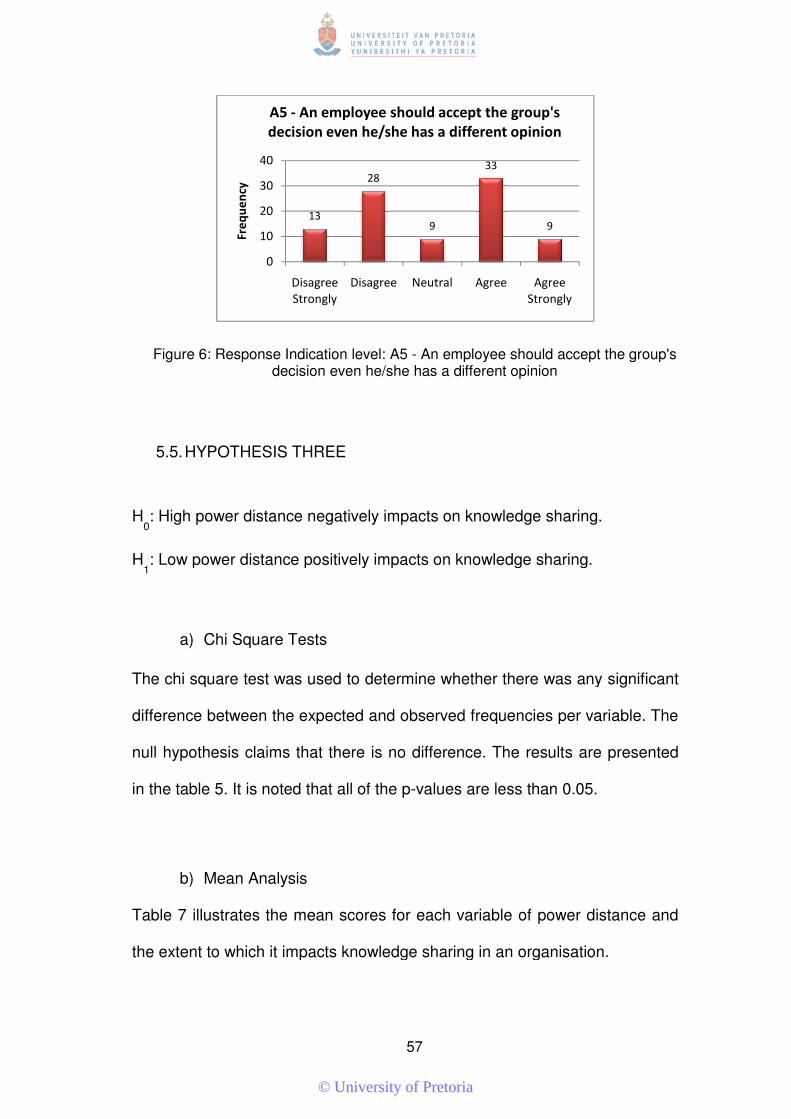
Figure 6: Response Indication level: A5 decision even he/she has a di
5.5. HYPOTHESIS THREE
H0: High power distance negatively impacts on knowledge sharing.
H1: Low power distance positively impacts on knowledge sharing.
a) Chi Square Tests
The chi square test was used to determine whether there was any
difference between the expected and observed frequencies per variable. The
null hypothesis claims that there is no difference. The result
in the table 5. It is noted that all of the
b) Mean Analysis
Table 7 illustrates the mean scores for each variable of power distance and
the extent to which it impacts knowledge sharing in an organisation.
0
10
20
30
40
Fre
qu
en
cy
A5
decision even he/she has a different opinion
57
: Response Indication level: A5 - An employee should accept the group's decision even he/she has a different opinion
HYPOTHESIS THREE
: High power distance negatively impacts on knowledge sharing.
: Low power distance positively impacts on knowledge sharing.
Chi Square Tests
The chi square test was used to determine whether there was any
difference between the expected and observed frequencies per variable. The
null hypothesis claims that there is no difference. The results are presented
. It is noted that all of the p-values are less than 0.05.
Mean Analysis
illustrates the mean scores for each variable of power distance and
the extent to which it impacts knowledge sharing in an organisation.
13
28
9
33
9
Disagree
Strongly
Disagree Neutral Agree Agree
Strongly
A5 - An employee should accept the group's
decision even he/she has a different opinion
An employee should accept the group's
: High power distance negatively impacts on knowledge sharing.
: Low power distance positively impacts on knowledge sharing.
The chi square test was used to determine whether there was any significant
difference between the expected and observed frequencies per variable. The
s are presented
values are less than 0.05.
illustrates the mean scores for each variable of power distance and
the extent to which it impacts knowledge sharing in an organisation.
©© UUnniivveerrssiittyy ooff PPrreettoorriiaa
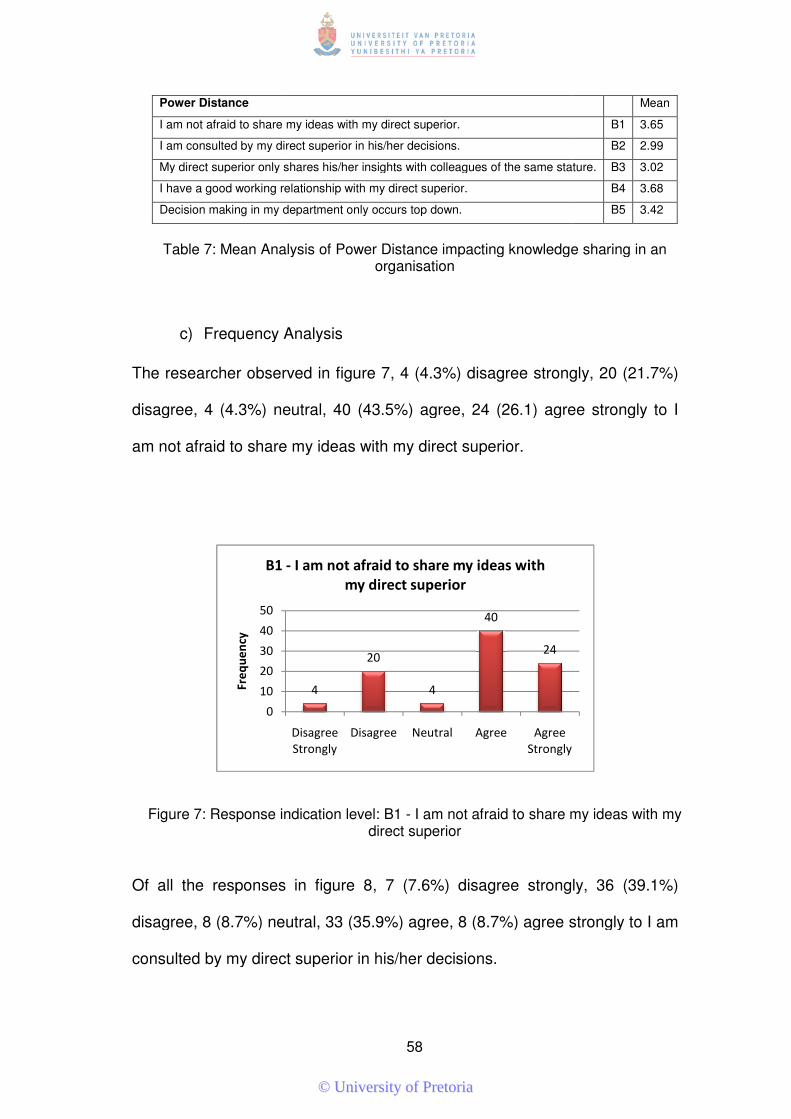
Power Distance
I am not afraid to share my ideas with my direct superior.
I am consulted by my direct superior in his/her decisions.
My direct superior only shares his/her insights with colleagues of the same stature.
I have a good working relationship with my direct superior.
Decision making in my department only occurs top down.
Table 7: Mean Analysis of Power Distance impacting knowledge sharing in an
c) Frequency Analysis
The researcher observed in figure 7
disagree, 4 (4.3%) neutral, 40 (43.5%) agree, 24 (26.1) agree strongly to I
am not afraid to share my ideas with my direct superior.
Figure 7: Response indication level: B1
Of all the responses in figure 8
disagree, 8 (8.7%) neutral, 33 (35.9%) agree, 8 (8.7%) agree strongly to I am
consulted by my direct superior in his/her decisions.
0
10
20
30
40
50
Fre
qu
en
cy
B1 -
58
I am not afraid to share my ideas with my direct superior.
I am consulted by my direct superior in his/her decisions.
My direct superior only shares his/her insights with colleagues of the same stature.
I have a good working relationship with my direct superior.
my department only occurs top down.
: Mean Analysis of Power Distance impacting knowledge sharing in an
organisation
Frequency Analysis
esearcher observed in figure 7, 4 (4.3%) disagree strongly, 20 (21.7%)
disagree, 4 (4.3%) neutral, 40 (43.5%) agree, 24 (26.1) agree strongly to I
am not afraid to share my ideas with my direct superior.
: Response indication level: B1 - I am not afraid to share my ideas with my direct superior
all the responses in figure 8, 7 (7.6%) disagree strongly, 36 (39.1%)
disagree, 8 (8.7%) neutral, 33 (35.9%) agree, 8 (8.7%) agree strongly to I am
consulted by my direct superior in his/her decisions.
4
20
4
40
24
Disagree
Strongly
Disagree Neutral Agree Agree
Strongly
- I am not afraid to share my ideas with
my direct superior
Mean
B1 3.65
B2 2.99
My direct superior only shares his/her insights with colleagues of the same stature. B3 3.02
B4 3.68
B5 3.42
: Mean Analysis of Power Distance impacting knowledge sharing in an
, 4 (4.3%) disagree strongly, 20 (21.7%)
disagree, 4 (4.3%) neutral, 40 (43.5%) agree, 24 (26.1) agree strongly to I
I am not afraid to share my ideas with my
, 7 (7.6%) disagree strongly, 36 (39.1%)
disagree, 8 (8.7%) neutral, 33 (35.9%) agree, 8 (8.7%) agree strongly to I am
©© UUnniivveerrssiittyy ooff PPrreettoorriiaa
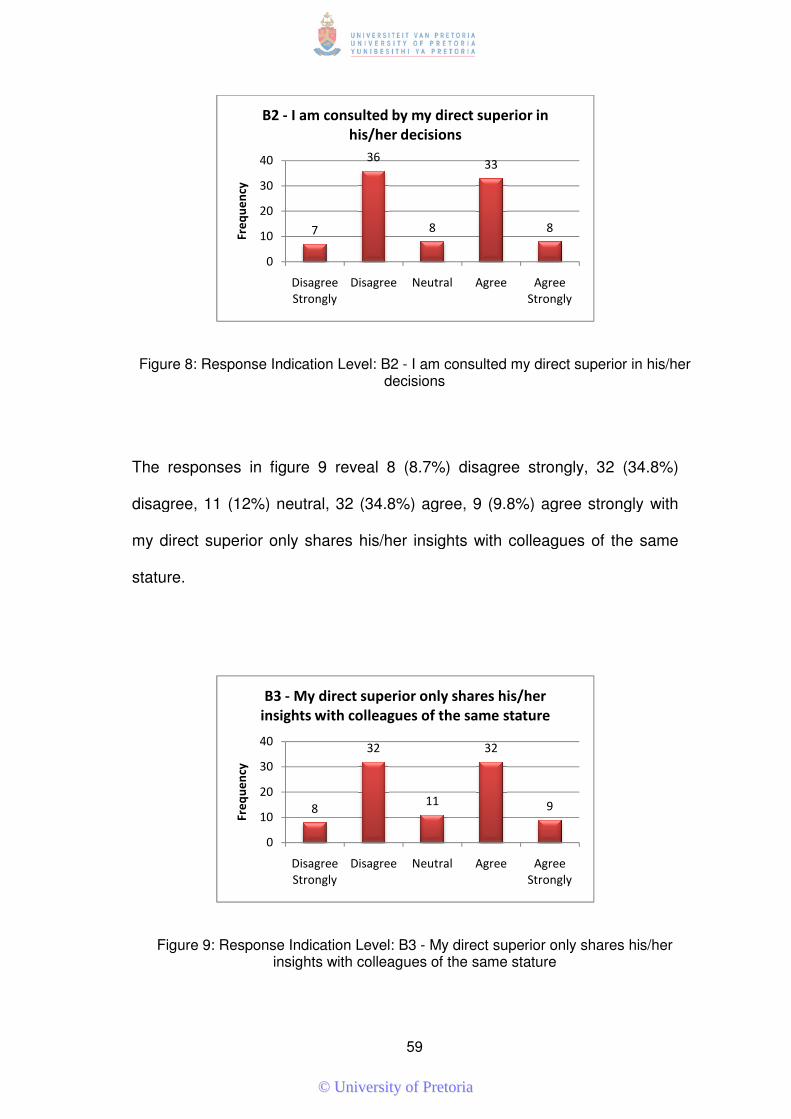
Figure 8: Response Indication Level: B2
The responses in figure 9
disagree, 11 (12%) neutral, 32 (34.8%) agree, 9 (9.8%) agree strongly
my direct superior on
stature.
Figure 9: Response Indication Level: B3 insights with colleagues of the same stature
0
10
20
30
40
Fre
qu
en
cy
B2 -
0
10
20
30
40
Fre
qu
en
cy
B3 -
insights with colleagues of the same stature
59
Response Indication Level: B2 - I am consulted my direct superior in his/her decisions
The responses in figure 9 reveal 8 (8.7%) disagree strongly, 32 (34.8%)
disagree, 11 (12%) neutral, 32 (34.8%) agree, 9 (9.8%) agree strongly
my direct superior only shares his/her insights with colleagues of the same
: Response Indication Level: B3 - My direct superior only shares his/her insights with colleagues of the same stature
7
36
8
33
8
Disagree
Strongly
Disagree Neutral Agree Agree
Strongly
- I am consulted by my direct superior in
his/her decisions
8
32
11
32
9
Disagree
Strongly
Disagree Neutral Agree Agree
Strongly
- My direct superior only shares his/her
insights with colleagues of the same stature
I am consulted my direct superior in his/her
reveal 8 (8.7%) disagree strongly, 32 (34.8%)
disagree, 11 (12%) neutral, 32 (34.8%) agree, 9 (9.8%) agree strongly with
ly shares his/her insights with colleagues of the same
My direct superior only shares his/her
©© UUnniivveerrssiittyy ooff PPrreettoorriiaa
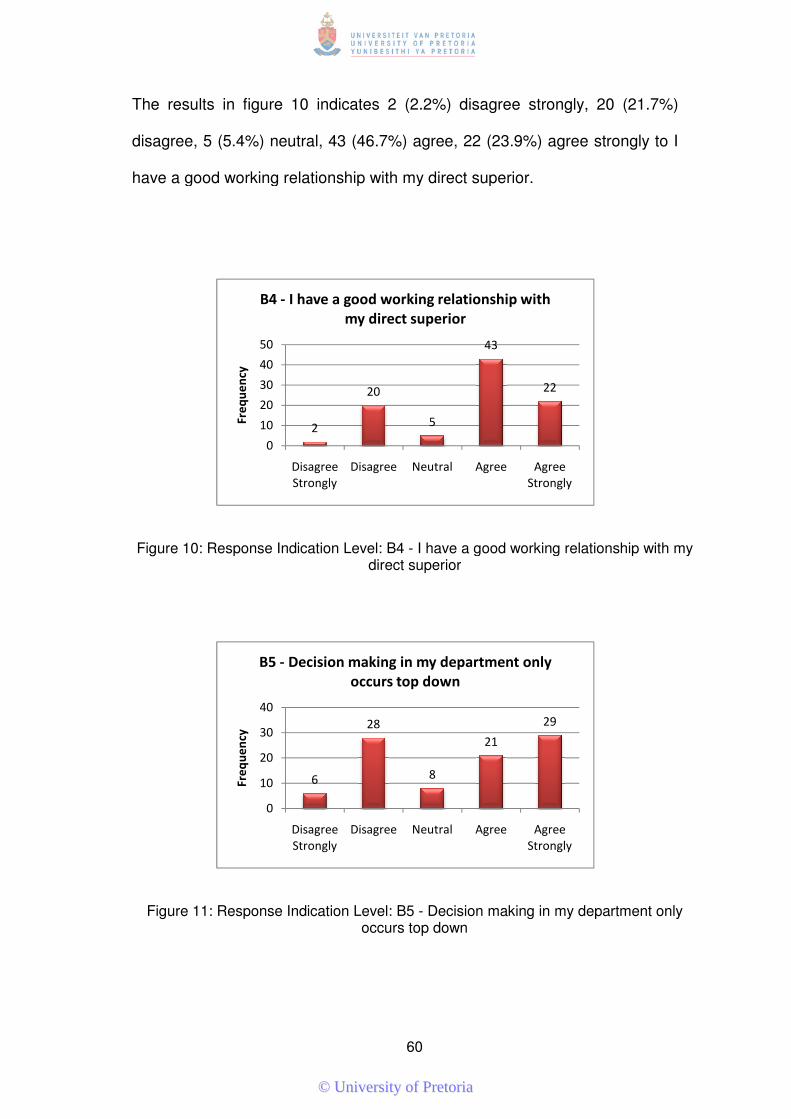
The results in figure 10
disagree, 5 (5.4%) neutral, 43 (46.7%) agree, 22 (23.9%) agree strongly to I
have a good working relationship with my direct superior.
Figure 10: Response Indication Level: B4
Figure 11: Response Indication Level: B5
0
10
20
30
40
50
Fre
qu
en
cy
B4 -
0
10
20
30
40
Fre
qu
en
cy
B5 -
60
re 10 indicates 2 (2.2%) disagree strongly, 20 (21.7%)
disagree, 5 (5.4%) neutral, 43 (46.7%) agree, 22 (23.9%) agree strongly to I
have a good working relationship with my direct superior.
: Response Indication Level: B4 - I have a good working relationship with my direct superior
: Response Indication Level: B5 - Decision making in my department only occurs top down
2
20
5
43
22
Disagree
Strongly
Disagree Neutral Agree Agree
Strongly
I have a good working relationship with
my direct superior
6
28
8
21
29
Disagree
Strongly
Disagree Neutral Agree Agree
Strongly
Decision making in my department only
occurs top down
2 (2.2%) disagree strongly, 20 (21.7%)
disagree, 5 (5.4%) neutral, 43 (46.7%) agree, 22 (23.9%) agree strongly to I
good working relationship with my
Decision making in my department only
©© UUnniivveerrssiittyy ooff PPrreettoorriiaa
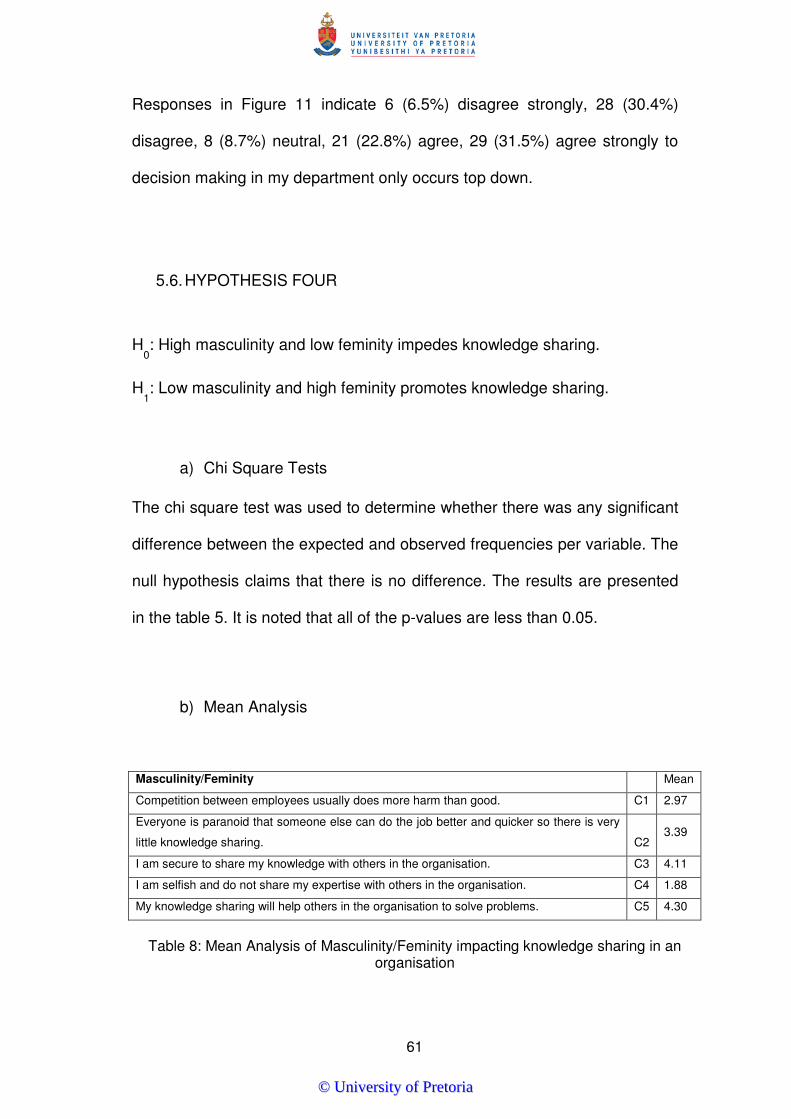
61
Responses in Figure 11 indicate 6 (6.5%) disagree strongly, 28 (30.4%)
disagree, 8 (8.7%) neutral, 21 (22.8%) agree, 29 (31.5%) agree strongly to
decision making in my department only occurs top down.
5.6. HYPOTHESIS FOUR
H0: High masculinity and low feminity impedes knowledge sharing.
H1: Low masculinity and high feminity promotes knowledge sharing.
a) Chi Square Tests
The chi square test was used to determine whether there was any significant
difference between the expected and observed frequencies per variable. The
null hypothesis claims that there is no difference. The results are presented
in the table 5. It is noted that all of the p-values are less than 0.05.
b) Mean Analysis
Masculinity/Feminity
Mean
Competition between employees usually does more harm than good. C1 2.97
Everyone is paranoid that someone else can do the job better and quicker so there is very
little knowledge sharing. C2 3.39
I am secure to share my knowledge with others in the organisation. C3 4.11
I am selfish and do not share my expertise with others in the organisation. C4 1.88
My knowledge sharing will help others in the organisation to solve problems. C5 4.30
Table 8: Mean Analysis of Masculinity/Feminity impacting knowledge sharing in an
organisation
©© UUnniivveerrssiittyy ooff PPrreettoorriiaa
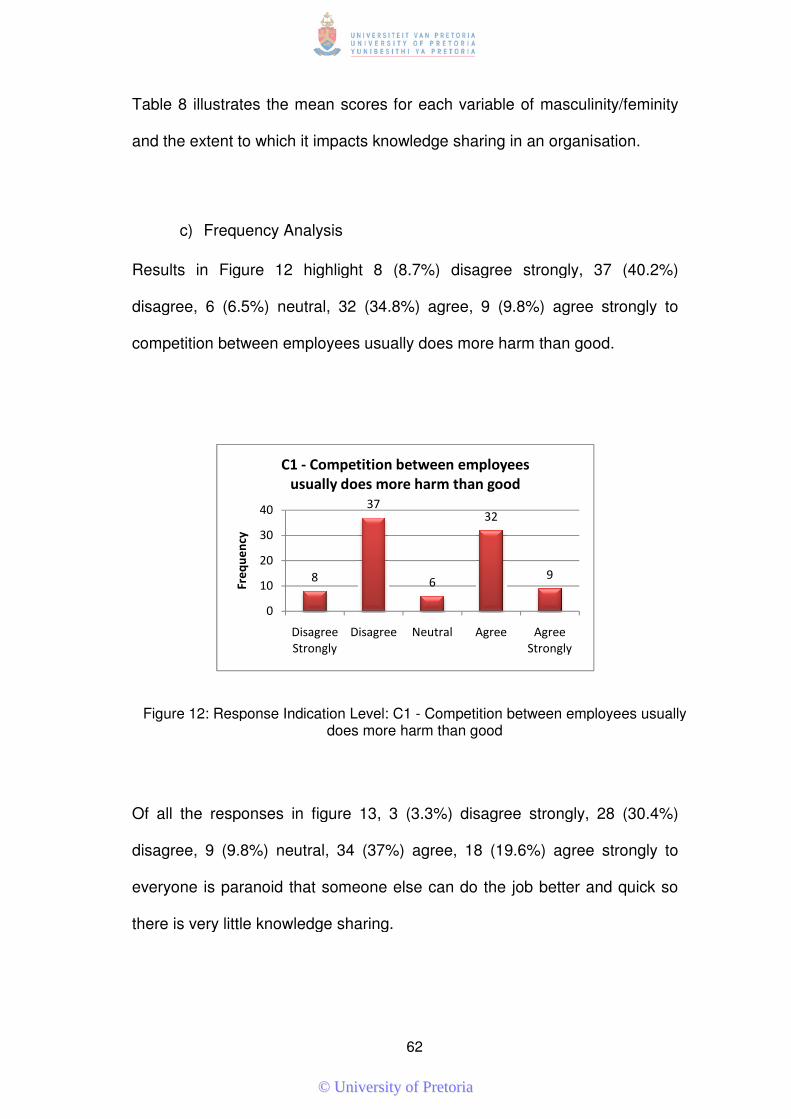
Table 8 illustrates the mean scores for each variable of masculinity/feminity
and the extent to which it impacts knowledge sharing in an organi
c) Frequency Analysis
Results in Figure 12
disagree, 6 (6.5%) neutral, 32 (34.8%) agree, 9 (9.8%) agree strongly to
competition between employees usually does more harm than good.
Figure 12: Response Indication Level: C1
Of all the responses in figure 13
disagree, 9 (9.8%) neutral, 34 (37%) agree, 18 (19.6%) ag
everyone is paranoid that someone else can do the job better and quick so
there is very little knowledge sharing.
0
10
20
30
40
Fre
qu
en
cy
C1
62
illustrates the mean scores for each variable of masculinity/feminity
and the extent to which it impacts knowledge sharing in an organi
Frequency Analysis
Results in Figure 12 highlight 8 (8.7%) disagree strongly, 37 (40.2%)
disagree, 6 (6.5%) neutral, 32 (34.8%) agree, 9 (9.8%) agree strongly to
competition between employees usually does more harm than good.
: Response Indication Level: C1 - Competition between employees usually does more harm than good
all the responses in figure 13, 3 (3.3%) disagree strongly, 28 (30.4%)
disagree, 9 (9.8%) neutral, 34 (37%) agree, 18 (19.6%) agree strongly to
everyone is paranoid that someone else can do the job better and quick so
there is very little knowledge sharing.
8
37
6
32
9
Disagree
Strongly
Disagree Neutral Agree Agree
Strongly
C1 - Competition between employees
usually does more harm than good
illustrates the mean scores for each variable of masculinity/feminity
and the extent to which it impacts knowledge sharing in an organisation.
highlight 8 (8.7%) disagree strongly, 37 (40.2%)
disagree, 6 (6.5%) neutral, 32 (34.8%) agree, 9 (9.8%) agree strongly to
competition between employees usually does more harm than good.
Competition between employees usually
, 3 (3.3%) disagree strongly, 28 (30.4%)
ree strongly to
everyone is paranoid that someone else can do the job better and quick so
©© UUnniivveerrssiittyy ooff PPrreettoorriiaa
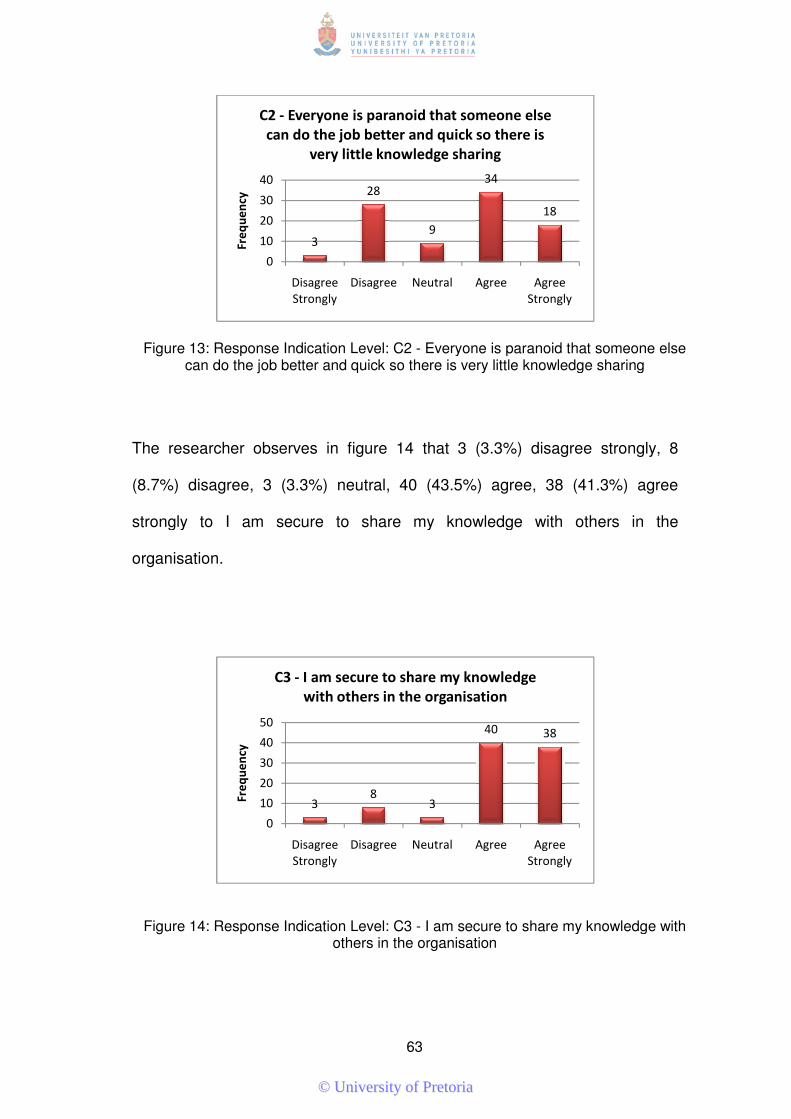
Figure 13: Response Indication Level: C2 can do the job better and quick so there is very little knowledge sharing
The researcher observes in figure 14
(8.7%) disagree, 3 (3.3%) neutral, 40 (43.5%) agree, 38 (41.3%) agree
strongly to I am secure to share my knowledge with others in the
organisation.
Figure 14: Response Indication Level: C3
0
10
20
30
40
Fre
qu
en
cy
C2 -
can do the job better and quick so there is
0
10
20
30
40
50
Fre
qu
en
cy
C3
63
: Response Indication Level: C2 - Everyone is paranoid that someone else better and quick so there is very little knowledge sharing
searcher observes in figure 14 that 3 (3.3%) disagree strongly, 8
(8.7%) disagree, 3 (3.3%) neutral, 40 (43.5%) agree, 38 (41.3%) agree
strongly to I am secure to share my knowledge with others in the
: Response Indication Level: C3 - I am secure to share my knowledge with others in the organisation
3
28
9
34
18
Disagree
Strongly
Disagree Neutral Agree Agree
Strongly
Everyone is paranoid that someone else
can do the job better and quick so there is
very little knowledge sharing
38
3
40 38
Disagree
Strongly
Disagree Neutral Agree Agree
Strongly
C3 - I am secure to share my knowledge
with others in the organisation
Everyone is paranoid that someone else better and quick so there is very little knowledge sharing
that 3 (3.3%) disagree strongly, 8
(8.7%) disagree, 3 (3.3%) neutral, 40 (43.5%) agree, 38 (41.3%) agree
strongly to I am secure to share my knowledge with others in the
I am secure to share my knowledge with
©© UUnniivveerrssiittyy ooff PPrreettoorriiaa
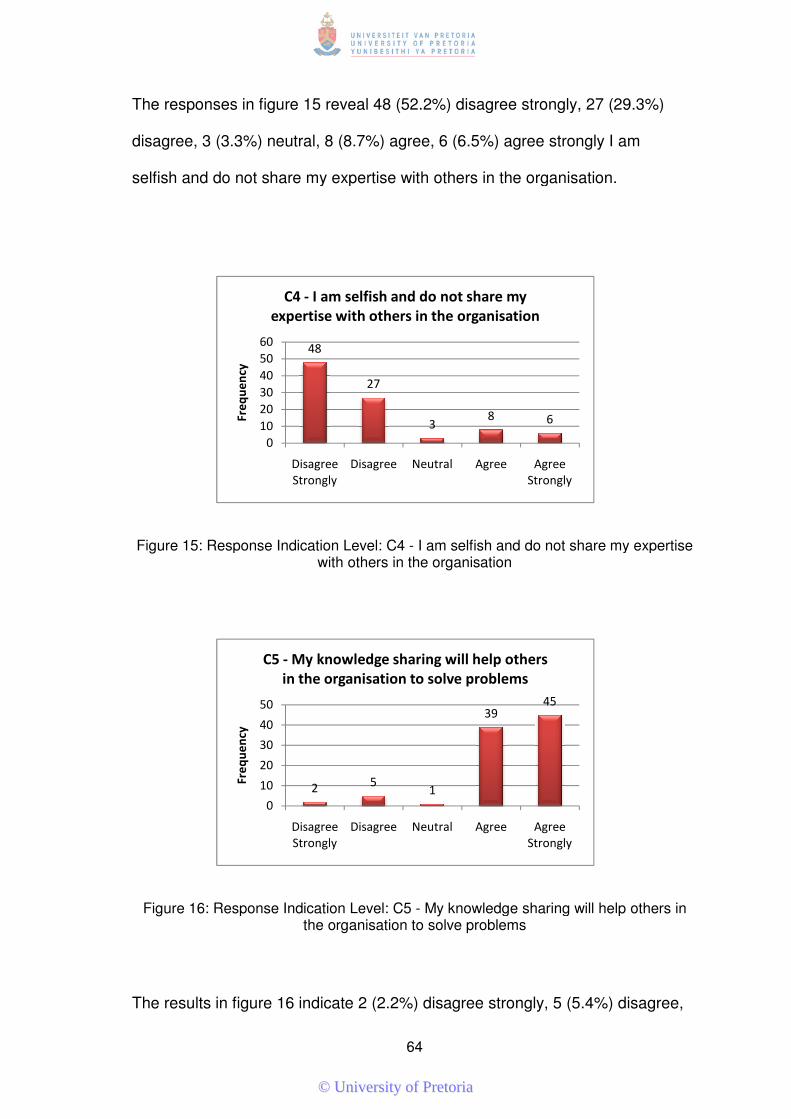
The responses in figure 15
disagree, 3 (3.3%) neutral, 8 (8.7%) agree, 6 (6.5%) agree strongly I am
selfish and do not share my expertise wit
Figure 15: Response Indication Level: C4
Figure 16: Response Indication Level: C5
The results in figure 16 indicate 2 (2.2%) disagree strongly, 5 (5.4%) disagree,
0
10
20
30
40
50
60
Fre
qu
en
cy
C4
expertise with others in the organisation
0
10
20
30
40
50
Fre
qu
en
cy
C5 -
in the organisation to solve problems
64
The responses in figure 15 reveal 48 (52.2%) disagree strongly, 27 (29.3%)
disagree, 3 (3.3%) neutral, 8 (8.7%) agree, 6 (6.5%) agree strongly I am
selfish and do not share my expertise with others in the organisation.
: Response Indication Level: C4 - I am selfish and do not share my expertise with others in the organisation
: Response Indication Level: C5 - My knowledge sharing will help others in the organisation to solve problems
The results in figure 16 indicate 2 (2.2%) disagree strongly, 5 (5.4%) disagree,
48
27
38 6
Disagree
Strongly
Disagree Neutral Agree Agree
Strongly
C4 - I am selfish and do not share my
expertise with others in the organisation
25
1
3945
Disagree
Strongly
Disagree Neutral Agree Agree
Strongly
- My knowledge sharing will help others
in the organisation to solve problems
reveal 48 (52.2%) disagree strongly, 27 (29.3%)
disagree, 3 (3.3%) neutral, 8 (8.7%) agree, 6 (6.5%) agree strongly I am
h others in the organisation.
I am selfish and do not share my expertise
knowledge sharing will help others in
The results in figure 16 indicate 2 (2.2%) disagree strongly, 5 (5.4%) disagree,
©© UUnniivveerrssiittyy ooff PPrreettoorriiaa
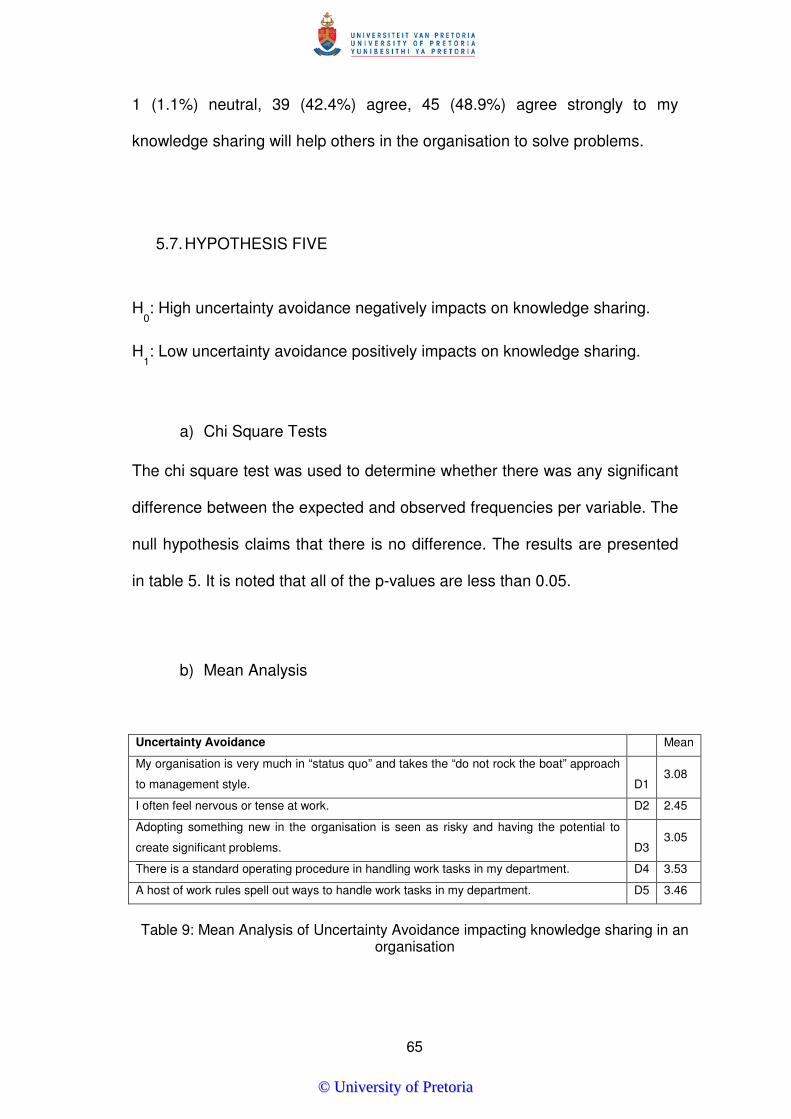
65
1 (1.1%) neutral, 39 (42.4%) agree, 45 (48.9%) agree strongly to my
knowledge sharing will help others in the organisation to solve problems.
5.7. HYPOTHESIS FIVE
H0: High uncertainty avoidance negatively impacts on knowledge sharing.
H1: Low uncertainty avoidance positively impacts on knowledge sharing.
a) Chi Square Tests
The chi square test was used to determine whether there was any significant
difference between the expected and observed frequencies per variable. The
null hypothesis claims that there is no difference. The results are presented
in table 5. It is noted that all of the p-values are less than 0.05.
b) Mean Analysis
Uncertainty Avoidance
Mean
My organisation is very much in “status quo” and takes the “do not rock the boat” approach
to management style. D1 3.08
I often feel nervous or tense at work. D2 2.45
Adopting something new in the organisation is seen as risky and having the potential to
create significant problems. D3 3.05
There is a standard operating procedure in handling work tasks in my department. D4 3.53
A host of work rules spell out ways to handle work tasks in my department. D5 3.46
Table 9: Mean Analysis of Uncertainty Avoidance impacting knowledge sharing in an
organisation
©© UUnniivveerrssiittyy ooff PPrreettoorriiaa
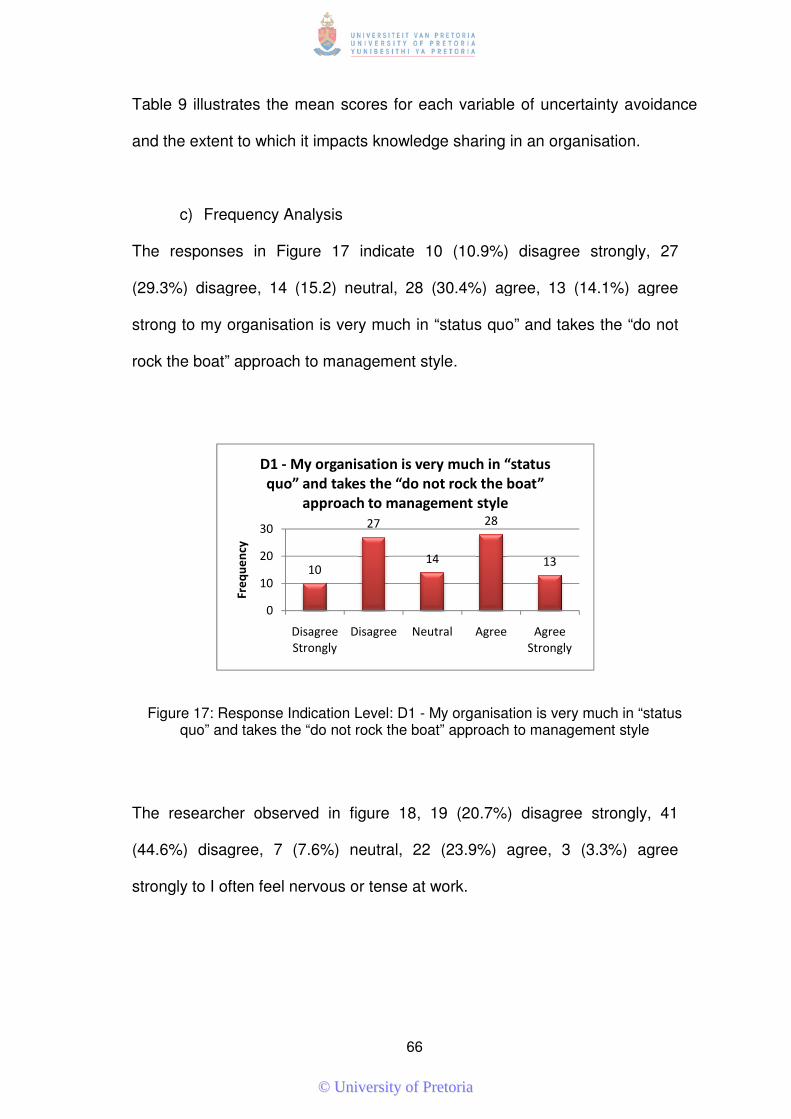
Table 9 illustrates the mean scores for each variable of uncertainty avoidance
and the extent to which it impacts
c) Frequency Analysis
The responses in Figure 17
(29.3%) disagree, 14 (15.2) neutral, 28 (30.4%) agree, 13 (14.1%) agree
strong to my organisation is very much in “status quo” and takes the “do not
rock the boat” approach to management style
Figure 17: Response Indication Level: D1 quo” and takes the “do not rock
The researcher observed in figure 18
(44.6%) disagree, 7 (7.6%) neutral, 22 (23.9%) agree, 3 (3.3%) agree
strongly to I often feel nervous or tense at work.
0
10
20
30
Fre
qu
en
cy
D1 -
quo” and takes the “do not rock the boat”
66
Table 9 illustrates the mean scores for each variable of uncertainty avoidance
and the extent to which it impacts knowledge sharing in an organisation.
Frequency Analysis
ponses in Figure 17 indicate 10 (10.9%) disagree strongly, 27
(29.3%) disagree, 14 (15.2) neutral, 28 (30.4%) agree, 13 (14.1%) agree
my organisation is very much in “status quo” and takes the “do not
rock the boat” approach to management style.
: Response Indication Level: D1 - My organisation is very much in “status quo” and takes the “do not rock the boat” approach to management style
searcher observed in figure 18, 19 (20.7%) disagree strongly, 41
(44.6%) disagree, 7 (7.6%) neutral, 22 (23.9%) agree, 3 (3.3%) agree
strongly to I often feel nervous or tense at work.
10
27
14
28
13
Disagree
Strongly
Disagree Neutral Agree Agree
Strongly
- My organisation is very much in “status
quo” and takes the “do not rock the boat”
approach to management style
Table 9 illustrates the mean scores for each variable of uncertainty avoidance
knowledge sharing in an organisation.
indicate 10 (10.9%) disagree strongly, 27
(29.3%) disagree, 14 (15.2) neutral, 28 (30.4%) agree, 13 (14.1%) agree
my organisation is very much in “status quo” and takes the “do not
My organisation is very much in “status the boat” approach to management style
, 19 (20.7%) disagree strongly, 41
(44.6%) disagree, 7 (7.6%) neutral, 22 (23.9%) agree, 3 (3.3%) agree
©© UUnniivveerrssiittyy ooff PPrreettoorriiaa
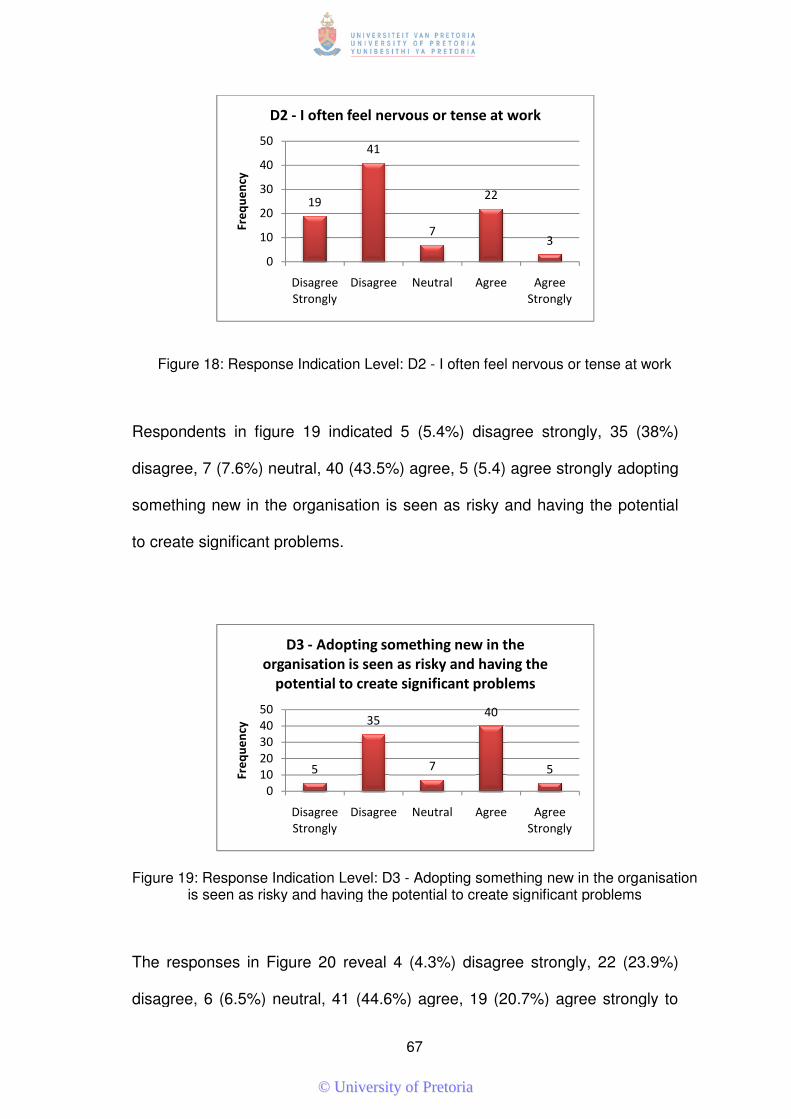
Figure 18: Response Indication Level: D2
Respondents in figure 19
disagree, 7 (7.6%) neutral, 40 (43.5%) agree, 5 (5.4) agree strongly
something new in the organis
to create significant problems.
Figure 19: Response Indication Level: D3 is seen as risky and having the
The responses in Figure 20
disagree, 6 (6.5%) neutral, 41 (44.6%) agree, 19 (20.7%) agree strongly to
0
10
20
30
40
50
Fre
qu
en
cy
D2
0
10
20
30
40
50
Fre
qu
en
cy
organisation is seen as risky and having the
potential to create significant problems
67
: Response Indication Level: D2 - I often feel nervous or tense at work
Respondents in figure 19 indicated 5 (5.4%) disagree strongly, 35 (38%)
disagree, 7 (7.6%) neutral, 40 (43.5%) agree, 5 (5.4) agree strongly
something new in the organisation is seen as risky and having the potential
to create significant problems.
: Response Indication Level: D3 - Adopting something new in the organisation is seen as risky and having the potential to create significant problems
The responses in Figure 20 reveal 4 (4.3%) disagree strongly, 22 (23.9%)
disagree, 6 (6.5%) neutral, 41 (44.6%) agree, 19 (20.7%) agree strongly to
19
41
7
22
3
Disagree
Strongly
Disagree Neutral Agree Agree
Strongly
D2 - I often feel nervous or tense at work
5
35
7
40
5
Disagree
Strongly
Disagree Neutral Agree Agree
Strongly
D3 - Adopting something new in the
organisation is seen as risky and having the
potential to create significant problems
I often feel nervous or tense at work
indicated 5 (5.4%) disagree strongly, 35 (38%)
disagree, 7 (7.6%) neutral, 40 (43.5%) agree, 5 (5.4) agree strongly adopting
ation is seen as risky and having the potential
Adopting something new in the organisation potential to create significant problems
reveal 4 (4.3%) disagree strongly, 22 (23.9%)
disagree, 6 (6.5%) neutral, 41 (44.6%) agree, 19 (20.7%) agree strongly to
©© UUnniivveerrssiittyy ooff PPrreettoorriiaa
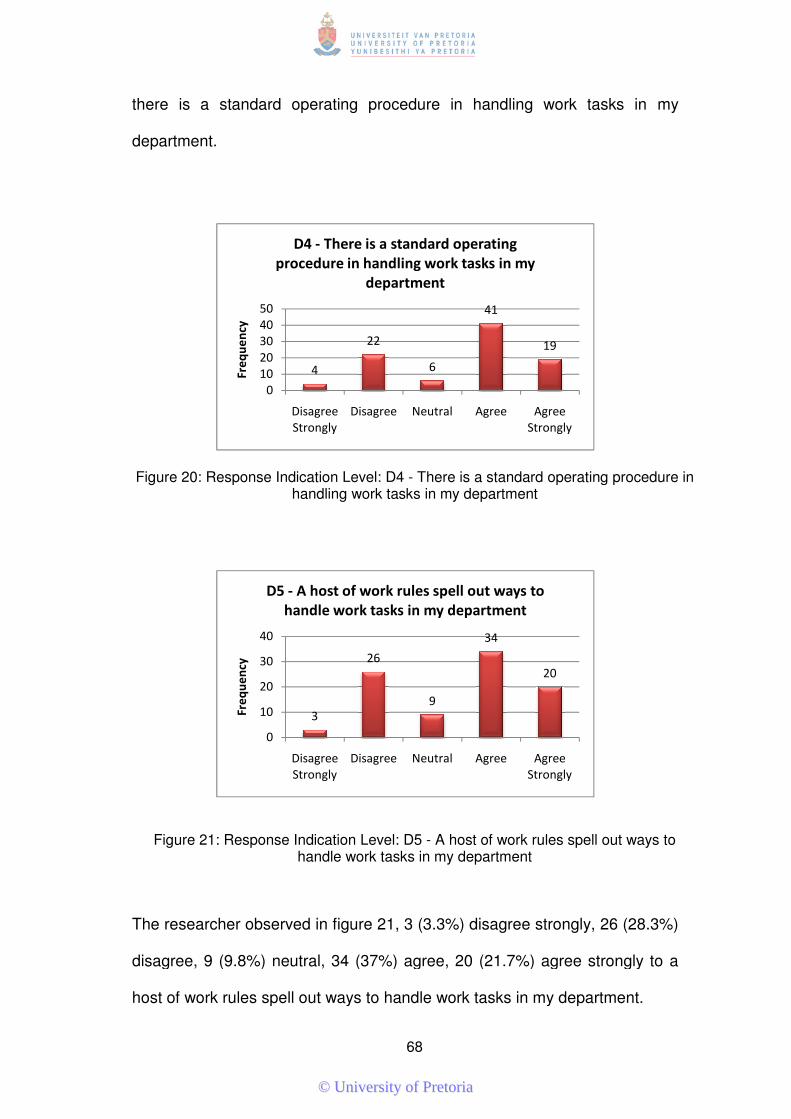
there is a standard operating procedure in handling work tasks in
department.
Figure 20: Response Indication Level: D4
Figure 21: Response Indication Level: D5
The researcher observed in figure 21
disagree, 9 (9.8%) neutral, 34 (37%) agree, 20 (21.7%) agree strongly to
host of work rules spell out ways to handle work tasks in my department.
0
10
20
30
40
50
Fre
qu
en
cy
procedure in handling work tasks in my
0
10
20
30
40
Fre
qu
en
cy
D5
handle work tasks in my department
68
there is a standard operating procedure in handling work tasks in
: Response Indication Level: D4 - There is a standard operating procedure in handling work tasks in my department
: Response Indication Level: D5 - A host of work rules spell out ways to handle work tasks in my department
searcher observed in figure 21, 3 (3.3%) disagree strongly, 26 (28.3%)
disagree, 9 (9.8%) neutral, 34 (37%) agree, 20 (21.7%) agree strongly to
host of work rules spell out ways to handle work tasks in my department.
4
22
6
41
19
Disagree
Strongly
Disagree Neutral Agree Agree
Strongly
D4 - There is a standard operating
procedure in handling work tasks in my
department
3
26
9
34
20
Disagree
Strongly
Disagree Neutral Agree Agree
Strongly
D5 - A host of work rules spell out ways to
handle work tasks in my department
there is a standard operating procedure in handling work tasks in my
There is a standard operating procedure in
rules spell out ways to
, 3 (3.3%) disagree strongly, 26 (28.3%)
disagree, 9 (9.8%) neutral, 34 (37%) agree, 20 (21.7%) agree strongly to a
host of work rules spell out ways to handle work tasks in my department.
©© UUnniivveerrssiittyy ooff PPrreettoorriiaa
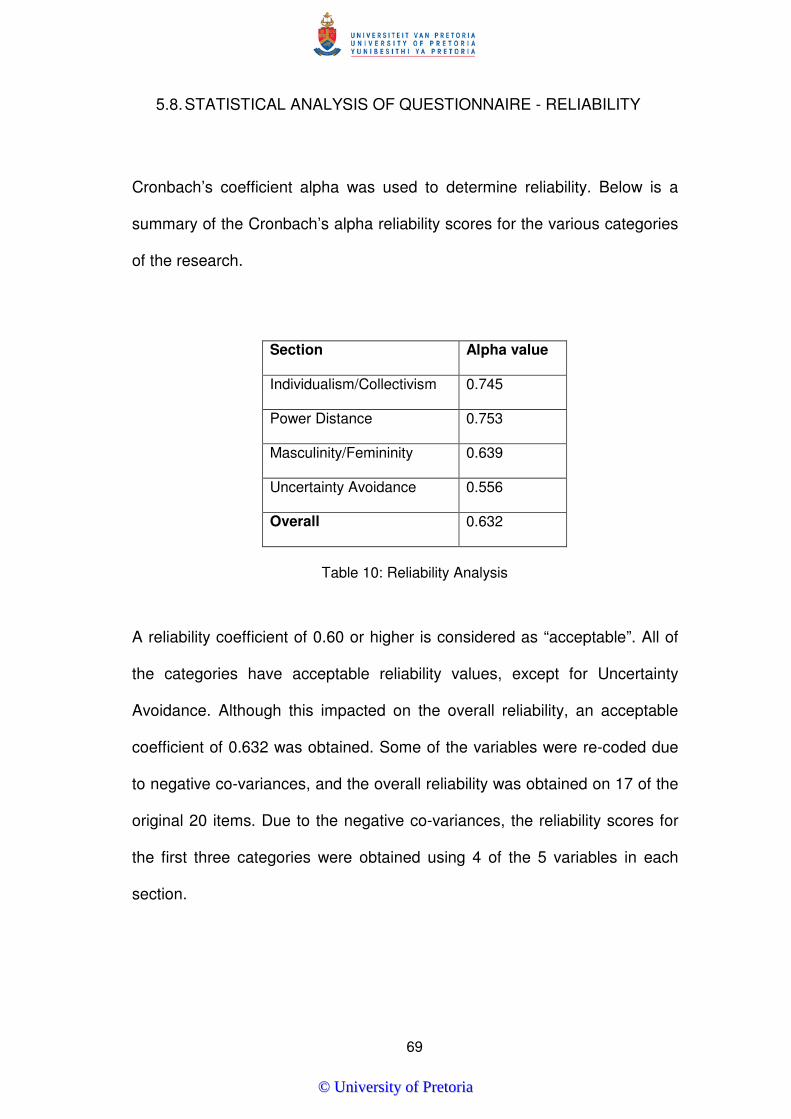
69
5.8. STATISTICAL ANALYSIS OF QUESTIONNAIRE - RELIABILITY
Cronbach’s coefficient alpha was used to determine reliability. Below is a
summary of the Cronbach’s alpha reliability scores for the various categories
of the research.
Section Alpha value
Individualism/Collectivism 0.745
Power Distance 0.753
Masculinity/Femininity 0.639
Uncertainty Avoidance 0.556
Overall 0.632
Table 10: Reliability Analysis
A reliability coefficient of 0.60 or higher is considered as “acceptable”. All of
the categories have acceptable reliability values, except for Uncertainty
Avoidance. Although this impacted on the overall reliability, an acceptable
coefficient of 0.632 was obtained. Some of the variables were re-coded due
to negative co-variances, and the overall reliability was obtained on 17 of the
original 20 items. Due to the negative co-variances, the reliability scores for
the first three categories were obtained using 4 of the 5 variables in each
section.
©© UUnniivveerrssiittyy ooff PPrreettoorriiaa
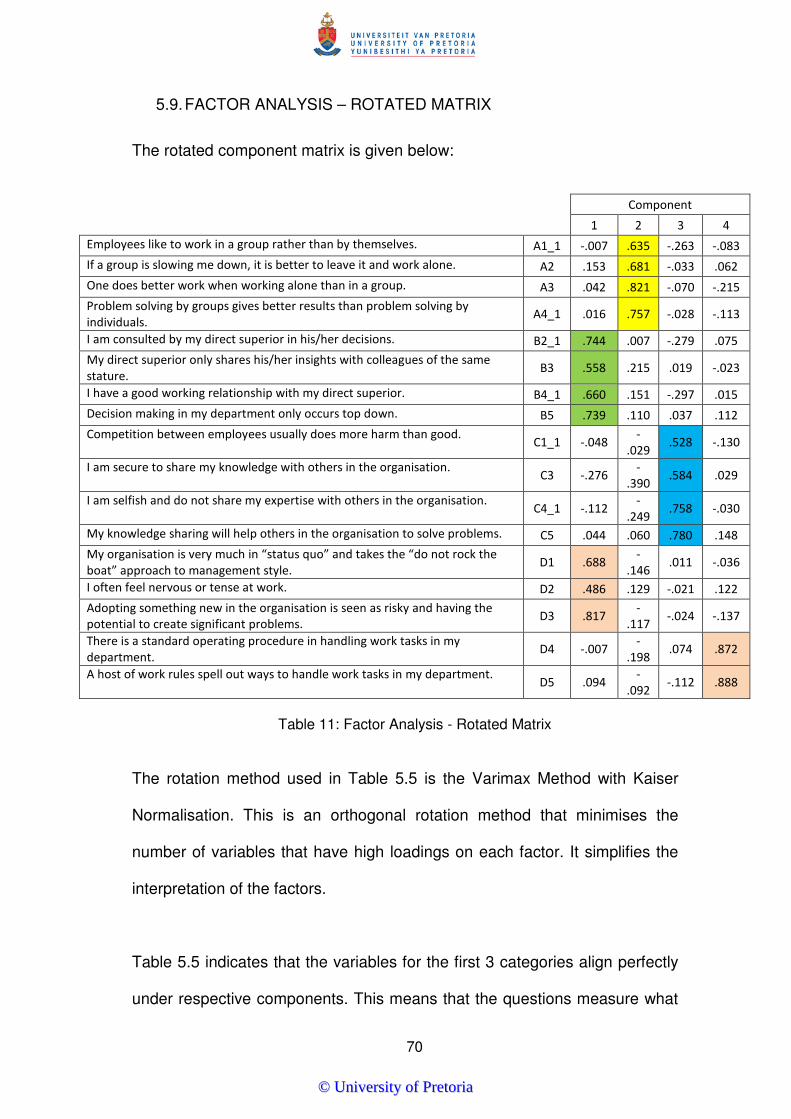
70
5.9. FACTOR ANALYSIS – ROTATED MATRIX
The rotated component matrix is given below:
Component
1 2 3 4
Employees like to work in a group rather than by themselves. A1_1 -.007 .635 -.263 -.083
If a group is slowing me down, it is better to leave it and work alone. A2 .153 .681 -.033 .062
One does better work when working alone than in a group. A3 .042 .821 -.070 -.215
Problem solving by groups gives better results than problem solving by
individuals. A4_1 .016 .757 -.028 -.113
I am consulted by my direct superior in his/her decisions. B2_1 .744 .007 -.279 .075
My direct superior only shares his/her insights with colleagues of the same
stature. B3 .558 .215 .019 -.023
I have a good working relationship with my direct superior. B4_1 .660 .151 -.297 .015
Decision making in my department only occurs top down. B5 .739 .110 .037 .112
Competition between employees usually does more harm than good. C1_1 -.048
-
.029 .528 -.130
I am secure to share my knowledge with others in the organisation. C3 -.276
-
.390 .584 .029
I am selfish and do not share my expertise with others in the organisation. C4_1 -.112
-
.249 .758 -.030
My knowledge sharing will help others in the organisation to solve problems. C5 .044 .060 .780 .148
My organisation is very much in “status quo” and takes the “do not rock the
boat” approach to management style. D1 .688
-
.146 .011 -.036
I often feel nervous or tense at work. D2 .486 .129 -.021 .122
Adopting something new in the organisation is seen as risky and having the
potential to create significant problems. D3 .817
-
.117 -.024 -.137
There is a standard operating procedure in handling work tasks in my
department. D4 -.007
-
.198 .074 .872
A host of work rules spell out ways to handle work tasks in my department. D5 .094
-
.092 -.112 .888
Table 11: Factor Analysis - Rotated Matrix
The rotation method used in Table 5.5 is the Varimax Method with Kaiser
Normalisation. This is an orthogonal rotation method that minimises the
number of variables that have high loadings on each factor. It simplifies the
interpretation of the factors.
Table 5.5 indicates that the variables for the first 3 categories align perfectly
under respective components. This means that the questions measure what
©© UUnniivveerrssiittyy ooff PPrreettoorriiaa
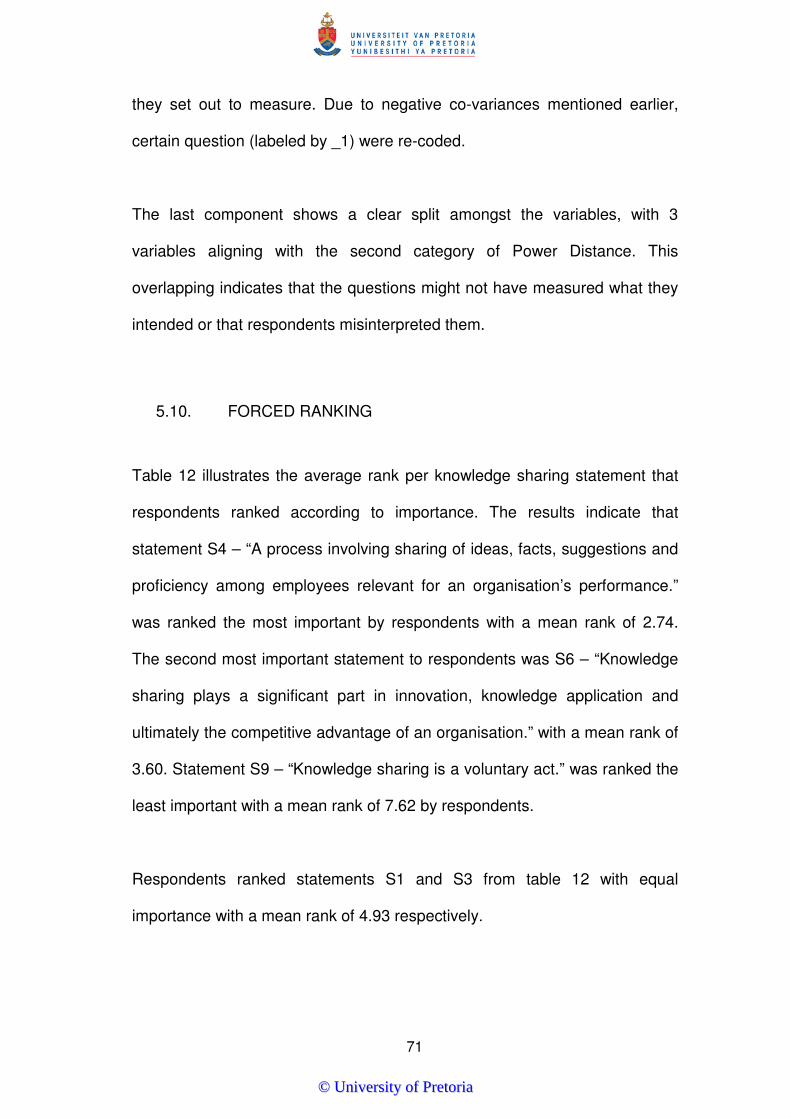
71
they set out to measure. Due to negative co-variances mentioned earlier,
certain question (labeled by _1) were re-coded.
The last component shows a clear split amongst the variables, with 3
variables aligning with the second category of Power Distance. This
overlapping indicates that the questions might not have measured what they
intended or that respondents misinterpreted them.
5.10. FORCED RANKING
Table 12 illustrates the average rank per knowledge sharing statement that
respondents ranked according to importance. The results indicate that
statement S4 – “A process involving sharing of ideas, facts, suggestions and
proficiency among employees relevant for an organisation’s performance.”
was ranked the most important by respondents with a mean rank of 2.74.
The second most important statement to respondents was S6 – “Knowledge
sharing plays a significant part in innovation, knowledge application and
ultimately the competitive advantage of an organisation.” with a mean rank of
3.60. Statement S9 – “Knowledge sharing is a voluntary act.” was ranked the
least important with a mean rank of 7.62 by respondents.
Respondents ranked statements S1 and S3 from table 12 with equal
importance with a mean rank of 4.93 respectively.
©© UUnniivveerrssiittyy ooff PPrreettoorriiaa
72
Average Rank
A process involving sharing of ideas, facts, suggestions and proficiency
among employees relevant for an organisation’s performance. S4 2.74
Knowledge sharing plays a significant part in innovation, knowledge
application and ultimately the competitive advantage of an organisation. S6 3.60
Knowledge flows between two individuals or from one individual to a
group when knowledge sharing occurs. S1 4.93
An activity of transferring knowledge from one person, group or
organisation. S3 4.93
A practice in which knowledge by an individual is transformed into a
form that can be understood and utilised by other individuals. S5 5.07
Problem solving is a means of knowledge sharing. S8 6.01
A process of identification, outflow, transmission and inflow of
knowledge in an organisation. S2 6.20
A process where individuals mutually exchange both tacit and explicit
knowledge to jointly create new knowledge. S7 6.68
Knowledge sharing can occur through meetings, email or intranet. S10 7.22
Knowledge sharing is a voluntary act. S9 7.62
Table 12: Forced Ranking
5.11. CHAPTER CONCLUSION
In this chapter the results of the data obtained were presented. The data was
presented in both tabular and graphical representations. Data for Cronbach’s
alpha, frequency analysis, factor analysis, forced ranking, results of chi
square and cross tabs and mean analysis were presented in tabular format
and discussed briefly.
©© UUnniivveerrssiittyy ooff PPrreettoorriiaa
73
For each hypothesis, data was presented in terms of the chi square tests,
mean analysis and a graphical illustration of each relevant question to the
hypothesis.
The next chapter (Chapter 6) is going to focus on the discussion and
interpretation of the results.
©© UUnniivveerrssiittyy ooff PPrreettoorriiaa
74
CHAPTER 6
DISCUSSION OF RESULTS
6.1. INTRODUCTION
In this chapter, the results obtained and presented in chapter 5 are discussed
according the developed hypotheses in chapter 3. The results of this study
together with the research findings in the literature review from chapter 2 were
used for an interpretation of the findings.
6.2. HYPOTHESIS ONE
H0: There is a no difference in employee perceptions varying in biographical
profiles (age, gender, work experience) regarding the impact of the dimensions
of culture (individualism/collectivism, power distance, uncertainty avoidance
and masculinity/feminity) on knowledge sharing.
H1: There is a difference in employee perceptions varying in biographical
profiles (age, gender, work experience) regarding the impact of the dimensions
of culture (individualism/collectivism, power distance, uncertainty avoidance and
masculinity/feminity) on knowledge sharing.
The rationale for this hypothesis was to determine if there was a relationship
between the biographical profiles on the four dimensions of culture and its
impact on knowledge sharing. Previous research has shown that there was a
relation between gender and age to the cultural dimension scores (Hofstede,
©© UUnniivveerrssiittyy ooff PPrreettoorriiaa
75
1991). In a research study by (Chow et al, 2000) where they compared Chinese
to Anglo American culture they established that employees with long work
experience displayed an unwillingness to share knowledge by not sharing their
own errors made in an organisation.
From table 4 there was only one significant value (p-value) for age and one
does better work when working alone than in a group in the cultural dimension
individualism/collectivism. However, for the other nineteen variables there were
no significant values. For this reason, there was no significant difference in the
perceptions of employees varying in age regarding the impact of the four
dimensions of culture on knowledge sharing.
Just one significant value (p-value) was indicated in table 4 for gender and a
host of work rules spell out ways to handle work tasks in my department in the
cultural dimension uncertainty avoidance. But with no significant values for the
other nineteen variables it was evident that there was no significant difference in
the perceptions of employees varying in gender regarding the impact of the
cultural dimensions on knowledge sharing.
Results in table 4 highlighted the two significant values (p-value) for work
experience, and the two variables - adopting something new in the organisation
is seen as risky and having the potential to create significant problems and
there is a standard operating procedure in handling work tasks in my
department. Despite this, the other eighteen variables showed no significant
values. It was therefore deduced that there was no significant difference in the
perceptions of employees varying in work experience with regards to the impact
©© UUnniivveerrssiittyy ooff PPrreettoorriiaa
76
of the four cultural dimensions on knowledge sharing. Hence the results
obtained, indicated that age, gender and work experience had no effect on
knowledge sharing in terms of the cultural dimensions.
The non-significant findings may be due to the characteristics of the research
sample, as the majority of the respondents were in the 30-34 age group, from
the mining and manufacturing sector. This was the younger age group of
managers from this sector. The overall trend in the results indicated that there
were more males than females, which were a classic attribute of a mining and
manufacturing industry. This could have influenced the insignificant result
obtained.
Table 3 indicated that a greater part of the respondents had 6 -10 years
experience. The results of the study by (Chow et al, 2000) revealed that
respondents who had approximately 7 years work experience displayed a
negative relationship to the willingingness to share one’s errors with others in
the organisation. However, in this study from the results attained no significant
difference was noted with work experience and the cultural dimensions. This
could be attributed to the fact that Chow et al (2000) in their study compared the
Chinese and Anglo American cultures which differed to the South African
culture.
6.3. HYPOTHESIS TWO
H0: High individualism and low collectivism impedes knowledge sharing.
H1: Low individualism and high collectivism promotes knowledge sharing.
©© UUnniivveerrssiittyy ooff PPrreettoorriiaa
77
The results from this study for individualism/collectivism revealed generally
positive results. Table 5 revealed that there was a significant difference in the
manner in which respondents scored each question in the cultural dimension
individualism/collectivism. The means values indicated in table 6 showed that
low individualism and high collectivism positively impacted knowledge sharing.
With one exception, responses for the fifth question in this cultural dimension
was close to 3 indicating that there were as many respondents who agreed with
the statement as those who did not.
The frequency analysis in figure 2 indicated that 34 (37%) of the respondents
agree and 11 (12%) of the respondents strongly agreed to question A1
highlighting that knowledge sharing was promoted when employees work in a
group. Since the majority of the respondents 45 (49%) agreed that working in a
group promoted knowledge sharing this indicated that low individualism and
high collectivism promoted knowledge sharing.
Figure 3 showed that the frequency analysis of question A2 indicated that 41
(44.6%) of the respondents disagree and 13 (14.1%) of the respondents
strongly disagreed to this question highlighting that knowledge sharing was
promoted when employees work in a group rather than on one’s own. From the
results obtained it was evident that the greater part of the respondents 54
(58.7%) agreed that working in a group rather than on one’s own promoted
knowledge sharing. Therefore, this indicated that low individualism and high
collectivism promoted knowledge sharing. The results in figure 4 concerning
question A3 revealed that 37 (40.2%) of the respondents disagree and 14
©© UUnniivveerrssiittyy ooff PPrreettoorriiaa
78
(15.2%) of the respondents strongly disagreed to this question highlighting that
better work was achieved when one works in a group than alone. Thus,
indicating that knowledge sharing was promoted when one worked with others.
The majority of the respondents 51 (55.4%) agreed that working in a group
achieved better work results hence promoting knowledge sharing which
indicated that low individualism and high collectivism promoted knowledge
sharing.
The results regarding question A4 in figure 5 indicated that 39 (42.4%) of the
respondents agree and 31 (33.7%) of the respondents strongly agreed to this
question highlighting that problem solving in groups gave better results than
when it was done by an individual therefore indicating that knowledge sharing
was promoted when problem solving was done in a group. The majority of the
respondents 70 (76.1%) agreed that problem solving in groups gave better
results than when it was done by an individual hence promoting knowledge
sharing which indicated that low individualism and high collectivism promoted
knowledge sharing.
Finally figure 6 results indicated that 33 (35.9%) of the respondents agree and 9
(9.8%) of the respondents strongly agreed to this question. This highlighted that
the employee must give priority to the decision of the group rather than placing
their own personal goals ahead of the group. Therefore, indicating, that
knowledge sharing was promoted when an individual gave priority to the
decisions of the group. From figure 6, 28 (30.4%) of the respondents disagree
and 13 (14.1%) of the respondents strongly disagreed. However, the mean
©© UUnniivveerrssiittyy ooff PPrreettoorriiaa
79
value for this question is 3 indicating that number of respondents agreeing with
statement was the similar to the ones disagreeing with it. Therefore, for this
study, the last question was not considered due to its impartial result indicating
that the cultural dimension individualism/collectivism has no impact on
knowledge sharing.
Nevertheless, the results unanimously support the hypothesis in that there was
a definite trend that low individualism and high collectivism promoted
knowledge sharing. From the chi square test all p – values for questions A1 to
A5 were less than 0.05 indicating there was a significant difference in the
manner in which respondents scored the questions hence showing a clear
tendency that low individualism and high collectivism promoted knowledge
sharing.
In earlier research, it was shown that it was more difficult to share knowledge in
an individualistic culture as individuals viewed knowledge as a source of power
whereas in a collectivistic culture easier knowledge sharing took place
especially if the group saw the benefit (Ford & Chan, 2003). Consequently, a
low individualistic culture and a high collectivistic culture will promote knowledge
sharing. It was also noted that individuals in individualistic cultures displayed a
tendency to place their own personal goals ahead of the larger social group
such as an organisation (Ardichvili et al, 2006). Hofstede (2001) on the other
hand mentioned that individuals in collectivistic cultures tended to give priority to
the goals of the larger collective or group they belonged to. In spite of this the
last question of the cultural dimension individualism/collectivism showed no
©© UUnniivveerrssiittyy ooff PPrreettoorriiaa
80
conclusive result as this could be due to the employees of Samancor Chrome
not fully understanding the question.
6.4. HYPOTHESIS THREE
H0: High power distance negatively impacts on knowledge sharing.
H1: Low power distance positively impacts on knowledge sharing.
The results pertaining to hypothesis three in table 5 indicated there was a
significant difference in the way in which respondents scored each question in
the cultural dimension power distance. The means values indicated in table 7
showed that low power distance positively impacted knowledge sharing. With
two exceptions, responses for the third and fourth question in this cultural
dimension was close to 3 indicating that equal amount of respondents agreed
and disagreed with these questions.
Results in figure 7 indicated that 40 (43.5%) of the respondents agree and 24
(26.1%) of the respondents strongly agreed that they were not afraid to share
their ideas with their direct superior. Most of the respondents 64 (69.6%) agreed
that none of them were afraid to have their ideas shared with their superiors. A
possible explanation for this was that the superior was quite open to ideas from
the subordinates confirming that he/she encouraged generation of ideas
thereby promoting knowledge sharing. This suggested that low power distance
positively impacted knowledge sharing.
©© UUnniivveerrssiittyy ooff PPrreettoorriiaa
81
Question B4 in figure 10 revealed that 43 (46.7%) of the employees agree and
22 (23.9%) of employees strongly agreed that they all had good working
relationships with their superiors. It was evident that the majority of the
employees 65 (70.6%) had good working relationships with their superiors. An
explanation for this could be that their superiors’ were not autocratic and did not
control all the decisions and ideas generated by subordinates. A superior with
such qualities promoted knowledge sharing. This implied that low power
distance has a positive impact on knowledge sharing.
Davenport & Prusak (1998) mentioned that smaller power distance brought
down the gap between superior and the employees which had a positive effect
on the knowledge sharing process in the organisation. This was apparent with
the agreement from employees that they had good working relationships with
their superiors and were not afraid to share their ideas. Hence low or smaller
power distance promotes knowledge sharing. The lack of formal distance made
the information flow in both directions much better implying that employees in
lower positions were not afraid to show their ideas to the organisation
(Davenport & Prusak, 1998) confirming easier knowledge sharing.
The results regarding figure 11 indicated that 21 (22.8%) of respondents agree
and 29 (31.5%) agreed strongly that in their departments decision making
occurred top down. However table 7 showed that its mean value is lesser than
questions B4 and B1 indicating that most of the employees are of the opinion
that decision making does not only occur from top down. This could be
attributed to the fact that employees reported to managers that had different
©© UUnniivveerrssiittyy ooff PPrreettoorriiaa
82
management styles. Considering this, low power distance promoted knowledge
sharing.
The exceptions to questions B2 and B3 indicated that employees could not
come to a decision as to whether they were consulted or not by their superiors
in his/her decisions, and were not aware of what their superior’s actions were
when it came to sharing insights in the organisation with other colleagues of the
same stature respectively.
It was clear that the employees in Samancor Chrome believed that knowledge
flow occured in both directions as mentioned by (Davenport & Prusak, 1998)
suggesting better knowledge sharing in the organisation. This argument was
further supported by (Hofstede, 2001) as he stated that information flows were
constrained by cultures that displayed high power distances due to the
presence of hierachical environments. Uncertainty in employees concerning
questions B2 and B3 could be due to the different types of management styles
from the various managers.
Therefore, the results in this section 5.5 showed that there was a clear pattern
that low power distance positively impacted knowledge sharing. Hence it is
quite evident that Samancor Chrome demonstrated a horizontal culture as
discussed by (Bhagat et al, 2002) where information flows in both directions.
Furthermore (Ardichvili et al, 2006) emphasised this point by asserting that
differences in status are less explicit which was evidently seen in the responses
obtained for questions B1 and B4 thus indicating that low power distance
©© UUnniivveerrssiittyy ooff PPrreettoorriiaa
83
promoted knowledge sharing. From the chi square test all p – values for
questions B1 to B5 were less than 0.05 indicating there was a significant
difference in the manner in which respondents scored the questions hence
confirming that low power distance had a postiive impact on knowledge
sharing.
6.5. HYPOTHESIS FOUR
H0: High masculinity and low feminity impedes knowledge sharing.
H1: Low masculinity and high feminity promotes knowledge sharing.
The results concerning hypothesis four revealed that low masculinity and high
feminity promoted knowledge sharing. The results in table 5 indicated that there
existed a significant difference in the manner in which responds scored each
question in the cultural dimension masculinity/feminity. The mean values
indicated in table 8 revealed that low masculinity and high feminity promoted
knowledge sharing as questions C3, C4 and C5 effectively indicated that
respondents would share their knowledge. With two exceptions, responses for
question C1 in this cultural dimension tended towards neutrality indicating that
there were as many respondents who agreed with the statement as there was
who did not. This could be owing to employees not understanding the question
and how it affects their organisation in terms of knowledge sharing. C4 also
tended towards neutrality, which could be attributed to the different views that
certain managers had.
©© UUnniivveerrssiittyy ooff PPrreettoorriiaa
84
Regarding question C3, the results in figure 14 highlighted that 40 (43.5%) of
the respondents agree and 38 (41.3%) strongly agreed that they were secure to
share their knowledge with others in the organisation. From the literature,
Rivera-Vazquez et al (2009) defined feminity as an environment of cooperation
where employees felt secure to share their knowledge with other colleagues.
Hence, this suggested that the employees believed that the atmosphere at
Samancor Chrome was one of cooperativeness, which enabled the security for
them to share their knowledge. It also showed an atmosphere of
understanding, not one of aggression and self accomplishment (Hauke, 2006).
From figure 14 it was clear that this statement held true for Samancor Chrome.
It also indicated that employees did not feel threatened to share their
knowledge, thus reinforcing the argument made by (Hauke, 2006). With the
majority of the respondents 78 (84.8%) feeling this way, the results obtained
suggested that low masculinity and high feminity promoted knowledge sharing.
Results in figure 15 indicated that 48 (52.2%) of employees at Samancor
Chrome strongly disagree and 27 (29.3%) disagreed that they were selfish
when it came to sharing expertise with others in the organisation. This implied
that most of the respondents 75 (81.5%) seemed to agree that they were
unselfish when it came to sharing expertise with other employees in the
organisation. A possible explanation for this could be that superiors displayed
this same quality, which encouraged subordinates to demonstrate the same
behaviour. This positive result indicated that low masculinity and high feminity
promoted knowledge sharing.
©© UUnniivveerrssiittyy ooff PPrreettoorriiaa
85
The last figure 16 showed that 45 (48.9%) of all the respondents strongly agree
and 39 (42.4%) of respondents agreed that their knowledge sharing assisted
others in the organisation to solve problems. This huge response 84 (91.3%)
suggested yet again that employees strongly felt that the environment at
Samancor Chrome was a conducive one for knowledge sharing. An explanation
for this could be that employees have already seen how well problem solving
can be achieved by groups rather than by oneself. Another possible explanation
would be that by working in a group, expertise is shared with others and this
made the problems solving process more efficient and valuable. Hofstede
(2001) also mentioned in his study that when the feminity dimension is applied
at the workplace, relationships are of priority. This is clearly indicated by the
results obtained in figure 16. This suggested that low masculinity and high
feminity promoted knowledge sharing.
Ford & Chan (2003) also argued that cultures that were high in masculinity may
have less knowledge sharing taking place among individuals in an organisation
if the competitiveness was individually based.
However from the frequencies obtained, there was a strong positive trend that
low feminity and high masculinity promoted knowledge sharing. From the chi
square test all p-values for questions C1 to C5 were less than 0.05 indicating
there was a significant difference in the manner in which respondents scored
the questions. Hence it was very clear that the differences in responses were
significant indicating that low masculinity and high feminity promoted knowledge
sharing.
©© UUnniivveerrssiittyy ooff PPrreettoorriiaa
86
6.6. HYPOTHESIS FIVE
H0: High uncertainty avoidance negatively impacts on knowledge sharing.
H1: Low uncertainty avoidance positively impacts on knowledge sharing.
The results concerning hypothesis five for the cultural dimension uncertainty
avoidance indicated generally positive results. The results in table 5 showed a
significant difference in the style in which respondents scored each question in
the cultural dimension uncertainty avoidance. The mean values in table 9
however indicated that high uncertainty avoidance negatively impacted
knowledge sharing. This was mainly due to the high mean values attained in D4
and D5. Two out of the five questions, D1 and D3 tended to be neutral
suggesting that respondents’ had the inability to accurately assess the type of
organisation Samancor Chrome actually was. Alternatively, it may be that the
respondents’ did not want to be truthful about the organisation and how it
operated. D2 indicated that employees were comfortable at work.
Figure 20 revealed that 19 (20.7%) of the respondents strongly agree and 41
(44.6%) agreed that in their departments there were standard operating
procedures for handling work tasks. The majority of the respondents agreed to
this question. This might be due to the robust and unsafe environment that was
characteristic of a mining and manufacturing organisation. To avoid harm to
employees there were standard operating procedures to ensure that everyone
knew how to perform work tasks in a safe manner.
©© UUnniivveerrssiittyy ooff PPrreettoorriiaa
87
The results for D5 in figure 21 indicated that 34 (37%) of the employees agree
and 20 (21.7%) of employees strongly agreed that a host of work rules spelt out
ways to handle tasks in their department. Majority of employees agreed to this,
as it is well known that the mining and manufacturing organisation has a
significant amount of the work force that is not well educated. In addition to this,
there are complex operations that are run in these types of organisations
increasing uncertainty and safety of employees. Therefore, there are work rules
in these organisations to guide employees to do the right thing and at the same
time keep them safe. The disparity in the results indicated that employees are
experiencing some form of conflict between freely expressing their perceptions
and being somewhat conservative.
The results for D4 and D5 certainly concurred with (Wilkesmann et al, 2009)
argument when they mentioned that uncertainty avoidance is the degree to
which an organisation strived to avoid uncertainty by relying on established
norm, rituals and bureaucratic practices. Furthermore, they said that people in
high uncertainty avoidance culture eagerly sought to decrease the probability of
unpredictable events that could adversely affect the operation of an
organisation. As discussed earlier, the mining and manufacturing is
characterised as a high uncertainty avoidance culture.
From the chi square test all p – values for questions D1 to D5 were less than
0.05 indicating there was a significant difference in the manner in which
respondents scored the questions hence showing high uncertainty avoidance
negatively impacts knowledge sharing. Hauke (2006) argued that in a low
©© UUnniivveerrssiittyy ooff PPrreettoorriiaa
88
uncertainty avoidance environment employees in an organisation are willing to
take risk, they feel more accountable for their decisions which results in better
satisfaction of achieved success and a higher self esteem. In consequence,
(Hauke, 2006, p. 8) mentioned “they build informal networks, which enables
knowledge sharing across people. These informal networks are also being built
on the basis of ongoing cooperation between different companies, which is
positively correlated with knowledge sharing process among them”. However,
from the above it was clearly evident that Samancor Chrome displayed high
uncertainty avoidance which negatively impacted knowledge sharing.
6.7. BIOGRAPHICAL DATA
The data recorded in this section reported the biographical characteristics of the
participants in the survey.
From the literature review it was identified by (Hofstede, 1991) and (Chow et al,
2000) that gender, age and work experience had a relationship on the scores of
the cultural dimensions which in turn had an impact on knowledge sharing.
Thus for the purposes of this research the biographical data was collected to
ascertain whether there was relationship in hypothesis one.
6.8. FORCED RANKING – KNOWLEDGE SHARING
In chapter 2 it was identified that several authors described the term knowledge
sharing, despite this definitional debate the researcher adopted the definition by
(Bartol & Srivistava, 2002) due to its applicability to knowledge sharing. The
©© UUnniivveerrssiittyy ooff PPrreettoorriiaa
89
forced ranking results in table 12 indicated that the most important knowledge
sharing statement to respondents was that it was a process which involved
sharing of ideas, facts, suggestions and proficiency among employees relevant
for an organisation’s performance. This result suggested that there was
consensus from the majority of the respondents on what they believed
knowledge sharing should be, which corresponds to the researcher’s choice of
the definition by (Bartol & Srivistava, 2002).
Respondents in the survey also thought that the second most important aspect
of knowledge sharing was the significant part it played in innovation, knowledge
application and ultimately the competitive advantage of the an organisation.
According to (Rivera-Vazquez et al, 2009) they were also of the opinion that it
was crucial for enterprises that wanted a competitive advantage to have good
knowledge transfer and a culture promoting knowledge sharing in an
organisation. It was also affirmed by (Calantone et al, 2002) and (Scarbrough,
2003) that the key to enhancing an organisation’s innovation performance is
knowledge sharing.
The results revealed also indicated that the respondents ranked knowledge
sharing as a voluntary act as the least important characteristic of knowledge
sharing. This demonstrated that from the employees’ experience, they felt that
the environment at Samancor Chrome is not a favourable one where sharing of
solutions between employees occurs on a voluntary basis. However in (Ford &
Chan, 2003) study between North American and Japanese employees it was
evident that knowledge sharing was a voluntary act when it came to sharing
solutions among subordinates. These conflicting views could be owing to the
©© UUnniivveerrssiittyy ooff PPrreettoorriiaa
90
South African culture accompanied by the nature of the mining and
manufacturing environment. Employees acknowledged that knowledge sharing
is an activity that involves transferring of knowledge from one individual to a
group as they ranked S1 and S3 similarly.
The analysis of the results clearly indicated that employees at Samancor
Chrome understood the significance of knowledge sharing for the organisation
and benefits thereof; however, they also acknowledged it was an added effort to
get employees to voluntarily share knowledge with others.
6.9. CHAPTER CONCLUSION
In this chapter, an interpretation of the results from chapter 5 was coupled and
an overall picture of what the results and the interpretations meant to the study
was illustrated.
Based on the results of the study the researcher identified that the biographical
data (age, gender, work experience) had no influence on the four cultural
dimensions that would impact knowledge sharing. It was apparent that there
was agreement that employees at Samancor Chrome were well aware of what
knowledge sharing was and how crucial it was for the success of the
organisation.
The impact of the cultural dimension individualism/collectivism indicated that
low individualism and high collectivism promoted knowledge sharing. It was
©© UUnniivveerrssiittyy ooff PPrreettoorriiaa
91
quite evident from the results for this study that Samancor Chrome displayed a
culture of high collectivism. All employees positively agreed that working in
groups gave better results and problem solving and also employees at
Samancor Chrome liked working in groups. This therefore suggested that low
individualism and high collectivism promoted knowledge sharing.
The impact of the cultural dimension power distance revealed that low power
distance positively impacts knowledge sharing. Employees were of the view that
they had good working relationships with their direct superiors and could share
their ideas with them. This indicated that the superior was open to new idea
generation from subordinates, thus promoting knowledge sharing. However, as
many employees that agreed that decision making occurred top down, there
were those who did not. This could be due to the fact that some employees
reported to different managers that displayed different management styles. The
results in this study concerning the power distance dimension indicated that
Samancor Chrome exhibited a low power distance culture which promoted
knowledge sharing.
The impact of the cultural dimension masculinity/feminity on knowledge sharing
showed that high feminity and low masculinity promoted knowledge sharing.
From the results, it could be seen that Samancor Chrome displayed a culture of
low masculinity and high feminity that positively impacted knowledge sharing.
Majority of the employees at Samancor Chrome understood that sharing
knowledge assisted in problem solving since expertise was shared and the
process was made more efficient, thereby adding value to the organisation.
©© UUnniivveerrssiittyy ooff PPrreettoorriiaa
92
Employees were also very secure to share knowledge and expertise with others
in the organisation. This suggested that maybe superiors displayed behaviours
which encouraged subordinates to behave similarly. Ultimately, Samancor
Chrome displayed a low masculinity and high feminity culture which promoted
knowledge sharing.
The impact of the cultural dimension uncertainty avoidance on knowledge
sharing indicated that high uncertainty avoidance negatively impacted
knowledge sharing. The results in this study indicated that Samancor Chrome
displayed a culture of high uncertainty avoidance which negatively impacted
knowledge sharing. The mining and manufacturing organisations are known for
their complex operations, robust and unsafe environments. Therefore,
employees at Samancor Chrome fully agreed that standard operating
procedures and a host of work rules were employed to handle work tasks in
their departments. A possible explanation for this was to ensure that employees
fully understood their work tasks and to avoid any harm to employees. This type
of environment inhibited knowledge sharing as it took away accountability from
employees and avoided better decision making. Samancor Chrome is shown to
have a high uncertainty avoidance culture which negatively impacts on
knowledge sharing.
Hence, it was evident that the four cultural dimensions have an impact on
knowledge sharing. The next chapter (chapter 7) will be based on the
conclusions drawn from the discussions section.
©© UUnniivveerrssiittyy ooff PPrreettoorriiaa
93
CHAPTER 7
CONCLUSION AND RECOMMENDATIONS
7.1. INTRODUCTION
This chapter focuses on the conclusions extracted from the discussion in
chapter 6. The central theme of the research was to investigate whether the
four dimensions of culture promote or impede knowledge sharing, and to
establish an understanding of employees’ perceptions on knowledge sharing.
Recommendations for addressing the relationship between culture and
knowledge sharing, will be presented.
7.2. RECOMMENDATIONS OF THE STUDY
Recommendations presented below focus on the relationship between the four
cultural dimensions and its impact on knowledge sharing based on the results of
this study.
7.2.1. Recommendations based on the Results of the Study
The results of the study clearly indicate awareness, by the employees, of what
knowledge sharing is as per forced ranking. Most of the employees at
Samancor Chrome felt that knowledge sharing was a process that involved
sharing of ideas, facts, suggestions and proficiency among employees relevant
for an organisation’s performance. However, it was detected that Samancor
Chrome employees do not believe that knowledge sharing is a voluntary act, as
©© UUnniivveerrssiittyy ooff PPrreettoorriiaa
94
it was ranked the least important. From the literature reviewed (Davenport,
1997) defined sharing as a voluntary act. This was confirmed by (Ford & Chan,
2003) when they found that sharing of solutions between subordinates in an
organisation, was predominantly a voluntary act. Hence, it is recommended that
Samancor Chrome undertake an interview process to understand why
employees in top and middle management considered knowledge sharing as a
voluntary act, as the least important.
From the study it was found that gender, age and work experience had no
influence on the four cultural dimensions and its impact on knowledge sharing,
despite the literature by (Chow et al, 2000) and (Hofstede, 2001) mentioning
that there is a relation between age, gender and work experience to the cultural
dimension scores.
The results from the study for the cultural dimension individualism/collectivism
indicate positive results suggesting that low individualism and high collectivism
promoted knowledge sharing. Hence, with Samancor Chrome displaying a
collective culture, knowledge sharing is much easier as mentioned by (Ford &
Chan, 2003). From the literature with easy knowledge sharing (Reid, 2003)
stated that opportunities will be created to maximise Samancor Chrome’s ability
to meet those needs, that provide the business with a competitive advantage.
Therefore, for Samancor Chrome to sustain this culture adequately they need to
perform an audit to identify the key knowledge sharing criteria that needs to be
monitored.
©© UUnniivveerrssiittyy ooff PPrreettoorriiaa
95
Power distance indicated positive results for this study indicating that low power
distance positively impacts knowledge sharing. From the literature, it has been
established that a low power distance decreases the gap between superior and
employees’, thus encouraging knowledge sharing due to the flow of information
in both directions (Davenport & Prusak, 1998), as seen in Samancor Chrome.
Furthermore, better team performance, a decline in production costs, firm
innovative capabilities and firm performance including sales growth is
anticipated as revealed in the literature review by (Hansen, 2002; Cummings,
2004; Arthur & Huntley, 2005; Collins & Smith, 2006; Lin, 2007; Mesmur-
Magnus & DeChurch, 2009). Hence, it is suggested that Samancor Chrome
conduct interviews with their top and middle management to better understand
their current management approach, to ensure effective future knowledge
sharing and to maintain the existing low power distance culture.
The third cultural dimension masculinity/feminity revealed positive results for
this study, indicating that low masculinity and high feminity promoted knowledge
sharing at Samancor Chrome. (Rivera-Vazquez et al, 2009) mentioned that a
culture demonstrating high feminity establishes an environment of
cooperativeness, thus making employees more secure to share their knowledge
with other colleagues and at the same time promoting knowledge sharing. With
such knowledge sharing practices (Fong & Chu, 2006) avow that employees
are more proactive in generating ideas and improving problem solving abilities
and as a result, it makes them more responsible. To maintain such a culture,
Samancor Chrome needs to investigate the constituents of a cooperative
©© UUnniivveerrssiittyy ooff PPrreettoorriiaa
96
culture, in order to have it well understood in the organisation to ensure
successful knowledge sharing.
The last cultural dimension, uncertainty avoidance in this study, indicated that
this dimension had a negative impact on knowledge sharing. The results in this
study indicated that high uncertainty avoidance impedes knowledge sharing.
From the literature reviewed (Hauke, 2006) argued that in a culture that showed
high uncertainty avoidance, employees were not willing to take risk and showed
no accountability for decisions making, thus impeding knowledge sharing.
Another inhibitor to knowledge sharing was noticeable, when they stated that
the building of informal networks was limited. However, from the literature there
was no clear indication demonstrating how to address a culture with high
uncertainty avoidance. Therefore, it is suggested that future studies in this
cultural dimension, needs to be accomplished to identify tools to reduce high
uncertainty avoidance cultures.
7.2.2. Recommendations for Future Research
� Sample Size
For purposes of this study, a sample size of only ninety-six (96) respondents
was utilised to get a sense of what the data was saying. A larger sample size
may be used to execute an extensive analysis which could improve the validity
and reliability of the results.
©© UUnniivveerrssiittyy ooff PPrreettoorriiaa
97
� Target Population
The data collection was gathered from respondents employed at the three
chrome manufacturing operations and the two mining operations. To
incorporate more employees in this research, either an in depth study within
Samancor Chrome or a comparative study with other manufacturing chrome
operations such as Xstrata and International Ferrometals, should be
undertaken.
� Data Collection Techniques
For this study, questionnaires were the primary data collection method. To
enhance the validity and reliability of results in future research, the triangular
approach using two others data collection methods should be used, for
example, focus groups and interviews.
7.3. CHAPTER CONCLUSION
Knowledge is a vital constituent in the new global economy to ensure and
sustain competitive advantage for an organisation. It is therefore an imperative
strategic route, which businesses have to undertake in order to survive and to
compete effectively in the global environment. For companies to participate
actively in the rising global economy they need to be proactive and start thinking
about ways to strategically share information and create new knowledge.
The purpose of this study was to investigate whether the four dimensions of
culture promoted or impeded knowledge sharing in an organisation. The results
©© UUnniivveerrssiittyy ooff PPrreettoorriiaa
98
from this study indicated that the theoretically introduced cultural dimensions
are relevant factors that have an impact on knowledge sharing.
This study demonstrated three of the four cultural dimensions, namely high
collectivism, low power distance and high feminity that promoted knowledge
sharing. However, the study indicated that Samancor Chrome displayed a high
uncertainty avoidance culture thus impeding knowledge sharing.
The findings of this research suggests that there is an advantage for
organisations to know what type of culture they have in order to facilitate
knowledge sharing, in an attempt to sustain competitive advantage.
©© UUnniivveerrssiittyy ooff PPrreettoorriiaa
99
REFERENCE LIST
Alavi, M., & Leidner, D. (2001). Knowledge management and knowledge
management systems: conceptual foundations and research issues. MISQ
Review , 25 (1), 107-136.
Ardichvili, A., Maurer, M., Li, W., Wentling, T., & Stuedemann, R. (2006).
Cultural influences on knowledge sharing through online communities of
practice. Journal of Knowledge Managment , 10 (1), 94-107.
Arthur, J. B., & Huntley, C. L. (2005). Ramping up the Organisational Curve:
Assessing the Impact of Deliberate Learning on Organisational Performance
under Gainsharing. Academy of Management Journal , 48 (6), 1159-1170.
Bartol, K., & Srivistava, A. (2002). Encouraging knowledge sharing: the role of
organisational reward systems. Journal of Leadership & Organisational Studies
, 9 (1), 64-76.
Bhagat, R. S., Kedia, B. L., Harveston, P. D., & Triandis, H. C. (2002). Cultural
Variations in the Cross-Border Transfer of Organisational Knowledge: An
Intergrative Framework. The Academy of Management Review , 27 (2), 204-
221.
Bircham, H. (2003). The impact of question structure when sharing knowledge.
Electronic Journal of Knowledge Management , 1 (2), 17-24.
Bock, G. W., & Kim, Y.-G. (2002). Breaking the Myths of Rewards: An
Exploratory Study of Attitudes about Knowledge Sharing. Information
Resources Management Journal , 15 (2), 14-21.
Burke, M. E. (2010, February). Emerald. Retrieved May 18, 2010, from
http://www.emeraldinsight.com/products/journals/call_for_papers.htm?id=2000&
PHPSESSID=76f93j1pqi2rdfauic8b2tbra2`
Calantone, R. J., Cavusgil, S. T., & Zhao, Y. (2002). Learning Orientation, firm
innovation capability, and firm performance. Industrial Marketing Management ,
31 (6), 515-524.
©© UUnniivveerrssiittyy ooff PPrreettoorriiaa
100
CEN (European Committee of Standardisation). (2004). Retrieved February 22,
2010, from European guide to good practice in Knowledge management - Part
5: KM Terminology:
http://ww.cen.eu/cen/Sectors/Sectors/ISSS/CEN%20Workshop%20Agreements
/Pages/Knowledge%20Management.aspx
Chow, C. W., Deng, F. J., & Ho, J. L. (2000). The Openness of Knowledge
Sharing within Organisations: A Comparative Study of the United States and the
People's Republic of China. Journal of Management Accounting Research , 12,
65-95.
Ciganek, A. P., Mao, E., & Srite, M. (2008). Organisational Culture for
Knowledge Management Systems: A Study of Corporate Users. International
Journal of Knowledge Management , 4 (1), 1-16.
Collins, C. J., & Smith, K. G. (2006). Knowledge Exchange and Combination:
The role of Human Resource Practices in the Performance of High Technology
Firms. Academy of Management Journal , 49 (3), 544-560.
Cooper, D. R., & Schindler, P. S. (2001). Business Research Methods (7th ed.).
New York: McGraw Hill.
Cummings, J. N. (2004). Work Groups, Structural Diversity, and Knowledge
Sharing in a Global Organisation. Management Science , 50 (3), 352-364.
Davenport, T. H. (1997). Information Ecology. Oxford: Oxford University Press.
Davenport, T. H., & Prusak, L. (1998). Working knowledge: how organisation
manage what they know. Boston, MA.
De Long, D. W., & Fahey, L. (2000). Diagnosing Cultural Barriers to Knowledge
Management. The Academy of Management Executive , 14 (4), 113-127.
Drucker, P. (2001, November). The next society: a survey of the near future.
Retrieved February 23, 2010, from The Economist: http://www.economist.com
Fong, P. S., & Chu, L. (2006). Exploratory Study of Knowledge Sharing in
Contracting Companies: A Sociotechnical Perspective. Journal of Construction
Engineering and Management , 132 (9), 928-939.
©© UUnniivveerrssiittyy ooff PPrreettoorriiaa
101
Ford, D. P., & Chan, Y. E. (2003). Knowledge sharing in a multi-cultural setting:
a case study. Knowledge Management Research & Practice , 1 (1), 11-27.
Gold, A., Malhotra, A., & Segars, A. (2001). Knowledge management: An
organisational capabilities perspective. Journal of Management Information
Systems , 18 (1), 185-214.
Gupta, A. K., & Govindarajan, V. (2000). Knowledge Flows within Multinational
Corporations. Strategic Management Journal , 21, 473-496.
Hansen, M. T. (2002). Knowledge Networks: Explaining Effective Knowledge
Sharing in Multiunit Companies. Organisation Science , 13 (3), 232-248.
Harris, R. (2001). The knowledge-based economy: intellectual origins and new
economic perspectives. International Journal of Management Reviews , 3 (1),
21-40.
Hauke, A. (2006, April). The Fondazione Eni Enrico Mattei Note di Lavoro
Series Index. Retrieved April 05, 2010, from
http://www.feem.it/Feem/Pub/Publications/WPapers/default.htm
Hofstede, G. (1980). Culture's Consequences: International Differences in
Work-Related Values. Beverly Hills: Sage Publications.
Hofstede, G. (1983). The cultural relativity organisational practices and theories.
Journal of International Business Studies , 14 (2), 75-89.
Hofstede, G., & Bond, M. H. (1988). The Confucius Connection: From Cultural
Roots to Economic Growth. Organisational Dynamics , 16 (4), 4-21.
Hofstede, G. (1991). Cultures and Organisations: Software of the Mind. New
York: McGraw-Hill.
Hofstede, G. (2001). Culture's Consequences: Comparing Values, Behaviours,
Institutions, and Organisations across Nations. Thousands Oaks: Sage
Publications.
©© UUnniivveerrssiittyy ooff PPrreettoorriiaa
102
Hussey, J., & Hussey, R. (1997). Business Research: A Practical Guide for
Undergraduate and Post Graduate Students. Great Britain: Macmillan Press
Ltd.
Hutchings, K., & Michailova, S. (2004). Facilitating knowledge sharing in
Russian and Chinese subsidiaries: the role of personal networks and group
membership. Journal of Knowledge Management , 8 (2), 84-94.
Ipe, M. (2003). Knowledge Sharing in Organisations: A Conceptual Framework.
Human Resources Development Review , 2 (4), 337-359.
Jackson, S. E., Chuang, C.-H., Harden, E. E., & Jiang, Y. (2006). Toward
Developing Human Resource Management Systems for Knowledge-Intensive
Teamwork. Research in Personnel and Human Resources Management , 25,
27-70.
Kang, Y.-J., Kim, S.-E., & Chang, G.-W. (2008). The Impact of Knowledge
Sharing on Work Performance: An Empirical Analysis of Public Employees'
Perceptions in South Korea. International Journal of Public Administration , 31,
1548-1568.
King, N., Kruger, N., & Pretorius, J. (2007). Knowledge management in a
multicultural environment: A South African Perspective. New Information
Perspectives , 59 (3), 285-299.
Lee, J.-N. (2001). The impact of knowledge sharing, organisational capability
and partnership quality on IS outsourcing success. Information and
Management , 38, 323-335.
Lemon, M., & Sahota, P. S. (2003). Organisational Culture as a Knowledge
Repository for Increased Innovative Capacity. Retrieved August 8, 2010, from
http://0-
www2.warwick.ac.uk.innopac.up.ac.za/fac/soc/wbs/conf/olkc/archive/oklc3/pape
rs/id88.pdf
Lin, H.-F. (2007). Knowledge Sharing and Firm Innovation Capability: an
empirical study. International Journal of Manpower , 28 (3/4), 315-332.
©© UUnniivveerrssiittyy ooff PPrreettoorriiaa
103
Lucas, L. M. (2006). The role of culture on knowledge transfer: the case of the
multinational corporation. The Learning Organisation , 13 (3), 257-275.
McDermott, R., & O'Dell, C. (2001). Overcoming cultural barriers to sharing
knowledge. Journal of Knowledge Management , 5 (1), 76-85.
Mesmur-Magnus, J. R., & DeChurch, L. A. (2009). Information Sharing and
Team Performance: A Meta-Analysis. Journal of Applied Psychology , 94 (2),
535-546.
Michailova, S., & Husted, K. (2003). Knowledge-Sharing Hostility in Russian
Firms. California Management Review , 45 (3), 59-77.
Minbaeva, D. B. (2007). Knowledge Transfer in Multinational Corporations.
Management International Review , 47 (4), 567-593.
Nayır, D. Z., & Uzunçarşılı, Ü. (2008). A cultural perspective on knowledge
management: the success story of Sarkuysan Company. Journal of Knowledge
Management , 12 (2), 141-155.
Ndlela, L. T., & du Toit, A. S. (2001). Establishing a knowledge management
programme for a competitive advantage in an enterprise. International Journal
of Information Management , 21 (2), 151-165.
Nonaka, I. (1994). A dynamic theory of organisational knowledge creation.
Organisation Science , 5 (1), 14-37.
Park, H., Ribiere, V., & Schulte, W. D. (2004). Critical attributes of
organisational culture that promote knowledge management technology
implementation success. Journal of Knowledge Management , 8 (3), 106-117.
Reid, F. (2003). Creating a knowledge sharing culture among diverse business
units. Employment Relations Today , 30 (3), 43-49.
Riesenberger, J. R. (1998). Executive Insights: Knowledge - The Source of
Sustainable Competitive Advantage. Journal of International Marketing , 6 (3),
94-107.
©© UUnniivveerrssiittyy ooff PPrreettoorriiaa
104
Rivera-Vazquez, J. C., Ortiz-Fournier, L. V., & Flores, F. R. (2009). Overcoming
cultural barriers for innovation and knowledge sharing. Journal of Knowledge
Management , 13 (5), 257-270.
Saunders, M., Lewis, P., & Thornhill, A. (2003). Research Methods for Business
Students 3rd Edition. England: Prentice Hall.
Scarbrough, H. (2003). Knowledge Management, HRM and innovation process.
International Journal of Manpower , 24 (5), 501-516.
Sekaran, U. (2003). Research Methods for Business A Skill Building Approach
(4th Edition ed.). New Jersey: John Wiley & Sons, Inc.
Tong, J., & Mitra, A. (2009). Chinese cultural influences on knowledge
management practice. Journal of Knowledge Management , 13 (2), 49-62.
Triandis, H. (1995). Individualism and Collectivism. Boulder: CO: Westview
Press.
Triandis, H. C. (1996). The Psychological Measurment of Cultural Syndromes.
American Psychological Association , 51 (4), 407-415.
Usoro, A., & Kuofie, M. H. (2006). Conceptualisation of Cultural Dimensions as
a Major Influence on Knowledge Sharing. International Journal of Knowledge
Management , 2 (2), 16-25.
Wei, J., Stankosky, M., Calabrese, F., & Lu, L. (2008). A Framework for
studying the impact of national culture on knowledge sharing motivation in
virtual teams. Journal of Information and Knowledge Management Systems , 38
(2), 221-231.
Wilkesmann, U., Fischer, H., & Wilkesmann, M. (2009). Cultural characteristics
of knowledge transfer. Journal of Knowledge Management , 13 (6), 464-477.
Zakaria, N., Amelinckx, A., & Wilemon, D. (2004). Working Together Apart?
Building a Knowledge-Sharing Culture for Global Virtual Teams. Creativity and
Innovation Management , 13 (1), 15-29.
©© UUnniivveerrssiittyy ooff PPrreettoorriiaa
105
Zikmund, W. G. (2003). Business Research Methods (7th Edition ed.). Ohio:
South-Western CENGAGE Learning.
©© UUnniivveerrssiittyy ooff PPrreettoorriiaa
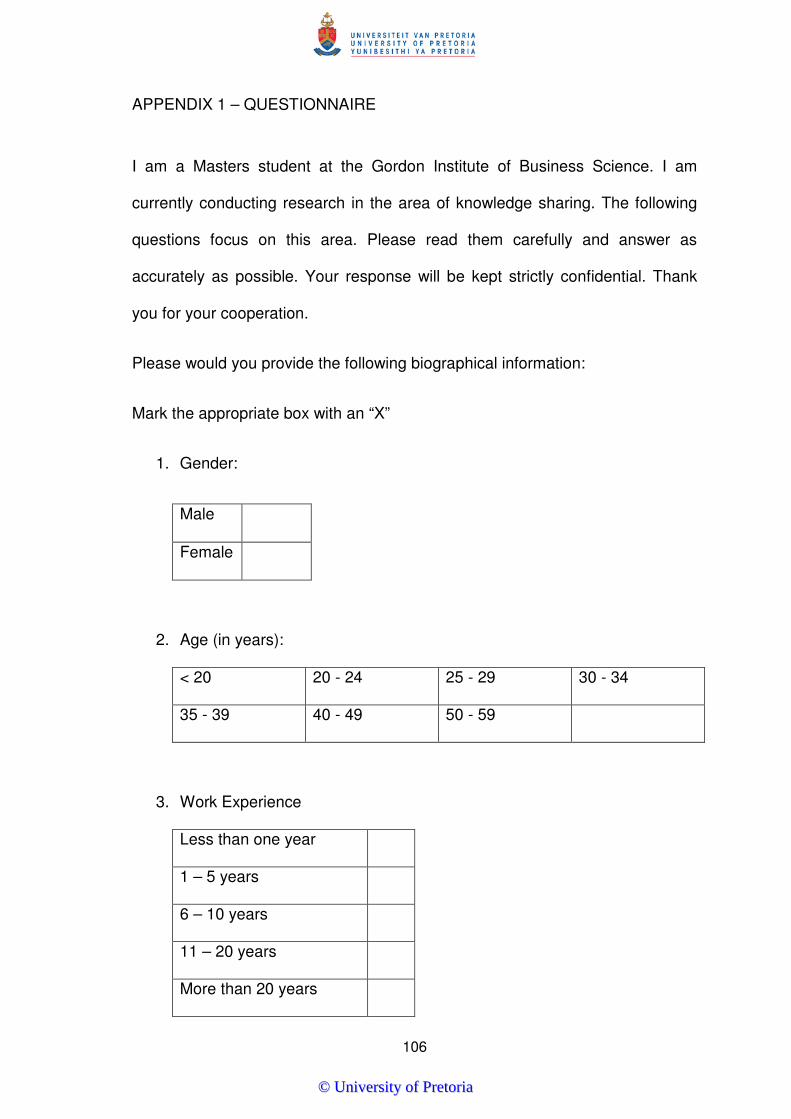
106
APPENDIX 1 – QUESTIONNAIRE
I am a Masters student at the Gordon Institute of Business Science. I am
currently conducting research in the area of knowledge sharing. The following
questions focus on this area. Please read them carefully and answer as
accurately as possible. Your response will be kept strictly confidential. Thank
you for your cooperation.
Please would you provide the following biographical information:
Mark the appropriate box with an “X”
1. Gender:
Male
Female
2. Age (in years):
< 20 20 - 24 25 - 29 30 - 34
35 - 39 40 - 49 50 - 59
3. Work Experience
Less than one year
1 – 5 years
6 – 10 years
11 – 20 years
More than 20 years
©© UUnniivveerrssiittyy ooff PPrreettoorriiaa
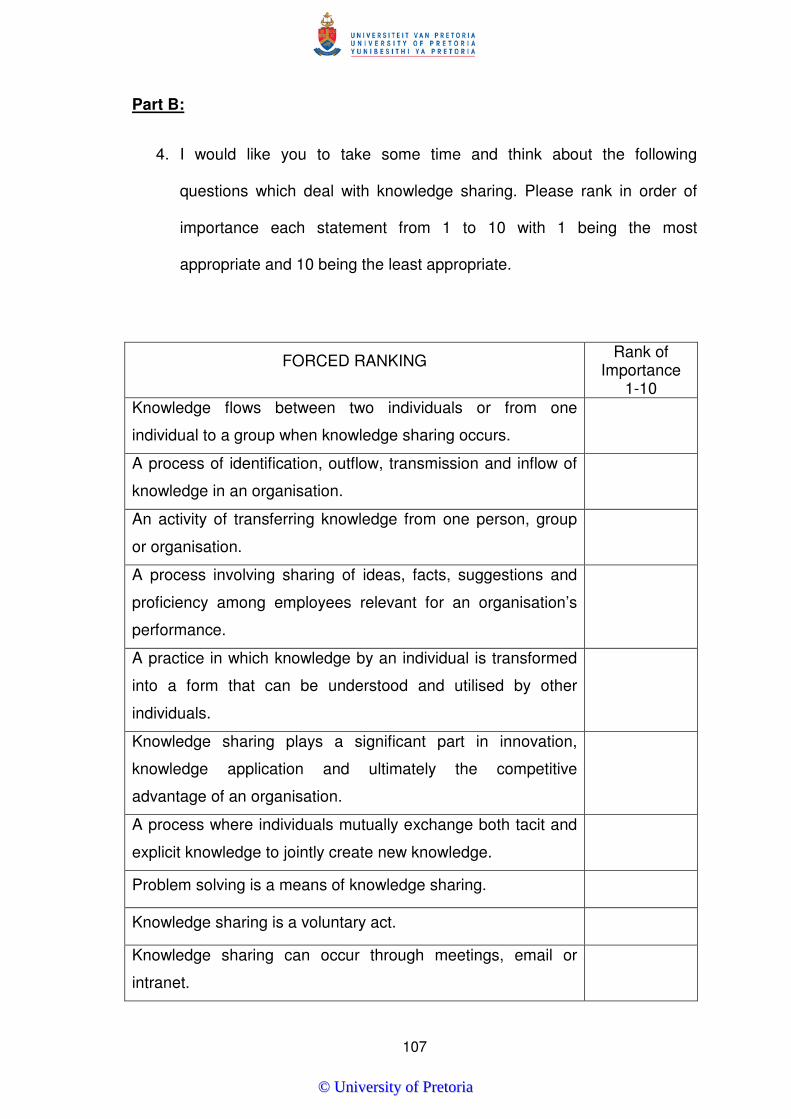
107
Part B:
4. I would like you to take some time and think about the following
questions which deal with knowledge sharing. Please rank in order of
importance each statement from 1 to 10 with 1 being the most
appropriate and 10 being the least appropriate.
FORCED RANKING Rank of
Importance 1-10
Knowledge flows between two individuals or from one
individual to a group when knowledge sharing occurs.
A process of identification, outflow, transmission and inflow of
knowledge in an organisation.
An activity of transferring knowledge from one person, group
or organisation.
A process involving sharing of ideas, facts, suggestions and
proficiency among employees relevant for an organisation’s
performance.
A practice in which knowledge by an individual is transformed
into a form that can be understood and utilised by other
individuals.
Knowledge sharing plays a significant part in innovation,
knowledge application and ultimately the competitive
advantage of an organisation.
A process where individuals mutually exchange both tacit and
explicit knowledge to jointly create new knowledge.
Problem solving is a means of knowledge sharing.
Knowledge sharing is a voluntary act.
Knowledge sharing can occur through meetings, email or
intranet.
©© UUnniivveerrssiittyy ooff PPrreettoorriiaa
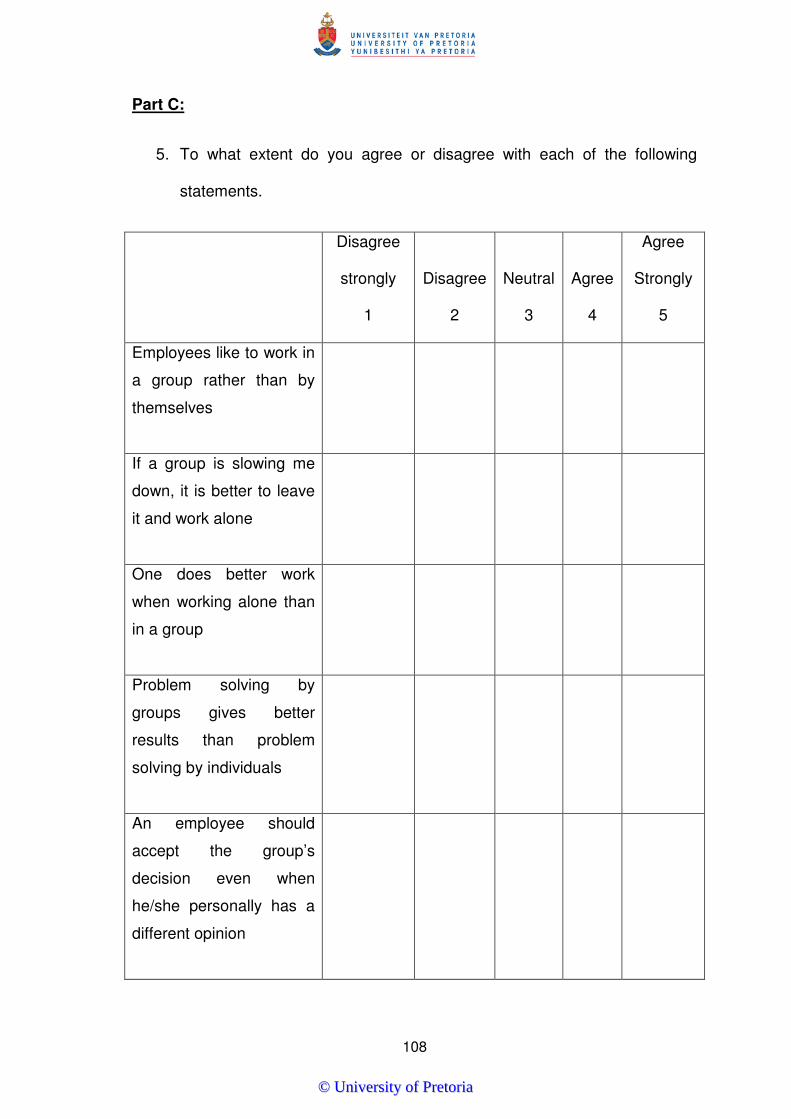
108
Part C:
5. To what extent do you agree or disagree with each of the following
statements.
Disagree
strongly
1
Disagree
2
Neutral
3
Agree
4
Agree
Strongly
5
Employees like to work in
a group rather than by
themselves
If a group is slowing me
down, it is better to leave
it and work alone
One does better work
when working alone than
in a group
Problem solving by
groups gives better
results than problem
solving by individuals
An employee should
accept the group’s
decision even when
he/she personally has a
different opinion
©© UUnniivveerrssiittyy ooff PPrreettoorriiaa
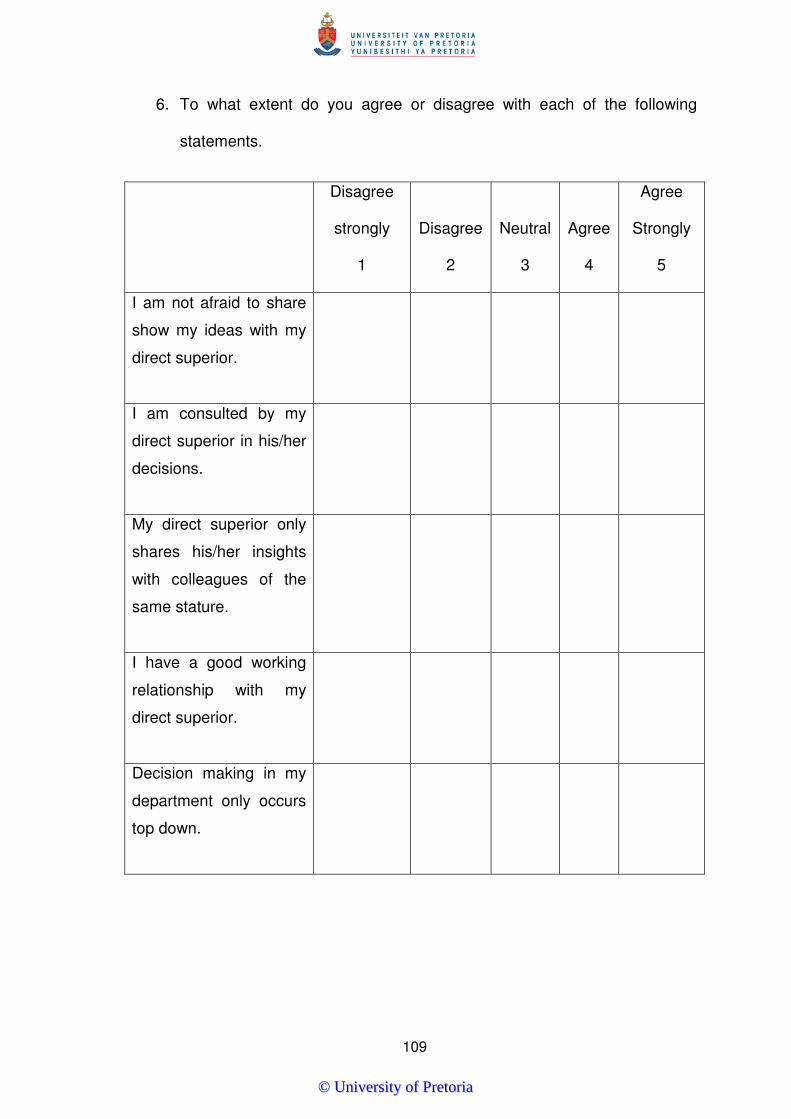
109
6. To what extent do you agree or disagree with each of the following
statements.
Disagree
strongly
1
Disagree
2
Neutral
3
Agree
4
Agree
Strongly
5
I am not afraid to share
show my ideas with my
direct superior.
I am consulted by my
direct superior in his/her
decisions.
My direct superior only
shares his/her insights
with colleagues of the
same stature.
I have a good working
relationship with my
direct superior.
Decision making in my
department only occurs
top down.
©© UUnniivveerrssiittyy ooff PPrreettoorriiaa
110
7. To what extent do you agree or disagree with each of the following
statements.
Disagree
strongly
1
Disagree
2
Neutral
3
Agree
4
Agree
Strongly
5
Competition between
employees usually does
more harm than good.
Everyone is paranoid that
someone else can do the
job better and quicker so
there is very little
knowledge sharing.
I am secure to share my
knowledge with others in
the organisation.
I am selfish and do not
share my expertise with
others in the organisation.
My knowledge sharing will
help others in the
organisation to solve
problems.
©© UUnniivveerrssiittyy ooff PPrreettoorriiaa
111
8. To what extent do you agree or disagree with each of the following
statements.
Disagree
strongly
1
Disagree
2
Neutral
3
Agree
4
Agree
Strongly
5
My organisation is very
much in “status quo” and
takes the “do not rock the
boat” approach to
management style.
I often feel nervous or
tense at work
Adopting something new
in the organisation is seen
as risky and having the
potential to create
significant problems.
There is a standard
operating procedure in
handling work tasks in my
department.
A host of work rules spell
out ways to handle work
tasks in my department.
Thank you for participating in this questionnaire. Please be assured that your
responses will remain anonymous.
©© UUnniivveerrssiittyy ooff PPrreettoorriiaa