Embed Size (px)
Citation preview
THE IMPACT OF ESTABLISHING INTERNET
EXCHANGE POINTS
ITU REGIONAL SEMINAR ON COSTS AND TARIFFS FOR MEMBER
COUNTRIES OF THE REGIONAL GROUP FOR AFRICA
Presented by:
Michuki Mwangi
Sr. Development Manager Africa & Middle East
Internet Society
Agenda
• Interconnection Analogy
• Overview of Africa’s Interconnection Infrastructure
• Addressing Africa’s Internet Transit deficit
• The Impact of IXPs in Africa
• Conclusion
ITU SG3RG-AFR 8
- 9 May 2012,
Cotonou
As communication is essential for trade, an increase in trade
also increases the demand for communication. For the same
reason, improving telecommunications infrastructure and
reducing costs leads to higher growth in trading than in non-
trading sectors. Dr. Bruckner (ITU/ESCAP/WTO Joint Seminar
on Telecommunication and Trade Issues Bangkok, 28-30 October
2003)
ITU SG3RG-AFR 8
- 9 May 2012,
Cotonou
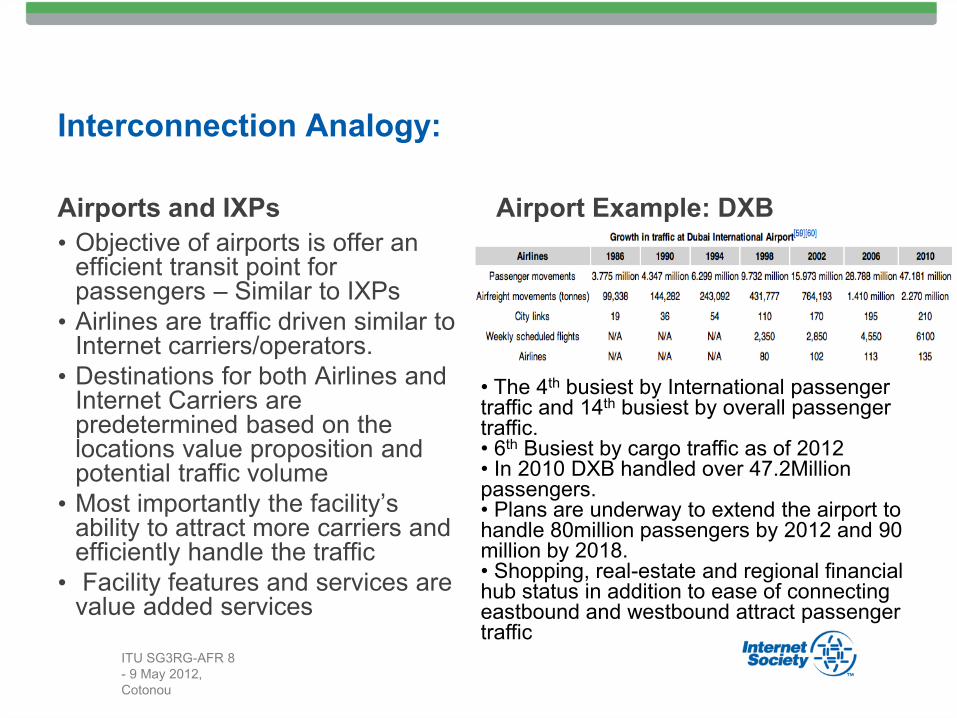
Interconnection Analogy:
Airports and IXPs
• Objective of airports is offer an efficient transit point for passengers – Similar to IXPs
• Airlines are traffic driven similar to Internet carriers/operators.
• Destinations for both Airlines and Internet Carriers are predetermined based on the locations value proposition and potential traffic volume
• Most importantly the facility’s ability to attract more carriers and efficiently handle the traffic
• Facility features and services are value added services
Airport Example: DXB
• The 4th busiest by International passenger traffic and 14th busiest by overall passenger traffic. • 6th Busiest by cargo traffic as of 2012 • In 2010 DXB handled over 47.2Million passengers. • Plans are underway to extend the airport to handle 80million passengers by 2012 and 90 million by 2018. • Shopping, real-estate and regional financial hub status in addition to ease of connecting eastbound and westbound attract passenger traffic
ITU SG3RG-AFR 8
- 9 May 2012,
Cotonou
Overview of IXPs around the world
ATU Workshop 5 -
7 March 2012,
Ouagadougou
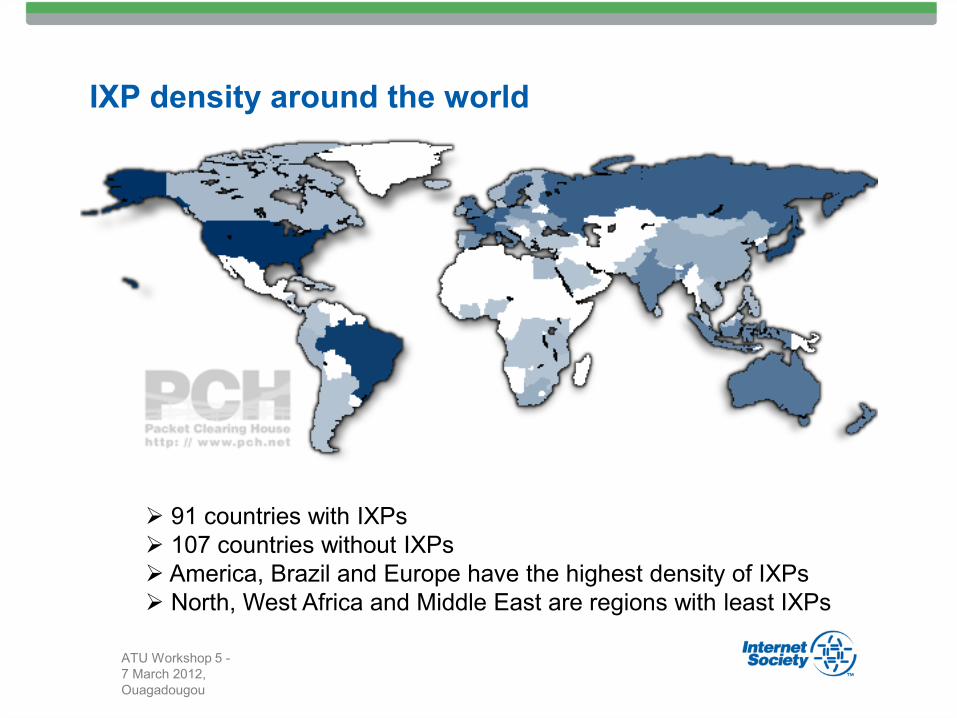
IXP density around the world
ATU Workshop 5 -
7 March 2012,
Ouagadougou
91 countries with IXPs
107 countries without IXPs
America, Brazil and Europe have the highest density of IXPs
North, West Africa and Middle East are regions with least IXPs
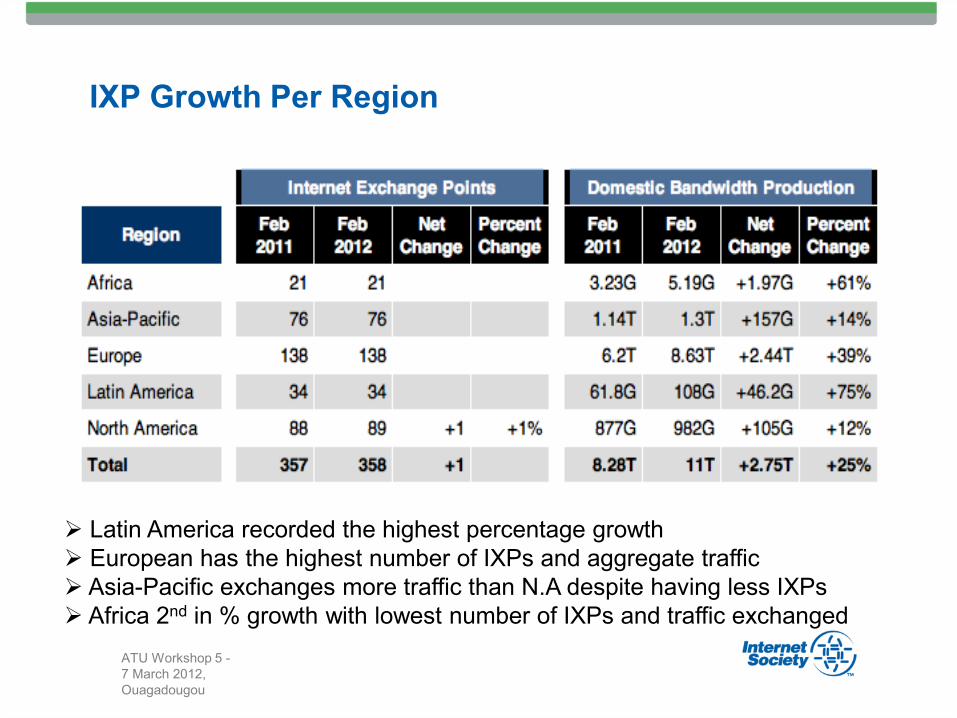
IXP Growth Per Region
ATU Workshop 5 -
7 March 2012,
Ouagadougou
Latin America recorded the highest percentage growth
European has the highest number of IXPs and aggregate traffic
Asia-Pacific exchanges more traffic than N.A despite having less IXPs
Africa 2nd in % growth with lowest number of IXPs and traffic exchanged
Summary of North America IXP
• Due to the history of the Internet and the US the first IXP’s known as Federal Internet Exchanges (FIX) East and West were built in 1989 under the NSFNET
• Soon after the first Commercial Internet Exchange (CIX) was built on the West Coast.
• In 1990 the 1st commercial IXP Metropolitan Area East (MAE) on the East Cost (Wash. DC)
• Thereafter the NSFNET awarded contracts for the running of 4 Network Access Points (NAPs)
• Over the years traffic reduced from the NAPs to Private Interconnections
• There 89 IXPs in the US today most of which are commercially operated.
• Most of there IXPs are owned and operated by Data-Center companies
ATU Workshop 5 -
7 March 2012,
Ouagadougou
Summary of Latin America & Caribbean IXPs
• The LAC region is as diverse as the Asia-Pacific region.
• The IXPs are commonly referred to as Network Access Points
(NAPs)
• Brazil and Argentina are the most developed in the region.
• Brazil has the highest number of IXPs with 9 run by PTT metro a
non-profit organization supported by the CGI
• Policy and regulations vary from one country to another for
instance Chile requires each IP operator connect to a NAP
• Regional connectivity for the region happens mostly in Miami,
USA following historical reasons
• The Caribbean Islands of Haiti and Netherlands Antilles have
IXPs.
ATU Workshop 5 -
7 March 2012,
Ouagadougou
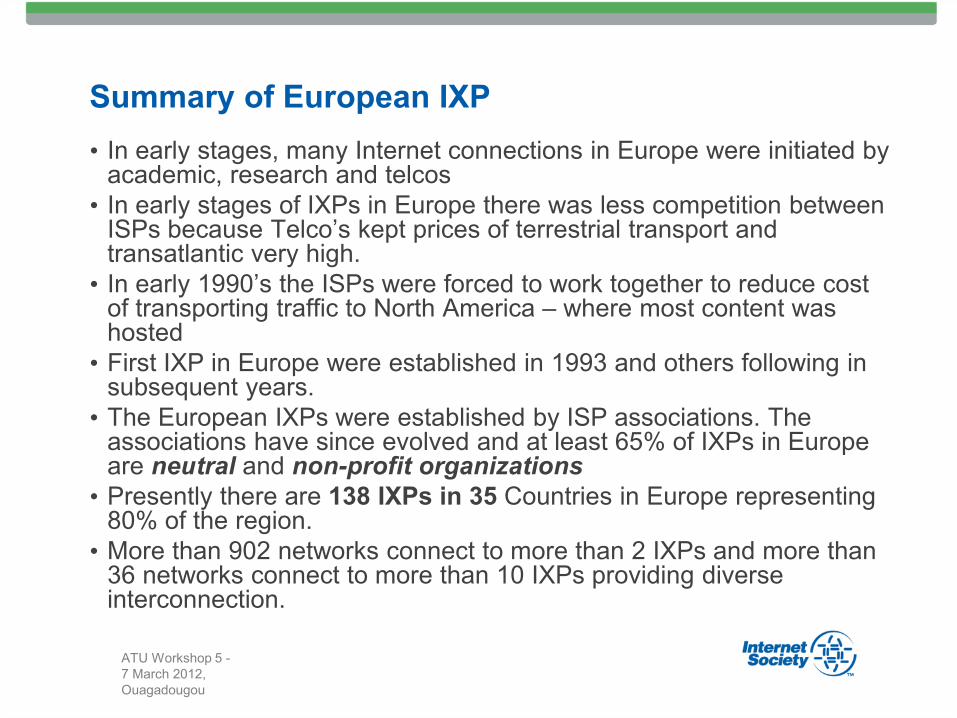
Summary of European IXP
• In early stages, many Internet connections in Europe were initiated by academic, research and telcos
• In early stages of IXPs in Europe there was less competition between ISPs because Telco’s kept prices of terrestrial transport and transatlantic very high.
• In early 1990’s the ISPs were forced to work together to reduce cost of transporting traffic to North America – where most content was hosted
• First IXP in Europe were established in 1993 and others following in subsequent years.
• The European IXPs were established by ISP associations. The associations have since evolved and at least 65% of IXPs in Europe are neutral and non-profit organizations
• Presently there are 138 IXPs in 35 Countries in Europe representing 80% of the region.
• More than 902 networks connect to more than 2 IXPs and more than 36 networks connect to more than 10 IXPs providing diverse interconnection.
ATU Workshop 5 -
7 March 2012,
Ouagadougou
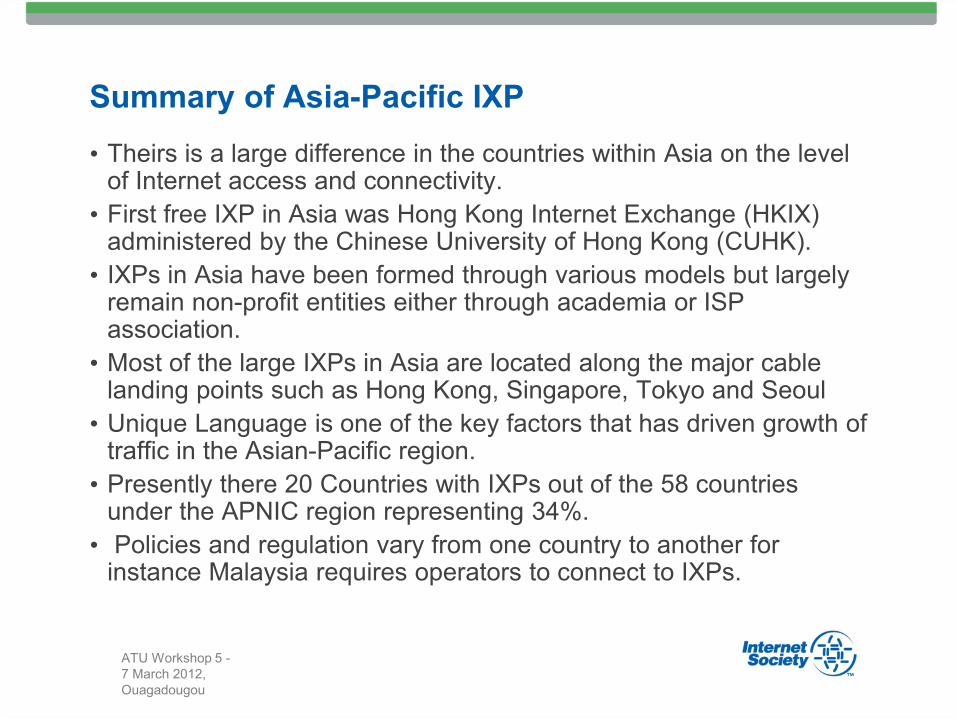
Summary of Asia-Pacific IXP
• Theirs is a large difference in the countries within Asia on the level of Internet access and connectivity.
• First free IXP in Asia was Hong Kong Internet Exchange (HKIX) administered by the Chinese University of Hong Kong (CUHK).
• IXPs in Asia have been formed through various models but largely remain non-profit entities either through academia or ISP association.
• Most of the large IXPs in Asia are located along the major cable landing points such as Hong Kong, Singapore, Tokyo and Seoul
• Unique Language is one of the key factors that has driven growth of traffic in the Asian-Pacific region.
• Presently there 20 Countries with IXPs out of the 58 countries under the APNIC region representing 34%.
• Policies and regulation vary from one country to another for instance Malaysia requires operators to connect to IXPs.
ATU Workshop 5 -
7 March 2012,
Ouagadougou
Overview of Africa’s Interconnection
Infrastructure
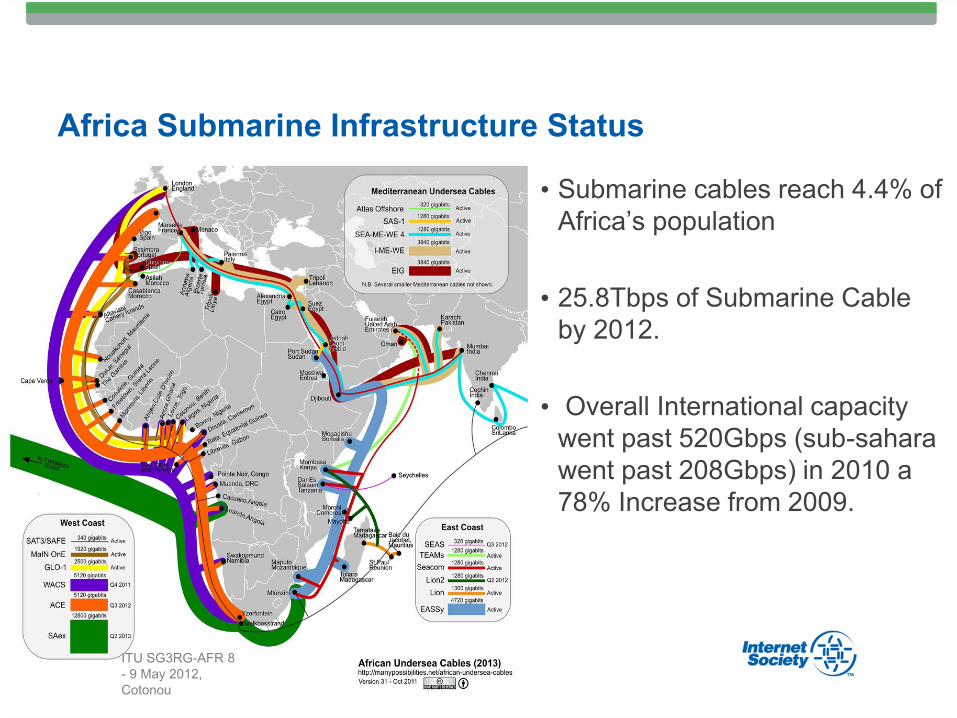
Africa Submarine Infrastructure Status
• Submarine cables reach 4.4% of
Africa’s population
• 25.8Tbps of Submarine Cable
by 2012.
• Overall International capacity
went past 520Gbps (sub-sahara
went past 208Gbps) in 2010 a
78% Increase from 2009.
ITU SG3RG-AFR 8
- 9 May 2012,
Cotonou
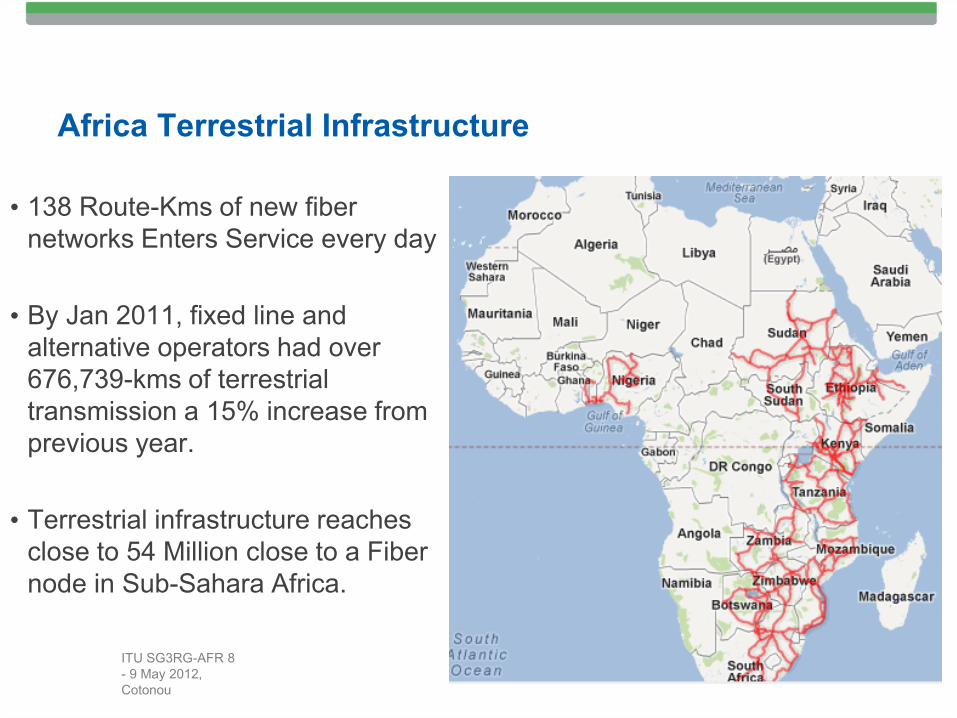
Africa Terrestrial Infrastructure
• 138 Route-Kms of new fiber
networks Enters Service every day
• By Jan 2011, fixed line and
alternative operators had over
676,739-kms of terrestrial
transmission a 15% increase from
previous year.
• Terrestrial infrastructure reaches
close to 54 Million close to a Fiber
node in Sub-Sahara Africa.
ITU SG3RG-AFR 8
- 9 May 2012,
Cotonou
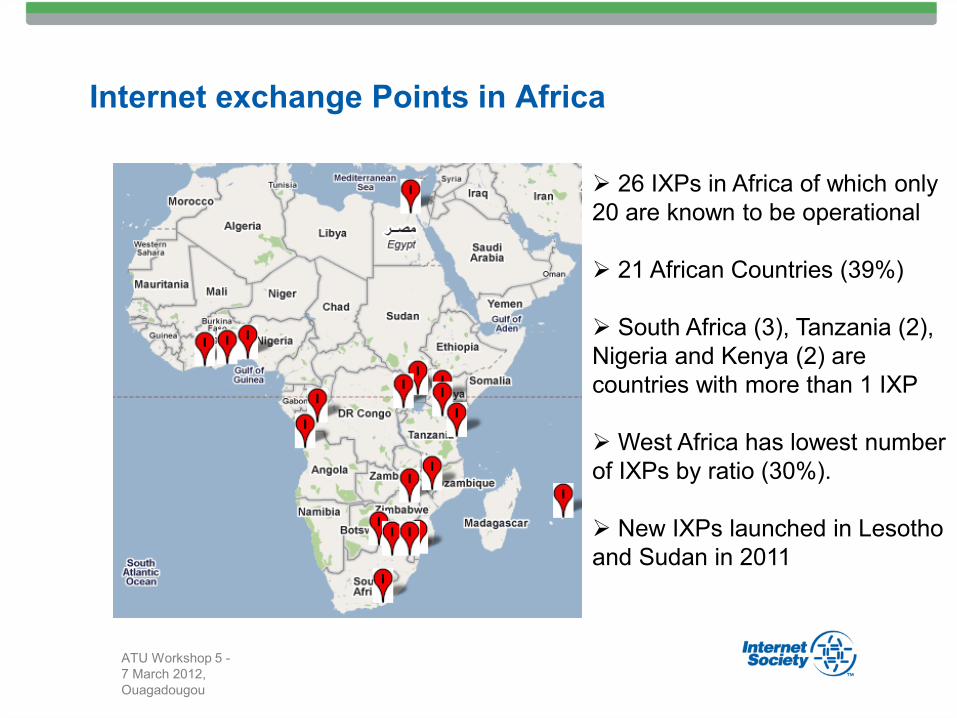
Internet exchange Points in Africa
ATU Workshop 5 -
7 March 2012,
Ouagadougou
26 IXPs in Africa of which only
20 are known to be operational
21 African Countries (39%)
South Africa (3), Tanzania (2),
Nigeria and Kenya (2) are
countries with more than 1 IXP
West Africa has lowest number
of IXPs by ratio (30%).
New IXPs launched in Lesotho
and Sudan in 2011
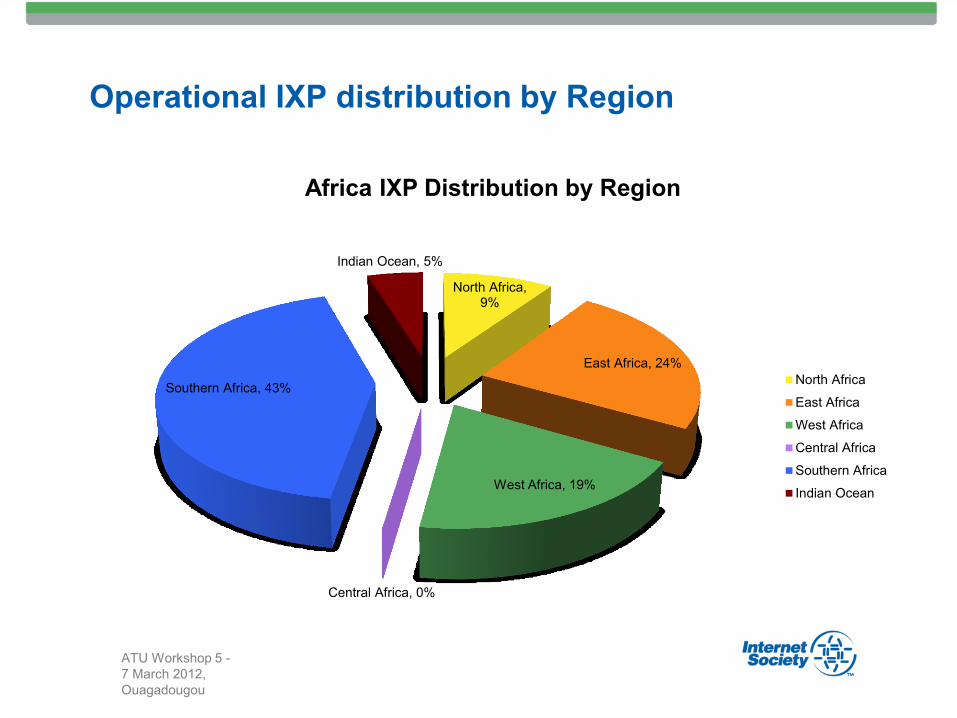
Operational IXP distribution by Region
ATU Workshop 5 -
7 March 2012,
Ouagadougou
North Africa, 9%
East Africa, 24%
West Africa, 19%
Central Africa, 0%
Southern Africa, 43%
Indian Ocean, 5%
Africa IXP Distribution by Region
North Africa
East Africa
West Africa
Central Africa
Southern Africa
Indian Ocean
ITU SG3RG-AFR 8
- 9 May 2012,
Cotonou
The Regional Interconnection Challenge
Despite the growth in regional submarine, terrestrial
cables and Internet Exchange Points;
Routing policies continue to follow the satellite topology
For instance traffic from Rwanda a landlocked country in East Africa to
Nairobi, Kenya goes via London despite the fact that the Submarine
cable transit points are in Port city of Mombasa in Kenya
ITU SG3RG-AFR 8
- 9 May 2012,
Cotonou
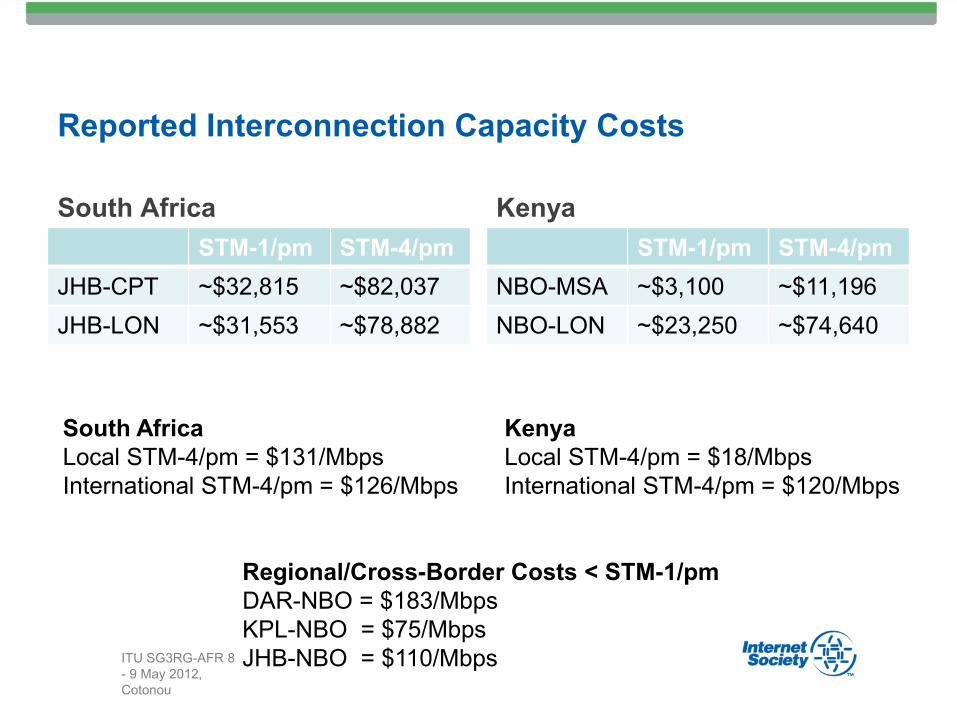
Reported Interconnection Capacity Costs
South Africa
STM-1/pm STM-4/pm
JHB-CPT ~$32,815 ~$82,037
JHB-LON ~$31,553 ~$78,882
Kenya
STM-1/pm STM-4/pm
NBO-MSA ~$3,100 ~$11,196
NBO-LON ~$23,250 ~$74,640
South Africa
Local STM-4/pm = $131/Mbps
International STM-4/pm = $126/Mbps
Kenya
Local STM-4/pm = $18/Mbps
International STM-4/pm = $120/Mbps
Regional/Cross-Border Costs < STM-1/pm
DAR-NBO = $183/Mbps
KPL-NBO = $75/Mbps
JHB-NBO = $110/Mbps ITU SG3RG-AFR 8
- 9 May 2012,
Cotonou
Content Hosting & Infrastructure
• Africa has an estimated 84,000 square meters of raised floor
data center capacity or 39% of London’s capacity is 215,000
square meters (by end 2011)
• South Africa remains the most developed data market
• Content flight due to lack of competitive hosting solutions
• Building Carrier Neutral Datacenters is important to enhance the
reliability of hosting services
• Most of the hosting infrastructure available are in ISP data-
centers and is not well developed.
• Mains power supply and reliability is the major challenge to
large data center development
ATU Workshop 5 -
7 March 2012,
Ouagadougou
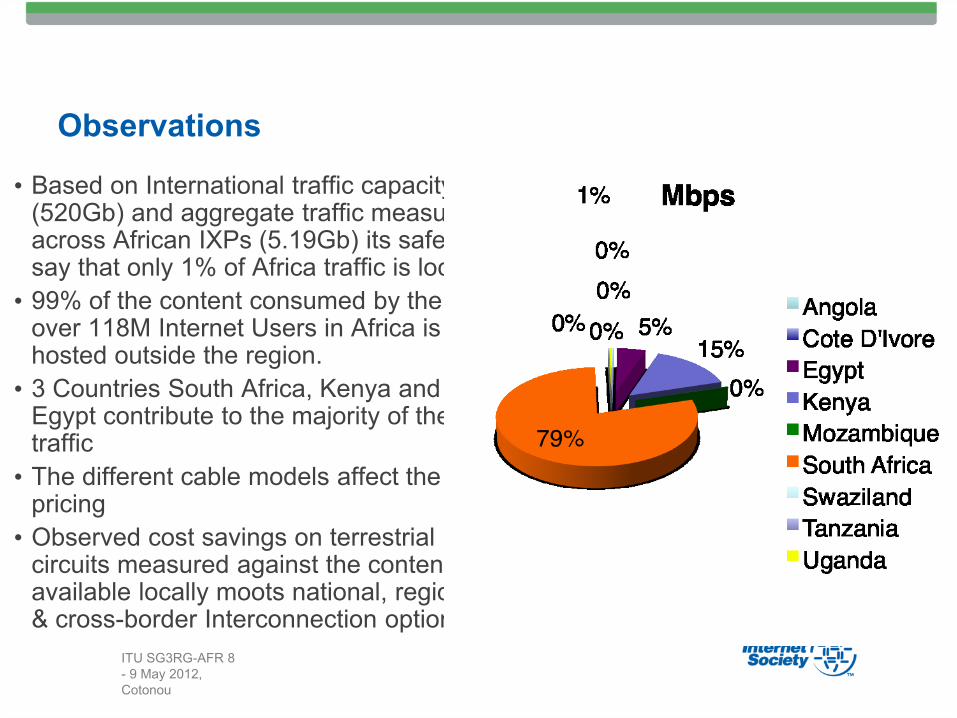
Observations
• Based on International traffic capacity (520Gb) and aggregate traffic measured across African IXPs (5.19Gb) its safe to say that only 1% of Africa traffic is local.
• 99% of the content consumed by the over 118M Internet Users in Africa is hosted outside the region.
• 3 Countries South Africa, Kenya and Egypt contribute to the majority of the traffic
• The different cable models affect the pricing
• Observed cost savings on terrestrial circuits measured against the content available locally moots national, regional & cross-border Interconnection options.
ITU SG3RG-AFR 8
- 9 May 2012,
Cotonou

Addressing Africa’s Internet Transit
Deficit
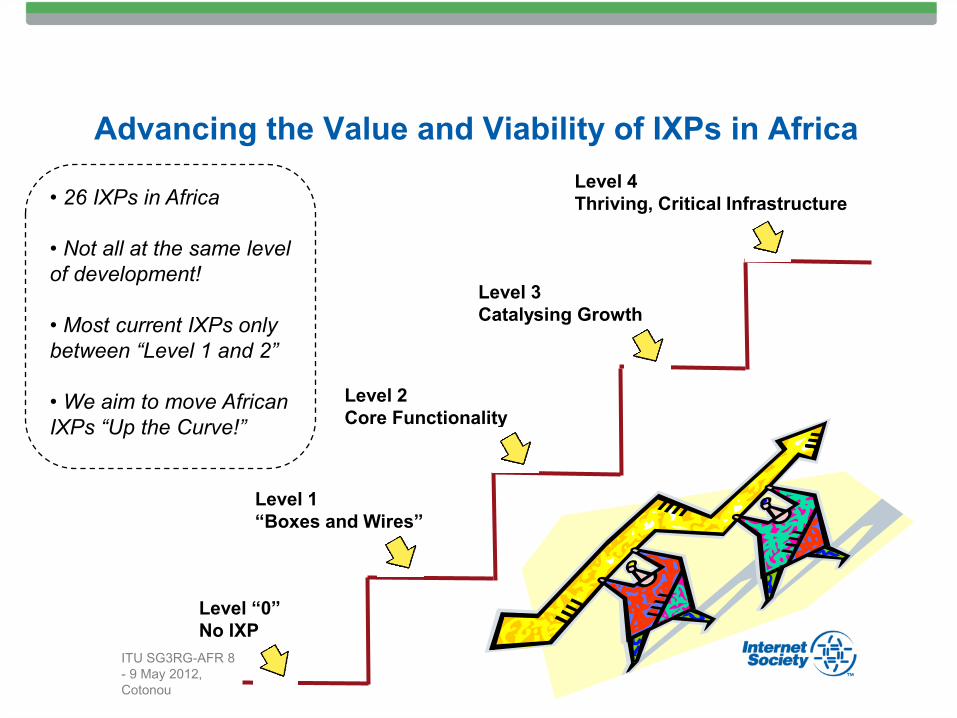
Advancing the Value and Viability of IXPs in Africa
Level “0”
No IXP
Level 1
“Boxes and Wires”
Level 2
Core Functionality
Level 3
Catalysing Growth
Level 4
Thriving, Critical Infrastructure • 26 IXPs in Africa
• Not all at the same level
of development!
• Most current IXPs only
between “Level 1 and 2”
• We aim to move African
IXPs “Up the Curve!”
ITU SG3RG-AFR 8
- 9 May 2012,
Cotonou
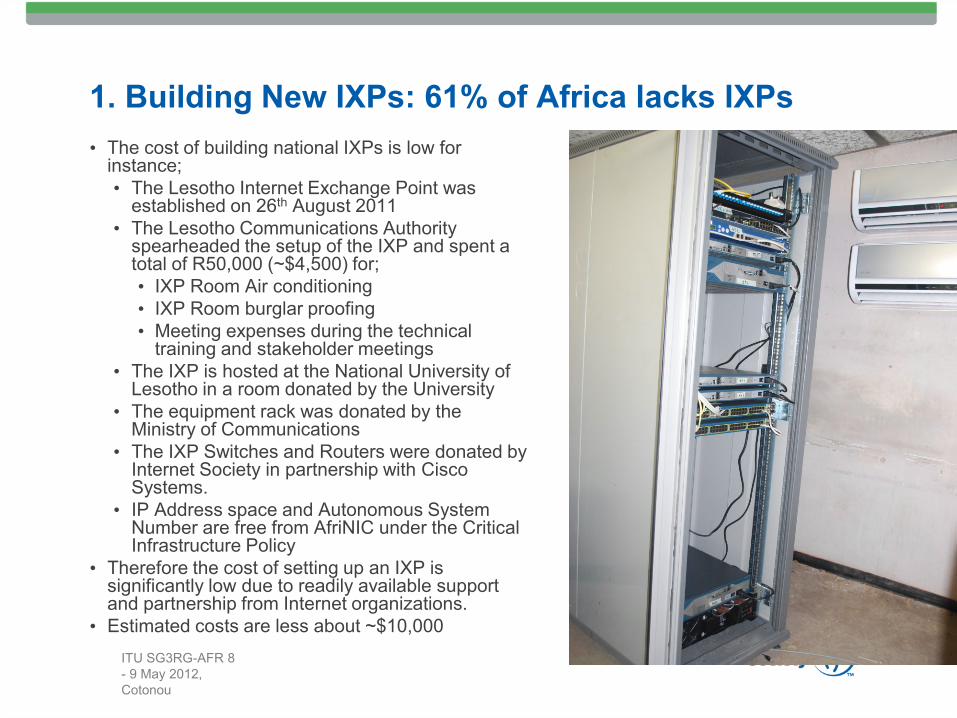
1. Building New IXPs: 61% of Africa lacks IXPs
• The cost of building national IXPs is low for instance;
• The Lesotho Internet Exchange Point was established on 26th August 2011
• The Lesotho Communications Authority spearheaded the setup of the IXP and spent a total of R50,000 (~$4,500) for;
• IXP Room Air conditioning
• IXP Room burglar proofing
• Meeting expenses during the technical training and stakeholder meetings
• The IXP is hosted at the National University of Lesotho in a room donated by the University
• The equipment rack was donated by the Ministry of Communications
• The IXP Switches and Routers were donated by Internet Society in partnership with Cisco Systems.
• IP Address space and Autonomous System Number are free from AfriNIC under the Critical Infrastructure Policy
• Therefore the cost of setting up an IXP is significantly low due to readily available support and partnership from Internet organizations.
• Estimated costs are less about ~$10,000
ITU SG3RG-AFR 8
- 9 May 2012,
Cotonou
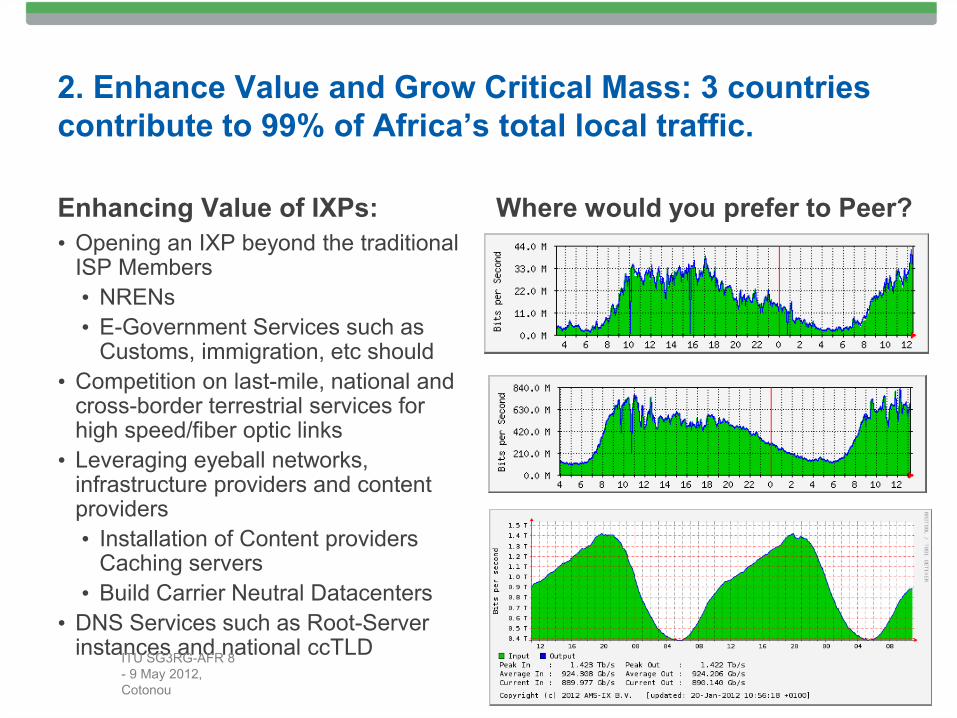
2. Enhance Value and Grow Critical Mass: 3 countries
contribute to 99% of Africa’s total local traffic.
Enhancing Value of IXPs:
• Opening an IXP beyond the traditional ISP Members
• NRENs
• E-Government Services such as Customs, immigration, etc should
• Competition on last-mile, national and cross-border terrestrial services for high speed/fiber optic links
• Leveraging eyeball networks, infrastructure providers and content providers
• Installation of Content providers Caching servers
• Build Carrier Neutral Datacenters
• DNS Services such as Root-Server instances and national ccTLD
Where would you prefer to Peer?
ITU SG3RG-AFR 8
- 9 May 2012,
Cotonou
3. Communities of Practice
• Communities of practice provide a platform where stakeholders can meet and share experiences and best practices.
• In Africa such forums have had resounding success on the technical capacity building front and policy development such as AfNOG, AfriNIC, etc.
• The Africa Peering and Interconnection Forum (AfPIF) is an open forum that is aspiring to contribute to the growth of national and cross-border interconnection.
• AfPIF also helps bridge the information asymmetry on Interconnection economics for the benefit of Regulators, Governments, Operators, Research and Education Networks amongst others.
• The forum further offers opportunities to exchange ideas and learn more about the global trends on interconnection.
• More information is available www.afpif.org
ITU SG3RG-AFR 8
- 9 May 2012,
Cotonou
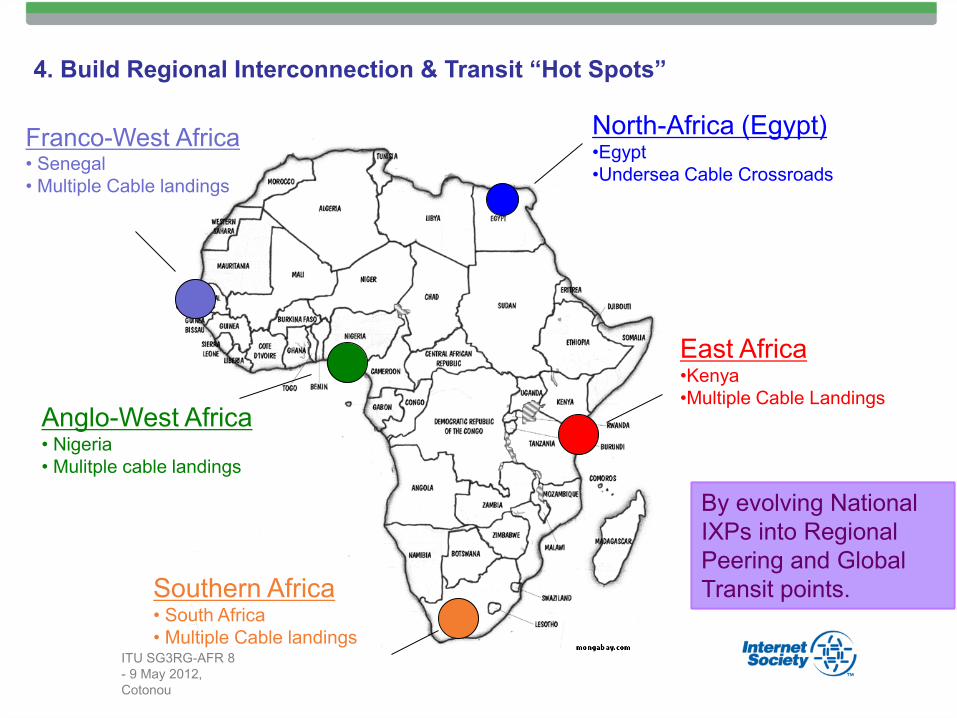
4. Build Regional Interconnection & Transit “Hot Spots”
North-Africa (Egypt) •Egypt
•Undersea Cable Crossroads
Anglo-West Africa • Nigeria
• Mulitple cable landings
Southern Africa • South Africa
• Multiple Cable landings
East Africa •Kenya
•Multiple Cable Landings
Franco-West Africa • Senegal
• Multiple Cable landings
By evolving National
IXPs into Regional
Peering and Global
Transit points.
ITU SG3RG-AFR 8
- 9 May 2012,
Cotonou
5. Local Content & Hosting Incentives
• There is an absence of relevant content in the region. The following areas need further development to grow content and local hosting services.
• E-Government Services are lacking and where available are hosted overseas. In comparison Brazil hosts 93% of the Government websites locally all reachable in under 100ms.
• What are the statistics for African Govt websites?
• ccTLD: - there is a correlation between local domain names and local content. South Africa has 800,000 domains under .ZA and Kenya has 20,000 domains under .KE and reflected by IXP traffic.
• Policies: - The absence of policies and frameworks that support e-transactions and offers incentives for local hosting.
ATU Workshop 5 -
7 March 2012,
Ouagadougou
Impact of Interconnection in Africa
The Kenya Internet Exchange Point (KIXP)
• The KIXP was established in 2002.
• It is operated by the ISP association TESPOK a not-for-profit entity
• Has 30 members connected to the facility and drawn from the ISP, Mobile operators, ccTLD, NREN, Government and Content providers;
• KIXP has 2 peering locations in Nairobi and 1 location in Mombasa
• KIXP is self-sustaining with members paying a monthly access based on their subscribed switch port speed i.e 10Mbps, 100Mbps or 1Gbps.
• There are over 107 Autonomous System Numbers (ASN’s) visible at KIXP with over 50% of them being external to Kenya therefore increasingly acting as a regional hub for traffic from neighboring countries.
ITU SG3RG-AFR 8
- 9 May 2012,
Cotonou
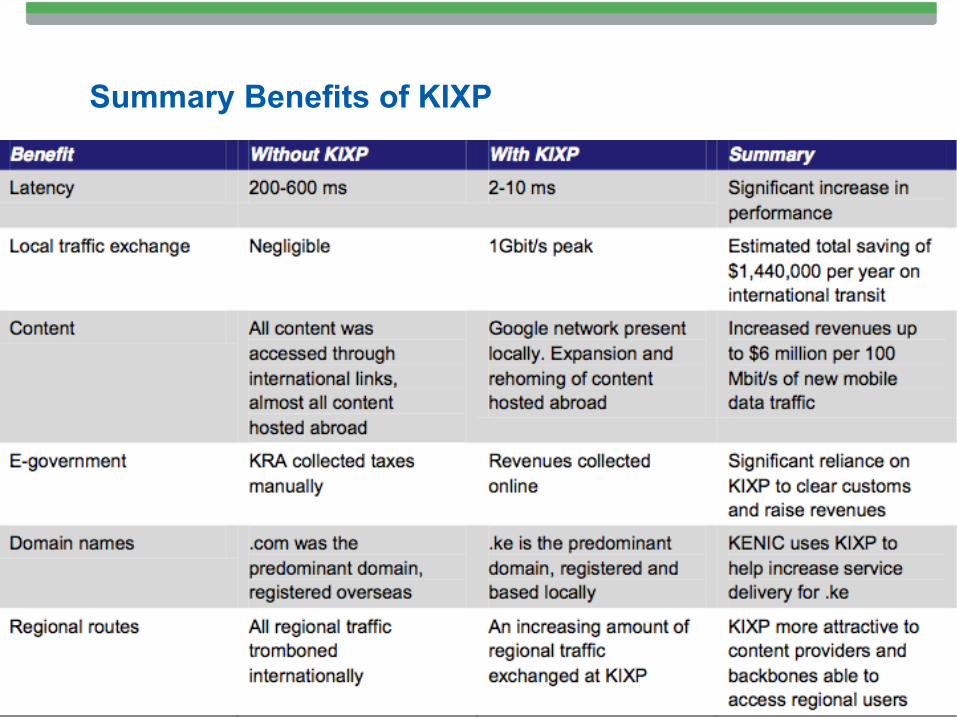
Summary Benefits of KIXP
ITU SG3RG-AFR 8
- 9 May 2012,
Cotonou
The Internet Exchange Point of Nigeria (IXPN)
• The IXPN was established in 2006 Lagos as a neutral exchange
• IXPN is a not-for-profit organization and was established through
a public private partnership process.
• There are over 30 members connected at IXPN
• Diverse membership like Kenya with ISPs, academia, ccTLD,
mobile operators and others.
• A new pop has been launched in Abuja and aiming for all 6
geopolitical zones in Nigeria
• The IXPN is self-sustaining with a business model that charges
for connection similar to that of Kenya
ITU SG3RG-AFR 8
- 9 May 2012,
Cotonou
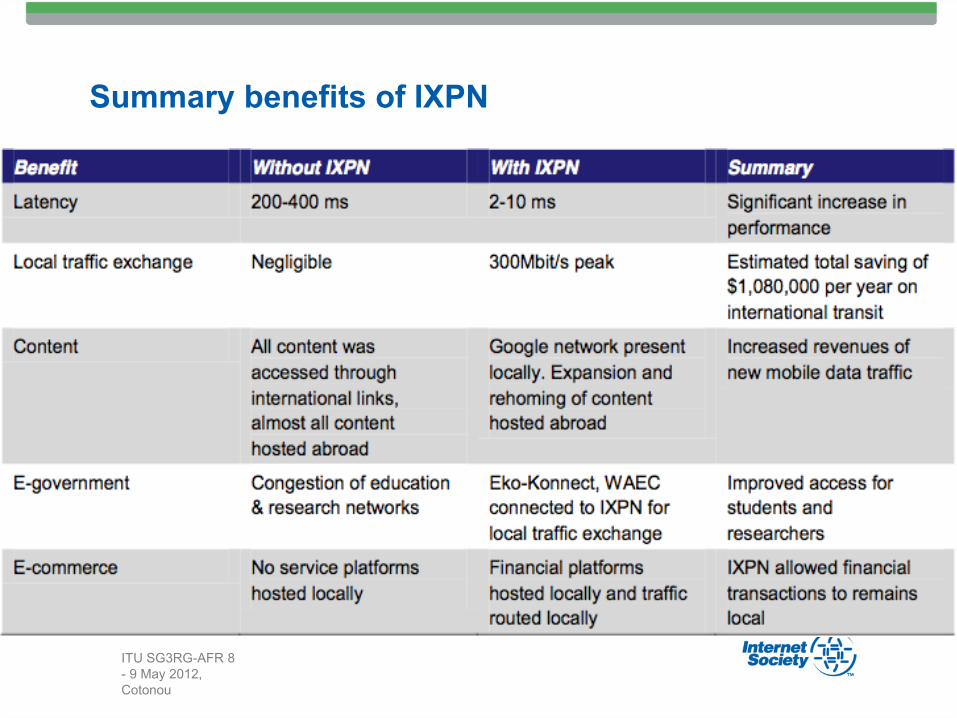
Summary benefits of IXPN
ITU SG3RG-AFR 8
- 9 May 2012,
Cotonou
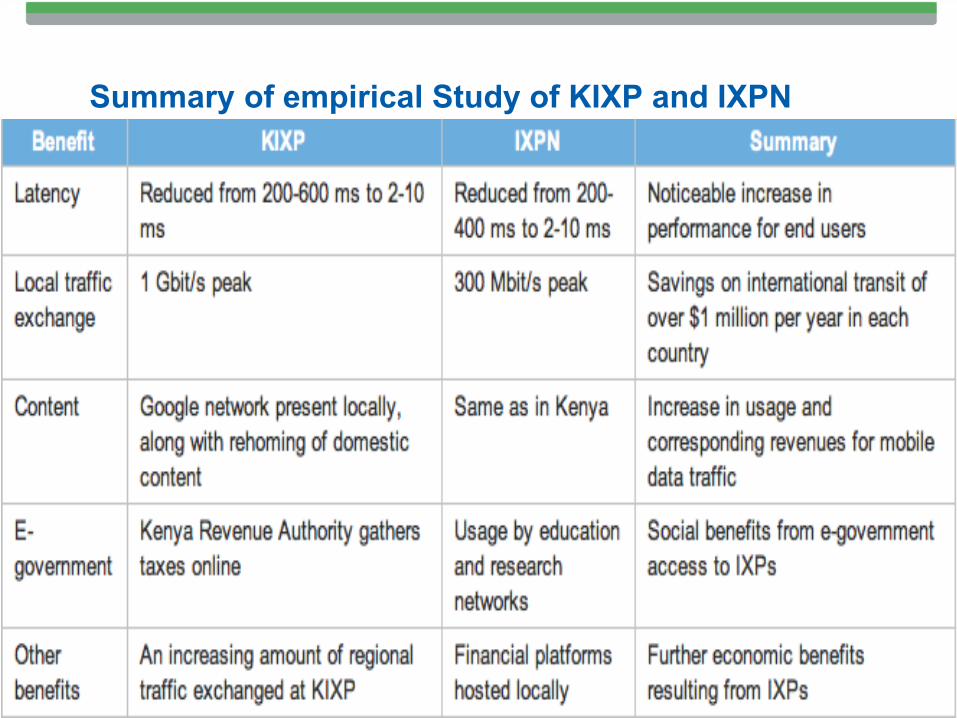
Summary of empirical Study of KIXP and IXPN
ITU SG3RG-AFR 8
- 9 May 2012,
Cotonou
Conclusion
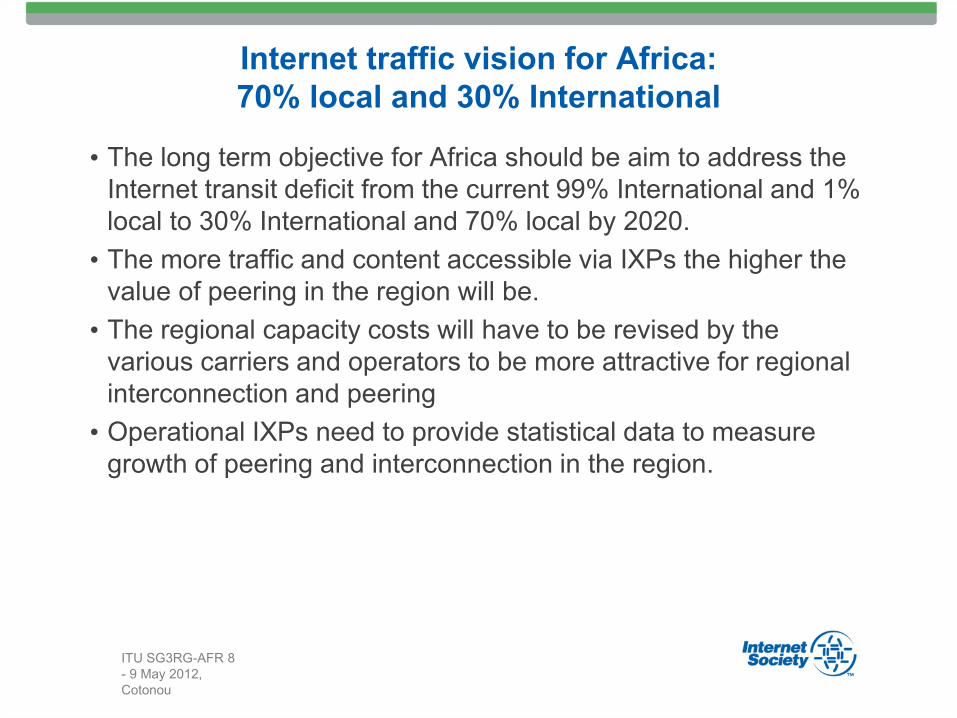
Internet traffic vision for Africa:
70% local and 30% International
• The long term objective for Africa should be aim to address the
Internet transit deficit from the current 99% International and 1%
local to 30% International and 70% local by 2020.
• The more traffic and content accessible via IXPs the higher the
value of peering in the region will be.
• The regional capacity costs will have to be revised by the
various carriers and operators to be more attractive for regional
interconnection and peering
• Operational IXPs need to provide statistical data to measure
growth of peering and interconnection in the region.
ITU SG3RG-AFR 8
- 9 May 2012,
Cotonou
References
• ITU Stats http://www.itu.int/ITU-D/ict/statistics/at_glance/KeyTelecom.html
• IXP Aggregate Stats http://www.pch.net
• Africa IXP Map www.nsrc.org
• Seacom Marketing and Pricing Information http://ictafrica.nepadcouncil.org/proceedings2008/SEACOM.pdf
• Africa Bandwidth Maps http://www.africabandwidthmaps.com/
• Empirical Study of KIXP and IXPN http://www.internetsociety.org/ixpimpact
• Internet Society Resources on IXPs: http://www.internetsociety.org/internet-exchange-points-ixps-0
• Euro-IX 2009 report on European IXPs: https://www.euro-ix.net/documents/653-euro-ix-report-2009-pdf?download=yes
• Africa Under Sea Cables: http://manypossibilities.net/african-undersea-cables/
• Africa Terrestrial Fiber Cables Project: http://manypossibilities.net/afterfibre/
• PCH Global Status of IXPs and relation to submarine cable landing stations: http://lacnic.net/documentos/ixp/woodcock-ixp_mundo.pdf
• Business Wire/Tariff Consultancy – Africa Data Center 2012
• Tariff Consultancy – The London Data Center Market http://www.techweekeurope.co.uk/news/london-remains-largest-european-data-centre-market-10007
ITU SG3RG-AFR 8
- 9 May 2012,
Cotonou

![Implementation and Management of Internet Exchange Points ... · Implementation and Management of Internet Exchange Points (IXP) Haitham El-Nakhal AFRINIC [NA] Board Member Brazzaville,](https://img.pdfslide.net/doc/110x75/5d53ee2288c9930e2c8b87f5/implementation-and-management-of-internet-exchange-points-implementation.jpg)