Embed Size (px)
Citation preview
The Impact of Large Scale Promotions on the Sales andRatings of Mobile Apps: Evidence from Apple’s App
Store
Georgios Askalidis∗
Northwestern University
June 20, 2018
Abstract
We study four promotions offered on Apple’s mobile app store that vary in user
exposure, price discount and redemption procedure. We find that promotions that are
full-price discounted and digital (i.e., the redemption procedure is a few taps on the
smartphone) are the ones that cause the largest increase in downloads. Investigating
the effect on ratings, we find neutral or positive effects on the ratings for all full-
price discounted promotions but negative short-term effects on the ratings of apps
promoted by substantial, but only partial, price discounts. Furthermore, we find that
high barrier promotions induce a rich-get-richer effects, with apps that were popular
before the promotion receiving, generally, larger benefits. In contrast, low barrier
promotions cause, on average, the same increase in sales for all participating apps
regardless their characteristics or their previous popularity. Finally, we explore the
effect of these promotions on the competition of the featured apps and find negative
externalities when the promotion is low barrier and positive when it’s high barrier.
1
arX
iv:1
506.
0685
7v4
[cs
.CY
] 3
1 M
ar 2
016
1 Introduction
Mobile apps have become an economy with a market size of $25 Billion in 20131 and with
a projected market size of $77 Billion by 20172. As of mid 2016, The Google Play store for
Android apps and iOS App Store for iOS apps, owned and operated by Google Inc. and
Apple Inc. respectively, are the two largest mobile app stores, each with more than 1.5
Million mobile apps available to download3. As of July 2013 the two mobile app stores had
seen more than 50 Billion app downloads4 5 each. Apple announced100 Billion downloads in
June 2015. With such volumes, it’s impossible for users to be aware even of a small fraction
of all the available apps: the average iOS and Android smartphone user used less than 30
apps per month at the end of 20136.
This incentivizes the owners of the stores to segment their content into easily navigable
segments such as ‘Editor’s Choice’, ‘Essentials’ or ‘New to the Store’ to help their users
find their most preferred apps. Similarly, creators of apps try to induce word of mouth and
publicity for their apps, for example, via free ‘light’ versions of their (not-free) app or by
lowering the app’s price for a limited time.
But promotions could come with their own caveats. For example, a price reduction could
attracts users that are not in the target group of an app and hence lead to suboptimal user
experiences which, in turn, can lead to lower online reviews. These lower online reviews, can
significantly impact the future performance of any product and service. On the other hand,
developers usually strive to be featured in their stores, perhaps without having a complete
understanding of the benefits but also risks that such promotions can have. Our paper is
contributing towards a better understanding of the effects that such promotions can have on
the sales and ratings of featured apps, as well their competition.
1Wall Street Journal (http://on.wsj.com/1Haufei)2entrepreneur.com (http://goo.gl/GdOa3P)3statista.com (http://goo.gl/dm1aw2)4statista.com (http://goo.gl/knUMyp)5statista.com (http://goo.gl/dcqFks)6nielsen.com (http://goo.gl/QkSPCw)
2
We focus on four such promotion campaigns in the iOS App Store. Two of them are
versions of a larger promotion offered by the coffee chain Starbucks, called ‘iOS Pick of the
Week’. With both promotions, Starbucks offers a one-time redemption code that customers
can use to get a featured app for free. The difference between the two promotions is that
one distributes the redemption codes via printed coupons in physical stores (we will refer to
this distribution method as ‘In-Store’) and the other from within the Starbucks iOS app (we
will refer to this distribution method as ‘Digital’). The sets of apps featured in these two
versions of the promotion are non overlapping. The other promotions we study were offered
by Apple itself. The first, ‘App of the Week’, is a recurring weekly free offering of an app
that is generally not free otherwise. The other ones, are four one-time promotions that run
for one week each the third week of December 2014, the third week of July 2015, the fourth
week of May 2015 and the third week of December 2015. Three of the promotions were
called ‘Amazing Apps & Games for 99¢each’ and the fourth was called ‘Handpicked Apps
& Games for $0.99’. The general theme was the same in all four promotions: Apple chose
30 apps (usually 15 of them were games) and offered them for $0.99 each for a week. Since
the last four promotions are so similar in spirit and execution we bundle them together and
refer to them simple as the Apple Amazing promotion.
One of the key differences between the two promotions offered by Apple and the two
promotions offered by Starbucks is that the two promotions offered by Apple feature large
banners on the front page of the App Store, and the featured apps were sold for the reduced
price for all users (even those who were unaware of the promotion before their visit). In con-
trast, Starbucks’ promotions were valid only for customers that had acquired a redemption
code either in store or though the iOS app. All other users would have to pay the full price
to get the app.
Even though these promotions were offered both inside and outside of the United States,
in this study we focus only on the US App Store and US Starbucks stores.
3
1.1 Main Insights
We focus on two main characteristics of the promotions: steepness of price discount and ease
of redemption. We utilize the similarities and differences between the four promotions in our
study to understand the effect each of these two promotion characteristics had on the sales
and ratings of the promoted apps. We find that digital promotions, which are easy to redeem,
accompanied by a full price discount are the promotions that cause the largest increase in
sales, while having neutral or even positive effects on the ratings. In-store coupons, which
are slightly less trivial to redeem, cause a smaller increase in sales but also have no effect
on the ratings. Non-full price discounted promotions cause the smallest (but still positive)
increase in sales but can also have a negative effect on the ratings.
Furthermore, we explore the effect of various app characteristics in the success of the app’s
promotion. We find that in digital and full-price discounted promotions, all featured apps
receive on average the same increase in sales. But in promotions with higher barriers (such
as less trivial redemption procedure or non-zero price) apps that were more popular before
the promotion are the ones that will receive the largest increases in sales. This indicates
that when the user is offered an app that is free and (literally) a few taps away, the specific
characteristics of the app will not matter much on their decision to redeem the offer or not.
But when the barriers are higher, users are more likely to do the effort (or pay the price) if
it’s a more established app that they are familiar with.
Finally, we are also interested in understanding the effect that these promotions had on
the apps competing with the promoted apps. We find that full price discounted promotions
to have a significant negative effect on the sales of their competition but not full price
discounted promotions have a positive effect on the sales of their competition. We interpret
this result as a sign that users are intrigued and interested when they are exposed to an
app through a promotion. If the app is not free, the user will not commit immediately but
instead will explore the alternatives. When the app is free, the user will have little incentive
to search for alternatives.
4
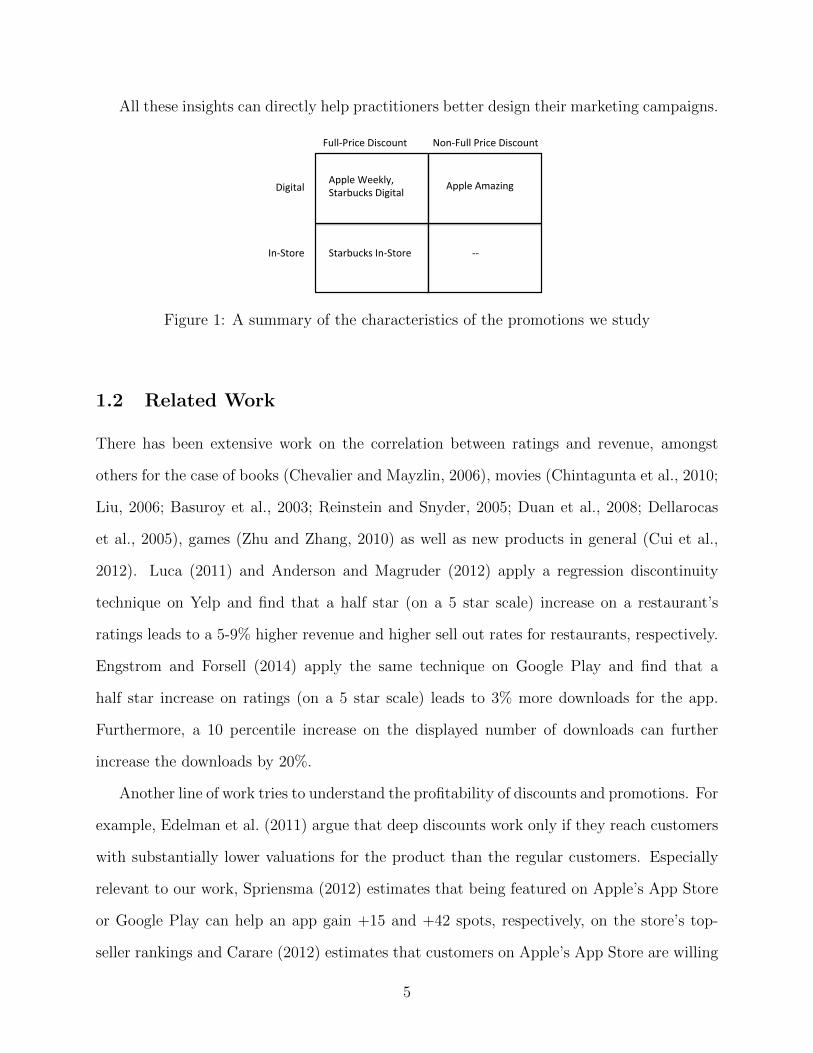
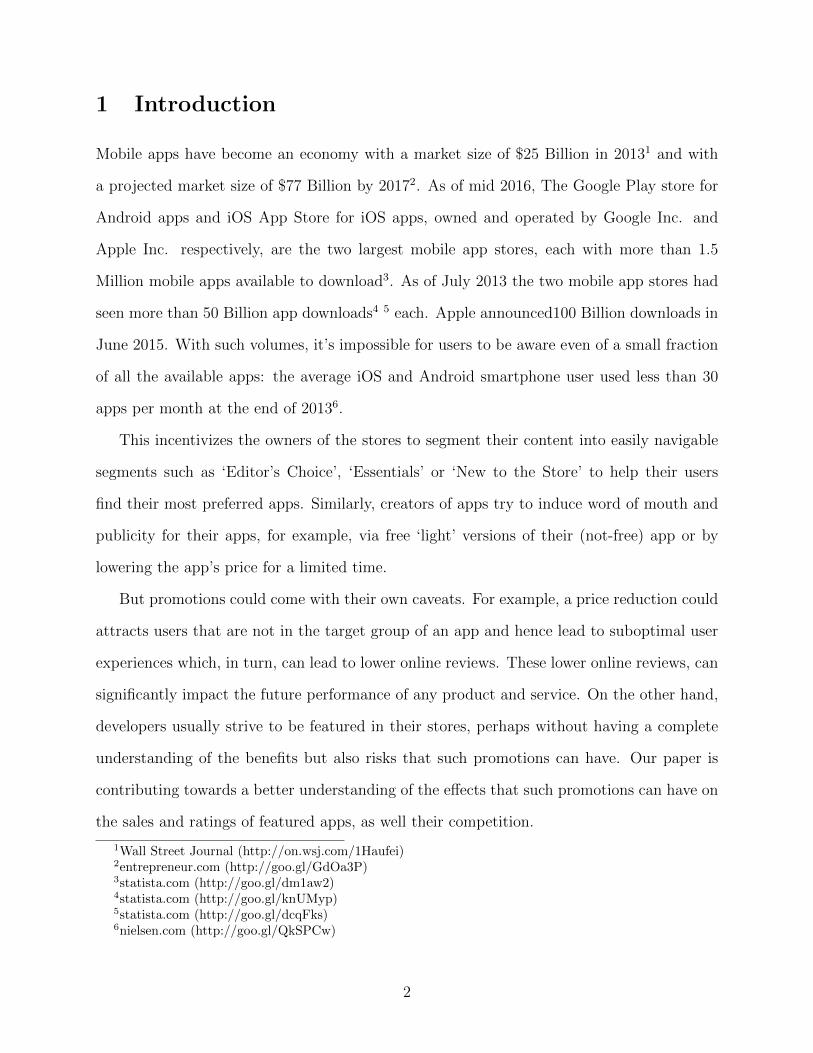
All these insights can directly help practitioners better design their marketing campaigns.
Apple%Weekly,%Starbucks%Digital%
Starbucks%In7Store%
Apple%Amazing%
77%
Digital%
In7Store%
Full7Price%Discount% Non7Full%Price%Discount%
Figure 1: A summary of the characteristics of the promotions we study
1.2 Related Work
There has been extensive work on the correlation between ratings and revenue, amongst
others for the case of books (Chevalier and Mayzlin, 2006), movies (Chintagunta et al., 2010;
Liu, 2006; Basuroy et al., 2003; Reinstein and Snyder, 2005; Duan et al., 2008; Dellarocas
et al., 2005), games (Zhu and Zhang, 2010) as well as new products in general (Cui et al.,
2012). Luca (2011) and Anderson and Magruder (2012) apply a regression discontinuity
technique on Yelp and find that a half star (on a 5 star scale) increase on a restaurant’s
ratings leads to a 5-9% higher revenue and higher sell out rates for restaurants, respectively.
Engstrom and Forsell (2014) apply the same technique on Google Play and find that a
half star increase on ratings (on a 5 star scale) leads to 3% more downloads for the app.
Furthermore, a 10 percentile increase on the displayed number of downloads can further
increase the downloads by 20%.
Another line of work tries to understand the profitability of discounts and promotions. For
example, Edelman et al. (2011) argue that deep discounts work only if they reach customers
with substantially lower valuations for the product than the regular customers. Especially
relevant to our work, Spriensma (2012) estimates that being featured on Apple’s App Store
or Google Play can help an app gain +15 and +42 spots, respectively, on the store’s top-
seller rankings and Carare (2012) estimates that customers on Apple’s App Store are willing
5

to pay $4.50 more on apps that are top-ranked than the same unranked ones. Spriensma
(2012) also finds that putting apps on sale can be profitable especially if the price is cut in
half or on the price points of $0.99 or $1.99. Hence, there are strong economic incentives
for the developers to both strive to be featured on their respective stores and offer frequent
discounts. Ajorlou et al. (2014) even provide theoretical evidence for the optimality of a
pricing strategy that drops the price to zero infinitely often in an environment where word
of mouth effects are in play. Finally, Adamopoulos and Todri (2014) study the effectiveness
of a large scale marketing campaign carried out on Twitter and find significant returns on
participating brands in terms of fan base and social media followers.
Our work is related to both of the aforementioned lines of research since it estimates
the immediate effect of various promotions on the sales of mobile apps but also tries to
understand the effect these promotions have on the ratings of the apps. The effect on
ratings is important because the ratings can continue affecting the sales of the app long
after the promotion is over. Our work is especially related to the work of Byers et al.
(2012) who found that establishments that offer Groupon promotions find their Yelp rating
decrease. But our work also differs from theirs in some crucial ways. First, we are studying
promotions and reviews for digital and not physical goods (or services). Hence, some of the
caveats that could apply for physical establishments don’t apply here, e.g., all purchasers
of a digital good get the exact same product no matter the price they pay, whereas owners
of restaurants could discriminate against customers not paying full price. But perhaps the
most important distinction between our work and the work of Byers et al. (2012) is that the
four promotions studied in this paper are selected and offered by two third-party companies
that have their own complicated incentives. Hence the selection process is not as endogenous
as in platforms like Groupon.
By comparing four different promotions and the different effects they had on the sales
and ratings of the featured promoted apps, our work, amongst other contributions, can lead
to a better understanding of how to design effective marketing campaigns.
6
1.3 Data
Our dataset is from the period of January 2013 to December 2015. Within this time frame,
59 and 71 apps were offered in the digital and in-store versions of the Starbucks promotion
respectively, and 93 apps were offered in Apple’s ‘App of the Week’ promotion (roughly
one per week). The Apple Amazing promotion is an aggregation of four promotions, that
featured between them 68 unique apps.
Our first dataset consists of the app name, app id and the start date of the promotion for
each of these 291 promoted apps. The app id is a unique string assigned by Apple to each
app. In general, all apps were offered for one week each. For each promoted app, we also
collect details about their characteristics such as category, price, size and number and price
of in-app purchases. We use these characteristics to understand how the promoted apps may
differ from other apps in the store.
On the iOS App Store a user can submit two types of reviews: A star rating on a
scale from 1 to 5 or a star rating and accompanied by text. All ratings contribute to a
displayed average star rating but only ratings accompanied by text are displayed in the
app’s review page alongside with their submitted date. Between them, the 291 (59 and 71
from the Starbucks promotions and 93 and 68 from Apple’s) studied promoted apps had, as
of January 2016, more than 665 thousand text reviews. For each of these text reviews we
collected the accompanying text, the date the review was submitted, and their star rating.
We don’t have data on the ratings that were submitted without accompanying text review.
We also use two control datasets. One consists of 56 thousand uniformly sampled apps
from the set of all available apps in the AppStore. For these control apps, we collected de-
tailed information about their characteristics such as price, size, number of in-app purchases
(if any), price of in-app purchases (if any) and more. We use this control dataset to get
insights about how promoted apps differ from an average app from the App Store with re-
spect to the aforementioned characteristics. From the 56 thousand uniformly sampled apps,
we further uniformly sample 5 thousand apps for which we collect all text reviews. This is
7
our second and main control dataset which we use to control for temporal and other trends
when examining the effect of the promotions on the sales and ratings of the promoted (and
competing to the promoted) apps.
Since we can’t observe the number of sales, we use the number of text reviews to make
indirectly detect relative changes in the sales of an app. This is an approached used also in
for data from the Google Play store. In both Google’s and Apple’s store, only users that
have downloaded an app can submit a review, so the number of reviews an app receives is
always a lower bound on it’s sales.
Furthermore, we use the relative changes in the star average from text reviews to ap-
proximate relative changes in the overall star average.
Terminology Throughout the paper we will refer to any apps that were offered as part of
the digital version of the Starbucks ‘iOS Pick of the week’ promotion as Starbucks Digital
apps and to the promotion itself as Starbucks Digital. Similarly, we will use the terms
Starbucks In-Store apps and Starbucks In-Store promotion, Apple Weekly apps and Apple
Weekly promotion and Apple Amazing apps and Apple Amazing promotion. There should
be no confusion with apps made by Apple or Starbucks, which are not part of any promotion
discussed in this study. Finally, we will usually refer to a rating accompanied by text as text
review and simply as rating otherwise.
1.4 Initial Exploration
We start by using our datasets to get insights on the general characteristics of the promoted
apps and how they may differ from an average app in the App Store.
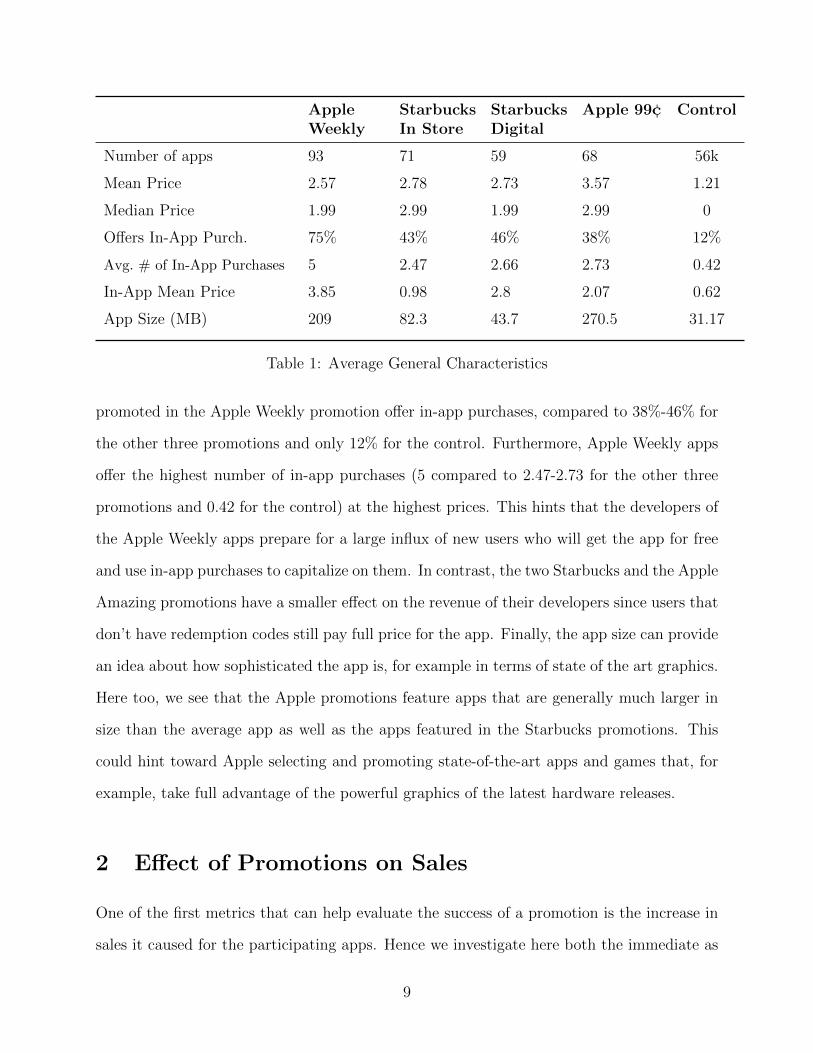
Table 1 shows some general characteristics of the four sets of offered apps as well as of a
control set of uniformly sampled apps. We see that the offered apps have a higher average
price than the control and, amongst the offered apps, the ones that were offered on a non full
price discount are the ones with the highest regular price. We also see that 75% of the apps
8
AppleWeekly
StarbucksIn Store
StarbucksDigital
Apple 99¢ Control
Number of apps 93 71 59 68 56k
Mean Price 2.57 2.78 2.73 3.57 1.21
Median Price 1.99 2.99 1.99 2.99 0
Offers In-App Purch. 75% 43% 46% 38% 12%
Avg. # of In-App Purchases 5 2.47 2.66 2.73 0.42
In-App Mean Price 3.85 0.98 2.8 2.07 0.62
App Size (MB) 209 82.3 43.7 270.5 31.17
Table 1: Average General Characteristics
promoted in the Apple Weekly promotion offer in-app purchases, compared to 38%-46% for
the other three promotions and only 12% for the control. Furthermore, Apple Weekly apps
offer the highest number of in-app purchases (5 compared to 2.47-2.73 for the other three
promotions and 0.42 for the control) at the highest prices. This hints that the developers of
the Apple Weekly apps prepare for a large influx of new users who will get the app for free
and use in-app purchases to capitalize on them. In contrast, the two Starbucks and the Apple
Amazing promotions have a smaller effect on the revenue of their developers since users that
don’t have redemption codes still pay full price for the app. Finally, the app size can provide
an idea about how sophisticated the app is, for example in terms of state of the art graphics.
Here too, we see that the Apple promotions feature apps that are generally much larger in
size than the average app as well as the apps featured in the Starbucks promotions. This
could hint toward Apple selecting and promoting state-of-the-art apps and games that, for
example, take full advantage of the powerful graphics of the latest hardware releases.
2 Effect of Promotions on Sales
One of the first metrics that can help evaluate the success of a promotion is the increase in
sales it caused for the participating apps. Hence we investigate here both the immediate as
9
well as the longer term increase that the four studied promotions caused for their featured
apps.
Generally, we would expect low barrier promotions, i.e., free and easy redemption process,
to outperform higher barrier promotions such as promotions with less trivial redemption
procedures or not fully discounted. Hence, we expect the Apple Weekly and Starbucks
Digital promotions to cause a larger increase than the Starbucks In-Store and Apple Weekly.
Furthermore, since the Apple Weekly promotion features a banner in the front page of the
App Store driving awareness, we expect the Apple Weekly promotion to outperform the
Starbucks Digital one. Amongst the two high barrier promotions, we expect that the less
trivial redemption procedure will outperform partially discounted promotion.
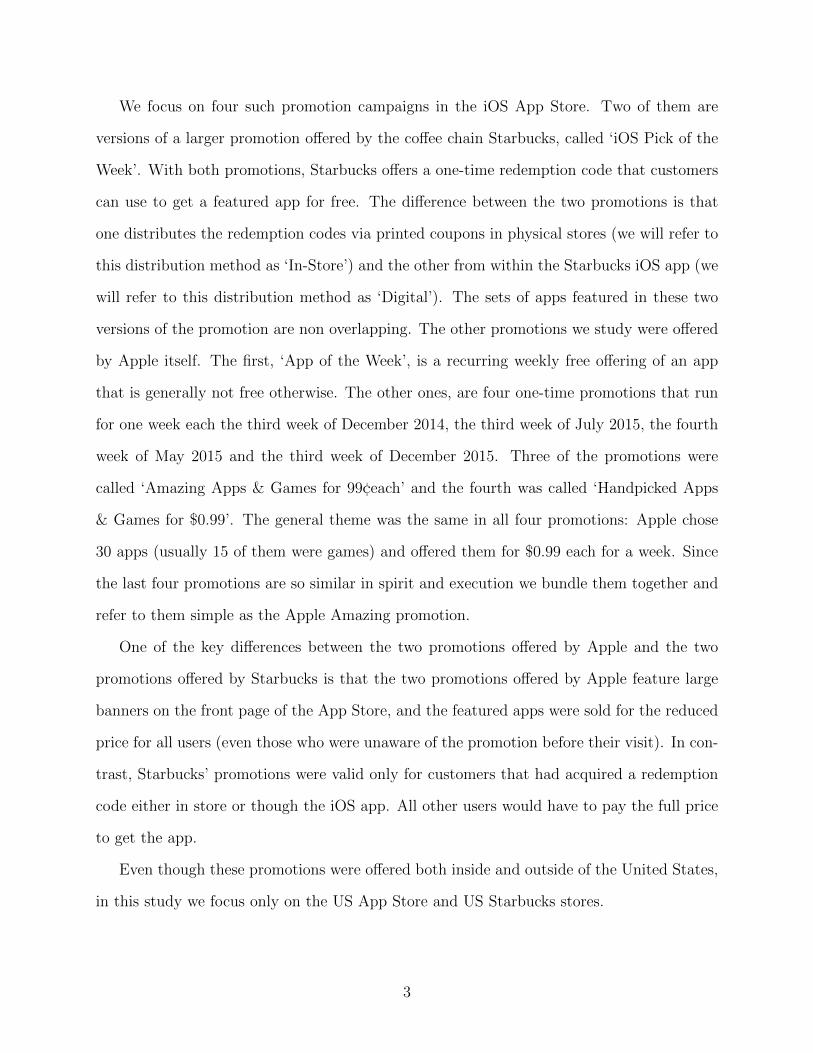
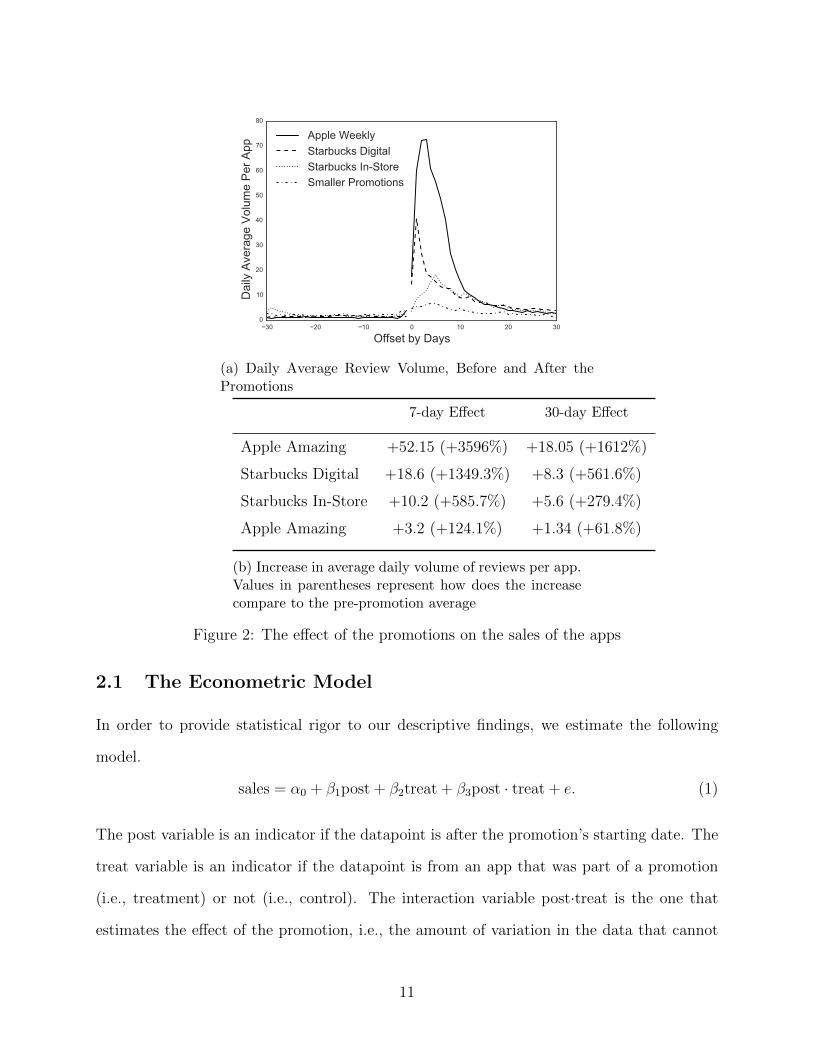
An exploratory analysis of our dataset provides support for all the predictions above. The
average Apple Weekly app goes from 1.45 reviews per day, in the 7 days before the promotion
starts, to 53.6 reviews per day in the 7 days of the promotion ,an increase of almost 3600%.
For the same time periods, the Starbucks Digital apps go from 1.4 to 20 reviews per day
(1800% increase), the Starbucks In-Store apps go from 1.75 to 12 reviews per day (1025%)
and the Apple Amazing apps go from 2.6 to 5.75 reviews per day (124% increase). Table 2b
displays the short term (one week after and one week before the start of the promotion) and
long term (one month after and one month before the start of the promotion) increase in
number of daily reviews. We show both the absolute as well as percentage increase. Note
that all promotions studied in this paper run for 7 days.
Figure 2a displays the evolution of the average daily number of reviews per app for 60
day interval offset at the beginning of the promotions, and it provides further support for
our exploratory findings.
10
30 20 10 0 10 20 30
Offset by Days
0
10
20
30
40
50
60
70
80
Dai
ly A
vera
ge V
olum
e P
er A
pp
Apple WeeklyStarbucks DigitalStarbucks In-StoreSmaller Promotions
(a) Daily Average Review Volume, Before and After thePromotions
7-day Effect 30-day Effect
Apple Amazing +52.15 (+3596%) +18.05 (+1612%)
Starbucks Digital +18.6 (+1349.3%) +8.3 (+561.6%)
Starbucks In-Store +10.2 (+585.7%) +5.6 (+279.4%)
Apple Amazing +3.2 (+124.1%) +1.34 (+61.8%)
(b) Increase in average daily volume of reviews per app.Values in parentheses represent how does the increasecompare to the pre-promotion average
Figure 2: The effect of the promotions on the sales of the apps
2.1 The Econometric Model
In order to provide statistical rigor to our descriptive findings, we estimate the following
model.
sales = α0 + β1post + β2treat + β3post · treat + e. (1)
The post variable is an indicator if the datapoint is after the promotion’s starting date. The
treat variable is an indicator if the datapoint is from an app that was part of a promotion
(i.e., treatment) or not (i.e., control). The interaction variable post·treat is the one that
estimates the effect of the promotion, i.e., the amount of variation in the data that cannot
11
be explained by the control set of reviews. The error term is e.
For the purposes of the model estimations, we restrict our data only on the period of two
weeks before and two weeks after the start of the promotion. This time frame captures the
effect of the promotion, while the promotion is still active as well as one week after it’s over.
For this time period, our dataset is comprised of 88,172 ratings for 297 treatment apps and
81,257 ratings for 2635 control apps.
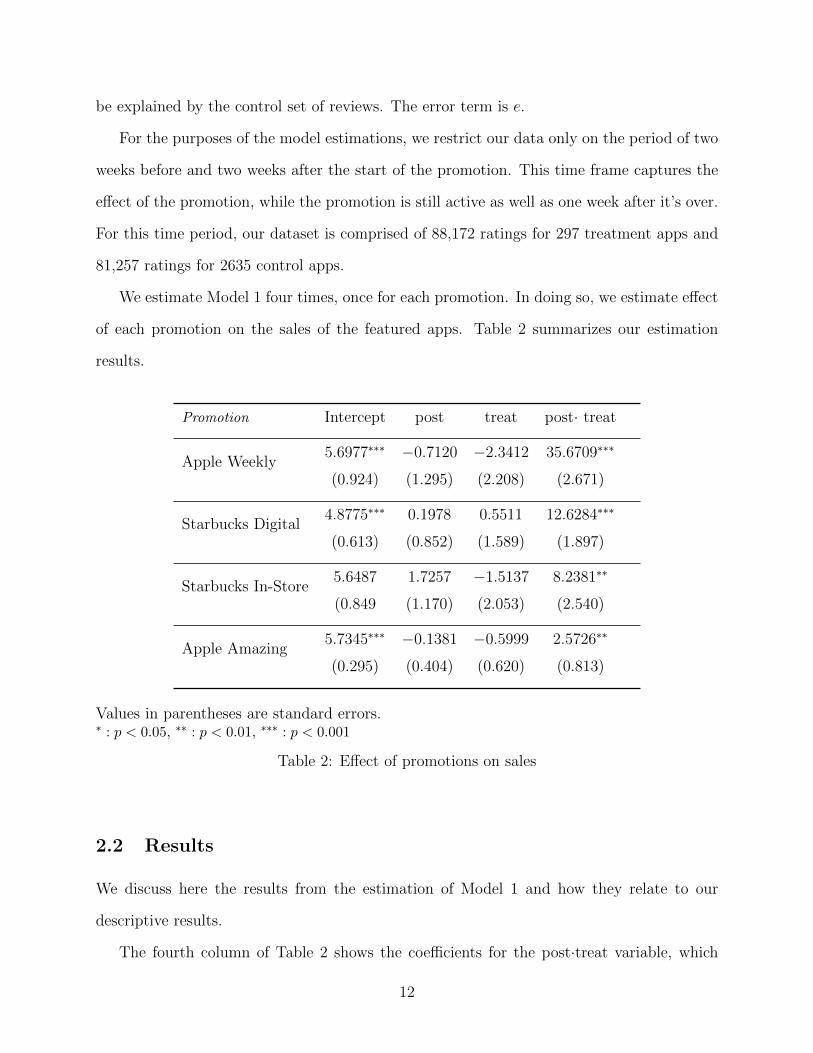
We estimate Model 1 four times, once for each promotion. In doing so, we estimate effect
of each promotion on the sales of the featured apps. Table 2 summarizes our estimation
results.
Promotion Intercept post treat post· treat
Apple Weekly5.6977∗∗∗ −0.7120 −2.3412 35.6709∗∗∗
(0.924) (1.295) (2.208) (2.671)
Starbucks Digital4.8775∗∗∗ 0.1978 0.5511 12.6284∗∗∗
(0.613) (0.852) (1.589) (1.897)
Starbucks In-Store5.6487 1.7257 −1.5137 8.2381∗∗
(0.849 (1.170) (2.053) (2.540)
Apple Amazing5.7345∗∗∗ −0.1381 −0.5999 2.5726∗∗
(0.295) (0.404) (0.620) (0.813)
Values in parentheses are standard errors.∗ : p < 0.05, ∗∗ : p < 0.01, ∗∗∗ : p < 0.001
Table 2: Effect of promotions on sales
2.2 Results
We discuss here the results from the estimation of Model 1 and how they relate to our
descriptive results.
The fourth column of Table 2 shows the coefficients for the post·treat variable, which
12
estimates the effect of the promotions, and it confirms our descriptive findings, shown in
Figure 2a.
Apple Weekly As we expected, Apple Weekly has the largest coefficient for the post·treat
variable confirming that it’s the promotion with the largest positive impact on the featured
apps’ sales. This can be explained not only by the low barrier nature of the promotion but
also by the large awareness that the banner in the front page of the App Store brings. In
addition to these factors, the app is promoted and appears to be endorsed by Apple itself,
hence providing users with further confidence. As seen from Figure 2a the large effects last
around 2 weeks, after which a gradual descent ‘back to normal’ begins. The promotion is
only one week in duration, and hence we believe that the extra days of increased volume
of sales is due to a combination of word-of-mouth as well as higher ranks in the top selling
charts, which came as a result of the promotion.
Starbucks promotions As can be seen in the second and third row of Table 2, the coeffi-
cients of post·treat for both of the Starbucks promotions are positive and highly significant,
hence confirming the positive increase in sales we observed in Figure 2a. Moreover, the
coefficient is larger for the Starbucks Digital version compared to the Starbucks In-Store,
confirming that low barrier promotions attract larger increases than higher barrier ones.
Figure 2a also shows that the increase in the digital promotion is much more sudden than
the in the in-store promotion. This can be because customers redeeming a coupon for the
in-store promotion can pick up the coupon from the physical locations but can wait up to
three months before going through the process. In contrast, customers can redeem the digital
promotion, right from their phones, only within the week of the promotion.
Similar to the Apple Weekly promotion, we expect that the Starbucks promotions caused
an increase in word-of-mouth for the featured apps and helped them climb up the ranks of
the top charts, which can explain why there are still some abnormally large sales (compared
to before the promotion) even after the 7 days of the promotion were over.
13
Apple Amazing Even though the Apple Amazing promotion is the only one not offering
a full price discount, as can be seen in the fourth row of Table 2, it still observes a positive
and significant increase in sales. Confirming what we observed in Figure 2a, this increase
is the smallest amongst the studied promotions. Smaller increase in sales means smaller
climb in the top-charts ranks which can also explain why this promotion seems to be the
one returning to their normal pre-promotion sales faster from the other ones.
The results from this section show that low barrier promotions, i.e., digital and free, have
the largest and most immediate increase in their sales whereas higher barrier promotions,
i.e., partial discount or offline redemption procedure, have smaller and less sudden, but still
substantial, increases.
3 Effect of Promotions on Ratings
Having studied the effect of the promotion on sales, we turn our attention in the effect on
ratings. A promotion is usually designed to attract users that would otherwise not buy a
product with the intention to turn them into long-term paying customers. Does this increase
in sales need always come with the risk of lower ratings, as observed in Byers et al. (2012),
or can practitioners mitigate undesired effects by designing the promotion carefully? An
extended literature has shown the importance of positive ratings in the economics success of
products and services (), hence any effects that the promotions will have on the ratings of
featured products and services, can continue affecting their success long after the promotions
are over.
Even though our work is very similar in spirit with the work of Byers et al. (2012), our
setting has important differences. Perhaps the most important is that the promoted apps are
selected by Apple or Starbucks, two companies with their own complicated objectives and
incentives, that may not always align entirely with the objectives and incentives of the app
developers. Unlike settings such as Groupon, a developer cannot just add their app in the
14
Apple Weekly promotion, it needs to be selected (or at least agreed by) Apple. This induces
a selection procedure that makes our predictions for the effects on the ratings harder. Take
for example the Apple Weekly promotion. As can be seen in Figure 2a, Apple Weekly is the
promotion that causes the largest increase in sales. This large influx of new users can be
risky since some of them may not be in the target group of the promoted app. On the other
hand, the promotion is on the front page of the AppStore and that means that the users that
are exposed to the banner are customers that are actively browsing for apps to download.
The fact that Apple is endorsing the promoted apps can also induce some positive ‘social
influence’-type bias.
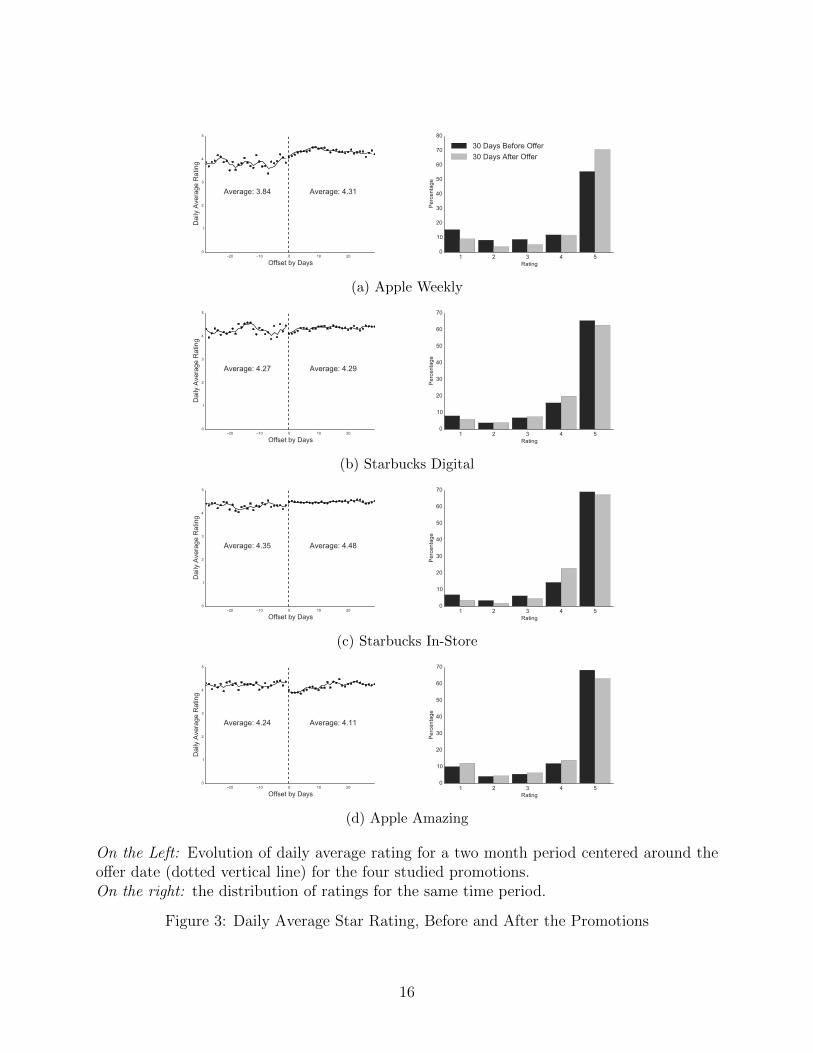
An exploratory analysis of the immediate effects of the promotions on the ratings of the
promoted apps, shows that the apps featured in the Apple Weekly promotion experience,
on average, an increase of 0.4 stars, from 3.86 in the week before the promotion starts to
4.27 for the week after the promotion started. In the same time period, apps featured in the
Starbucks Digital promotion doesn’t seem to have been affected, with their ratings increasing
only by 0.01 star (from 4.21 to 4.22). The ratings for apps featured in the Starbucks In-
Store promotion increased by 0.14 star (from 4.33 to 4.47) and for apps featured in the Apple
Amazing promotion decreased by 0.34 star (from 4.3 to 3.96).
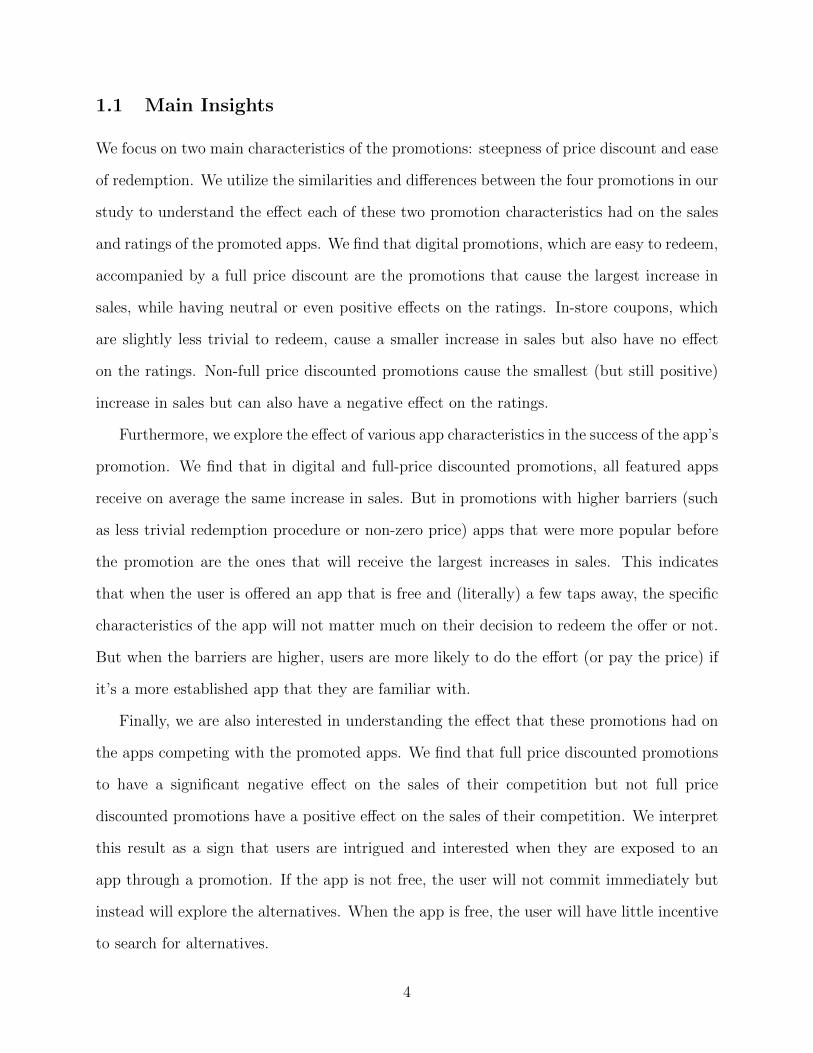
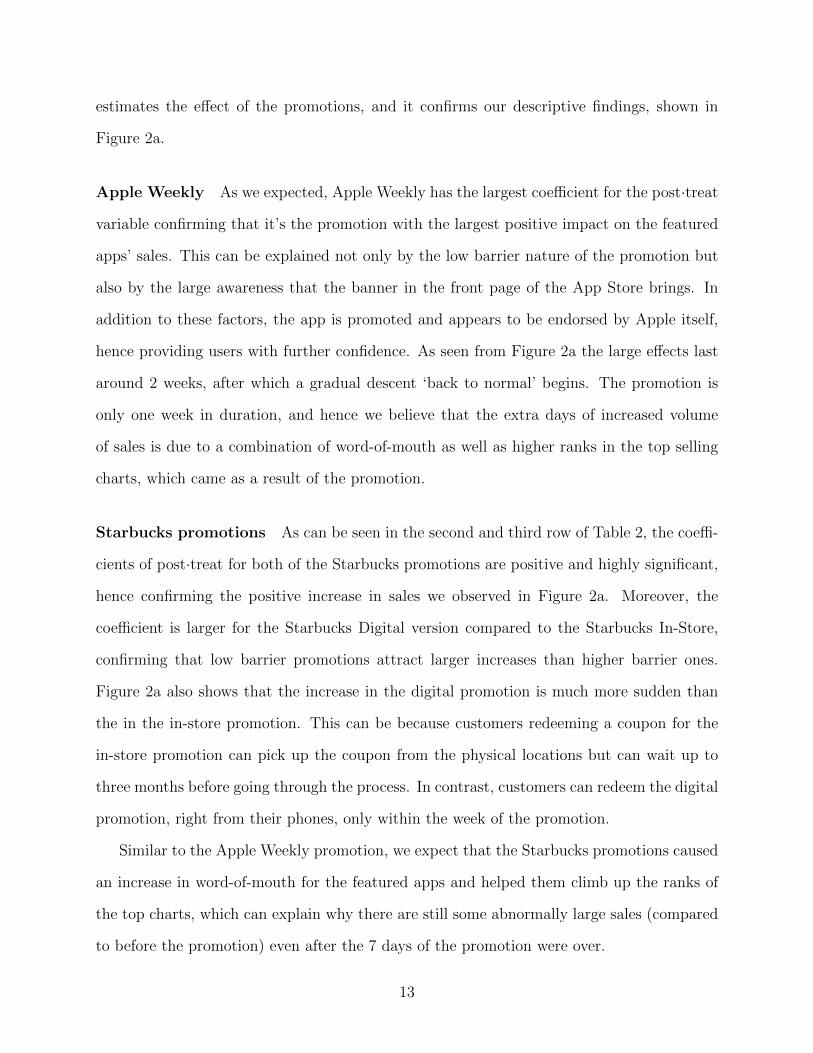
Figure 3 shows a more detailed view on the effect that the promotions had on the ratings.
On the left hand side, is the evolution of the daily average rating for the two month period
offset at the start of the promotion (all promotions run for 7 days) alongside the average
rating for each 30 day period. On the right hand side, is the actual distributions of the ratings
for each 30 day period (before and after the start of the promotion). Figure 3 provides further
support for all the descriptive statistics we mentioned above: ratings become substantially
more positive for the Apple Weekly apps, remain stable or go slightly up for the Starbucks
promotions and there is a sudden decrease for the Apple Amazing apps, but one that seems
to be partially corrected after the end of the promotion.
15
20 10 0 10 20
Offset by Days
0
1
2
3
4
5
Dai
ly A
vera
ge R
atin
gAverage: 3.84 Average: 4.31
1 2 3 4 5Rating
0
10
20
30
40
50
60
70
80
Per
cent
age
30 Days Before Offer30 Days After Offer
(a) Apple Weekly
20 10 0 10 20
Offset by Days
0
1
2
3
4
5
Dai
ly A
vera
ge R
atin
g
Average: 4.27 Average: 4.29
1 2 3 4 5Rating
0
10
20
30
40
50
60
70
Per
cent
age
(b) Starbucks Digital
20 10 0 10 20
Offset by Days
0
1
2
3
4
5
Dai
ly A
vera
ge R
atin
g
Average: 4.35 Average: 4.48
1 2 3 4 5Rating
0
10
20
30
40
50
60
70
Per
cent
age
(c) Starbucks In-Store
20 10 0 10 20
Offset by Days
0
1
2
3
4
5
Dai
ly A
vera
ge R
atin
g
Average: 4.24 Average: 4.11
1 2 3 4 5Rating
0
10
20
30
40
50
60
70
Per
cent
age
(d) Apple Amazing
On the Left: Evolution of daily average rating for a two month period centered around theoffer date (dotted vertical line) for the four studied promotions.On the right: the distribution of ratings for the same time period.
Figure 3: Daily Average Star Rating, Before and After the Promotions
16
3.1 The Econometric Model
We estimate the following model in order to provide statistical support for the descriptive
results shown in Figure 3.
rating = α0 + β1post + β2treat + β3post · treat + e (2)
The post variable is a binary indicator if the datapoint is before the start date of the pro-
motion and the treat variable is a binary indicator if the datapoint is from an app that was
part of a promotion. The interaction variable post·treat is the effect that is unique to the
promoted apps after the promotion started. Hence, the coefficient of that variable estimates
the effect on the promoted apps that cannot be explained by the control dataset, i.e., the
causal effect of the promotion. The error term is e.
As we did with the regressions for the effect on sales, we restrict our attention on a
period of two weeks before and two weeks after the start date of the promotions. This makes
the time window long enough to capture the immediate effects of the promotions while the
promotions are in progress as well as one week after they are over. For this time frame, our
dataset is comprised of 88,172 ratings for the 297 treatment apps and 81,257 ratings for 2635
control apps.
We estimate Model 1 four times, once for each promotion and summarize our results in
Table 3
3.2 Results
We discuss here the results of our statistical analysis and how they tie up with our descriptive
results.
The coefficient for post·treat when Model 2 is run on the Apple Weekly dataset is positive
and highly significant. This confirms that our descriptive findings, that the Apple Weekly
promotion has a positive effect on the ratings of the featured apps, is statistically significant.
17
Promotion Intercept post treat post·treat
Apple Weekly4.0104∗∗∗ −0.01084 −0.1458∗∗ 0.4167∗∗∗
(0.017) (0.024) (0.046) (0.050)
Starbucks Digital4.1758∗∗∗ −0.0029 0.052 -0.001
(0.021) (0.03) (0.05) (0.05)
Starbucks In-Store4.4737∗∗∗ 0.0307 −0.1369∗∗∗ 0.11∗∗∗
(0.014) (0.018) (0.037) (0.04)
Apple Amazing4.2258∗∗∗ −0.1043∗∗∗ 0.0769 −0.2320∗∗∗
(0.022) (0.029) (0.045) (0.054)
Values in parentheses are standard errors.∗ : p < 0.05, ∗∗ : p < 0.01, ∗∗∗ : p < 0.001
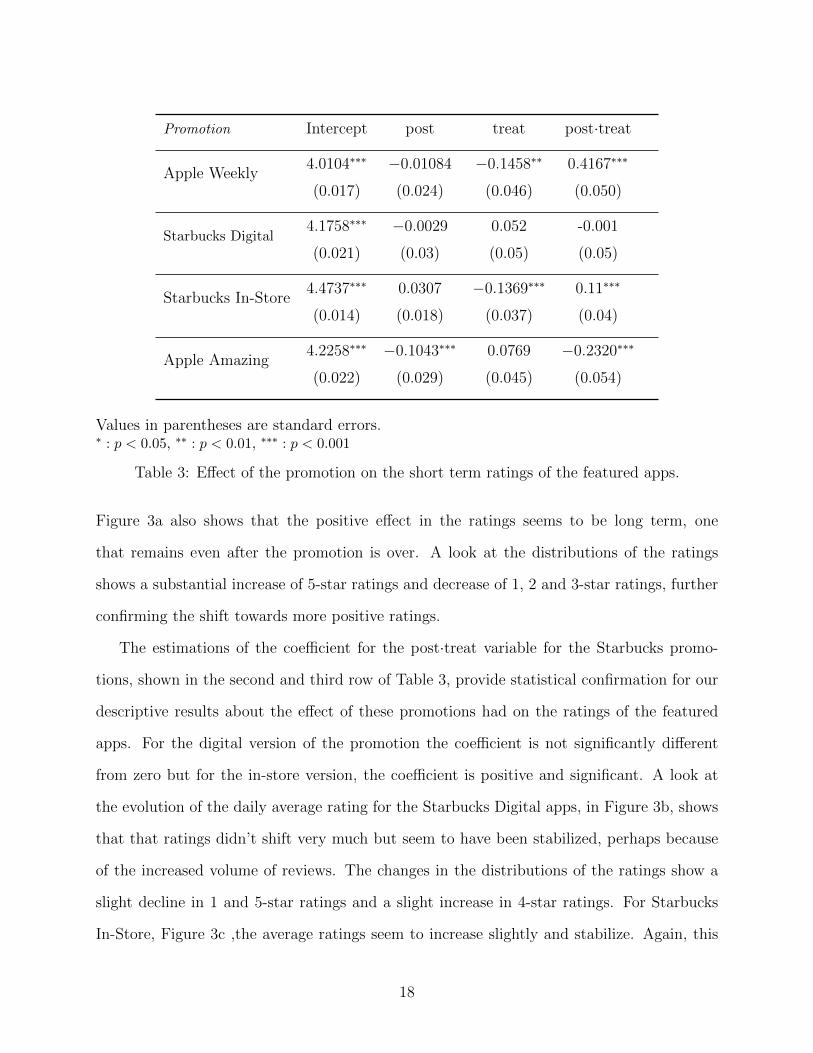
Table 3: Effect of the promotion on the short term ratings of the featured apps.
Figure 3a also shows that the positive effect in the ratings seems to be long term, one
that remains even after the promotion is over. A look at the distributions of the ratings
shows a substantial increase of 5-star ratings and decrease of 1, 2 and 3-star ratings, further
confirming the shift towards more positive ratings.
The estimations of the coefficient for the post·treat variable for the Starbucks promo-
tions, shown in the second and third row of Table 3, provide statistical confirmation for our
descriptive results about the effect of these promotions had on the ratings of the featured
apps. For the digital version of the promotion the coefficient is not significantly different
from zero but for the in-store version, the coefficient is positive and significant. A look at
the evolution of the daily average rating for the Starbucks Digital apps, in Figure 3b, shows
that that ratings didn’t shift very much but seem to have been stabilized, perhaps because
of the increased volume of reviews. The changes in the distributions of the ratings show a
slight decline in 1 and 5-star ratings and a slight increase in 4-star ratings. For Starbucks
In-Store, Figure 3c ,the average ratings seem to increase slightly and stabilize. Again, this
18
stabilization could be because of the increased volume of reviews. Moreover, a comparison of
the distributions of the ratings before and after the start of the promotion, show an increase
of 4-star and decrease of 1-star ratings.
The in-store promotion involves a customer noticing the printed coupon in a physical
location, picking it up and then redeeming it on their phone. In contrast, the digital version
of the promotion offers the users the ability to claim their free app with only two taps
from the within the Starbucks iOS app. Hence, we ask, what types of customers are more
likely to go through each process? Customers are more likely to go through with the offline
redemption procedure if they are positively predisposed towards the promoted app, e.g.,
they are aware of the app from their friends or from some other source. Hence, this small
barrier seems to be effective in filtering out users that wouldn’t be in the target audience of
the group and wouldn’t enjoy it.
Even though the Starbucks Digital and Apple Weekly promotion are both digital and free,
only Apple’s promotion causes an increase in the ratings. This could be due to few factors.
First, it could be that the selection procedure of Apple is such that it discovers high quality
apps and presents them to their users. From a private conversation the author had with a
person in charge of the Starbucks promotions, the selections process for the Starbucks apps
seems to be essentially the same as the one for the Apple promotions, with Apple needing to
confirm the selections made by Starbucks before they go live on either of the two Starbucks
promotions. Hence, another factor is the incentives and goals of each company. Starbucks
seems to be offering the promotion as an additional service to their customers and our data
show that they tend to choose apps that are higher rated than the Apple Weekly apps.
This could perhaps be because Starbucks wants to offer their customers already popular and
risk-free apps, whereas Apple could have incentives to choose more niche apps, in order to
help their customers discover even more great apps than what they already know. Finally,
users that are exposed to the Apple Weekly promotion are users that are already browsing
the AppStore hence they are already actively looking for apps to purchase. This seamless
19
and well timed integration of the promotion in the user experience could be why we see
the different effects in the ratings of their featured apps. Moreover, the apps featured in
the Apple Weekly promotion are promoted and endorsed by Apple itself, hence an iOS user
could be predisposed positively towards them.
The coefficient of the post·treat variable for the Apple Amazing promotion, is highly
significant and the only, out of the four studied promotions, that is negative. This is in
agreement with our descriptive results, shown in Figure 3d, that show a sudden decrease in
the ratings immediately following the start of the Apple Amazing promotion. Figure 3d also
shows that this decrease seems to be partially corrected as time goes on after the end of the
promotion. A look at the distributions of the ratings before and after the promotion shows
a decrease in 5-star and increase in 1-star ratings hence further confirming the shift towards
lower ratings.
This decrease must have something to do with the fact that the Apple Amazing promotion
is the only one not offering a full discount. Even though the discount is around 75%, with
the average normal price for the Apple Amazing promotions being around $4, the $0.99 price
tag is still higher than the median ($0) and only slightly lower than the mean ($1.2) app
price in the App Store. Note that users that are exposed to the Apple Amazing promotion
don’t get information about the app’s original price. Hence, from a customer’s point of view
they are offered an app that in comparison to the average app in the store, is only slightly
cheaper. Hence, the promotion and the endorsement by Apple may have incentivized some
users to purchase the app even though they would not have buy otherwise. The price-tag
may have then caused these users to be dissatisfied and submitting a low rating.
Note that the Apple Amazing promotion is the one most similar to promotions on plat-
forms like Groupon, because it’s the only one where the apps are not given out for free.
It’s interesting that it’s the only promotion we find to have a negative effect on the ratings.
We think this is a finding that can contribute in further understanding of the ‘Groupon
phenomeon’ (Byers et al., 2012), and one that practitioners should take into account when
20
designing their promotions.
4 Effect of App Characteristics
All the studied promotions caused an increase in the sales of the promoted apps, but was the
extend of this increase correlated with any of the characteristics of the app7? For example,
when offered for free, do apps that are normally more expensive benefit more or less from
apps that are cheaper? How about the previous popularity of the promoted apps? Do apps
that are already popular and established benefit more or less from a promotion? Insights
towards this direction can help practitioners understand what type of apps can benefit the
most from each type of promotions, and design their marketing strategy accordingly.
In order to examine this question, we define a new variable, called boost, as the difference
between the average number of reviews an app received during the 7 days of the promotion
and the 7 days before the promotion started.
We focus on four characteristics of an app: popularity before the start of the promotion,
normal price, age (in days), and size (in Mega Bytes). Popularity before the start of the
promotion will help us see if there are any ‘rich-get-richer’ effects, where apps that were
already popular benefit disproportionally from price reductions and promotions. The regular
price of the app can capture if, amongst apps that are offered for the same price (free or
otherwise), the apps that are more expensive normally will attract larger interest. For
example, more users that held back their purchases for more expensive apps can now have
the opportunity to get it at a discount. Furthermore, the regular price can also be correlated
with the quality of the app. The age of the app can capture if an app is established and had
more time to build their user base and word of mouth, and the size in MegaBytes of the app
can signal the level of sophistication that app has, e.g., state of the art graphics or many
levels for a game.
7The author would like to thank the anonymous CIST reviewer that suggested this research idea
21
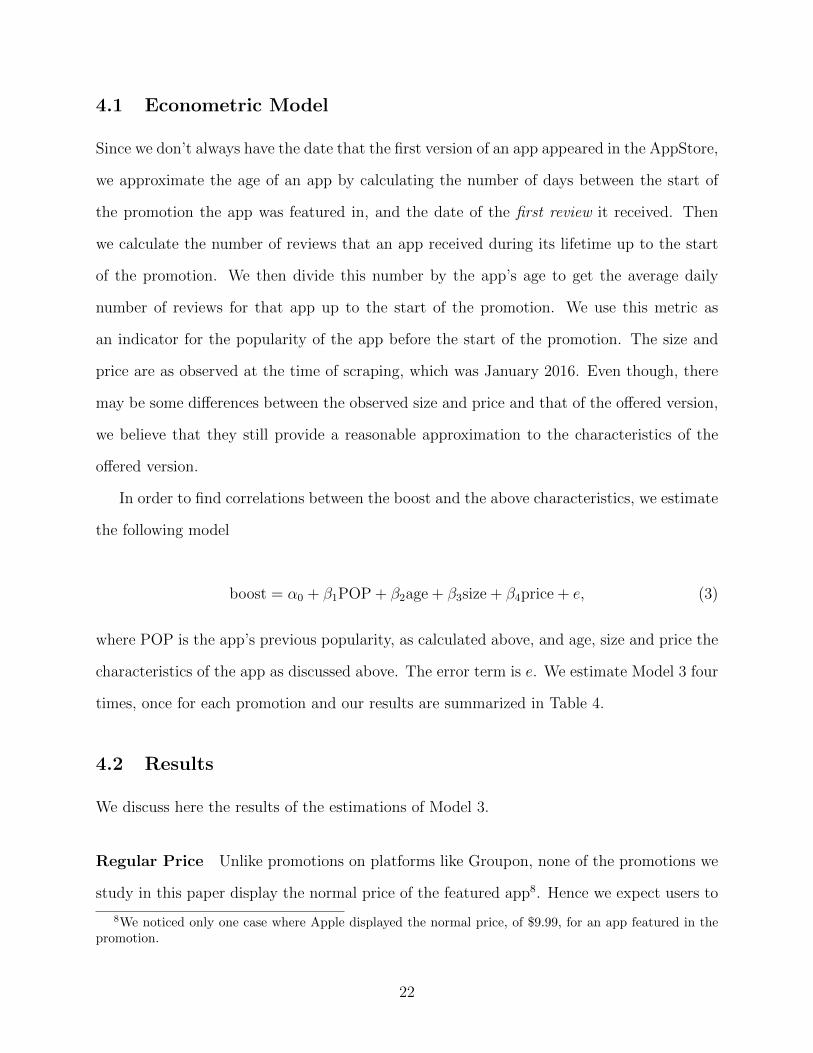
4.1 Econometric Model
Since we don’t always have the date that the first version of an app appeared in the AppStore,
we approximate the age of an app by calculating the number of days between the start of
the promotion the app was featured in, and the date of the first review it received. Then
we calculate the number of reviews that an app received during its lifetime up to the start
of the promotion. We then divide this number by the app’s age to get the average daily
number of reviews for that app up to the start of the promotion. We use this metric as
an indicator for the popularity of the app before the start of the promotion. The size and
price are as observed at the time of scraping, which was January 2016. Even though, there
may be some differences between the observed size and price and that of the offered version,
we believe that they still provide a reasonable approximation to the characteristics of the
offered version.
In order to find correlations between the boost and the above characteristics, we estimate
the following model
boost = α0 + β1POP + β2age + β3size + β4price + e, (3)
where POP is the app’s previous popularity, as calculated above, and age, size and price the
characteristics of the app as discussed above. The error term is e. We estimate Model 3 four
times, once for each promotion and our results are summarized in Table 4.
4.2 Results
We discuss here the results of the estimations of Model 3.
Regular Price Unlike promotions on platforms like Groupon, none of the promotions we
study in this paper display the normal price of the featured app8. Hence we expect users to
8We noticed only one case where Apple displayed the normal price, of $9.99, for an app featured in thepromotion.
22
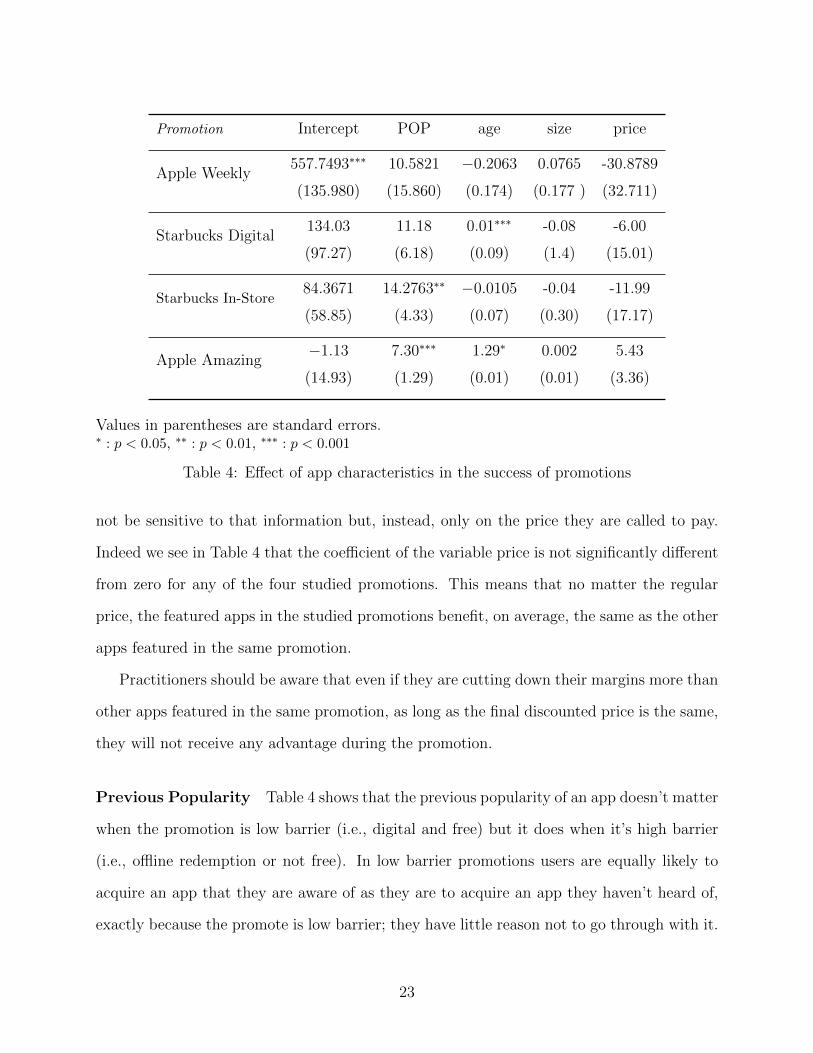
Promotion Intercept POP age size price
Apple Weekly557.7493∗∗∗ 10.5821 −0.2063 0.0765 -30.8789
(135.980) (15.860) (0.174) (0.177 ) (32.711)
Starbucks Digital134.03 11.18 0.01∗∗∗ -0.08 -6.00
(97.27) (6.18) (0.09) (1.4) (15.01)
Starbucks In-Store84.3671 14.2763∗∗ −0.0105 -0.04 -11.99
(58.85) (4.33) (0.07) (0.30) (17.17)
Apple Amazing−1.13 7.30∗∗∗ 1.29∗ 0.002 5.43
(14.93) (1.29) (0.01) (0.01) (3.36)
Values in parentheses are standard errors.∗ : p < 0.05, ∗∗ : p < 0.01, ∗∗∗ : p < 0.001
Table 4: Effect of app characteristics in the success of promotions
not be sensitive to that information but, instead, only on the price they are called to pay.
Indeed we see in Table 4 that the coefficient of the variable price is not significantly different
from zero for any of the four studied promotions. This means that no matter the regular
price, the featured apps in the studied promotions benefit, on average, the same as the other
apps featured in the same promotion.
Practitioners should be aware that even if they are cutting down their margins more than
other apps featured in the same promotion, as long as the final discounted price is the same,
they will not receive any advantage during the promotion.
Previous Popularity Table 4 shows that the previous popularity of an app doesn’t matter
when the promotion is low barrier (i.e., digital and free) but it does when it’s high barrier
(i.e., offline redemption or not free). In low barrier promotions users are equally likely to
acquire an app that they are aware of as they are to acquire an app they haven’t heard of,
exactly because the promote is low barrier; they have little reason not to go through with it.
23
But with high barrier promotions, users are more likely to do the effort required to redeem
the coupon or pay the (reduced) price if they are aware of the app already.
Hence, we see that high barrier promotions induce a ‘rich-get-richer’ effect, where the
increase an app observes during the promotion is proportional to their previous popularity.
In contrast, apps participating in low barrier promotions receive, on average, the same
increase no matter their previous popularity.
Age The age of an app can be an indicator of how established it is and how much time it
had to build its user base and word of mouth. We see in Table 4 that the coefficient for the
age variable is not significantly different from zero for all of the studied promotions except
the Apple Amazing one, the only promotion that offers partial discount. This could indicate
the users are more willing to pay even a reduced price for apps that have been in the market
longer, and hence, perhaps, had the time to release multiple versions fixing any bugs and
improving their product. In contrast, in free promotions the app’s success is not dependent
on it’s age.
Size Finally, we use the size of the offered app as an indicator for the level of sophistication
of the source code as well as characteristics like graphics, number of gameplay levels (if the
app is a game) and more. We see in Table 4, that the coefficient for the size variable is not
significantly different from zero for any of the studied promotions. This means that when
promoted, apps of all sizes benefit, on average, the same from the promotion.
Our insights from this section can help practitioners better design their own promotions
according to their apps. For examplee, apps that are newer and not yet very succesfull
should avoid being featured in high barrier promotions alongside with more successful apps,
since the more successful apps will disproportionally benefit from the promotion.
24
5 Effect of the Promotions on the Competition
Many online stores today use machine learning algorithms that, based on user’s behavior on
the site try to recommend items that the user might be interested in. For example, Amazon
has a section called ‘Customers Who Bought This Item Also Bought’ on the product pages
of their item. Such recommendation algorithms can help users explore and discover new
products of interest in an otherwise very large search space of options (e.g., Amazon and
eBay have millions of products each for sale, Google’s and Apple’s App Store have more
than 1.5 million apps each).
Apple’s recommendation engine in the AppStore works mainly by displaying a ‘Customers
also bough’ tab on the product page of many apps. Even though sometimes these apps can
be complimentary (such as Facebook and Messenger) most of the times they seem to be
competing. For example, a casual game will have recommendations for other casual games
and a productivity app will have recommendations for other apps with similar functions.
These similar apps, compete for the user’s attention, wallet as well as phone storage space
(the 16GB model is the best selling amongst the iPhones).
For every promoted app we gathered the apps appearing in its ‘Customers also bought’
tab’. We then collected the entire review history of every such app. We aim to study the effect
of the promotions on these competing apps’ sales. A negative effect on sales would suggest
that the promotion causes customers to select the promoted app amongst the alternatives,
possibly because of it’s discounted price or to avoid the cost of searching further. A positive
effect would suggest that the promoted app increases awareness for itself as well as apps
similar to it and customers use the promoted app as a starting point to search further for
the best alternative.
25
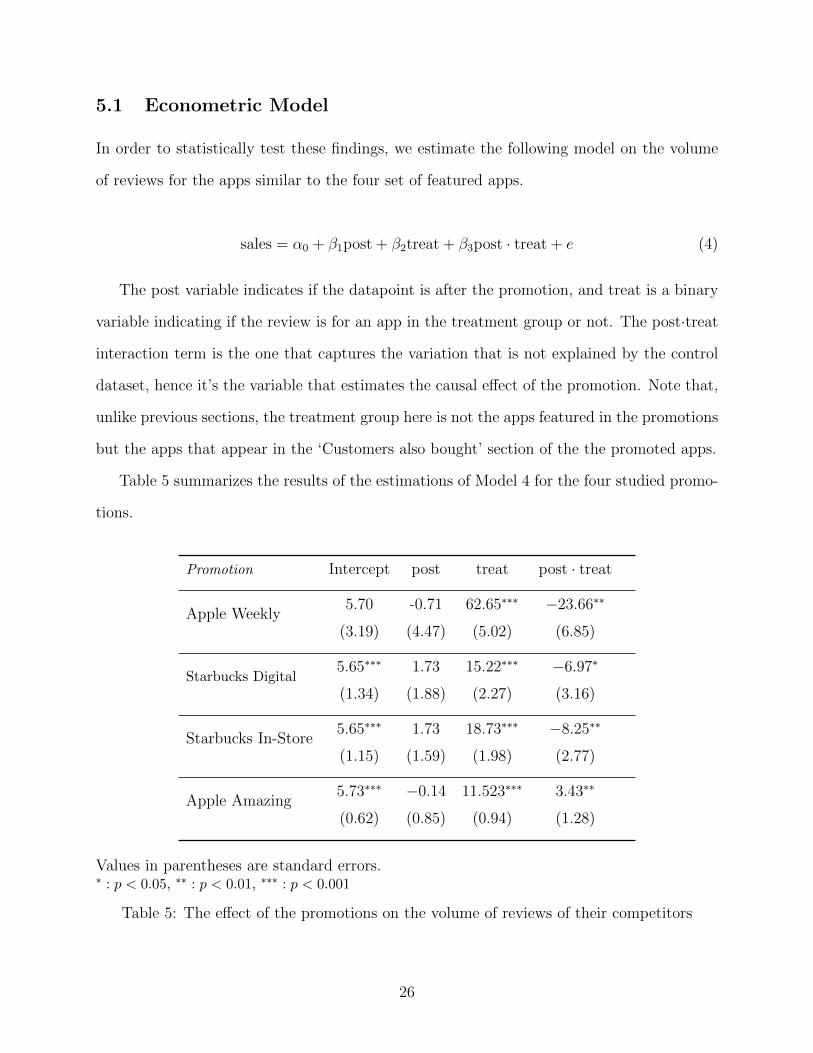
5.1 Econometric Model
In order to statistically test these findings, we estimate the following model on the volume
of reviews for the apps similar to the four set of featured apps.
sales = α0 + β1post + β2treat + β3post · treat + e (4)
The post variable indicates if the datapoint is after the promotion, and treat is a binary
variable indicating if the review is for an app in the treatment group or not. The post·treat
interaction term is the one that captures the variation that is not explained by the control
dataset, hence it’s the variable that estimates the causal effect of the promotion. Note that,
unlike previous sections, the treatment group here is not the apps featured in the promotions
but the apps that appear in the ‘Customers also bought’ section of the the promoted apps.
Table 5 summarizes the results of the estimations of Model 4 for the four studied promo-
tions.
Promotion Intercept post treat post · treat
Apple Weekly5.70 -0.71 62.65∗∗∗ −23.66∗∗
(3.19) (4.47) (5.02) (6.85)
Starbucks Digital5.65∗∗∗ 1.73 15.22∗∗∗ −6.97∗
(1.34) (1.88) (2.27) (3.16)
Starbucks In-Store5.65∗∗∗ 1.73 18.73∗∗∗ −8.25∗∗
(1.15) (1.59) (1.98) (2.77)
Apple Amazing5.73∗∗∗ −0.14 11.523∗∗∗ 3.43∗∗
(0.62) (0.85) (0.94) (1.28)
Values in parentheses are standard errors.∗ : p < 0.05, ∗∗ : p < 0.01, ∗∗∗ : p < 0.001
Table 5: The effect of the promotions on the volume of reviews of their competitors
26
The post·treat coefficients are the ones estimating the extend of the effect that cannot
be explained by the control dataset. We see that the coefficients are negative and significant
for Apple Weekly and Starbucks In-Store, negative and barely not significant (p=0.08) for
Starbucks Digital and positive and significant for Apple Amazing.
5.2 Results
Since low barrier promotions make it very easy and costless for the user to acquire the
promoted app, we expect that customers exposed to such suers will not explore for further
alternatives and hence competing sales will decrease. Indeed, we find that apps competing
with Apple Weekly promotions see their average daily number of reviews fall by XX in
the 7 days of the promotion compared to the 7 days before. Similarly, we see a decrease
of YY for apps competing with Starbucks Digital apps. Furthermore, we find that even
apps competing with the Starbucks In-Store apps see a decrease of ZZ. This is even though
Starbucks In-Store has a slightly non-trivial redemption procedure. Finally, and perhaps
most interestingly, we find an increase of ZZ for the sales of the apps competing with Apple
Amazing apps.
The negative and significant coefficients for the post·treat variable for all full price dis-
counted promotions, shown in Table 5, confirm that such promotions have a negative effect
on the sales of their competition. In contrast, the only partially discounted promotion causes
an increase in the sales of its competition.
This suggests that, especially in electronic markets where such recommendation algo-
rithms are in place, increasing awareness for a product may increase awareness and sales for
it’s competition. That is, unless the promotion is such that offers no incentives for users to
explore for further alternatives, such as a full price discount.
We expect similar positive and negative externalities to exists in other types of markets
as well, and in other types of marketing campaigns. Essentially, if we look at the recommen-
dation graph produced by the centralized platform as a graph on which the user is walking
27
a random walk, any increase in the probability of a specific point will have some effects on
that point’s neighbors.
This suggests that practitioners designing marketing campaigns for their products should
be aware of the positive externalities they can have on their competition. In fact, phenomena
similar to this has already been observed in the literature, Lewis and Nguyen (2014)
6 Discussion and Insights
We studied four promotions offered on Apple’s iOS AppStore, that varied in scale of exposure,
level of price discount and ease of redemption. We aim to understand better the effects that
these promotions have on the sales as well as the ratings of the featured apps. We found
positive effects on the sales for all promotions and mixed effects on the ratings. Notably,
the only promotion that was not full price discounted was that only one that had a negative
effect on the ratings of its featured apps whereas the weekly promotion run by Apple was
the one with the largest positive effect.
We also explored the correlation between app characteristics and how succesfull their
promotion campaign is. We found that when a promotion is low barrier, i.e., digital and free,
users are equally likely to get an app no matter the app’s previous popularity, regular price
and age. In contrast, promotions with higher barriers, such as non-zero price or non-trivial
redemption process, induce a rich-get-effect where users are more likely to get a promoted
app if it’s already established and successful.
Finally, our study also explored the effect of the promotions on the sales of their com-
petitors. We found that full price discounts decrease the sales of their competitors, perhaps
because users have no incentive to search for further alternatives. In contrast, the only par-
tially discounted promotion in our study, Apple Amazing, caused an increase in the sales of
it’s competition. This suggests that the promotion raised awareness for the featured apps,
but the non-free price tag incentivized users to hold back on their purchase until they explore
28
further alternatives.
These insights can help practitioners better design their promotion campaigns. Our
work displays the benefits in sales and ratings of being featured in carefully selected and far-
reaching promotions, but also the potential risks of not full price discounts. We also show
that apps are newer and not yet very popular should avoid being featured in high barrier
promotions alongside with more successful apps, since then the more succesfull apps will
disproportionally benefit from the promotion. Finally, we exhibit the positive and negative
externalities that various types of promotions can have, which make developers more aware
of the full extend of the effect that their promotions can have on their competitors, as well
as the other way around too.
7 Future Directions
We believe there are many interesting questions left to be studied in future work. First,
most of the other major app store platforms have their own variation of a ‘Free App of
the Week/Day’ promotion. Investigating if similar results hold for the other app stores can
increase our understanding on the subject and provide further insights for practitioners to
better design their promotions on various platform.
Furthermore, it’s interesting to see what is the effect of promotions that are not accom-
panied by any price discount, such as the ‘Editor’s Choice’ list. These promotions signal
that a high profile entity with knowledge on the matter (usually the App Store itself) is
endorsing an app for its high quality. What is the effect of such signals on the ratings and
sales of the featured apps?
Moreover, promotions done by the developer’s themselves can also be of interest. The
four promotions studied in this paper all involve a selection process by a third party, but at
any given day there are apps that are being sold in reduced prices, from their developers.
These promotions are closer in spirit to the ones offered on platforms like Groupon since they
29
are self-selected. Insights on the effect that these type of promotions have on the sales and
ratings of the apps can help our understanding of the ‘Groupon effect’ Byers et al. (2012).
It can also help developers explore better promotion strategies.
Finally, it will be of interest to see if effects similar to the ones discovered in this study
arise when other types of digital goods, such as songs and movies, are offered in promotion.
References
Panagiotis Adamopoulos and Vilma Todri. Social media analytics: The effectiveness of
promotional events on brand user base in social media. 2014.
Amir Ajorlou, Ali Jadbabaie, and Ali Kakhbod. Dynamic pricing in social networks: The
word of mouth effect. Available at SSRN 2495509, 2014.
Michael Anderson and Jeremy Magruder. Learning from the crowd: Regression discontinuity
estimates of the effects of an online review database*. The Economic Journal, 122(563):
957–989, 2012.
Suman Basuroy, Subimal Chatterjee, and S Abraham Ravid. How critical are critical reviews?
the box office effects of film critics, star power, and budgets. Journal of Marketing, 67(4):
103–117, 2003.
John W Byers, Michael Mitzenmacher, and Georgios Zervas. The groupon effect on yelp
ratings: a root cause analysis. In Proceedings of the 13th ACM Conference on Electronic
Commerce, pages 248–265. ACM, 2012.
Octavian Carare. The impact of bestseller rank on demand: Evidence from the app market*.
International Economic Review, 53(3):717–742, 2012.
Judith A Chevalier and Dina Mayzlin. The effect of word of mouth on sales: Online book
reviews. Journal of marketing research, 43(3):345–354, 2006.
30
Pradeep K Chintagunta, Shyam Gopinath, and Sriram Venkataraman. The effects of on-
line user reviews on movie box office performance: Accounting for sequential rollout and
aggregation across local markets. Marketing Science, 29(5):944–957, 2010.
Geng Cui, Hon-Kwong Lui, and Xiaoning Guo. The effect of online consumer reviews on
new product sales. International Journal of Electronic Commerce, 17(1):39–58, 2012.
Chrysanthos Dellarocas, Neveen Awad, and M Zhang. Using online ratings as a proxy of
word-of-mouth in motion picture revenue forecasting. Technical report, Citeseer, 2005.
Wenjing Duan, Bin Gu, and Andrew B Whinston. The dynamics of online word-of-mouth
and product sales?an empirical investigation of the movie industry. Journal of retailing,
84(2):233–242, 2008.
Benjamin Edelman, Sonia Jaffe, and Scott Duke Kominers. To groupon or not to groupon:
The profitability of deep discounts. Marketing Letters, pages 1–15, 2011.
Per Engstrom and Eskil Forsell. Demand effects of consumers’ stated and revealed prefer-
ences. Available at SSRN 2253859, 2014.
Randall A Lewis and Dan Tri Nguyen. A samsung ad for the ipad? display advertising’s
competitive spillovers to search. Display Advertising’s Competitive Spillovers to Search
(January 2, 2014), 2014.
Yong Liu. Word of mouth for movies: Its dynamics and impact on box office revenue. Journal
of marketing, 70(3):74–89, 2006.
Michael Luca. Reviews, reputation, and revenue: The case of yelp. com. Technical report,
Harvard Business School, 2011.
David A Reinstein and Christopher M Snyder. The influence of expert reviews on consumer
demand for experience goods: A case study of movie critics*. The journal of industrial
economics, 53(1):27–51, 2005.
31
Gert Jan Spriensma. The impact of app discounts and the impact of being a featured app.
Distimo Publicatio, 2012.
Feng Zhu and Xiaoquan Zhang. Impact of online consumer reviews on sales: The moderating
role of product and consumer characteristics. Journal of Marketing, 74(2):133–148, 2010.
32