Embed Size (px)
Citation preview
1
The Impact of the PCAOB Individual
Engagement Inspection Process – Preliminary Evidence
Daniel Aobdia
Public Company Accounting Oversight Board (PCAOB), Center for Economic Analysis
and
Kellogg School of Management, Northwestern University
This version: February 2016
The PCAOB, as a matter of policy disclaims responsibility for any private publication or statement by any of its
Economic Research Fellows and employees. The views expressed in this paper are the views of the author and do
not necessarily reflect the views of the Board, individual Board members, or staff of the PCAOB. I would like to
thank Preeti Choudhary, Michael Gurbutt, Sanjay Kallapur (discussant), Robert Knechel (discussant), Patricia
Ledesma, Robert Magee, Hollis A. Skaife, Suraj Srinivasan (discussant), Luigi Zingales, PCAOB staff and seminar
participants at the CPAAOB/FSA Japan, the 2015 HKUST Research Symposium, Northwestern University, the
PCAOB, the PCAOB/JAR 2015 conference on auditing and capital markets, the ninth PCAOB international institute
on audit regulation, Stanford University, and the University of Arizona for helpful discussions on earlier versions of
this work.
2
The Impact of the PCAOB Individual
Engagement Inspection Process – Preliminary Evidence
Abstract
This study investigates, mainly for the largest auditors, the impact on auditors’ and client issuers’
activities of the PCAOB individual engagement inspection process. Using a unique dataset of
inspected engagements and identified audit deficiencies (Part I Findings), I find that both auditor
and client issuer react to the issuance of a Part I Finding on their engagement. The audit firm
increases effort on its inspected engagement and also on non-inspected engagements of offices or
partners that receive a Part I Finding, suggesting both direct and spillover impact of the PCAOB
inspections. The client is also more likely to switch auditors, often to auditors with high
perceived quality. However, audit firms reduce their subsequent effort on inspected engagements
that did not receive a Part I Finding, perhaps because of a better understanding of where the Part
I Finding bar stands, and a lowered deterrence effect of the PCAOB inspection program
following a clean inspection. In contrast, clients are less likely to switch auditor following a
clean PCAOB inspection. Overall, these results suggest that both audit firms and client issuers
care about the PCAOB individual engagement inspection process and gravitate towards the level
of the Part I Finding bar.
Keywords: Impact of Regulation, Audit Quality, PCAOB Inspections, Auditor Effort.
JEL Classification: M42, M48.
3
1. Introduction
The purpose of this study is to assess the impact, at the auditor and client levels, of the
inspections of individual audit engagements conducted by the Public Company Accounting
Oversight Board (PCAOB). The PCAOB is a non-profit organization established by the
Sarbanes-Oxley Act of 2002 (SOX) to oversee the audits of public companies (referred to as
issuers or client issuers in the remainder of this paper) and improve audit quality. In particular,
the PCAOB conducts inspections of public accounting firms that audit issuers. These inspections
are annual for firms that regularly provide audit reports for more than 100 issuers, and at least
triennial otherwise (Section 104 of SOX). As part of an inspection, the PCAOB selects for
review specific aspects of certain audits, and usually sends a team of inspectors, all experienced
former auditors, to review the audit work performed.1 In the event that the inspection team, based
on applicable standards, determines that the work conducted by the audit engagement team was
not sufficient to support the audit opinion, the PCAOB issues a Part I Finding.2
Even though both PCAOB and the inspected audit firm know the exact identity of the
engagements inspected and the outcomes of the inspections, this information is not available to
the public, and not even directly available to the client issuer either (e.g., PCAOB, 2012). Part I
Findings are disclosed in the public inspection reports of the PCAOB, yet the names of the
1 In addition to the review of individual engagements, a PCAOB inspection also includes an evaluation of the audit
firm’s quality control systems, including a review of policies concerning audit performance, training, compliance
with independence requirements, and client management (e.g., PCAOB, 2012). If the PCAOB identifies deficiencies
in these quality control systems, a Part II Finding is issued. Part II Findings are not publicly disclosed if remediated
within one year (Section 104 of SOX). The focus of this paper is on the reviews of specific engagements, and not on
the evaluation of the firm’s quality control systems. 2 Because of the binary nature of the PCAOB Part I Findings, in the remainder of this paper, I refer to an audit with
a Part I Finding as a fail, and define an audit without a Part I Finding as a pass, or a clean audit. I also define the
level that separates engagements with Part I Findings from the other ones as the pass/fail bar. This level is based on
applicable audit standards. The “pass/fail” shorthand is my own for purposes of this analysis. It is not employed in
PCAOB inspections, and, in particular, the concept of “pass” should not be understood to indicate that PCAOB
inspectors, having reviewed only selected aspects of an audit, affirmatively concluded that an audit opinion was
sufficiently supported.
4
issuers are masked. Further, the identity of the engagements selected for inspection remains
unknown to the public. This lack of publicly available data has made it difficult for academic
researchers to identify proper research settings where the impact of the PCAOB inspections on
audit quality can be assessed (e.g., DeFond, 2010; DeFond and Lennox, 2015). Consequently,
with the notable exception of international inspections, which timing of introduction was
staggered over time (e.g., Lamoreaux, 2013; Fung et al., 2014; Krishnan et al., 2014; Shroff,
2015), the accounting literature, and the public in general, are still struggling to understand the
impact of the PCAOB inspection process on auditor effort, audit quality, and client issuers’
actions in general. For example, Kinney (2005), Palmrose (2006), and Lennox and Pittman (2010)
argue that less is known about audit firm quality post SOX.
The aim of this study is to determine the impact on the audit firm and the client issuer of the
inspections of individual audit engagements conducted by the PCAOB. Ex-ante, several forces
can influence this impact. On the one hand, auditors could take permanent action to correct the
deficiencies identified by the PCAOB through the inspection program, because SOX granted the
PCAOB the power to discipline firms for violation of auditing standards (see SOX Section 105)
and publicly disclose quality control issues that are not remediated (see SOX Section 104). On
the other hand, because of the confidential nature of the PCAOB inspection process, audit firms,
potentially skeptical about the value added provided by a PCAOB inspection, may only be
managing regulatory risk and take corrective actions in the deficiencies of their audits only when
they have no other option.3 Furthermore, a PCAOB inspection is likely to provide a signal to the
engagement team about where the pass/fail bar, itself determined by applicable audit standards,
3 For example, audit firms, including the Big 4, do not always remediate deficiencies identified by the PCAOB in
their systems of quality controls, thereby leading to the public disclosure of Part II Findings. Furthermore, in some
instances, audit firms have explicitly conveyed their disagreement with the inspection findings of the PCAOB in the
firms’ responses (see for example Deloitte’s responses to its 2004 inspection report and to its updated 2007
inspection report publicly disclosing Part II Findings).
5
exactly stands.4 On the one hand, such information may lead audit firms to increase audit quality
in general, regardless of whether Part I Findings are identified, in order to provide differentiation
to their audit services (e.g., Donovan, Frankel, Lee, Martin and Seo, 2014). On the other hand a
clean inspection may lead audit firms to inadvertently or advertently gravitate towards the
pass/fail bar in the absence of additional incentives to improve audit quality, especially if little
differentiation exists in the audit industry in terms of quality (Donovan et al., 2014). To assess
the impact of the PCAOB inspection process, I ask the following questions: What happens to
audit effort and quality following the inspection of a given engagement? Is this impact different
depending on whether a Part I Finding is identified or not? Is there a spillover effect of the
PCAOB inspections on other engagements of an inspected office or the engagement partner? Do
client issuers react at all to PCAOB inspections of their audits, and is this reaction different
depending on whether a Part I Finding is identified or not? The answers to these questions
present new insights into the impact of the PCAOB inspection program on auditor effort and
quality, and provide a better understanding of how the PCAOB can fulfill its mission to protect
investors and further the public interest in the preparation of informative, accurate and
independent audit reports. Furthermore, they also answer a broader question of whether the
actions of a regulatory entity are effective.
To assess the impact of the PCAOB inspection program, I use a proprietary dataset obtained
from the PCAOB that indicates which engagements were inspected and whether each inspected
engagement received a Part I Finding or not. This dataset spans the years 2003 to 2013. I
combine this dataset with another proprietary dataset obtained from the PCAOB of the hours
4 The inspection process, including the binary outcome related to Part I Findings, involves assessing compliance
with existing auditing standards rather than imposing any new requirements. Some auditors, however, may find the
process educational as to the meaning and application of those standards, and may adjust their practices accordingly.
See additional details in Subsection 3.1.
6
spent by the auditor on each engagement, the number of audit partner hours, the engagement
quality review partner (EQR) hours, and the information system auditor hours.5 I merge these
datasets with publicly available data obtained from Compustat and Audit Analytics. Because my
datasets are often restricted to the largest audit firms, one caveat of this study is that its results
are mostly applicable to larger audit firms, and not necessarily to smaller ones.
In the first set of tests, I compare the inspected engagements with a control group of non-
inspected engagements using a difference-in-differences specification. I also split the inspected
engagements between those receiving a Part I Finding and those that do not. I find evidence that
the audit firm takes corrective action on the engagements that received a Part I Finding.
Specifically, auditors increase total hours between 5% and 8% the year following the
identification of a deficiency on their engagement, of which total partner hours increase by 11%
to 19%, depending on the specification and control group used. This increase in auditor effort
translates into higher audit fees, up to 3%, which suggests that the auditor is unable to fully
recoup its increased effort in the form of increased fees.6 The results are quite different when the
engagement passes the PCAOB inspection process. In this case, I find a decline in audit effort
the year following the inspection, with a reduction in the partner hours of 6% and in the
engagement quality review partner hours of 8%.7 I also find an increase in the probability of
restatements of the issuer, which appears to be driven by the more severe types of restatements,
those disclosed in a form 8-K under item 4.02 (Non-Reliance on Previously Issued Financial
Statements or a Related Audit Report or Completed Interim Review). Overall, these results
suggest that auditors gravitate towards the pass/fail bar, perhaps because of a better
5 The dataset on the hours is only available for the 2008 to 2013 U.S. engagements of the largest audit firms, and
also includes the identity of the engagement partner. 6 Untabulated analyses confirm that the average hourly rate goes down following a Part I Finding.
7 Audit fees and hours also go down significantly two years following the inspection.
7
understanding of where this bar stands following the inspection process. These results are also
consistent with the PCAOB being able to use the inspection program to enforce a minimum level
of audit quality among audit firms, but not necessarily to spur additional action beyond this
minimum level.8
The results of mild deterioration in audit effort following a clean PCAOB inspection could
also be driven by a lower probability of inspection by the PCAOB the subsequent year, thereby
reflecting a lower deterrence effect from the PCAOB inspections process for these engagements
(e.g., DeFond, 2010).9 I test for this possibility using an inspection selection model and find that
the PCAOB was in the past less likely to inspect engagements that passed an inspection in the
prior year, consistent with this explanation.10
Consequently, the reduction in audit hours may be
entirely driven or compounded by a decreased deterrence effect of the PCAOB inspections
(DeFond, 2010). As such the observed increase in restatements following a clean inspection (the
probability increases by approximately 1.6%) may represent an estimate of a lower bound of the
deterrence effect of the PCAOB inspection process.
In the next set of analyses, I test whether client issuers react to their audit engagement being
selected for inspection or to receiving a Part I Finding. Because the PCAOB is precluded from
communicating directly with the client issuer about the results of the inspection (e.g., PCAOB,
2012), the issuer may not even be aware that its audit was selected for inspection. Furthermore,
the issuer may only be concerned about obtaining an audit at the lowest cost possible, especially
8 Note that this result is akin to results in the managerial accounting literature that find that managers actively target,
from both upper and lower sides, the thresholds required to meet their bonus (e.g, Healy, 1985; Holthausen, Larcker
and Sloan, 1995, and Gaver, Gaver and Austin, 1995). However, the analysis in this paper is unable to disentangle
whether gravitating towards the pass/fail bar is a deliberate action or not from an auditor’s standpoint. 9 In particular, it is likely that the audit firm, able to observe the past inspections for its engagements, would have
perceived such a pattern in the PCAOB inspections process. 10
Note that this result, based on prior practices, does not speak of the current or future criteria chosen by the
PCAOB to select engagements for inspection. For example, the PCAOB recently announced its initiative to add
more randomization to its inspection selection program (e.g., Doty, 2015).
8
given that the inspection results will not be publicly tied to its audit. I find that an issuer whose
audit passed the PCAOB inspection is 14% less likely than non-inspected engagements to switch
auditors within the following two years. Furthermore, an issuer whose audit inspection received
a Part I Finding is 20% more likely than non-inspected engagements to switch auditors.
Additional analyses suggest that the increased switching activity is not driven by increased
auditor resignation or by a need to reduce audit fees. Further, I find some evidence that switching
issuers are more likely to switch to auditors with high perceived quality.11
Overall, these results
suggest that issuers care about the quality of their audits and the certification role of the PCAOB
inspections, and thus are significantly more likely to take prompt action in case a deficiency is
identified by the PCAOB. The impact of the PCAOB inspections at the issuer level could
potentially be even greater if the PCAOB were allowed to communicate directly the inspection
results to the client issuer.
In the final set of tests, I assess whether PCAOB inspections of individual engagements
generate spillover effects. Ex-ante, because PCAOB inspections are risk based (e.g., Hanson,
2012), it is unclear whether such spillover effects exist. Specifically, the deficiencies identified
during the inspection process may not be representative of issues encountered in different audits.
I focus on non-inspected engagements audited in the same year by inspected engagement
partners or offices. I also consider whether the inspected engagements received a clean
inspection report or a Part I Finding. Using a difference-in-differences specification, I find
evidence of a reaction for non-inspected engagements audited by inspected partners or offices, in
the form of higher hours worked, only when the inspected engagement received a Part I Finding.
These results suggest that the information communicated by the PCAOB to audit firms is useful
11
High perceived quality auditors are defined as Big 4 auditors or Big 4 auditors that are industry specialists. See
subsection 4.5 for additional details.
9
beyond the engagements directly inspected and that auditors act on the deficiencies identified by
the PCAOB.
Overall, this study contributes to an emerging literature that focuses on the impact of the
PCAOB inspections, and responds to DeFond and Zhang (2014) who mention the limited
number of studies in this area. The study also responds to DeFond and Lennox (2015), who
mention that one major issue of the existing literature on the PCAOB inspections for U.S. audit
firms is the lack of identification resulting from the absence of appropriate control groups. Using
unique datasets that allow building a design with reasonably clean identification, I find a positive
impact of the PCAOB inspections program in terms of auditor effort, for inspected engagements,
and also for non-inspected engagements covered by the same engagement partner or office.
However, this effect exists only when deficiencies are identified by the PCAOB. Client issuers
also appear to care about the potential certification derived from the PCAOB inspection program.
One issue raised by my results is that audit firms may gravitate towards the pass/fail bar. This
result is consistent with auditors being unable, in the current U.S. disclosure regime, to credibly
signal audit quality to the market participants beyond the minimum level imposed by existing
auditing standards and the PCAOB (Donovan et al., 2014).12
Nevertheless, enforcing an adequate
level of audit quality is consistent with the mission of the PCAOB, and can help mitigate an
important conflict of interest on the auditor side that it is hired, paid and retained by the client
issuer to potentially provide unfavorable opinions about its financial statements and internal
controls (e.g., Watts and Zimmerman, 1981; Palmrose, 2006; Moore, Tetlock, Tanlu and
Bazerman, 2006; DeFond and Zhang, 2014).
12
In alternative disclosure regimes, the auditor may be able to more credibly disclose audit quality to the market
participants. For example, Aobdia, Lin and Petacchi (2015) find that disclosure of the name of the engagement
partner in Taiwan brings value to capital market participants. Further, anecdotal evidence also suggests that auditors
may try to differentiate themselves in their audit disclosures in the U.K., following adoption of new rules in 2014
(e.g., Norris, 2014; Tysiac, 2014).
10
The remainder of this paper is structured as follows. Section 2 provides some background on
the PCAOB inspections and a review of the prior literature; Section 3, the hypothesis
development; Section 4, the auditor reaction tests; Section 5 the client reaction tests; and Section
6, the spillover impact of the PCAOB individual engagement inspections. Section 7 concludes.
2. Background on PCAOB inspections and Prior Literature
2.1 PCAOB Inspections
Prior to SOX, audit firms were self-regulated through, among other things, the AICPA’s peer
review program, started in the 1970s (e.g., Hermanson, Houston and Rice, 2007; Lennox and
Pittman, 2010). Several well-known accounting scandals at Enron, WorldCom and elsewhere
prompted change (e.g., Hanson, 2012). As part of SOX, Congress established independent
oversight of the accounting profession by the PCAOB for audits of issuers. Since its creation, the
PCAOB has, each year, conducted hundreds of inspections of registered public accounting firms
that audit issuers. These inspections are annual for firms that regularly provide audit reports for
more than 100 issuers, and at least triennial otherwise (Section 104 of SOX).
One element of the inspection program involves the selection of specific engagements for
review. The PCAOB usually inspects a select group of engagements of each audit firm, using a
risk-based selection approach (e.g., Hanson, 2012).13
The PCAOB then notifies the audit firm,
requests some initial data (e.g., Eskow, 2004; Fischer, 2006; Center for Audit Quality, 2012),
and usually sends a team of experienced audit inspectors (Aobdia, 2015), to conduct fieldwork at
the audit firm’s office.14
This fieldwork usually lasts approximately one week (e.g., Riley et al.,
2008; Johnson, Keune and Winchel, 2014). During the fieldwork, the PCAOB inspectors dissect
13
Usually, only limited areas of the engagement are reviewed, often those that appear to the inspectors to be the
most critical for the audit (Hanson 2012; Aobdia, 2015). 14
For smaller audit firms all of the inspection fieldwork may take place in one of the PCAOB offices (PCAOB
Annual Report, 2005).
11
the audit work papers, interact frequently with the engagement team to improve their
understanding of the work completed during the audit, and determine whether the work
performed by the engagement team is sufficient, based on the applicable standards related to
auditing issuers, to support the audit opinion. In the event that it is not sufficient, the PCAOB
issues a Part I Finding for that specific engagement. Part I Findings are made public in the annual
inspection reports of individual audit firms, disclosed by the PCAOB. The Appendix B of this
paper provides a publicly disclosed example of a Part I Finding identified on one of Deloitte’s
engagements for the 2011 inspection. The Part I Finding pinpoints the area of the audit where the
engagement team failed to gather sufficient evidence to support their opinion. However, the
name of the issuer is masked. In addition, the specific engagements selected for inspection are
not publicly disclosed. Consequently, an important part of the inspection process is not disclosed
to the public and only aggregate inference can be made with publicly available data.
(Insert Figure 1 About Here)
The typical timeline of the inspection of individual engagements is provided in Figure 1.
Inspection fieldwork for the audit engagements with issuer fiscal years ending between April 1st
of year t and March 31st of year t+1 is typically conducted between March and November of year
t+1, after these engagements are completed. Importantly, the PCAOB provides feedback to the
engagement team reasonably quickly about whether deficiencies were identified in the audit
engagement. In particular, the substance of the inspection comment forms (the precursor of a
Part I Finding which describes each concern on a particular audit in detail [e.g., PCAOB, 2012])
is ordinarily shared on-site with the audit team (Riley et al., 2008).15
Given that a large part of
15
The PCAOB, during its report writing phase, ultimately issues Part I Findings based on the comment forms
communicated to the firms, and the firm’s response to these comment forms (PCAOB, 2012). Therefore, even
12
the audit work is completed around the end of the issuer’s fiscal year, the inspection timeline
generally leaves sufficient time for the engagement team to adjust its effort for the year t+1 audit.
This analysis suggests that assessing the change in audit effort in year t+1 for inspections of
engagements of year t is appropriate.16
It is unclear whether or when the client issuer is notified of the results of the PCAOB
inspection process, because SOX prevents the PCAOB from directly disclosing the inspection
results regarding a particular audit engagement to parties besides the audit firm (PCAOB, 2012).
Consequently, the client issuer is only likely to be aware if the audit firm disclosed the results of
the inspection, and it is unclear when the timing of such disclosure would occur. Anecdotal
evidence suggests that the client issuer may be aware of a PCAOB inspection on its engagement,
at least in some instances. For example, the PCAOB sometimes interviews the issuer’s audit
committee chairperson as part of the individual inspection process (Riley et al., 2008; Center for
Audit Quality, 2012). Nevertheless, if inspection results are voluntarily communicated, this is
likely to occur towards the end of year t+1 or after. Consequently, the client issuer is unlikely to
have sufficient time to hire a new auditor for its year t+1 audit. Thus I evaluate client switching
activities between year t and year t+2 for inspections of engagements of year t.
2.2 Prior literature
Relatively little literature is available about the impact of the PCAOB inspections, because
the public does not know which engagements are selected for inspection and which ones receive
though the “official” Part I Finding may not have been issued prior to the end of the year t+1 engagement, the audit
firm already has a very good sense of whether a Part I Finding will be issued or not for a particular engagement. 16
See also the 2007 PCAOB annual report that indicates that “A firm may begin to take steps to address the
inspectors’ comments even before the final inspection report is issued. This is encouraged …”
13
Part I Findings.17
This contrasts with an emerging literature that focuses on SEC comment letters
and their impact on financial reporting quality of publicly traded corporations (e.g., Johnston and
Petacchi, 2014; Cassel, Dreher and Meyers, 2013; Blackburne, 2014).18
Because of the lack of
publicly available data and identification challenges from a research design standpoint, most
studies assessing the impact of PCAOB inspections on audit quality focus on the staggered
introduction of the inspection regime for foreign auditors (e.g., Lamoreaux, 2013; Fung et al.,
2014; Krishnan et al., 2014; Shroff, 2015). Results are generally consistent with PCAOB
inspections increasing audit quality for foreign auditors. In a recent study focusing on the U.S.,
DeFond and Lennox (2015) find evidence that the PCAOB successfully used its inspection
program to improve auditors’ ability to identify and report material weaknesses.19
However,
because of the inability to identify the individual engagements subject to PCAOB inspections
from publicly available data, no study focuses on the inspections of individual engagements and
their impact on audit quality.
A branch of the literature also assesses the market share impact of PCAOB inspections, using
the publicly disclosed part of the inspection reports. The results are relatively mixed here.
Lennox and Pittman (2010) do not find any change in subsequent audit firms’ market shares
following aggregate Part I Finding disclosures by the PCAOB. However, Abbott, Gunny and
Zhang (2013), Nagy (2014) and Boone, Khurana and Raman (2015), using different settings,
17
For example, Lennox and Pittman (2010) suggest that less in known about audit quality since the PCAOB began
conducting inspections. 18
In particular, following investor interest, the SEC made the decision to publish these comment letters beginning in
2005 (Johnston and Petacchi, 2014). 19
Church and Shefchik (2012) also find that the number of audit deficiencies from the PCAOB inspection reports
went down between 2004 and 2009 for large inspected firms, suggesting a positive impact of the PCAOB
inspections on audit quality. Carcello, Hollingsworth and Mastrolia (2011) also find some positive evidence of
PCAOB inspections on the quality of audits provided by the Big 4.
14
find evidence of negative market share impact on audit firms following the issuance of negative
PCAOB reports.
3. Hypothesis development
3.1. Audit firm reaction to engagements inspected by the PCAOB
Auditing standards provide a minimum bar auditors need to meet or beat in order to conduct
an audit that supports their opinion (Dye, 1993). However, there is some uncertainty around the
exact requirements for some of the standards. The PCAOB provides, during the inspection of
individual engagements, feedback about whether this bar is met (in case it is not, the auditor
receives a Part I Finding). This suggests that auditors might be using their experience with the
PCAOB inspection process to try to determine where the minimum bar stands. Because the
reaction of the auditor is likely to be asymmetric depending on whether the auditor is above or
below the bar, I consider these two possibilities below.
In case the engagement falls below the bar, the Part I Finding case, the PCAOB gives clear
feedback about the audit deficiency, often before the end of its fieldwork conducted on an
engagement (Riley et al., 2008; PCAOB, 2007). Consequently, the inspection process provides
the engagement team with valuable information, and the engagement team generally knows
corrective actions need to be taken to support the audit opinion for the portions of its audit that
were inspected.20
The question remains whether the engagement team will use the information
obtained from the inspection to improve the audit over the long run. Several arguments support
this hypothesis. First, the PCAOB can take action against non-complying engagement teams,
including disciplinary proceedings and referral to the SEC (PCAOB, 2008; DeFond, 2010). For
20
Such information can be assessed by looking at the PCAOB inspection reports, which disclose the nature of the
Part I Findings.
15
example, in an extreme case, the PCAOB issued a disciplinary order against Deloitte in 2007 and
fined the audit firm $1M for violations of auditing standards in connection with the 2003 audit of
Ligand Pharmaceuticals (PCAOB, 2007; Boone, Khurana and Raman, 2015). Second, it could be
the case that an engagement receiving a Part I Finding is inspected again the following year (see
the analysis in subsections 4.5 and 4.6). If this is the case, audit firms, able to observe the
inspection history for their own firm, are likely to be aware of this inspection pattern and take
action to make sure the engagement does not receive another Part I Finding. If such a case
happened, the PCAOB could take additional action such as identifying deficiencies in the firms’
overall system of quality control (a Part II Finding), or even possibly refer the case for
enforcement (e.g., PCAOB, 2012). On the other hand, audit firms could ignore the information
provided by the PCAOB inspection for subsequent years, in case the probability of a future
inspection is relatively low or if they disagree with the deficiencies identified by the PCAOB.
Furthermore, the potential actions taken by the PCAOB, including Part II Findings, which are
not publicly disclosed if remediated within one year, may not be material enough for the firm to
significantly change its audit going forward.21
Consequently, it remains an empirical question
whether the audit firm substantially changes its effort on a particular engagement following the
issuance of a Part I Finding. This results in the following hypothesis, stated in a null form:
H1a: The audit firm does not change its effort following an inspection with a Part I Finding
In case of a passed inspection, the engagement team is less likely to receive as much
information as in a failed inspection. Consequently, the audit firm may keep its effort the same
for clean engagements. Furthermore, regardless of whether deficiencies are identified by the
21
For example, audit firms, including the Big 4, do not always remediate firmwide quality control deficiencies
identified by the PCAOB, thereby resulting in the public disclosure of Part II Findings for the firms (see for example
the 2008 inspection report for Deloitte & Touche, or the 2011 inspection report for KPMG).
16
PCAOB, the inspection process itself could still result in additional insights about the work of
the engagement team and the quality of the audit. This could lead the audit firm to increase audit
effort on specific areas of the engagement to increase audit quality, in case audit quality beyond
the pass/fail bar is valued by the client issuer or the capital markets. This argument would be
consistent with a world where cross-sectional variation in audit quality matters (Donovan et al.,
2014). In other words, if audit differentiation matters to capital market participants, and the audit
firm is able to credibly convey this extra-quality, then the audit firm should keep its effort the
same, or slightly increase it, following a PCAOB inspection. However, interactions with PCAOB
inspectors during the inspection process could also lead the engagement team to form
expectations about how much above the bar they are. Because additional audit effort is costly
(e.g., Dye, 1993), in a world where cross-sectional differentiation in audit quality does not matter
(Donovan et al., 2014), the audit team, to increase the profitability of the audit, or retain a price
sensitive client, could strategically lower the effort on its audit to be closer to the bar.22
Further,
if the PCAOB is less likely to inspect again an engagement that passed an inspection, the
deterrence effect of the inspection process itself (e.g., DeFond, 2010) would mechanically be
lowered, thereby providing additional incentives for the audit firm to lower auditor effort on a
specific engagement.23
In such a case, the audit team may also be more relaxed about their
engagement in general and make more inadvertent mistakes.24
Consequently, it remains an
empirical question whether the audit firm changes its effort on an engagement that passes a
PCAOB inspection. This results in the following hypothesis, stated in a null form:
22
Client issuers may also relax their accounting if they learn that their engagement received a clean inspection report. 23
Because audit firms are able to observe which of their engagements are selected for inspection, they are able to
form expectations about which engagements will be selected in the future, for at least some categories, and could
strategically change audit quality based on these expectations. 24
For example, anecdotal evidence suggests that engagement partners used to increase the work performed on their
engagements on the specific years they were internally reviewed, because they knew with certainty when this
internal review would occur.
17
H1b: The audit firm does not change its effort following a passed PCAOB inspection
3.2. Client issuer reaction to their engagement inspected by the PCAOB
Ex-ante, it is unclear whether client issuers are aware of whether their engagement was
selected for inspection and the specific results of the inspection, given that the PCAOB is
precluded from directly communicating this information to them (e.g., PCAOB, 2012). Thus
client issuers may not react to the issuance of a Part I Finding. However, an argument can be
made that, in certain instances, the client issuer is aware of the PCAOB inspection of their
engagement and what the results of the inspection are. First, the audit firm could directly
communicate this information to the audit committee or client executives, especially when the
inspection did not result in a Part I Finding. Former auditors have suggested, anecdotally, that
particularly in recent years, audit firms have generally informed their clients about whether their
engagements were subject to inspection and what the outcome was. Second, in several instances,
the PCAOB interviews the audit committee chair as part of the review of the communications
between the audit firm and the audit committee (e.g., PCAOB, 2012; Center for Audit Quality,
2012), which would at least inform the client issuer of the existence of a PCAOB inspection of
their engagement. If audit committees care about the quality of their engagement beyond the
opinion provided by the audit firm on their financial statements and internal controls, then client
issuers would be less likely to switch of auditor following a clean inspection and more likely
following the issuance of a Part I Finding. In case of a switch for quality-related reasons, the
issuer could be more likely to switch to a high perceived-quality auditor. However, the issuance
of a clean audit opinion, at the lowest cost possible, may be the only item that matters to the
audit committee, especially because the public is unaware of which engagements were selected
for inspection by the PCAOB. Furthermore, clients may be unable to switch auditors because of
18
high switching costs in auditing. As a result, following the issuance of a Part I Finding, the client
may not switch auditors, or may only do so with an opinion shopping purpose (Teoh, 1992;
Lennox, 2000) because of increased scrutiny by their incumbent auditor. Further, the auditor
could also resign from the engagement following a Part I Finding, if, based on the additional
audit work required, servicing the client may not make sense economically. Consequently, it
remains an empirical question whether client issuers take action following a PCAOB inspection.
I test the following hypotheses, stated in their null forms:
H2a: The client issuer does not react to a clean inspection report of its engagement
H2b: The client issuer does not react to an inspection report with a Part I Finding of its
engagement
3.3. Spillover effects of the PCAOB individual engagement inspection process
Ex-ante, it is unclear whether PCAOB inspections of individual engagements result in
spillover effects. On the one hand, especially in the case of issuance of a Part I Finding, the
inspection may result in the release of information that could be useful to other engagements in
the same office or covered by the same partner. For example, an audit deficiency identified in the
context of a specific engagement could actually be representative of a more systemic issue of an
engagement partner or an audit office. This could lead the audit firm and personnel to take action
on these engagements. Further, the immediate physical proximity of the PCAOB inspectors
during the inspection fieldwork could increase the perceived deterrence effect of the PCAOB
inspections, thereby yielding increased audit effort for other engagements. On the other hand, the
risk-based selection process of engagements subject to inspection (e.g., Olson, 2008; Hanson,
2012; Church and Shefchik, 2012) may make the deficiencies identified on a specific
engagement irrelevant for other engagements of the inspected engagement partner (or office).
Further, the audit firm may take a myopic view of the PCAOB inspection process and SOX in
19
general and only take action on the deficiencies directly identified by the PCAOB, without
regard to quality on related but non-inspected engagements. Consequently, I test the following
hypotheses, stated in their null forms:
H3a: There is no spillover effect at the audit-firm partner level of the PCAOB inspections of
individual engagements
H3b: There is no spillover effect at the audit-firm office level of the PCAOB inspections of
individual engagements
4. Auditor reaction tests
4.1 Sample Construction
I obtain individual PCAOB inspections and Part I Findings data from the PCAOB. These
data cover the inspections corresponding to financial statements with fiscal years between 2003
and 2013, and include the name of the issuer inspected, its Central Index Key (CIK), its auditor,
the year of the inspection, and whether a Part I Finding is issued or not. I merge this dataset with
Compustat and Audit Analytics to obtain publicly available information on auditors, restatements,
audit fees, audit offices, and control variables. I also merge these data with audit hours and
engagement partner information obtained from the PCAOB.25
These data cover the fiscal years
2008 to 2013, are only available for the U.S. engagements of the largest audit firms, and include
partner name, as well as hours spent on the engagement, hours spent by the partners involved in
the audit, the quality review partner, and hours spent by the information system auditors. The
time and audit firm data restrictions greatly reduce the sample size for the analyses focusing on
audit hours. While the audit hours are generally well populated, the other types of hours are not
always available for every year and this further reduces the sample size for more detailed
analyses focusing on the hours of the partners, the information system auditors, and the
25
To reduce potential noise in the analyses, I only keep the inspections of the main auditor [in some instances, the
PCAOB reviews portions of engagements of certain issuers completed by affiliate offices (Center of Audit Quality,
2012)], and the inspections that fall within the typical timeline shown in Figure 1.
20
engagement review partner. The sample size varies with the analysis conducted and data
availability for the particular dependent variable considered. I do not restrict the sample to the
intersection of all data available, because doing so would considerably reduce the sample size for
most of the analyses.
4.2 Research Design
I test whether the auditor reacts to the PCAOB inspection process using a difference-in-
differences specification. In this analysis, the treatment group is composed of engagements that
are inspected by the PCAOB. I compare the hours spent, the probability of restatement, and the
audit fees between the inspected engagement and those for the engagement one year later,
because the timeline detailed in Figure 1 suggests that the auditor has sufficient time to adjust the
next engagement following a PCAOB inspection. To control for other factors that could impact
the dependent variables, such as the introduction of new auditing standards or economic
conditions, I include a control group of engagements that did not experience a PCAOB
inspection. Specifically, for each inspected engagement, I choose a control engagement for the
same year that is not inspected, is not covered by an office or a partner that was inspected, whose
issuer is in the same two-digit SIC code as the inspected engagements, and has assets as close as
possible to the ones of the inspected issuer.26
I also split the inspected engagements between
those that received a Part I Finding and those that did not. This results in a triple interaction term.
Empirically, the research design takes the following form:
Log(Hours) i,t or Logauditfeesi,t or Restatementi,t = α + β1.Inspectedi,t +
β2.Afteri,t + β3. Inspectedi,t × Afteri,t + β4. Inspectedi,t × Part I Findingi,t +
26
I choose a control issuer that does not belong to an inspected office or engagement partner because the analysis in
Section 5 suggests that spillover effects exist for engagements closely related to the ones inspected. Doing so allows
me to keep a similar design for the analysis in Section 5.
21
β5. Inspectedi,t × Part I Findingi,t × Afteri,t + γ.Controlsi,t + εi,t, (1)
where the subscripts i and t correspond to issuers and years, respectively.
The dependent variables include Logauditfees, equal to the logarithm of audit fees,
Restatement, an indicator variable equal to one when the issuer restates its year t financial
statements, and Log(Hours), composed of four different proxies: Logaudithours, equal to the
logarithm of the total engagement hours, Logpartnerhours, equal to the logarithm of the partner
hours, Logeqrhours, equal to the logarithm of the quality review partner hours, and LogIThours,
equal to the logarithm of the hours spent by the information system auditors. Detailed variable
definitions are provided in Appendix A. The advantage of using audit hours in this analysis is
that they represent an aggregate measure of the audit inputs and directly measure the effort spent
by the auditor on the engagement. This effort is likely to be related with perceived audit quality
(Caramanis and Lennox, 2008; Lobo and Zhao, 2013). Further, because proxies for output
measures of audit quality are noisy (Aobdia, 2015), audit hours, when using an appropriate
research design, are likely to measure in a more powerful fashion the direct reaction of the
auditor to the PCAOB inspection process. A potential drawback of using audit hours is that this
measure represents a summary of the total audit effort. Consequently, nuances in the mix of the
hours by activity may not be captured by this measure. Further, the auditor could also
mechanically react to a PCAOB inspection by increasing or decreasing the number of hours, for
example by spending more time documenting the audit procedures, without truly solving the
underlying issues identified by the PCAOB. In an attempt to provide further granularity, I also
include the breakdown of the hours between the partners involved in the audit, the quality review
partner, and the information system auditors. These hours are likely to be of higher quality, and
their changes are likely to reflect more important changes on the audit effort in general. I also use
22
restatements as an output measure of audit quality and use audit fees to determine whether the
change in hours is priced to the issuer.27
Inspected is an indicator variable equal to one for the inspected observations, and After is an
indicator variable equal to one for the year after the inspection. The coefficient of interest β3, on
the interaction Inspected × After, shows the impact of the inspection for the year following the
inspection, for those engagements that do not receive a Part I Finding, in comparison with the
control group. To distinguish the impact of the inspections that receive a Part I Finding from
those that do not, I also include an indicator variable Part I Finding, equal to one when the
inspected engagement results in a Part I Finding (this variable is equal to zero for non-inspected
engagements). I interact this variable with Inspected and Inspected × After. The coefficient of
interest β5, on the interaction Inspected × After × Part I Finding , shows the impact of the
inspection for the year following the inspection, for those engagements that receive a Part I
Finding, in comparison with inspected engagements that do not receive a Part I Finding. The sum
β3+ β5 is informative about the impact of the PCAOB inspections for the engagements receiving
a Part I Finding in comparison with the control group of non-inspected engagements.
Controls is a vector of control variables that prior research has identified as potentially
impacting audit fees and quality (e.g., Francis, Reichelt and Wang, 2005; Aobdia, Srivastava and
Wang, 2015; Aobdia, 2015). This vector is composed of Logat, the natural logarithm of the
issuer’s assets, to control for issuer size, ForeignPifo, the absolute value of pretax income from
foreign operations divided by the absolute value of pretax income, Geoseg, the number of
geographic segments of the issuers, and Busseg, the number of business segments of the issuer to
27
Notably, the analysis in Aobdia (2015) suggests that restatements are one of the most powerful output measures of
audit quality, in contrast with other measures that appear noisier.
23
control for issuer’s complexity. I also include the issuer’s leverage ratio, Leverage, defined as
total debt divided by total debt plus book equity, its book-to-market ratio, BTM, CFOat, the
issuer prior year’s cash flows from operations deflated by beginning assets, StdCFOat, the
standard deviation of CFOat computed from years t-3 to year t, and Salegrowth, the year-on-year
sales growth of the issuer, to control for other business factors that could impact the issuance of a
Part I Finding. I also include Weaknesses, an indicator equal to one if the company has a material
weakness during the year, HiTech, an indicator variable equal to one when the issuer is in a hi-
tech industry, and Litigation, an indicator variable equal to one when the issuer is in a high-
litigation industry. All continuous variables are winsorized at the 1st and 99
th percentiles to
reduce the impact of outliers in the specifications. I also include audit firm, client issuer and year
fixed effects in most specifications. I estimate Model (1) using a logistic specification when
using Restatement as the dependent variable, and OLS otherwise.28
To control for changes in audit effort related with auditor switches, I also restrict the sample
to issuers that do not switch auditors between the year of inspection and the following year. I
only keep observations where the data is available for both inspected and the following year. Due
to the initial data availability, the sample size varies depending on the dependent variable
considered.
4.3 Results
Table 1, Panel A presents descriptive statistics. Approximately 10% of the financial
statements are eventually restated. The mean of Part I Finding equals 0.13. Given that half of the
sample is composed of inspected engagements, this indicates that approximately 26% of the
inspections in the sample result in the identification of a Part I Finding. A typical audit, at the
28
Due to the very high number of fixed effects, I re-estimate (1) using OLS when using Restatement as the
dependent variable and including all fixed effects in the specification.
24
median of the values, involves 7,115 audit hours, 584 hours for the information system auditors,
399 partner hours, and 53 quality review partner hours. Overall, the partner hours represent a
small proportion, less than 6%, of the total audit hours.
(Insert Table 1 About Here)
Table 1 Panel B presents the results of Model (1). The first two columns present the results
when using Restatement as the dependent variable, while the third to seventh columns use
Logaudithours, LogIThours, Logpartnerhours, Logeqrhours, and Logauditfees, respectively. The
results on the interaction term Inspected × After, which represents the change in the dependent
variable for the engagements that receive a clean inspection report, in comparison with the
control group, suggest a deterioration of audit effort and quality. In particular, the interaction
term loads positively in Columns (1) and (2), suggesting that the incidence of restatements
actually increases following a clean inspection, by approximately 1.6%, based on the results of
Column (2). The interaction term also loads negatively when using the different proxies for
hours as the dependent variables, suggesting that the overall audit effort is decreased following a
clean inspection. Audit hours go down by approximately 1.5% (insignificant at conventional
statistical levels). Notably, both partner and quality review partner hours go down, by
approximately 6% and 8% (significant at 10% and 5%), respectively, suggesting that partners on
the account significantly reduce their effort spent on the engagement.29
Overall, these results
suggest a deterioration in audit effort and quality following a clean inspection, consistent with
the audit firm gravitating towards the pass/fail bar, but perhaps not necessarily sure about where
the pass/fail bar exactly stands when the inspection does not result in a Part I Finding.
29
Because the dependent variables are the logarithm of hours and fees, β3 and β5 represent approximate percentage
changes in hours or fees. The true percentage changes can be computed as the exponentials of β3 and β5 minus one,
which are not too different from β3 and β5 themselves when these are reasonably small.
25
The picture is drastically different for those inspected engagements that receive a Part I
Finding. In particular, based on the results in Panel B, the triple interaction Inspected × Part I
Finding × After, which shows the change in the dependent variable for inspections that resulted
in Part I Findings, in contrast with clean inspected engagements, loads negatively for
restatements, and positively for most types of hours. This indicates that, compared with clean
inspections, the audit firm takes significant corrective action following the issuance of a Part I
Finding. Specifically, the incidence of restatement goes down by approximately 4%, while total
audit hours increase by approximately 7% relative to a clean inspection. The increase is even
larger for partner hours, at approximately 18%. This increased auditor effort is partially, but not
fully reflected in the audit fees, which increase by approximately 2%. The results are, not
surprisingly, weaker when comparing the inspected engagements that received a Part I Finding
with the non-inspected engagements, as evidenced by the statistical significance of the Wald or
F-test when testing for β3+ β5 (Inspected × After + Inspected × Part I Finding × After) but still
indicate that audit hours and partner hours increase by approximately 6% and 11%, respectively,
relative to non-inspected engagements. The probability of restatements also goes down by
approximately 2.2% [close to significance but still insignificant at conventional levels in column
(2)]. Overall, these results suggest a reaction of the audit firm following the issuance of a Part I
Finding on the inspected engagement, especially on the high-quality partner hours. They also
suggest that the audit firm increases effort more than it is able to pass these increased costs to its
client, and that consequently the average rate per hour goes down (a result confirmed in
untabulated analyses).
4.4 Additional analyses
26
I conduct additional analyses on the probability of restatements. The SEC issued in August
2004 Final Rule: Additional Form 8-K Disclosure Requirements and Acceleration of Filing Date
(SEC 2004) that requires issuers to disclose material restatements on an 8-K form under item
4.02, Non-Reliance on Previously Issued Financial Statements. This rule suggests that
restatements disclosed on an 8-K form are more severe, as recently empirically confirmed
(Choudhary, Merkley and Schipper, 2016). Consequently, I create two additional variables,
8KRestatement and Non8KRestatement, indicator variables equal to one when the company
restates and the restatement is disclosed in a form 8-K under item 4.02 or not, respectively. I run
Model (1) using these variables. The results are presented in Table 2. I find that the results on
restatements presented in Table 1 mostly apply to the more severe forms of restatements,
disclosed in an 8-K.
(Insert Table 2 About Here)
I also conduct a similar difference in differences analysis to the one presented in Model (1)
with changes as dependent variables, instead of levels. Concretely, the specification takes the
following form:
Log(Hours) i,t or Logauditfeesi,t or Restatementi,t = α + β1.Inspectedi,t +
+ β2. Inspectedi,t × Part I Findingi,t + γ.Controlsi,t + εi,t, (2)
where indicates the change of the variable between year t and t+1. The variables of interest
in this specification are Inspected, which shows the impact of a PCAOB inspection not resulting
in a Part I Finding, and the interaction Inspected × Part I Finding, which shows the impact of a
PCAOB inspection resulting in a Part I Finding, in comparison with a clean inspection. The sum
Inspected + Inspected × Part I Finding shows the impact of a PCAOB inspection for an
engagement that results in a Part I Finding in comparison with the control group of non-
27
inspected engagements. I keep a comparable sample to the one used in Table 1, with one change
observation for each inspected engagement and its control engagement, determined as in
Subsection 4.2.
(Insert Table 3 About Here)
Results are presented in Table 3 and are qualitatively similar to the ones shown in Table 1.
Notably, Inspected loads positively for restatements, negatively for partner and EQR hours, and
Inspected × Part I Finding loads negatively for restatements and positively for most forms of
audit hours. However, I also find that Inspected loads negatively for audit hours, suggesting that
auditors also decrease total audit hours following a clean inspection. Furthermore, the sum
Inspected + Inspected × Part I Finding becomes significant for restatements and audit fees,
suggesting that the incidence of restatements of failed inspections goes down the following year
in comparison with non-inspected engagements.
I also repeat the analysis conducted in Model (2) by assessing the auditor reaction two years
following the inspected year, instead of one year later. The advantage of doing so is that I can
also capture the change in audit effort at the beginning of the audit period (see Figure 1 for the
timing of the inspection). The major disadvantage of this specification is a reasonably large
sample reduction for the audit hours sample, due to original data availability.
(Insert Table 4 About Here)
Table 4 presents the results of this analysis. I find results reasonably similar with the results
shown in Table 3. Notably, all forms of audit hours go down following a clean inspection,
whereas the probability of restatements goes up. Interestingly, audit fees also go down
(marginally significant), suggesting that the auditor passes through a portion of the hours saved
28
to their clients. However, the magnitude of reduction in audit fees is much lower than the
reduction in audit hours. These results suggest that the changes in auditor effort presented above
are reasonably persistent across time. In light of the timeline presented in Figure 1, the reduction
in audit fees suggests that either the client issuer, now possibly aware of the inspection results,
requests the audit firm to reduce fees following a clean inspection, or that the audit firm does not
increase fees as much as for other engagements following a clean inspection. Overall, this result
is consistent with audit firms and possibly their clients seeking to perform the specific extent of
audit work that is both necessary and sufficient to comply with PCAOB auditing standards,
consistent with a world where audit differentiation does not matter beyond the regulatory
standards (Donovan et al., 2014).
4.5 Testing the deterrence effect of the PCAOB inspections
The results of deterioration of audit quality following a clean inspection are also potentially
driven by a lowered deterrence effect of the inspection process for the following year. In
particular, an engagement that just passed an inspection may be considered less risky going
forward by the PCAOB. Thus, the probability of inspection may be lower the year following a
clean inspection. Because the audit firms know which of their engagements are inspected, they
are likely to be aware of such a pattern and consequently may advertently or inadvertently
decrease effort the following year, even if they are not fully sure about where the pass/fail bar
stands, because of a lowered deterrence effect from the PCAOB inspections process.30
I run the
following regression model to test this idea:
Inspectedi,t = α + β1. Inspected Last Yeari,t + β2. Inspected Last Yeari,t × Part I Finding Last
Yeari,t + γ.Controlsi,t + εi,t, (3)
30
This analysis, based on historical data, represents past practices of the PCAOB and is not necessarily
representative of current or future practices.
29
Inspected and Inspected Last Year are indicator variables equal to one when a particular
engagement is selected for inspection for the current year and last year, respectively. Because of
the binary nature of the dependent variable, I estimate Model (3) using a logistic regression. Part
I Finding Last Year is an indicator variable equal to one when an engagement selected for
inspection the prior year receives a Part I Finding. Controls is the vector of control variables
defined above, augmented with DecYe, an indicator variable equal to one when the issuer’s fiscal
year ends in December, Big4, an indicator variable equal to one when the issuer is audited by a
Big 4 firm, and LengthRelationship, that measures the time the auditor has audited the client
issuer.31
I predict that β1 should load negatively if engagements selected for inspection the prior
year that passed the inspection are less likely to be selected the following year.32
(Insert Table 5 About Here)
The results of Model (3) are presented in Table 5. Panel A presents descriptive statistics, and
Panel B the result of the regression model. For the sake of preserving the confidentiality of the
PCAOB inspection selection process, the coefficients on the control variables are not reported in
Panel B. Column (1) shows the results when considering all audit firms, whereas Columns (2)
and (3) show the results when restricting the sample to the auditors that are actually inspected
during a given year and Big 4 audit firms, respectively.33
Consistent with the prediction,
Inspected Last Year loads negatively, indicating that engagements inspected by the PCAOB the
prior year and that pass the inspection are much less likely to be inspected again the next year. In
terms of economic magnitude, based on Column (3) and at the average of the control variables,
31
The two first controls are unnecessary in Model (1) due to the inclusion of a large number of fixed effects. 32
To keep a consistent sample with the analysis of auditor switches in the following section, I also restrict the
sample to engagements where the auditor information is available for the following two years. The results are
qualitatively unchanged if I remove this restriction. 33
Columns (2) and (3) alleviate the concern that the results are mechanically driven by the inclusion of triennially
inspected firms in the sample. These firms are highly unlikely to be inspected again the year following an inspection.
30
untabulated analyses indicate that the marginal effect of a passed inspection the prior year is -
5.4%, to be compared with a predicted probability of being inspected of 7.3%. In other words,
the probability of inspection the following year following a passed inspection is significantly
lower, but there is still a possibility that an engagement that passed the inspection is inspected
again. Not surprisingly, the interaction Inspected Last Year × Part I Finding Last Year loads
positively, indicating that the pattern does not hold for those inspected engagements that received
a Part I Finding. The sum Inspected Last Year + Inspected Last Year × Part I Finding Last Year
is insignificant in Columns (2) and (3), based on a Wald test, indicating that the probability of
inspection for those engagements that received a Part I Finding the prior year is not significantly
different from the probability of inspection for non-inspected engagements. Overall, these results
indicate that the results identified in prior tables of lower auditor effort following a clean
PCAOB inspection could be driven by a lowered deterrence effect of the PCAOB inspections
process.
4.6 A different approach
I validate the analyses of sub-sections 4.1 to 4.4 using a different approach. Specifically, I
focus on the engagements re-inspected by the PCAOB the following year, and use a Part I
Finding prediction model to determine whether audit quality improves or diminishes for the
engagements that were previously inspected by the PCAOB. The research design takes the
following form:
Part I Findingi,t = α + β1.Inspected Last Yeari,t +
+ β2. Inspected Last Yeari,t × Part I Finding Last Yeari,t + γ.Controlsi,t + εi,t, (4)
The sample is restricted to inspected engagements. Part I Finding is equal to one when the
PCAOB identifies deficiencies in the engagement. Inspected Last Year is an indicator variable
31
equal to one when the engagement was inspected the prior year and is re-inspected. Part I
Finding Last Year is an indicator variable equal to one when the prior inspection resulted in a
Part I Finding. Controls is the same vector of controls used in Model (3).
(Insert Table 6 About Here)
Results of Model (4) are presented in Table 6. Inspected Last Year is negative but does not
load significantly in the regression, suggesting that engagements already inspected the prior year
and that passed the inspection are not less likely to receive a Part I Finding than engagements
that were not inspected. This suggests deterioration in the audit quality of these engagements,
given that all passed the inspection the prior year. The interaction Inspected Last Year × Part I
Finding Last Year loads positively, suggesting that those re-inspected engagements that received
a Part I Finding the prior year are still more likely to receive a Part I Finding than those re-
inspected engagements that initially passed the inspection. However, a Wald or F-test of the sum
Inspected Last Year + Inspected Last Year × Part I Finding Last Year loads insignificantly,
suggesting that engagements that received a Part I Finding the prior year are no more likely to
receive a Part I Finding the following year than those inspected engagements that were not
inspected the prior year. This suggests an improvement in audit quality, given that all failed the
inspection the prior year. Overall, these results confirm the results shown in Tables 1 to 4, using
a different setting.
I also conduct an additional test of Model (4). Because the engagements selected for PCAOB
inspections are risk based, (e.g., Hanson, 2012), it is possible that selection bias in the
engagement selection program may result in coefficient bias (Lennox et al. 2012). Consequently,
I also conduct a robustness test using a bivariate probit model with selection (Van de Ven and
32
Van Pragg, 1981), similar to Aobdia (2015). In the first stage, I model the probability of
selection for inspection of a particular engagement. I then control for this selection in the second
stage model. I identify two variables based on internal discussions at the PCAOB, that can be
included in the first stage and can convincingly be excluded from the second stage (Little, 1985;
Lennox et al., 2012).34
Two categories of issuers were less likely to be selected for inspection for
reasons unrelated to risk assessment. These exclusion restrictions are similar to the ones used in
Aobdia (2015). In untabulated analyses, I find a negative coefficient on Inspected Last Year, a
positive coefficient on Inspected Last Year × Part I Finding Last Year, and an insignificant
coefficient on Inspected Last Year + Inspected Last Year × Part I Finding Last Year. These
results indicate that engagements previously inspected that had clean inspections are still less
likely to receive a Part I Finding the next year, suggesting that the deterioration in audit quality
identified in prior analyses is present but not extreme. They also indicate that audit firms
improve on the audits deemed deficient by the PCAOB, with the probability of Part I Finding the
next year not being significantly different from other inspected engagements.
5. Client reaction tests
5.1 Research design
I test the client impact of the PCAOB inspections by assessing whether a client issuer is more
likely to switch auditors within the next two years when its engagement is selected for inspection,
whether the switch is driven by the auditor resigning from the account, and whether, in case of a
switch not driven by the auditor’s resignation, the client issuer switches to a perceived high-
quality auditor. Concretely, I estimate the three following models:
Switchi,t = α + β1. Inspectedi,t + β2. Inspectedi,t × Part I Findingi,t + γ.Controlsi,t + εi,t, (5)
34
I am unable to describe in further details these variables, to preserve the confidentiality of the PCAOB inspection
selection process.
33
Auditor_Resignationi,t = α + β1. Inspectedi,t + β2. Inspectedi,t × Part I Findingi,t
+ γ.Controlsi,t + εi,t, (6)
Qualityi,t = α + β1. Inspectedi,t + β2. Inspectedi,t × Part I Findingi,t + γ.Controlsi,t + εi,t , (7)
where, in Model (5), Switch is an indicator variable equal to one when the client switches
auditors within the next two fiscal years. Inspected is an indicator variable equal to one when a
given fiscal year engagement is inspected, and Part I Finding equals one when the inspection
results in a Part I Finding. Controls are the same as in Model (4), augmented by Restatement, an
indicator variable equal to one if the financial statements for the initial fiscal year are restated. In
particular, prior studies document higher management and board turnover following a
restatement (Srinivasan 2005, Arthaud-Day et al. 2006, Desai et al. 2006). Consequently, it is
likely that the probability of auditor switch is higher if the fiscal year’s statements must be
restated.35
All models are tested using logistic specifications.
In Model (6), the sample is restricted to issuers that switch auditors within the next two fiscal
years. The dependent variable, Auditor_Resignation, equals one when the audit firm resigned
from the account. The data are from Audit Analytics.
In Model (7), the sample is restricted to issuers that switch auditors within the next two fiscal
years and where the auditor does not resign from the account. The dependent variable, Quality, is
composed of two variables. The first one, HighQuality, equals one when the client issuer
switches to an auditor that is a Big 4 and an industry specialist, defined as having a market share
above 25%, based on audit fees in the two-digit SIC code industry (computed excluding the
switching issuer). Industry specialist auditors are generally perceived to be providing higher
35
Results are qualitatively unchanged when excluding Restatement from the set of control variables.
34
quality services (e.g., Balsam, Krishnan and Yang, 2003; Krishnan, 2003; Government
Accountability Office, 2008), and this feature is extensively advertised by auditing firms (e.g.,
Minutti-Meza, 2013). Consequently, this variable measures the perception of the quality of an
auditor, from a client standpoint limited to observable inputs to the audit process (e.g, DeFond
and Zhang, 2014). For similar reasons, I also use Big4, an indicator variable equal to one if the
client switches to a Big 4 auditor, as a measure of higher perceived auditor quality. Explanatory
variables are similar to those in Models (5) and (6). Because it is often the case in the sample that
the inspected auditor itself is considered to be a perceived high quality auditor, the issuance of a
Part I Finding for such an auditor may negatively affect this perception at the client level and, for
the right reasons, cast doubt on the perceived quality of a high perceived quality auditor. Further,
an issuer not covered by a Big 4 auditor may not be interested or able to switch to a Big 4 auditor
(e.g., Aobdia, Enache and Srivastava, 2015). Consequently, to increase the power of the tests, I
also estimate Model (7) by restricting the sample to issuers initially covered by a Big 4 auditor,
and by a Big 4 auditor non industry specialist.
5.2 Empirical results
The results of Models (5), (6) and (7) are presented in Table 7.36
Column (1) presents the
results of Model (5). Inspected loads negatively (significant at 1%), suggesting that a clean
inspection allows the auditor to more easily retain the client. Untabulated analysis indicate that
the probability of switching decreases by 1.6% at the average of the control variables, to be
compared with a predicted probability of switching of 11.5%. On the other hand, Inspected ×
Part I Finding loads positively, significant at 1%. The sum Inspected + Inspected × Part I
Finding also loads positively in a Wald test. These results indicate that the issuer of an inspected
36
Descriptive statistics for this table are available in Table 5, Panel A.
35
engagement that receives a Part I Finding is much more likely to switch auditors than both
inspected engagements that pass the inspection and non-inspected engagements. In terms of
economic significance, at the average of the control variables, untabulated analyses indicate that,
in comparison with the control group of non-inspected engagements, the probability of auditor
switching within the next two years increases by 2.2%, to be compared with a predicted
probability of 11.5%, or a 20% increase. Restatement also loads positively as a control variable,
suggesting that issuers are more likely to switch auditors when their initially audited financial
statements need to be restated. This result is consistent with prior literature on executive and
board turnover following the announcement of a restatement. The inclusion of Restatement as a
control variable provides some confidence that the results on Inspected × Part I Finding are not
driven by the increased probability of restatement for the inspected engagements that result in a
Part I Finding.
(Insert Table 7 About Here)
Column (2) presents the results of Model (6). I do not find evidence that the switch is driven
more often by auditor resignations when the engagement is selected for inspection and receives
or not a Part I Finding, as evidenced by insignificant coefficients on Inspected and Inspected ×
Part I Finding or their sum. This result suggests that the increased switches, in case of issuance
of a Part I Finding, are client driven.
The client issuer could switch following the issuance of a Part I Finding because of increased
auditor scrutiny following the inspection, or because the issuer is genuinely concerned about
audit quality. I test for this idea using Model (7). The results with HighQuality as the dependent
variable are shown in Column (3) when including all the sample of switching issuers (excluding
36
the switches driven by auditor resignation), and in Column (4) when restricting the sample to
switching issuers initially covered by Big 4 auditors that are not industry specialists. The
coefficients on Inspected × Part I Finding and the sum Inspected + Inspected × Part I Finding
are insignificant in Column (3). However, the sum Inspected + Inspected × Part I Finding
becomes significant in Column (4). These results are consistent with the idea that, at least in the
case of issuers covered by a non-industry specialist Big 4 auditor, these issuers switch to high
perceived quality auditors following the issuance of a Part I Finding on their engagement. Not
surprisingly, the results appear when the issuer is initially not covered by an industry specialist,
because the issuance of a Part I Finding on an industry specialist auditor most likely casts doubt
on the perceived expertise of such auditors. I find qualitatively similar results when using a
switch to a Big 4 auditor as the dependent variable in Columns (5) and (6). Column (5) presents
the results for the overall sample, and Column (6) when restricting the sample to issuers initially
covered by a Big 4 auditor. I find in both columns some evidence that switching clients are more
likely to switch to a Big 4 auditor when their engagement receives a Part I Finding.
Overall, these results suggest that client issuers are aware about the results of the inspection
of their audit and care about those when they are negative. Because, in the present regime, there
could be a mix of informed and non-informed clients, these results could even be stronger if the
PCAOB were allowed to disclose the inspection results to the client issuer.
5.3 Additional analysis
I conduct an additional analysis to confirm that clients do not switch auditors following
identification of a Part I Finding on their engagement because of increased fees by their existing
auditor. The basic idea is that, if clients whose engagements received a Part I Findings switch
37
auditors because of fee related reasons, then more fee pressure should be observed at the time of
the switch, compared to other engagements. Concretely, I use a model similar to Model (6) but
replace the dependent variable with the change in fees between year t and t+2, or year t+1 and
year t+2, where year t is the year inspected by the PCAOB. The model is restricted to issuers that
switch auditors. In untabulated analyses, I do not find a significant relationship between
Inspected, Inspected × Part I Finding, or the sum of the two coefficients, and the change in audit
fees. This result suggests that clients that switch auditors following identification of a Part I
Finding on their engagement by the PCAOB do not switch because of increased fee pressure
from their existing auditor.
6. Spillover Impact of the PCAOB Inspections
6.1 Research design
I test, in a similar fashion to the analyses of Model (2), whether spillover effects occur when
the PCAOB inspects individual engagements. Specifically, I use a difference-in-differences
specification. In this analysis, the treatment group is composed of engagements that are not
inspected by the PCAOB but are either covered by an office inspected by the PCAOB, or are
covered by an engagement partner that was inspected by the PCAOB during the same year.
Similar to the analysis of Model (2), I compare the changes in hours, probability of restatement,
and audit fees between the treated engagement and a control engagement for the same year that
is not inspected, is not covered by an office or a partner that was inspected, whose issuer is in the
same two-digit SIC code as the inspected engagements, and has assets as close as possible to the
ones of the inspected issuer. I also split the treated engagements between those that were covered
by offices or partners that received a Part I Finding and those that did not. The research design
takes the following form:
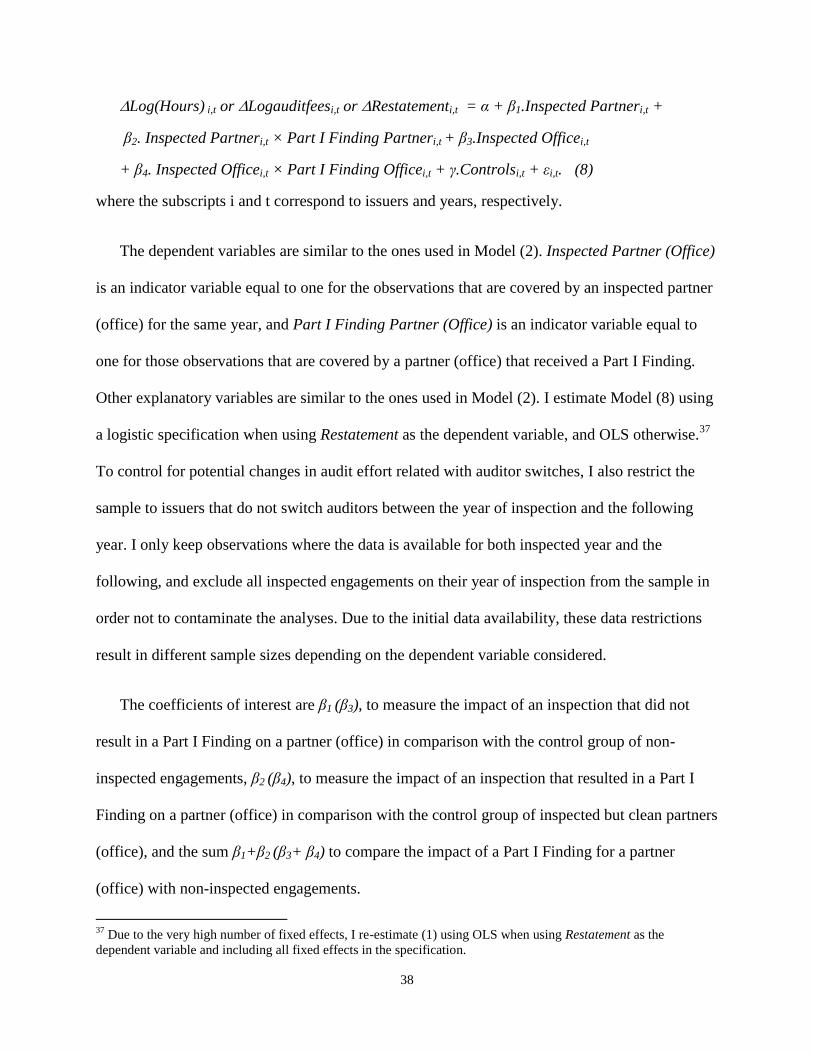
38
Log(Hours) i,t or Logauditfeesi,t or Restatementi,t = α + β1.Inspected Partneri,t +
β2. Inspected Partneri,t × Part I Finding Partneri,t + β3.Inspected Officei,t
+ β4. Inspected Officei,t × Part I Finding Officei,t + γ.Controlsi,t + εi,t. (8)
where the subscripts i and t correspond to issuers and years, respectively.
The dependent variables are similar to the ones used in Model (2). Inspected Partner (Office)
is an indicator variable equal to one for the observations that are covered by an inspected partner
(office) for the same year, and Part I Finding Partner (Office) is an indicator variable equal to
one for those observations that are covered by a partner (office) that received a Part I Finding.
Other explanatory variables are similar to the ones used in Model (2). I estimate Model (8) using
a logistic specification when using Restatement as the dependent variable, and OLS otherwise.37
To control for potential changes in audit effort related with auditor switches, I also restrict the
sample to issuers that do not switch auditors between the year of inspection and the following
year. I only keep observations where the data is available for both inspected year and the
following, and exclude all inspected engagements on their year of inspection from the sample in
order not to contaminate the analyses. Due to the initial data availability, these data restrictions
result in different sample sizes depending on the dependent variable considered.
The coefficients of interest are β1 (β3), to measure the impact of an inspection that did not
result in a Part I Finding on a partner (office) in comparison with the control group of non-
inspected engagements, β2 (β4), to measure the impact of an inspection that resulted in a Part I
Finding on a partner (office) in comparison with the control group of inspected but clean partners
(office), and the sum β1+β2 (β3+ β4) to compare the impact of a Part I Finding for a partner
(office) with non-inspected engagements.
37
Due to the very high number of fixed effects, I re-estimate (1) using OLS when using Restatement as the
dependent variable and including all fixed effects in the specification.
39
For this particular analysis, given that the engagement partner information is required, I
restrict the sample to observations that have both engagement partner data and audit hours
available.38
6.2 Results
Results are presented in Table 8. I do not observe any major spillover impact of the
inspections when an office or partner is inspected and passes the inspection, as evidenced by
insignificant coefficients on Inspected Partner and Inspected Office. This suggests that a clean
inspection does not result in the dissemination of information that could have a positive impact
on the other audit engagements. However, the picture is different for when an office or a partner
receives a Part I Finding. In case of a partner, audit hours, partner hours and quality review hours
increase for non-inspected engagements of a partner that received a Part I Finding on another
engagement, as evidenced by a positive coefficient on the interaction Inspected Partner × Part I
Finding Partner. The sum Inspected Partner + Inspected Partner × Part I Finding Partner is
also significant, indicating that these results are not dependent on which control group is used for
this specification. In terms of economic significance, hours worked increase by approximately
5%, while partner hours increase by approximately 15% and review partner hours by 14% in
comparison with inspected partners that did not receive a Part I Finding. Overall, these results
suggest that a reasonably strong spillover effect exists for other engagements of an inspected
partner who receives a Part I Finding, perhaps because the information released by the PCAOB
is also relevant to non-inspected audits of the same engagement partner.
(Insert Table 8 About Here)
38
The inferences on the spillovers at the audit office level would remain unchanged if these sample restrictions were
not in place.
40
I also detect a spillover effect of the PCAOB inspection process at the office level.
Specifically, the interaction Inspected Office × Part I Finding Office loads significantly when
using audit hours, IT hours and EQR hours as dependent variables, suggesting that audit hours
increase in an office that received a Part I Finding on another engagement. However, the sum
Inspected Office + Inspected Office × Part I Finding Office is only significant for total audit
hours. This indicates that not all results for audit offices hold depending on the control group.
Overall, these results suggest that engagement-specific PCAOB inspections impact other
engagements beyond the inspected ones, with spillover effects detected at both the partner and
office level. However, these effects are only present when a Part I Finding is identified,
consistent with the results in Table 1 that suggest that audit firms care about the identification of
a Part I Finding by the PCAOB.
7. Conclusion
This paper investigates the impact, at the auditor and client levels, of the PCAOB inspections
of individual engagements. I find a reaction from both audit firm and client issuer following the
issuance of a Part I Finding. I also find evidence of spillover effects of the PCAOB inspections
of individual engagements, suggesting that the information transferred by the PCAOB to audit
firms is valuable and applicable to non-inspected engagements. However, I also find some
evidence consistent with audit firms gravitating towards the pass/fail bar, consistent with audit
firms in the U.S. being unable to credibly convey audit quality beyond the minimum bar imposed
by auditing standards (Donovan et al., 2014). One caveat of these results is that, due to the nature
of the datasets examined, they are applicable mostly for the largest audit firms. In addition,
because PCAOB inspections are currently risk based (e.g., Hanson, 2012), I cannot fully rule out
that some of the results are driven by the inspection selection process. Consequently, future
41
research may have the opportunity to revisit this analysis in a few years if the PCAOB begins
using random inspections, as currently under consideration (e.g., Doty, 2015).
Overall, these results further our understanding of the forces at play in the PCAOB
inspections process. Several interesting questions remain to be answered, such as whether the
impact of the PCAOB inspections would be different in a world where audit firms have more
possibilities to credibly differentiate their audits, whether this impact is different for the smaller
(triennially inspected) firms, and whether proper audit firms’ quality control systems have a
positive influence on audit quality and profitability. Notably, future research should have the
opportunity to explore the first question again when auditors publicly report the name of their
engagement partners, as adopted by the PCAOB on December 15, 2015 (PCAOB 2015).
42
References
Abbott, L.J., Gunny, K.A., and T.C. Zhang. 2013. When the PCAOB talks, who listens?
Evidence from stakeholder reaction to GAAP-deficient PCAOB inspection reports of small
auditors. Auditing: A Journal of Practice & Theory 32 (2): 1-31.
Aobdia, D. 2015. The validity of publicly available measures of audit quality. Evidence from the
PCAOB inspection data. Working paper.
Aobdia, D., Lin, C.-J., and R. Petacchi. 2015. Capital market consequences of audit partner
quality. The Accounting Review 90 (6): 2143-2176.
Aobdia, D., Srivastava, A., and E. Wang. 2015. Foreign born graduates and the human capital of
large public accounting firms. Working paper.
Aobdia, D., Enache, L., and A. Srivastava. 2015. The changing landscape of public firms and the
associated changes in the competitive structure of the audit industry. Working paper.
Arthaud-Day. M.L., S.T. Certo, and D.R. Dalton. 2006. A changing of the guard: Executive and
director turnover following corporate financial restatements. Academy of Management
Journal 49 (6): 1119-1136.
Balsam, S., Krishnan, J., and J. Yang. 2003. Auditor industry specialization and earnings quality.
Auditing: A Journal of Practice & Theory 22: 71-97.
Blackburne, T. 2014. Regulatory oversight and reporting incentives: Evidence from SEC budget
allocations. Working Paper.
Boone, J.P., Khurana, I.K., and K.K. Raman. 2015. Did the 2007 PCAOB disciplinary order
against Deloitte impose actual costs on the firm or improve its audit quality? The
Accounting Review 90 (2): 405-441.
Caramanis, C., and C. Lennox. 2008. Audit effort and earnings management. Journal of
Accounting and Economics 45 (1): 116-138.
Carcello, J.V., C Hollingsworth, and S.A. Mastrolia. 2011. The effect of PCAOB inspections on
Big 4 audit quality. Research in Accounting Regulation 23: 85-96.
Cassell, C., L. Dreher, and L. Myers. 2013. Reviewing the SEC’s review process: 10-K comment
letters and the cost of remediation. The Accounting Review 88 (6): 1875-1908.
Center for Audit Quality. 2012. Guide to PCAOB Inspections.
Choudhary, P., K. Merkley, and K. Schipper. 2016. Qualitative characteristics of financial
reporting errors deemed immaterial by managers. Working paper.
Church, B.K., and L.B. Shefchik. 2012. PCAOB inspections and large accounting firms.
Accounting Horizons, 26 (1): 43-63.
DeFond, M.L. 2010. How should the auditors be audited? Comparing the PCAOB inspections
with the AICPA peer review. Journal of Accounting and Economics 49: 104-108.
DeFond, M.L., and C.S. Lennox. 2015. Do PCAOB inspections improve the quality of internal
control audits. Working paper.
DeFond, M.L., and J. Zhang. 2014. A review of archival auditing research. Journal of
Accounting and Economics 58 (2-3): 275-326.
43
Desai, H., C.E. Hogan, and M.S. Wilkins. 2006. The reputational penalty for aggressive
accounting: Earnings restatements and management turnover. The Accounting Review
81(1): 83-112.
Donovan, J., Frankel, R., Lee, J., Martin, X., and H. Seo. 2014. Issues raised by studying
DeFond and Zhang: What should audit researchers do? Journal of Accounting and
Economics 58 (2-3): 327-338.
Doty, J. 2015. Protecting the investing public’s interest in informative, accurate, and independent
audit reports. Keynote speech at the AICPA conference on current SEC and PCAOB
developments.
Dye, R. 1993. Auditing standards, legal liability, and auditor wealth. Journal of Political
Economy 101 (5): 887-914.
Eskow, S. 2004. PCAOB inspections pick up speed. The Trusted Professional 7 (13).
Fischer, R.F. 2006. The PCAOB experience, up close and personal. Pennsylvania CPA Journal
76 (4): 22-23.
Francis, J.R., K. Reichelt, and D. Wang. 2005. The pricing of national and city-specific
reputations for industry expertise in the U.S. audit market. The Accounting Review 80:
113–136.
Fung, S., Raman, K., Zhu, X., 2014. Does the PCAOB’s international inspection program
provide spillover audit quality benefits for investors abroad? Working paper, The Hong
Kong Polytechnic University, University of Texas at San Antonio, and City University of
Hong Kong.
Gaver, J.J., Gaver, K.M., and J.R. Austin. 1995. Additional evidence on bonus plans and income
management. Journal of Accounting and Economics 19: 3-28.
Government Accountability Office (GAO). 2008. Audits of public companies. Continued
concentration in audit market for large public companies does not call for immediate action.
Washington DC: GAO.
Hanson, J.D. 2012. Reflections on the state of the audit profession. American Accounting
Association, Auditing Section, Midyear Meeting. Available at
http://pcaobus.org/News/Speech/Pages/01132012_HansonAAA.aspx
Healy, P.M. 1985. The effect of bonus schemes on accounting decision. Journal of Accounting
and Economics 7: 85-107.
Hermanson, D.R., R.W. Houston, and J.C. Rice. 2007. PCAOB inspections of smaller CPA firms:
Initial evidence from inspection reports. Accounting Horizons 21 (2): 137-152.
Holthausen, R.W., Larcker, D.F., and R.G. Sloan. 1995. Annual bonus schemes and the
manipulation of earnings. Journal of Accounting and Economics 19: 29-74.
Johnson, L.M., M.B. Keune, and J. Winchel. 2014. Auditor perceptions of the PCAOB oversight
process. Working Paper.
Johnston, R., and R. Petacchi. 2014. Regulatory oversight of financial reporting: Securities and
Exchange Commission comment letters. Working paper.
Kinney, W.R. 2005. Twenty-five years of audit deregulation and re-regulation: What does it
mean for 2005 and beyond? Auditing: A Journal of Practice & Theory 24 (s-1): 89-109.
44
Krishnan, J. 2003. Does big 6 auditor industry expertise constrain earnings management?
Accounting Horizons 17: 1-16.
Krishnan, J., Krishnan, J., Song, H., 2014. PCAOB international inspections and audit quality.
Working paper, Temple University and the University of Akron.
Lamoreaux, P., 2013. Does PCAOB exposure affect auditor reporting decisions? Working paper,
University of Arizona.
Lennox, C. 2000. Do companies succesfully engage in opinion-shopping? Evidence from the UK.
Journal of Accounting and Economics 29: 321-337.
Lennox, C., and J. Pittman. 2010. Auditing the auditors: Evidence on the recent reforms to the
external monitoring of audit firms. Journal of Accounting and Economics 49: 84-103.
Lennox, C., J.R. Francis, and Z. Wang. 2012. Selection models in accounting research. The
Accounting Review 87 (2): 589-616.
Lobo, G.J., and Y. Zhao. 2013. Relation between audit effort and financial report misstatements:
Evidence from quarterly and annual restatements. The Accounting Review 88 (4): 1385-
1412.
Little, R. 1985. A note about models for selectivity bias. Econometrica 53 (6): 1469-1474.
Minutti-Meza, M. 2013. Does auditor industry specialization improve audit quality? Journal of
Accounting Research 51 (4): 779:817.
Moore, D.A., Tetlock, P.E., Tanlu, L., and M.H. Bazerman. 2006. Conflicts of interest and the
case of auditor independence: Moral seduction and strategic issue cycling. The Academy of
Management Review 31 (1): 10-29.
Nagy, A.L. 2014. PCAOB quality control inspection reports and auditor reputation. Auditing, A
Journal of Practice & Theory 33 (3): 87-104.
Norris, F. 2014. Holding auditors accountable on reports. The New York Times May 9, B1.
Olson, M.W. 2008. Remarks on PCAOB inspections, audit risks, and standard-setting priorities.
Association of Audit Committee Members. Available at
http://pcaobus.org/News/Speech/Pages/05212008_OlsonAssociationofAuditCommitteeMe
mbers.aspx.
Palmrose, Z-V. 2006. Maintaining the Value and Viability of Auditors as Gatekeepers Under
SOX: An Auditing Master Proposal,” in Financial Gatekeepers: Can They Protect
Investors? Yasuyuki Fuchita and Robert E. Litan, eds.: 103-135.
PCAOB. 2006. PCAOB 2005 Annual Report. PCAOB, Washington, DC.
PCAOB. 2007. Order Instituting Disciplinary Proceedings, Making Findings, and Imposing
Sanctions in the Matter of Deloitte & Touche LLP. (December 10). Release No. 105-2007-
005. Available at: http://pcaobus.org/Enforcement/Decisions/Documents/12-
10_Deloitte.pdf
PCAOB. 2008. 2007 Annual Report. PCAOB, Washington, DC.
PCAOB. 2012. Information for audit committees about the PCAOB inspection process.
Available at http://pcaobus.org/Inspections/Documents/
Inspection_Information_for_Audit_Committees.pdf.
45
PCAOB. 2015. Improving the transparency of audits: Rules to require disclosure of certain audit
participants on a new PCAOB form and related amendments to auditing standards. PCAOB
rule No. 2015-008.
Riley, R.R., Jenkins, J.G., Roush, P.Y., and J.C. Thibodeau. 2008. Audit quality in the poxt-SOX
audit environment: What your accounting students must know about the PCAOB
inspection process. Currrent Issues in Auditing 2 (2): A17-A25.
Securities and Exchange Commission (SEC). 2004. Final Rule: Additional Form 8-K Disclosure
Requirements and Acceleration of Filing Date. Washington DC: Govt Printing Office.
Shroff, N. 2015. Real effects of financial reporting quality and credibility: Evidence from the
PCAOB regulatory regime. Working paper.
Srinivasan, S. 2005. Consequences of financial reporting failure for outside directors: Evidence
from accounting restatements and audit committee members. Journal of Accounting
Research 43(2): 291-334.
Teoh, S. 1992. Auditor independence, dismissal threats, and the market reaction to auditor
switches. Journal of Accounting Research 30: 1-23.
Tysiac, K. 2014. Audit regulators see positive signs. Journal of Accountancy September 1.
Van de Ven, W.P.M.M., and B.M.S. Van Pragg. 1981. The demand for deductibles in private
health insurance: A probit model with sample selection. Journal of Econometrics 17: 229-
252.
Watts, R., and J. Zimmerman. 1981. The market for independence and independent auditors.
Working Paper, University of Rochester.
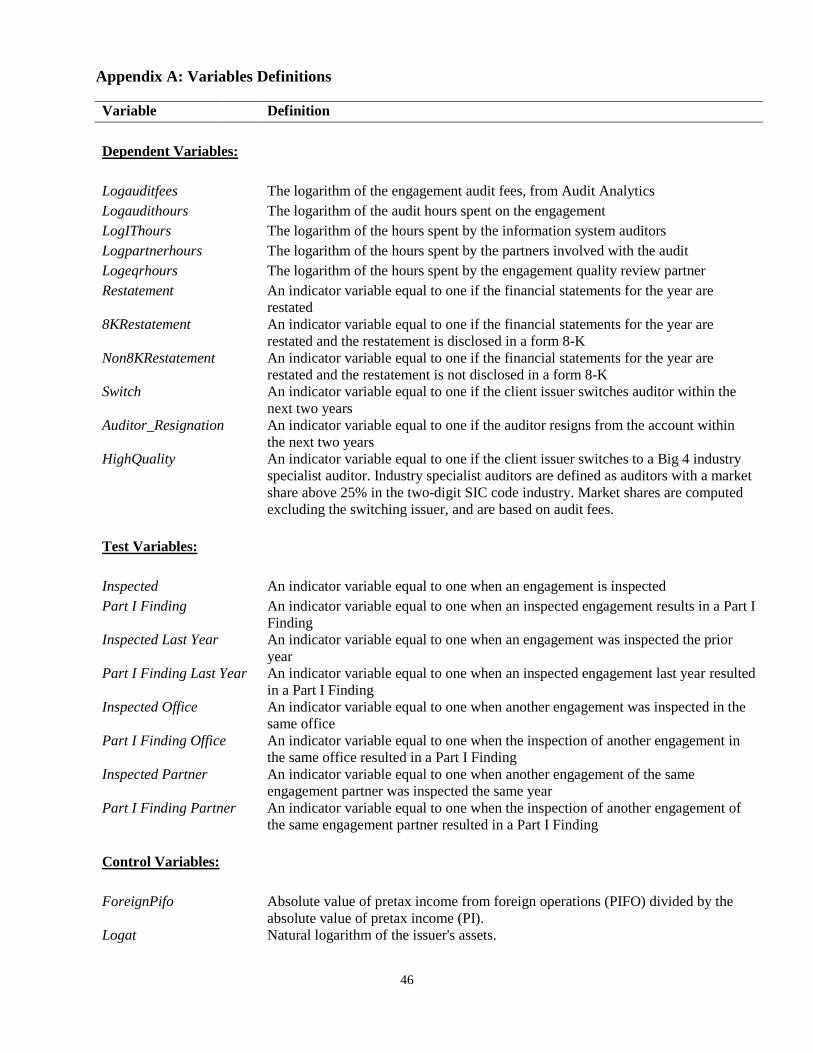
46
Appendix A: Variables Definitions
Variable Definition
Dependent Variables:
Logauditfees The logarithm of the engagement audit fees, from Audit Analytics
Logaudithours The logarithm of the audit hours spent on the engagement
LogIThours The logarithm of the hours spent by the information system auditors
Logpartnerhours The logarithm of the hours spent by the partners involved with the audit
Logeqrhours The logarithm of the hours spent by the engagement quality review partner
Restatement An indicator variable equal to one if the financial statements for the year are
restated
8KRestatement An indicator variable equal to one if the financial statements for the year are
restated and the restatement is disclosed in a form 8-K
Non8KRestatement An indicator variable equal to one if the financial statements for the year are
restated and the restatement is not disclosed in a form 8-K
Switch An indicator variable equal to one if the client issuer switches auditor within the
next two years
Auditor_Resignation An indicator variable equal to one if the auditor resigns from the account within
the next two years
HighQuality An indicator variable equal to one if the client issuer switches to a Big 4 industry
specialist auditor. Industry specialist auditors are defined as auditors with a market
share above 25% in the two-digit SIC code industry. Market shares are computed
excluding the switching issuer, and are based on audit fees.
Test Variables:
Inspected An indicator variable equal to one when an engagement is inspected
Part I Finding An indicator variable equal to one when an inspected engagement results in a Part I
Finding
Inspected Last Year An indicator variable equal to one when an engagement was inspected the prior
year
Part I Finding Last Year An indicator variable equal to one when an inspected engagement last year resulted
in a Part I Finding
Inspected Office An indicator variable equal to one when another engagement was inspected in the
same office
Part I Finding Office An indicator variable equal to one when the inspection of another engagement in
the same office resulted in a Part I Finding
Inspected Partner An indicator variable equal to one when another engagement of the same
engagement partner was inspected the same year
Part I Finding Partner An indicator variable equal to one when the inspection of another engagement of
the same engagement partner resulted in a Part I Finding
Control Variables:
ForeignPifo Absolute value of pretax income from foreign operations (PIFO) divided by the
absolute value of pretax income (PI).
Logat Natural logarithm of the issuer's assets.
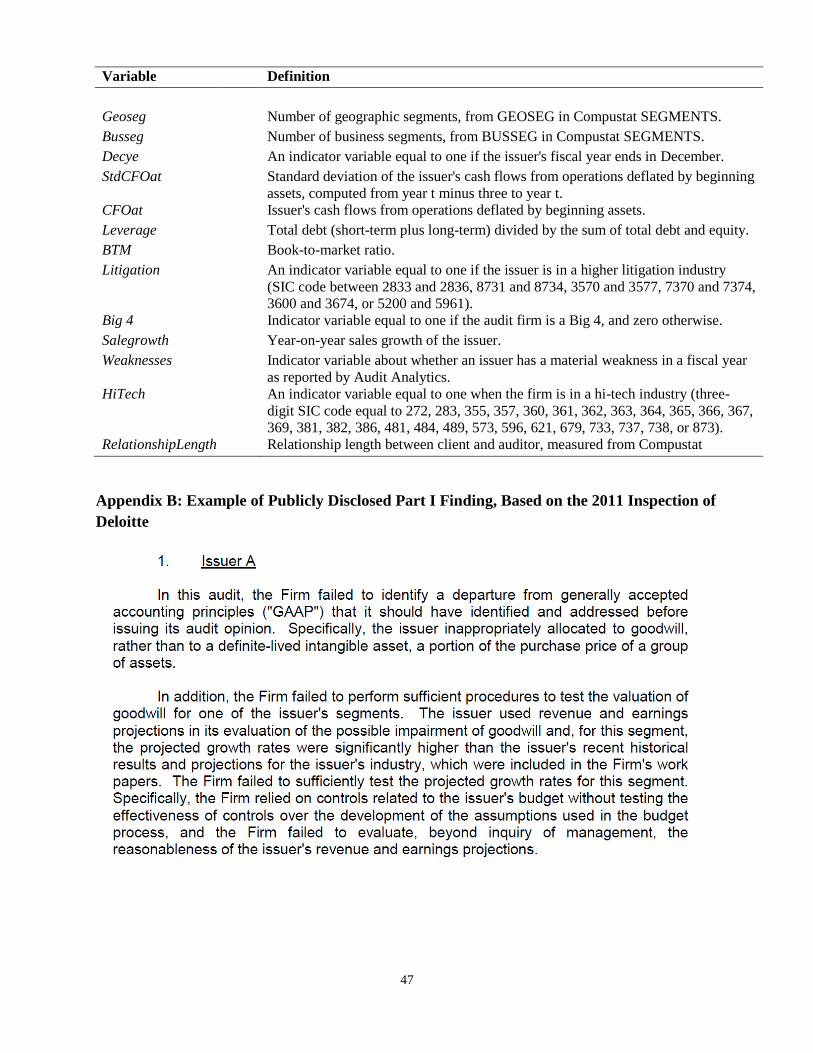
47
Variable Definition
Geoseg Number of geographic segments, from GEOSEG in Compustat SEGMENTS.
Busseg Number of business segments, from BUSSEG in Compustat SEGMENTS.
Decye An indicator variable equal to one if the issuer's fiscal year ends in December.
StdCFOat Standard deviation of the issuer's cash flows from operations deflated by beginning
assets, computed from year t minus three to year t.
CFOat Issuer's cash flows from operations deflated by beginning assets.
Leverage Total debt (short-term plus long-term) divided by the sum of total debt and equity.
BTM Book-to-market ratio.
Litigation An indicator variable equal to one if the issuer is in a higher litigation industry
(SIC code between 2833 and 2836, 8731 and 8734, 3570 and 3577, 7370 and 7374,
3600 and 3674, or 5200 and 5961).
Big 4 Indicator variable equal to one if the audit firm is a Big 4, and zero otherwise.
Salegrowth Year-on-year sales growth of the issuer.
Weaknesses Indicator variable about whether an issuer has a material weakness in a fiscal year
as reported by Audit Analytics.
HiTech An indicator variable equal to one when the firm is in a hi-tech industry (three-
digit SIC code equal to 272, 283, 355, 357, 360, 361, 362, 363, 364, 365, 366, 367,
369, 381, 382, 386, 481, 484, 489, 573, 596, 621, 679, 733, 737, 738, or 873).
RelationshipLength Relationship length between client and auditor, measured from Compustat
Appendix B: Example of Publicly Disclosed Part I Finding, Based on the 2011 Inspection of
Deloitte
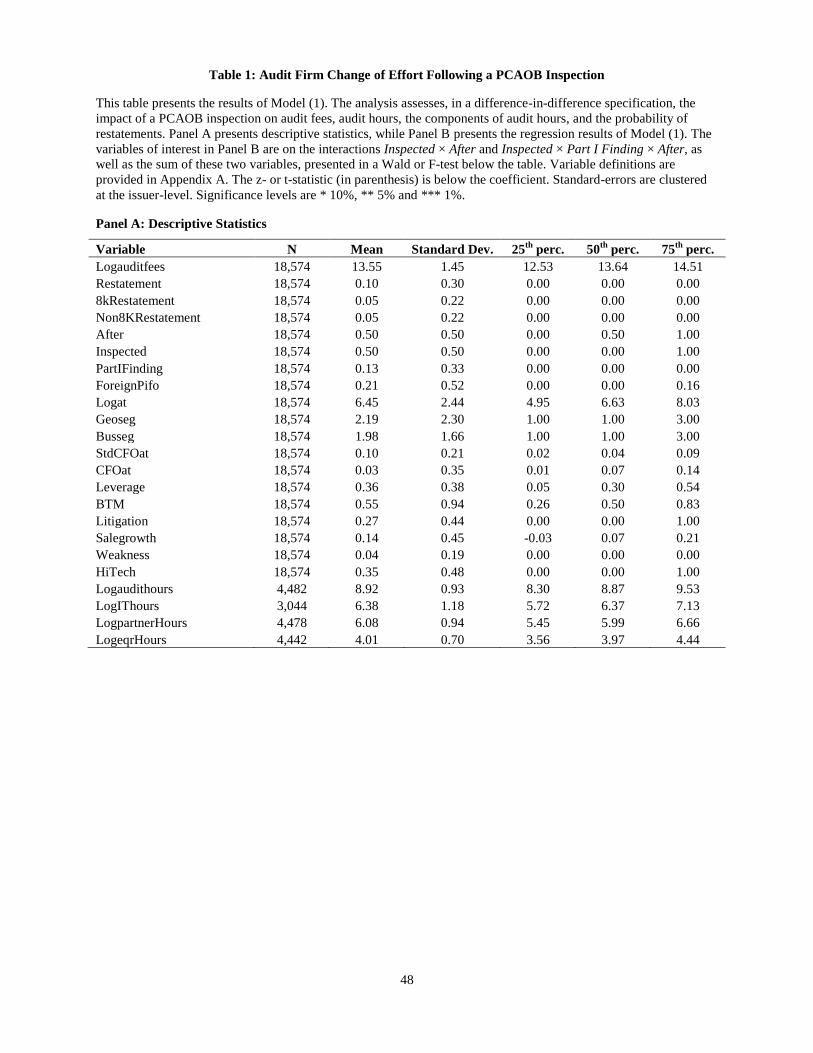
48
Table 1: Audit Firm Change of Effort Following a PCAOB Inspection
This table presents the results of Model (1). The analysis assesses, in a difference-in-difference specification, the
impact of a PCAOB inspection on audit fees, audit hours, the components of audit hours, and the probability of
restatements. Panel A presents descriptive statistics, while Panel B presents the regression results of Model (1). The
variables of interest in Panel B are on the interactions Inspected × After and Inspected × Part I Finding × After, as
well as the sum of these two variables, presented in a Wald or F-test below the table. Variable definitions are
provided in Appendix A. The z- or t-statistic (in parenthesis) is below the coefficient. Standard-errors are clustered
at the issuer-level. Significance levels are * 10%, ** 5% and *** 1%.
Panel A: Descriptive Statistics
Variable N Mean Standard Dev. 25th
perc. 50th
perc. 75th
perc.
Logauditfees 18,574 13.55 1.45 12.53 13.64 14.51
Restatement 18,574 0.10 0.30 0.00 0.00 0.00
8kRestatement 18,574 0.05 0.22 0.00 0.00 0.00
Non8KRestatement 18,574 0.05 0.22 0.00 0.00 0.00
After 18,574 0.50 0.50 0.00 0.50 1.00
Inspected 18,574 0.50 0.50 0.00 0.00 1.00
PartIFinding 18,574 0.13 0.33 0.00 0.00 0.00
ForeignPifo 18,574 0.21 0.52 0.00 0.00 0.16
Logat 18,574 6.45 2.44 4.95 6.63 8.03
Geoseg 18,574 2.19 2.30 1.00 1.00 3.00
Busseg 18,574 1.98 1.66 1.00 1.00 3.00
StdCFOat 18,574 0.10 0.21 0.02 0.04 0.09
CFOat 18,574 0.03 0.35 0.01 0.07 0.14
Leverage 18,574 0.36 0.38 0.05 0.30 0.54
BTM 18,574 0.55 0.94 0.26 0.50 0.83
Litigation 18,574 0.27 0.44 0.00 0.00 1.00
Salegrowth 18,574 0.14 0.45 -0.03 0.07 0.21
Weakness 18,574 0.04 0.19 0.00 0.00 0.00
HiTech 18,574 0.35 0.48 0.00 0.00 1.00
Logaudithours 4,482 8.92 0.93 8.30 8.87 9.53
LogIThours 3,044 6.38 1.18 5.72 6.37 7.13
LogpartnerHours 4,478 6.08 0.94 5.45 5.99 6.66
LogeqrHours 4,442 4.01 0.70 3.56 3.97 4.44
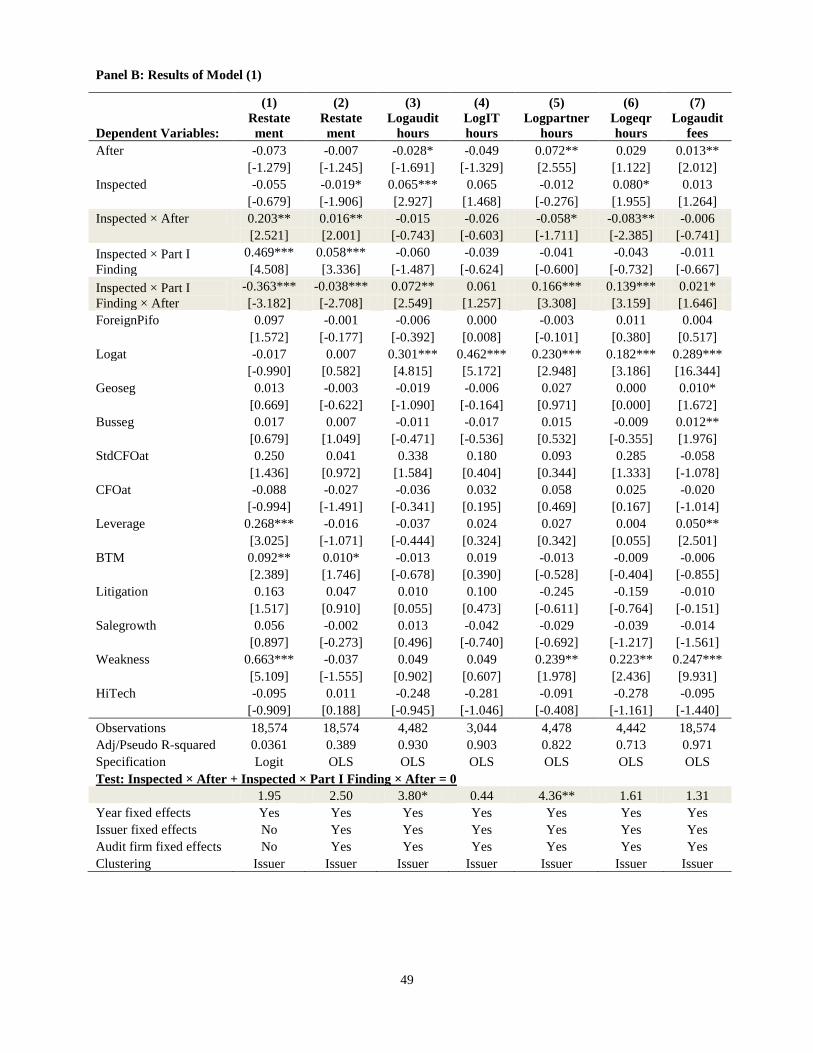
49
Panel B: Results of Model (1)
(1) (2) (3) (4) (5) (6) (7)
Dependent Variables:
Restate
ment
Restate
ment
Logaudit
hours
LogIT
hours
Logpartner
hours
Logeqr
hours
Logaudit
fees
After -0.073 -0.007 -0.028* -0.049 0.072** 0.029 0.013**
[-1.279] [-1.245] [-1.691] [-1.329] [2.555] [1.122] [2.012]
Inspected -0.055 -0.019* 0.065*** 0.065 -0.012 0.080* 0.013
[-0.679] [-1.906] [2.927] [1.468] [-0.276] [1.955] [1.264]
Inspected × After 0.203** 0.016** -0.015 -0.026 -0.058* -0.083** -0.006
[2.521] [2.001] [-0.743] [-0.603] [-1.711] [-2.385] [-0.741]
Inspected × Part I
Finding
0.469*** 0.058*** -0.060 -0.039 -0.041 -0.043 -0.011
[4.508] [3.336] [-1.487] [-0.624] [-0.600] [-0.732] [-0.667]
Inspected × Part I
Finding × After
-0.363*** -0.038*** 0.072** 0.061 0.166*** 0.139*** 0.021*
[-3.182] [-2.708] [2.549] [1.257] [3.308] [3.159] [1.646]
ForeignPifo 0.097 -0.001 -0.006 0.000 -0.003 0.011 0.004
[1.572] [-0.177] [-0.392] [0.008] [-0.101] [0.380] [0.517]
Logat -0.017 0.007 0.301*** 0.462*** 0.230*** 0.182*** 0.289***
[-0.990] [0.582] [4.815] [5.172] [2.948] [3.186] [16.344]
Geoseg 0.013 -0.003 -0.019 -0.006 0.027 0.000 0.010*
[0.669] [-0.622] [-1.090] [-0.164] [0.971] [0.000] [1.672]
Busseg 0.017 0.007 -0.011 -0.017 0.015 -0.009 0.012**
[0.679] [1.049] [-0.471] [-0.536] [0.532] [-0.355] [1.976]
StdCFOat 0.250 0.041 0.338 0.180 0.093 0.285 -0.058
[1.436] [0.972] [1.584] [0.404] [0.344] [1.333] [-1.078]
CFOat -0.088 -0.027 -0.036 0.032 0.058 0.025 -0.020
[-0.994] [-1.491] [-0.341] [0.195] [0.469] [0.167] [-1.014]
Leverage 0.268*** -0.016 -0.037 0.024 0.027 0.004 0.050**
[3.025] [-1.071] [-0.444] [0.324] [0.342] [0.055] [2.501]
BTM 0.092** 0.010* -0.013 0.019 -0.013 -0.009 -0.006
[2.389] [1.746] [-0.678] [0.390] [-0.528] [-0.404] [-0.855]
Litigation 0.163 0.047 0.010 0.100 -0.245 -0.159 -0.010
[1.517] [0.910] [0.055] [0.473] [-0.611] [-0.764] [-0.151]
Salegrowth 0.056 -0.002 0.013 -0.042 -0.029 -0.039 -0.014
[0.897] [-0.273] [0.496] [-0.740] [-0.692] [-1.217] [-1.561]
Weakness 0.663*** -0.037 0.049 0.049 0.239** 0.223** 0.247***
[5.109] [-1.555] [0.902] [0.607] [1.978] [2.436] [9.931]
HiTech -0.095 0.011 -0.248 -0.281 -0.091 -0.278 -0.095
[-0.909] [0.188] [-0.945] [-1.046] [-0.408] [-1.161] [-1.440]
Observations 18,574 18,574 4,482 3,044 4,478 4,442 18,574
Adj/Pseudo R-squared 0.0361 0.389 0.930 0.903 0.822 0.713 0.971
Specification Logit OLS OLS OLS OLS OLS OLS
Test: Inspected × After + Inspected × Part I Finding × After = 0
1.95 2.50 3.80* 0.44 4.36** 1.61 1.31
Year fixed effects Yes Yes Yes Yes Yes Yes Yes
Issuer fixed effects No Yes Yes Yes Yes Yes Yes
Audit firm fixed effects No Yes Yes Yes Yes Yes Yes
Clustering Issuer Issuer Issuer Issuer Issuer Issuer Issuer
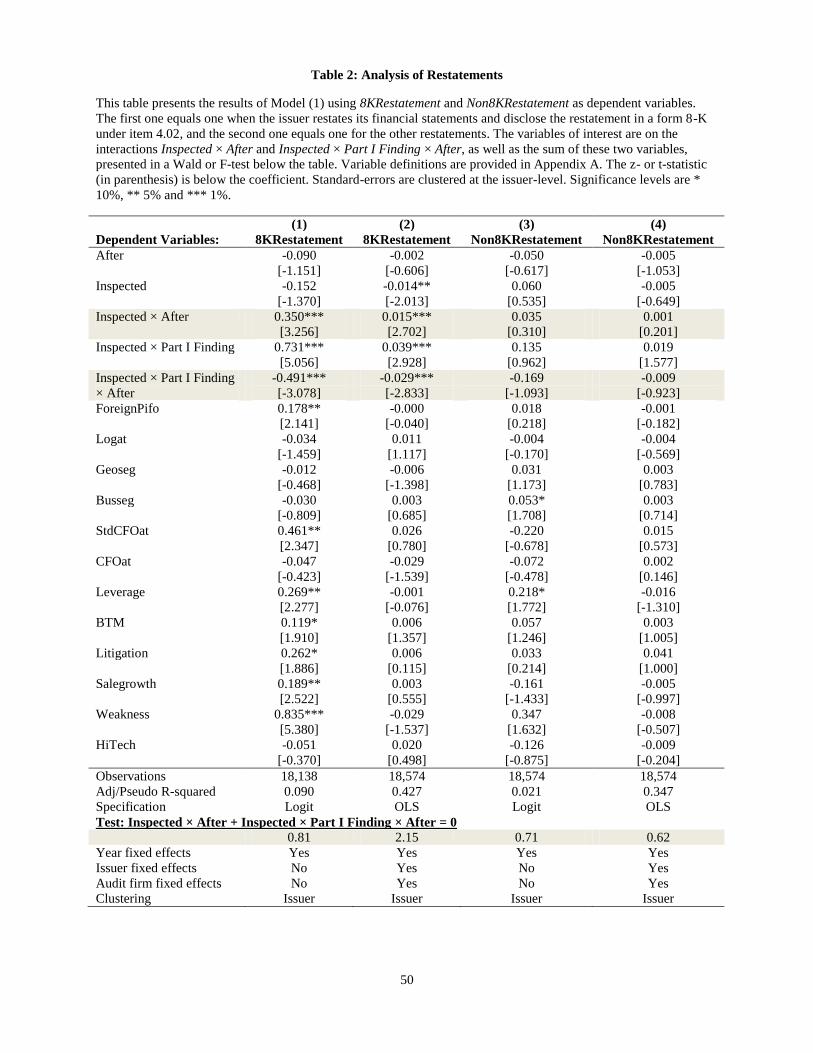
50
Table 2: Analysis of Restatements
This table presents the results of Model (1) using 8KRestatement and Non8KRestatement as dependent variables.
The first one equals one when the issuer restates its financial statements and disclose the restatement in a form 8-K
under item 4.02, and the second one equals one for the other restatements. The variables of interest are on the
interactions Inspected × After and Inspected × Part I Finding × After, as well as the sum of these two variables,
presented in a Wald or F-test below the table. Variable definitions are provided in Appendix A. The z- or t-statistic
(in parenthesis) is below the coefficient. Standard-errors are clustered at the issuer-level. Significance levels are *
10%, ** 5% and *** 1%.
(1) (2) (3) (4)
Dependent Variables: 8KRestatement 8KRestatement Non8KRestatement Non8KRestatement
After -0.090 -0.002 -0.050 -0.005
[-1.151] [-0.606] [-0.617] [-1.053]
Inspected -0.152 -0.014** 0.060 -0.005
[-1.370] [-2.013] [0.535] [-0.649]
Inspected × After 0.350*** 0.015*** 0.035 0.001
[3.256] [2.702] [0.310] [0.201]
Inspected × Part I Finding 0.731*** 0.039*** 0.135 0.019
[5.056] [2.928] [0.962] [1.577]
Inspected × Part I Finding
× After
-0.491*** -0.029*** -0.169 -0.009
[-3.078] [-2.833] [-1.093] [-0.923]
ForeignPifo 0.178** -0.000 0.018 -0.001
[2.141] [-0.040] [0.218] [-0.182]
Logat -0.034 0.011 -0.004 -0.004
[-1.459] [1.117] [-0.170] [-0.569]
Geoseg -0.012 -0.006 0.031 0.003
[-0.468] [-1.398] [1.173] [0.783]
Busseg -0.030 0.003 0.053* 0.003
[-0.809] [0.685] [1.708] [0.714]
StdCFOat 0.461** 0.026 -0.220 0.015
[2.347] [0.780] [-0.678] [0.573]
CFOat -0.047 -0.029 -0.072 0.002
[-0.423] [-1.539] [-0.478] [0.146]
Leverage 0.269** -0.001 0.218* -0.016
[2.277] [-0.076] [1.772] [-1.310]
BTM 0.119* 0.006 0.057 0.003
[1.910] [1.357] [1.246] [1.005]
Litigation 0.262* 0.006 0.033 0.041
[1.886] [0.115] [0.214] [1.000]
Salegrowth 0.189** 0.003 -0.161 -0.005
[2.522] [0.555] [-1.433] [-0.997]
Weakness 0.835*** -0.029 0.347 -0.008
[5.380] [-1.537] [1.632] [-0.507]
HiTech -0.051 0.020 -0.126 -0.009
[-0.370] [0.498] [-0.875] [-0.204]
Observations 18,138 18,574 18,574 18,574
Adj/Pseudo R-squared 0.090 0.427 0.021 0.347
Specification Logit OLS Logit OLS
Test: Inspected × After + Inspected × Part I Finding × After = 0
0.81 2.15 0.71 0.62
Year fixed effects Yes Yes Yes Yes
Issuer fixed effects No Yes No Yes
Audit firm fixed effects No Yes No Yes
Clustering Issuer Issuer Issuer Issuer
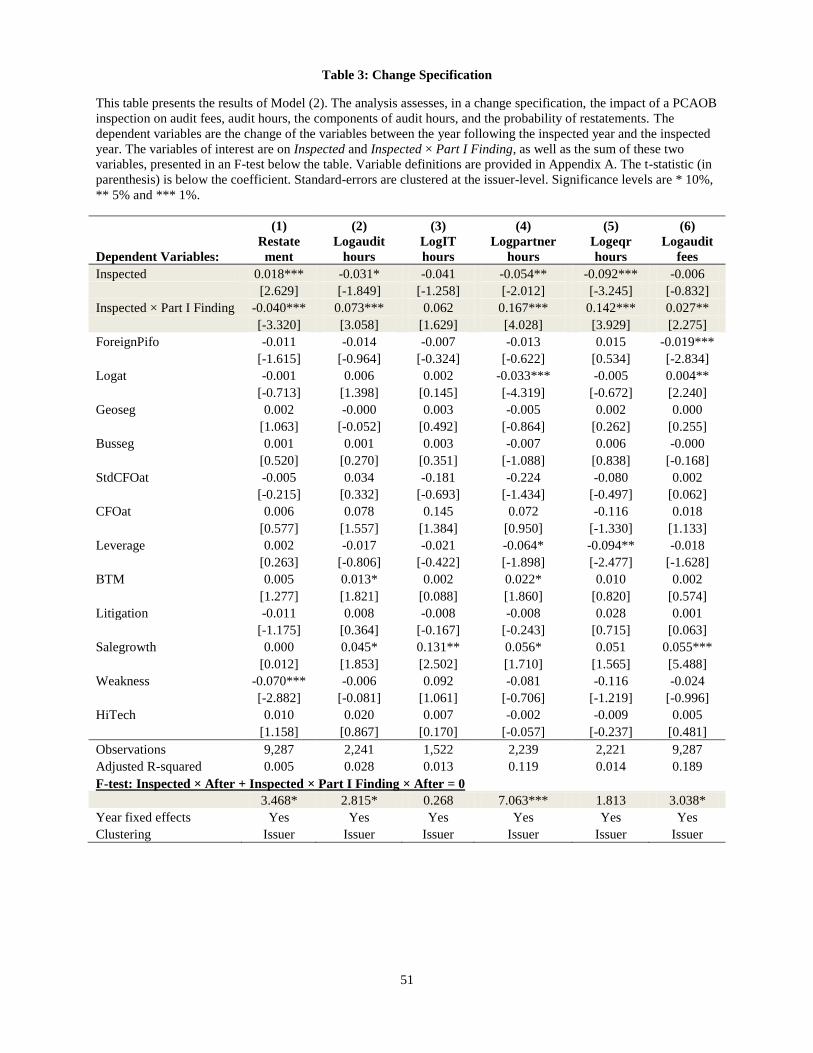
51
Table 3: Change Specification
This table presents the results of Model (2). The analysis assesses, in a change specification, the impact of a PCAOB
inspection on audit fees, audit hours, the components of audit hours, and the probability of restatements. The
dependent variables are the change of the variables between the year following the inspected year and the inspected
year. The variables of interest are on Inspected and Inspected × Part I Finding, as well as the sum of these two
variables, presented in an F-test below the table. Variable definitions are provided in Appendix A. The t-statistic (in
parenthesis) is below the coefficient. Standard-errors are clustered at the issuer-level. Significance levels are * 10%,
** 5% and *** 1%.
(1) (2) (3) (4) (5) (6)
Dependent Variables:
Restate
ment
Logaudit
hours
LogIT
hours
Logpartner
hours
Logeqr
hours
Logaudit
fees
Inspected 0.018*** -0.031* -0.041 -0.054** -0.092*** -0.006
[2.629] [-1.849] [-1.258] [-2.012] [-3.245] [-0.832]
Inspected × Part I Finding -0.040*** 0.073*** 0.062 0.167*** 0.142*** 0.027**
[-3.320] [3.058] [1.629] [4.028] [3.929] [2.275]
ForeignPifo -0.011 -0.014 -0.007 -0.013 0.015 -0.019***
[-1.615] [-0.964] [-0.324] [-0.622] [0.534] [-2.834]
Logat -0.001 0.006 0.002 -0.033*** -0.005 0.004**
[-0.713] [1.398] [0.145] [-4.319] [-0.672] [2.240]
Geoseg 0.002 -0.000 0.003 -0.005 0.002 0.000
[1.063] [-0.052] [0.492] [-0.864] [0.262] [0.255]
Busseg 0.001 0.001 0.003 -0.007 0.006 -0.000
[0.520] [0.270] [0.351] [-1.088] [0.838] [-0.168]
StdCFOat -0.005 0.034 -0.181 -0.224 -0.080 0.002
[-0.215] [0.332] [-0.693] [-1.434] [-0.497] [0.062]
CFOat 0.006 0.078 0.145 0.072 -0.116 0.018
[0.577] [1.557] [1.384] [0.950] [-1.330] [1.133]
Leverage 0.002 -0.017 -0.021 -0.064* -0.094** -0.018
[0.263] [-0.806] [-0.422] [-1.898] [-2.477] [-1.628]
BTM 0.005 0.013* 0.002 0.022* 0.010 0.002
[1.277] [1.821] [0.088] [1.860] [0.820] [0.574]
Litigation -0.011 0.008 -0.008 -0.008 0.028 0.001
[-1.175] [0.364] [-0.167] [-0.243] [0.715] [0.063]
Salegrowth 0.000 0.045* 0.131** 0.056* 0.051 0.055***
[0.012] [1.853] [2.502] [1.710] [1.565] [5.488]
Weakness -0.070*** -0.006 0.092 -0.081 -0.116 -0.024
[-2.882] [-0.081] [1.061] [-0.706] [-1.219] [-0.996]
HiTech 0.010 0.020 0.007 -0.002 -0.009 0.005
[1.158] [0.867] [0.170] [-0.057] [-0.237] [0.481]
Observations 9,287 2,241 1,522 2,239 2,221 9,287
Adjusted R-squared 0.005 0.028 0.013 0.119 0.014 0.189
F-test: Inspected × After + Inspected × Part I Finding × After = 0
3.468* 2.815* 0.268 7.063*** 1.813 3.038*
Year fixed effects Yes Yes Yes Yes Yes Yes
Clustering Issuer Issuer Issuer Issuer Issuer Issuer
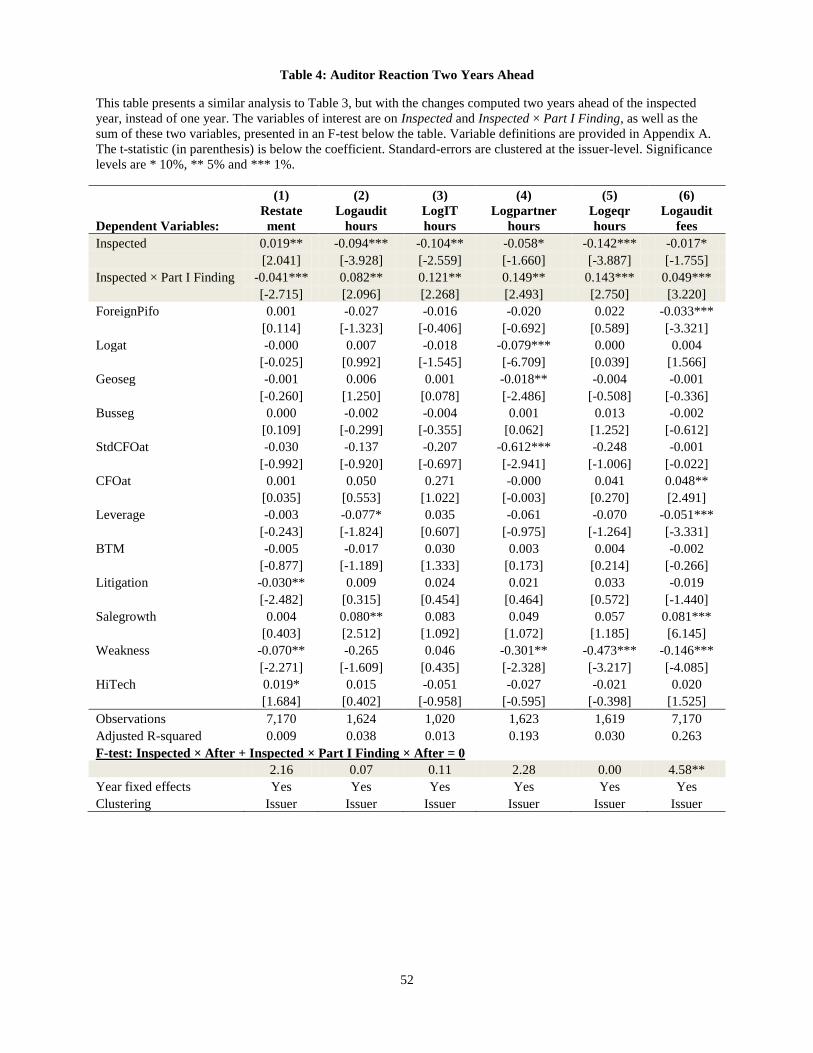
52
Table 4: Auditor Reaction Two Years Ahead
This table presents a similar analysis to Table 3, but with the changes computed two years ahead of the inspected
year, instead of one year. The variables of interest are on Inspected and Inspected × Part I Finding, as well as the
sum of these two variables, presented in an F-test below the table. Variable definitions are provided in Appendix A.
The t-statistic (in parenthesis) is below the coefficient. Standard-errors are clustered at the issuer-level. Significance
levels are * 10%, ** 5% and *** 1%.
(1) (2) (3) (4) (5) (6)
Dependent Variables:
Restate
ment
Logaudit
hours
LogIT
hours
Logpartner
hours
Logeqr
hours
Logaudit
fees
Inspected 0.019** -0.094*** -0.104** -0.058* -0.142*** -0.017*
[2.041] [-3.928] [-2.559] [-1.660] [-3.887] [-1.755]
Inspected × Part I Finding -0.041*** 0.082** 0.121** 0.149** 0.143*** 0.049***
[-2.715] [2.096] [2.268] [2.493] [2.750] [3.220]
ForeignPifo 0.001 -0.027 -0.016 -0.020 0.022 -0.033***
[0.114] [-1.323] [-0.406] [-0.692] [0.589] [-3.321]
Logat -0.000 0.007 -0.018 -0.079*** 0.000 0.004
[-0.025] [0.992] [-1.545] [-6.709] [0.039] [1.566]
Geoseg -0.001 0.006 0.001 -0.018** -0.004 -0.001
[-0.260] [1.250] [0.078] [-2.486] [-0.508] [-0.336]
Busseg 0.000 -0.002 -0.004 0.001 0.013 -0.002
[0.109] [-0.299] [-0.355] [0.062] [1.252] [-0.612]
StdCFOat -0.030 -0.137 -0.207 -0.612*** -0.248 -0.001
[-0.992] [-0.920] [-0.697] [-2.941] [-1.006] [-0.022]
CFOat 0.001 0.050 0.271 -0.000 0.041 0.048**
[0.035] [0.553] [1.022] [-0.003] [0.270] [2.491]
Leverage -0.003 -0.077* 0.035 -0.061 -0.070 -0.051***
[-0.243] [-1.824] [0.607] [-0.975] [-1.264] [-3.331]
BTM -0.005 -0.017 0.030 0.003 0.004 -0.002
[-0.877] [-1.189] [1.333] [0.173] [0.214] [-0.266]
Litigation -0.030** 0.009 0.024 0.021 0.033 -0.019
[-2.482] [0.315] [0.454] [0.464] [0.572] [-1.440]
Salegrowth 0.004 0.080** 0.083 0.049 0.057 0.081***
[0.403] [2.512] [1.092] [1.072] [1.185] [6.145]
Weakness -0.070** -0.265 0.046 -0.301** -0.473*** -0.146***
[-2.271] [-1.609] [0.435] [-2.328] [-3.217] [-4.085]
HiTech 0.019* 0.015 -0.051 -0.027 -0.021 0.020
[1.684] [0.402] [-0.958] [-0.595] [-0.398] [1.525]
Observations 7,170 1,624 1,020 1,623 1,619 7,170
Adjusted R-squared 0.009 0.038 0.013 0.193 0.030 0.263
F-test: Inspected × After + Inspected × Part I Finding × After = 0
2.16 0.07 0.11 2.28 0.00 4.58**
Year fixed effects Yes Yes Yes Yes Yes Yes
Clustering Issuer Issuer Issuer Issuer Issuer Issuer
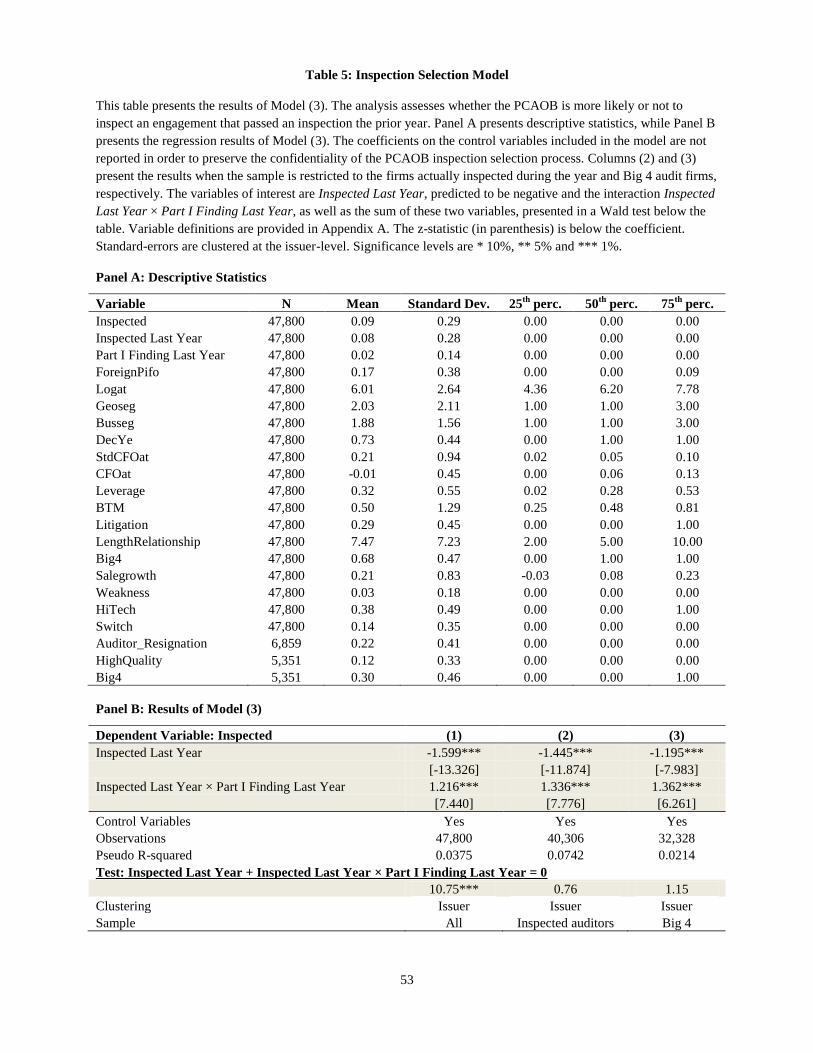
53
Table 5: Inspection Selection Model
This table presents the results of Model (3). The analysis assesses whether the PCAOB is more likely or not to
inspect an engagement that passed an inspection the prior year. Panel A presents descriptive statistics, while Panel B
presents the regression results of Model (3). The coefficients on the control variables included in the model are not
reported in order to preserve the confidentiality of the PCAOB inspection selection process. Columns (2) and (3)
present the results when the sample is restricted to the firms actually inspected during the year and Big 4 audit firms,
respectively. The variables of interest are Inspected Last Year, predicted to be negative and the interaction Inspected
Last Year × Part I Finding Last Year, as well as the sum of these two variables, presented in a Wald test below the
table. Variable definitions are provided in Appendix A. The z-statistic (in parenthesis) is below the coefficient.
Standard-errors are clustered at the issuer-level. Significance levels are * 10%, ** 5% and *** 1%.
Panel A: Descriptive Statistics
Variable N Mean Standard Dev. 25th
perc. 50th
perc. 75th
perc.
Inspected 47,800 0.09 0.29 0.00 0.00 0.00
Inspected Last Year 47,800 0.08 0.28 0.00 0.00 0.00
Part I Finding Last Year 47,800 0.02 0.14 0.00 0.00 0.00
ForeignPifo 47,800 0.17 0.38 0.00 0.00 0.09
Logat 47,800 6.01 2.64 4.36 6.20 7.78
Geoseg 47,800 2.03 2.11 1.00 1.00 3.00
Busseg 47,800 1.88 1.56 1.00 1.00 3.00
DecYe 47,800 0.73 0.44 0.00 1.00 1.00
StdCFOat 47,800 0.21 0.94 0.02 0.05 0.10
CFOat 47,800 -0.01 0.45 0.00 0.06 0.13
Leverage 47,800 0.32 0.55 0.02 0.28 0.53
BTM 47,800 0.50 1.29 0.25 0.48 0.81
Litigation 47,800 0.29 0.45 0.00 0.00 1.00
LengthRelationship 47,800 7.47 7.23 2.00 5.00 10.00
Big4 47,800 0.68 0.47 0.00 1.00 1.00
Salegrowth 47,800 0.21 0.83 -0.03 0.08 0.23
Weakness 47,800 0.03 0.18 0.00 0.00 0.00
HiTech 47,800 0.38 0.49 0.00 0.00 1.00
Switch 47,800 0.14 0.35 0.00 0.00 0.00
Auditor_Resignation 6,859 0.22 0.41 0.00 0.00 0.00
HighQuality 5,351 0.12 0.33 0.00 0.00 0.00
Big4 5,351 0.30 0.46 0.00 0.00 1.00
Panel B: Results of Model (3)
Dependent Variable: Inspected (1) (2) (3)
Inspected Last Year -1.599*** -1.445*** -1.195***
[-13.326] [-11.874] [-7.983]
Inspected Last Year × Part I Finding Last Year 1.216*** 1.336*** 1.362***
[7.440] [7.776] [6.261]
Control Variables Yes Yes Yes
Observations 47,800 40,306 32,328
Pseudo R-squared 0.0375 0.0742 0.0214
Test: Inspected Last Year + Inspected Last Year × Part I Finding Last Year = 0
10.75*** 0.76 1.15
Clustering Issuer Issuer Issuer
Sample All Inspected auditors Big 4
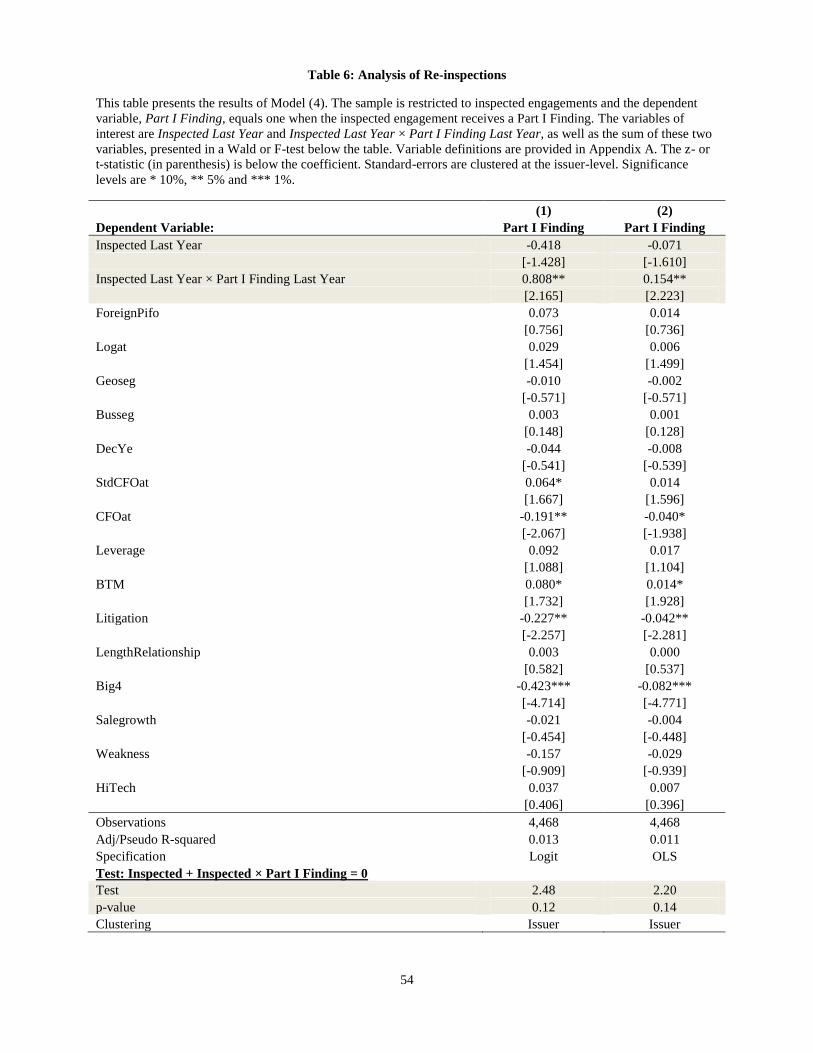
54
Table 6: Analysis of Re-inspections
This table presents the results of Model (4). The sample is restricted to inspected engagements and the dependent
variable, Part I Finding, equals one when the inspected engagement receives a Part I Finding. The variables of
interest are Inspected Last Year and Inspected Last Year × Part I Finding Last Year, as well as the sum of these two
variables, presented in a Wald or F-test below the table. Variable definitions are provided in Appendix A. The z- or
t-statistic (in parenthesis) is below the coefficient. Standard-errors are clustered at the issuer-level. Significance
levels are * 10%, ** 5% and *** 1%.
(1) (2)
Dependent Variable: Part I Finding Part I Finding
Inspected Last Year -0.418 -0.071
[-1.428] [-1.610]
Inspected Last Year × Part I Finding Last Year 0.808** 0.154**
[2.165] [2.223]
ForeignPifo 0.073 0.014
[0.756] [0.736]
Logat 0.029 0.006
[1.454] [1.499]
Geoseg -0.010 -0.002
[-0.571] [-0.571]
Busseg 0.003 0.001
[0.148] [0.128]
DecYe -0.044 -0.008
[-0.541] [-0.539]
StdCFOat 0.064* 0.014
[1.667] [1.596]
CFOat -0.191** -0.040*
[-2.067] [-1.938]
Leverage 0.092 0.017
[1.088] [1.104]
BTM 0.080* 0.014*
[1.732] [1.928]
Litigation -0.227** -0.042**
[-2.257] [-2.281]
LengthRelationship 0.003 0.000
[0.582] [0.537]
Big4 -0.423*** -0.082***
[-4.714] [-4.771]
Salegrowth -0.021 -0.004
[-0.454] [-0.448]
Weakness -0.157 -0.029
[-0.909] [-0.939]
HiTech 0.037 0.007
[0.406] [0.396]
Observations 4,468 4,468
Adj/Pseudo R-squared 0.013 0.011
Specification Logit OLS
Test: Inspected + Inspected × Part I Finding = 0
Test 2.48 2.20
p-value 0.12 0.14
Clustering Issuer Issuer
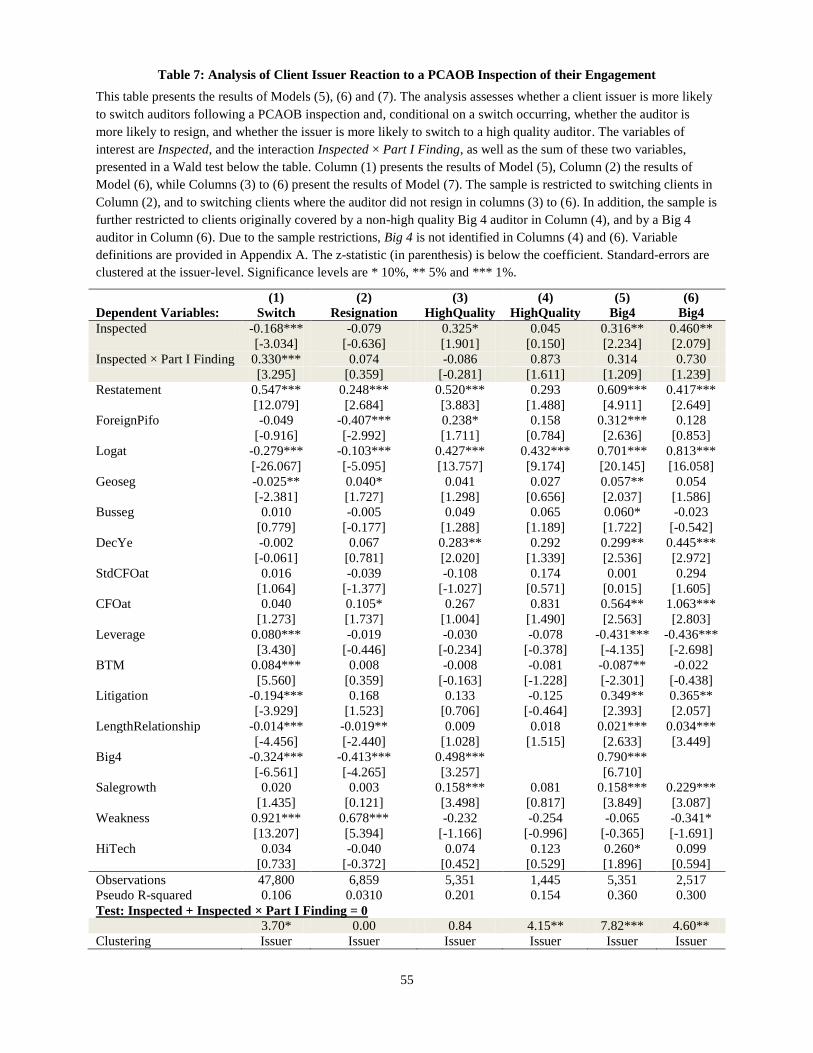
55
Table 7: Analysis of Client Issuer Reaction to a PCAOB Inspection of their Engagement
This table presents the results of Models (5), (6) and (7). The analysis assesses whether a client issuer is more likely
to switch auditors following a PCAOB inspection and, conditional on a switch occurring, whether the auditor is
more likely to resign, and whether the issuer is more likely to switch to a high quality auditor. The variables of
interest are Inspected, and the interaction Inspected × Part I Finding, as well as the sum of these two variables,
presented in a Wald test below the table. Column (1) presents the results of Model (5), Column (2) the results of
Model (6), while Columns (3) to (6) present the results of Model (7). The sample is restricted to switching clients in
Column (2), and to switching clients where the auditor did not resign in columns (3) to (6). In addition, the sample is
further restricted to clients originally covered by a non-high quality Big 4 auditor in Column (4), and by a Big 4
auditor in Column (6). Due to the sample restrictions, Big 4 is not identified in Columns (4) and (6). Variable
definitions are provided in Appendix A. The z-statistic (in parenthesis) is below the coefficient. Standard-errors are
clustered at the issuer-level. Significance levels are * 10%, ** 5% and *** 1%.
(1) (2) (3) (4) (5) (6)
Dependent Variables: Switch Resignation HighQuality HighQuality Big4 Big4
Inspected -0.168*** -0.079 0.325* 0.045 0.316** 0.460**
[-3.034] [-0.636] [1.901] [0.150] [2.234] [2.079]
Inspected × Part I Finding 0.330*** 0.074 -0.086 0.873 0.314 0.730
[3.295] [0.359] [-0.281] [1.611] [1.209] [1.239]
Restatement 0.547*** 0.248*** 0.520*** 0.293 0.609*** 0.417***
[12.079] [2.684] [3.883] [1.488] [4.911] [2.649]
ForeignPifo -0.049 -0.407*** 0.238* 0.158 0.312*** 0.128
[-0.916] [-2.992] [1.711] [0.784] [2.636] [0.853]
Logat -0.279*** -0.103*** 0.427*** 0.432*** 0.701*** 0.813***
[-26.067] [-5.095] [13.757] [9.174] [20.145] [16.058]
Geoseg -0.025** 0.040* 0.041 0.027 0.057** 0.054
[-2.381] [1.727] [1.298] [0.656] [2.037] [1.586]
Busseg 0.010 -0.005 0.049 0.065 0.060* -0.023
[0.779] [-0.177] [1.288] [1.189] [1.722] [-0.542]
DecYe -0.002 0.067 0.283** 0.292 0.299** 0.445***
[-0.061] [0.781] [2.020] [1.339] [2.536] [2.972]
StdCFOat 0.016 -0.039 -0.108 0.174 0.001 0.294
[1.064] [-1.377] [-1.027] [0.571] [0.015] [1.605]
CFOat 0.040 0.105* 0.267 0.831 0.564** 1.063***
[1.273] [1.737] [1.004] [1.490] [2.563] [2.803]
Leverage 0.080*** -0.019 -0.030 -0.078 -0.431*** -0.436***
[3.430] [-0.446] [-0.234] [-0.378] [-4.135] [-2.698]
BTM 0.084*** 0.008 -0.008 -0.081 -0.087** -0.022
[5.560] [0.359] [-0.163] [-1.228] [-2.301] [-0.438]
Litigation -0.194*** 0.168 0.133 -0.125 0.349** 0.365**
[-3.929] [1.523] [0.706] [-0.464] [2.393] [2.057]
LengthRelationship -0.014*** -0.019** 0.009 0.018 0.021*** 0.034***
[-4.456] [-2.440] [1.028] [1.515] [2.633] [3.449]
Big4 -0.324*** -0.413*** 0.498***
0.790***
[-6.561] [-4.265] [3.257]
[6.710]
Salegrowth 0.020 0.003 0.158*** 0.081 0.158*** 0.229***
[1.435] [0.121] [3.498] [0.817] [3.849] [3.087]
Weakness 0.921*** 0.678*** -0.232 -0.254 -0.065 -0.341*
[13.207] [5.394] [-1.166] [-0.996] [-0.365] [-1.691]
HiTech 0.034 -0.040 0.074 0.123 0.260* 0.099
[0.733] [-0.372] [0.452] [0.529] [1.896] [0.594]
Observations 47,800 6,859 5,351 1,445 5,351 2,517
Pseudo R-squared 0.106 0.0310 0.201 0.154 0.360 0.300
Test: Inspected + Inspected × Part I Finding = 0
3.70* 0.00 0.84 4.15** 7.82*** 4.60**
Clustering Issuer Issuer Issuer Issuer Issuer Issuer
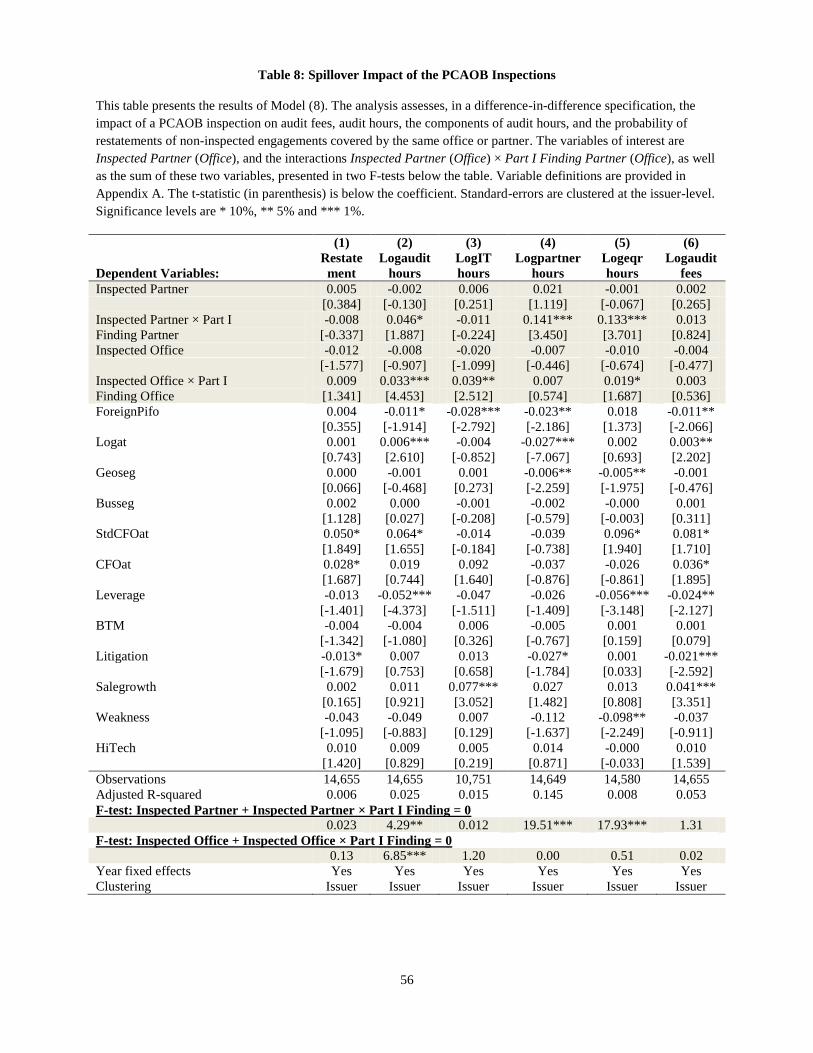
56
Table 8: Spillover Impact of the PCAOB Inspections
This table presents the results of Model (8). The analysis assesses, in a difference-in-difference specification, the
impact of a PCAOB inspection on audit fees, audit hours, the components of audit hours, and the probability of
restatements of non-inspected engagements covered by the same office or partner. The variables of interest are
Inspected Partner (Office), and the interactions Inspected Partner (Office) × Part I Finding Partner (Office), as well
as the sum of these two variables, presented in two F-tests below the table. Variable definitions are provided in
Appendix A. The t-statistic (in parenthesis) is below the coefficient. Standard-errors are clustered at the issuer-level.
Significance levels are * 10%, ** 5% and *** 1%.
(1) (2) (3) (4) (5) (6)
Dependent Variables:
Restate
ment
Logaudit
hours
LogIT
hours
Logpartner
hours
Logeqr
hours
Logaudit
fees
Inspected Partner 0.005 -0.002 0.006 0.021 -0.001 0.002
[0.384] [-0.130] [0.251] [1.119] [-0.067] [0.265]
Inspected Partner × Part I
Finding Partner
-0.008 0.046* -0.011 0.141*** 0.133*** 0.013
[-0.337] [1.887] [-0.224] [3.450] [3.701] [0.824]
Inspected Office -0.012 -0.008 -0.020 -0.007 -0.010 -0.004
[-1.577] [-0.907] [-1.099] [-0.446] [-0.674] [-0.477]
Inspected Office × Part I
Finding Office
0.009 0.033*** 0.039** 0.007 0.019* 0.003
[1.341] [4.453] [2.512] [0.574] [1.687] [0.536]
ForeignPifo 0.004 -0.011* -0.028*** -0.023** 0.018 -0.011**
[0.355] [-1.914] [-2.792] [-2.186] [1.373] [-2.066]
Logat 0.001 0.006*** -0.004 -0.027*** 0.002 0.003**
[0.743] [2.610] [-0.852] [-7.067] [0.693] [2.202]
Geoseg 0.000 -0.001 0.001 -0.006** -0.005** -0.001
[0.066] [-0.468] [0.273] [-2.259] [-1.975] [-0.476]
Busseg 0.002 0.000 -0.001 -0.002 -0.000 0.001
[1.128] [0.027] [-0.208] [-0.579] [-0.003] [0.311]
StdCFOat 0.050* 0.064* -0.014 -0.039 0.096* 0.081*
[1.849] [1.655] [-0.184] [-0.738] [1.940] [1.710]
CFOat 0.028* 0.019 0.092 -0.037 -0.026 0.036*
[1.687] [0.744] [1.640] [-0.876] [-0.861] [1.895]
Leverage -0.013 -0.052*** -0.047 -0.026 -0.056*** -0.024**
[-1.401] [-4.373] [-1.511] [-1.409] [-3.148] [-2.127]
BTM -0.004 -0.004 0.006 -0.005 0.001 0.001
[-1.342] [-1.080] [0.326] [-0.767] [0.159] [0.079]
Litigation -0.013* 0.007 0.013 -0.027* 0.001 -0.021***
[-1.679] [0.753] [0.658] [-1.784] [0.033] [-2.592]
Salegrowth 0.002 0.011 0.077*** 0.027 0.013 0.041***
[0.165] [0.921] [3.052] [1.482] [0.808] [3.351]
Weakness -0.043 -0.049 0.007 -0.112 -0.098** -0.037
[-1.095] [-0.883] [0.129] [-1.637] [-2.249] [-0.911]
HiTech 0.010 0.009 0.005 0.014 -0.000 0.010
[1.420] [0.829] [0.219] [0.871] [-0.033] [1.539]
Observations 14,655 14,655 10,751 14,649 14,580 14,655
Adjusted R-squared 0.006 0.025 0.015 0.145 0.008 0.053
F-test: Inspected Partner + Inspected Partner × Part I Finding = 0
0.023 4.29** 0.012 19.51*** 17.93*** 1.31
F-test: Inspected Office + Inspected Office × Part I Finding = 0
0.13 6.85*** 1.20 0.00 0.51 0.02
Year fixed effects Yes Yes Yes Yes Yes Yes
Clustering Issuer Issuer Issuer Issuer Issuer Issuer
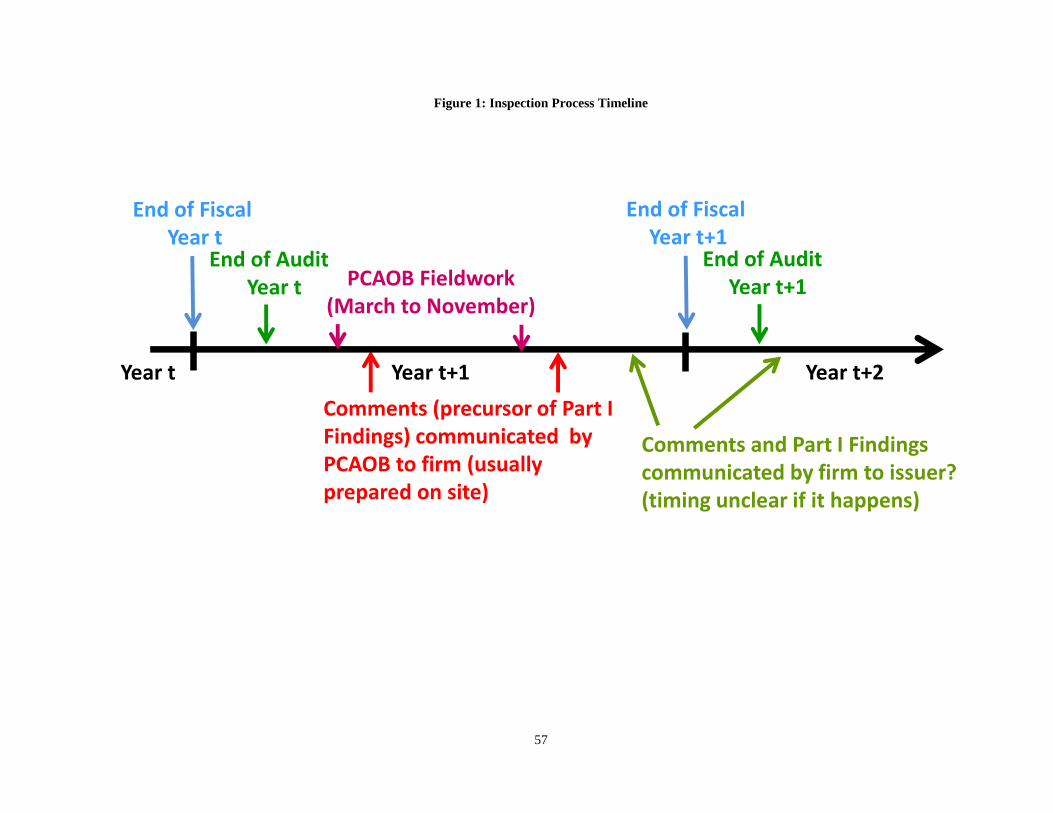
57
Figure 1: Inspection Process Timeline
Year t Year t+1 Year t+2
End of FiscalYear t
End of AuditYear t PCAOB Fieldwork
(March to November)
Comments (precursor of Part I Findings) communicated by PCAOB to firm (usually prepared on site)
Comments and Part I Findings communicated by firm to issuer? (timing unclear if it happens)
End of FiscalYear t+1
End of AuditYear t+1