Embed Size (px)
Citation preview
The Income Distribution Effect of Natural Disasters: An Analysis of Hurricane Katrina Timothy M. Shaughnessy, Mary L. White, and Michael D. Brendler Louisiana State University in Shreveport – USA
Abstract. This paper combines the study of income distribution with that of natural disasters. We introduce several income density functions to approximate the income distributions of five samples: New Orleans prior to Katrina, New Orleans after Katrina, the United States during the same year (2005), and then New Orleans and the United States in 2007. We then assess the goodness of fit of these models to determine which most accurately represents the income dis-tributions of the samples. We conclude with a discussion of how the income inequality and distribution was impacted in the city of New Orleans by Hurricane Katrina using the best-fitting models and examine the persistence of these changes two years later.
1. Introduction There is a growing literature on the topic of natural
disasters, with recent emphasis on the effect of hurri-canes. This work has been largely outside the field of economics, although those papers within the field usually address issues of economic damages, recovery costs, public service provision (both pre- and post-disaster), and urban planning. A much broader litera-ture in economics deals with the topic of income distribution, both in a normative sense of what the proper income distribution should be and how to at-tain it, and in a positive sense of both the methodology for measuring the distribution and approximating the actual distribution using different theoretical models.
The goal of this paper is to combine the study of income distribution with that of the study of natural disasters. First, we provide a background on the effects of the hurricane using a variety of non-income related variables. Section three presents a brief litera-ture review. In section four we examine the income distribution in New Orleans to see what effect Hurri-cane Katrina had on the metropolitan area, as well as compare the area pre- and post-Katrina with the income distribution of the United States. Data is avail-able showing the proportion of the population in different income classes prior to and shortly after the
storm. We report this actual distribution, and then attempt to model this distribution using a variety of popular income density functions presented in section five. These distributions are then compared to data from 2007 to examine whether the effect on income inequality was either temporary or more persistent. Section six assesses the fit of these three functions. Section seven provides commentary on frequently used representations of income distribution: Lorenz curves and Gini ratios. In the final section, we present our conclusions.
2. Background
Hurricane Katrina made landfall in southeast Loui-siana/southwest Mississippi on August 29, 2005, as a category three storm with winds up to 125 mph. Though the storm itself did not directly inflict major damage to the New Orleans area, the flooding that followed the storm was devastating. Brunkard et al. (2008) present a conservative storm-related death toll of 986, and the economic impact of the storm is esti-mated in the hundreds of billions of dollars, including economic damages and recovery efforts. The number of housing units dropped from 552,454 from January until the storm to 418,171 from the storm to December
JRAP 40(1): 84-95. © 2010 MCRSA. All rights reserved.
Income Distribution Effect of Natural Disasters 85
2005. The housing vacancy rate jumped from 10.8% to 31.8%.1
The population of the New Orleans MSA stood at 1,190,615 from January to August 2005, but dropped to 723,830 from September to December of that year.
2 Further, New Orleans had a relatively high level of poverty, where 194,800 people of the MSA population (23.2% of the city population) lived at or below the poverty line at the time of the storm.3
The composition of the workforce in the MSA saw dramatic changes as well.
The median age of residents in the MSA rose from 37.7 to 41.6, reflect-ing the greater mobility of younger residents to eva-cuate or move out of the area. Whites were 59.3% of the MSA population before the storm and 73.0% after; blacks were 36.6% before and 21.7% after (ACS, 2005).
4 The working-age popula-tion dropped almost 40% from January-August 2005 to September-December 2005, from 933,249 to 574,934.5 Per capita personal income growth in the MSA was growing at 5.7% from 2003-2004 but plummeted by 33.2% from 2004-2005.6 The Current Population Sur-vey tracked the monthly employment status from October 2005 to October 2006 of those who did and those who did not return to the homes in which they lived in August 2005.7
1U.S. Census Bureau, 2005 American Community Survey (ACS) Gulf Coast Area Data Profiles, New Orleans-Metairie-Kenner, LA Metro-politan Statistical Area Data Profiles, http://www.census.gov/acs/www/Products/Profiles/gulf_coast/tables/tab4_katrinaK0100US2203v.htm, accessed Jan 20, 2007.
Those who had returned to the homes from which they evacuated increased from about 40% in October 2005 to about 60% in October 2006. The monthly unemployment rates of this group that returned to their homes stayed at least 9.8 percen-tage points lower than the rates of the group that did not return home. A month after the storm, those who
2U.S. Census Bureau, 2005 American Community Survey (ACS) Gulf Coast Area Data Profiles, New Orleans-Metairie-Kenner, LA Metro-politan Statistical Area Data Profiles, http://www.census.gov/acs/www/Products/Profiles/gulf_coast/tables/tab1_katrinaK0100US2203v.htm, accessed Nov. 27, 2006. 3U.S. Census Bureau, Sep. 2, 2005 Press Release. http://www.census.gov/Press-Release/www/releases/archives/ hurricanes_tropical_storms/005673.html, accessed Nov. 27, 2006. 4 For those interested in a descriptive analysis of the physical dislo-cations and the resulting social dislocations, we suggest The Storm by Van Heerden and Bryan (2006). 5U.S. Census Bureau, 2005 American Community Survey (ACS) Gulf Coast Area Data Profiles, New Orleans-Metairie-Kenner, LA Metro-politan Statistical Area Data Profiles, http://www.census.gov/acs/www/Products/Profiles/gulf_coast/tables/tab3_katrinaK0100US2203v.htm, accessed Jan 13, 2007. 6Bureau of Economic Analysis News Release, Personal Income for Metropolitan Areas, 2005. http://www.bea.gov/bea/ newsrelarchive/2006/mpi0906.htm, accessed January 11, 2007. 7Bureau of Labor Statistics, Employment Status Information on Hur-ricane Katrina Evacuees. http://www.bls.gov/ katrina/empstatusinfo.htm, accessed January 13, 2007.
evacuated but returned home had an unemployment rate of 10.5% compared to 33.4% who were living elsewhere. These rates both decreased by October 2006 but still showed a clear difference: 7.0% for those in the same homes and 17.9% for those in different homes.
Researchers interested in the study of income distribution have shown considerable interest in the post-Katrina New Orleans MSA, as it represents a truly exogenous disruption of a major city’s demo-graphic composition. The ability of a household to evacuate, return home, rebuild if necessary, and find employment again arguably all vary with household wealth or income. The extent to which households of different income levels were affected by Katrina will result in considerable changes in the city’s political, social, and cultural environment. Therefore, an accu-rate measurement of the displacement that occurred due to the storm, and thus the resulting change in in-come distribution, is needed. 3. Literature review
Natural disasters have widespread effects on local economies. They not only cause physical destruction and supply disruptions of resources but also impact households, creating labor disruptions. Assessing the immediate and long-term economic impacts of a disas-ter is difficult due to a lack of available data and is a problem long studied by economists. Short-run studies are often focused on the immediate impacts of a disaster (Guimaraes et al., 1993) and how economic relationships might be disrupted (West and Lenze, 1994). Economic recovery is often considered in the context of aggregate economic variables such as taxa-ble sales (Baade et al., 2007) or population changes (Smith and McCarty, 1996).
There are several papers that examine the effects of natural disasters on output, capital growth, employ-ment, and other variables not directly related to income distribution. Albala-Bertrand (1993) develops a theoretical macroeconomic model to examine the ef-fects of natural disasters on the capital stock and the growth rate of output. Interestingly, a conclusion from the model is that the compensation required to restore output to pre-disaster levels is relatively small, as “the first estimates of general losses…have been shown to be normally highly overestimated” (p. 1417). This con-clusion can be contrasted with the $120.5 billion devoted to New Orleans’ emergency relief and rebuilding efforts and bolsters Albala-Bertrand’s (1993) point that initial responses to sudden disasters
86 Shaughnessy, White, and Brendler
are usually relatively high compared to actual losses.8 Many of these studies are often done within the con-text of whether an economy has returned to its pre-disaster levels of activity, but such information may not provide a complete picture of the redistributive effects. Skidmore & Toya (2002) describes the long-run growth impact from natural disasters and shows that the destruction of physical capital in disasters encou-rages substitution toward human capital in disaster-prone areas. It provides evidence showing a signifi-cant positive relationship between disasters and per capita GDP growth,9
Two key articles have directly studied the relation-ship between income distribution and fatalities result-ing from natural disasters. Using international data, Kahn (2005) finds geographical areas with higher levels of income inequality, as measured by the Gini Coefficient, suffer more deaths from disasters than areas with less inequality. Anbarci et al. (2005) dis-cusses how the number of fatalities and response to earthquakes are related to the combined effects of per capita income and income inequality. Essentially, a larger income disparity will lead those with higher incomes to be less concerned with cooperating in col-lective action to recover from earthquakes, so that the harm from the disaster is felt mostly by the poor rely-ing on government assistance since the wealthy can privately self-insure. An interesting implication of Anbarci, et al.’s (2005) results is that the costs of a storm in terms of damage and fatalities are to an ex-tent endogenous in that political and economic institu-tions matter significantly. A more significant implica-tion of Anbarci, which is well-suited to be tested using our data, is whether higher-income New Orleans resi-dents were less invested in returning to the area after Katrina. The initial evidence, as discussed in section two, appears to contradict Anbarci’s conclusion.
driven by the positive externali-ties associated with human capital accumulation and by the adoption of better technology that improves factor productivity.
The massive evacuation that occurred prior to Hur-ricane Katrina is one factor likely to affect the distribu-tion of income. If differentials exist in evacuees’ ability to return to the city after the disaster, then the distri-bution of income immediately after the hurricane is likely to be affected. If households make different decisions about migrating back to the city, then the income distribution could be permanently affected.
8 Total enacted federal spending: “Katrina/Rita Financial Assistance (Emergency Supplementals),” U.S. Department of Homeland Securi-ty, http://www.dhs.gov/xlibrary/assets/gcr_katrina-rita_finasst.pdf. 9 The positive association is better seen in climatic disasters (of which Katrina is an example) versus geologic disasters.
Landry et al. (2007) analyzes two samples of Hurricane Katrina evacuees to model their return mi-gration decision and finds evidence that in the months immediately following the storm lower income indi-viduals were less likely to migrate back.
One branch of the literature on income distribution uses Lorenz curves and Gini ratios to measure the existing income distribution. A thorough study is Madden (2000), which includes every metropolitan area in the U.S. and analyzes changes in several variables over the period 1979 to 1989. Earlier work by Brendler and Jones (1994) follows the approach used by Madden. In that study they considered just the metropolitan areas in Louisiana and Texas, with the variables measured across the metropolitan areas in a single year, 1990.
Another area of the literature that is of interest concerns the different ways to model and explain the income distribution. Campano and Salvatore (2006) discusses several models and provides the basis for the present study. It considers a few complex methods (e.g., estimating a five parameter Champernowne probability density function with two functional forms). Our approach will follow its analysis of three models: the lognormal, the log-logistic, and Singh-Maddala.
4. Pre- and post-Katrina and U.S. data
As mentioned, measuring the immediate economic effects of a hurricane is often difficult due to a lack of available data. The Census Bureau compiles the na-tionwide American Community Survey (ACS) on an annual basis, but due to the significance of Katrina the Census released two ACS estimates for the affected areas for 2005: from January through August and from September through December. Part of the sample was the New Orleans-Metairie-Kenner, Louisiana, MSA. The data on income distribution used in this study are available online under the 2005 American Community Survey Gulf Coast Area Data Profiles in “Table 3: Pro-file of Selected Economic Characteristics” and also available from American FactFinder.10 As the ACS data provide 2005 information for New Orleans, we wanted a comparison with the national income distri-bution in the same year, so data for the United States was obtained as well.11
10http://www.census.gov/acs/www/Products/Profiles/gulf_coast/tables/tab3_katrinaK0100US2203v.htm.
11http://factfinder.census.gov/servlet/DTTable?_bm=y&-geo_id=01000US&-ds_name=ACS_2005_EST_G00_&-_lang=en&-mt_name=ACS_2005_EST_G2000_B19001&-mt_name=ACS_2005_EST_G2000_C19001&-format=&-CONTEXT=dt.
Income Distribution Effect of Natural Disasters 87
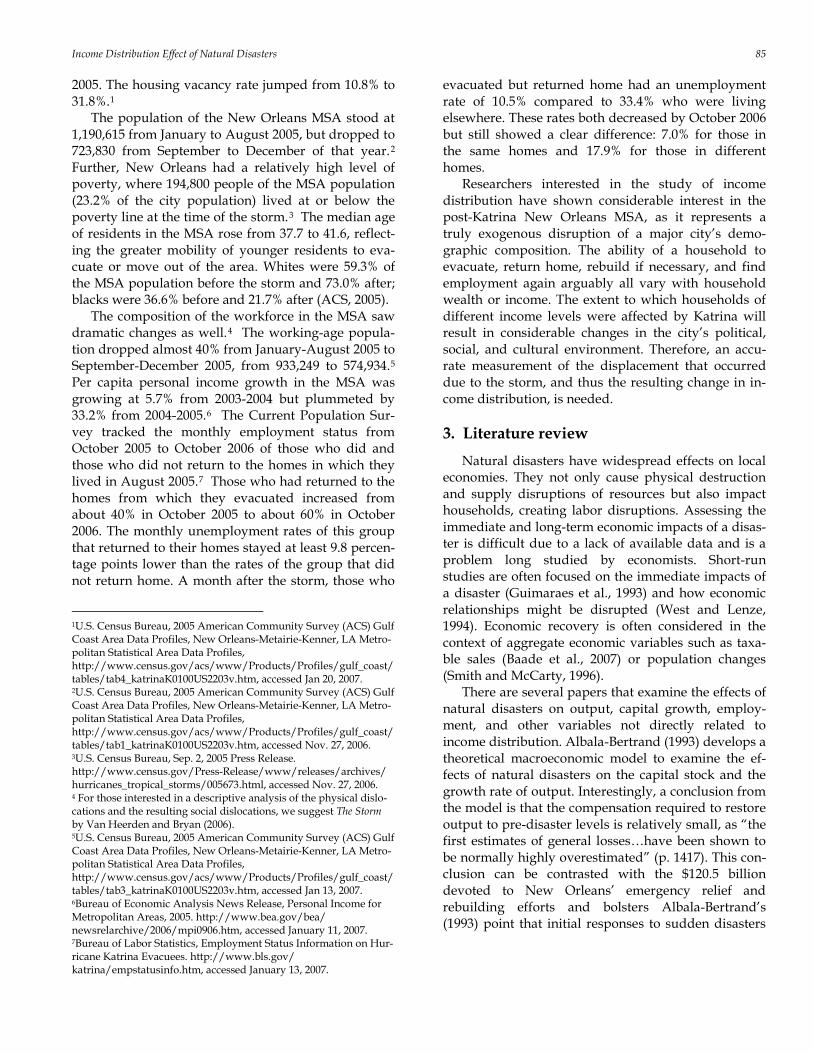
Table 1A — 2005 income distribution, proportion in each income class.
New Orleans U.S. Real income & benefits (2005 $) Jan-Aug 2005 Sep-Dec 2005 % change 2005 Total households 492,912 285,106 -42.16% 111,090,617 Less than $10,000 11.4% 9.1% -20.18% 8.65% $10,000 to $14,999 8.3% 6.5% -21.69% 6.2% $15,000 to $24,999 13.8% 13.9% 0.72% 11.96% $25,000 to $34,999 11.2% 11.7% 4.46% 11.48% $35,000 to $49,999 14.5% 14.2% -2.07% 15.08% $50,000 to $74,999 16.6% 16.1% -3.01% 18.91% $75,000 to $99,999 10.5% 11.4% 8.57% 11.39% $100,000 to $149,999 9.0% 9.6% 6.67% 10.13% $150,000 to $199,999 2.2% 3.7% 68.18% 3.19% $200,000 or more 2.5% 3.8% 52% 3.02% Median household income $39,793 $43,447 9.18% $46,242 Mean household income $55,326 $64,122 15.90% $62,556 Source: Census Bureau, American Community Survey. Table 1B. 2007 income distribution, proportion in each income class. New Orleans % Change U.S. % Change Real income & benefits (2007 $) 2007 Since Aug 2005 2007 Since 2005 Total households 367,100 -25.5% 112,377,977 1.2% Less than $10,000 8.2% -28.1% 7.3% 17.7% $10,000 to $14,999 6.1% -26.5% 5.6% -53.2% $15,000 to $24,999 11.4% -17.4% 10.99% -4.3% $25,000 to $34,999 11.1% -0.9% 10.7% -29.0% $35,000 to $49,999 14.5% 0.0% 14.5% -23.3% $50,000 to $74,999 18.1% 9.0% 18.9% 65.9% $75,000 to $99,999 12.6% 20.0% 12.2% 20.4% $100,000 to $149,999 10.8% 20.0% 11.7% 266.8% $150,000 to $199,999 3.6% 63.6% 4.01% 32.8% $200,000 or more 3.6% 44.0% 3.96% -36.1% Median household income $48,109 20.9% $50,740 9.7% Mean household income $66,596 20.4% $69,193 10.6% Source: Census Bureau, American Community Survey.
Short-run changes are informative and may pro-vide early insight into the long-term effects on income. Such information should be important for researchers as they continue to study and change assumptions about economic behavior after a disaster. In addition, permanent changes in the distribution of income could have consequences for long-term recovery different from changes in the level of income. To compare any short versus long-term effects we also collected com-parable data for 2007 to determine what changes, if any, had occurred in the distribution of income from 2005 to 2007 as economic recovery has continued
post-Katrina.12
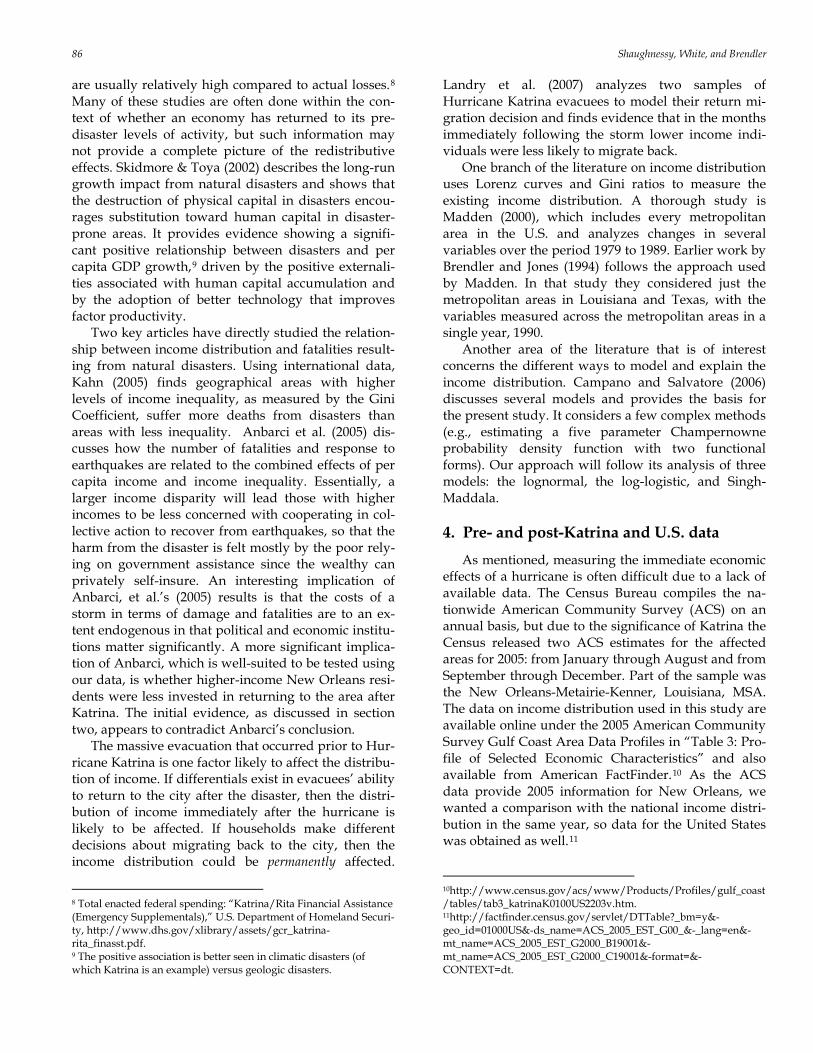
Common ways of visually displaying the income distribution include histograms, polygons, and cumu-lative distribution functions. The polygon envelope simply connects the points at the tops of each histo-gram rectangle, reflecting the same underlying data as the histogram but in a more visually appealing ap-proach. Figure 1 shows the polygon concave enve-lopes around the histograms of the three 2005 samples,
Tables 1A and 1B provide the income distribution data.
12For the U.S.: http://factfinder.census.gov/servlet/ STTable?_bm=y&-qr_name=ACS_2007_1YR_G00_S1901&-ds_name=ACS_2007_1YR_G00_&-_lang=en; For MSA: http://factfinder.census.gov/servlet/STTable?_bm=y&-qr_name=ACS_2007_1YR_G00_S1901&-ds_name=ACS_2007_1YR_G00_&-_lang=en.
88 Shaughnessy, White, and Brendler
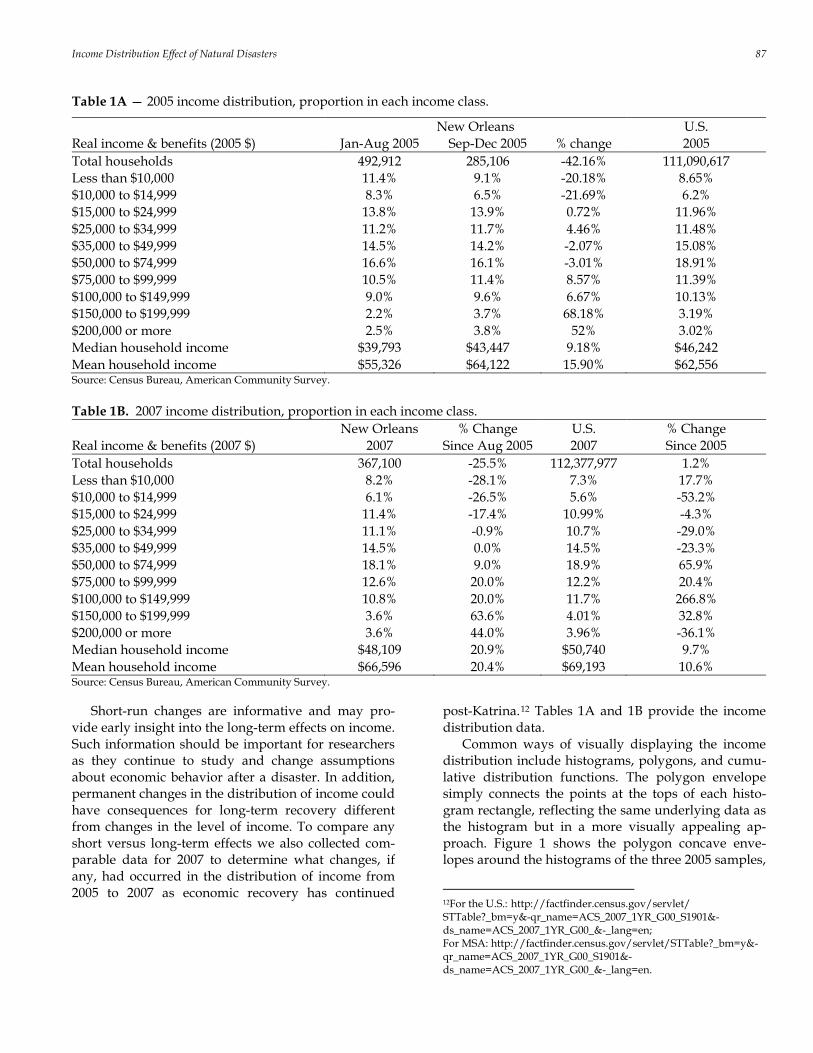
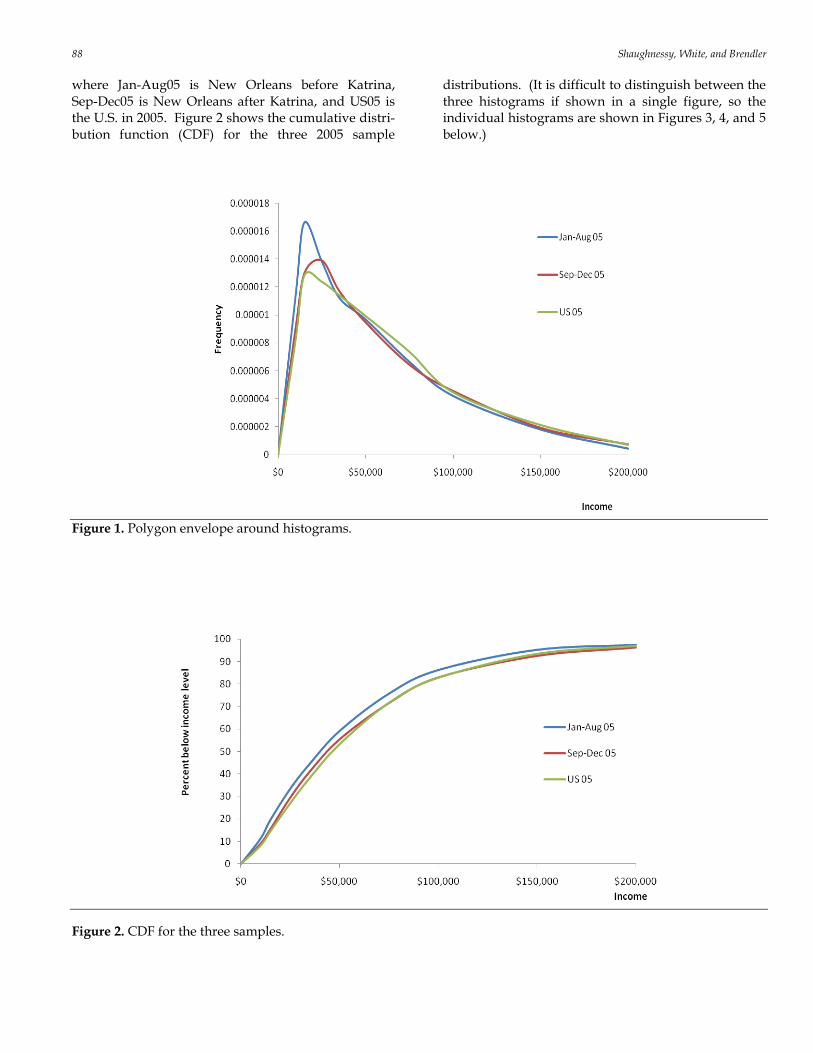
where Jan-Aug05 is New Orleans before Katrina, Sep-Dec05 is New Orleans after Katrina, and US05 is the U.S. in 2005. Figure 2 shows the cumulative distri-bution function (CDF) for the three 2005 sample
distributions. (It is difficult to distinguish between the three histograms if shown in a single figure, so the individual histograms are shown in Figures 3, 4, and 5 below.)
Figure 1. Polygon envelope around histograms.
Figure 2. CDF for the three samples.
Income Distribution Effect of Natural Disasters 89
Note that the pre-Katrina (Jan-Aug 05) distribution
of New Orleans is more heavily skewed toward lower incomes than both the post-Katrina and U.S. distribu-tions. The polygon envelope of pre-Katrina shows a greater proportion of the population at lower incomes, evidenced by the greater height at low incomes and the shorter height at high incomes than the post-Katrina and U.S. polygons. Similarly, the CDF ap-proaches 100% of the population more quickly or at lower incomes for pre-Katrina than it does for the post-Katrina and U.S. CDFs. These two figures make visually apparent that Katrina pushed New Orleans’ income distribution towards higher incomes, which made it more closely mirror the U.S. distribution. An interesting short-run hypothesis not examined here is how the human capital stock was affected as the in-come distribution changed; Skidmore & Toya’s (2002) conclusion that disasters promote human capital ac-cumulation may depend on the type of worker who emigrates versus returns to the disaster area. The ob-served shift of the distribution toward higher incomes also contradicts Anbarci et al.’s (2005) conclusion that higher-income residents are less likely to contribute to rebuilding efforts.
5. Possible income density functions to describe data
In order to generate descriptive statistics about the income distributions and to describe in greater detail how the Hurricane affected New Orleans, income den-sity functions need to be constructed that fit well the underlying data. In the course of analyzing our data, three possible income density functions were esti-mated and will be discussed below.13
Each of these three income density functions contains parameters that can be adjusted, through an iterative search process, to achieve the best fit of the underlying in-come data where the best fitting parameters are those that yield the lowest Chi-squared statistic.
5.1. Lognormal density function
The lognormal has a probability density function (PDF) described by
2
2
2)(ln
21)( σ
µ
πσ
−−
=y
ey
yf (1)
where y represents income, and μ and σ represent pa-rameters to be calculated. The mean of the lognormal,
13These three, among others, are discussed in greater detail in Cam-pano and Salvatore (2006), chapters 3, 5, and 6.
μy, is the mean income (as reported in Tables 1A and 1B) and the variance is
∑=
−=c
iyiiy xp
1
222 µσ (2)
where c is the number of income classes (here c = 10), pi is the proportion of households in the ith class, and xi is the income class midpoint (e.g., $5000 for the first class). Once the mean income and variance are found, the parameters μ and σ2 can be calculated. For the log-normal,
+= 2
222 ln
y
yy
µ
σµσ (3)
and
2ln
2σµµ −= y (4)
A valuable feature of the lognormal is that it can be easily transformed into a standard normal distribution by defining z = (ln y – μ) / σ, and thus can be used to find the probability of falling between particular in-come levels.
5.2. Log-logistic density function
The log-logistic has a PDF described by
2ln
ln
1
)(
+
=−
−
kmy
kmy
eky
eyf (5)
where m is the log of median income (see Tables 1A and 1B) and k (> 0) is a scale parameter to be deter-mined using an iterative process. The CDF is
1ln
11)(
−−
+−= k
my
eyF (6)
5.3. Singh-Maddala density function
This function has a PDF described by
11
1
32132
2
)1()(
+
−
+= aa
a
yayaaayf (7)
where the a’s are again parameters that will be deter-mined through iteration to find the lowest chi-squared. The CDF is
32 )1(1)( 1aayayF −+−= (8)
90 Shaughnessy, White, and Brendler
6. Fit of income density functions
Once the parameters have been estimated it is necessary to determine goodness of fit if those functions are to have value for empirical research questions about the change in income distribution and the effect of Katrina on New Orleans. Four different measures of the goodness of fit of the income PDFs were calculated: the mean absolute deviation (MAD); the mean squared error (MSE); the Chi-squared statis-tic (Chi); and the Kolmogorov-Smirnov statistic (K-S). They are calculated as follows:
c
nco
n
ffMAD
c∑ −= 1 (9)
c
nco
n
ffMSE
c∑ −= 1
2)( (10)
∑ −=
cn
c
co
fff
Chi1
2)( (11)
)()( yFyFSK co −=− sup (12)
where fo is the number of households observed in each income class, fc is the number of households predicted by the different density functions in each income class, nc is the number of income classes, and sup is the larg-est absolute difference.
Table 2 reports the four goodness-of-fit measures for the three income density functions describing the five different samples, and includes the values for the parameters that resulted from the direct-search proce-dure. The proper comparison to make in assessing the fit of the three income density functions is to compare the fit statistics down a given column for each sample.
Table 2—Measures of goodness of fit.
New Orleans U.S. New Orleans U.S. Density Function Jan-Aug 2005 Sep-Dec 2005 2005 2007 2007 Lognormal
MAD 11,623 4,230 1,885,725 6,628 1,820,373 MSE 236,704,525 37,521,846 7.25361E+12 74,385,135 6.03383E+12 Chi 14,231 3,265 1,760,467 6,259 1,483,109 K-S 0.088124 0.059617 0.068629 0.066949 0.065713 μ 10.60132 10.71343 10.72983 10.77744 10.82782 σ 0.799592 0.842747 0.792443 0.811117 0.796033
Log-logistic MAD 8,751 3,158 1,752,642 5,893 1,689,320 MSE 94,331,913 17,567,699 4.11682E+12 47,149,017 3.84294E+12 Chi 24,829 7,720 4,898,262 16,331 4,422,781 K-S 0.0478 0.0989 10.218 0.0442 10.22
k 0.58808 0.5776 0.5538 0.56041 0.55152 Singh-Maddala
MAD 25,008 13,386 5,529,013 18,928 6,715,141 MSE 795,261,991 228,552,951 4.21153E+13 482,936,237 6.54064E+13 Chi 161,511 84,120 41,199,066 136,762 152,736,109 K-S 0.1737 0.2157 248.87 1.1247 369.28 a1 2.7756E-17 2.7756E-17 2.27756E-17 2.7756E-17 2.7756E-17 a2 4.0352 3.9844 3.9536 3.9468 3.6118 a3 0.19732 0.20391 0.21664 0.21122 0.8399
For the pre-Katrina New Orleans sample, the best-
fitting density function appears to be the log-logistic: it has the lowest values of three of the four fit statistics with the exception of the Chi-squared, which is lowest for the lognormal. The Singh-Maddala does relatively poorly in describing the fit compared to either the log-normal or the log-logistic since its fit statistics are always higher.
For the post-Katrina New Orleans sample and the U.S. sample for 2005, the lognormal and the log-logistic again appear to be better-fitting models than Singh-Maddala, with the lognormal performing better as measured by the Chi-squared and K-S, and the log-logistic performing better as measured by the MAD and MSE. Note that the fit statistics are bigger for the U.S. sample due to the much larger values of fo and fc.
Income Distribution Effect of Natural Disasters 91
In 2007 for the New Orleans data, the log-logistic is the best-fitting model according to all of the fit statis-tics other than the Chi-squared. The log-logistic is also the best-fitting model for the 2007 U.S. data according to the MAD and MSE measures, but the lognormal model performs better as measured by the Chi-squared and K-S.
In terms of descriptive ability over all the five sam-ples, the log-logistic performed marginally better than
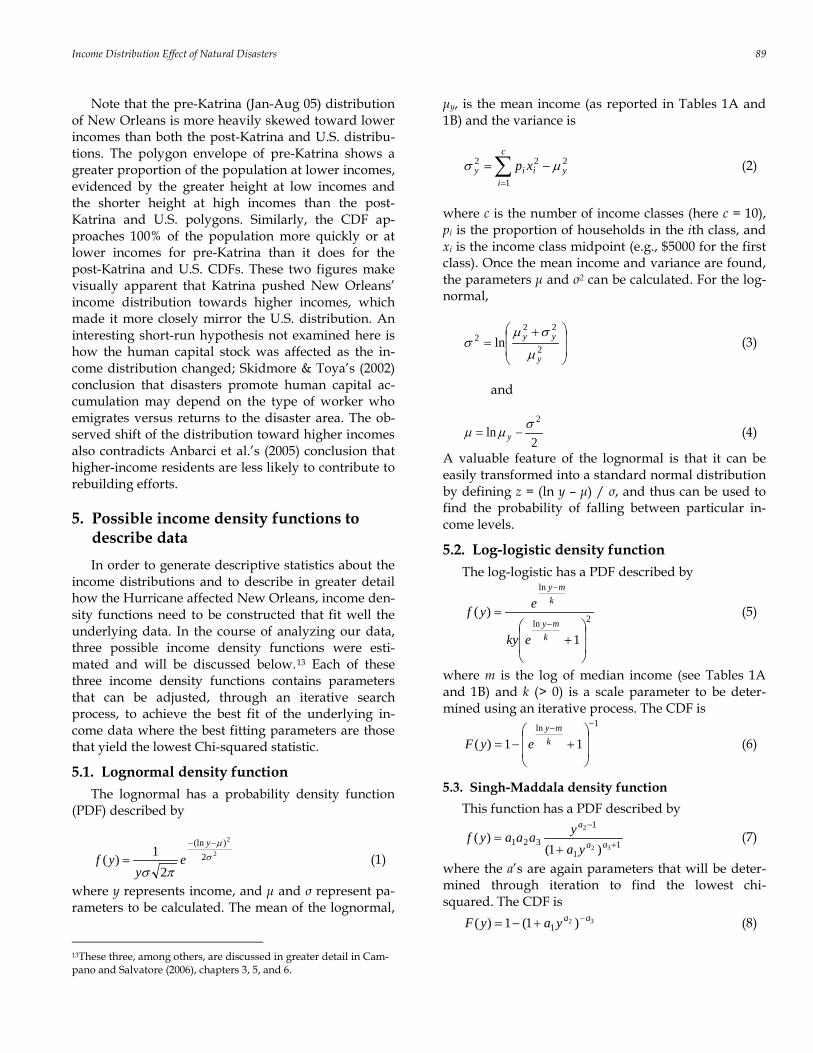
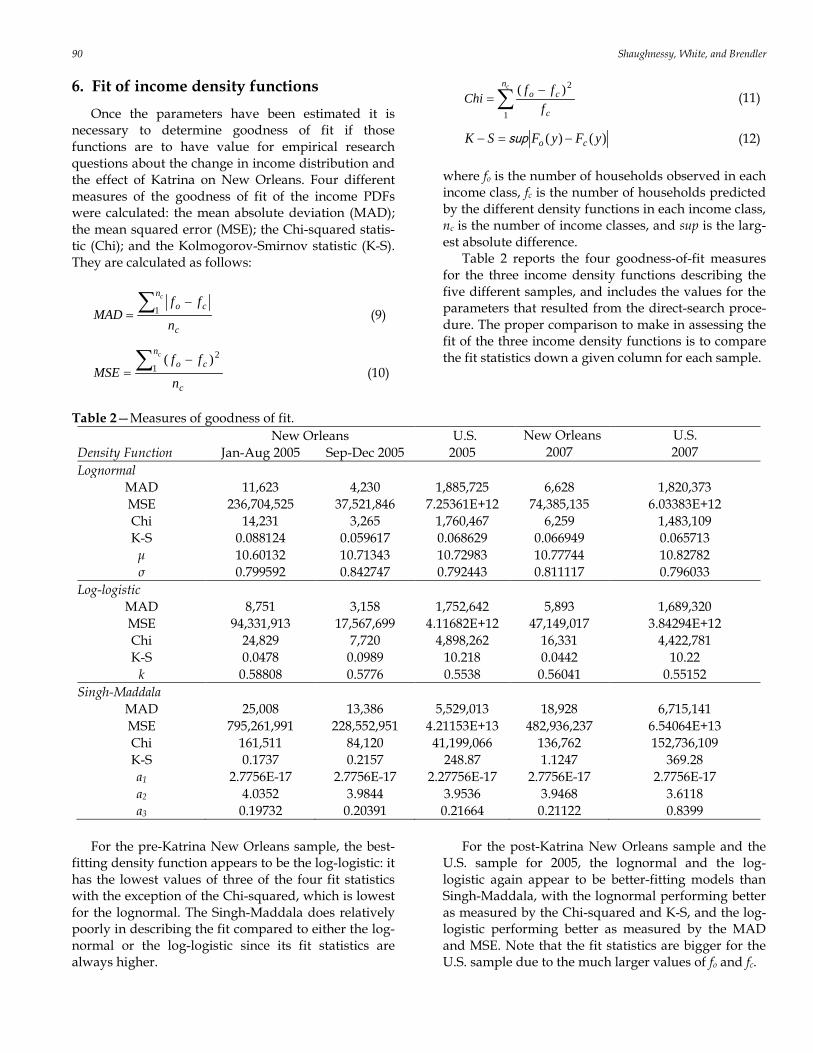
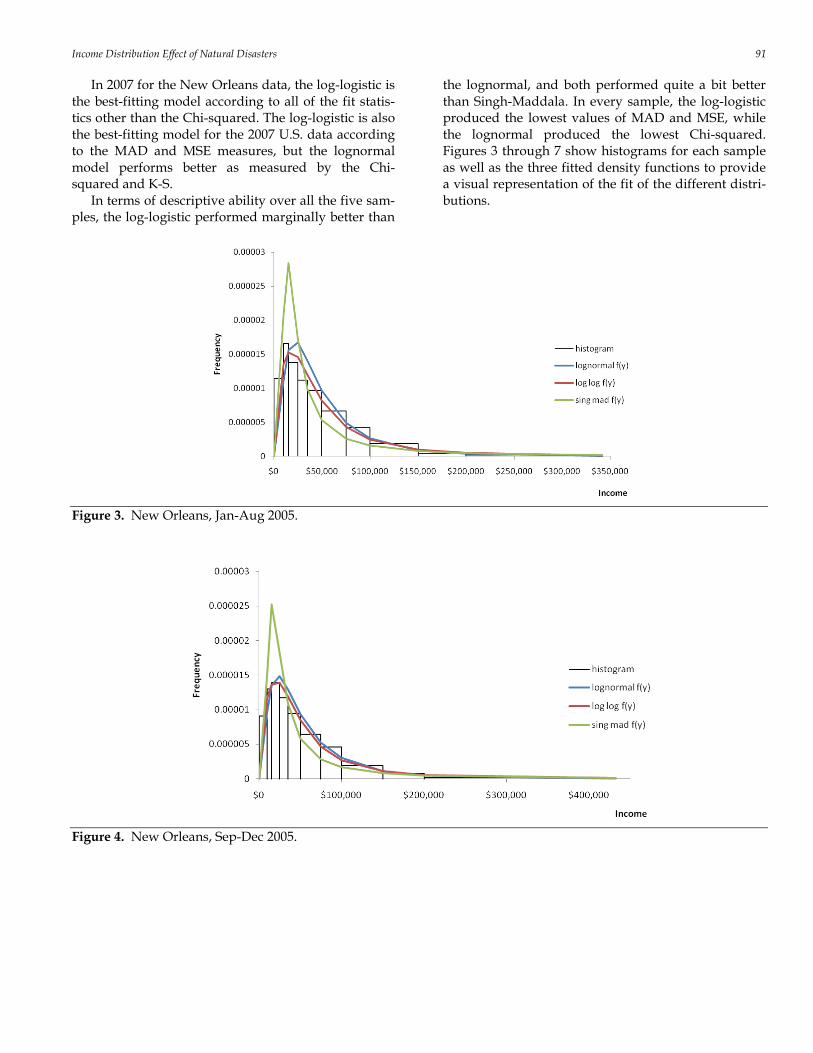
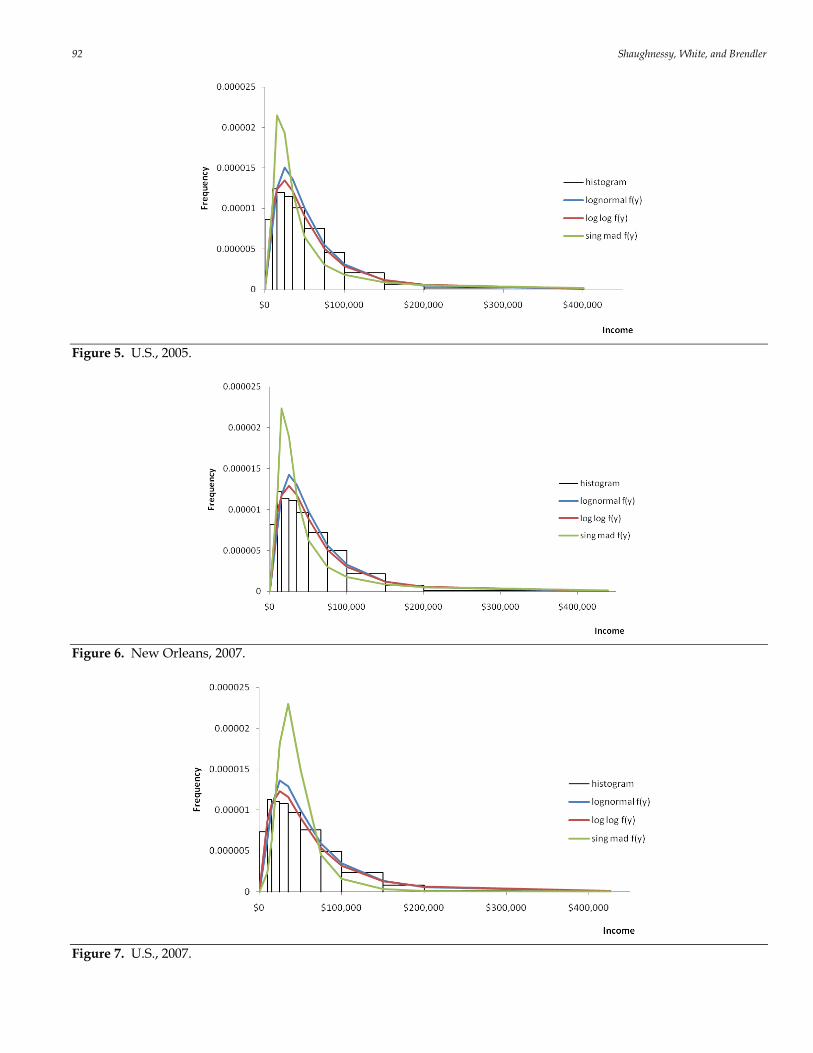
the lognormal, and both performed quite a bit better than Singh-Maddala. In every sample, the log-logistic produced the lowest values of MAD and MSE, while the lognormal produced the lowest Chi-squared. Figures 3 through 7 show histograms for each sample as well as the three fitted density functions to provide a visual representation of the fit of the different distri-butions.
Figure 3. New Orleans, Jan-Aug 2005.
Figure 4. New Orleans, Sep-Dec 2005.
92 Shaughnessy, White, and Brendler
Figure 5. U.S., 2005.
Figure 6. New Orleans, 2007.
Figure 7. U.S., 2007.
Income Distribution Effect of Natural Disasters 93
7. Determining income inequality using the income distribution
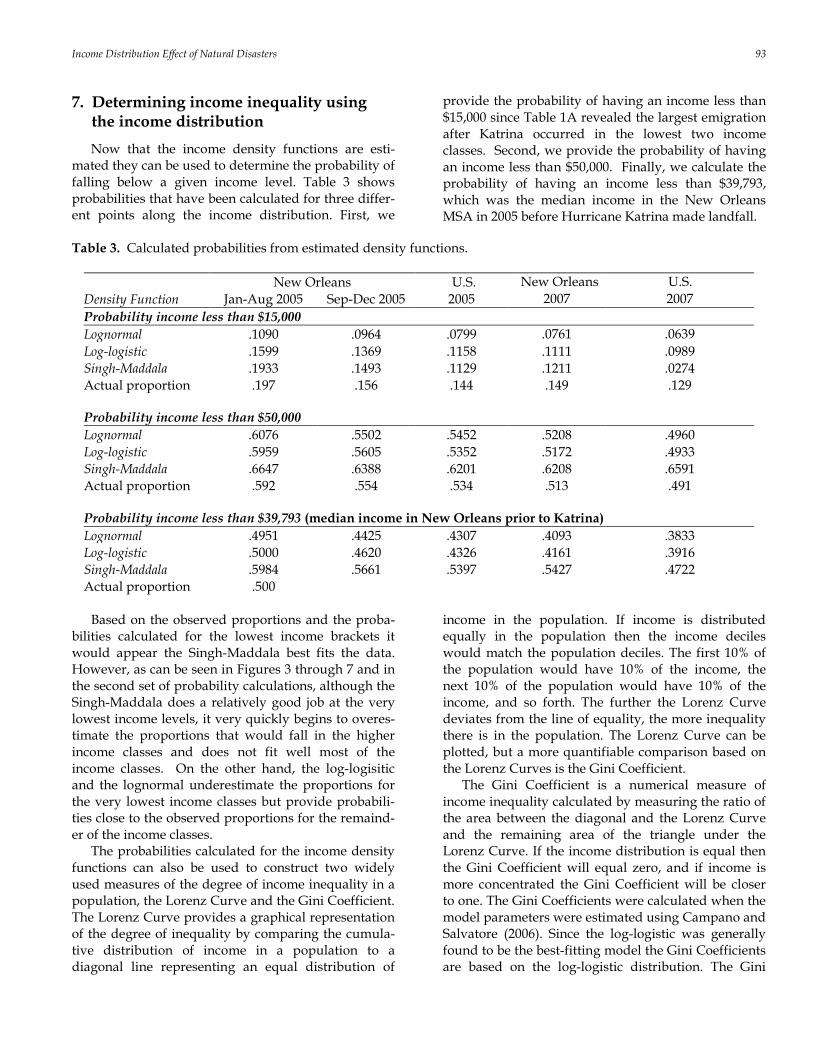
Now that the income density functions are esti-mated they can be used to determine the probability of falling below a given income level. Table 3 shows probabilities that have been calculated for three differ-ent points along the income distribution. First, we
provide the probability of having an income less than $15,000 since Table 1A revealed the largest emigration after Katrina occurred in the lowest two income classes. Second, we provide the probability of having an income less than $50,000. Finally, we calculate the probability of having an income less than $39,793, which was the median income in the New Orleans MSA in 2005 before Hurricane Katrina made landfall.
Table 3. Calculated probabilities from estimated density functions.
New Orleans U.S. New Orleans U.S. Density Function Jan-Aug 2005 Sep-Dec 2005 2005 2007 2007 Probability income less than $15,000 Lognormal .1090 .0964 .0799 .0761 .0639 Log-logistic .1599 .1369 .1158 .1111 .0989 Singh-Maddala .1933 .1493 .1129 .1211 .0274 Actual proportion .197 .156 .144 .149 .129 Probability income less than $50,000 Lognormal .6076 .5502 .5452 .5208 .4960 Log-logistic .5959 .5605 .5352 .5172 .4933 Singh-Maddala .6647 .6388 .6201 .6208 .6591 Actual proportion .592 .554 .534 .513 .491 Probability income less than $39,793 (median income in New Orleans prior to Katrina) Lognormal .4951 .4425 .4307 .4093 .3833 Log-logistic .5000 .4620 .4326 .4161 .3916 Singh-Maddala .5984 .5661 .5397 .5427 .4722 Actual proportion .500
Based on the observed proportions and the proba-
bilities calculated for the lowest income brackets it would appear the Singh-Maddala best fits the data. However, as can be seen in Figures 3 through 7 and in the second set of probability calculations, although the Singh-Maddala does a relatively good job at the very lowest income levels, it very quickly begins to overes-timate the proportions that would fall in the higher income classes and does not fit well most of the income classes. On the other hand, the log-logisitic and the lognormal underestimate the proportions for the very lowest income classes but provide probabili-ties close to the observed proportions for the remaind-er of the income classes.
The probabilities calculated for the income density functions can also be used to construct two widely used measures of the degree of income inequality in a population, the Lorenz Curve and the Gini Coefficient. The Lorenz Curve provides a graphical representation of the degree of inequality by comparing the cumula-tive distribution of income in a population to a diagonal line representing an equal distribution of
income in the population. If income is distributed equally in the population then the income deciles would match the population deciles. The first 10% of the population would have 10% of the income, the next 10% of the population would have 10% of the income, and so forth. The further the Lorenz Curve deviates from the line of equality, the more inequality there is in the population. The Lorenz Curve can be plotted, but a more quantifiable comparison based on the Lorenz Curves is the Gini Coefficient.
The Gini Coefficient is a numerical measure of income inequality calculated by measuring the ratio of the area between the diagonal and the Lorenz Curve and the remaining area of the triangle under the Lorenz Curve. If the income distribution is equal then the Gini Coefficient will equal zero, and if income is more concentrated the Gini Coefficient will be closer to one. The Gini Coefficients were calculated when the model parameters were estimated using Campano and Salvatore (2006). Since the log-logistic was generally found to be the best-fitting model the Gini Coefficients are based on the log-logistic distribution. The Gini
94 Shaughnessy, White, and Brendler
Coefficient for the pre-Katrina New Orleans data was 0.5881, and it decreased to 0.5776 post-Katrina. The coefficient further decreased to 0.5604 for 2007, indi-cating a decrease in income inequality for the area. In comparison, the Gini Coefficient for the U.S. only de-creased from 0.5538 to 0.5515 between 2005 and 2007. 8. Conclusion
The event of Hurricane Katrina is an interesting one for economists to study for several reasons. The city of New Orleans itself was (and, to a lesser extent, is) somewhat unique in its demographic and economic characteristics compared either to the U.S. as a whole or to larger MSAs. Its income distribution was skewed more toward lower income classes than other areas and had been so for quite a while.14
The hurricane was unprecedented, not necessarily in terms of its strength, but in terms of the damage and displacement of the population that it caused. It was a truly exogenous shock (despite meteorologists’ warnings about the possibility of flooding in the be-low-water-level city) unlike any the city had expe-rienced in its recent history, so there were no prior conceptions about what the aftermath would be like.
According to Boettke et al. (2007), the city’s economic underperfor-mance and status as a welfare city prior to the hurri-cane meant it was not well prepared to stage a quick recovery from such a large disaster. Anbarci et al. (2005) and Kahn (2005) provide some mild theoretical support for this claim as well, since it is argued there that disaster preparedness should be less likely as income levels are lower and as the income distribution is more unequal. Kahn (2005) also provides empirical support finding a positive relationship between a nation’s Gini Coefficient and its fatalities from natural disasters.
Our analysis sheds some empirical light on this af-termath, specifically on how its income distribution changed. We identified several theoretical models that can be used to describe the underlying income distri-butions of the MSA before and after the storm and of the U.S. as a comparison. Our conclusions are that, of the three models tested here, the log-logistic and the lognormal appear to provide the closest fits for our samples. Our results are confirmed by several good-ness-of-fit measures, and the resulting estimated parameters can be used to apply these income density
14 This may contradict Skidmore & Toya’s (2002) claim that disas-ter-prone areas promote human capital accumulation. Being below sea-level and having a history of hurricanes, the presumption would be that New Orleans residents would have higher capital accumulation and presumably higher incomes as a result, even before Katrina.
functions to other research questions relating to New Orleans. For example, having a well-defined model of the income distribution will enable better modeling of labor markets (which can then test hypotheses such as those in Skidmore & Toya (2002)), better analysis of the probability of success of particular industries whose customers have relatively high or low income elasticities of demand, a greater understanding of the public finance implications for tax revenues and the tax base, and other economic and sociological ques-tions of interest after a similar exogenous event.
One of Anbarci et al.’s (2005) conclusions is that “policies designed to … reduce inequality can be expected to, through their impact on the likelihood of collective action, mitigate the effect of major quakes.” To the extent that Katrina itself reduced the inequality of the New Orleans MSA, perhaps the effects on the area of possible future hurricanes will be mitigated as well. This, of course, can only be known for certain if the change in inequality (whether after a storm or after designed policies) is properly quantified, which we hope our work has achieved.
It is evident that Hurricane Katrina was unlike any disaster previously experienced in New Orleans. The evacuation of the city displaced an unprecedented number of individuals, many of whom opted not to return or were unable to return, affecting the distribu-tion of income in the city even into 2007. Whether Katrina was a disaster with a unique impact on the income inequality of New Orleans can be determined only if the type of data available immediately after the hurricane is also made available after future disasters so researchers can have a clearer understanding of the immediate impact of disasters on local economies and their income distributions. Acknowledgements
We thank session participants at the 2010 International Conference of the Association of Private Enterprise Education, especially Peter Boettke, for helpful com-ments, as well as insightful suggestions from anonym-ous JRAP referees. References
Albala-Bertrand, J.M. 1993. Natural Disaster Situations
and Growth: A Macroeconomic Model for Sudden Disaster Impacts. World Development 21(9): 1417-1434.
Anbarci, N., M. Escaleras, and C. A. Register. 2005. Earthquake Fatalities: The Interaction of Nature and Political Economy. Journal of Public Economics 89(9-10): 1907-1933.
Income Distribution Effect of Natural Disasters 95
Baade, R. A., R. Baumann, and V. Matheson. 2007. Es-timating the Economic Impact of Natural and So-cial Disasters, with an Application to Hurricane Katrina. Urban Studies 44(11): 2061-2076.
Boettke, P., E. Chamlee-Wright, P. Gordon, S. Ikeda, P. T. Leeson, and R. Sobel. 2007. The Political, Eco-nomic, and Social Aspects of Katrina. Southern Eco-nomic Journal 74(2): 363-376.
Brendler, M., and C.A. Jones. 1994. Income Distribu-tion Determinants within Adjacent States: The Case of Louisiana and Texas. Southwestern Economic Re-view 21(1): 71-79.
Brunkard, J., G. Namulanda, and R. Ratard. 2008. Hur-ricane Katrina Deaths, Louisiana, 2005. Disaster Medicine and Public Health Preparedness 2(4): 215-223.
Campano, F., and D. Salvatore. 2006. Income Distribu-tion. New York: Oxford University Press.
Greater New Orleans Community Data Center, www.gnocdc.org, accessed August 8, 2006.
Guimaraes, P., F. L. Hefner, and D. P. Woodward. 1993. Wealth and Income Effects of Natural Disas-ters: An Econometric Analysis. Review of Regional Studies 23(2): 97-114.
Kahn, M. E. 2005. The Death Toll from Natural Disas-ters: The Role of Income, Geography, and Institu-tions. The Review of Economics and Statistics 87(20): 271-284.
Landry, C. E., O. Bin, P. Hindsley, J. C. Whitehead, and K. Wilson. 2007. Going Home: Evacuation-Migration Decisions of Hurricane Katrina Survi-vors. Southern Economic Journal 74(2): 326-343.
Liu, A., M. Fellowes, and M. Mabanta. 2006. Special Edition of the Katrina Index: A One Year Review of Key Indicators of Recovery in Post-Storm New Orleans. Washington, D.C.: The Brookings Institution, Met-ropolitan Policy Program.
———. 2006. Katrina Index: Tracking Variables of Post-Katrina Recovery. Washington, D.C.: The Brookings Institution, Metropolitan Policy Program.
Madden, J.F. 2000. Changes in Income Inequality within U.S. Metropolitan Areas. Kalamazoo, Michigan: W.E. Upjohn Institute for Employment Research.
Skidmore, M., and H. Toya. 2002. Do Natural Disasters Promote Long-Run Growth? Economic Inquiry 40(4): 664-687.
Skoufias, E. 2003. Economic Crises and Natural Disas-ters: Coping Strategies and Policy Implications. World Development 31(7): 1087-1102.
Smith, S. K., and C. McCarty. 1996. Demographic Ef-fects of Natural Disasters: A Case Study of Hurri-cane Andrew. Demography 33(2): 265-275.
Van Heerden, I. and M. Bryan. 2006. The Storm. New York: Viking Press.
West, C. . and D.G. Lenze. 1994. Modeling the Region-al Impact of Natural Disaster and Recovery: A General Framework and an Application to Hurri-cane Andrew. International Regional Science Review 17(2): 121-150.