Embed Size (px)
Citation preview
T H E I N D E X O F
GLOBAL PHILANTHROPY AND REMITTANCES
2016
© 2016 Hudson Institute, Inc. All rights reserved
1201 Pennsylvania Ave., N.W., Suite 400, Washington, DC 20004 I P: 202.974.2400
www.hudson.org/cgp
The Center for Global Prosperity (CGP) provides a platform —
through conferences, discussions, publications, and media
appearances — to create awareness among U.S. and international
scholars, policy-makers, and opinion leaders, as well as the general
public, about the central role of the private sector, both for-profit
and not-for-profit, in the creation of economic growth and
prosperity in all countries. The Center supports free societies,
including capital markets, rule of law, government transparency,
free trade and press, human rights, and private property —
prerequisites for economic health and well-being.
First published in 2006, The Index of Global Philanthropy and
Remittances details the sources and magnitude of private giving to
the developing world. The Index reframes the discussion about the
roles of public and private sectors in foreign aid by showing that
the full scale of a country’s generosity is measured not just by
government aid, but by private giving as well.
The Index of Philanthropic Freedom was published in June 2015.
This new Index is the first in-depth analysis of philanthropic
freedom around the world. By examining barriers and incentives
for individuals and organizations to donate money and time to
social causes, the Index measures, ranks and compares countries
on their ease of giving. The research is a major step in identifying
the public policy actions to improve the enabling environment
for philanthropy.
Hudson Institute is an independent research organization
promoting new ideas for the advancement of global security,
prosperity, and freedom.
© 2016 Hudson Institute, Inc. All rights reserved
1201 Pennsylvania Ave., N.W., Suite 400, Washington, DC 20004 I P: 202.974.2400
www.hudson.org/cgp
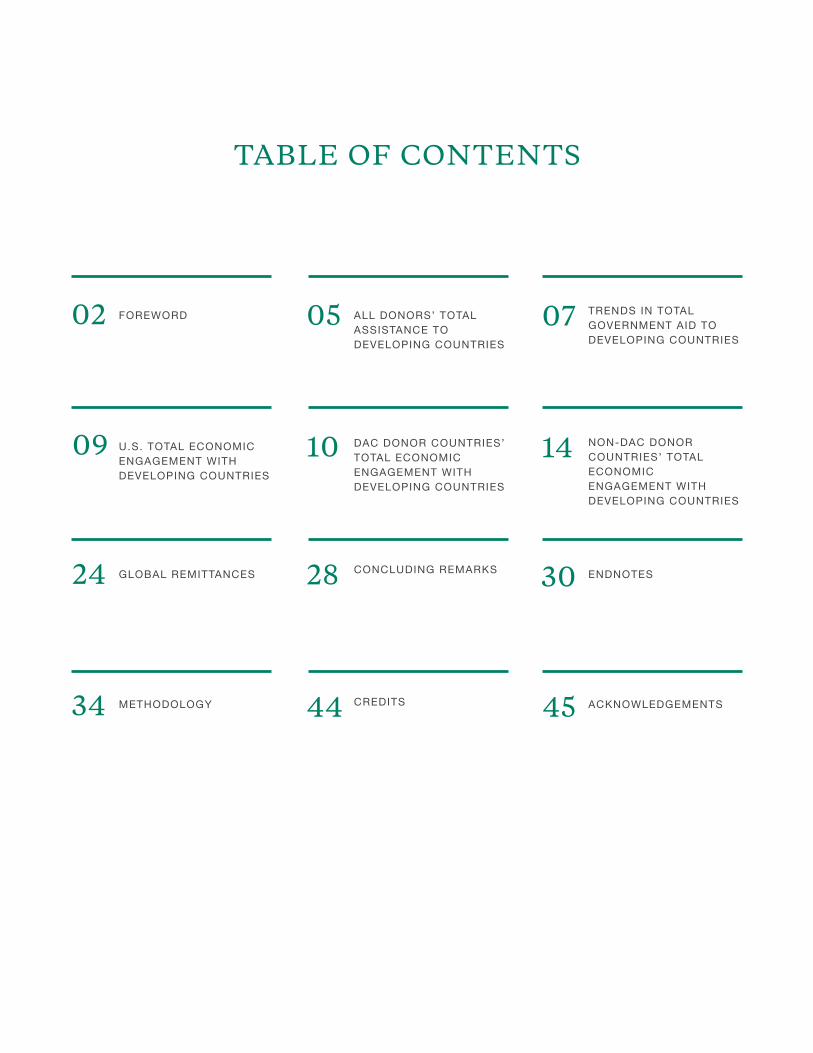
TABLE OF CONTENTS
02
34
10
30
09
28
07
45
24
05
44
14
FOREWORD
METHODOLOGY
DAC DONOR COUNTRIES’ TOTAL ECONOMIC ENGAGEMENT WITH DEVELOPING COUNTRIES
ENDNOTES
U.S. TOTAL ECONOMIC ENGAGEMENT WITH DEVELOPING COUNTRIES
CONCLUDING REMARKS
TRENDS IN TOTAL GOVERNMENT AID TO DEVELOPING COUNTRIES
ACKNOWLEDGEMENTS
GLOBAL REMITTANCES
ALL DONORS’ TOTAL ASSISTANCE TO DEVELOPING COUNTRIES
CREDITS
NON-DAC DONOR COUNTRIES’ TOTAL ECONOMIC ENGAGEMENT WITH DEVELOPING COUNTRIES
H U D S O N I N S T I T U T E2
The 2016 Index breaks new ground by measuring the
financial flows from eleven emerging economies to the
developing world. CGP partnered with individuals and
organizations in Brazil, China, Colombia, India, Indonesia,
Kenya, Mexico, South Africa, Tanzania, Turkey, and Uganda,
to report on these countries’ total economic engagement
with the developing world, including government aid, private
philanthropy, remittances, and capital investment. Together
with financial data collected by CGP from the 28 members of
the Organization for Economic Cooperation and
Development (OECD) Development Assistance Committee
(DAC), the Index reveals a more complete picture of
countries’ total economic engagement with the developing
world. CGP hopes that the Index will improve civil society
around the world by strengthening philanthropic
infrastructure, including private charities, foundations,
religious organizations, volunteer organizations, social
entrepreneurship, and corporate giving.
In 2015, CGP published the Index of Philanthropic
Freedom, the first in-depth analysis of the regulatory
environment for philanthropy in 64 developed and
developing countries around the world. The countries
included in the Index represented 82% of the world’s
population and 89% of the world’s GDP. Each country was
measured and ranked by an in-country expert on their ease
of giving using three major criteria. These included the ease
of registering and operating non-profit organizations
(NPOs), the tax incentives and barriers to giving, and the
ease of cross-border giving in countries.
FOREWORD
Center for Global Prosperity (CGP) at the Hudson Institute is pleased to present the 2016 Index of Global Philanthropy and Remittances. Over a ten year period, the ninth edition of the Index reports on the sources and
magnitude of global philanthropy from developed and emerging economies to the developing world. As in previous editions of the Index, private financial flows—including philanthropy, remittances, and private capital investment—continue to grow and surpass government aid. In addition to the magnitude of the developed and emerging economies’ total economic engagement with the developing world, the 2016 Index highlights the new partnerships and infrastructure that support philanthropic giving around the world.
THE
T H E I N D E X O F G L O B A L P H I L A N T H R O P Y A N D R E M I T TA N C E S 3
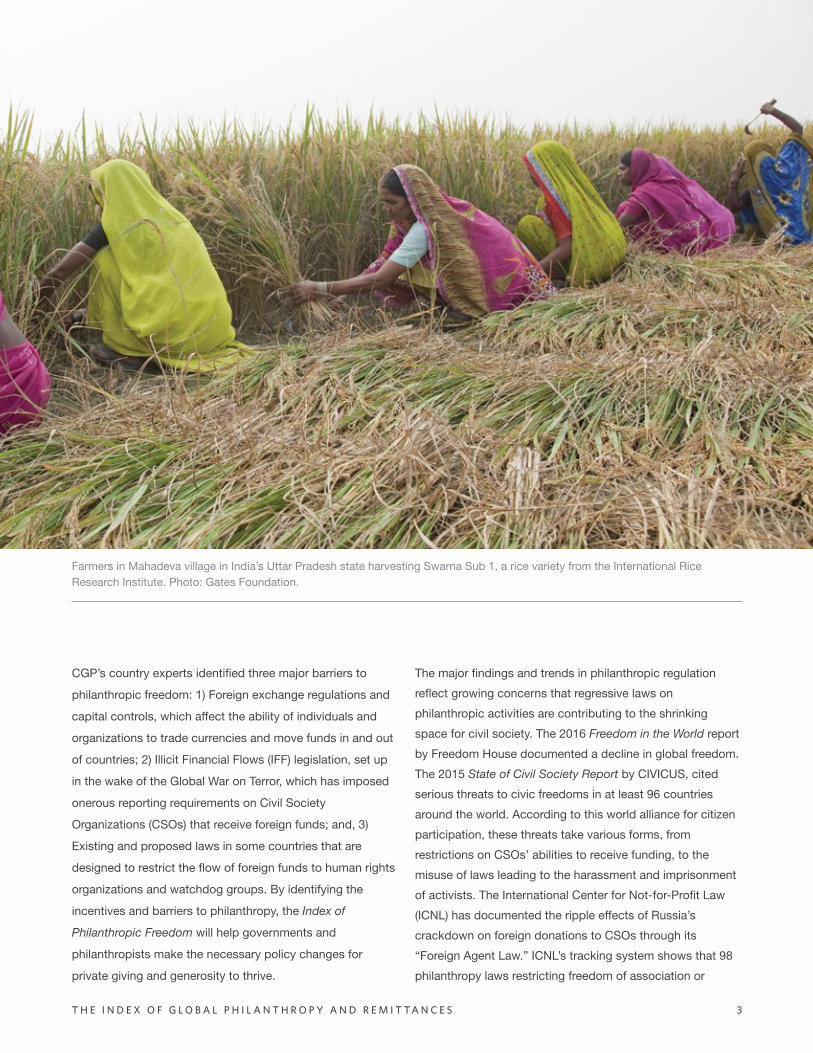
Farmers in Mahadeva village in India’s Uttar Pradesh state harvesting Swarna Sub 1, a rice variety from the International Rice Research Institute. Photo: Gates Foundation.
CGP’s country experts identified three major barriers to
philanthropic freedom: 1) Foreign exchange regulations and
capital controls, which affect the ability of individuals and
organizations to trade currencies and move funds in and out
of countries; 2) Illicit Financial Flows (IFF) legislation, set up
in the wake of the Global War on Terror, which has imposed
onerous reporting requirements on Civil Society
Organizations (CSOs) that receive foreign funds; and, 3)
Existing and proposed laws in some countries that are
designed to restrict the flow of foreign funds to human rights
organizations and watchdog groups. By identifying the
incentives and barriers to philanthropy, the Index of
Philanthropic Freedom will help governments and
philanthropists make the necessary policy changes for
private giving and generosity to thrive.
The major findings and trends in philanthropic regulation
reflect growing concerns that regressive laws on
philanthropic activities are contributing to the shrinking
space for civil society. The 2016 Freedom in the World report
by Freedom House documented a decline in global freedom.
The 2015 State of Civil Society Report by CIVICUS, cited
serious threats to civic freedoms in at least 96 countries
around the world. According to this world alliance for citizen
participation, these threats take various forms, from
restrictions on CSOs’ abilities to receive funding, to the
misuse of laws leading to the harassment and imprisonment
of activists. The International Center for Not-for-Profit Law
(ICNL) has documented the ripple effects of Russia’s
crackdown on foreign donations to CSOs through its
“Foreign Agent Law.” ICNL’s tracking system shows that 98
philanthropy laws restricting freedom of association or
H U D S O N I N S T I T U T E4
assembly around the world have been proposed or passed
since 2012. Approximately half of these laws placed
constraints on the registration and operation of CSOs and
another third constrained cross-border philanthropy.
In researching material for the Index of Global Philanthropy and Remittances over the last ten years, CGP has identified trends
in the sources and types of global philanthropy. New sources of
philanthropy, including crowd-sourcing and other forms of
online giving, continue to grow and benefit disaster victims,
refugees, and social entrepreneurs. Younger donors, particularly
high net worth individuals, are contributing to philanthropic
causes at earlier ages, thus increasing the ultimate amount of
philanthropy over time. The growth of the middle class around
the world is resulting in more indigenous philanthropy in
low- and middle-income countries as high net worth individuals
and community foundations increase their giving. In addition,
philanthropists such as Bill and Melinda Gates, Mark
Zuckerberg and Priscilla Chan, Pierre and Pam Omidyar, and
George Soros have focused on solving development problems
by engaging in new and financially sustainable philanthropic
methods, including public-private partnerships.
While the 2016 Index of Global Philanthropy and Remittances
shows that global philanthropy has grown, and philanthropic
infrastructure has improved in many countries, the barriers to
private giving identified in the Index of Philanthropic Freedom
are an ongoing challenge for philanthropy and civil society.
We are grateful to all of our donors for their ongoing support
of both Indices. CGP would also like to thank our excellent
research partners in the United States and throughout the
world for their dedication and hard work on the data for the
publications. Both Indices have been well-received by policy-
makers and stakeholders in bilateral and multilateral
government institutions, universities, foundations, charities,
private voluntary organizations, and religious organizations.
Schools of philanthropy, business, and public policy use the
research for teaching, and individuals use it as a giving
guide. After over a decade publishing the Index of Global Philanthropy and Remittances and five years developing the
pilot study and first Index of Philanthropic Freedom, CGP is
pleased to announce the institutionalization of the two
Indices in January of 2017.
Over the last ten years, the number of U.S. and foreign
research partners involved in both projects has grown
substantially, as has the demand for new countries to be
added to the Indices. As the Indices expanded, it became
clear that a larger institution with multi-disciplinary studies,
high standards of scholarship, and a large and growing
international network of scholars and practitioners would
ensure the continued quality of both publications.
After reviewing a number of potential options, the Lilly Family
School of Philanthropy (LFSOP) at Indiana University stood
out as an ideal permanent home for the Indices. As the only
school of philanthropy in the world, the LFSOP has a broad
network of international alumni, professors, students, and
partners to support its research. With its annual report, Giving USA, LFSOP is the gold standard in measuring philanthropy in
the United States. Housing the Indices at Indiana University
will provide the multidisciplinary resources required to
research financial flows to developing countries and the
diversity of philanthropic approaches and program areas.
CGP is honored to be transferring the two Indices to Indiana
University where Dr. Les Lenkowsky, Professor Emeritus of
Public Affairs and Philanthropy has been an invaluable
resource for the research. With the strong leadership of the
Dean of the Lilly Family School of Philanthropy, Dr. Amir
Pasic, and the impeccable research skills and experience of
Director of Research, Dr. Una Osili, CGP looks forward to
assisting in an advisory capacity to help ensure a smooth
transition in the coming years.
T H E I N D E X O F G L O B A L P H I L A N T H R O P Y A N D R E M I T TA N C E S 5
ALL DONORS’ TOTAL ASSISTANCE TO DEVELOPING COUNTRIES
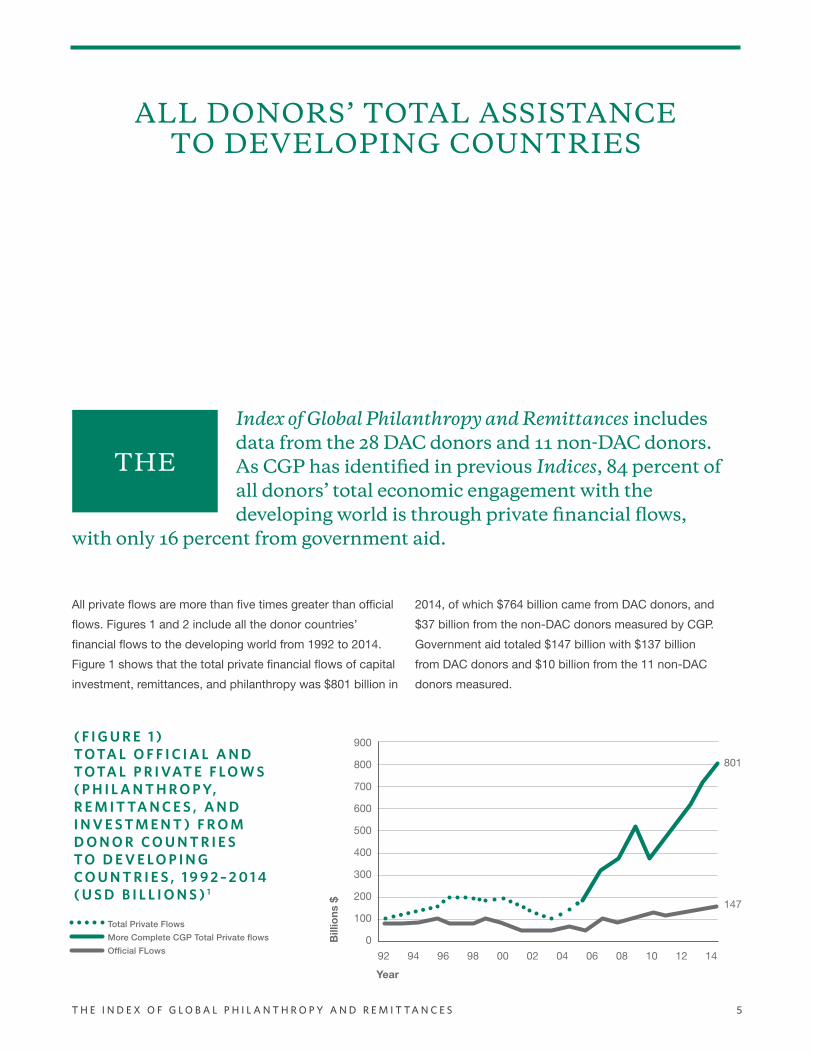
( F I G U R E 1 ) T O TA L O F F I C I A L A N D T O TA L P R I VAT E F L O W S ( P H I L A N T H R O P Y, R E M I T TA N C E S , A N D I N V E S T M E N T ) F R O M D O N O R C O U N T R I E S T O D E V E L O P I N G C O U N T R I E S , 1 9 9 2 – 2 0 1 4 ( U S D B I L L I O N S ) 1
All private flows are more than five times greater than official
flows. Figures 1 and 2 include all the donor countries’
financial flows to the developing world from 1992 to 2014.
Figure 1 shows that the total private financial flows of capital
investment, remittances, and philanthropy was $801 billion in
2014, of which $764 billion came from DAC donors, and
$37 billion from the non-DAC donors measured by CGP.
Government aid totaled $147 billion with $137 billion
from DAC donors and $10 billion from the 11 non-DAC
donors measured.
Bill
ions
$
Year
900
800
700
600
500
400
300
200
100
0
92 94 96 98 00 02 04 06 08 10 12 14
THE
Index of Global Philanthropy and Remittances includes data from the 28 DAC donors and 11 non-DAC donors. As CGP has identified in previous Indices, 84 percent of all donors’ total economic engagement with the developing world is through private financial flows,
with only 16 percent from government aid.
801
147
Total Private FlowsMore Complete CGP Total Private flowsOfficial FLows
H U D S O N I N S T I T U T E6
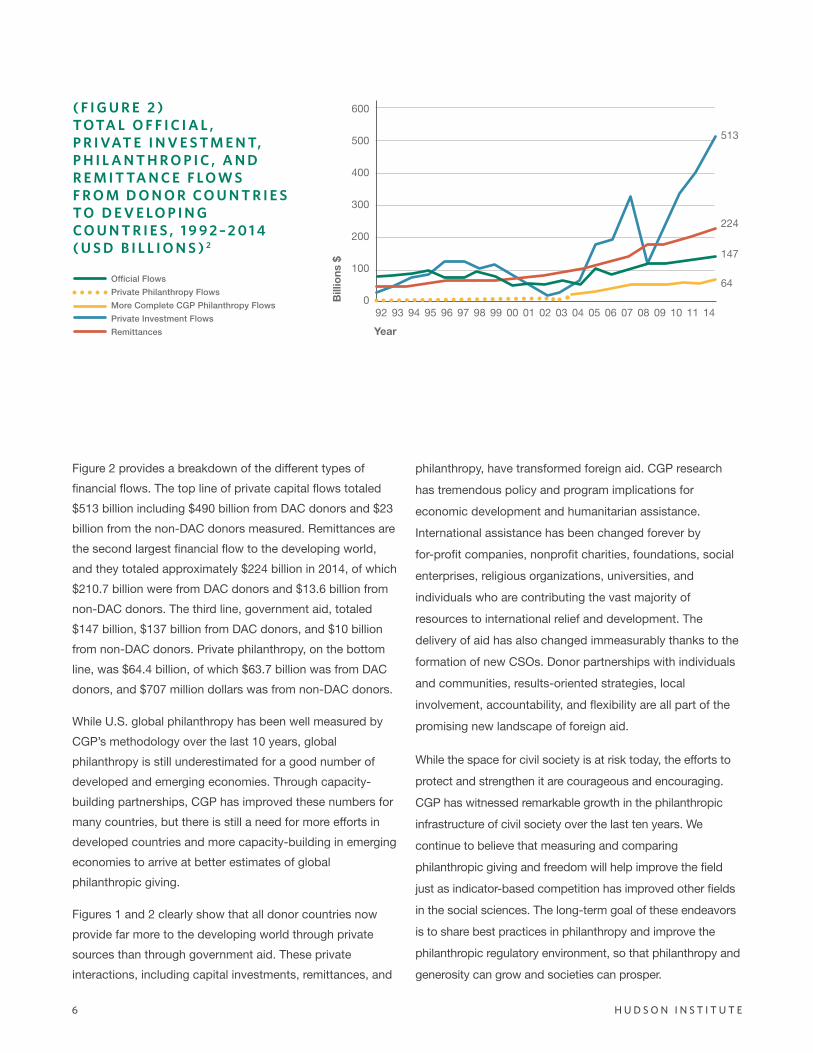
Figure 2 provides a breakdown of the different types of
financial flows. The top line of private capital flows totaled
$513 billion including $490 billion from DAC donors and $23
billion from the non-DAC donors measured. Remittances are
the second largest financial flow to the developing world,
and they totaled approximately $224 billion in 2014, of which
$210.7 billion were from DAC donors and $13.6 billion from
non-DAC donors. The third line, government aid, totaled
$147 billion, $137 billion from DAC donors, and $10 billion
from non-DAC donors. Private philanthropy, on the bottom
line, was $64.4 billion, of which $63.7 billion was from DAC
donors, and $707 million dollars was from non-DAC donors.
While U.S. global philanthropy has been well measured by
CGP’s methodology over the last 10 years, global
philanthropy is still underestimated for a good number of
developed and emerging economies. Through capacity-
building partnerships, CGP has improved these numbers for
many countries, but there is still a need for more efforts in
developed countries and more capacity-building in emerging
economies to arrive at better estimates of global
philanthropic giving.
Figures 1 and 2 clearly show that all donor countries now
provide far more to the developing world through private
sources than through government aid. These private
interactions, including capital investments, remittances, and
philanthropy, have transformed foreign aid. CGP research
has tremendous policy and program implications for
economic development and humanitarian assistance.
International assistance has been changed forever by
for-profit companies, nonprofit charities, foundations, social
enterprises, religious organizations, universities, and
individuals who are contributing the vast majority of
resources to international relief and development. The
delivery of aid has also changed immeasurably thanks to the
formation of new CSOs. Donor partnerships with individuals
and communities, results-oriented strategies, local
involvement, accountability, and flexibility are all part of the
promising new landscape of foreign aid.
While the space for civil society is at risk today, the efforts to
protect and strengthen it are courageous and encouraging.
CGP has witnessed remarkable growth in the philanthropic
infrastructure of civil society over the last ten years. We
continue to believe that measuring and comparing
philanthropic giving and freedom will help improve the field
just as indicator-based competition has improved other fields
in the social sciences. The long-term goal of these endeavors
is to share best practices in philanthropy and improve the
philanthropic regulatory environment, so that philanthropy and
generosity can grow and societies can prosper.
( F I G U R E 2 ) T O TA L O F F I C I A L , P R I VAT E I N V E S T M E N T, P H I L A N T H R O P I C , A N D R E M I T TA N C E F L O W S F R O M D O N O R C O U N T R I E S T O D E V E L O P I N G C O U N T R I E S , 1 9 9 2 – 2 0 1 4 ( U S D B I L L I O N S ) 2
Bill
ions
$Year
600
500
400
300
200
100
0
513
224
147
64
92 93 94 95 96 97 98 99 00 01 02 03 04 05 06 07 08 09 10 11 14
Official FlowsPrivate Philanthropy FlowsMore Complete CGP Philanthropy FlowsPrivate Investment FlowsRemittances
T H E I N D E X O F G L O B A L P H I L A N T H R O P Y A N D R E M I T TA N C E S 7
Development Assistance (ODA) from all OECD DAC countries amounted to $137 billion in 2014, which was an increase of 1.2 percent in real terms (accounting for inflation and exchange rate movements) from $134 billion
in 2013.3 Notable increases include Germany, which increased its ODA by just over $2 billion, and the United Kingdom, which increased its ODA by $1.4 billion. The most notable decline was in Japan, where ODA fell by over $2 billion from the previous year.
TRENDS IN TOTAL GOVERNMENT AID TO DEVELOPING COUNTRIES
Sub-Saharan Africa received the largest portion of total aid at
$44.3 billion, followed by South and Central Asia with $19.8
billion. The regional distribution of aid remained similar to the
previous years with the exception of the Middle East.4 ODA
from DAC countries has increased dramatically to the Middle
East over the last three years. In 2012, ODA to the Middle
East was $8.7 billion. In 2013, that figure reached $16.9
billion and climbed to $25.1 billion in 2014. When combined
with aid to North Africa, total aid to the Middle East and
North Africa region (MENA) reached $32.4 billion in 2014.
Afghanistan remains the largest recipient of aid at $4.8
billion.5 The Syrian Republic and Egypt were among the next
largest, receiving $4.2 billion and $3.5 billion, respectively.
The rapid rise of ODA came about to meet the challenges
within the region over the last few years, notably the Iraqi
civil war and Syrian crisis. The regional crisis caused by
ongoing conflict in Syria has displaced millions of people.
The United Nations reports that there are over 4.8 million
Syrian refugees and a further 6.6 million that are internally
displaced, having been forced to flee their homes but still
remaining within the borders of Syria.6 Turkey has become
the largest refugee hosting country, with a population of 2.7
million registered Syrian refugees. Germany has pledged
nearly 40,000 places for Syrian refugees through its
humanitarian admission program, nearly 54 percent of the
total promised by the European Union.7
OFFICIAL
H U D S O N I N S T I T U T E8
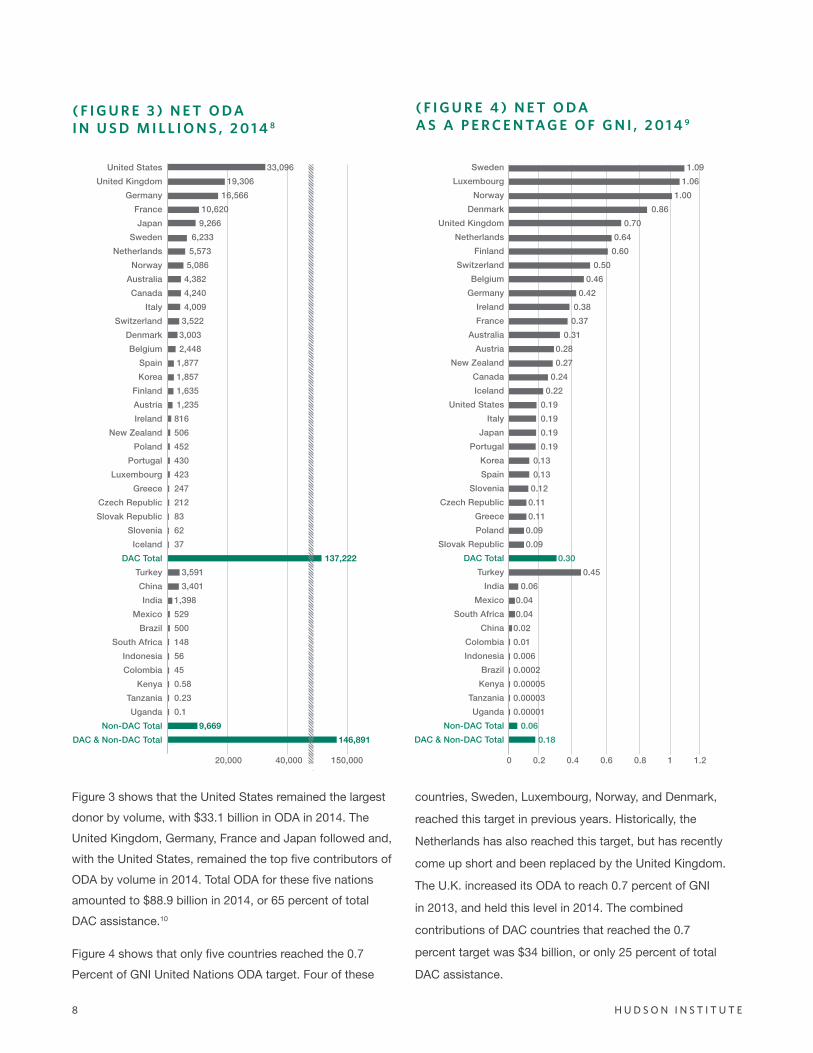
( F I G U R E 3 ) N E T O D A I N U S D M I L L I O N S , 2 0 1 4 8
( F I G U R E 4 ) N E T O D AA S A P E R C E N TA G E O F G N I , 2 0 1 4 9
Figure 3 shows that the United States remained the largest
donor by volume, with $33.1 billion in ODA in 2014. The
United Kingdom, Germany, France and Japan followed and,
with the United States, remained the top five contributors of
ODA by volume in 2014. Total ODA for these five nations
amounted to $88.9 billion in 2014, or 65 percent of total
DAC assistance.10
Figure 4 shows that only five countries reached the 0.7
Percent of GNI United Nations ODA target. Four of these
countries, Sweden, Luxembourg, Norway, and Denmark,
reached this target in previous years. Historically, the
Netherlands has also reached this target, but has recently
come up short and been replaced by the United Kingdom.
The U.K. increased its ODA to reach 0.7 percent of GNI
in 2013, and held this level in 2014. The combined
contributions of DAC countries that reached the 0.7
percent target was $34 billion, or only 25 percent of total
DAC assistance.
United StatesUnited Kingdom
GermanyFranceJapan
SwedenNetherlands
NorwayAustraliaCanada
ItalySwitzerland
DenmarkBelgium
SpainKorea
FinlandAustriaIreland
New ZealandPoland
PortugalLuxembourg
GreeceCzech RepublicSlovak Republic
SloveniaIceland
DAC TotalTurkeyChinaIndia
MexicoBrazil
South AfricaIndonesiaColombia
KenyaTanzaniaUganda
Non-DAC TotalDAC & Non-DAC Total
SwedenLuxembourg
NorwayDenmark
United KingdomNetherlands
FinlandSwitzerland
BelgiumGermany
IrelandFrance
AustraliaAustria
New ZealandCanadaIceland
United StatesItaly
JapanPortugal
Korea Spain
SloveniaCzech Republic
GreecePoland
Slovak RepublicDAC Total
TurkeyIndia
MexicoSouth Africa
ChinaColombiaIndonesia
BrazilKenya
TanzaniaUganda
Non-DAC TotalDAC & Non-DAC Total
20,000 0 0.2 0.4 0.6 0.8 1 1.240,000 150,000
33,096 19,306 16,566 10,620 9,266 6,233 5,573 5,086 4,382 4,240 4,009 3,522 3,003 2,448 1,877 1,857 1,635 1,235816506452430423247212836237 137,222 3,591 3,4011,39852950014856450.580.230.1 9,669 146,891
1.09 1.06 1.00 0.86 0.70 0.64 0.60 0.50 0.46 0.42 0.38 0.37 0.31 0.28 0.27 0.24 0.22 0.19 0.19 0.19 0.19 0.13 0.13 0.12 0.11 0.11 0.09 0.09 0.30 0.45 0.06 0.04 0.040.020.010.0060.00020.000050.000030.00001 0.06 0.18
T H E I N D E X O F G L O B A L P H I L A N T H R O P Y A N D R E M I T TA N C E S 9
U.S. TOTAL ECONOMIC ENGAGEMENT WITH DEVELOPING COUNTRIES
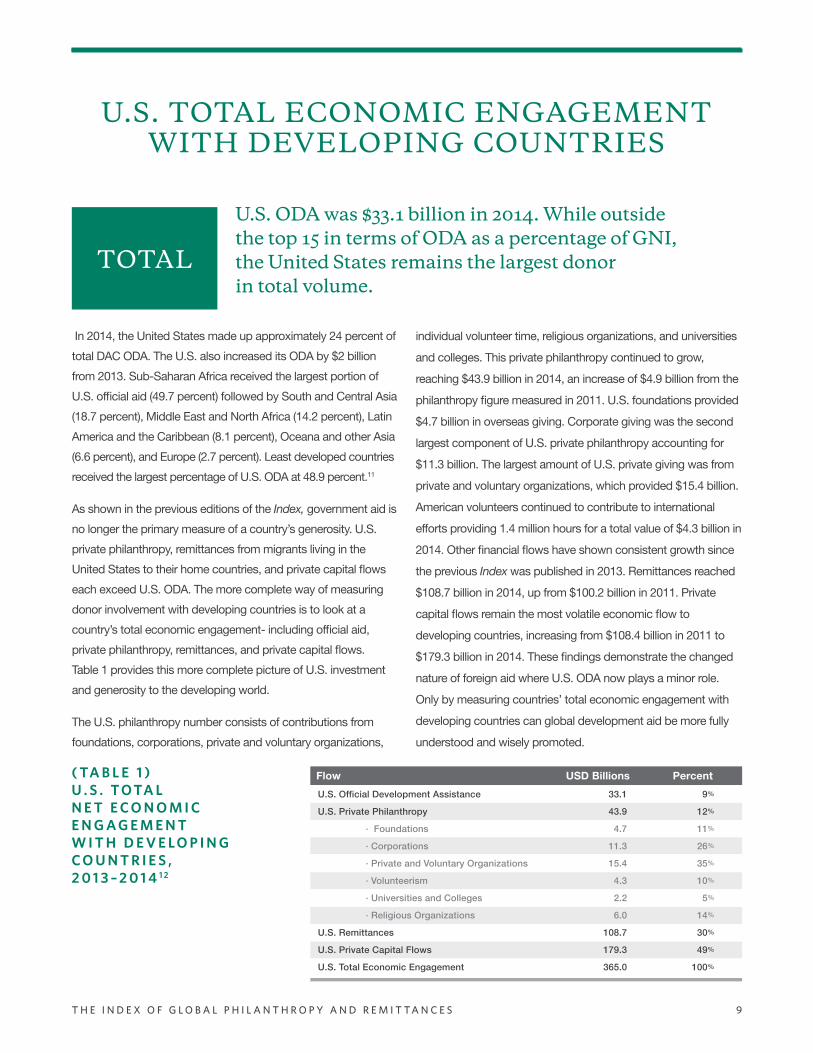
In 2014, the United States made up approximately 24 percent of
total DAC ODA. The U.S. also increased its ODA by $2 billion
from 2013. Sub-Saharan Africa received the largest portion of
U.S. official aid (49.7 percent) followed by South and Central Asia
(18.7 percent), Middle East and North Africa (14.2 percent), Latin
America and the Caribbean (8.1 percent), Oceana and other Asia
(6.6 percent), and Europe (2.7 percent). Least developed countries
received the largest percentage of U.S. ODA at 48.9 percent.11
As shown in the previous editions of the Index, government aid is
no longer the primary measure of a country’s generosity. U.S.
private philanthropy, remittances from migrants living in the
United States to their home countries, and private capital flows
each exceed U.S. ODA. The more complete way of measuring
donor involvement with developing countries is to look at a
country’s total economic engagement- including official aid,
private philanthropy, remittances, and private capital flows.
Table 1 provides this more complete picture of U.S. investment
and generosity to the developing world.
The U.S. philanthropy number consists of contributions from
foundations, corporations, private and voluntary organizations,
individual volunteer time, religious organizations, and universities
and colleges. This private philanthropy continued to grow,
reaching $43.9 billion in 2014, an increase of $4.9 billion from the
philanthropy figure measured in 2011. U.S. foundations provided
$4.7 billion in overseas giving. Corporate giving was the second
largest component of U.S. private philanthropy accounting for
$11.3 billion. The largest amount of U.S. private giving was from
private and voluntary organizations, which provided $15.4 billion.
American volunteers continued to contribute to international
efforts providing 1.4 million hours for a total value of $4.3 billion in
2014. Other financial flows have shown consistent growth since
the previous Index was published in 2013. Remittances reached
$108.7 billion in 2014, up from $100.2 billion in 2011. Private
capital flows remain the most volatile economic flow to
developing countries, increasing from $108.4 billion in 2011 to
$179.3 billion in 2014. These findings demonstrate the changed
nature of foreign aid where U.S. ODA now plays a minor role.
Only by measuring countries’ total economic engagement with
developing countries can global development aid be more fully
understood and wisely promoted.
( TA B L E 1 ) U . S . T O TA L N E T E C O N O M I C E N G A G E M E N T W I T H D E V E L O P I N G C O U N T R I E S , 2 0 1 3 – 2 0 1 4 1 2
Flow USD Billions PercentU.S. Official Development Assistance
U.S. Private Philanthropy
· Foundations
· Corporations
· Private and Voluntary Organizations
· Volunteerism
· Universities and Colleges
· Religious Organizations
U.S. Remittances
U.S. Private Capital Flows
U.S. Total Economic Engagement
33.1
43.9
4.7
11.3
15.4
4.3
2.2
6.0
108.7
179.3
365.0
9%
12%
11%
26%
35%
10%
5%
14%
30%
49%
100%
U.S. ODA was $33.1 billion in 2014. While outside the top 15 in terms of ODA as a percentage of GNI, the United States remains the largest donor in total volume.
TOTAL
H U D S O N I N S T I T U T E10
I N T E R N AT I O N A L P H I L A N T H R O P Y All DAC donors gave $63.7 billion in private philanthropy.
The U.S. gave $43.9 billion, followed by the U.K. at $4.9
billion, Japan at $4.5 billion, Germany at $1.9 billion, and
Canada at $1.7 billion.
CGP was the first to provide a more comprehensive picture
of global philanthropic giving to developing countries.
Despite increased giving, however, many countries are
reporting significantly underestimated levels of private giving
to the OECD which collects these data for DAC donor
countries. Some DAC countries are not reporting any private
giving to the OECD. For these reasons, CGP developed
partnerships and collected data from researchers throughout
the world on their cross-border giving to developing world
nations. The resources for measuring global philanthropic
giving are growing, and some of the DAC donor countries,
such as Japan, the Netherlands, the U.K., and Canada have
developed methodologies similar to CGP’s to collect data on
their global philanthropy.
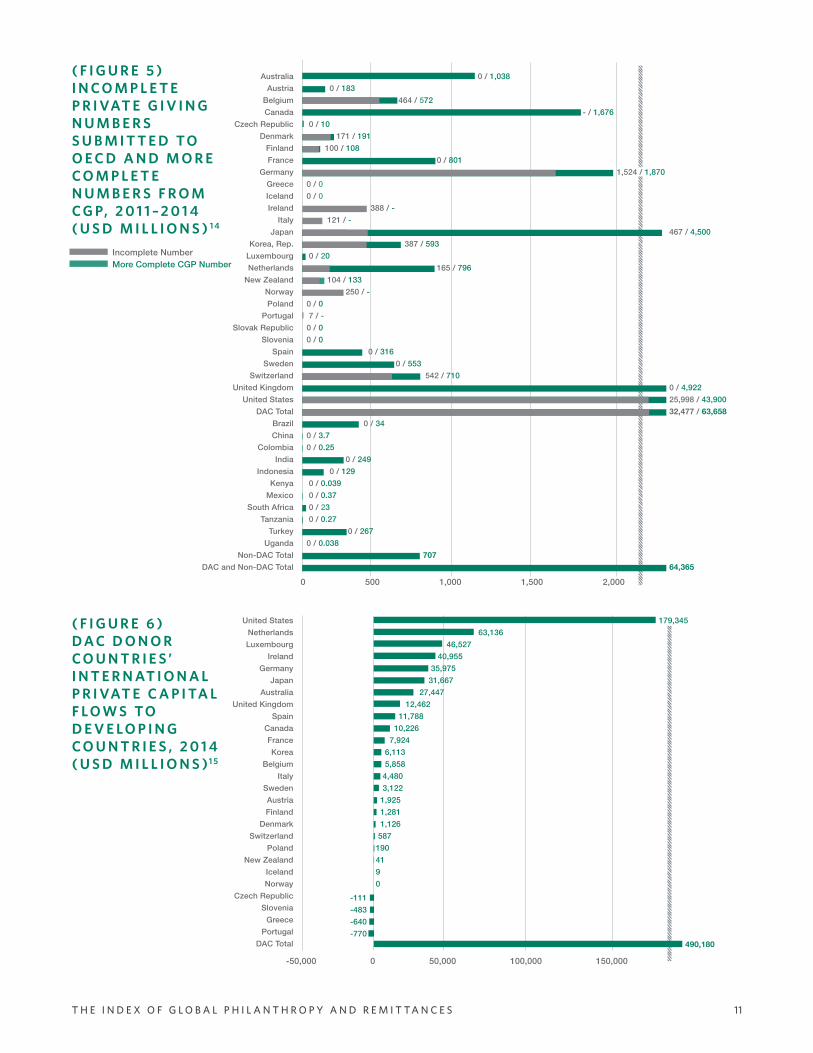
Figure 5 shows that there is a wide discrepancy between the
level of private giving that countries report to the OECD and
the more complete numbers compiled by the CGP. For
example, Australia, France, and the U.K. reported no
philanthropic giving to the OECD in 2014. CGP’s research
through private sources in these countries, however, found
$1 billion in private giving to developing countries from
Australia, $801 million from France, and $4.9 billion from the
U.K. One of the largest discrepancies is seen in the private
giving number reported by Japan to the OECD. In 2014
Japan reported only $467 million to the OECD. Japan’s CSO
Network, working in partnership with CGP, identified $4.5
billion in global philanthropy from Japan to developing
countries. Another large discrepancy comes from the U.S.
government, which submitted only $26 billion to the OECD
for its private giving number in 2014. This is vastly lower than
the $43.9 billion that CGP research, with its large network of
U.S. experts and partners, has identified.
DAC DONOR COUNTRIES’ TOTAL ECONOMIC ENGAGEMENT WITH
DEVELOPING COUNTRIES
seen in Figure 3, the 28 DAC donor countries provided $137.2 billion in Official Development Aid (ODA) to developing countries. The U.S. gave $33.1 billion followed by the U.K. with $19.3 billion, Germany with $16.6 billion, France with $10.6 billion, and Japan with $9.2 billion.
The DAC donor countries provided a total of $210.7 billion in remittances to developing countries (for a detailed discussion of remittances see page 24).13
AS
T H E I N D E X O F G L O B A L P H I L A N T H R O P Y A N D R E M I T TA N C E S 11
( F I G U R E 5 )I N C O M P L E T E P R I VAT E G I V I N G N U M B E R S S U B M I T T E D T O O E C D A N D M O R E C O M P L E T E N U M B E R S F R O M C G P, 2 0 1 1 – 2 0 1 4 ( U S D M I L L I O N S ) 1 4
( F I G U R E 6 ) D A C D O N O R C O U N T R I E S ’ I N T E R N AT I O N A L P R I VAT E C A P I TA L F L O W S T O D E V E L O P I N G C O U N T R I E S , 2 0 1 4 ( U S D M I L L I O N S )1 5
Incomplete NumberMore Complete CGP Number
United StatesNetherlandsLuxembourg
IrelandGermany
JapanAustralia
United KingdomSpain
CanadaFrance Korea
BelgiumItaly
SwedenAustriaFinland
DenmarkSwitzerland
PolandNew Zealand
IcelandNorway
Czech RepublicSlovenia
GreecePortugal
DAC Total
179,345 63,136 46,527 40,955 35,975 31,667 27,447 12,462 11,788 10,226 7,924 6,113 5,858 4,480 3,122 1,925 1,281 1,126 5871904190
-111-483 -640-770
490,180
AustraliaAustria
BelgiumCanada
Czech RepublicDenmark
FinlandFrance
GermanyGreeceIcelandIreland
ItalyJapan
Korea, Rep.LuxembourgNetherlands
New ZealandNorwayPoland
PortugalSlovak Republic
SloveniaSpain
SwedenSwitzerland
United KingdomUnited States
DAC TotalBrazilChina
ColombiaIndia
IndonesiaKenya
MexicoSouth Africa
TanzaniaTurkey
UgandaNon-DAC Total
DAC and Non-DAC Total
0 500 1,000 1,500 2,000
0 / 1,038 0 / 183 464 / 572 - / 1,676 0 / 10 171 / 191 100 / 108 0 / 801 1,524 / 1,8700 / 00 / 0 388 / - 121 / - 467 / 4,500 387 / 593 0 / 20 165 / 796 104 / 133 250 / -0 / 0 7 / -0 / 00 / 0 0 / 316 0 / 553 542 / 710 0 / 4,922 25,998 / 43,900 32,477 / 63,658 0 / 340 / 3.70 / 0.25 0 / 249 0 / 129 0 / 0.039 0 / 0.37 0 / 23 0 / 0.27 0 / 2670 / 0.038 707 64,365
-50,000 0 50,000 100,000 150,000
H U D S O N I N S T I T U T E12
Canada is one example of CGP’s partnerships with
researchers in donor countries to obtain data on countries’
total economic engagement with the developing world.
CGP established a new partnership with the University of
Saskatchewan’s Social Sciences Research Laboratories
(SSRL) to develop a data set on Canada’s total philanthropy,
remittances, ODA, and private capital flows. In 2014 Canada
provided $4.2 billion in Official Development Aid and $1.7
billion in private philanthropy to developing countries.18
Canada also sent $14.6 billion in remittances and invested
$10.2 billion in private capital flows to these countries.
Canada’s total economic engagement with developing
countries in 2014 is estimated at $30.7 billion.19
Consistently ranked as one of the most charitable nations,
Canada has recently made headlines with its approach to the
continued global refugee crisis. Under Prime Minister Justin
Trudeau, the Canadian government has implemented a
program in which citizens can sponsor the arrival of Syrian
refugees. The program works to immerse refugees into the
communities and families of Canadian citizens and has been
met with strong support.20 As Immigration Minister John
McCallum stated, “I can’t provide refugees fast enough for
the Canadians who want to sponsor them.”21 The recently
elected Liberal government has promised to help 25,000
refugees settle in Canada by February 2017.
This level of volunteerism can be found throughout Canada.
In 2013, 12.7 million people, or more than four in ten
Canadians aged 15 or older participated in some sort of
volunteer work both domestic and international.22 Some
Canadian charitable organizations recruit and deploy trained
volunteers including physicians and engineers for projects in
developing countries. To estimate the value of international
volunteerism, SSRL identified ten organizations which
collectively had facilitated over 2,000 Canadians volunteering
abroad in 2014. The value of this international volunteerism
was $40 million.
Faith-based organizations constitute a significant part of
Canada’s charitable aid activity. In 2014, faith-based
organizations provided $900 million to developing countries.
Non-faith-based organizations gave $736 million in charitable
giving. The total amount of private giving from Canada to the
developing world in 2014 was estimated at $1.7 billion,
consisting of the $40 million in international volunteerism, the
faith-based giving of $900 million, and the other charitable
giving of $736 million.23
The SSRL calculation of private philanthropy does not
include corporate charity since companies typically do not
differentiate between domestic and international giving in
their annual reports. While nearly half of Canada’s 400 oil and
gas companies and 1,400 mining companies operate outside
of Canada, the SSRL could not obtain an overseas giving
number for these companies. On July 1st 2015 the Canadian
government enacted The Extractive Sector Transparency Measures Act, which mandates increased public reporting-
making it possible ultimately to calculate Canadian corporate
international charity in the future.24
C A N A D A
CGP found that, overall, DAC donors gave almost double the
$32.5 billion private giving number reported to and published
by the OECD.16 Clearly, the OECD private giving number is
insufficient. The OECD must improve and expand its
research on global private giving so that they can obtain a
more accurate measure of the large and growing private
philanthropic aid flowing into the developing world.
I N T E R N AT I O N A L P R I VAT E C A P I TA L F L O W S
Figure 6 shows that private capital flows from DAC donor
countries to developing countries were $490.2 billion.
Following the U.S. at $179.3 billion, the Netherlands was the
next largest investor of private capital to developing
countries in 2014 at $63.1 billion. After the Netherlands and
the United States, the next largest private capital investors
were Luxembourg, Ireland, Germany, and Japan.
The total economic engagement of all DAC donors with the
developing world in 2014 is estimated at $901.7 billion. After
the U.S., which had a total economic engagement with the
developing world of $365 billion in 2014, the Netherlands
was second with $71.8 billion. The Netherlands was followed
by Germany, Japan, and the U.K. 17
H U D S O N I N S T I T U T E12
T H E I N D E X O F G L O B A L P H I L A N T H R O P Y A N D R E M I T TA N C E S 13
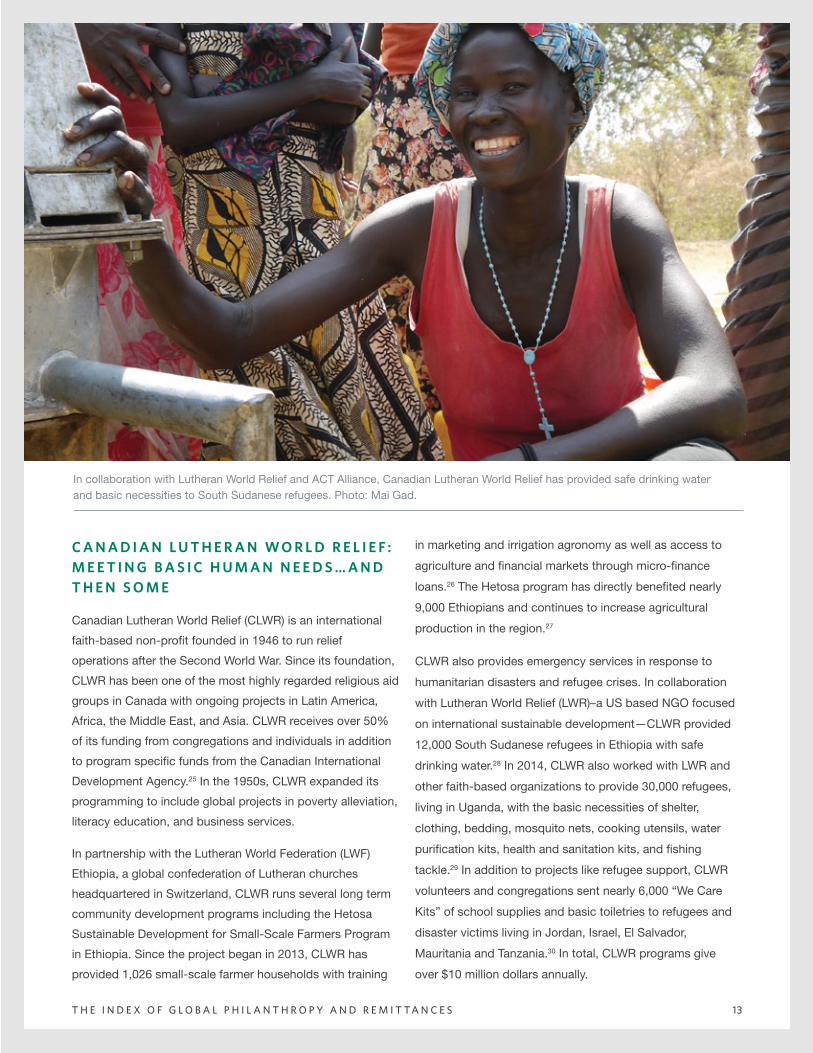
C A N A D I A N L U T H E R A N W O R L D R E L I E F : M E E T I N G B A S I C H U M A N N E E D S … A N D T H E N S O M E
Canadian Lutheran World Relief (CLWR) is an international
faith-based non-profit founded in 1946 to run relief
operations after the Second World War. Since its foundation,
CLWR has been one of the most highly regarded religious aid
groups in Canada with ongoing projects in Latin America,
Africa, the Middle East, and Asia. CLWR receives over 50%
of its funding from congregations and individuals in addition
to program specific funds from the Canadian International
Development Agency.25 In the 1950s, CLWR expanded its
programming to include global projects in poverty alleviation,
literacy education, and business services.
In partnership with the Lutheran World Federation (LWF)
Ethiopia, a global confederation of Lutheran churches
headquartered in Switzerland, CLWR runs several long term
community development programs including the Hetosa
Sustainable Development for Small-Scale Farmers Program
in Ethiopia. Since the project began in 2013, CLWR has
provided 1,026 small-scale farmer households with training
in marketing and irrigation agronomy as well as access to
agriculture and financial markets through micro-finance
loans.26 The Hetosa program has directly benefited nearly
9,000 Ethiopians and continues to increase agricultural
production in the region.27
CLWR also provides emergency services in response to
humanitarian disasters and refugee crises. In collaboration
with Lutheran World Relief (LWR)–a US based NGO focused
on international sustainable development—CLWR provided
12,000 South Sudanese refugees in Ethiopia with safe
drinking water.28 In 2014, CLWR also worked with LWR and
other faith-based organizations to provide 30,000 refugees,
living in Uganda, with the basic necessities of shelter,
clothing, bedding, mosquito nets, cooking utensils, water
purification kits, health and sanitation kits, and fishing
tackle.29 In addition to projects like refugee support, CLWR
volunteers and congregations sent nearly 6,000 “We Care
Kits” of school supplies and basic toiletries to refugees and
disaster victims living in Jordan, Israel, El Salvador,
Mauritania and Tanzania.30 In total, CLWR programs give
over $10 million dollars annually.
In collaboration with Lutheran World Relief and ACT Alliance, Canadian Lutheran World Relief has provided safe drinking water and basic necessities to South Sudanese refugees. Photo: Mai Gad.
T H E I N D E X O F G L O B A L P H I L A N T H R O P Y A N D R E M I T TA N C E S 13
H U D S O N I N S T I T U T E14
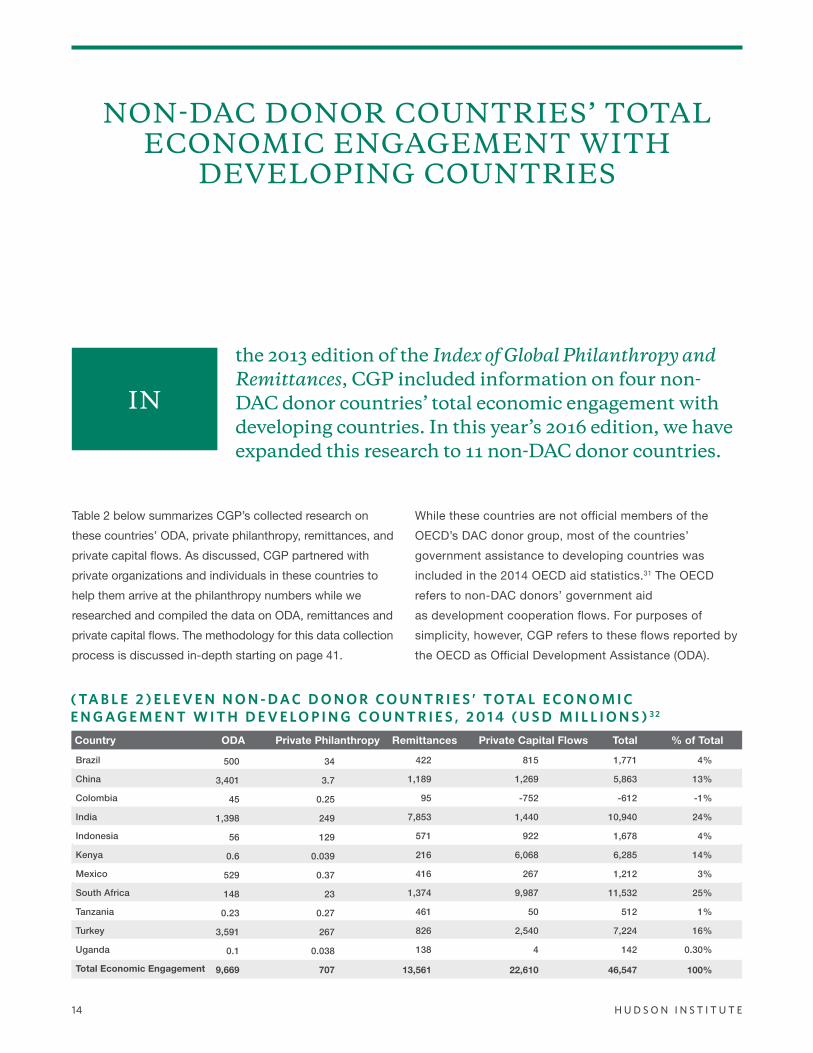
Table 2 below summarizes CGP’s collected research on
these countries’ ODA, private philanthropy, remittances, and
private capital flows. As discussed, CGP partnered with
private organizations and individuals in these countries to
help them arrive at the philanthropy numbers while we
researched and compiled the data on ODA, remittances and
private capital flows. The methodology for this data collection
process is discussed in-depth starting on page 41.
While these countries are not official members of the
OECD’s DAC donor group, most of the countries’
government assistance to developing countries was
included in the 2014 OECD aid statistics.31 The OECD
refers to non-DAC donors’ government aid
as development cooperation flows. For purposes of
simplicity, however, CGP refers to these flows reported by
the OECD as Official Development Assistance (ODA).
NON-DAC DONOR COUNTRIES’ TOTAL ECONOMIC ENGAGEMENT WITH
DEVELOPING COUNTRIES
the 2013 edition of the Index of Global Philanthropy and Remittances, CGP included information on four non-DAC donor countries’ total economic engagement with developing countries. In this year’s 2016 edition, we have expanded this research to 11 non-DAC donor countries.
IN
Country ODA Private Philanthropy Remittances Private Capital Flows Total % of Total
Brazil
China
Colombia
India
Indonesia
Kenya
Mexico
South Africa
Tanzania
Turkey
Uganda
Total Economic Engagement
500
3,401
45
1,398
56
0.6
529
148
0.23
3,591
0.1
9,669
34
3.7
0.25
249
129
0.039
0.37
23
0.27
267
0.038
707
422
1,189
95
7,853
571
216
416
1,374
461
826
138
13,561
815
1,269
-752
1,440
922
6,068
267
9,987
50
2,540
4
22,610
1,771
5,863
-612
10,940
1,678
6,285
1,212
11,532
512
7,224
142
46,547
4%
13%
-1%
24%
4%
14%
3%
25%
1%
16%
0.30%
100%
( TA B L E 2 ) E L E V E N N O N - D A C D O N O R C O U N T R I E S ’ T O TA L E C O N O M I C E N G A G E M E N T W I T H D E V E L O P I N G C O U N T R I E S , 2 0 1 4 ( U S D M I L L I O N S ) 3 2
T H E I N D E X O F G L O B A L P H I L A N T H R O P Y A N D R E M I T TA N C E S 15
B R A Z I LThe last estimate of Brazil’s Official Development Assistance
was in 2010 when the Brazilian Cooperation Agency reported
a total of $500 million being sent to developing countries.33
For cross-border giving, CGP collaborated with Senior
Researcher Anna Peliano at Communitas who estimated that
Brazilian companies gave $34 million to philanthropic
activities outside of Brazil. In 2014 Brazil also provided $422
million in remittances and invested $815 million in private
capital flows to developing countries.34 Brazil’s total
economic engagement with developing countries is
estimated at $1.8 billion.
After rising to prominence as an economic leader in South
America, Brazil’s philanthropic giving has since declined.35
This decline can be attributed to the economic and political
crises that have gripped the nation over the last decade. In
2016, by some estimates, Brazil’s economy was 8 percent
smaller than it was at the beginning of 2014.36 Grupo de
Institutos Fundaçõe e Empresesas (GIFE), formed in 1995 to
bolster support for private organizations, has addressed the
culture of giving in Brazil at several conferences. GIFE asked
representatives from a variety of institutions and countries to
present models that might encourage Brazilian giving.37
Several initiatives are underway now in Brazil to encourage
philanthropic giving, such as the “Day of Giving” campaign
which promotes individual giving. “We Capture,” an online
program, has been established to help CSO’s dialogue
with donors.38
C H I N A
In 2014 China’s Official Development Aid amounted to $3.4
billion.39 The CGP’s research partner, the China Foundation
Center, found that the top 75 Chinese foundations reported
total expenditures of $2.8 billion, of which only $3.7 million
was directed to international causes in 2014. In 2014 China
sent $1.2 billion in remittances and invested $1.3 billion in
private capital flows.40 China’s total economic engagement
with developing countries in 2014 is estimated at $5.9 billion.
China continues to play a growing role as an international
donor, with President Xi Jinping announcing plans in 2015 to
create a 10-year, $1 billion “peace and development” fund to
support the work of the United Nations.41 Over the last
decade, China has become one of Africa’s biggest
investors.42 However, some studies suggest that Chinese
investment in Africa only makes up a small percentage of
total Chinese foreign investment.43
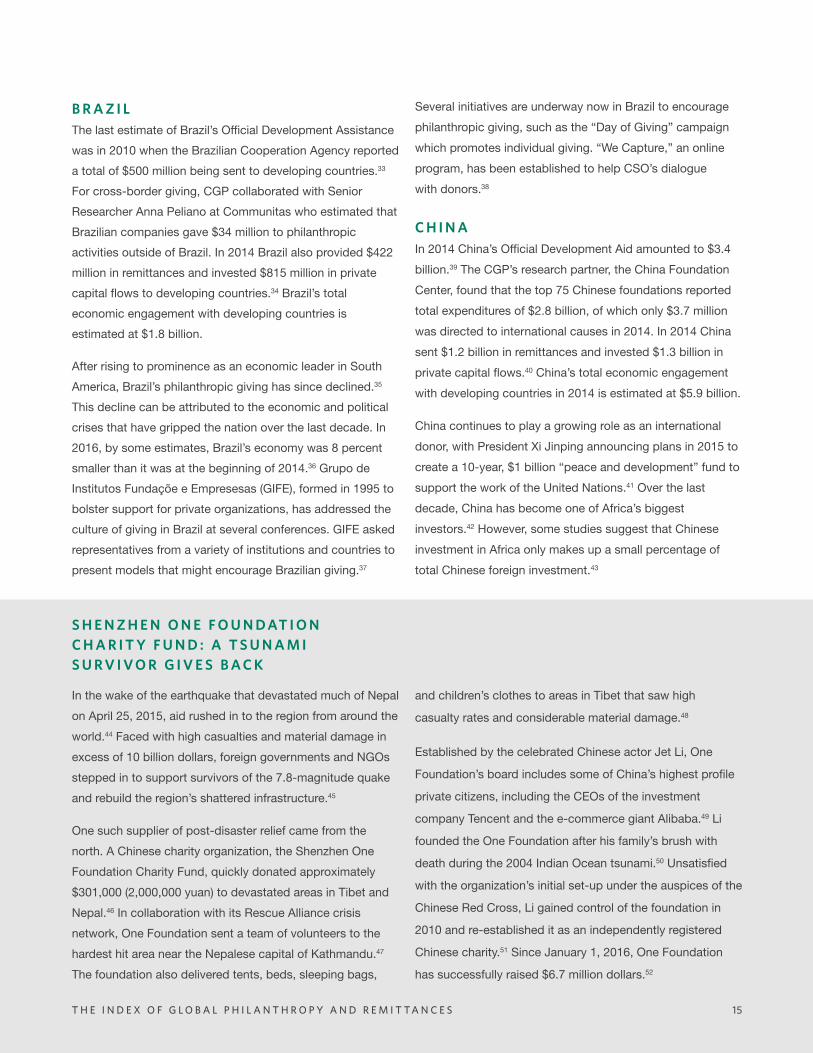
In the wake of the earthquake that devastated much of Nepal
on April 25, 2015, aid rushed in to the region from around the
world.44 Faced with high casualties and material damage in
excess of 10 billion dollars, foreign governments and NGOs
stepped in to support survivors of the 7.8-magnitude quake
and rebuild the region’s shattered infrastructure.45
One such supplier of post-disaster relief came from the
north. A Chinese charity organization, the Shenzhen One
Foundation Charity Fund, quickly donated approximately
$301,000 (2,000,000 yuan) to devastated areas in Tibet and
Nepal.46 In collaboration with its Rescue Alliance crisis
network, One Foundation sent a team of volunteers to the
hardest hit area near the Nepalese capital of Kathmandu.47
The foundation also delivered tents, beds, sleeping bags,
and children’s clothes to areas in Tibet that saw high
casualty rates and considerable material damage.48
Established by the celebrated Chinese actor Jet Li, One
Foundation’s board includes some of China’s highest profile
private citizens, including the CEOs of the investment
company Tencent and the e-commerce giant Alibaba.49 Li
founded the One Foundation after his family’s brush with
death during the 2004 Indian Ocean tsunami.50 Unsatisfied
with the organization’s initial set-up under the auspices of the
Chinese Red Cross, Li gained control of the foundation in
2010 and re-established it as an independently registered
Chinese charity.51 Since January 1, 2016, One Foundation
has successfully raised $6.7 million dollars.52
S H E N Z H E N O N E F O U N D AT I O N C H A R I T Y F U N D : A T S U N A M I S U R V I V O R G I V E S B A C K
T H E I N D E X O F G L O B A L P H I L A N T H R O P Y A N D R E M I T TA N C E S 15
H U D S O N I N S T I T U T E16
The role of Chinese private philanthropy in developing
countries remains limited by government regulation. Historically, the Communist Party of China has restricted the
formation and operation of NGOs, requiring organizations to
have a sponsoring official organization. These government
organized non-government organizations (GONGOs) have
long been the sanctioned face of philanthropy, with the bulk
of independent NGOs functioning either in disguise as
businesses, or operating without registration. This last
category constitutes the bulk of Chinese NGOs with an
estimated 1.5 million operating as unregistered in 2014.53
China seems intent on gaining control over independent
NGO’s, recently publishing details of a new draft law aimed
at regulating the work of NGO’s, including those linked to
foreign organizations.
C O L O M B I A
In 2014 Colombia provided $45 million in Official
Development Aid and $253,000 in private philanthropy to
developing countries.54 To establish the private philanthropy
estimate, CGP partnered with the local non-profit
organization, Makaia Asesoria Internacional, a charity with
the mission of strengthening the social sector in Colombia. In
2014 Colombia also sent $95 million in remittances to
developing countries.55 Due to losses in Colombia’s portfolio
investments including equity, debt, and debt securities,
Colombia’s private capital investment in developing countries
suffered a loss of $752 million in 2014.56 While the first three
flows of ODA, private philanthropy, and remittances provided
$140.3 million to developing countries, Colombia’s estimated
total economic engagement with these countries was a net
negative $612 million due to the negative portfolio investments.
Colombia’s civil society is fragmented, and the country lacks
a single organization responsible for collecting data on the
third sector. Historically, Colombian civil society consisted of
foundations, supported by the church and individuals, along
with some community based organizations.57 NGOs emerged
more recently with a focus on human rights as well as
economic and educational issues, but they operate within a
complicated legal framework. Colombian law provides
numerous freedoms for civil society organizations, but
fragmented oversight and little enforcement make it difficult
to estimate the number of organizations registered under the
Public Registry in Colombia’s Chambers of Commerce.58
To estimate private giving, Makaia interviewed 55 non-profit
organizations, including corporate and private foundations.
Makaia found that most of these organizations do not invest
in cross-border philanthropy, and focus instead on domestic
giving. Colombia is a not a high-income country, and it faces
immense challenges in political and financial stability. As
such, most international giving takes the form of official
government assistance. Most of the corporate foundations
interviewed by Makaia spoke of their desire to support social
causes in their own areas of business in Colombia. Makaia
found that, of the 55 organizations surveyed, only three
engaged in philanthropic giving in the neighboring countries
of El Salvador, Panama, the Dominican Republic, and
Ecuador. These organizations provided an estimated total of
$253,000 in cross-border private giving in 2014.59
I N D I A
In 2014 India provided $1.4 billion in Official Development
Aid and an estimated $249 million in private philanthropy to
developing countries.60 To arrive at an estimate of India’s
private giving, the CGP used various resources in India for
background information and data collection. India also sent
$7.9 billion in remittances and invested $1.4 billion in private
capital flows to the developing world.61 The CGP estimates
that India’s total economic engagement with developing
countries in 2014 was $11 billion.
With the world’s second largest population and one of the
fastest growing economies, India’s philanthropic structure
has often struggled to keep pace with its socio-economic
environment. In spite of these difficulties, India’s private
giving has increased with the country’s economic growth.
More and more private individuals are turning to the
philanthropic sector to help Indian citizens improve their
lives. Individual giving has grown, with some 28 percent of
the adult population donating money in 2013, making India’s
T H E I N D E X O F G L O B A L P H I L A N T H R O P Y A N D R E M I T TA N C E S 17
private giving significantly greater than other countries with
similar Purchasing Power Parity.62 While there are
approximately 70,000 registered NGOs operating in India,
studies suggest that there are nearly 2 million non-profits in
existence.63 This philanthropic infrastructure has developed
over time as individuals and corporations have invested
resources in social development programs.
Most of India’s philanthropic giving is, understandably,
focused inwards as the country tries to remedy imbalances
in the socio-economic environment of its 1.3 billion citizens.
Bain & Company, which tracks Indian philanthropy, found
that the most popular philanthropic causes are education
and child welfare. A large portion of the country’s population
lacks access to secondary education and only 36 percent of
India’s population has access to modern sanitation facilities.64
India’s third sector continues to play an important role in
addressing these development issues by filling gaps in the
government’s welfare systems.65 Due to India’s corporate social
responsibility legislation, which requires Indian corporations to
donate two percent of their net profits to charity, corporate
giving will likely increase in the years to come.66
The private resources that CGP drew upon for background
and data on India’s domestic and cross-border giving
included the Sampradaan Indian Centre for Philanthropy,
Bain & Company, Corporate Sustainability & Reputation
Consulting, and research by the INSEAD graduate business
school. While there is information on Indian philanthropy,
particularly domestic giving, there is scarce data on India’s
cross-border giving. Since this information was not available
for 2014, CGP used data that collected for its 2013 Index by
the Sampradaan Indian Centre for Philanthropy that relied on
a survey of over 600 foundations and corporations.67
I N D O N E S I A
In 2014 Indonesia provided $56 million in Official
Development Aid and $129 million in private philanthropy to
developing countries.68 To establish this estimate of private
philanthropy, the CGP partnered with Dr. Maria Radyati, the
Executive Director of the Center for Entrepreneurship,
Change and Third Sector in Indonesia. Indonesia also sent
$571 million in remittances to developing countries and
invested $922 million in private capital flows.69 Indonesia’s
total economic engagement with developing countries in
2014 is estimated to be $1.7 billion.
Civil society organizations have been restricted by the
government for much of Indonesia’s post-colonial history.
Under the authoritative control of President Suharto, they
were classified as mass organizations or “Ormas.”70 After
Suharto stepped down in 1998, government treatment of
NGOs began to improve but has declined in recent years.
On July 2, 2013 Indonesia’s parliament enacted the Law of
Mass Organizations despite opposition from all parts of civil
society. Provisions of the NGO law give the government the
authority to screen all “mass organizations” in the country.71
The law also stipulates that foreigners who wish to start an
NGO in Indonesia must have resided in Indonesia for a
minimum of five years and must invest $1 million of their
personal wealth into the organization.72 While petitions were
made by CSOs to review the law, Indonesia’s Constitutional
Court upheld it, although it did strike down some provisions
harmful to Indonesia’s civil society.73
There are nearly 49,000 organizations registered at the
Ministry of Law and Human Rights, but there is little
information regarding the nature of these organizations.74
Civil society organizations lack tax exemptions, and the
government places time-consuming reporting requirements
on those who receive foreign funds. The CGP’s partner in
Indonesia found that most foreign donations to NGOs were
made by wealthy citizens and religious organizations.
Indonesian corporate foundations interviewed gave $118
million to overseas development causes in 2014. Religious
organizations gave $11 million in assistance that year, often
in the form of disaster relief.75
K E N YA
In 2013 Kenya provided $580,000 in government assistance
and $38,900 in private philanthropy to developing
countries.76 To establish this estimate of private philanthropy,
H U D S O N I N S T I T U T E18
the CGP partnered with the East Africa Association of
Grantmakers (EAAG), an association in Kenya that
encourages local giving. In 2014 Kenya also sent $216
million in remittances and invested $6 billion in private capital
flows to developing countries.77 This private capital flow
figure could be an overestimation since the quality of data
reported by receiving countries to the IMF of Kenya’s
outward investments improved from 2013 to 2014. Kenya’s
total economic engagement with developing countries in
2014 is estimated at $6.3 billion.
The concept of civil society is deeply rooted in Kenya. NGOs
played a central role in Kenya’s struggle for independence in
1963 and they worked with the government to provide social
services.78 In the late 1990s, when Kenya’s government failed
to respond to the HIV/AIDS crisis, NGOs stepped in and
provided advocacy and services. Civil society groups are
well respected by Kenyan citizens. According to a Freedom
House study, 82 percent of nearly 3,000 respondents
believed that NGOs contributed positively to their lives.79
Unfortunately, the Kenyan government has often restricted
NGO operations. The environment for NGOs improved in 2002
when the country transitioned from an authoritarian dictatorship
to democratic rule, but it remains far from enabling. In October
2015, the government sought to deregister nearly one thousand
organizations for not being able to account for donor funding
and put forth a proposal that NGOs could receive only 15
percent of funding from foreign sources. During a meeting
organized by the Kenya’s Human Rights Commission, the
country’s Attorney General criticized NGOs for acting “like
teenagers out to externalize local problems” and for failing to
“look at themselves in the mirror.”80
Kenya lacks a common legal framework for registering and
categorizing foundations and trusts, which makes it difficult
to provide complete accounts of private philanthropy. To
generate an estimate, EAAG surveyed 52 organizations of
foundations, corporations, and NGOs and found that they
spent a total of $23,343 on social causes outside the
country. EEAG found that these organizations had logged a
total of 92,608 hours of volunteer time, eight percent of
which was in support of foreign causes. The value of this
labor is estimated at $15,558 for a total estimate of
international private giving of $38,900.81
M E X I C O
In 2014 Mexico provided $529 million in Official Development
Aid and $370,000 in private philanthropy to developing
countries.82 To establish this estimate of private philanthropy,
the CGP partnered with Centro de Investigacion y Estudios
sobre Sociedad Civil (CIESC), an association that focuses on
contributing to the development of civil society in Mexico and
Latin America. Mexico also sent $416 million in remittances
and invested $267 million in private capital flows to developing
countries.83 Mexico’s estimated total economic engagement
with developing countries in 2014 was $1.2 billion.
Mexico’s philanthropic giving has its roots in the Catholic
Church, which has encouraged charitable giving and was
instrumental in establishing welfare institutions. More
recently, Mexico’s civil society has focused its attention on
political and social causes and environmental sustainability.84
According to the Federal CSO registry, there are
approximately 20,000 active civil society organizations.85 Civil
society organizations received public attention by fighting
fraud during elections in the 1980s and 1990s and, more
recently, fighting corruption in local governments. In April
2015, NGOs lobbied successfully for greater transparency in
government by using “name and shame” publicity
campaigns which identified corrupt officials.86
Mexico’s tax laws have not been designed to incentivize
international charitable giving. While private entities in
Mexico may receive tax benefits when sending contributions
to organizations abroad, such benefits are only available if
funds were donated to international organizations to which
Mexico is a full member.87 Some nonprofit organizations can
become tax-exempt entities, a near equivalent of a U.S.
501(c)(3). Civil society benefits from the double taxation
treaty that Mexico has with the United States which ensures
that identical tax incentives are provided to donors and
recipients of both countries. The tax on transferring money
from Mexico to countries other than the United States is a
barrier for cross-border philanthropy.
T H E I N D E X O F G L O B A L P H I L A N T H R O P Y A N D R E M I T TA N C E S 19
To establish an estimate of private philanthropy, CIESC
examined the contributions of the top ten international
corporations and found that these corporations gave
$370,000 to foreign causes in 2014.88 This number, however,
is likely underestimated since some corporations have mixed
local and foreign charitable giving. Estimates on other
sources such as foundations, charities, and religious giving,
are difficult to make as many donations are still made
through informal channels and lack the legal framework
necessary to more fully track these flows. Further research is
needed to obtain data on these other financial flows.
S O U T H A F R I C A
In 2014 South Africa provided $148 million in Official
Development Aid and $23 million in private philanthropy to
developing countries.89 To establish an estimate of private
philanthropy, the CGP partnered with Charities Aid Foundation
(CAF) Southern Africa. South Africa also sent $1.4 billion in
remittances and invested $9.9 billion in private capital flows to
developing countries.90 South Africa’s estimated total economic
engagement with developing countries in 2014 was $11.5 billion.
South Africa has a long history of philanthropy deeply rooted
in providing support to extended families and community
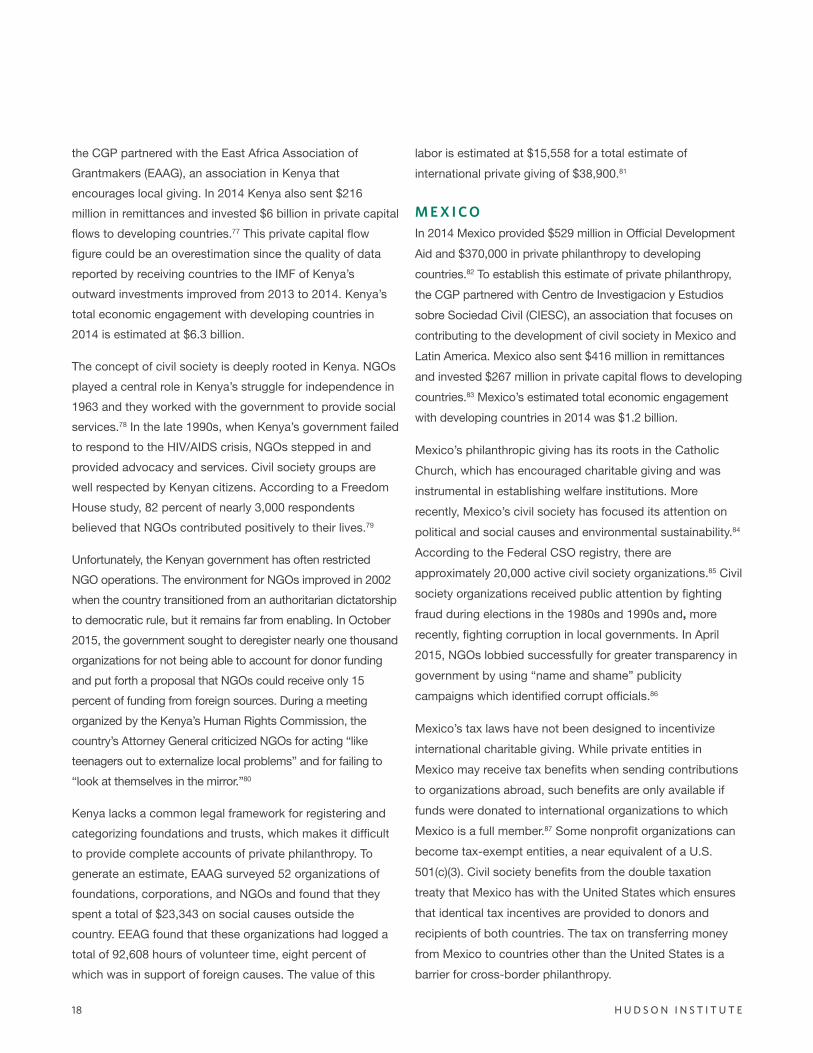
G O L D A G E N C Y: E D U C AT I N G T O M O R R O W ’ S L E A D E R S T O D AY The Mertech Group is a South African investment company that
was founded in 1980 by Francois van Niekerk.91 Mertech
invests internationally in a variety of industries including
corporate property development, renewable “CleanTech”
energy, insurance, information and communication technology,
and mining.92 While Mertech works in a variety of sectors, it also
funds the Muthobi Foundation, which invests in 18 charitable
organizations in South Africa and around the region.
One of the organizations supported by the Muthobi
Foundation is Generations of Leaders Discovered Peer
Education Development Agency (abbreviated GOLD
Agency). GOLD Agency is a non-profit organization that
targets adolescents from communities that face obstacles
like poverty, inadequate education, unemployment, gender
violence, orphanhood and HIV/AIDS. Since 2004, GOLD
Agency has created working internship opportunities for 475
unemployed youth (ages 19 to 25). In turn, these peer
educators have mentored and trained 12,214 adolescents
(ages 13 to 18) and reached over 37,863 additional youth.93
According to the GOLD Agency, the peer education program
has led to a measurable decrease in substance abuse,
gender violence, and teenage pregnancy, as well as a
measurable improvement in academic performance, healthy
relationships, and employability. Kwazulu Natal, a peer
educator with the GOLD Agency clearly reflected these
trends when he noted: “GOLD has taught me to live a good
and peaceful life. I have been able to convince my brother to
go back to school and I am helping him apply. I am no longer
on drugs.”94
The GOLD Model harnesses the influence that young people
have on their peers and younger children to encourage
young people to make informed choices about their health
and safety.95 GOLD believes that the first steps towards
meaningful change involve a journey of self-discovery: a
process that must be facilitated, due to the challenging
realities that South African youth face today. Through training
exercises, the GOLD Model encourages peer educators to
recognize their value and think about their futures. Once
trained, peer educators can make positive choices and
encourage their peers to do the same.
GOLD Agency—an organization partially supported by the corporate philanthropy of the Mertech Group—trains at risk youth become peer educators who, in turn, help their fellow students avoid substance abuse, gender violence, and teenage pregnancy. Photo: GOLD Agency
H U D S O N I N S T I T U T E20
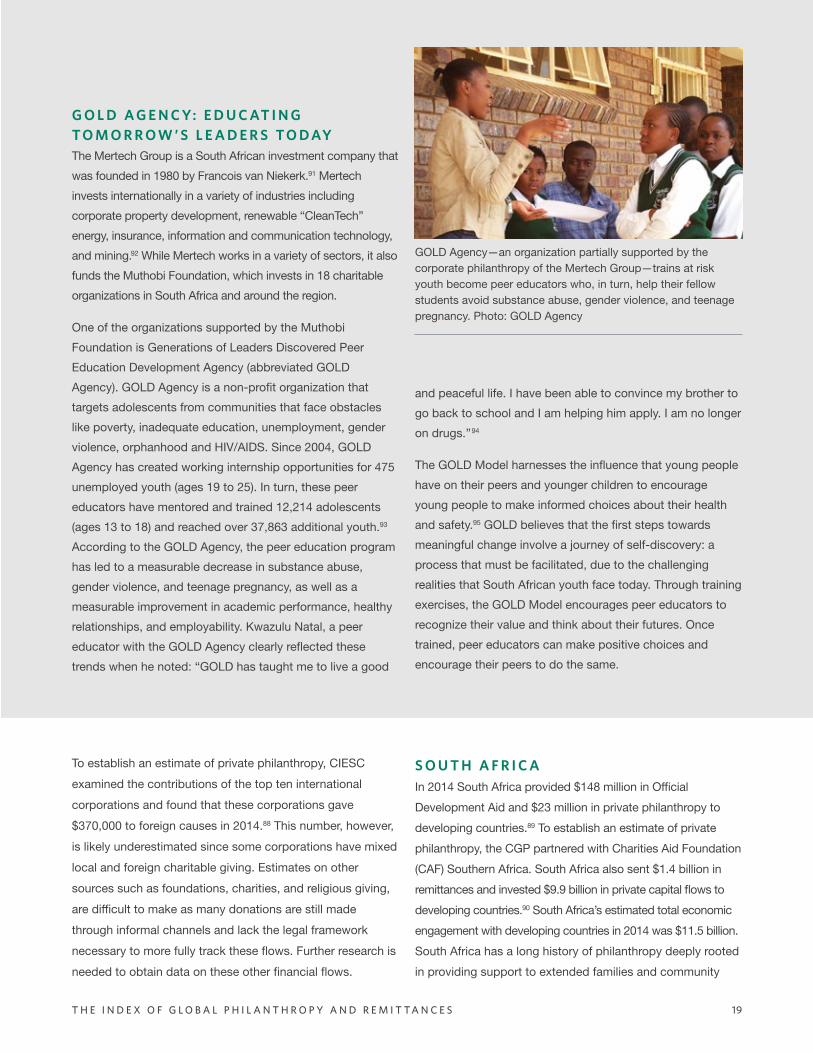
WomenCraft, a social enterprise foundation in the Ngara region of Tanzania, trains women in traditional weaving. WomenCraft artisans sell their goods to generate a living wage. Photo: WomenCraft
groups. The concept of “Ubuntu” or the “moral philosophy of
the collective self” encourages philanthropic giving. A pilot
study of individual giving in South Africa, conducted by CAF
Southern Africa in the province of Guateng, found high levels
of giving, particularly among high net worth individuals. A
study conducted by NedBank found that 91 percent of high
net worth individuals gave money, time, or goods in 2012.96
South Africa’s legislation is generally supportive of its third
sector. While the legal tradition is still rooted in the Dutch
colonial period, restrictive laws used to suppress the
activities of some organizations were repealed when the
1997 Non-Profit Act was enacted. According to the 2013
State of NPO Registration published by the Department of
Social Development in South Africa, there are approximately
102,000 voluntary associations.97
To estimate total private philanthropic giving of $23 million,
CAF analyzed results from a survey sent to 500 NPOs and
found that 5 percent of eligible organizations gave
internationally. These NPOs gave a total of $1.6 million in
2014 to developing countries. Trialogue, a consultancy in
South Africa that focuses on corporate responsibility, found
that 11 percent of corporations surveyed gave to countries
outside of South Africa. The estimated total of this corporate
cross-border giving was $20.9 million in 2014. The value of
international volunteerism by South Africans contributed an
additional $441,000 in 2014.98
TA N Z A N I A
In 2013 Tanzania provided $230,000 in government
assistance and $270,000 in private philanthropy to
developing countries.99 To establish an estimate of private
philanthropy, the CGP partnered with the East Africa
Association of Grantmakers (EAAG), an association in Kenya
that encourages local giving. In 2014 Tanzania also sent
$461 million in remittances and invested $50 million in
H U D S O N I N S T I T U T E20
T H E I N D E X O F G L O B A L P H I L A N T H R O P Y A N D R E M I T TA N C E S 21
W O M E N C R A F T: W E AV I N G C O M M U N I T I E S B A C K T O G E T H E R
A charitable social enterprise foundation founded in 2007,
WomenCraft is based in the Ngara region of Tanzania within
miles of the Rwandan and Burundi borders. For six decades,
Ngara has hosted refugees from the surrounding region who
have been affected by community instability and resource
scarcity. To help the tri-border region, WomenCraft built on
local weaving traditions by introducing modern designs to
female artisans. The women make baskets, bowls, and
trivets which are sold around the world. The profits generate
a living wage well above the average $0.71 cents that
non-artisans survive on per day.105
Of the over 300 WomenCraft artisans, 83% spent the
majority of their weaving income on food and improved
nutrition while 67% also used their income to fund education
and tuition costs for their children.106 Since 90% of Ngara’s
residents are subsistence farmers, and life expectancy in the
region is just 44 years, additional food is essential. Education
is also crucial in Ngara where the literacy rate is just 49%,
well below Tanzania’s 76% national rate.107 Not only is the
quality of life improving for all women involved in the
WomenCraft program, but some refugees (seventy artisans
are repatriated Burundians) are also using their income to
return to their countries of origin where they are buying land
and building houses.108
In addition to their increased income, WomenCraft artisans
develop business skills that allow them to take a more active
role in the foundation’s daily operations and become more
invested in the management of the enterprise.109 This income
generation and training is also helping to improve the
sociocultural status of women in and around Ngara. Like
many of her fellow artisans, Angelika Rauben used to “ask
her husband for every purchase…even to buy matches for
cooking.”110 Angelika’s success in the program and recent
election to Chairperson of the Artisan Advisory Council has
given her economic independence. WomenCraft currently
receives support from donors including: the European Union,
the US Embassy in Tanzania, the Hosanna Lutheran Church
of Houston, the Herbert Smith Fund and the Margaret
Lingoul Fund. WomenCraft also receives technical assistance
from the Ministry of Foreign Affairs in the Netherlands and
Belgian Technical Cooperation.111
private capital flows in developing countries.100 The
estimate for Tanzania’s total economic engagement with
developing countries from 2013 and 2014 sources was
$512 million.
The principal act governing NGOs in Tanzania is NGO Act
24 of 2002, but NGOs may also register under the
Companies Act or Trusteeship Act. All of these grant legal
status to a non-governmental organization.101 The legal
status of an organization is important in Tanzania as those
registered as philanthropic organizations are exempt from
all forms of taxation. The principal NGO Act of 2002 affords
Tanzania’s civil society considerable freedom by providing a
framework of self-regulation directed by a board of 30
members from various NGOs.
The Government Notice 176 of 1973 also gives the Minister
of Finance the authority to waive taxes for NGOs working
for the public interest.102 While Tanzania’s law treats
incoming cross-border flows favorably under the Income
Tax Act of 2004, there are no specific regulations for
outbound cross-border flows. Tanzania’s laws do not
distinguish between profit of international companies and
donations, so all transfers leaving the country are taxed at
10 percent.103
Tanzania lacks an organization that tracks the magnitude
and destination of private philanthropy from NGOs and
other sources. To estimate this flow, the EAAG surveyed 36
organizations registered in Tanzania. This included local
NGOs, trusts, religious organizations, and companies.
EAAG found that these organizations spent $251,372 on
overseas social causes and. an additional $17,674 was
distributed to organizations in Tanzania that work on
international issues.104
T H E I N D E X O F G L O B A L P H I L A N T H R O P Y A N D R E M I T TA N C E S 21
H U D S O N I N S T I T U T E22
Founded in 2002, Toplum Gönüllüleri (TOG) is a civil society
organization that engages young people living in Turkey in
social responsibility activities. In 2015, 60,761 Turkish teens
and young adults participated in over 1,468 local, national,
and international social responsibility projects organized by
TOG.112 TOG has conducted and participated in numerous
volunteer projects around the world, and has multiple project
partnerships with European organizations like the European
Voluntary Service (EVS), Eramus, and Youth for Exchange.113
TOG also partners with local NGOs in other countries to
conduct international exchanges, facilitate intercultural
dialogues, and organize service projects.
In partnership with local NGOs, TOG has organized
engagement projects in Armenia since 2008. Working to
bridge the historic gap and ethnic animosity between Turkey
and Armenia, TOG organizes social sensitivity gatherings
that include service projects. For example, TOG recently
hosted an intercultural dialogue where participants renovated
a primary school in the Turkish province of Arpaçay near the
Armenian border. One TOG participant noted: “I have seen
that I am in a space where young individuals are appreciated,
their initiatives are supported, and they are the ones who
determine the direction of the organization. The most
influential factor in my personal transformation has been
seeing where [TOG’s] social responsibility projects are
[being] implemented.”114 In partnership with the Armenian
NGO, The Future is Yours, TOG also participated in the 2009
“Bridge for Benevolence” project, which conducted two
youth exchanges between Turkey and Armenia.115
TOG’s efforts are funded by individual donations, corporate
sponsorship, domestic and international providers of
enterprise funds, and EU grants.116 In 2014, TOG received
in-kind donations valued at approximately $5 million from
individual and corporate sources. To supplement their
assets, 33% of TOG’s annual income is invested.117
T O P L U M G Ö N Ü L L Ü L E R I : YO U T H E X C H A N G E S F O R U N D E R S TA N D I N G
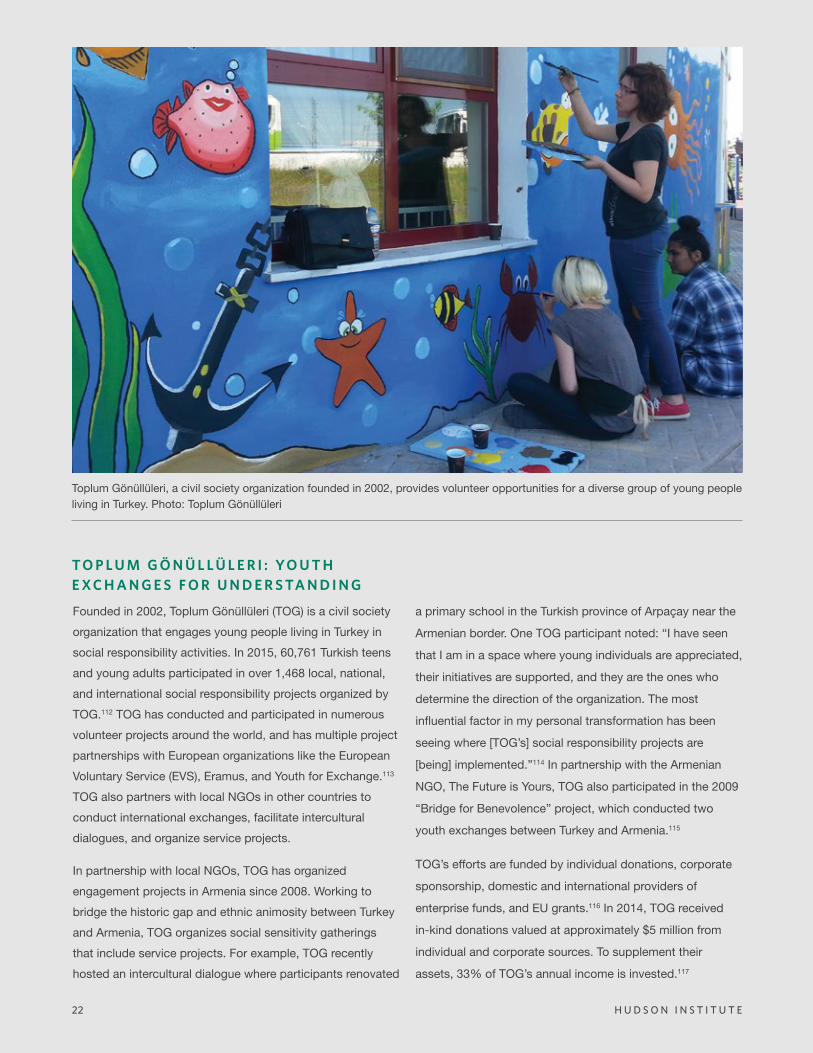
Toplum Gönüllüleri, a civil society organization founded in 2002, provides volunteer opportunities for a diverse group of young people living in Turkey. Photo: Toplum Gönüllüleri
H U D S O N I N S T I T U T E22
T H E I N D E X O F G L O B A L P H I L A N T H R O P Y A N D R E M I T TA N C E S 23
T U R K E Y
In 2014 Turkey provided $3.6 billion in Official Development
Aid and $267 million in private philanthropy to developing
countries.118 To establish an estimate of private philanthropy,
the CGP partnered with Turkish independent expert, Sevda
Kilicalp. Turkey also sent $826 million in remittances and
invested $2.5 billion in private capital flows in these
countries.119 Turkey’s estimated total economic engagement
with developing countries in 2014 was $7.2 billion.
Turkey has grown as an international humanitarian donor in
recent years.120 Turkish Official Development Aid has
expanded by over a billion dollars since 2012, increasing by
over $500 million a year since 2010. A large portion of this
aid has been for the Syrian refugee crisis. Turkey is currently
hosting 2.5 million Syrian refugees and facing an
unprecedented increase in asylum applications from
Afghans, Iraqis, and Iranians. The increase in Turkey’s
development aid coincides with the rise of the Justice and
Development Party (AKP) in 2002 and Turkey’s candidacy as
a member of the European Union.
Turkey’s nonprofit sector is largely composed of
foundations and associations. As of December 2014
there were almost 109,000 nonprofit organizations in
Turkey. Of these organizations, 104,066 were associations
and nearly 5,000 were foundations.121 Since 2003 Turkey
has implemented a series of reforms to expand civil
society, allowing associations to receive foreign funding
and form partnerships without prior authorization from
the government. In addition, the Turkish government
now allows associations to open representative offices
in other countries.122 Turkish philanthropy benefits from
Zakat, the mandatory Muslim practice of donating 2.5
percent of one’s accumulated wealth which is often
given more to family members and neighbors, than
civil society organizations.
U G A N D A
In 2013 Uganda provided $100,000 in government
assistance and $38,400 in private philanthropy to developing
countries.123 To generate this estimate of private philanthropy,
the CGP partnered with the East Africa Association of
Grantmakers (EAAG), an association in Kenya that focuses
on encouraging local giving. In 2014 Uganda also sent $138
million in remittances and invested $4 million in private
capital flows to developing countries.124 The estimate for
Uganda’s total economic engagement with developing
countries from 2013 and 2014 sources was $142.1 million.
Civil society organizations face significant challenges in
Uganda. Many CSOs are dedicated to political reform and
protecting human rights. Recently, some CSOs have been
promoting the reform of electoral laws through an alliance
called Citizen’s Coalition for Electoral Democracy in
Uganda.125 Unfortunately, the legal space for CSOs continues
to narrow. In October 2013, The Public Order Management Act granted the police the power to prohibit public meetings
of three or more people and decide the venues for approved
meetings. This has been used to target opposition members
and civil society leaders.126 Uganda’s parliament passed
another NGO law in 2015 which allows the government to
refuse NGO registrations, revoke permits, and limit hiring of
non-citizens. In addition, the government requires that all
foreign funding be sent to the government operated Bank of
Uganda.127 The application of these laws gives the
government the ability to restrict CSOs that act against the
political and social interests of the government.
The NGO Board in Uganda does not provide information on
the number of CSOs registered in the country nor estimates of
their private giving. To estimate this flow, the EAAG surveyed 30
organizations engaged in philanthropic giving that were
registered in Uganda. This survey included local NGOs,
religious organizations, trusts, and companies. EAAG found that
these organizations spent $36,400 on foreign causes and
activities. An additional $2,000 was distributed to organizations
based in Uganda that work on international issues.128
H U D S O N I N S T I T U T E24
R E M I T TA N C E S F R O M A L L C O U N T R I E S T O D E V E L O P I N G C O U N T R I E S
In 2014, migrants sent a worldwide total of $580 billion
back to their countries of origin. Nearly 3/4 of this total, an
estimated $427 billion, was sent to developing countries.129
This flow is a sizable source of the GDP of some
developing countries.130
The number of international migrants worldwide has
continued to grow, reaching 244 million people in 2015. More
than two thirds of these migrants live in high income
countries. In 2015, the five high income countries with the
largest migrant populations were the United States,
Germany, Russia, Saudi Arabia, and the United Kingdom.131
India remains the largest recipient of remittances, receiving
an estimated total of $71 billion in 2014. The remaining top
ten remittance destinations are China ($62.3 billion), the
Philippines ($28 billion), Mexico ($24.5 billion), Nigeria ($20.9
billion), Egypt ($19.5 billion), Pakistan ($17 billion),
Bangladesh ($15 billion), Vietnam ($12 billion), and Ukraine
($7.3 billion).132
After an average growth of 7.1 percent per year from 2010 to
2013, remittances to the developing world experienced more
modest growth of 3.3 percent in 2014, totaling $427 billion.
This slowdown in remittances to developing countries is
expected to continue in 2015 with a forecasted growth of 2
percent, or $435 billion. This lower growth is attributed to the
recent slowing economic activity in the euro area, a year of
lethargic growth in the BRICS, and currency depreciation
against the U.S. dollar.133 China reported that its economic
growth had slowed to 7.4 percent in 2015, its weakest year
since 1990.134 The IMF expects this trend to continue in
China, with growth rates of 6.3 and 6.0 percent forecasted
for 2016 and 2017.135
Remittances to developing countries in the European and
Central Asian region are estimated to fall by 6.3 percent in
2014 after experiencing a strong growth rate of 10.3 percent
in 2013.136 The decline of remittances in this region is largely
due to the recent economic slowdown in Russia, one of the
world’s largest migrant destinations. The value of the ruble
has depreciated consistently, further decreasing the
international value of migrant work. Recent reports have
shown the cost of working legally in Moscow undercuts its
value. Administrative procedures require a 22,000 ruble
($365 USD) work permit and a 4,000 ruble ($66 USD)
monthly fee. These are compounded by Russia’s crackdown
on immigration. State law requires that migrants now have
health insurance and knowledge of Russian language,
history, and law within a month of arrival.137 As a result,
remittances to developing countries in the Europe and
Central Asian region are expected to fall 18 percent in
2015.138 It is the only region of developing countries that is
expected to experience negative growth in total remittances.
The cost of sending remittances has slowly declined
according to the Remittance Prices Worldwide database. At
the close of 2014, the average global cost of sending $200
stood at 7.7 percent- a decrease of 0.6 percentage points
from the previous year. The cost of sending remittances in
South Asia fell to 5.9 percent, followed closely by Latin
GLOBAL REMITTANCES
as a source of international funding to developing countries, have grown to be substantially larger than Official Development Aid (ODA) and remain more consistent than foreign direct investment.
REMITTANCES
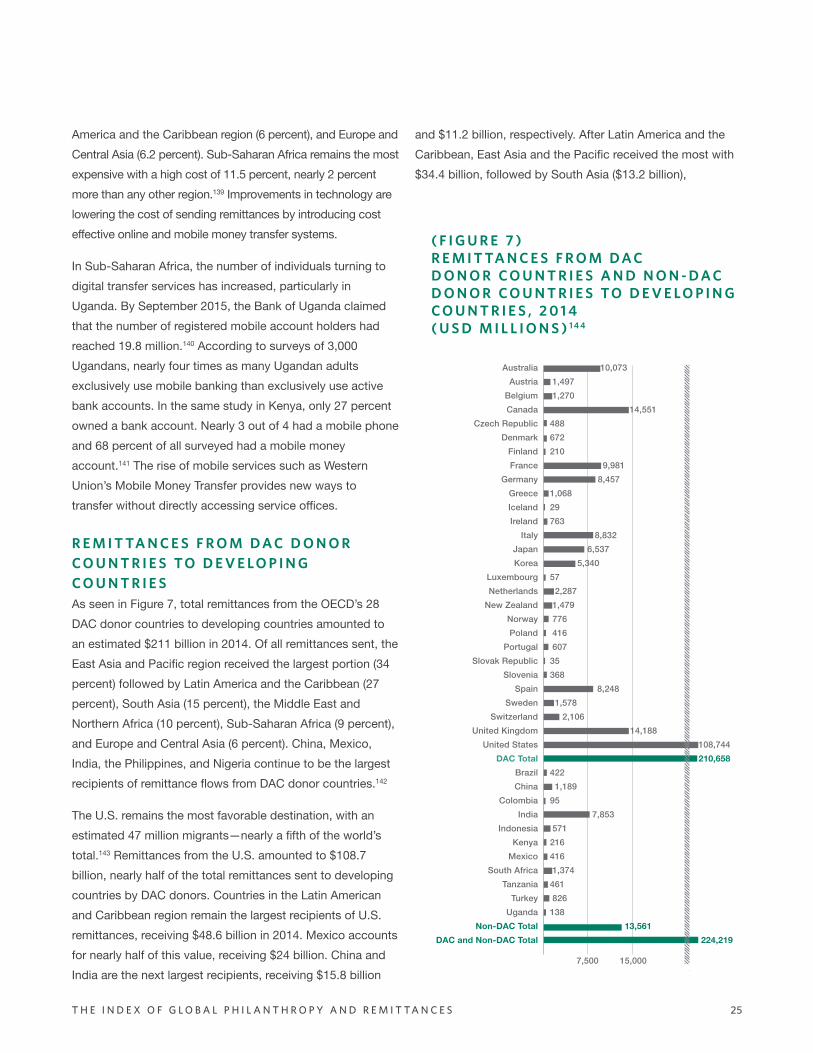
T H E I N D E X O F G L O B A L P H I L A N T H R O P Y A N D R E M I T TA N C E S 25
AustraliaAustria
BelgiumCanada
Czech RepublicDenmark
FinlandFrance
GermanyGreeceIcelandIreland
ItalyJapanKorea
LuxembourgNetherlands
New ZealandNorwayPoland
PortugalSlovak Republic
SloveniaSpain
SwedenSwitzerland
United KingdomUnited States
DAC TotalBrazilChina
ColombiaIndia
IndonesiaKenya
MexicoSouth Africa
TanzaniaTurkey
UgandaNon-DAC Total
DAC and Non-DAC Total
15,0007,500
10,073 1,497 1,270 14,551488672210 9,981 8,4571,06829763 8,832 6,537 5,34057 2,287 1,479 776 416 60735368 8,248 1,578 2,106 14,188 108,744 210,658422 1,18995 7,853 571216416 1,374461 826138 13,561 224,219
America and the Caribbean region (6 percent), and Europe and
Central Asia (6.2 percent). Sub-Saharan Africa remains the most
expensive with a high cost of 11.5 percent, nearly 2 percent
more than any other region.139 Improvements in technology are
lowering the cost of sending remittances by introducing cost
effective online and mobile money transfer systems.
In Sub-Saharan Africa, the number of individuals turning to
digital transfer services has increased, particularly in
Uganda. By September 2015, the Bank of Uganda claimed
that the number of registered mobile account holders had
reached 19.8 million.140 According to surveys of 3,000
Ugandans, nearly four times as many Ugandan adults
exclusively use mobile banking than exclusively use active
bank accounts. In the same study in Kenya, only 27 percent
owned a bank account. Nearly 3 out of 4 had a mobile phone
and 68 percent of all surveyed had a mobile money
account.141 The rise of mobile services such as Western
Union’s Mobile Money Transfer provides new ways to
transfer without directly accessing service offices.
R E M I T TA N C E S F R O M D A C D O N O R C O U N T R I E S T O D E V E L O P I N G C O U N T R I E S
As seen in Figure 7, total remittances from the OECD’s 28
DAC donor countries to developing countries amounted to
an estimated $211 billion in 2014. Of all remittances sent, the
East Asia and Pacific region received the largest portion (34
percent) followed by Latin America and the Caribbean (27
percent), South Asia (15 percent), the Middle East and
Northern Africa (10 percent), Sub-Saharan Africa (9 percent),
and Europe and Central Asia (6 percent). China, Mexico,
India, the Philippines, and Nigeria continue to be the largest
recipients of remittance flows from DAC donor countries.142
The U.S. remains the most favorable destination, with an
estimated 47 million migrants—nearly a fifth of the world’s
total.143 Remittances from the U.S. amounted to $108.7
billion, nearly half of the total remittances sent to developing
countries by DAC donors. Countries in the Latin American
and Caribbean region remain the largest recipients of U.S.
remittances, receiving $48.6 billion in 2014. Mexico accounts
for nearly half of this value, receiving $24 billion. China and
India are the next largest recipients, receiving $15.8 billion
and $11.2 billion, respectively. After Latin America and the
Caribbean, East Asia and the Pacific received the most with
$34.4 billion, followed by South Asia ($13.2 billion),
( F I G U R E 7 )R E M I T TA N C E S F R O M D A C D O N O R C O U N T R I E S A N D N O N - D A C D O N O R C O U N T R I E S T O D E V E L O P I N G C O U N T R I E S , 2 0 1 4 ( U S D M I L L I O N S ) 1 4 4
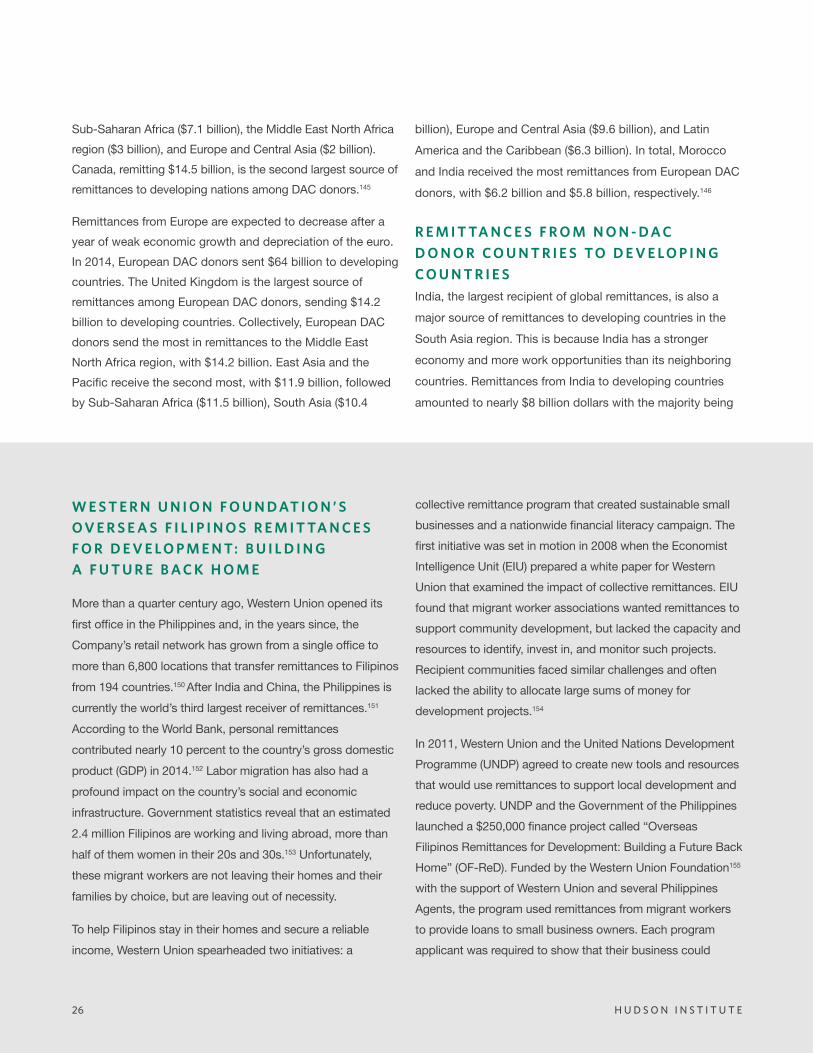
H U D S O N I N S T I T U T E26
W E S T E R N U N I O N F O U N D AT I O N ’ S O V E R S E A S F I L I P I N O S R E M I T TA N C E S F O R D E V E L O P M E N T: B U I L D I N G A F U T U R E B A C K H O M E
More than a quarter century ago, Western Union opened its
first office in the Philippines and, in the years since, the
Company’s retail network has grown from a single office to
more than 6,800 locations that transfer remittances to Filipinos
from 194 countries.150 After India and China, the Philippines is
currently the world’s third largest receiver of remittances.151
According to the World Bank, personal remittances
contributed nearly 10 percent to the country’s gross domestic
product (GDP) in 2014.152 Labor migration has also had a
profound impact on the country’s social and economic
infrastructure. Government statistics reveal that an estimated
2.4 million Filipinos are working and living abroad, more than
half of them women in their 20s and 30s.153 Unfortunately,
these migrant workers are not leaving their homes and their
families by choice, but are leaving out of necessity.
To help Filipinos stay in their homes and secure a reliable
income, Western Union spearheaded two initiatives: a
collective remittance program that created sustainable small
businesses and a nationwide financial literacy campaign. The
first initiative was set in motion in 2008 when the Economist
Intelligence Unit (EIU) prepared a white paper for Western
Union that examined the impact of collective remittances. EIU
found that migrant worker associations wanted remittances to
support community development, but lacked the capacity and
resources to identify, invest in, and monitor such projects.
Recipient communities faced similar challenges and often
lacked the ability to allocate large sums of money for
development projects.154
In 2011, Western Union and the United Nations Development
Programme (UNDP) agreed to create new tools and resources
that would use remittances to support local development and
reduce poverty. UNDP and the Government of the Philippines
launched a $250,000 finance project called “Overseas
Filipinos Remittances for Development: Building a Future Back
Home” (OF-ReD). Funded by the Western Union Foundation155
with the support of Western Union and several Philippines
Agents, the program used remittances from migrant workers
to provide loans to small business owners. Each program
applicant was required to show that their business could
H U D S O N I N S T I T U T E26
Sub-Saharan Africa ($7.1 billion), the Middle East North Africa
region ($3 billion), and Europe and Central Asia ($2 billion).
Canada, remitting $14.5 billion, is the second largest source of
remittances to developing nations among DAC donors.145
Remittances from Europe are expected to decrease after a
year of weak economic growth and depreciation of the euro.
In 2014, European DAC donors sent $64 billion to developing
countries. The United Kingdom is the largest source of
remittances among European DAC donors, sending $14.2
billion to developing countries. Collectively, European DAC
donors send the most in remittances to the Middle East
North Africa region, with $14.2 billion. East Asia and the
Pacific receive the second most, with $11.9 billion, followed
by Sub-Saharan Africa ($11.5 billion), South Asia ($10.4
billion), Europe and Central Asia ($9.6 billion), and Latin
America and the Caribbean ($6.3 billion). In total, Morocco
and India received the most remittances from European DAC
donors, with $6.2 billion and $5.8 billion, respectively.146
R E M I T TA N C E S F R O M N O N - D A C D O N O R C O U N T R I E S T O D E V E L O P I N G C O U N T R I E S India, the largest recipient of global remittances, is also a
major source of remittances to developing countries in the
South Asia region. This is because India has a stronger
economy and more work opportunities than its neighboring
countries. Remittances from India to developing countries
amounted to nearly $8 billion dollars with the majority being
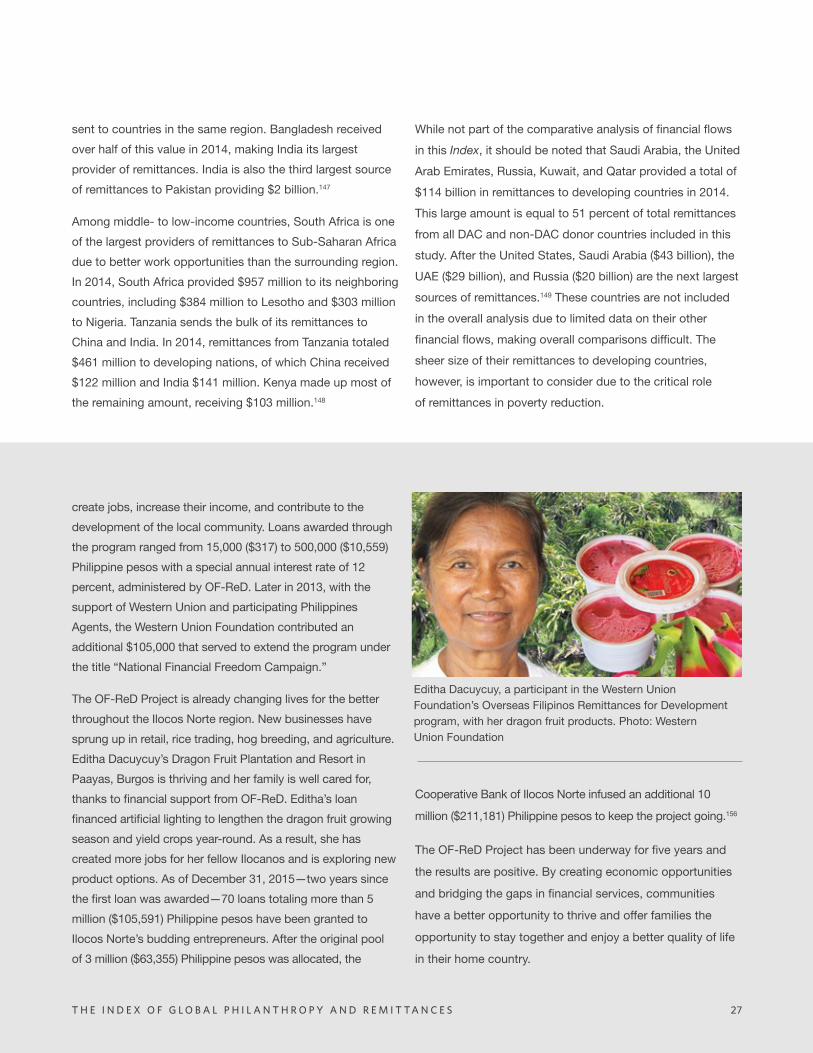
T H E I N D E X O F G L O B A L P H I L A N T H R O P Y A N D R E M I T TA N C E S 27
Editha Dacuycuy, a participant in the Western Union Foundation’s Overseas Filipinos Remittances for Development program, with her dragon fruit products. Photo: Western Union Foundation
create jobs, increase their income, and contribute to the
development of the local community. Loans awarded through
the program ranged from 15,000 ($317) to 500,000 ($10,559)
Philippine pesos with a special annual interest rate of 12
percent, administered by OF-ReD. Later in 2013, with the
support of Western Union and participating Philippines
Agents, the Western Union Foundation contributed an
additional $105,000 that served to extend the program under
the title “National Financial Freedom Campaign.”
The OF-ReD Project is already changing lives for the better
throughout the Ilocos Norte region. New businesses have
sprung up in retail, rice trading, hog breeding, and agriculture.
Editha Dacuycuy’s Dragon Fruit Plantation and Resort in
Paayas, Burgos is thriving and her family is well cared for,
thanks to financial support from OF-ReD. Editha’s loan
financed artificial lighting to lengthen the dragon fruit growing
season and yield crops year-round. As a result, she has
created more jobs for her fellow Ilocanos and is exploring new
product options. As of December 31, 2015—two years since
the first loan was awarded—70 loans totaling more than 5
million ($105,591) Philippine pesos have been granted to
Ilocos Norte’s budding entrepreneurs. After the original pool
of 3 million ($63,355) Philippine pesos was allocated, the
Cooperative Bank of Ilocos Norte infused an additional 10
million ($211,181) Philippine pesos to keep the project going.156
The OF-ReD Project has been underway for five years and
the results are positive. By creating economic opportunities
and bridging the gaps in financial services, communities
have a better opportunity to thrive and offer families the
opportunity to stay together and enjoy a better quality of life
in their home country.
sent to countries in the same region. Bangladesh received
over half of this value in 2014, making India its largest
provider of remittances. India is also the third largest source
of remittances to Pakistan providing $2 billion.147
Among middle- to low-income countries, South Africa is one
of the largest providers of remittances to Sub-Saharan Africa
due to better work opportunities than the surrounding region.
In 2014, South Africa provided $957 million to its neighboring
countries, including $384 million to Lesotho and $303 million
to Nigeria. Tanzania sends the bulk of its remittances to
China and India. In 2014, remittances from Tanzania totaled
$461 million to developing nations, of which China received
$122 million and India $141 million. Kenya made up most of
the remaining amount, receiving $103 million.148
While not part of the comparative analysis of financial flows
in this Index, it should be noted that Saudi Arabia, the United
Arab Emirates, Russia, Kuwait, and Qatar provided a total of
$114 billion in remittances to developing countries in 2014.
This large amount is equal to 51 percent of total remittances
from all DAC and non-DAC donor countries included in this
study. After the United States, Saudi Arabia ($43 billion), the
UAE ($29 billion), and Russia ($20 billion) are the next largest
sources of remittances.149 These countries are not included
in the overall analysis due to limited data on their other
financial flows, making overall comparisons difficult. The
sheer size of their remittances to developing countries,
however, is important to consider due to the critical role
of remittances in poverty reduction.
T H E I N D E X O F G L O B A L P H I L A N T H R O P Y A N D R E M I T TA N C E S 27
H U D S O N I N S T I T U T E28
OECD and the international community at large have focused on official flows when making cross-country comparisons. Figure 1 shows net ODA from each country, and Figure 2 shows ODA as a percentage of countries’ GNI. The vast majority of countries do not reach the
0.7 percent target for ODA set by the Pearson Commission in 1969 and still supported by some countries.
THE
CONCLUDING REMARKS
Since ODA is now an incomplete measure of what a country
gives to the developing world, it is more useful to compare
donors on the basis of all financial giving—ODA,
philanthropy, and remittances. Figures 8 and 9 give a more
comprehensive picture of the generosity of DAC donor
countries by combining their ODA, philanthropy, and
remittances to developing countries and measuring the total
as a percentage of GNI.
As shown in Figure 8, in the case of the United States, its
ODA of $33 billion, makes up the smallest portion of total
U.S. giving. Private philanthropy provides $44 billion in
giving, and remittances account for $109 billion. Together,
these two sources dwarf ODA. The $33 billion in ODA from
the U.S. makes up 24 percent of the DAC total, but when all
flows of financial aid are considered, the $186 billion
provided by the U.S. makes up 45 percent of total assistance
from all DAC countries. After the U.S., the largest
contributors of total assistance are the United Kingdom,
Germany, France, and Canada.
As shown in Figure 9, comparing total assistance as a
percentage of GNI changes the order of top donors when
only a country’s ODA is considered. The United Kingdom,
ranked 5th when only ODA is measured, moves up to 2nd
place when total assistance is considered. Canada ranked
16th when measured by only ODA, but moves up to 6th place
when total assistance flows are considered. New Zealand
made one of the largest leaps, moving from 15th to 3rd place.
The United States also improved its position, moving from
18th to 8th place. When only ODA is used to measure a
nation’s contributions relative to its GNI, only five countries
reach the target of 0.7 percent. When philanthropy and
remittances are included, however, 17 countries pass the mark.
In 2002, the Center for Global Prosperity began to measure
private giving more comprehensively to provide a broader
view of the total financial assistance provided by DAC donor
countries. Our work, conducted with leading research
institutions such as the Urban Institute’s Center on
Nonprofits and Philanthropy and the Foundation Center,
identified significantly larger numbers in private philanthropy
than what countries report to the OECD. In the United
States, the government is aware of the inadequacies of the
private giving numbers that it reports and has acknowledged,
in publications and official presentations, the more in-depth
numbers provided by CGP’s research network. Figures 8 and 9
demonstrate the changed world of development assistance in
which private flows play a larger and more central role. Private
flows exceed ODA and reflect the diverse scene of international
development assistance in which corporations, non-profits,
churches, universities, families, and individuals are contributing
to relief and development efforts around the world.
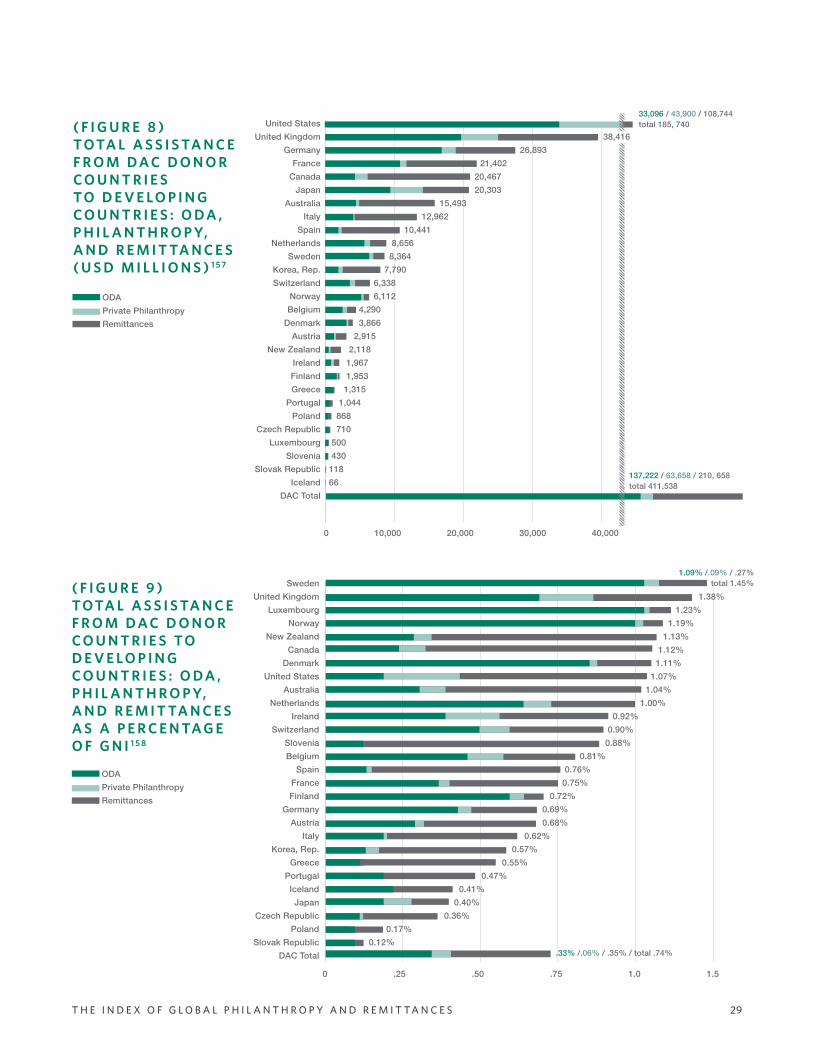
T H E I N D E X O F G L O B A L P H I L A N T H R O P Y A N D R E M I T TA N C E S 29
United StatesUnited Kingdom
GermanyFrance
CanadaJapan
AustraliaItaly
SpainNetherlands
SwedenKorea, Rep.Switzerland
NorwayBelgium
DenmarkAustria
New ZealandIrelandFinlandGreece
PortugalPoland
Czech RepublicLuxembourg
SloveniaSlovak Republic
IcelandDAC Total
( F I G U R E 8 )T O TA L A S S I S TA N C E F R O M D A C D O N O R C O U N T R I E S T O D E V E L O P I N G C O U N T R I E S : O D A , P H I L A N T H R O P Y, A N D R E M I T TA N C E S ( U S D M I L L I O N S ) 1 5 7
ODA Private PhilanthropyRemittances
137,222 / 63,658 / 210, 658total 411,538
( F I G U R E 9 ) T O TA L A S S I S TA N C E F R O M D A C D O N O R C O U N T R I E S T O D E V E L O P I N G C O U N T R I E S : O D A , P H I L A N T H R O P Y, A N D R E M I T TA N C E S A S A P E R C E N TA G E O F G N I 1 5 8
ODA Private PhilanthropyRemittances
SwedenUnited Kingdom
LuxembourgNorway
New ZealandCanada
DenmarkUnited States
AustraliaNetherlands
IrelandSwitzerland
SloveniaBelgium
SpainFranceFinland
GermanyAustria
ItalyKorea, Rep.
GreecePortugalIceland
JapanCzech Republic
PolandSlovak Republic
DAC Total
0 .25 .50 .75 1.0 1.5
33,096 / 43,900 / 108,744total 185, 740
38,416 26,893 21,402 20,467 20,303 15,493 12,962 10,441 8,656 8,364 7,790 6,338 6,112 4,290 3,866 2,915 2,118 1,967 1,953 1,315 1,044 868 710 500 430 118 66
0 10,000 20,000 30,000 40,000
1.09% /.09% / .27% total 1.45%
.33% /.06% / .35% / total .74%
1.38% 1.23% 1.19% 1.13% 1.12% 1.11% 1.07% 1.04% 1.00% 0.92% 0.90% 0.88% 0.81% 0.76% 0.75% 0.72% 0.69% 0.68% 0.62% 0.57% 0.55% 0.47% 0.41% 0.40% 0.36% 0.17% 0.12%
H U D S O N I N S T I T U T E30
1 Internal calculations (see methodology pages 34-43) based on data from: Organization for Economic Co-Operation and Development, “Statistics on Resource Flows to Developing Countries: Table 13: Comparison of Flows by Type,” OECD, 22 December 2015, http://www.oecd.org/dac/stats/statisticsonre-sourceflowstodevelopingcountries.htm; Organization for Economic Co-Operation and Development, “Development finance of countries beyond the DAC,” OECD, February 2016, http://www.oecd.org/dac/dac-glob-al-relations/non-dac-reporting.htm; International Monetary Fund, “Coordinated Direct Investment Survey Table 2-o: Outward Direct Investment Positions” IMF, 8 December 2015, http://data.imf.org/regular.as-px-?key=60564261; International Monetary Fund, “IMF Coordinated Portfolio Investment Survey Table 1: Total Portfolio Investment,” IMF, 3 May 2016, http://data.imf.org/regular.aspx?key=60587804; Organization for Economic Co-Operation and Development, “Development finance of countries beyond the DAC,” OECD, February 2016, http://www.oecd.org/dac/dac-global-relations/non-dac-reporting.htm. World Bank,“Bilateral Remittance Matrix 2014,” World Bank, October 2015; International Monetary Fund, “Coordinated Direct Investment Survey Table 3-I: Inward Direct Investment Positions,” IMF, December 2015, http://data.imf.org/regular.aspx?key=60564262.
2 Ibid.
3 Organization for Economic Co-Operation and Development, “Statistics on Resource Flows to Developing Countries: Table 1: DAC Members’ Net Official Development Assistance in 2014,” OECD, 22 December 2015, http://www.oecd.org/dac/stats/ statisticsonresourceflowstodevelopingcoun-tries.htm.
4 Organization for Economic Co-Operation and Development, “Statistics on Resource Flows to Developing Countries: Table 25: ODA Receipts and Selected Indicators for Developing Countries and Territories,” OECD, 22 December 2015, http://www.oecd.org/dac/stats/statisticsonresourceflowstodevel-opingcountries.htm.
5 Ibid.
6 United Nations Office for the Coordination of Humanitarian Affairs, “About the Crisis,” UNOCHA, Accessed: 14 March 2016, http://www.unocha.org/syrian-arab-republic/syria-country-profile/about-crisis.
7 Amnesty International, “Syria’s refugee crisis in numbers,” Amnesty International, 3
February 2016, https://www.amnesty.org/en/latest/news/2016/02/syrias-refugee-cri-sis-in-numbers/.
8 Organization for Economic Co-Operation and Development, “Statistics on Resource Flows to Developing Countries: Table 1: DAC Members’ Net Official Development Assistance in 2014,” OECD, 22 December 2015, http://www.oecd.org/dac/stats/ statisticsonresourceflowstodevelopingcoun- tries.htm; Organization for Economic Co-Operation and Development, “Develop-ment finance of countries beyond the DAC,” OECD, February 2016, http://www.oecd.org/dac/dac-glob-al-relations/non-dac-reporting.htm; United Nations Financial Tracking Service, “Donor Profile: Uganda/Tanzania/Kenya” UNFTS, 22 July 2016, https://fts.unocha.org/reports/daily/ocha_Rdonor6_DC220_ Y2010___1607071721.pdf.
9 Ibid.
10 Organization for Economic Co-Operation and Development, “Statistics on Resource Flows to Developing Countries: Table 13: Compari-son of Flows by Type,” OECD, 22 December 2015, http://www.oecd.org/dac/stats/statisticsonresourceflowstodevelopingcoun-tries.htm.
11 Organization for Economic Co-Operation and Development, “Statistics on Resource Flows to Developing Countries: Table 28: Regional Distribution of ODA by Individual DAC Donors,” OECD, 22 December 2015, http://www.oecd.org/dac/stats/statisticsonre-sourceflowstodevelopingcountries.htm; Organization for Economic Co-Operation and Development, “Statistics on Resource Flows to Developing Countries: Table 26: Distribu-tion of ODA by Income Group,” OECD, 22 December 2015, http://www.oecd.org/dac/stats/statisticsonresourceflowstodeveloping-countries.htm.
12 See Methodology Page 34-37
13 See Methodology Page 43
14 See Methodology Page 37-41
15 See Methodology Page 43
16 See Methodology Page 37-41
17 See Methodology Page 43
18 Organization for Economic Co-Operation and Development, “Statistics on Resource Flows to Developing Countries: Table 13: Compari-son of Flows by Type in 2014,” OECD, 22 December 2015, http://www.oecd.org/dac/stats/statisticsonresourceflowstodeveloping-countries.htm.
19 See Methodology Page 43, World Bank, “Bilateral Remittance Matrix 2014,” World Bank, October 2015, http://www.worldbank.org/en/topic/migrationremittancesdiasporais-sues/brief/migration-remittances-data; Organization for Economic Co-Operation and Development, “Statistics on Resource Flows to Developing Countries: Table 13: Compari-son of Flows by Type in 2014,” OECD, 22 December 2015, http://www.oecd.org/dac/stats/statisticsonresourceflowstodeveloping-countries.htm.
20 Jodi Kantor, Catrin Einhorn, “Refugees Encounter a Foreign Word: Welcome,” The New York Times, 30 June 2016.
21 Ibid.
22 Matin Turcotte, “Volunteering and Charitable Giving in Canada,” Statistics Canada, 15 April 2016, http://www.statcan.gc.ca/pub/89-652-x/89-652-x2015001-eng.htm#a7.
23 See Methodology Page 38
24 Extractive Sector Transparency Measures Act, Statutes of Canada 2014, c. 39, s. 376. http://laws-lois.justice.gc.ca/eng/acts/E-22.7/page-1.html.
25 Canadian Lutheran World Relief, “2014-2015 Annual Report,” CLWR, 30 March 2016, http://www.clwr.org/What-We-Do/documents/AnnualReport2015.pdf.
26 Manitoba Council for International Cooperation, “International Projects: Canadian Lutheran World Relief,” MCIC, http://mcic.ca/projects/member/canadian- lutheran-world-relief.
27 Lutheran World Federation, “Project Overview,” LWF, https://ethiopia.lutheran-world.org/content/projects-ethiopia; Canadian Lutheran World Relief, “Growing Produce and Prosperity,” Partnership (Winnipeg: Canadian Lutheran World Relief, Spring 2013) http://www.clwr.org/Get-In-volved/documents/PartnershipSpring2013FI-NAL2.pdf
28 Canadian Lutheran World Relief, “Sudanese refugees receive hope and comfort from Canadian Lutherans,” CLWR, 12 March 2013, http://www.clwr.org/News/news-brief.cfm?news_id=292.
29 Canadian Lutheran World Relief, “Update: your support for South Sudanese refugees,” CLWR, 6 May 2014, http://www.clwr.org/News/news-brief.cfm?news_id=372.
30 St. Peters Evangelical Lutheran Church, “CLWR We Care Kits,” St. Peters Evangelical Lutheran Church, 17 November 2015,
ENDNOTES
T H E I N D E X O F G L O B A L P H I L A N T H R O P Y A N D R E M I T TA N C E S 31
http://www.stpetersottawa.ca/2015/11/17/clwr-we-care-kits/.
31 Organizations for Economic Co-Operation and Development, “Statistics on Resource Flows to Developing Countries: Table 33a: Estimates of Gross Concessional Flows for Development Co-Operation (“ODA-like” flows) from OECD Key Partners,” OECD, 22 December 2015, http://www.oecd.org/dac/stats/statisticsonresourceflowstodeveloping-countries.htm
32 See Methodology Page 41-43
33 Organization for Economic Co-Operation and Development, “Development finance of countries beyond the DAC,” OECD, February 2016, http://www.oecd.org/dac/dac-glob-al-relations/non-dac-reporting.htm.
34 See Methodology Page 43, International Monetary Fund, “Coordinated Direct Investment Survey Table 2-o: Outward Direct Investment Positions” IMF, 8 December 2015, http://data.imf.org/regular.aspx-?key=60564261; International Monetary Fund, “IMF Coordinated Portfolio Investment Survey Table 1: Total Portfolio Investment,” IMF, 3 May 2016, http://data.imf.org/regular.aspx?key=60587804; Organization for Economic Co-Operation and Development, “Development finance of countries beyond the DAC,” OECD, February 2016, http://www.oecd.org/dac/dac-global-relations/non-dac-reporting.htm.
35 Charities Aid Foundation, World Giving Index 2015 (London: CAF, November 2015).
36 “Brazil’s Crisis: Irredeemable?” The Economist, 30 December 2015, http://www.economist.com/news/briefing/21684778-for-mer-star-emerging-world-faces-lost-decade-irredeemable.
37 Grupo de Institutos Fundaçõe e Empresesas, “Culturas da doação’ será tema de destaque no Congresso GIFE,” GIFE, 15 February 2016, http://gife.org.br/2016/02/15/culturas-da-doacao-sera-tema-de-des-taque-no-congresso-gife/.
38 Grupo de Institutos Fundaçõe e Empresesas, “Funding of civil society organizations is central to strengthening the field,” GIFE, 11 March 2016.
39 Organization for Economic Co-Operation and Development, “Development finance of countries beyond the DAC,” OECD, February 2016, http://www.oecd.org/dac/dac-glob-al-relations/non-dac-reporting.htm.
40 See Methodology Page 43, World Bank, “Bilateral Remittance Matrix 2014,” World Bank, October 2015; International Monetary Fund, “Coordinated Direct Investment Survey Table 3-I: Inward Direct Investment Positions,” IMF, December 2015, http://data.imf.org/regular.aspx?key=60564262.
41 Jeremy Page, “China to Create $1 Billion Fund to Support UN,” Wall Street Journal, 28
September 2015, http://www.wsj.com/articles/china-to-create-1-billion-fund-to-sup-port-u-n-1443463394.
42 “Chinese Investment in Africa: Not as easy as it looks” The Economist, 21 November 2015, http://www.economist.com/news/middle-east-and-africa/21678777-western-worries-about-chinas-burgeoning-influence-afri-ca-may-be-overblown-not.
43 Ibid.
44 Alan Taylor, “Nepal’s Earthquakes: One Year Later,” The Atlantic, 25 April 2016, http://www.theatlantic.com/photo/2016/04/nepals-earthquakes-one-year-later/479772/.
45 BBC, “Nepal Earthquakes: Devastation in Maps and Images,” BBC Asia, 15 May 2015, http://www.bbc.com/news/world-asia-32479909.
46 Han Ximin, “Charity Organizations Raise Funds for Quake-hit Regions,” Shenzhen Daily, 28 April 2015, http://www.szdaily.com/content/2015-04/28/content_11519239.htm.
47 Han Ximin, “Quake Aid Response Initiated,” Shenzhen Daily, 27 April 2015, http://szdaily.sznews.com/html/2015-04/27/con-tent_3207829.htm.
48 Ibid.
49 Caixia Wu and Chen Wu, “Jet Li’s One Foundation Turns into Independent Public Fund-raising Organization,” Xinhua, 12 January 2011, http://news.xinhuanet.com/english2010/china/2011-01/12/c_13687548.htm.
50 Jet Li, “Jet Li Explains Why He Started A Foundation,” Newsweek, 26 September 2008, http://www.newsweek.com/jet-li-explains-why-he-started-foundation-89273.
51 Ibid.
52 Shenzhen One Foundation, “One Foundation Home,” 壹基金官方网站-壹基金, Accessed: 1 June 2016, http://www.onefoundation.cn/
53 “Enter the Chinese NGO,” The Economist, 12 April 2014, http://www.economist.com/news/leaders/21600683-communist-party-giv-ing-more-freedom-revolutionary-idea-en-ter-chinese-ngo.
54 Organization for Economic Co-Operation and Development, “Development finance of countries beyond the DAC,” OECD, February 2016, http://www.oecd.org/dac/dac-glob-al-relations/non-dac-reporting.htm.
55 See Methodology Page 43, World Bank, “Bilateral Remittance Matrix 2014,” World Bank, October 2015
56 See Methodology Page 43, International Monetary Fund, “Coordinated Direct Investment Survey Table 2-o: Outward Direct Investment Positions” IMF, 8 December 2015, http://data.imf.org/regular.aspx-?key=60564261; International Monetary Fund,
“IMF Coordinated Portfolio Investment Survey Table 1: Total Portfolio Investment,” IMF, 3 May 2016, http://data.imf.org/regular.aspx?key=60587804;
57 The International Center for Not-For-Profit Law, “NGO Law Monitor: Colombia,” ICNL, June 2016, http://www.icnl.org/research/monitor/colombia.html.
58 Ibid.
59 See Methodology Page 41-42
60 See Methodology Page 42, Organization for Economic Co-Operation and Development (OECD) “Development finance of countries beyond the DAC,” OECD, February 2016.
61 See Methodology Page 43, World Bank, “Bilateral Remittance Matrix 2014,” World Bank, October 2015; International Monetary Fund, “Coordinated Direct Investment Survey Table 2-o: Outward Direct Investment Positions” IMF, 8 December 2015, http://data.imf.org/regular.aspx?key=60564261; International Monetary Fund, “IMF Coordinat-ed Portfolio Investment Survey Table 1: Total Portfolio Investment,” IMF, 3 May 2016, http://data.imf.org/regular.aspx?key=60587804
62 Arpan Shieth, Dinkar Ayilavarapu, Anant Bhagwati, India Philanthropy Report 2015: Accelerating the next philanthropic wave (Mumbai, India: Bain & Company, 21 March 2015), 8.
63 Ibid., 9.
64 Ibid., 11.
65 The International Center for Not-For-Profit Law, “NGO Law Monitor: India,” ICNL, January 2016, http://www.icnl.org/research/monitor/India.html.
66 Esha Chhabra, “Corporate Social Responsi-bility: Should it be a Law?” Forbes, 18 April 2014, http://www.forbes.com/sites/eshachhabra/2014/04/18/corporate-social-re-sponsibility-should-it-be-a-law/#d37070c79849
67 Hudson Institute, The Index of Global Philanthropy and Remittances 2013 (Washington, DC: Hudson Institute, 15 November 2013).
68 See Methodology Page 43, Organization for Economic Co-Operation and Development, “Development Finance of Countries Beyond the DAC,” OECD, February 2016.
69 See Methodology Page 43, World Bank, “Bilateral Remittance Matrix 2014,” World Bank, October 2015, http://www.worldbank.org/en/topic/migrationremittancesdiasporais-sues/brief/migration-remittances-data; International Monetary Fund, “Coordinated Direct Investment Survey Table 2-o: Outward Direct Investment Positions” IMF, 8 December 2015, http://data.imf.org/regular.aspx?key=60564261; International Monetary Fund, “IMF Coordinated Portfolio Investment Survey Table 1: Total Portfolio Investment,”
H U D S O N I N S T I T U T E32
IMF, 3 May 2016, http://data.imf.org/regular.aspx?key=60587804;
70 The International Center for Not-For-Profit Law, “NGO Law Monitor: Indonesia,” ICNL, 16 November 2015, http://www.icnl.org/research/monitor/indonesia.html.
71 Constance Johnson, “Indonesia: Law on Mass Organizations,” The Law Library of Con-gress, 11 July 2013, http://www.loc.gov/law/foreign-news/article/indone-sia-law-on-mass-organizations/.
72 Human Rights Watch, “Indonesia: Amend Law on Mass Organization,” HRW, 17 July 2014, https://www.hrw.org/news/2013/07/17/indonesia-amend-law-mass-organizations.
73 The International Center for Not-For-Profit Law, “NGO Law Monitor: Indonesia,” ICNL, 16 November 2015, http://www.icnl.org/research/monitor/indonesia.html.
74 Ibid.
75 See Methodology Page 42
76 See Methodology Page 42, United Nations Financial Tracking Service, “Donor Profile: Kenya in 2013,” UNFTS, 21 July 2016, https://fts.unocha.org/reports/daily/ocha_Rdonor6_DC110_Y2013___1607060231.pdf.
77 See Methodology Page 43, World Bank, “Bilateral Remittance Matrix 2014,” World Bank, October 2015, http://www.worldbank.org/en/topic/migrationremittancesdiasporais-sues/brief/migration-remittances-data; International Monetary Fund, “Coordinated Direct Investment Survey Table 2-o: Outward Direct Investment Positions” IMF, 8 December 2015, http://data.imf.org/regular.aspx?key=60564261.
78 The International Center for Not-For-Profit Law, “NGO Law Monitor: Kenya,” ICNL, May 2016, http://www.icnl.org/research/monitor/turkey.html.
79 Mark P. Lagon, “When Civil Society is Attacked, Kenya’s Democracy is Imperiled,” Freedom House, 8 January 2016,https://freedomhouse.org/blog/when-civil-society-at-tacked-kenya-s-democracy-imperiled.
80 Ibid.
81 See Methodology Page 42
82 Organization for Economic Co-Operation and Development, “Development finance of countries beyond the DAC,” OECD, February 2016.
83 See Methodology Page 43, World Bank, “Bilateral Remittance Matrix 2014,” World Bank, October 2015, http://www.worldbank.org/en/topic/migrationremittancesdiasporais-sues/brief/migration-remittances-data; International Monetary Fund, “Coordinated Direct Investment Survey Table 2-o: Outward Direct Investment Positions” IMF, 8 December
2015, http://data.imf.org/regular.aspx-?key=60564261; International Monetary Fund, “IMF Coordinated Portfolio Investment Survey Table 1: Total Portfolio Investment,” IMF, 3 May 2016, http://data.imf.org/regular.aspx?key=60587804;
84 Consuelo Castro, “The Index of Philanthropic Freedom 2015: Mexico Country Report” Center for Global Prosperity, 15 June 2015, https://s3.amazonaws.com/media.hudson.org/files/publications/2015.Index.of.Philanthropic.Freedom.Tanzania.pdf.
85 “Mexico and its NGOs: The new movers and shakers,” The Economist, 2 May 2015, http://www.economist.com/news/ameri-cas/21650136-they-dont-wear-balaclavas-or-wave-banners-they-are-bringing-about-change-new-movers-and.
86 Ibid.
87 Consuelo Castro, “The Index of Philanthropic Freedom 2015: Mexico Country Report” Center for Global Prosperity, 15 June 2015, https://s3.amazonaws.com/media.hudson.org/files/publications/2015.Index.of.Philanthropic.Freedom.Tanzania.pdf.
88 See Methodology Page 42
89 See Methodology Page 42, Organization for Economic Co-Operation and Development, “Development finance of countries beyond the DAC,” OECD, February 2016.
90 See Methodology Page 43, World Bank, “Bilateral Remittance Matrix 2014,” World Bank, October 2015, http://www.worldbank.org/en/topic/migrationremittancesdiasporais-sues/brief/migration-remittances-data; International Monetary Fund, “Coordinated Direct Investment Survey Table 2-o: Outward Direct Investment Positions” IMF, 8 December 2015, http://data.imf.org/regular.aspx-?key=60564261; International Monetary Fund, “IMF Coordinated Portfolio Investment Survey Table 1: Total Portfolio Investment,” IMF, 3 May 2016, http://data.imf.org/regular.aspx?key=60587804;
91 Mertech Co, “Our History,” Mertech, 24 March 2016, http://www.mertech.co.za/about.html.
92 Mertech Co, “Portfolio: Mertech Invest-ments,” Mertech, 24 March 2016, http://www.mertech.co.za/mertech-investments.html.
93 Gold Agency, “Internal Reports,” Gold Agency, 2016.
94 Ibid.
95 Gold Agency, “Our Story,” Gold Agency, 3 June 2016, http://www.goldpe.org.za/about-us/history/.
96 Nedbank Private Wealth, The Giving Report II: A Survey on the Giving Practices of High Net Worth Individuals in South Africa (South Africa: Nedbank Limited, 2012) https://www.
nedbankprivatewealth.com/south-africa/the-giving-report-II.
97 Republic of South Africa Department of Social Development, “The State of NPO Registration in South Africa: A Report from the National NPO Database,” South African Department of Social Development, July 2009, http://www.dsd.gov.za/npo/index2.php?option=com_docman&task=doc_view&gid=69&Itemid=39
98 See Methodology Page 42
99 See Methodology Page 43, United Nations Financial Tracking Service, “Donor Profile: Tanzania in 2012,” UNFTS, 22 July 2016, https://fts.unocha.org/reports/daily/ocha_Rdonor6_DC209_Y2012___1607071636.pdf.
100 See Methodology Page 43, World Bank, “Bilateral Remittance Matrix 2014,” World Bank, October 2015, http://www.worldbank.org/en/topic/migrationremittancesdiasporais-sues/brief/migration-remittances-data; International Monetary Fund, “Coordinated Direct Investment Survey Table 2-o: Outward Direct Investment Positions” IMF, 8 December 2015, http://data.imf.org/regular.aspx-?key=60564261.
101 Nontsikelelo Nzula, Brian Kagaro, “The Index of Philanthropic Freedom 2015: Tanzania Country Report,” Center for Global Prosperity, 15 June 2015, https://s3.amazonaws.com/media.hudson.org/files/publications/2015.Index.of.Philanthropic.Freedom.Tanzania.pdf.
102 Ibid.
103 Ibid.
104 See Methodology Page 43
105 WomenCraft Social Enterprise, “About,” WomenCraft, 2016, http://womencraft.org/about/.
106 WomenCraft Social Enterprise, “Artisans,” WomenCraft, http://womencraft.org/artisans/.
107 Ibid.
108 Diocese of Kagera, “WomenCraft,” Diocese of Kagera, http://www.kageradiocese.info/kagera/index.php/poverty-alleviation/womencraft
109 WomenCraft Social Enterprise, “Involve,” WomenCraft, http://womencraft.org/involve/.
110 WomenCraft Social Enterprise, “Artisans,” WomenCraft, http://womencraft.org/artisans/.
111 WomenCraft, “About,” WomenCraft Social Enterprise, http://womencraft.org/about/.
112 Toplum Gönüllüleri Vakfı, “About Us,” Toplum Gönüllüleri Vakfı, 16 February 2016, http://www.tog.org.tr/tr/hakkimizda.
113 Toplum Gönüllüleri Vakfı, “International Facilities,” Toplum Gönüllüleri Vakfı, 16 February 2016, http://www.tog.org.tr/tr/calismalarimiz/uluslararasi-imkanlar.
T H E I N D E X O F G L O B A L P H I L A N T H R O P Y A N D R E M I T TA N C E S 33
114 Toplum Gönüllüleri Vakfı, “2014 Activity Report,” Community Volunteers Foundation, 18 February 2016, http://www.tog.org.tr/tr/hakkimizda/belge-ve-raporlar.
115 Siranuysh Gevorgyan, “Bridge of Benevo-lence: Young Armenians and Turks Building Ties Through A Civil Society Project,” ArmeniaNow.com, 29 October 2009, https://www.armenianow.com/news/10734/bridge_of_benevolence_young_armeni
116 Toplum Gönüllüleri Vakfı, “2014 Activity Report” Toplum Gönüllüleri Vakfı, 18 February 2016, http://www.tog.org.tr/tr/hakkimizda/belge-ve-raporlar.
117 Ibid., Based on exchange rate in December 2014 of 0.4354.
118 Organization for Economic Co-Operation and Development, “Development finance of countries beyond the DAC,” OECD, February 2016.
119 See Methodology Page 43, World Bank, “Bilateral Remittance Matrix 2014,” World Bank, October 2015, http://www.worldbank.org/en/topic/migrationremittancesdiasporais-sues/brief/migration-remittances-data; International Monetary Fund, “Coordinated Direct Investment Survey Table 2-o: Outward Direct Investment Positions” IMF, 8 December 2015, http://data.imf.org/regular.aspx?key=60564261; International Monetary Fund, “IMF Coordinated Portfolio Investment Survey Table 1: Total Portfolio Investment,” IMF, 3 May 2016, http://data.imf.org/regular.aspx?key=60587804;
120 United Nations High Commissioner for Refugees, “2015 UNHCR Country Operations Profile – Turkey,” UNHCR, http://www.unhcr.org/pages/49e48e0fa7f.html
121 Turkish Prime Ministry Directorate General of Foundations, “Distribution of Foundations by Year and Geographic Location,” Directorate General of Foundations, 13 July 2016, http://www.vgm.gov.tr/db/dosyalar/webicerik193.pdf
122 The International Center for Not-For-Profit Law, “NGO Law Monitor: Turkey,” ICNL, December 2015, http://www.icnl.org/research/monitor/turkey.html
123 United Nations Financial Tracking Service, “Donor Profile: Uganda in 2010,” UNFTS, 22 July 2016, https://fts.unocha.org/reports/daily/ocha_Rdonor6_DC220_Y2010___1607071721.pdf.
124 See Methodology Page 43, World Bank, “Bilateral Remittance Matrix 2014,” World Bank, October 2015, http://www.worldbank.org/en/topic/migrationremittancesdiasporais-sues/brief/migration-remittances-data; International Monetary Fund, “Coordinated Direct Investment Survey Table 2-o: Outward Direct Investment Positions” IMF, 8 December 2015, http://data.imf.org/regular.aspx?key=60564261.
125 The International Center for Not-For-Profit Law, “NGO Law Monitor: Uganda,” ICNL, January 2016, http://www.icnl.org/research/monitor/Uganda.html.
126 Ibid.
127 Ibid.
128 See Methodology Page 43
129 United Nations. International Migration Report 2015 (New York: United Nations, 2016): 2. http://www.un.org/en/development/desa/population/migration/publications/migra-tionreport/docs/MigrationReport2015_High-lights.pdf.
130 “Remittance Corridors: New Rivers of Gold,” The Economist, 26 April 2012, http://www.economist.com/node/21553458.
131 United Nations. International Migration Report 2015 (New York: United Nations, 2016): 2. http://www.un.org/en/development/desa/population/migration/publications/migra-tionreport/docs/MigrationReport2015_High-lights.pdf.
132 See Methodology Page 43, World Bank, “Bilateral Remittance Matrix 2014,” World Bank, October 2015, http://www.worldbank.org/en/topic/migrationremittancesdiasporais-sues/brief/migration-remittances-data.
133 Dilip Ratha, et. al., Migration and Develop-ment Brief 25 (Washington, DC: World Bank, October 2015), 16.
134 Elaine Kurtenbach, “IMF cuts growth forecast, citing sluggish EU, Japan, BRICS,” Salon, 20 January 2015, http://www.salon.com/2015/01/20/imf_cuts_growth_forecasts_citing_sluggish_eu_japan_brics/.
135 International Monetary Fund, “Subdued Demand Diminished Prospects,” IMF, January 2016, https://www.imf.org/external/pubs/ft/weo/2016/update/01/.
136 Dilip Ratha, et. al., Migration and Develop-ment Brief 25 (Washington, DC: World Bank, October 2015), 4.
137 Matthew Luxmoore, “Ruble Ripple: New Russian laws make life difficult for migrant workers,” Al Jazeera America, 27 February 2015, http://america.aljazeera.com/articles/2015/2/27/new-russian-laws-make-life-difficult-for-migrant-workers.html
138 Dilip Ratha, et. al., Migration and Develop-ment Brief 25 (Washington, DC: World Bank, October 2015), 4.
139 Dilip Ratha, et. al., Migration and Develop-ment Brief 24 (Washington, DC: World Bank, April 2015), 10.
140 Matrin Oketch, “Mobile Money Accounts Increase by 2.1 Million,” Daily Monitor, 16 December 2015, http://www.monitor.co.ug/Business/Mobile-money-accounts-increase-by-2-1-million/-/688322/2998652/-/t2a1iy/-/index.html.
141 “Kenya Country Page,” Finclusion, 2014, http://finclusion.org/country/kenya.html.
142 See Methodology Page 43, World Bank, “Bilateral Remittance Matrix 2014,” World Bank, October 2015, http://www.worldbank.org/en/topic/migrationremittancesdiasporais-sues/brief/migration-remittances-data.
143 United Nations. International Migration Report 2015 (New York: United Nations, 2016), 7. http://www.un.org/en/development/desa/population/migration/publications/migra-tionreport/docs/MigrationReport2015_High-lights.pdf.
144 See Methodology Page 43, Ibid
145 World Bank, “Bilateral Remittance Matrix 2014,” World Bank, October 2015, http://www.worldbank.org/en/topic/migrationremit-tancesdiasporaissues/brief/migration-remit-tances-data.
146 See Methodology Page 43, World Bank, “Bilateral Remittance Matrix 2014,” World Bank, October 2015, http://www.worldbank.org/en/topic/migrationremittancesdiasporais-sues/brief/migration-remittances-data.
147 Ibid.
148 Ibid.
149 Ibid.
150 Western Union, Western Union Q1 Report (Englewood, CO: Western Union, 2016).
151 World Bank, “Personal Remittances, Received (current US$),” World Bank, Accessed: 14 July 2016.
152 World Bank, “Personal Remittances, Received (% of GDP),” World Bank, Accessed: 14 July 2016.
153 Philippine Statistics Authority, “2015 Survey on Overseas Filipinos,” Philippine Statistics Authority, 18 May 2016, https://psa.gov.ph/content/2015-survey-overseas-filipinos-0
154 Western Union, “Faces of OF-ReD,” (Englewood, CO: Western Union, 2016), 14.
155 The Western Union Foundation is a separate §501(c)(3) recognized United States non-profit corporation supported by the Western Union Company, its employees, Agents, and business partners.
156 The Economist Intelligence Unit, “Building a Future Back Home: Levering Migrant Worker Remittances for Development in Asia,” The Economist, 2008, http://foundation.westernunion.com/pdf/Western_Union_Asia_study.pdf.
157 See Methodology Page 34-43
158 See Methodology Page 34-43
H U D S O N I N S T I T U T E34
METHODOLOGY
U.S. International Philanthropy
F O U N D AT I O N S The Foundation Center’s estimates of 2014 international giving by U.S. foundations and of the share of this support benefiting developing countries are based on an analysis of their grants sample database and on giving by the nation’s nearly 87,000 grantmaking private and community foundations. The Foundation Center’s preliminary 2014 grants sample database includes all of the grants of $10,000 or more authorized or paid by 1,000 of the nation’s largest foundations, including 136 corporate foundations. Estimates of international foundation giving include all grants awarded to recipients based outside of the United States and its territories, and grants to U.S.-based international programs. Grants for developing countries include the subset of awards targeting recipients based in developing countries, U.S.-based and overseas international programs benefiting developing countries, and global health programs. Countries were classified as “developing” based on the Official Development Assistance Recipient List of the Organization for Economic Cooperation and Development (OECD).
The Foundation Center determined that overall giving by U.S. private and community foundations for international causes was $7,578,114,000: $6,978,982,000 by independent, community, and operating
foundations and $599,133,000 from
corporate foundations. The Foundation
Center estimated the proportion that
targeted the developing world based on a
detailed analysis of its grants dataset over
several years, closely examining the
geographic focus of giving by all foundations
included in its sample. Foundation giving for
developing countries as a share of
international giving for non-corporate
foundations was estimated to be 66.7%.
Applied to the figure of $6,978,982,000 in
overall international giving by non-corporate
foundations, the Foundation Center derived
the figure of approximately $4.7 billion for
giving by non-corporate foundations to
developing countries. International giving for
developing countries by corporate
foundations was also estimated, but this
figure is included in the corporate giving
section of the Index.
C O R P O R AT I O N S The Center for Global Prosperity (CGP)
partnered with the Foundation Center, the
Urban Institute’s Center on Nonprofits and
Philanthropy (CNP) and the Partnership for
Quality Medical Donations (PQMD) for data
on corporate giving for 2014. CGP
also consulted with CECP an international
forum focused exclusively on
corporate philanthropy.
The Foundation Center, through its survey of
U.S. corporate foundations, found that they
gave $599,132,911 internationally. Based on
the Foundation Center’s calculations, an
estimated 45.2% or $271,026,652 of these
donations were sent to developing countries.
The Urban Institute, in collaboration with the
Foundation Center, identified major in-kind
drug and medical supply grants from
corporations to Private and Voluntary
Organizations (PVOs). These in-kind
donations are reported in Schedule M line
20 of the IRS Forms 990 and 990EZ for the
fiscal years 2013/2014. CNP estimated that
$7,693,235,631 was donated to PVOs by
corporations. Most PVO’s report “Wholesale
Value,” “Market Value,” “Comparable Sales,”
“Red Book,” or other published sources for the
valuation method in Line 20 of Schedule M.
CGP consulted with PQMD for percentage
estimates of the overhead costs incurred by
corporations donating the in-kind
contributions discussed above. The PQMD
comprises 29 member organizations (NGOs
and pharmaceutical and medical supply
manufacturers) that share a common
commitment to advancing effective drug and
medical supply donation practices. Based
on the consensus of their members, PQMD
estimates that transport, insurance and
handling costs add 10%, or $769,323,562,
to donors’ costs. Duties, taxes and tariffs
account for 18% or $1,384,782,401.
Storage, distribution and in-country
transport cost an additional 15% or
$1,153,985,344. When these overhead costs
are applied to the $7,693,235,631, total
donations by corporations for 2014 amount
to $11,001,326,947.
T H E I N D E X O F G L O B A L P H I L A N T H R O P Y A N D R E M I T TA N C E S 35
Together, the $271,026,652 from in cash grants from corporate foundations identified by the Foundation Center and the $11,001,326,947 from in-kind corporate giving to PVOs identified by the Urban Institute produces a total of $11,272,353,599 in U.S. corporate giving to the developing world in 2013/2014.
P R I VAT E A N D V O L U N TA R Y O R G A N I Z AT I O N S The CGP collaborated with the Urban Institute’s Center on Nonprofits and Philanthropy (CNP) to determine the dollar value of international development assistance projects run by private and voluntary organizations (PVOs). Building on its earlier research on international PVOs (2005-2010), the CNP utilized several data sources and methods to identify an initial population of 17,250 organizations with possible international development activities from approximately 1.1 million registered 501(c)(3) domestic public charities.
Sections of IRS Form 990 and 990-EZ return filings from 217,300 domestic 501(c)(3) public charities submitting an electronic (E-File) return during Fiscal Years 2013/2014 were examined for various indications of program service and grantmaking activities outside of the United States. The CNP also used annual reports and information from the USAID U.S. PVO Registry (also known as the Report of Voluntary Agencies Engaged in Overseas Relief and Development or VolAg Report) to identify religious, newly registered, and other PVOs with international development activities that did not file Forms 990 during Fiscal Years 2013/2014 (Fiscal Year 2013 data reported in 2015 VolAg Report as of June 2016: pvo.usaid.gov/usaid/). In addition, the CNP utilized the Urban Institute’s National Center for Charitable Statistics (NCCS) National Taxonomy of Exempt Entities (NTEE) classification codes, and conducted text searches of keyword terms pertaining to international aid and development activities within PVO name, mission/purpose statements, and program descriptions across NCCS’ IRS Business Master File and Form 990/990-EZ return data archives (circa fiscal years 1989 through 2016).
The CNP examined IRS Form 990 and 990-EZ information returns for Fiscal Years 2013 and 2014 from the initial sample of
17,250 PVOs to identify the final population of 6,695 PVOs providing international development and assistance for this study. Domestic organizations, such as community theaters and neighborhood associations, were excluded in the search, while environmental, human service, healthcare, and other types of organizations that could have both domestic and international activities were retained. To align the CNP data set with CGP specifications, the CNP removed all organizations that primarily supported activities in the United States or other developed countries, including Israel. The CNP also excluded organizations that focused on cultural and student exchange; missionary and religious activities; and immigration/adoption to the U.S.
The CNP then reviewed organizations’ Form 990s, web sites, and annual reports, and the VolAg registry to determine the ratio of international to domestic programmatic expenditures and activities by developing region, and by type of nonprofit sector activity. These ratios of international program support/activity were applied to total direct private contributed revenue for each PVO to determine total direct PVO aid and assistance to each developing region and by type of sector activity. The CNP staff manually verified and assigned ratios of international activity to 3,600 of the largest PVOs representing more than 90% of total international private contributions. Average ratios of international activity ranging from 51% to 77% were assigned to the remaining 3,100 smaller PVOs based on organization type and size categories. Fiscal Year 2014 represents approximately 52% of total international private contributions for aid and development, and 2013 represents the remaining 48%.
Adjustments were made to eliminate two potential sources of double-counting. The first adjustment excluded foundation grants to PVOs that were reported as private contributions by the PVOs in their 990s or the VolAg Report. The CNP prepared a list of the 2,800 largest PVOs, and the Foundation Center matched this list with the grants received by the organizations and determined whether the grants were intended for developing countries. The total amount of international foundation grants to U.S.-based organizations for development purposes identified by the Foundation
Center, was $709,666,330. This was subtracted from the total estimate of private contributions for development and relief of $23,835,634,673 leaving $23,125,968,328.
The second adjustment addressed potential double-counting of corporate contributions of pharmaceuticals and other medical supplies or equipment that are accounted for in the U.S. corporate giving section of the Index. CNP reviewed Form 990 Schedule M (Noncash Contributions) for large in-kind contributions of drugs and medical supplies (reported on Line 20 of Schedule M). The total dollar value of in-kind contributions of pharmaceuticals or other medical supplies was $7,693,235,631. This was deducted from the private contribution subtotal of $23.1 billion resulting in $15.4 billion in private contributions received by U.S. PVOs and spent for international development and relief.
V O L U N T E E R T I M E The Index estimate of the value of U.S. volunteer time for international causes in 2014 is based on data taken from the Current Population Survey (CPS) and Independent Sector’s estimated dollar value of volunteer time. The CPS is a monthly survey of about 60,000 households conducted by the Bureau of the Census for the Bureau of Labor Statistics. As with the estimate of the value of U.S. international volunteer time for 2011, CGP based the 2014 estimate on two categories of respondents to the volunteer supplement: those who volunteered outside of the United States and those who volunteered in the United States for organizations that support international development assistance.
The CPS tallies individual volunteer time spent abroad and, separately, the type of organization for which individuals volunteer. Thus, CGP was able to determine how many people volunteered abroad and how much time they spent doing so and how many people volunteered for U.S.-based international organizations and how much time they spent doing so. For the second category, the CPS does not provide a breakdown of where the volunteering time was spent (abroad or in the United States) when volunteering for an international organization. Because of this, survey respondents who volunteered for a U.S.-based international organization and
H U D S O N I N S T I T U T E36
said they volunteered abroad might be double counted. To avoid this, CGP staff excluded the individuals who volunteered for an international organization and who also volunteered abroad. This resulted in two distinct groups of volunteers: those who volunteered abroad and those who volunteered in the United States in support of international development causes.
CGP calculated the value of U.S. volunteers’ time spent abroad by multiplying the estimated hourly value of volunteer time by the estimate of total volunteer hours abroad as calculated from the 2014 volunteer supplement data, which asked respondents: “Considering all of the volunteer work you have done since September 1st of last year, about how much of it was done abroad: all or almost all; more than half; about half; less than half; or very little?” CGP staff assigned percentage values (95%, 75%, 50%, 25%, and 5%, respectively) to each of these categories to calculate the numbers of hours served overseas. The percentages were assigned to the average amount of time spent volunteering by the individuals who went abroad. Using Dataferrett, a data analysis and extraction tool to customize data from the U.S. Census Bureau, CGP found over 952,700 volunteers worked abroad in 2014. The CGP found that volunteers working internationally contributed an average of 318.53 hours. By applying the average amount of hours worked by volunteers to the categories of volunteers that had worked 95%, 75%, 50%, 25%, and 5%, the CGP found that in 2014 volunteers worked a total of 137.4 million hours abroad. Based on Bureau of Labor statistics figures, Independent Sector estimated the dollar value of a volunteer’s time to be $23.07 per hour in 2014. Multiplying the 137.7 million U.S. volunteer hours contributed internationally by the hourly wage of $23.07 brings the dollar value of U.S. international volunteerism to $3,170,601,788 or $3.2 billion.
To calculate the value of time volunteered in support of international development assistance causes in the United States, CGP staff identified CPS respondents who served with one or more international organizations and totaled the hours they served across all international organizations, removing those who had volunteered overseas. There were 385,156 people in this category volunteering
an average of 110.3 hours in 2014. These
figures, multiplied together, yielded a total of
42,482,707 hours. A further 82,668 people
worked in refugee and immigrant assistance,
working an average of 78.7 hours in 2014 for
a total of 6,505,972 hours. This total of
467,824 volunteers contributed a total of
48,988,678 hours, which when multiplied by
the hourly wage of $23.07 brings the dollar
value of volunteerism within the United
States in support of international
development causes to $1,130,168,811.
By adding the economic value of U.S.
volunteers’ time dedicated to international
causes at home ($1.1 billion) to the
economic value of those who volunteered
abroad ($3.2 billion), CGP estimates that the
total value of U.S. volunteer time for
international causes in 2014 to be $4.3 billion.
U N I V E R S I T I E S A N D C O L L E G E S The CGP once again used data from two
sources to determine the amount of private
support to international students: 1) The
Open Doors 2015 report published by the
Institute for International Education; and, 2)
data from the NAFSA 2014/2015 Academic
Year Fact Sheet published by the NAFSA:
Association of International Educators.
NAFSA is the world’s largest nonprofit
professional association on international
education, which gathers information on
international students in the United States
and U.S. students abroad.
Open Doors 2015 covers the 974,926
international students who studied in the
United States in the 2014/2015 academic
year. It includes cost breakdowns of their
tuition and fees, living expenses, and their
sources of support. Open Doors compiles
information on all international students
coming to the United States from all regions
of the world. For the 2016 Index, CGP
deducted the number of students who came
to the United States from developed
countries, and determined that 68% of
international students came to the United
States from the developing world by
calculating the proportion of students from
developing countries relative to the
worldwide total.
The analysis for Open Doors accounted for
various cost categories of international
students in the United States to produce a
total for all expenses for all international students in the United States in 2014/2015 of $30.5 billion. Among the sources of these funds were personal and family contributions, home governments, foreign private sponsors, international organizations, U.S. sources, and employment. According to NAFSA, the proportion of this $30.5 billion total that came from U.S. sources was $8,531,783,252. According to Open Doors 2015, the U.S. government was the primary source of funding for 0.5% of international students, which yields a contribution of $42,658,916. Subtracting $42,658,916 in U.S. government support from $8,531,783,252 yields $8.48 billion in support from U.S. sources other than the U.S. government. Multiplying this figure by the 68% that represents the portion of students from the developing world yields a total of $5,772,604,548 in contributions to students from the developing world.
Since we removed the number of students whose primary source of funding is the U.S. government, the remaining students’ funds came from U.S. private sponsors and host university or college funds. The Institute for International Educators (IIE) does not provide information on what portion of the U.S. university/college funding sources category originates from the U.S. government. However, the IIE speculates that a large portion of doctoral students receive funding from U.S. government sources like the National Science Foundation or the National Institute of Health. To be conservative, CGP found the ratio of all international students in the U.S. who are in non-doctoral programs, which in 2010 amounted to 38%, and applied that ratio to the $5.77 billion total for non-governmental U.S. funding to students from developing countries. This yielded an estimate of $2.19 billion. Thus, the final estimate for U.S. private funding for students from developing countries of $2.2 billion only includes U.S. private funding for non-doctoral students studying in the U.S. that came from developing countries.
The IIE’s survey methodology includes a country classification system that organizes places of origin into regional groupings based on the U.S. Department of State’s definition of world regions and states. The survey defines an international student as “an individual who is enrolled in courses at a
T H E I N D E X O F G L O B A L P H I L A N T H R O P Y A N D R E M I T TA N C E S 37
higher education institution in the United States on a temporary visa.” The survey pool consists of approximately 3,000 regionally accredited U.S. institutions. The pool is updated regularly using the Integrated Postsecondary Education Data System (IPEDS) produced by the U.S. Department of Education and the U.S. Department of Homeland Security’s Student and Exchange Visitor Information System (SEVIS). The overall institutional response rate for 2009–10 was 63% or 1,674 institutions.
R E L I G I O U S O R G A N I Z AT I O N S The results from the Urban Institute’s Congregational Survey are based on a stratified random sample survey of all religious congregations in the United States. The Urban Institute used the American Church List to select a stratified random sample to ensure that congregations of different sizes, denominations, and geographic areas were included in the study. Churches with larger memberships were given a higher probability of selection. Each sampled congregation was asked about their overseas donations for relief and development in 2015. The final questionnaire was implemented by Washington State University. It was designed to be administered either by web or by phone and consisted of four sections: 1) U.S.-Based Organizations; 2) Overseas-Based Organizations, Ministries, & Long-Term Missions; 3) Short-Term Missions; and, 4) Organization background. The estimates shown in this report are based on responses from a nationally representative sample of 357 congregations. The response rate for the 2016 survey was 30%, which was calculated by including all completed and partially completed questionnaires. Urban Institute followed the guidelines from AAPOR (American Association of Public Opinion Research) on how to treat ineligible organizations including congregations with disconnected phone numbers.
A hot deck imputation procedure was used for partially completed questionnaires and surveys that had missing information on total dollar amounts. In a hot deck imputation, the value reported by a respondent for a particular question is given
or donated to a “similar” organization whose respondent failed to respond to that question. The hot deck approach replaces missing data with plausible values, which is why it is the most common method used to assign values for missing responses in organizational surveys. Results were weighted to adjust for nonresponse, disproportionate sampling by size, and the estimated 265,461 congregations in the U.S., a number based on the full sampling frame of congregations maintained and regularly updated by “InfoUSA.”
The goal of the survey was to collect data on development and relief work. Support for evangelism, church planning, discipleship, and street evangelism was explicitly removed from the totals for overseas-based organizations and missions. The survey determined that: 1) an estimated 201,497 congregations gave a total of approximately $8.2 billion to U.S.-based development and relief organizations; 2) an estimated 76,913 congregations contributed a total of $2.4 billion directly to programs in foreign countries, including congregations that supported longer term mission trips for relief and development; and, 3) an estimated 76,929 congregations financially supported short-term mission trips to foreign countries by providing $1.3 billion in support including participant contributions. The $8.2 billion given to U.S.-based development and relief organizations is excluded from the Urban Institute estimate of religious giving since giving to these organizations is captured in the numbers for Private and Voluntary Organizations (PVOs) provided by the Urban Institute. Thus, the total amount of overseas giving to developing countries by U.S. religious organizations was $3.7 billion.
The Billy Graham Center at Wheaton College’s most recently published Mission Handbook is a study of giving to 700 U.S. mission agencies (Protestant religious organizations engaged in missions overseas) and was based on data from 2008. The Billy Graham Center reported a total of $5.7 billion in revenue for mission agencies from grants, individual giving, bequests, and other sources. The figure includes contributions by a number of largely nondenominational nonprofit organizations also represented in the Index’s PVO number,
determined by NCCS. To account for the overlap, NCCS matched its database with the Graham Center’s 2009-2011 Mission Handbook’s list of organizations to determine that the overlapping organizations accounted for $3.41 billion of the mission organizations’ revenues. Subtracting this amount from the Graham Center’s total of $5.7 billion provides a total of $2.29 billion in unique giving by religious organizations included in the Billy Graham Center study. Due to data limitations, it is not possible to completely disaggregate evangelism activities from relief and development activities in the Billy Graham Center data. For this reason, the $2.29 billion may represent an overestimation; however, the Urban Institute’s Congregational Survey and data from the LDS, which makes up the majority of our religious giving number, includes only funds spent strictly on relief and development. The private giving figures from the Urban Institute and Washington State University’s congregation survey ($3.7 billion) and the Billy Graham Center ($2.3 billion) produces a total of $6 billion in religious giving to the developing world.
International Philanthropy Outside the United States
A U S T R I A Private giving figures for Austria are based on an annual publication by the Österreichische Forschungsstiftung für Internationale Entwicklung - ÖFSE (the Austrian Research Foundation for International Development). The ÖFSE is the main research and information facility concerned with issues of developing countries, and development cooperation and policy. The ÖFSE’s annual publication, Österreichische Entwicklungspolitik (Austrian Development Policy) outlines all aspects of Austrian giving to the developing world including official development aid as well as private funding. The 2015 edition of this publication, Österreichische Entwicklungspolitik: Rohstoffe und Entwicklung includes a chapter devoted solely to private funding for development (Zuschüsse privater Organisationen).
The report comprises various private flows through nonprofit organizations, including donations, fundraising, membership fees, bequests, religious giving and corporate
H U D S O N I N S T I T U T E38
sponsorships, that are used for development projects, humanitarian aid or other assistance in developing countries. The numbers are based on financial reports provided by the organizations themselves. Since these organizations often exclude volunteer time, in-kind donations, and cash donations that do not flow through nonprofit organizations, these figures may be underestimated.
In 2013, total private income of Austrian nonprofits amounted to €133.5 million or $183.9 million. Of the $183.9 million donated, 83% was raised by Austria’s “Top Ten” nonprofit organizations of which 43% of the money went to African countries, 23% to Asia, 15% to the Americas, 8% to Europe, and 1% to Oceania.
A U S T R A L I A The private giving estimate for Australia is based on the ACFID 2014-15 Annual Report produced by the Australian Council for International Development (ACFID), which provides private giving data for 2014. The ACFID is the primary coordinating body for Australian non-government organizations (NGOs) involved in international development and humanitarian action. ACFID is composed of 137 Australian NGOs, however, it recognizes that Australian aid and international development extend beyond ACFID’s membership. ACFID uses figures from five non-ACFID NGOs to provide an accurate depiction of the sector’s total revenue. Each of the non-ACFID NGOs raised over 1 million Australian dollars in 2013–2014 which is significant when examining the aid and development sector as a whole.
Using the 2014 exchange rate of 1.219, CGP calculated that the total funding, both public and private, for the Australian aid and international development NGO sector was $1.443 billion (USD). Of this $1.443 billion, $869.2 million (60%) came from the “Australian Community,” a category composed of monetary and in-kind donations and bequests from private sources. $264.04 million (18%) came from “DFAT Grants,” a form of government aid. $86.2 million (6%) came from “Other Income,” a category composed of private investment income and income from religious organizations. $83.54 million (6%) came from “Grants — other Australian,” a category composed of private giving from
philanthropic organizations and corporations. $76.26 million (5%) came from “Grants — other Overseas,” a category that included grants from overseas sources and private organizations. Finally, $63.96 million came from “Revenue for Domestic Programs.” By adding the private funding categories of “Australian Community,” “Other Income,” and “Grants — other Australian,” CGP estimated that Australia’s total private giving to NGOs in the international development sector was $1,038,940,000 in 2014.
B E L G I U M To estimate private giving from Belgium to the developing world, CGP used “ngo-openboek.be”, a database for all registered Belgian private voluntary organizations. Ngo-openboek.be is an initiative by the NGO-Federatie and ACODEV, umbrella organizations for NGOs in Flanders and Wallonia, respectively. The website includes general information about the NGOs and their activities, as well as detailed financial statements. By collecting the private income statements of all Belgian nonprofit organizations that are concerned with aid to developing countries, CGP was able to estimate Belgium’s total private giving.
In 2014, private giving from Belgium to the developing world was €470.5 million or $572.4 million. Of this, €388.6 million or $472.7 million was raised through donations from individuals and corporations; €28.6 million or $34.8 million came from bequests; €19.4 million or $23.6 million from other private funds; €19.1 million or $23.2 million from the sale of products and merchandizing; and €14.8 million or $18 million from membership fees.
This estimate of $572.4 million in Belgian cross-border philanthropy is based on the available financial data from 2014 for a total of 73 PVOs, including foundations, associations, and NGOs. A few organizations have not publicly released their finances, but these are smaller organizations with less significant private income.
C A N A D A CGP partnered with the University of Saskatchewan’s Social Sciences Research Laboratories (SSRL) to estimate Canadian private giving to developing countries. The researchers, Jason Disano and Harley Dickinson, reviewed the annual tax returns
of charitable organizations that filed with the Government of Canada’s Canadian Revenue Service (CRS).
All Canadian organizations that offer tax credits to donors are required to annually file financial information with the CRS. SSRL used the CRS database to examine 9,000 charities that conducted all or part of their charitable work in developing countries. For organizations that reported only international charitable activity, financial information was taken directly from the CRS returns. For those organizations reporting both domestic and international activity, SSRL examined annual reports and audited financial statements to differentiate national from international expenditures. The research included charities’ program expenditures and did not include expenditures for management, fundraising, or political activities.
SSRL reviewed 764 organizations, which delivered $2.4 billion in aid to developing countries in 2014. The results showed that just under one third of this total was provided by Canadian federal, provincial, and territorial governments. This was removed from the total. The remaining $1.636 billion in aid to developing countries was provided by private sources. Faith based organizations accounted for $900 million of this total, while non-faith-based organizations accounted for the remaining $736 million.
To estimate the value of international volunteerism, SSRL identified Canadian charitable organizations that recruit and deploy highly skilled volunteers, ranging from physicians to engineers, for projects in developing countries. By examining the annual reports of ten of these organizations, SSRL found that 2,000 Canadians had volunteered in developing countries in 2014 for a total value of $40 million. In total, SSRL found that Canada provided $1.676 billion in private philanthropy to developing countries in 2014. This total consisted of the $900 million from faith-based organizations, $736 million from non-faith based organizations, and $40 million from volunteerism.
C Z E C H R E P U B L I C In the Czech Republic, an NGO is defined as any form of legal association and its organizational units. This includes civic
T H E I N D E X O F G L O B A L P H I L A N T H R O P Y A N D R E M I T TA N C E S 39
organizations, church institutions and religious organizations, charitable organizations, foundations and endowment funds. Since 2005, the number of NGOs in the Czech Republic has steadily increased.
To obtain a private giving estimate for the Czech Republic, CGP went through official financial reports from 21 different Czech NGOs and foundations. The organizations were collected from the Czech Forum for Development Cooperation (FoRS) and Nezikovy.cz, an umbrella organization that aims to improve NGO activity and encourage cooperation. Membership in FoRS is open to all Czech independent NGOs and academic institutions working in development and humanitarian fields. FoRS currently includes 45 organizations, of which 18 are concerned with international development aid.
The total private income of the 21 NGOs and foundations focused on international development in 2013, amounted to 203 million CZK or $10.4 million. These numbers include private donations, corporate donations, donations from foundations and other non-governmental organizations, as well as revenue from the sale of merchandise.
D E N M A R K The private giving estimate for Denmark is based on research performed by CGP. Research was conducted on 72 members of the three networks for Danish Development NGOs: Concord Danmark, the Danish NGO Forum, and the Danish 92 Group. By analyzing their annual reports, CGP was able to establish private giving numbers for 40 organizations. Their private income, based on the most recent income statements available (mostly 2014 and some 2013), totaled 1,164,764,469 DKK. Using the conversion rates for 2013 and 2014 of 5.419 and 6.124, respectively, provided an estimate of $191,119,004 in private giving from Denmark to the developing world.
F I N L A N D The private giving estimate for Finland is based on research performed by CGP staff. CGP researched the 16 partner NGOs that receive support for development programs from Finland’s Ministry of Foreign Affairs. By analyzing these organizations’ annual reports, CGP was able to establish private
giving estimates for 9 of the organizations. Their private income, based on the most recent income statements available (mostly 2014, and in one 2013), totaled €85,908,468. Using the conversion rates for 2013 and 2014 of .727 and .822, respectively, provided an estimate of $108,333,369 in private giving from Finland to the developing world.
F R A N C E To estimate French private giving, CGP staff used data for corporate giving from a biannual corporate giving survey published by L’Association pour le Développement du Mécénat Industriel et Commercial, a French corporate sponsorship organization, along with the market research firm, CSA. The survey is based on 1,019 firms with one employee or more. Of those 1,019 firms, 201 were engaged in philanthropy in 2013. Total corporate giving in 2013 was 2.8 billion euros, of which 8% or 224 million euros was internationally oriented. Using the 2013 conversion rate of 0.7260, this amounts to a total French corporate giving estimate of $308.5 million in 2013.
Data for private individual giving are taken from Recherches & Solidarités, a voluntary network of experts in the field of civil society, who publish an annual report on French private giving called La Générosité des Français. In 2013, French individual donations to international causes totaled 358 million euros, of which 140 million was spent on health, 127 million on children, and 91 million on development. Using a 2013 conversion rate of 0.7260 provided by the U.S. Treasury’s Bureau of the Fiscal Service, this amounts to a total French individual giving of $493.1 million in 2013. Taken together, French private giving from individuals and corporations to the developing world amounted to $801.6 million in 2013.
G E R M A N Y The private giving number for Germany is based on a survey by the Deutscher Spendenrat e.V., an umbrella organization of NGOs, in cooperation with a market research company, GfK. The publication Spendenjahr 2015: Trends und Prognose outlined private philanthropy trends in Germany in 2014 and predicted trends for 2015. The survey is based on a sample of 10,000 people aged 10 years or older and includes periodic and one-time donations.
The survey does not include corporate giving, bequests, and large donations of €2,500 or more. Private giving, both domestic and international, in Germany in 2014 amounted to just under €5 billion. The largest share of this (31%) was allocated internationally, compared to 30.1% locally, 22.8% nationally, and 16% of which respondents were unsure. Private giving from Germany to the developing world is estimated at $1.870 billion or €1.538 billion in 2014.
J A PA N The data on Japanese private giving to developing countries was collected by CSO Network Japan (CSONJ), following the methodology developed by CGP. CSONJ gathered data for foundations, nongovernmental organizations (NGOs), volunteer time and corporations. The survey for the corporations was carried out by CSONJ independently (supported by the Asahi Group Foundation), and the others were based on the use of publicly available data.
For foundations, The Japan Foundation Center supplied the data from the Database of Grant-making Organizations for fiscal year 2014, including grants provided for overseas research and projects, and scholarships provided to international students. Data on a total of 260 Japanese organizations was available and CSONJ further supplemented it with large-scale organizations not appearing in the data such as the Toyota Foundation. Grants and scholarships for non-developing countries were excluded based on the OECD-issued DAC List of ODA Recipients. As a result, the sample size was 184 organizations out of 260, which offered large grants for the programs to developing countries. The foundations gave $44.5 million in scholarships, $8.3 million in project funding, $1.2 million in research grants in 2014. The total private funds from Japanese foundations to developing countries amounted to $54 million.
Private giving from NGOs was compiled from the International Cooperation NGO Directory published by the Japan NGO Center for International Cooperation (JANIC). In the Directory, most organizations showed their fiscal reports in 2013. CSONJ updated overseas project expenditures (including personnel expenses and public subsidies) for 100 organizations offering more than 10 million JPY and 39
H U D S O N I N S T I T U T E40
organizations offering just a little under 10 million JPY out of 241 NGOs. The total amount of NGOs overseas private expenditures in developing countries was $530 million in 2013 up from $470 million in 2011.
For corporations, the results of the study The Research of Corporate Philanthropy and BOP Business for the Social Issues in Developing Countries conducted by CSO Network Japan (CSONJ) from 2013 to 2014 were used. This research was based on interviews with nine companies which were selected based on the top 50 companies included in the CSR Corporate Guide by sector published by Toyo Keizai Incorporated. Corporations’ annual reports were also used. According to the research, overall expenditures for CSR activities by the 9 companies were 35.4 billion JPY. Of this, expenditures in philanthropic activities in developing countries accounted for 19.1%, for a total of 6.75 billion JPY or $80 million. The $80 million corporate overseas giving number is significantly higher than a previous report published by the Japan Business Federation (Nippon Keidanren) called Corporate Philanthropy Activity Report for fiscal year 2013. That report underestimated corporate giving finding only 3.12 billion JPY, under half of the 6.75 billion JPY noted in this more recent study.
The report Giving Japan 2013 issued by the Japanese Fundraising Association calculated the economic value of volunteer activities related to international cooperation in 2012. According to this report, the economic value of Japanese volunteers was 11,357.4 billion JPY, and the total hours of volunteer time was 6.96 billion hours. The economic value in the field of international exchange and cooperation was 309 billion JPY equivalent to $3.87 billion, and the total hours of volunteer time was 160 million hours. This figure was calculated by multiplying the number of volunteers per field, average hours spent for volunteer activities per individual in the field, and the average wage of international volunteers which was 2,120 JPY. Together, Japanese foundations at $54 million, NGOs at $530 million, corporations at $80 million, and volunteer time at $3.87 billion amounted to $4.53 billion in international private giving to developing countries in 2013/2014. L U X E M B O U R G The private giving estimate for Luxembourg
is based on research performed by CGP staff. CGP researched 72 of the largest members of Le Cercle de Coopération des Ong de Développement, the only international development PVO umbrella group in Luxembourg. By analyzing their annual reports, CGP was able to establish private giving numbers for 25 organizations. For 2014, the private income for these organizations totaled roughly €16.4 million. Using the conversion rate of .822, CGP produced an estimate of $20,078,417 in private giving from Luxembourg to the developing world. Of the $20,078,417 in private giving, 8% was spent in Latin America, 67% was spent in Africa, and 25% was spent in Asia.
T H E N E T H E R L A N D S The private giving estimate for the Netherlands is based on the 2015 edition of the biannual report Geven in Nederland produced by the Vrije Universiteit Amersterdam, which provides data for 2013. The report includes giving in the category of “international aid” from five sources: households, bequests, foundations, corporations, and lotteries. According to the report, households gave €304 million or $418.7 million to international aid causes in both cash and in-kind donations, €61 million or $84 million came from bequests, €31 million or $42.7 million came from foundations, €67 million or $92.3 million came from corporations, and €115 million or $158.4 million came from lotteries.
Together these categories total €578 million. Using a 2013 conversion rate of 0.726, CGP produced an estimate of $796 million in Dutch private giving to the developing world.
N E W Z E A L A N D To estimate private giving for New Zealand, CGP examined data on the 27,191 registered charities in the country. Information on each registered charity’s finances, activities, beneficiaries, and areas of operation, is available on the Charity Service’s continuously updated Charities Register. In New Zealand, charities include “societies, institutions, and trustees of a trust.”
CGP examined the register to evaluate those charities that listed “international activities” as their primary or secondary sector and/or operated in a developing country. There were a total of 1,513 charities that met these criteria. After subtracting the total income
from government grants spent overseas from the gross income spent overseas, CGP produced an estimate of $133,205,540 in total private giving from New Zealand to the developing world.
N O R WAY Since there were no available sources of private international giving in Norway, CGP used earlier data from 2010 from a partnership with Stein Brothers AB, a Swedish research and consulting firm.
To estimate private giving by PVOs, Stein Brothers AB contacted the Norwegian Agency for Development Cooperation (NORAD) to identify the top 10 largest Norwegian PVOs. The annual reports of each PVO were reviewed and, when necessary, the organizations were contacted directly. By analyzing data, the estimate for Norwegian PVOs was calculated at $250.8 million in private giving to the developing world.
While Norwegian corporations also give to philanthropic activities in the developing world, they do so solely by giving to international PVOs. Thus in order to avoid double counting, it can be assumed that any Norwegian corporate contribution is likely included in the PVO figure.
S PA I N Private giving estimates for Spain are based on an annual publication by the Coordinadora de ONG para el Desarollo, a Spanish umbrella organization comprised of 80 nonprofit organizations focused on international development. For the 2013 edition of the Index, CGP used 2008 data provided by this source. Coordinadora’s 2014 report is based on financial data from 2013 and it includes responses from 73 of the 80 organizations represented by the umbrella group. In 2013, the total income of these organizations was €479.5 million or $660.5 million, of that total 52% was publically funded and 48% contributed by the private sector.
These organizations’ private income consisted of €75.5 million or $104 million in regular donations and fees, €37.1 million or $51.1 million in corporate sponsorships, €75.6 million or $104.1 million in one-time donations, €18.3 million or $25.2 million from private enterprises, €8.4 million or $11.6 million from the sale of products and merchandising, and €14.8 million or $20.3 million in other private funds. Using a 2013
T H E I N D E X O F G L O B A L P H I L A N T H R O P Y A N D R E M I T TA N C E S 41
conversion rate of 0.7260 provided by the
U.S. Treasury’s Bureau of the Fiscal Service,
this amounts to a total of €229.6 million or
$316.2 million in Spanish private giving to
the developing world.
S W E D E N
To obtain private giving estimates for
Sweden, CGP researched individual
Swedish NPOs working in development that
are members of the Frivilligorganisationernas
Insamlingsråd (FRII). FRII, also known as the
Swedish Fundraising Council, is an umbrella
organization for all registered Swedish
PVOs. It tracks and publishes the annual
private incomes of its member organizations.
Through the group’s website, CGP analyzed
financial reports from Swedish nonprofits
engaged in international development.
In 2014, 60 NPOs and foundations reported
their finances to FRII, leading to a total of
4.3 billion SEK, or $553.9 million in Swedish
private giving to the developing world. This
number contains large and small donations
from individuals, corporate sponsorships,
and funds raised through the sale of
products and merchandise.
S W I T Z E R L A N D The private giving number for Switzerland is
based on data from the Zewo Foundation
and financial reports from individual PVOs.
The Zewo Foundation is an umbrella
organization for all nonprofit organizations in
Switzerland that have gone through an
inspection to ensure that they meet certain
standards. Zewo assesses organizations on
their ethics and integrity, corporate
governance, use of funds, accounting
practices, transparency, accountability,
fundraising and communication.
The Zewo Spendenstatistik report is based
on financial data reported by 446 aid
organizations. The total amount of Swiss
private giving amounted to 1.7 billion CHF in
2014, of which 1 billion CHF went to
Zewo-certified PVOs. This number includes
large and small donations from individuals,
corporate funding and sponsorships,
religious donations, bequests, membership
fees, contributions from municipalities, and
funds raised from special events and the
sale of products. Almost half of the private
funds raised in 2014 were allocated to
international aid, amounting to a total of 494
million CHF or $499.5 million.
Some major PVOs in Switzerland are not Zewo-certified, meaning that they are not included in the above figure. Total Swiss private giving can, therefore, be more accurately estimated by analyzing 2014 annual reports of the four largest non-Zewo PVOs. In 2014, Médecins Sans Frontières Suisse raised 101.7 million CHF; Kantha Bopha Children’s Hospitals 41.4 million CHF; World Vision Switzerland raised 33.5 million CHF; and UNICEF Switzerland 31.9 million CHF. This amounts to an additional 208.5 million CHF or $210.8 million. Altogether, CGP estimates that Switzerland’s total private giving to the developing world reached $710.3 million in 2014.
U N I T E D K I N G D O M The private giving estimate for the United Kingdom is based on data provided by the Charity Aid Foundation’s (CAF) Charity Trends search tool. Once a month, financial data is supplied to CAF by the U.K. Charity Commission. The Charity Commission gathers the information supplied by registered charities in England and Wales in their annual return, and provides a monthly update to CAF which includes the information for each charity’s latest return.
There are currently over 160,000 registered charities in England and Wales. CGP identified, using the Charity Trends search tool, all U.K. charities that work in the area of “Overseas Aid/Famine Relief,” one of 17 categories by which charities define their activities when they register with the U.K. Charity Commission. There are, as of October 2015, 10,448 charities that indicated “Overseas Aid/Famine Relief” as a cause they work within. According to Charity Commission data from July 2011, 7,217 charities operate within Africa; 6,989 operate in Asia, 1,347 operate in South America; and 1,001 operate in Oceania.
For charities identified as working in “Overseas aid/Famine Relief”, CGP was able to obtain information on the voluntary income of charities that had a total income of more than £500,000 in the year of the return. Charities with an income of £500,000 or less are not required to submit detailed accounts and, therefore, no financial information is available from these charities.
Total private income for U.K. charities working in “Overseas Aid/Famine Relief” in 2014 amounted to £3,209,084,105. All
income data is from each individual charity’s most recent income statement. Using a 2014 conversion rate of 0.6420, CGP estimates that the U.K. gave $4.92 billion in philanthropy to the developing world.
International Philanthropy from Non-DAC Donors
B R A Z I L To obtain data on Brazilian international philanthropy, CGP partnered with Anna Peliano at Comunitas, a civil society organization with the goal of promoting social development in Brazil through the engagement of corporate and other sectors. Comunitas published a “Benchmarking in Corporate Social Investment” (BISC) report that measured and assessed corporate giving in 2014. Comunitas found that, in 2014, 303 Brazilian companies and 33 foundations linked to Brazilian corporations provided $33.5 million or $34 million to international activities.
C H I N A CGP partnered with Liming Chen and Tao Ze from the China Foundation Center (CFC) to survey the top 75 private and public foundations by expenditures in China. This was completed by directly interviewing foundation officers or analyzing annual financial disclosure reports. According to CFC, annual expenditures of all Chinese foundations amounted to $2.8 billion in 2014.
CFC found that Chinese private foundations gave $3.7 million to international causes, and Chinese public foundations gave a lower amount of $1.3 million. Because it is unclear whether the public foundations were solely government funded, or some mix of government and private funding, CGP is using only the $3.7 million from private foundations in its estimate of Chinese international philanthropy.
C O L O M B I A CGP partnered with Catalina Escobar from Makaia Aesesoria Internacional to survey the philanthropic contributions that were directed to international development causes from Colombian foundations and corporations with corporate social responsibility programs. Makaia conducted an online survey between October 2015 and February 2016. The survey was disseminated through email messages, Makaia´s website and social networks, and
H U D S O N I N S T I T U T E42
through partner organizations and media. Most of the responses were collected online, but some were also collected through phone interviews and face-to-face meetings.
In total, 208 organizations were contacted, 73 responded, and 55 met the eligibility criteria of the study. The organizations consisted of corporate foundations, private foundations, family foundations, and corporate social responsibility initiatives. Only three of these organizations had supported international causes, providing $253,000 in cross-border private giving in 2014.
I N D I A The CGP used various sources in India for its private giving number and background information on the philanthropic sector. For the international private giving number of $249 million, CGP partnered with the Sampradaan Indian Centre for Philanthropy, which was founded in 1995 and supported by international and Indian organizations. The CGP also obtained information from Corporate Sustainability & Reputation Consulting and Bain & Company. Sampradaan administered a questionnaire and collected secondary research for over 600 foundations and corporations in India to measure their philanthropic in-kind and cash donations to overseas causes. Because the direct response rate from the organizations was low, Sampradaan also relied on secondary research using annual reports, websites, and other data sources to collect more complete information. In total, Sampradaan found that Indian foundations and corporations provided $249 million in cross-border private giving in 2014.
I N D O N E S I A CGP partnered with Maria Radyati at the Center for Entrepreneurship Change and Third Sector to provide estimates of philanthropic contributions that were directed to foreign development activities from Indonesian foundations, corporations, and universities. The data consists of both primary and secondary data. Maria Radyati started her data collection by examining secondary sources including publicly available information on Indonesian philanthropy and data purchased from Badan Pusat Statistik (Jakarta Central Statistic Center). The second phase of her research involved a survey of 15
organizations including five corporate foundations and ten non-profit organizations. She interviewed these organizations and found they provided $128.8 million in international private giving in 2014.
K E N YA CGP partnered with East Africa Association of Grantmakers (EAAG) to provide estimates of Kenyan philanthropic contributions to international causes by NGOs, foundations, corporations, and religious organizations as well as an estimate of international volunteerism. EAAG surveyed a total of 55 organizations including local NGOs, foundations, corporations, and religious organizations and found that 52 organizations provided a total of $95,488,371 to social causes in 2013. Of this total, $23,434 was spent on international social causes. EAAG also found that these organizations had logged a total of 92,608 hours of volunteer time, of which 7,408 hours was used to support foreign causes. Using an average hourly wage of $2.10, calculated by examining the wages of trained occupations in Kenya, the value of this volunteerism is estimated at $15,558. Altogether, CGP estimates that Kenya contributed $38,992 to international causes in 2014.
M E X I C O CGP partnered with Centro de Investigación y Estudios sobre Sociedad Civil (CIESC) to estimate Mexico’s private philanthropy. Jacqueline Butcher García-Colín and Santiago Sordo Ruz conducted private giving research on charitable organizations and corporations to provide an estimate of Mexico’s cross-border private philanthropy. CIESC examined the donation reports from tax-exempt organizations and found that they contributed a total of $440 million in international private giving. The organizations, however, did not record the destination or purpose of these donations, which prevented an accurate estimation of private giving to international causes.
CIESC also researched international giving of corporate foundations by examining the public tax filings of 131 Mexican corporate foundations in 2014. They then created a list of the 50 largest foundations and examined their annual and directly contacted officials from 37 of them in order to assess their
international giving. CIESC found that corporate foundations in Mexico face a number of legal and financial restrictions, which limit their ability to give internationally. As such, CIESC was unable to establish an estimate of this flow.
CIESC continued to seek an estimate of at least some corporations in Mexico by analyzing annual financial, sustainability, and social responsibility reports, along with the Global Reporting Initiative of the top ten Mexican corporations engaged abroad. This research found that these corporations provided a total of $370,000 in private giving to international causes in 2014.
S O U T H A F R I C A To collect data on South Africa, CGP partnered with Charities Aid Foundation South Africa (CAF SA) working with Colleen du Toit and Karena Cronin. CAF SA operates a database of 1,096 nonprofit organizations which serves as an informational platform for the sector. To estimate NPO support of international causes, CAF SA sent a survey to 500 NPOs. The survey was sent out three times and follow up calls were made to some organizations to obtain outstanding data. CAF SA received a total of 203 survey responses. Respondents were asked to estimate the value/amount of financial resources received from South African sources in the last financial year (2015). Eighty-three organizations provided estimates. For the 81 organizations that provided clear estimates, the total amount received is estimated at R322 million. Of these 81 organizations, only eight spent money on activities outside South Africa. Only five of these were able to provide percentages of their total private giving outside of South Africa. The total cross border philanthropy of these organizations was $1.6 million or R18.7 million.
To estimate corporate giving, CAF SA partnered with Trialogue. For the last 18 years, Trialogue, a South African company that supports corporate social investment has conducted research on trends in corporate giving. Trialogue’s findings are published in the CSI Handbook. Drawing on the Trialogue 2015 CSI Handbook and email correspondence with Trialogue staff, CAF SA was informed that cross-border philanthropy accounted for 3% of overall corporate social investment. Based on this, CAF SA
T H E I N D E X O F G L O B A L P H I L A N T H R O P Y A N D R E M I T TA N C E S 43
estimated corporate philanthropy to developing countries at $21 million or R243 million.
To estimate international volunteerism, CAF SA contacted Stats South Africa for data from their Volunteer Activities Survey. CAF SA then determined that international volunteering constitutes .05% of the overall value of volunteering and applied this percentage to the overall value of R9.9 billion. Based on this, CAF SA estimated the value of international volunteering at $441,000 or R5.1 million. The three sources, NPOs, corporations, and volunteer time, provided a total of $23 million in international private giving.
TA N Z A N I A CGP partnered with East Africa Association of Grantmakers (EAAG) to provide estimates of Tanzania’s philanthropic contributions to international causes by foundations, charities, corporations, and religious organizations. EAAG surveyed a total of 36 organizations including local NGOs, trusts, religious organizations, and corporations. EAAG found that these organizations contributed a total of $2 million to social causes in 2013, including both foreign and domestic philanthropy. EAAG’s survey found that $251,372 of the organizations’ private resources were provided for international social causes in 2013. A further $17,674 was provided to organizations based in Tanzania that worked on international issues. This came to a total of $269,046 in international private giving.
T U R K E Y To estimate Turkey’s private philanthropic
contributions to international causes, the
CGP partnered with S. Sevda Kilicalp. Sevda
Kilicalp’s study provided an estimate of
contributions from private voluntary
organizations headquartered in Turkey. She
drew her sample from Turkish Development Assistance 2013, a report prepared by the
Turkish International Cooperation and
Development Agency (TIKA), Turkey’s
principal development aid agency
responsible for collecting and reporting
Turkish ODA data to the OECD. According
to the report by TIKA, 18 nonprofit
organizations provided $280 million of
assistance to developing countries in 2012.
Sevda Kilicalp contact these organizations
between August and December 2015 and
follow-up e-mails and telephone calls resulted in final sample of seven organizations. These seven PVOs reported a total of $267,830,588 or TL586,928,416) in private giving to international development assistance.
U G A N D A CGP partnered with the East Africa Association of Grantmakers (EAAG) to provide estimates of Ugandan philanthropic contributions to international causes by foundations, charities, corporations, and religious organizations. EAAG surveyed a total of 30 organizations consisting of corporations, trusts, NGOs, and religious organizations. These organizations contributed $1,729,545 to social causes in 2013. EAAG found that, of that figure, $36,400 went towards international social causes. A further $2,000 was provided to organizations based in Uganda that worked on international causes. Thus, the total contributions to international philanthropy were $38,400.
Global Remittances
The World Bank’s 2014 bilateral matrix, which is the only comprehensive and comparable source of all bilateral remittance flows, was used to calculate remittance transfers from OECD donor countries to DAC recipient countries in 2014. Dilip Ratha and William Shaw of the World Bank created the bilateral matrix, which shows remittances by remitting and destination countries (for a complete discussion of how the matrix was compiled, including the formulas used to calculate remittances, see Dilip Ratha and William Shaw, South-South Migration and Remittances, World Bank Working Paper No. 102, 2007, Appendix A and Appendix B).
The Bilateral Remittances Matrix 2014, published by the World Bank, was used to estimate total remittances used in this Index from DAC donor countries and non-DAC donor countries to all DAC recipient countries.
Private Capital Flows
The CGP estimated the private capital flows
from DAC and non-DAC donor countries to
developing countries by following two
sources. For the majority of the DAC donor countries, the CGP used the OECD’s Table 13: Comparison of Flows by Type in 2014 updated by the OECD on December 22nd 2015 and used the number listed under “Private Flows at Market Terms.” This was used to determine the private capital flows for: Australia, Austria, Belgium, Canada, Czech Republic, Denmark, Finland, France, Germany, Greece, Italy, Japan, South Korea, Netherlands, New Zealand, Norway, Portugal, Spain, Sweden, Switzerland, the United Kingdom, and the United States.
To calculate the private capital flows for the remaining 17 DAC and non-DAC countries, the CGP used the Coordinated Direct Investment Survey and Coordinated Portfolio Investment Survey published by the IMF in 2013 and 2014. To calculate countries’ direct investment in developing countries, the CGP used the data on outward investments to DAC recipient countries for most of our DAC and non-DAC donors. In the case of China, Kenya, Tanzania, and Uganda, CGP used the inward investments as reported by DAC recipient countries. The amount of investment was calculated by measuring the change between 2013 and 2014. To calculate portfolio investment, the CGP used its countries’ investments in DAC recipient countries and measured the amount by calculating the change between December 2013 and December 2014. These methods were used to determine the private capital flows for: Ireland, Iceland, Luxembourg, Poland, Slovak Republic, and Slovenia and non-DAC countries Brazil, China, Colombia, India, Indonesia, Kenya, Mexico, South Africa, Tanzania, Turkey, and Uganda. In certain cases, the data on investment improved from 2013 to 2014, which explains the large increases in overseas private capital investment experienced by Luxembourg, Ireland, and Kenya.
H U D S O N I N S T I T U T E44
CREDITS
PUBLISHER
Hudson Institute
CENTER FOR GLOBAL PROSPERITY STAFF
Dr. Carol Adelman, Senior Fellow & Director
Bryan Schwartz, Program Manager & Research Assistant
Elias Riskin, Research Assistant
PARTNERS & SUPPORTERS
Bill & Melinda Gates Foundation
Bristol-Myers Squibb Foundation
The International Center for Not-for-Profit Law
International Development Research Centre
ADVISORY BOARD
Consuelo Castro, Executive Secretary, Mexico City Private Assistance Board Commission
Nick Deychakiwsky, Program Officer, Charles Stewart Mott Foundation
Helena Monteiro, Former Executive Director, Worldwide Initiative for Grantmaker Support
Dr. Una Osili, Director of Research, Lilly Family School of Philanthropy, Indiana University
Dr. Susan Raymond, Executive Vice President, Changing our World, Inc.
Douglas Rutzen, President and CEO, International Center for Not-for-Profit Law
David Schwartz, Director, Donor Partnerships Division, International Development Research Centre
Hanna Surmatz, Legal Counsel, European Foundation Centre
Christopher Walker, Vice President for Studies and Analysis, National Endowment for Democracy
Ricardo Wyngaard, Independent Expert
RESEARCH PARTNERS
Brazil Comunitas Anna Peliano, Senior Researcher
Canada Jason Disano Director, Social Sciences Research Laboratories University of Saskatchewan
Harley D. Dickinson Principle Investigator Professor, Department of Sociology University of Saskatchewan
Mark Stobbe PhD Candidate, Department of Sociology University of Saskatchewan
Japan CSO Network Japan Dr. Masako Hasegawa, Program Officer Ms. Kaori Kuroda, Executive Director
China China Foundation Center Liming Chen, Project Lead Tao Ze, Vice President
Colombia Makaia Asesoria Internacional Catalina Escobar, Director and Cofounder Anyi Morales, Project Lead
East Africa East Africa Association of Grantmakers Nicanor Sabula, Former Chief Executive Officer Catherine Mwendwa, Programmes Officer
India Corporate Sustainability & Reputation Consulting Sanjay Bapat, Chairman Sampradaan India Centre for Philanthropy Bain & Company INSEAD Graduate Business School
Indonesia Center for Entrepreneurship, Change, and Third Sector (CECT) Dr. Maria R. Nindita Radyati, Executive Director Ir. Sandi Merwanto, MM (CSR), Research Director
Mexico Centro de Investigación y Estudios sobre Sociedad Civil, A.C. at the Tecnológico de Monterrey, Mexico City Campus Jacqueline Butcher García-Colín, Ph.D., Director Santiago Sordo Ruz, Project Director
South Africa Charities Aid Foundation Southern Africa Collen du Toit, Chief Executive Officer Karena Cronin, Business Development Manager
Turkey S. Sevda Kilicalp, Independent Researcher
United States Urban Institute, Center on Nonprofits and Philanthropy Shena Ashley, Director Tom Pollak, Former Program Director
Timothy Triplett, Senior Research Associate and Senior Survey Methodologist Jon Durnford, Affiliated Scholar Amy Blackwood, Affiliated Scholar Shatao Arya, Research Associate Nathan Dietz, Senior Research Associate Brice McKeever, Research Associate
Social and Economic Sciences Research Center, Washington State University Danna Moore, Ph.D., Senior Research Fellow and Principal Investigator Kent Miller, M.A., Study Director
Foundation Center Reina Mukai, Manager, Knowledge Services David Wolcheck, Manager, Data Standards
CECP Carmen Perez, Director, Evaluation and Data Insights André Solórzano, Manager, Data Insights
Institute of International Education (IIE) Rajika Bhandari, Ph.D., Director, IIE Center for Academic Mobility Research and Impact Christine Farrugia, Senior Research Officer
Interns Julia Eigner Calum Farley Ethan Gacek Nishka Hatten Lara Claire Ima Jansen Christopher Johns Lori McLaughlin Andrew Warner Cheyenne Wright Sophia Wu
T H E I N D E X O F G L O B A L P H I L A N T H R O P Y A N D R E M I T TA N C E S 45
This report is based on research funded in part by the Bill &
Melinda Gates Foundation. The findings and conclusions
contained within are those of the authors and do not
necessarily reflect positions or policies of the funders.
The Bristol-Myers Squibb Foundation has been a supporter
of both the Index of Global Philanthropy and Remittances
and the Index of Philanthropic Freedom. The company is
committed to global development and philanthropy through
its valuable corporate social responsibility programs.
The International Center for Not-for-Profit Law (ICNL) has
been a valued partner, and provided advice, guidance, and
access to their talented staff. The ICNL has made generous
contributions of their time and talent to both the Index of
Global Philanthropy and Remittances and the Index of
Philanthropic Freedom.
This work was carried out with the aid of a grant from the
International Development Research Centre, Ottawa, Canada.
ACKNOWLEDGEMENTS
THANK YOU TO OUR FUNDERS
Center for Global ProsperityHudson Institute
1201 Pennsylvania Ave. N.W. Suite 400Washington, D.C. 20004
Phone: (202) 974-2430Fax: (202) 974-2410
www.hudson.org/cgp
CONTACT INFORMATION
International Development Research Centre
Centre de recherches pour le développement international
Standards for use of the IDRC logo and Canada wordmark October 2014
H U D S O N I N S T I T U T E46
The CENTER forGLOBAL
PROSPERITY
The CENTER forGLOBAL
PROSPERITY
The CENTER forGLOBAL
PROSPERITY
The CENTER forGLOBAL
PROSPERITY
1201 Pennsylvania Ave., N.W., Suite 400, Washington, DC 20004 • P: 202.974.2400
www.hudson.org/cgp