Embed Size (px)
Citation preview
Page | 1
‘The influence of CEO power on CEO compensation’
Master’s thesis
Executive Programme in Management Studies – Strategy Track
Author: Marjolein Kennedy
Student number: 10733426
Date of submission: 30-06-2016
Final version
Supervisor: Dr. Daniel Wäger
Page | 2
Statement of Originality
This document is written by Student Marjolein Kennedy who declares to take full
responsibility for the contents of this document.
I declare that the text and the work presented in this document is original and that no
sources other than those mentioned in the text and its references have been used in
creating it.
The Faculty of Economics and Business is responsible solely for the supervision of
completion of the work, not for the contents.
Page | 3
Table of contents Abstract ........................................................................................................................................................ 5
Introduction ................................................................................................................................................. 6
Literature review ........................................................................................................................................ 9
CEO power and compensation .............................................................................................................. 9
Duality ................................................................................................................................................ 11
Board independence .......................................................................................................................... 12
Tenure ................................................................................................................................................ 12
CEO gender ........................................................................................................................................... 14
Country income inequality ................................................................................................................... 17
Data and method ....................................................................................................................................... 20
CEO compensation ............................................................................................................................... 21
Duality .................................................................................................................................................... 22
Tenure .................................................................................................................................................... 22
Board independence .............................................................................................................................. 22
CEO Gender .......................................................................................................................................... 23
GINI Index ............................................................................................................................................. 23
Control variables ................................................................................................................................... 24
Results ........................................................................................................................................................ 26
Findings for duality ............................................................................................................................... 34
Findings for tenure ............................................................................................................................... 34
Findings for board independence ........................................................................................................ 35
Findings for CEO gender ..................................................................................................................... 35
Findings for country inequality / GINI index ..................................................................................... 36
Other findings........................................................................................................................................ 36
Discussion .................................................................................................................................................. 38
Conclusions and suggestions for further research ................................................................................. 40
References .................................................................................................................................................. 42
Page | 4
Table of contents for tables and figures
Figure 1 Conceptual model……………………………………….…………………………....16
Table 1 Descriptive statistics for continuous variables…………………………………........23
Table 2 Descriptive statistics for categorical variables……………………………………....24
Table 3 Correlation matrix…………………………………………………………………….26
Table 4 Multiple regression results for independent variable duality………………………28
Table 5 Multiple regression results for independent variable tenure…………………….…29
Table 6 Multiple regression results for independent variable board independence...……..30
Page | 5
Abstract
CEO compensation is a topic that has gained an increased interest in the last few decades from
researchers in the field of governance, business ethics, psychology, and (behavioral) economics.
Researchers have looked into myriad of determinants of CEO compensation, of which one is
CEO power. CEO power is a multidimensional construct which measures the amount of
influence or power a CEO has, with regard to managerial discretion or persuasion of the board
for example. This concept is used as the independent variable in this study, and is divided into
three underlying variables; duality, tenure and board independence, in order to provide an
adequate measure for this multidimensional construct. This paper empirically tests to what extent
CEO power has an impact on CEO compensation, and furthermore looks at the moderating effect
of (in)equality associated with gender and with geographical location of the firms. Results from
the regression analyses show that CEO power has a very small effect on CEO compensation.
Gender does not seem to have any moderating effect, however country income equality
moderates the relationship between CEO power and CEO compensation for the variable of
duality. Regardless of the lack of support for the hypotheses as proposed in this paper, multiple
interesting findings are presented and suggestions for further research are provided at the end of
this paper.
Page | 6
Introduction
CEO compensation has been a topic of interest for several decades, and is often connected to
income inequality. Income inequality has increased greatly over the last decades and has come to
reach almost historic heights (Alvaredo, Atkinson, Piketty, & Saez, 2013, cf: Wernicke,
forthcoming). The income-related gap in society has recently become a more popular topic of
interest and has been the catalyst for protests against for example ‘the 1%’, referencing the 1% of
population that is extremely rich and continues to grow even richer as we speak. CEO
compensation in particular has not been shied away from in the media either, such as the Enron
scandal of 2001 or that of HP in 2010 to name but a few stories that were covered in great detail
in the media. Every year, new articles pop up describing yet another outrageous CEO pay
increase in time of crisis, or an exorbitant golden parachute rewarded to a CEO who has failed,
naturally often causing enragement of the public.
Not only is CEO compensation the source of often heated public debates on the ethics of
unwarranted remuneration packages and golden parachutes, but it has also attracted researchers
in governance, business ethics and firm performance alike, trying to figure out what factors
influence CEO compensation and under what circumstances these factors might be of more
significance (Belliveau et al., 1996; Brick et al., 2006; Cordeiro et al., 2003; Hill et al., 1991;
Johnston, 2002; Mohan et al., 2003; Sauerwald et al., 2014).
Much of the extant literature has predominantly had a focus on the combination of CEO
compensation and firm performance; trying to answer the question of whether higher
compensation is equal to higher performance (Adams et al., 2005; Brick et al., 2006; Hambrick,
2007). Through years of research, the answers to this question have been diverse and opinions
seem to remain mixed. More in the background has been the research on what ought to be, in my
Page | 7
opinion, researched first to try to understand CEO compensation; namely, what actually
constitutes CEO compensation, which attributes of CEOs themselves influence CEO
compensation and under what circumstances they do so more or less strongly? This paper aims
to add to this growing body of literature and studies the influence of CEO power, by trying to
answer the research question: ‘to what extent does CEO power have an impact on CEO
compensation?’.
There has also been an increasing interest in gender equality in the realm of
compensation. It is commonly known that the average wage of females is lower than their male
counterparts in comparable job positions. Females are often assumed to be other-regarding, and
to hold fairness into higher regard than males (Eagly & Wood, 1999). As stipulated by Hambrick
and Mason’s upper echelons theory, personal characteristics can be a proxy for managerial
characteristics influence strategic choice and decision-making (Hambrick & Mason, 1984). I
therefore believe it would be interesting to see whether gender has a moderating effect when
looking at the relationship between CEO power and CEO compensation. It would be insightful if
there is data available indicating a similar level of CEO power, however with a different impact
on executive compensation due to gender. This paper is unique in this sense, because gender and
equality in respect to compensation are certainly research areas which are understudied.
Especially matching CEO power with CEO gender and the underlying assumption of equality is
a topic that is novel and thus a valuable add-on to existing literature.
Another large influence of equality can be sought in culture; certain cultures value
fairness and equality more than others. In order to dig deeper into the role that regard for equality
plays in rewarding CEOs, the moderating role of equality per geographical region is also
researched in this paper. Both moderators are based on the same idea, namely that the influence
Page | 8
of CEO power should be lower when there is a higher concern for equality within a firm. I thus
theorize that the aversion to inequality is higher in firms led by female CEOs or in firms
headquartered in countries with low income inequality.
Both gender and geographical region with regard to equality in CEO compensation are
understudied research areas. This paper will thus create new insights and open up avenues for
future research.
The dataset used in this paper include the 500 companies as specified in the Financial
Times Global 500. The use of this specific global dataset creates a novel viewpoint, as most
extant literature limits itself to the North American market.
In the first part of this paper, a concise literature review including the proposed
hypotheses is presented. In the second part, the empirical research is presented by further
reviewing the dataset, variables, and study design, followed by the empirical results. Finally,
conclusions are offered and suggestions for future research are given.
Page | 9
Literature review
Executive compensation has been a topic of research interest for a very long time, and hundreds
of empirical studies have been done to define the key determinants of CEO compensation,
however mostly with mixed outcomes (Finkelstein & Boyd, 1998). Starting from an economics-
based viewpoint, the research has started shifting to a more social, political, and strategic focus
(Baker, Jensen & Murphy, 1988; cf. Finkelstein & Boyd, 1998).
CEO power and compensation
Agency theory has been, and still is, the main argument in explaining CEO compensation; the
conflict of interest between shareholders and the CEO is a perfect example of an agent-principal
problem. In light of self-interest, shareholders are assumed to want maximized stock returns,
where the CEO would want maximized private returns. Their demands clash, and according to
agency theory, only a monitor can solve this problem (Alchian & Demsetz, 1972). Yet still, a
monitoring board does not necessarily solve the problem. As has been shown in extant literature,
there are mixed empirical findings on the actual impact of the board and their monitoring, and it
has been suggested there are other contingencies that determine CEO compensation (Brick et al.,
2006; Ryan et al., 2004; Sauerwald et al., 2014).
Williamson’s model of managerial discretion (1964) is the forerunner of the principal-
agent problem (which was developed in the 70s) and laid the foundation theory for the self-
interested manager whose aim it is not to maximize company profit but their own utility. Agency
theory however does not account for differences between individuals. As stipulated by Alvesson
(2004), agency theory certainly has a few drawbacks, but most importantly he criticizes the
either/or situation in agency theory, there is always only one contract in agency theory. Instead,
Alvesson argues that there is always a combination of controls at the same time. This notion can
Page | 10
also be applied to CEO compensation; it is fair to say that there is a principal-agent relationship
between shareholders and the CEO, however this is likely not to be the only determinant of the
level of compensation. What about other situational, geographical, or social factors? Behavioral
economists have been moving away from the idea that everyone is self-interested, giving leeway
to new theories.
Sauerwald et al. (2014) do a very good job in explaining the power that a CEO could
have over a board in their article on board social capital and excess CEO returns, using a well
thought out theory cross-over from agency theory and social capital theory. They argue that
boards have to comply with normative pressures from both their external and internal social
networks. These normative pressures however, may not always be in the best interest of the
shareholders. Powerful CEOs may enhance or constrain these normative pressures, as they
influence the director selection process, so they may magnify certain norms favoring excess CEO
returns. Powerful CEOs may thus alter normative pressures to follow managerial preferences and
go against the shareholder’s interest, because CEOs have the power to refuse to recommend
board directors to other firms and to ensure that they will not easily be hired somewhere else
(Sauerwald et al., 2014).
Wernicke (forthcoming) borrows from social comparison theory to argue why inequality
has grown, CEOs look at the pay of peers and take that as the norm, this creates a vicious cycle
of increasing pay. The information era we live in further allows this comparison, according to
Wernicke as executive compensation information is often easily accessible. Wernicke attempts to
look at the true social factors that influence executive pay (inequality), however social
comparison theory fails to answer the question why social forces do not have the power to curb
Page | 11
excessive pay inequality. Rationally, you would argue that the influence of social force should be
much larger as information is quite readily available to anyone (Wernicke, forthcoming).
CEO power will be measured in this paper by a combination of proxies, as is typical in
the large stream of extant research (Coles, Daniel, and Naveen, 2008; Haynes and Hillman,
2010; Zhang and Rajagopalan, 2003; cf. Sauerwald et al., 2014). The measures for CEO power
that I will use in my paper are the following, CEO tenure, CEO duality, the number of board
members the CEO has appointed. These measures are among the most widely used and studied
proxies to measure CEO power (Zhang and Rajagopalan, 2003). CEO power has been used as a
control variable or a mediator role in past research (Sauerwald, 2014), in this paper however it
will be the main topic of the research question in this paper: ‘To what extent does CEO power
have an impact on executive compensation?’.
Duality
As Boyd (1995) mentions, duality offers direction of a single leader. As you might expect, this
comes with advantages and disadvantages. What is however incontestable, is that with duality
also a certain sense of power is created. Whereas a CEO may be overruled by the board in a
situation where the CEO does not simultaneously chair the board, this can become a problem
when the CEO does carry out this tandem job. The chair of a board naturally has the right to
veto, thus this could imply great impact. Furthermore, the argument that has been carried
forward by Sauerwald et al. (2014) that a CEO may hire board members which creates CEO
power, is even more magnified when the CEO is simultaneously chair of the board. As is further
stipulated by Finkelstein et al. (1994) CEO duality furthers entrenchment, and thus diminishes
board monitoring effectiveness.
Based on these arguments, I propose hypothesis 1a.
Page | 12
H1a: CEO compensation is higher for firms, in which the CEO is also chairman of the board of
directors.
Board independence
Ryan & Wiggins (2004) note that it is generally accepted that a more independent board is better
for corporate governance, and independent boards are more willing to monitor the CEO
(Hermalin & Weisbach, 1998). Ryan & Wiggins pose that in situations with a higher degree of
board independence, the CEO has less of an influence on decisions with regard to board directors
to continue to serve on the board or to serve on another board. Independent board members are
less reliant on the CEO’s decision, and they even have a better bargaining position with the CEO
compared to insider board members (Ryan & Wiggins, 1998). It is thus fair to argue that when
the degree of board independence is lower, the CEO has more influence and consequently more
power. The degree of board independence is often set in company policy, however board
independence might also link to CEO tenure. As is further stipulated below, over the course of a
CEO’s tenure, a CEO may gain increasing power and is sometimes even able to circumvent the
system and the monitoring of the board. Over time, a CEO might personally appoint an
increasing amount of board members, which increases their power and weakens the board
monitoring. I thus propose hypothesis 1b.
H1b: The higher the number of board members the CEO has appointed, the higher her/his
compensation.
Tenure
Hill et al. (1991) look at the specific feature of tenure as a determinant of pay, and
provide several interesting findings. In their expectations, multiple sound reasons corroborated
by previous literature, are provided as to why tenure would increase a CEO’s power. A CEO
Page | 13
who has been in a position longer can appoint new board members throughout the years of tenure
(Finkelstein & Hambrick, 1989, cf: Hill et al. 1991). Secondly, as tenure increases, they can
learn to work the system and influence internal information flows, making it possible to withhold
information (Coughlan & Schmidt, 1985, cf: Hill et al. 1991) or to even change the board agenda
and to cast themselves in the most favorable light. These reasons combined, make for tenure to
be an often-used proxy to determine the power a CEO has over their board, and thus over their
compensation packages. According to Hill et al. (1991), agency theory enforces a link between
pay and stock returns to satisfy shareholders. They find in their research that this relationship
between CEO pay and stock returns weakens with tenure, providing evidence that tenure indeed
influences CEO power in the sense that a CEO could over time circumvent the monitoring of the
board and strengthen their position with the shareholders (Hill et al., 1991). Johnston (2002)
finds further evidence that CEO compensation is linked to tenure, he however links the level of
pay to a reward for earlier successful performance reached in the CEO’s tenure with the
company. Results from Johnston’s 2005 research show that tenure is negatively related to the
awarding of share options and the total value of remuneration packages, however longer tenure is
associated with higher baseline salaries.
Based on the abovementioned arguments, I propose hypothesis 1c:
H1c: As a CEO’s tenure increases, their executive compensation also increases.
Another interesting addition from outside of the field of management, is that of Peterson
et al. (2003). They posit that a CEO’s personal characteristics influence the dynamics of the top
management team, which henceforth influences the firm’s performance. Peterson et al.’s article
provides a valuable addition to the implications that the upper echelons theory has for corporate
Page | 14
governance, as they point to the high influence a CEO’s personality may have on their followers
in the top management team. They suggest that the board of directors should play a larger role in
monitoring the climate of the top management team as created by the CEO. This is a fair
warning, but one that may be obsolete, or just too simple of a solution. As Hill et al. (1991)
rightfully point out, a CEO may be able to even circumvent the monitoring board of directors
through the use of information and by ‘playing the system’, by using their tenure as a source of
CEO power; a managerial characteristic.
As described, CEO power is widely researched, and can be considered a managerial
characteristic worth looking at in terms of compensation. CEO power is thus the key determinant
in this paper, which aims to answer the research question: ‘to what extent does CEO power have
an impact on CEO compensation?’.
Carpenter et al. (2004) further note that indirect effects may as well be observed with
regard to socially constructive, normative standards, suggesting that executive effects may in fact
reflect the firm’s and its management’s embeddedness in a broader institutional environment
(Carpenter et al., 2004: pg 29). Drawing on this conclusion, country (in)equality is introduced in
this paper as moderating variables. Furthermore, drawing on the upper echelons theory, CEO
gender is used as a moderating variable.
CEO gender
According to Croson & Gneezy (2004), the two main empirical results in the labor market that
signify a gender difference are 1) the gender gap, referring to the average wage gap between
males and females, and 2) wage discrimination, referring to lower wages for workers with
similar characteristics but different gender. Eagly and Wood (1999) delve deeper into the
behavioral differences between sexes and the reasons for these differences. In their article they
Page | 15
examine two theories; psychological disposition and social structure. Naturally, as men and
women hold different sex-specific evolved mechanisms, they tend to occupy different social
roles due to psychological differences. Social structure on the other hand argues the other way
around; because men and women occupy different social roles, they become psychologically
different so as to adjust to these roles (Eagly & Wood, 1991: pg 408). Important to note here, is
that the social structure is a structure created by mankind and boosted by societal and cultural
circumstances. Eagly and Wood (1999) further stipulate that the behavioral differences between
the sexes cannot be explained by a simple nature versus nurture, but instead we should think in a
more hybrid form of nature and nurture, as the importance of both factors cannot be negated by
the other. The archetypal family and economic roles of men and women, can even today still
largely be described as that of resource provider and homemaker. According to social structure
theory, men and women seek to accommodate to these roles in terms of psychological attributes
and social behavior, creating a distinction between agentic behavior, typically attributed to men,
and communal behavior, typically attributed to women (Eagly & Wood, 1999). Women, for
example, are expected to be more other-regarding and compassionate than men. In general,
women are more often associated, whether stereotypical or not, with personality traits including
trust, fairness, reciprocity, and altruism.
Gender differences with effect on wage have also been looked at from an economic point
of view, mostly through economic games. In Solnick’s 2001 article on gender differences in the
ultimatum game, she looks at different outcomes of different game set-ups and finds specific
differences between the sexes. Also Eckel and Grossman (2001) specifically look at gender as a
variable in the ultimatum game. They find differences between the sexes as well, based on their
findings they posit that women have different social norms regarding fairness and equality than
Page | 16
men do (Eckel & Grossman, 2001; cf. Solnick, 2001). Solnick (2001) adds to this notion of
fairness, by concluding that it is likely that female players are reluctant to reject an offer and
cause both players to gain nothing when the other player is visible, however when the impact is
less obvious female players mostly adhere to their wish of receiving their fair share.
Hambrick and Mason (1984) proposed that demographics of executives can be used as a
proxy to measure personal characteristics, which are very hard to measure. The key notions in
Hambrick and Mason’s theory are around the characteristics of executives or top management
teams, and their respective influence on decision-making within the firm. These characteristics
cover cognitions, values and norms, and perceptions of the person at stake (Hambrick & Mason
1984). According to Hambrick and Mason’s research, these characteristics influence the way in
which strategic decisions are made. As most determinants in their model are hard to measure
(such as cognitions and values), Hambrick and Mason rely on previous research on demography
and suggest that it is sufficient to measure managerial characteristics in order to get a view of
differences in cognition, perception and values (Carpenter et al., 2004). Specific demographic
characteristics such as age, education, tenure, etc. are used as proxies for psychological behavior
or constructs which shape your idea about the world and thus shape the strategic choices you
make (Carpenter et al., 2004).
Prior research has shown that Hambrick & Mason’s 1984 upper echelons theory can be
used very broadly and can be applied to multiple constructs, further linking it to firm
performance as opposed to strategic profiles, and also using it different firm contexts by
introducing new variables to the model (Carpenter et al., 2004). Their research has also provided
building blocks for further theory for the benefits of not only management, but also psychology
and mainstream economics (Carpenter et al., 2004). Recent interesting upper echelons research
Page | 17
in economics, finds valuable information to be used in management, however. Bertrand and
Schoar (2003) posit that top managers have a significant influence on how company resources,
such as investments, acquisitions, and other expenditures, are allocated. They find in their 2003
paper that manager fixed effects matter in decision-making, and moreover they propose several
patterns in managerial decision-making, explaining different managerial styles in similar
economic situations by attributing this to managerial (upper echelon) characteristics such as birth
cohort and educational experience. One of the interesting findings of Bertrand and Schoar’s 2003
paper with regard to compensation, is that manager fixed effects is related to manager
compensation levels, attributing this to management styles more prone to create value (initially
influenced by managerial upper echelon characteristics).
Following Hambrick & Mason’s Upper Echelons Theory (1984; 2007), executives'
experiences, values, and personalities influence their perceptions and interpretations, and thus
choices. I theorize that possibly due to certain character traits that are more commonly assigned
to women in the work field, such as a high regard of equality and fairness, there is a moderating
effect to be seen that weakens the direct effect of CEO power on CEO compensation. Thus,
‘female CEO’ is used as a moderating variable, and I suggest the following hypothesis:
H2: The relationship between CEO power and CEO compensation is moderated by the CEO
gender; when the CEO is female this direct relationship is weaker.
Country income inequality
Institutional theory was introduced in the late 1970s as a new field in organizational sociology.
The initial general argument within this theory was that formal organizational structure did not
just reflect technological imperatives and resource dependencies, but instead it reflected
institutional forces such as norms and values among other things (Scott, 2008). Over the last few
Page | 18
decades, institutional theory developed into a more well-defined and concrete theory.
Institutional theory states that institutions are forces on individuals and organizations, by creating
social pressures and setting the standard of what is considered acceptable and what is not. This
divide creates pressures, which have been divided into three pillars, namely normative, coercive,
and mimetic (DiMaggio & Powell, 1983). Income inequality could be placed in these social
pressures, and may become a social pressure through isomorphism. Firms often look to each
other for guidance, which might create a homogeneity based on a norm. Normative pressure
deals with social patterns and they become a pressure for organizations or individuals to comply
with norms or to act in a way that is regarded as normal or expected. This creation of a
homogeneity is referred to as isomorphism (Dimaggio & Powell, 1983).
Institutional theory does not only focus on individual organizations, but there is a large
sub-set of the literature focusing on the organizational field, which is characterized by a number
of organizations participating in the same cultural and social sub-system (Dimaggio & Powell,
1983). Organizations are key players in shaping the environment (Scott & Davis, 2007; cf. Scott,
2008), thus heavily influencing norms and values. One could argue that there is a vicious cycle
with organizations shaping the environment and the environment shaping organizations through
mimicking norms and values. What is however indisputable is that organizations and the
environment are closely related and thus influence each other heavily.
In this paper, I build on the institutional theory, and hypothesize that in countries where
there are higher levels of income equality, the CEO compensation will be lower even though the
CEO has considerable power. This will be tested through the following hypothesis:
H3: The relationship between CEO power and CEO compensation is weaker when there are
lower levels of inequality in the country where the firm is headquartered.
Page | 19
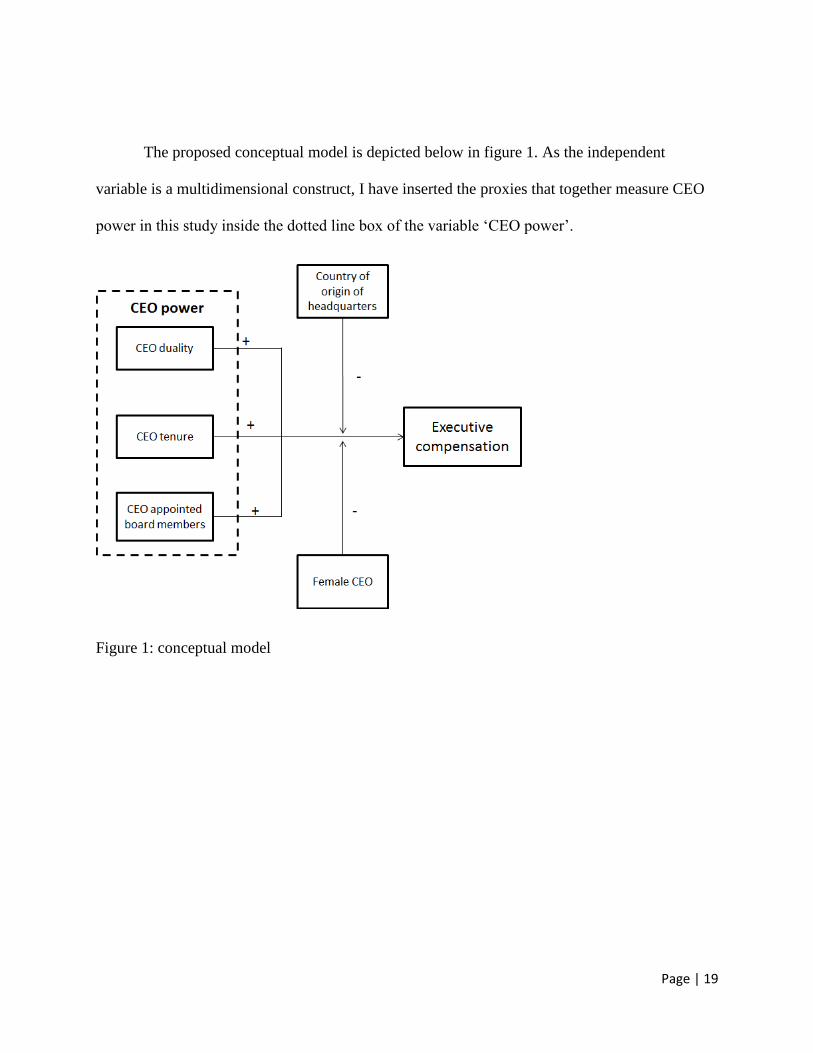
The proposed conceptual model is depicted below in figure 1. As the independent
variable is a multidimensional construct, I have inserted the proxies that together measure CEO
power in this study inside the dotted line box of the variable ‘CEO power’.
Figure 1: conceptual model
Page | 20
Data and method
As Sauerwald et al. (2014) point out, CEO power is a multidimensional construct, that is
typically measured through a combination of two or more individual measures. Following
existing research, I will measure commonly used features to measure CEO power, these are 1)
CEO tenure, 2) CEO duality, and 3) the amount of directors in the board that have been
appointed by the current CEO (in this paper, this variable is interchangeably named ‘board
independence’). These three variables all measure CEO power within the firm, as opposed to
other forces which could be an external boost to or constraint on CEO power (such as for
example media coverage).
For the independent variables (CEO power), and the moderating and control variables,
data from the year 2012 has been collected. For the dependent variable (CEO compensation) data
from the year 2013 has been collected. The data is limited to these years, in order to ensure that
the dependent variable indeed is the outcome of the independent variable, and furthermore this
will reflect the current environment.
Moreover, certain control variables will be added to the analysis in order to correct for
unwanted effects and to ensure validity. I will control only for the most salient factors such as
industry, geographical region (continent), and financial performance of the firm, and firm size.
The sample as used in this paper consists of the 500 companies which are included in the
Financial Times Global 500. This index provides an overview of the top 500 companies
worldwide, ranked on the value of their market capitalization. The market capitalization is
measured by multiplying the share price and number of shares issued, thus the greater the stock
market value of a firm, the higher it is listed. The main reason that the Financial Times Global
500 was used as a dataset, is because as the name already mentions it is global. Much, if not
Page | 21
most, of the extant research on CEO compensation focuses on North American companies only,
as this data is generally more easily retrievable due to legislation. However, to extend current
research it is of high value to look at this topic from a global angle versus isolated to one
geographical region. Having global data allows you to gain a valuable insight into possibly
replicating and extending earlier findings that only applied to North America for example.
Furthermore, it allows you to compare and contrast CEO compensation per geographical region,
providing a unique insight.
The hypotheses will be tested by running three hierarchical multiple regressions, one for
each independent variable. By running different regressions for the independent variables, it is
possible to gauge whether one or more proxies has a different effect than the others.
CEO compensation
Information on CEO compensation has been retrieved from the Thomson One Asset 4 database.
This database includes objective data on environmental, social, and governance information,
based upon myriad KPIs and datapoints. The variable used to measure the CEO compensation, is
described as ‘the value of the highest yearly remuneration package in dollars within the
company’, and is numerical. The data for CEO compensation has been collected for the year
2013, in order to be able to correctly measure the effect of the independent variables. CEO
compensation data was available for 326 out of the 500 Financial Times Global 500 companies.
This creates a large enough and representative sample in order to run the necessary statistical
tests.
Page | 22
Duality
Duality is used as one of the proxies to measure CEO power in this paper. Duality signifies the
‘double position’ a CEO can be in, by simultaneously being the CEO of a company and the
chairman of the board of that same company. Duality is considered a binary variable in this
paper, either CEO is also the chairman of the board, signified by a 1, or they are not, signified by
a 0. For statistical purposes, in order to be able to correctly run a regression test, the binary
variable is treated as a numerical variable.
Tenure
Tenure, the amount of years the CEO has been in their current position, is the second measure
used to gauge CEO power. This variable is numerical, and is measured by simply adding up the
years this person has been the CEO of the company he/she works for now. Data for this variable
is collected for the year 2012, and has been manually collected from company websites and
generic company index websites such as Bloomberg and Reuters. In the case a CEO was
appointed in the year 2012 itself, a tenure of 0 years was registered. The information of CEO
tenure has been collected for 431 CEOs, with years of service ranging from 0 years to a stunning
55 years. This wide range in tenure created some issues with skewedness in the data, which has
been dealt with accordingly as presented in the Results section of this paper.
Board independence
Board independence is the third variable that concludes the independent variables which are used
to measure CEO power within the firm. This variable stands for the amount of board members
that have been appointed by the current CEO. The data is collected from the Thomson One Asset
Page | 23
4 database, which reports the percentage of independent board members as reported by the
company.
CEO Gender
As a first moderating variable to possibly have effect on the relation between CEO power and
CEO compensation, CEO gender is measured. There has been some research on gender
differences in compensation (Adams et al., 2007; Mohan et al., 2003; Shin, 2012) but empirical
results seem mixed and have not developed a proven theoretical structure for this possible
difference. Gender has been chosen as a moderator in this paper, because there is theory
suggesting that women value fairness and equality more than men (Eagly & Wood, 1999). This
would suggest that females would accept a lower compensation than their male counterparts. For
the CEOs in the dataset, I verified whether this person is male or female. A male CEO is codified
as 0 in the sample, and a female CEO is codified as 1, creating another binary variable which is
treated as a numerical variable. After codifying the data, it can easily be said that male CEOs
dominate the sample by far, with 412 male CEOs against 18 female CEOs.
GINI Index
To continue in the realm of equality, I will assess whether the country where the headquarters is
based, could have a moderating effect on the relationship between CEO power and CEO
compensation. Geographical region is thus theorized to have a moderating impact on this
relationship.
The level of equality, is measured by using the GINI index. This index measures how the
distribution of income within a certain economy compares to a perfectly equal distribution. The
Page | 24
GINI Index on equality is a score ranging of 0 to 100, indicating the level of equality of salaries
among the whole workforce of that specific country, where 100 signifies perfect equality and a
score of 0 indicating perfect inequality. The GINI index is calculated by plotting the cumulative
percentages of total income received against the cumulative number of recipients on a Lorenz
curve, starting with the poorest individual or household
(http://data.worldbank.org/indicator/SI.POV.GINI). These plots provide a score ranging from 0
to 100, 0 representing perfect equality and 100 implying perfect inequality.
GINI index scores from the host countries of headquarters have been collected from the
year 2012, with the exception of the United States of America for which a GINI index score for
the year 2013 has been collected due to missing data for this country for the year of 2012.
Control variables
In order to correct for unwanted effects and to ensure validity, control variables are used. I will
control only for the most salient factors such as industry, geographical region (continent), firm
performance, and the firm size. Firm financial performance will be measure by Return on Assets
(ROA), which is the net income divided by total assets. Following extant research, total assets
seems to be most commonly used to measure firm size, as opposed to number of employees for
example.
Two of the control variables, industry and geographical region, are categorical, and were
therefore recoded into dummy variables. The geographical regions are divided into the six
continents: North America, South America, Europe, Africa, Asia, and Australia. North America
serves as the baseline group in this dummy variable, since it represents the majority of the
Page | 25
sample (N=166) for continent North America). Industry types have been classified according to
the Industry Classification Benchmark (ICB), as typified and maintained by FTSE International
Limited, and used at the majority of global stock markets. This index divides all industries in ten
overarching categories: financials, consumer goods, consumer services, basic materials,
healthcare, telecommunication, technology, oil & gas, and utilities. Financials serve as the
baseline group for this dummy variable, as it represents the majority of the sample (N = 64 for
industry financials)
Page | 26
Results
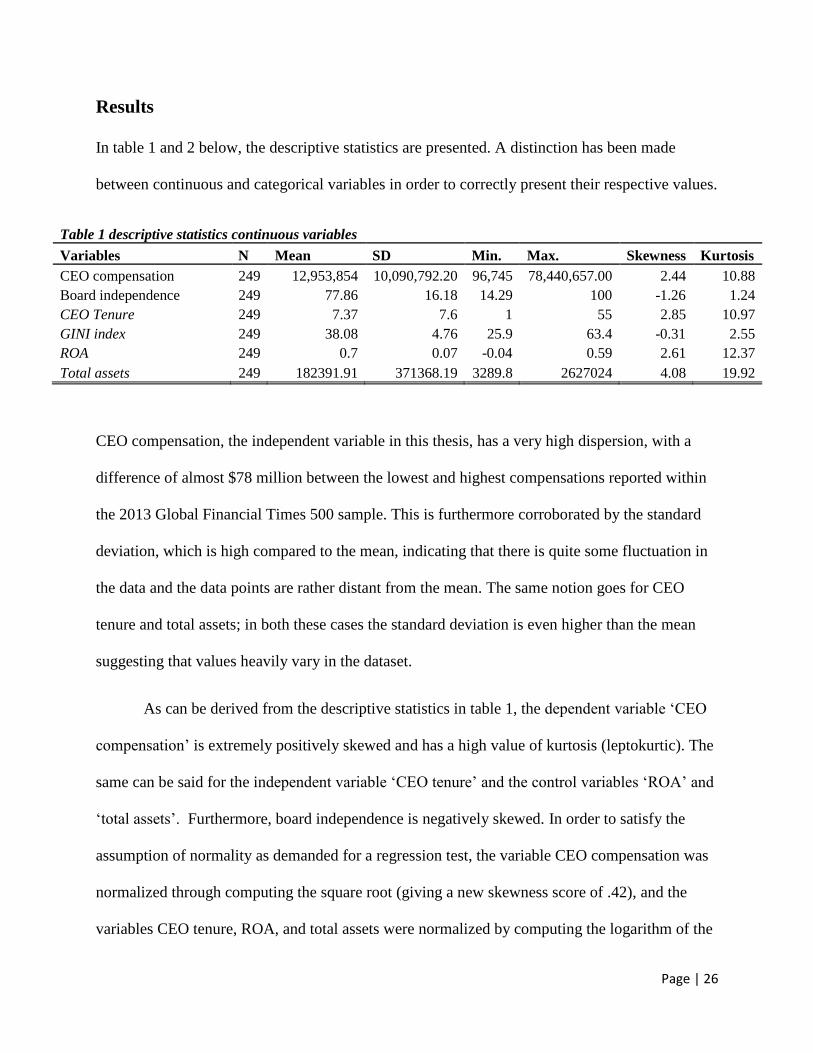
In table 1 and 2 below, the descriptive statistics are presented. A distinction has been made
between continuous and categorical variables in order to correctly present their respective values.
Table 1 descriptive statistics continuous variables
Variables N Mean SD Min. Max. Skewness Kurtosis
CEO compensation 249 12,953,854 10,090,792.20 96,745 78,440,657.00 2.44 10.88
Board independence 249 77.86 16.18 14.29 100 -1.26 1.24
CEO Tenure 249 7.37 7.6 1 55 2.85 10.97
GINI index 249 38.08 4.76 25.9 63.4 -0.31 2.55
ROA 249 0.7 0.07 -0.04 0.59 2.61 12.37
Total assets 249 182391.91 371368.19 3289.8 2627024 4.08 19.92
CEO compensation, the independent variable in this thesis, has a very high dispersion, with a
difference of almost $78 million between the lowest and highest compensations reported within
the 2013 Global Financial Times 500 sample. This is furthermore corroborated by the standard
deviation, which is high compared to the mean, indicating that there is quite some fluctuation in
the data and the data points are rather distant from the mean. The same notion goes for CEO
tenure and total assets; in both these cases the standard deviation is even higher than the mean
suggesting that values heavily vary in the dataset.
As can be derived from the descriptive statistics in table 1, the dependent variable ‘CEO
compensation’ is extremely positively skewed and has a high value of kurtosis (leptokurtic). The
same can be said for the independent variable ‘CEO tenure’ and the control variables ‘ROA’ and
‘total assets’. Furthermore, board independence is negatively skewed. In order to satisfy the
assumption of normality as demanded for a regression test, the variable CEO compensation was
normalized through computing the square root (giving a new skewness score of .42), and the
variables CEO tenure, ROA, and total assets were normalized by computing the logarithm of the
Page | 27
respective values (giving new values of -.06, -.27, and .56 respectively). Board independence
was normalized by computing higher powers (giving a new value of -.75). After normalizing, the
skewness and kurtosis values were all reduced to acceptable numbers in order to continue with
the statistical tests.
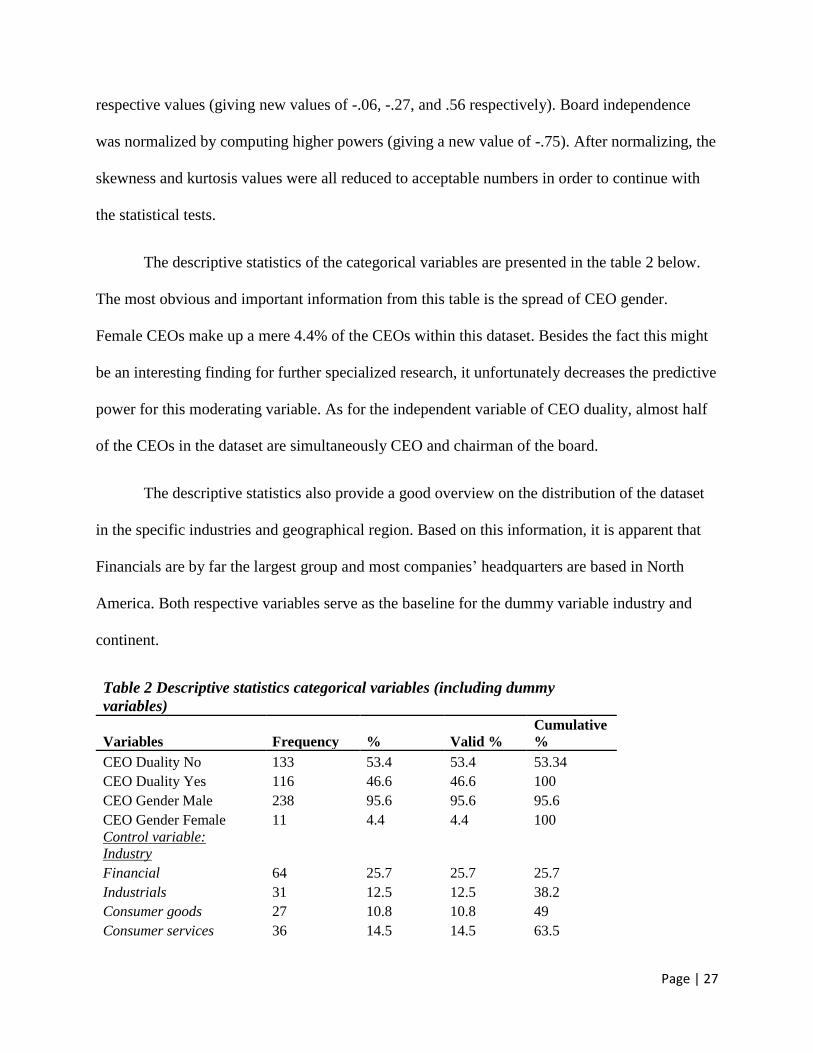
The descriptive statistics of the categorical variables are presented in the table 2 below.
The most obvious and important information from this table is the spread of CEO gender.
Female CEOs make up a mere 4.4% of the CEOs within this dataset. Besides the fact this might
be an interesting finding for further specialized research, it unfortunately decreases the predictive
power for this moderating variable. As for the independent variable of CEO duality, almost half
of the CEOs in the dataset are simultaneously CEO and chairman of the board.
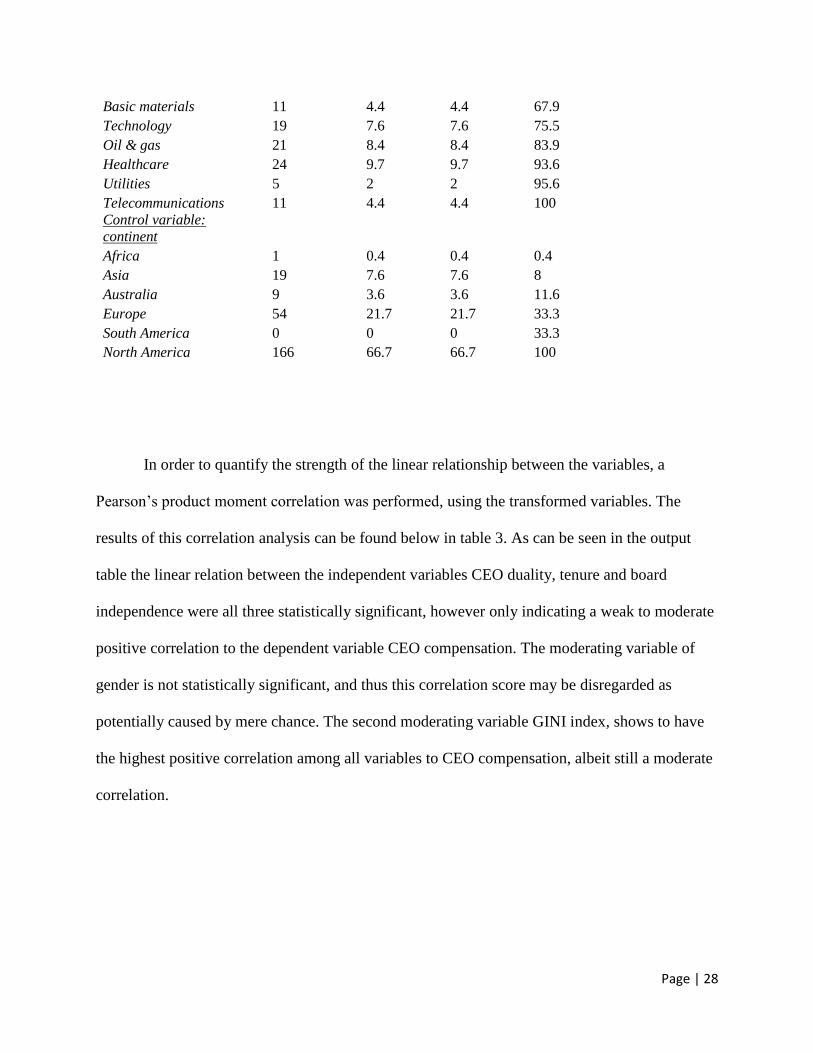
The descriptive statistics also provide a good overview on the distribution of the dataset
in the specific industries and geographical region. Based on this information, it is apparent that
Financials are by far the largest group and most companies’ headquarters are based in North
America. Both respective variables serve as the baseline for the dummy variable industry and
continent.
Table 2 Descriptive statistics categorical variables (including dummy
variables)
Variables Frequency % Valid %
Cumulative
%
CEO Duality No 133 53.4 53.4 53.34
CEO Duality Yes 116 46.6 46.6 100
CEO Gender Male 238 95.6 95.6 95.6
CEO Gender Female 11 4.4 4.4 100
Control variable:
Industry
Financial 64 25.7 25.7 25.7
Industrials 31 12.5 12.5 38.2
Consumer goods 27 10.8 10.8 49
Consumer services 36 14.5 14.5 63.5
Page | 28
Basic materials 11 4.4 4.4 67.9
Technology 19 7.6 7.6 75.5
Oil & gas 21 8.4 8.4 83.9
Healthcare 24 9.7 9.7 93.6
Utilities 5 2 2 95.6
Telecommunications 11 4.4 4.4 100
Control variable:
continent
Africa 1 0.4 0.4 0.4
Asia 19 7.6 7.6 8
Australia 9 3.6 3.6 11.6
Europe 54 21.7 21.7 33.3
South America 0 0 0 33.3
North America 166 66.7 66.7 100
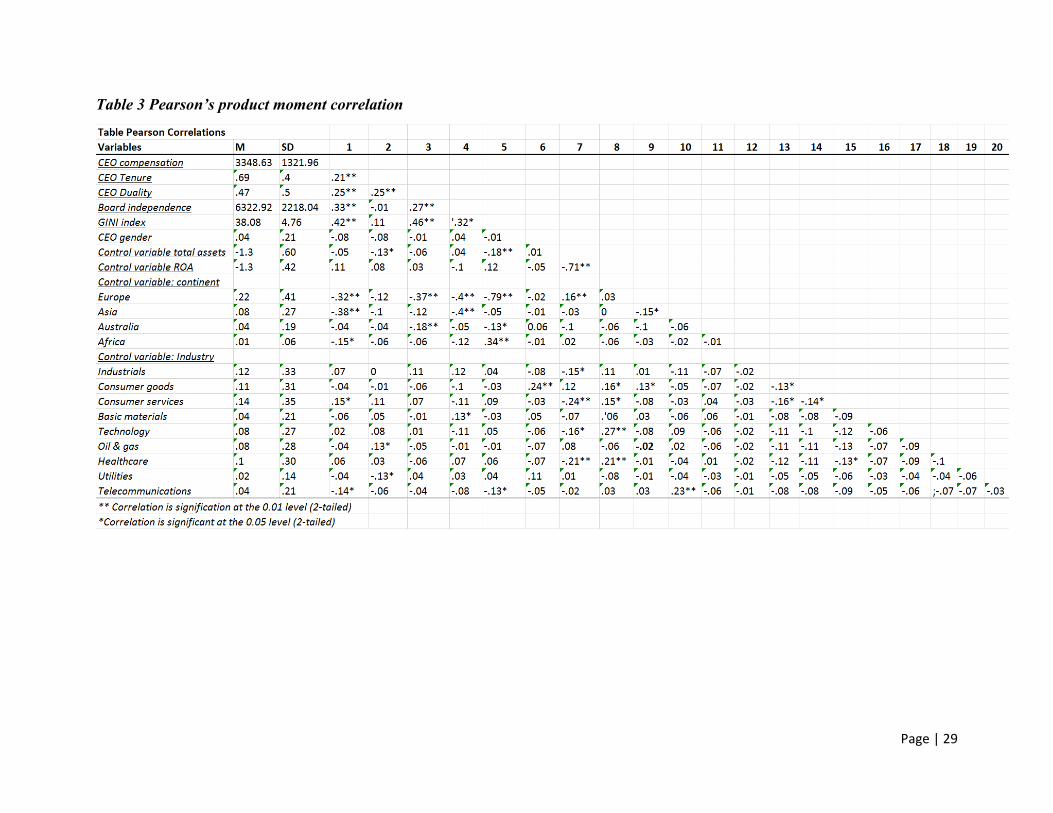
In order to quantify the strength of the linear relationship between the variables, a
Pearson’s product moment correlation was performed, using the transformed variables. The
results of this correlation analysis can be found below in table 3. As can be seen in the output
table the linear relation between the independent variables CEO duality, tenure and board
independence were all three statistically significant, however only indicating a weak to moderate
positive correlation to the dependent variable CEO compensation. The moderating variable of
gender is not statistically significant, and thus this correlation score may be disregarded as
potentially caused by mere chance. The second moderating variable GINI index, shows to have
the highest positive correlation among all variables to CEO compensation, albeit still a moderate
correlation.
Page | 29
Table 3 Pearson’s product moment correlation
Page | 30
As a Pearson’s product moment correlation merely tests the strength of a linear
relationship between variables, a multiple regression was performed in order to better assess the
strength of the relationship between the variables and to see which predictors add most variance
to the model.
Tables 4, 5 and 6 report standardized beta values and standard errors of the multiple
regression, furthermore at the bottom line of the table in the notes, the R2 and R2 change is
included for each model. Four steps have been run in this hierarchical multiple regression,
consistently adding a new variable to each step in order to gain an overall insight into the
specific effects of individual variables and their contribution to the model as a whole, and to
understand the relationship between the independent variable and the dependent variable and
their potential moderators. In the first step only control variables have been included in the
regression in order to account for any fixed effects caused by auxiliary variables. In the second
step, in the second column of the table, the independent variable has been added to the model.
Thirdly, the first moderating variable CEO gender and the interaction term for the independent
variable times CEO gender has been added to the model, and finally the second moderator
geographical region/GINI index value and its correspondent interaction term has been added to
complete the model and its constituent variables. Overall, I find that only tenure of the
independent variables that constitute CEO power altogether is statistically significant in
explaining the variance in CEO compensation, albeit with a low β value. Similar results are
found for the moderator CEO gender, implying no difference has been found between
compensation for male and female CEOs. The second moderator of country inequality does show
some significant findings. In the paragraphs below, the results and their implications for each
multiple regression is considered in further detail.
Page | 31
Table 4 Hierarchical multiple regression for independent variable Duality
Model 1 Model 2 Model 3 Model 4
Independent variable Duality .03 (163.21) .03 (163.74) -.01
Moderating variable CEO gender -.06 (71.2)
Moderating variable GINI index .14
Duality x Gender -.02 (69.98)
Duality x GINI index .66***
Control variable Industry
Industrials .02 (288.70) .02 (292.39) .02 (293.38) -.01 (281.82)
Consumer goods .01 (299.77) .01 (304.17) .02 (312.59) -.02 (304.82)
Consumer services .17* (284.49) .17* (287.52) .17* (288.25) .11 (279.03)
Basic materials -.04 (380.47) -.04 (382.33) -.04 (387.64) -.06(371.92)
Technology .02 (349.35) .02 (350.28) .02 (351.6) .01 (337.70)
Oil & gas -.03 (287.84) -.03 (288.32) -.03 (289.73) -.03 (280.95)
Healthcare .07 (316.12) .07 (316.98) .07 (318.42) .02 (310.23)
Utilities -.04 (502.70) -.05 (504.60) -.04 (516.51) -.07 (497.66)
Telecommunications -.01 (378.10) -.01 (379.61) -.02 (381.76) .01 (366.81)
Control variable continent
Europe -.41*** (182.59) -.40*** (205) -.4*** (206.19) .03 (368.65)
Asia -.45*** (269.51) -.45*** (275.41) -.45*** (276.35) -.35*** (283.75)
Australia -.17* (372.89) -.13* (388.40) -.13* (390.63) -.02 (406.23)
Africa -.16** (1070.85) -.16** (1076.07) -.16** (*1078.78) -.33*** (1337.34)
Control variable total assets .23** (189.21) .22** (190.91) .22** (191.41) .16* (185.72)
Control variable ROA .19* (273.16) .19* (273.61) .18* (274.58) .11 (267.45)
This table provides standardized beta values (and standard errors)
N = 249
Note. Statistical significance: *p <.05; **p <.01; ***; p <.001
Note: R² = .40***; ΔR² = .00 for model 2; ΔR² = .00 for model 3; ΔR² = .06*** for model 4
Page | 32
Table 5 Multiple regression for independent variable Tenure
Model 1 Model 2 Model 3 Model 4
Independent variable Tenure .12* (181.93) .12* .11
Moderating variable CEO gender -.05
Moderating variable GINI index .51***
Tenure x Gender -.01
Tenure x GINI .06
Control variable Industry
Industrials .02 (288.70) .03 (286.24) .03 (287.75) -.02 (278.97)
Consumer goods .01 (299.77) .02 (297.53) .03 (303.62) -.03 (297.79)
Consumer services .17* (284.49) .17* (281.89) .17* (282.75) .11 (276.52)
Basic materials -.04 (380.47) -.04 (377) -.04 (379.14) -.06 (366.61)
Technology .02 (349.35) .02 (346.16) .02 (347.25) -.01 (337.19)
Oil & gas -.03 (287.84) -.01 (288.28) -.01 (289.5) -.03 (278.66)
Healthcare .07 (316.12) .08 (313.49) .08 (314.6) .02 (308.18)
Utilities -.04 (502.70) -.02 (504.97) -.02 (520.93) -.05 (506.82)
Telecommunications -.01 (378.10) 0 (375.23) 0 (376.68) .01 (363.48)
Control variable continent
Europe -.41*** (182.59) -.40*** (181.64) -.40***(182.52) .01 (365.15)
Asia -.45*** (269.51) -.44*** (269.25) -.44*** (270.1) -.36 (274.51)
Australia -.17* (372.89) -.13* (370.53) -.12* (376.25) -.02 (402.38)
Africa -.16** (1070.85) -.15** (1064.67) -.15** (1067.99) -.3*** (1367.16)
Control variable total assets .23** (189.21) .23** (187.61) .23** (188.19) .19* (183.14)
Control variable ROA .19* (273.16) .18* (270.74) .18* (272.07) .13 (263.5)
This table provides standardized beta values (and standard errors)
Note: Statistical significance: *p <.05; ** p <.01; ***; p<.001
N = 249
Note: R² =.40***; ΔR² = .01* for model 2; ΔR² = .00 for model 3; ΔR² = .05*** for model 4
Page | 33
Table 6 Multiple regression for independent variable Board Independence
Model 1 Model 2 Model 3 Model 4
Independent variable Board Independence 0 (.04) .01 (.04) .02 (04)
Moderating variable CEO gender -.06 (350.06)
Moderating variable GINI index .51*** (33.17)
Board independence x Gender .02 (78.59)
Board independence x GINI -.06 (77.59)
Control variable Industry
Industrials .02 (288.70) .02 (290.44) .02 (291.54) -.02 (288.84)
Consumer goods .01 (299.77) .01 (301.1) .02 (309.85) -.03 (303.86)
Consumer services .17* (284.49) .17* (288.89) .17* (290.43) .12 (283.15)
Basic materials -.04 (380.47) -.04 (384.65) -.04 (387.72) -.06 (374.76)
Technology .02 (349.35) .02 (352.25) .02 (353.8) 0 (340.54)
Oil & gas -.03 (287.84) -.03 (288.71) -.04 (290.06) -.05 (279.25)
Healthcare .07 (316.12) .07 (317.13) .07 (318.4) .1 (312.35)
Utilities -.04 (502.70) -.04 (503.9) -.04 (508.76) -.07 (494)
Telecommunications -.01 (378.10) -.01 (379.22) -.02 (381.13) -.01 (366.78)
Control variable continent
Europe -.41*** (182.59) -.41*** (217.3) -.41*** (218.38) .04 (394.88)
Asia -.45*** (269.51) -.45*** (318.58) -.45*** (320.3) -.36*** (326.14)
Australia -.17* (372.89) -.14* (374.56) -.13* (377.39) -.02 (407.97)
Africa -.16** (1070.85) -.16** (1100.09) -.16** (1103) -.36*** (1533.91)
Control variable total assets .23** (189.21) .23** (189.65) .22** (190.64) .17* (185.92)
Control variable ROA .19* (273.16) .19* (274.53) .18* (275.7) .13 (267.39)
This table provides standardized beta values (and standard errors)
Note: Statistical significance: *p <.05; **p <.01; ***p<.001
N = 249
Note: R² =.40***; ΔR² = .00 for model 2; ΔR² = .00 for model 3; ΔR² = .05*** for model 4
Page | 34
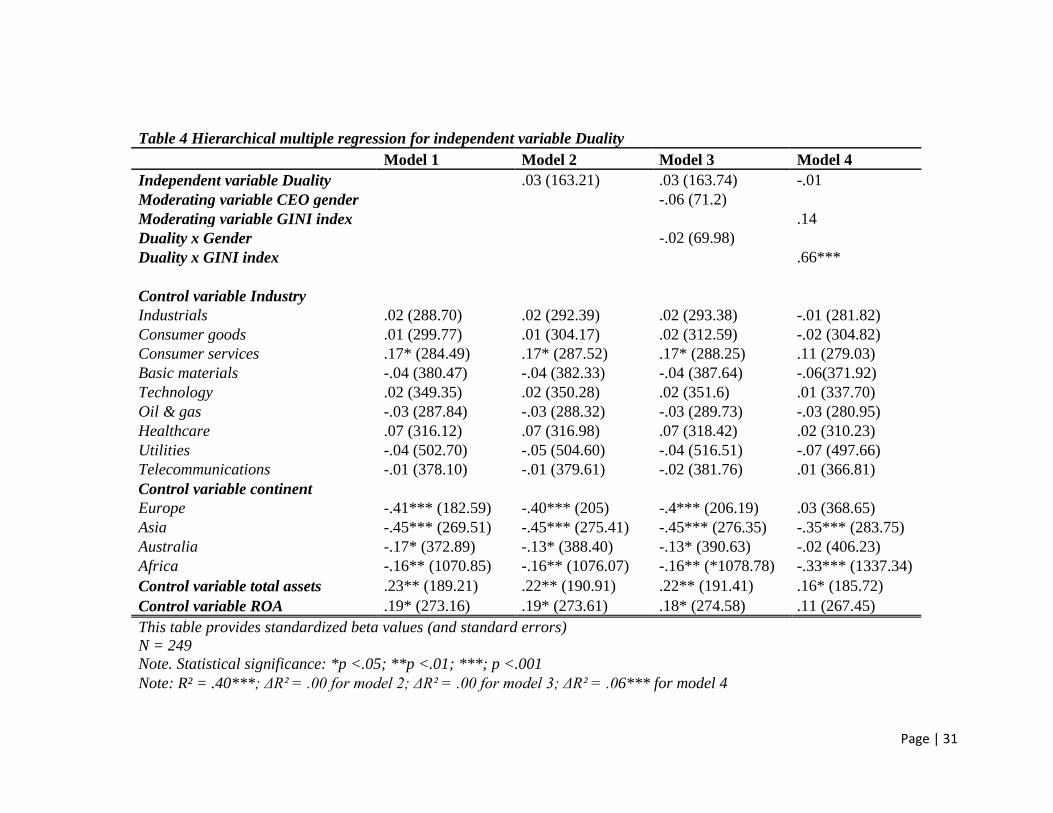
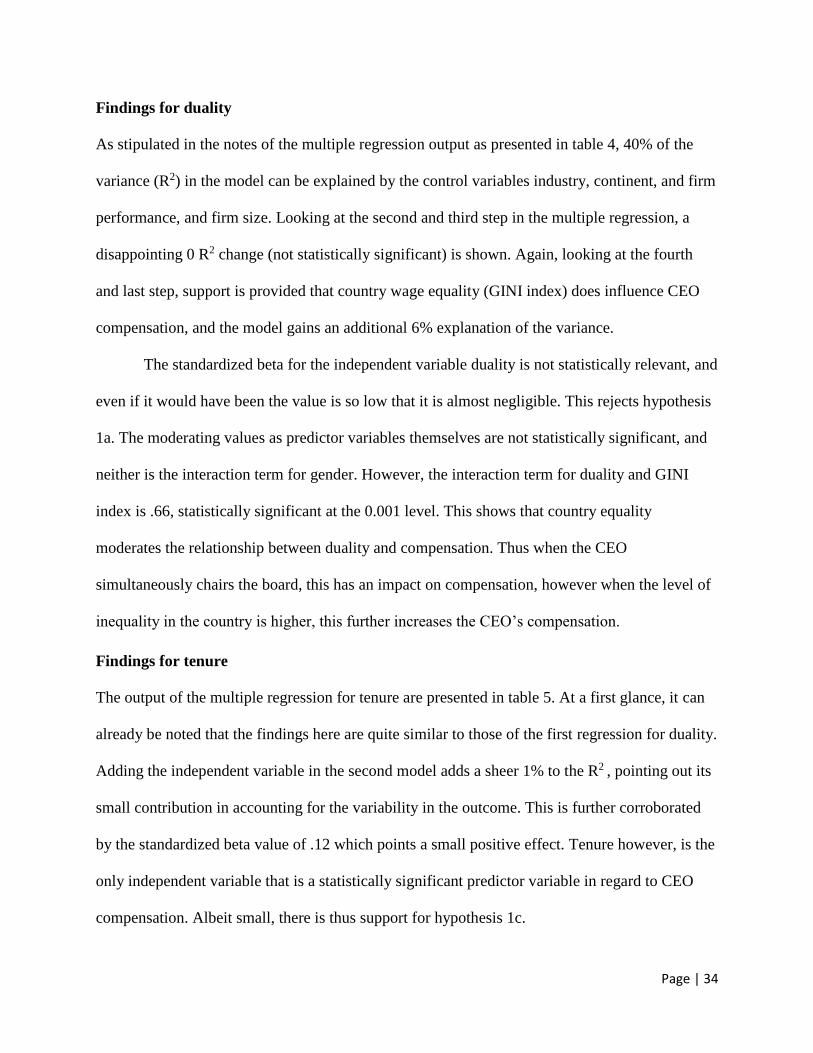
Findings for duality
As stipulated in the notes of the multiple regression output as presented in table 4, 40% of the
variance (R2) in the model can be explained by the control variables industry, continent, and firm
performance, and firm size. Looking at the second and third step in the multiple regression, a
disappointing 0 R2 change (not statistically significant) is shown. Again, looking at the fourth
and last step, support is provided that country wage equality (GINI index) does influence CEO
compensation, and the model gains an additional 6% explanation of the variance.
The standardized beta for the independent variable duality is not statistically relevant, and
even if it would have been the value is so low that it is almost negligible. This rejects hypothesis
1a. The moderating values as predictor variables themselves are not statistically significant, and
neither is the interaction term for gender. However, the interaction term for duality and GINI
index is .66, statistically significant at the 0.001 level. This shows that country equality
moderates the relationship between duality and compensation. Thus when the CEO
simultaneously chairs the board, this has an impact on compensation, however when the level of
inequality in the country is higher, this further increases the CEO’s compensation.
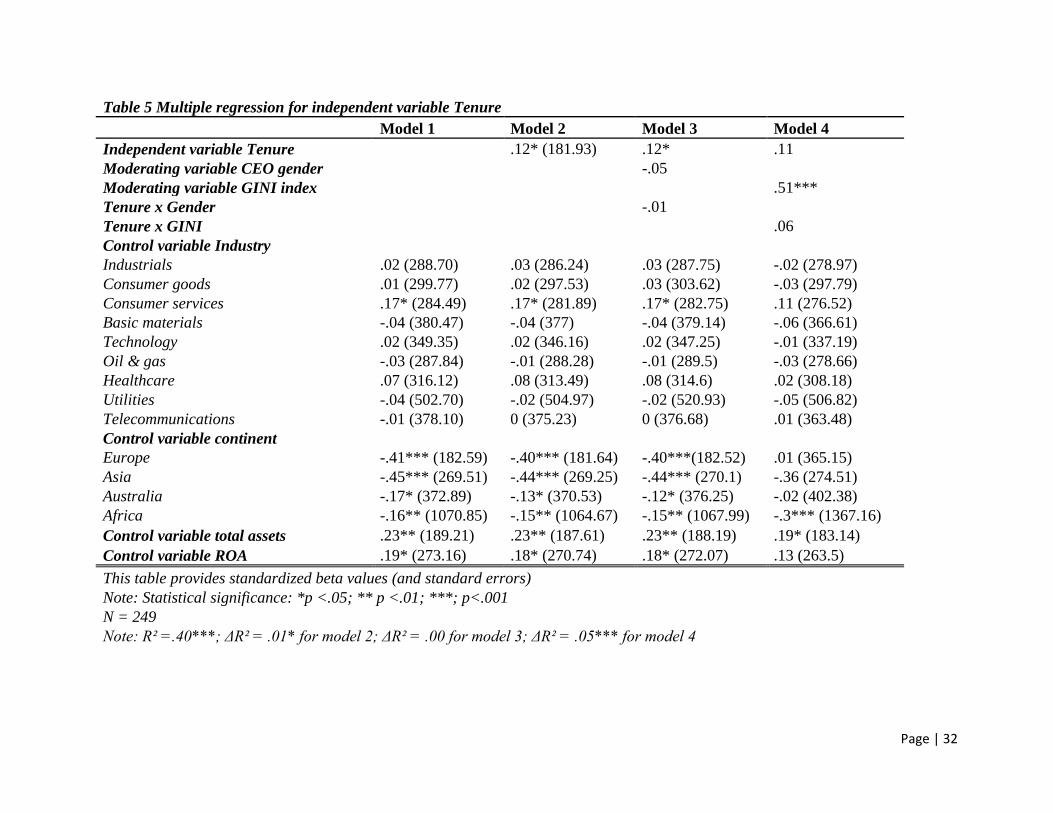
Findings for tenure
The output of the multiple regression for tenure are presented in table 5. At a first glance, it can
already be noted that the findings here are quite similar to those of the first regression for duality.
Adding the independent variable in the second model adds a sheer 1% to the R2 , pointing out its
small contribution in accounting for the variability in the outcome. This is further corroborated
by the standardized beta value of .12 which points a small positive effect. Tenure however, is the
only independent variable that is a statistically significant predictor variable in regard to CEO
compensation. Albeit small, there is thus support for hypothesis 1c.
Page | 35
Looking at the moderators or in table 5, neither of the interaction terms are statistically
significant. Even if they would be significant, the values are of such low values that they are
almost negligible.
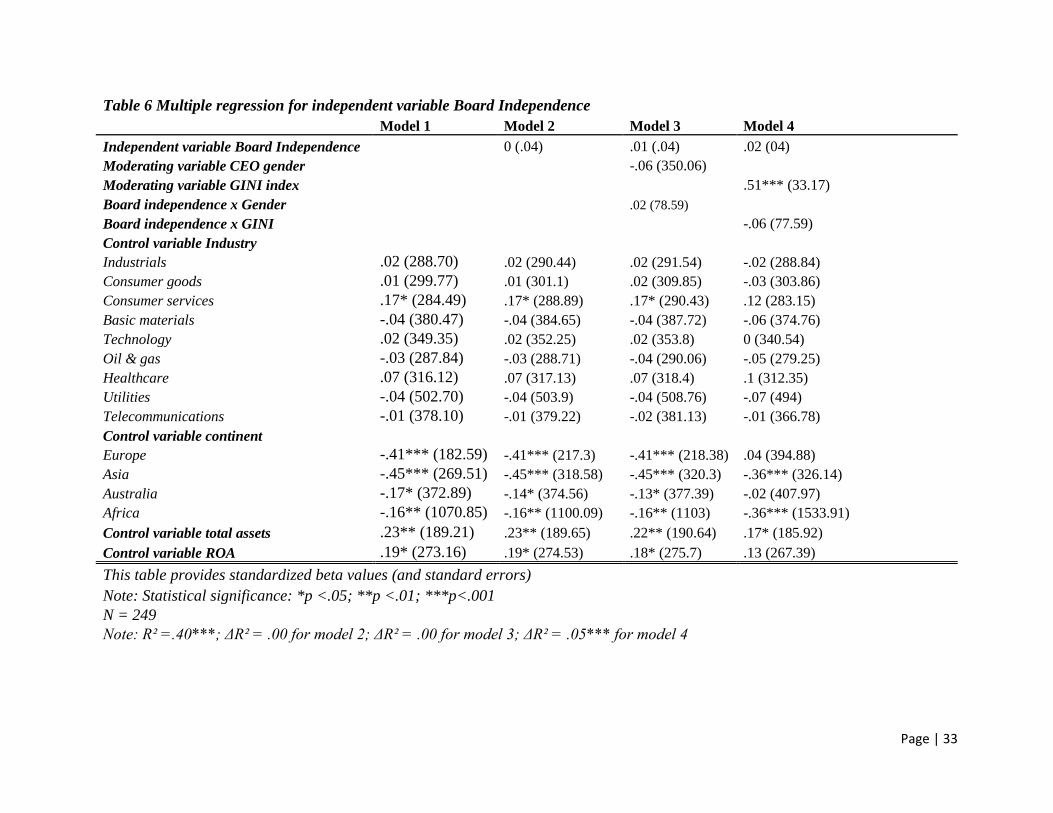
Findings for board independence
In table 6, the results from the regression for independent variable board independence is
presented. Most surprisingly, again the results are quite unexpected looking at their
insignificance. The coefficient of determination (R2) after adding the independent variable board
independence, does not change at all. This signifies the lack of any relationship between this
independent variable and the dependent variable. Furthermore, it indicates that board
independence does not account for any of the variability in CEO compensation. With regard to
the findings are presented in table 6, hypothesis 1b is thus rejected.
Furthermore, also the statistically insignificant and low interaction term values for the
moderators, show that there is no moderating effect of either variable.
Findings for CEO gender
In all three regressions, the β for the interaction term of ‘gender x duality’ is very small and is
not statistically significant ( -.02 in table 4, -.01 in table 5, and .01 in table 6). These results
imply that gender effectually does not moderate the relationship between any of the independent
variables and the dependent variable.
These findings, force me to have to reject hypothesis 2. It is however important to
mention that these findings might be convoluted by the dominance of male CEOs in this sample
(95.8% of the sample are male).
Page | 36
Findings for country inequality / GINI index
The interaction terms for country inequality, show that this variable only moderates the
relationship between duality and CEO compensation. In case of the other two independent
variables, the interaction term is not statistically significant. As there is moderation for one of
three independent variables, hypothesis 3 is partly supported.
Country of headquarters/GINI index, is however a statistically significant predictor in all
models and aside from this, also has the highest standardized beta value. This is quite surprising
and interesting, because geographic region has already been controlled for. This suggests that
country income inequality, as opposed to simply geographical region, has a significant additional
impact on CEO compensation.
Other findings
The control variables continent and firm size and performance are the only variables (besides the
GINI Index) which are consistently statistically relevant throughout the steps in the multiple
regressions. This proves their importance in explaining the variance measured for CEO
compensation. It is interesting when comparing these results to the findings for the industry
benchmark, which does not seem to have any impact on the level of CEO compensation.
Furthermore, as North America is the baseline for the dummy variable of continent, the
five other continents as shown in the tables above are a coefficient compared to North America.
This suggests that when the coefficient is positive, the level of CEO compensation is higher
compared to that in North America, and vice versa if the coefficient is negative. An interesting
result is that CEO compensation is lower than CEO compensation in North American for all
continents. These findings imply that CEO compensation in North America is the highest in the
Page | 37
world, which normally would raise ethical debates. This ethical issue could be an additional
explanation, besides the easy access to compensation data, as to why extant research has focused
on mostly North America up until now.
Below, a summary of the hypotheses is provided and whether they are supported by the
data or not:
H1a: When the CEO is also the chairman of the executive board (CEO duality), his or
her compensation will be higher than for those CEOs who are not.
Result: not supported.
H1b: When the CEO has appointed board members, CEO compensation will be higher
than when the board is independent. (Board independence)
Result: not supported.
H1c: As a CEO’s tenure increases, their executive compensation also increases.
Result: supported.
H2: The relationship between CEO power and CEO compensation is moderated by the
CEO gender; when the CEO is female this direct relationship is weaker.
Result: not supported.
H3: The relationship between CEO power and CEO compensation is weaker when there
are lower levels of inequality in the country where the firm is headquartered.
Result: partly supported.
Page | 38
Discussion
Multiple interesting findings have been presented in the previous chapter. The most obvious and
perhaps most surprising, is that only one of the three hypotheses pertaining to CEO power are
not supported by the data. Based on the results of the regressions and the outcome of these
hypotheses, the answer to the research question in this paper is that the extent of CEO power
only has a very small impact on CEO compensation.
Looking at the specific determinants of CEO power; duality, tenure, and board
independence, only the findings on tenure support previous research (Hill et al., 1991; Johnston,
2002). This finding also lends further support to the use upper echelon theory in explaining CEO
power and that tenure may be a proxy for this managerial characteristic. Adversely, for duality
and board independence, upper echelon theory was used to explain the use of these proxies,
however with no significant results.
The results as presented in this paper do provide an interesting and novel take on equality
with regard to CEO compensation, which has been an understudied topic up to now. It provides
an unusual view on the influence the country where the firm is headquartered with regard to
levels of (in)equality of that specific country. Country income equality, measured by the GINI
index, moderates the relation between duality and compensation. Results indicate that the higher
the level of inequality, the higher the level of CEO compensation. The insignificant findings on
CEO gender are not in support of the upper echelon theory as described in the literature review,
however it is very possible that the findings as presented in this paper are not fully representative
due to the imbalance between the amount of male and female CEOs in this dataset.
Page | 39
Albeit unfortunate that most of the hypotheses were not supported by the data, this does
create opportunities for additional research and building on the upper echelon theory with regard
to (in)equality.
Page | 40
Conclusions and suggestions for further research
This paper adds to the literature on CEO compensation by testing a set of hypotheses using a
unique global dataset, as opposed to extant literature. It finds that, opposite of what is theorized,
CEO power does not have an impact on CEO compensation.
This paper aims to extend the upper echelon theory (Hambrick & Mason, 1984), by
proposing that CEO power is one of the managerial characteristics that influence strategic choice
and moreover influence strategic choices of the board of directors with regard to CEO
compensation. Furthermore, the upper echelon theory is extended by introducing fairness into the
theory. As certain characteristics and social norms influence strategic decision-making
(Hambrick & Mason, 1984), I propose that it is likely that female CEOs are willing to accept
lower compensations than their male counterparts, because of the social structure of a high
regard of fairness and equality that is often assigned to females (Eagly & Woord, 1999).
Although the findings for this specific proposition are not what was expected per se, it is
important to note that this topic in specific deserves further research with different datasets.
Suggestions for further research thus regard the topic of gender and CEO compensation.
As is presented in this paper, female CEOs made up a sheer 4.2% of the whole sample,
decreasing the predictive power of this variable. Results however, showed that the difference
between female and male CEO compensation was not statistically significant. It would be very
interesting to understand whether CEO compensation would be influenced by whether or not
there are females on the board. This could for example be done by researching whether there are
any or no females on the board, and measure the respective impact on CEO compensation. It
would however be more interesting to research the effects of the specific amount of females on
the board. The reason for the latter, is because it has been theorized that females only have a
Page | 41
specific influence when there is another female on their side, as they are less likely to speak up if
they are the only female in the room. It would be interesting to then see whether it would make
any difference if there are no females on the board, one female on the board, or more than one
female on the board. In the latter case, this should decrease the CEO’s compensation based on
the research on fairness and reciprocity as presented in this paper.
Page | 42
References
Adams, R. B., Almeida, H., & Ferreira, D. 2005. Powerful CEOs and their impact on corporate
performance. Review of Financial Studies, 18(4): 1403-1432.
Adams, S. M., Gupta, A., Haughton, D. M., & Leeth, J. D. 2007. Gender differences in CEO
compensation: Evidence from the USA. Women in Management Review, 22(3): 208-224.
Alchian, A. A., & Demsetz, H. 1972. Production, information costs, and economic organization.
The American Economic Review, 62(5): 777-795.
Belliveau, M. A., O'Reilly, C. A., & Wade, J. B. 1996. Social capital at the top: Effects of social
similarity and status on CEO compensation. Academy of management Journal, 39(6): 1568-
1593.
Bertrand, M., & Schoar, A. 2002. Managing with style: The effect of managers on firm policies.
Boyd, B. K. 1995. CEO duality and firm performance: A contingency model. Strategic
Management Journal, 16(4): 301-312.
Brick, I. E., Palmon, O., & Wald, J. K. 2006. CEO compensation, director compensation, and
firm performance: Evidence of cronyism? Journal of Corporate Finance, 12(3): 403-423.
Bugeja, M., Matolcsy, Z. P., & Spiropoulos, H. 2012. Is there a gender gap in CEO
compensation? Journal of Corporate Finance, 18(4): 849-859.
Page | 43
Carpenter, M. A., Geletkanycz, M. A., & Sanders, W. G. 2004. Upper echelons research
revisited: Antecedents, elements, and consequences of top management team composition.
Journal of management, 30(6): 749-778.
Carpenter, M. A., & Reilly, G. P. 2006. Constructs and construct measurement in upper echelons
research. Research methodology in strategy and management, 3: 17-35.
Conyon, M. J. 2006. Executive compensation and incentives. The Academy of Management
Perspectives, 20(1): 25-44.
Cordeiro, J. J., & Veliyath, R. 2003. Beyond pay for performance: A panel study of the
determinants of CEO compensation. American Business Review, 21(1): 56.
Eagly, A. H., & Wood, W. 1999. The origins of sex differences in human behavior: Evolved
dispositions versus social roles. American psychologist, 54(6): 408.
FIELDS, COLLECTIVE RATIONALITY IN ORGANIZATIONAL, Dimaggio, P., & Powell,
W. 1983. The iron cage revisited: Institutional isomorphism and collective rationality in
organizational fields. American Sociological Review, 48(2): 147-160.
Finkelstein, S. 1992. Power in top management teams: Dimensions, measurement, and
validation. Academy of Management journal, 35(3): 505-538.
Finkelstein, S., & Boyd, B. K. 1998. How much does the CEO matter? the role of managerial
discretion in the setting of CEO compensation. Academy of Management journal, 41(2): 179-
199.
Page | 44
Finkelstein, S., & D'aveni, R. A. 1994. CEO duality as a double-edged sword: How boards of
directors balance entrenchment avoidance and unity of command. Academy of Management
journal, 37(5): 1079-1108.
Grabke-Rundell, A., & Gomez-Mejia, L. R. 2002. Power as a determinant of executive
compensation. Human Resource Management Review, 12(1): 3-23.
Haleblian, J., & Finkelstein, S. 1993. Top management team size, CEO dominance, and firm
performance: The moderating roles of environmental turbulence and discretion. Academy of
Management journal, 36(4): 844-863.
Hambrick, D. C. 2007. Upper echelons theory: An update. Academy of management review,
32(2): 334-343.
Haynes, K. T., & Hillman, A. 2010. The effect of board capital and CEO power on strategic
change. Strategic Management Journal, 31(11): 1145-1163.
Hermalin, B. E., & Weisbach, M. S. 1998. Endogenously chosen boards of directors and their
monitoring of the CEO. American Economic Review: 96-118.
Hill, C. W., & Phan, P. 1991. CEO tenure as a determinant of CEO pay. Academy of
Management journal, 34(3): 707-717.
Johnston, J. 2002. Tenure, promotion and executive remuneration. Applied Economics, 34(8):
993-997.
Page | 45
Mohan, N., & Ruggiero, J. 2003. Compensation differences between male and female CEOs for
publicly traded firms: A nonparametric analysis. Journal of the Operational Research Society,
54(12): 1242-1248.
Mohan, N., & Ruggiero, J. 2007. Influence of firm performance and gender on CEO
compensation. Applied Economics, 39(9): 1107-1113.
Peterson, R. S., Smith, D. B., Martorana, P. V., & Owens, P. D. 2003. The impact of chief
executive officer personality on top management team dynamics: One mechanism by which
leadership affects organizational performance. Journal of Applied Psychology, 88(5): 795.
Ryan, H. E., & Wiggins, R. A. 2004. Who is in whose pocket? director compensation, board
independence, and barriers to effective monitoring. Journal of Financial Economics, 73(3):
497-524.
Ryan, H. E., & Wiggins, R. A. 2004. Who is in whose pocket? director compensation, board
independence, and barriers to effective monitoring. Journal of Financial Economics, 73(3):
497-524.
Sauerwald, S., Lin, Z. J., & Peng, M. W. 2014. Board social capital and excess CEO returns.
Strategic Management Journal.
Scott, W. R. 2008. Approaching adulthood: The maturing of institutional theory. Theory and
society, 37(5): 427-442.
Page | 46
Shin, T. 2012. The gender gap in executive compensation the role of female directors and chief
executive officers. The Annals of the American Academy of Political and Social Science,
639(1): 258-278.
Solnick, S. J. 2001. Gender differences in the ultimatum game. Economic inquiry, 39(2): 189.
Wernicke, G. forthcoming. Dad is in the news! CEO identities and the social constraint on
executive pay.
Zhang, Y., & Rajagopalan, N. 2003. Explaining new CEO origin: Firm versus industry
antecedents. Academy of Management Journal, 46(3): 327-338.
Zhang, Y., & Rajagopalan, N. 2003. Explaining new CEO origin: Firm versus industry
antecedents. Academy of Management Journal, 46(3): 327-338.
Websites:
Financial Times Global 500 methodology: http://www.ft.com/cms/s/2/1fda5794-169f-11e5-b07f-
00144feabdc0.html#axzz4CDMRLRme, accessed on 21/6/2016.
ICB industry definitions. http://www.icbenchmark.com/, accessed on 6/6/2016.