Embed Size (px)
DESCRIPTION
THE INTEGRATED MONITORING OF THE ATMOSPHERIC AEROSOL IN SIBERIA. Koutsenogii K.P., Koutsenogii P.K. Institute of Chemical Kinetics and Combustion SB RAS, 630090 Novosibirsk, Institutskaya St., 3 [email protected]. 1. Content. Introduction. The monitoring aims. - PowerPoint PPT Presentation
Citation preview
Koutsenogii K.P., Koutsenogii P.K.
Institute of Chemical Kinetics and Combustion SB RAS, 630090 Novosibirsk, Institutskaya St., [email protected]
ContentContentIntroduction
The monitoring aims
The research results
The monitoring structure
The particle size distribution, chemical composition, number and mass concentrations AA in Siberia. It’s spatial and temporal variations
The sources of the atmospheric aerosol (AA) in Siberia
The evaluation of the technogenic loading
Summary
The mathematical models
Data base and GIS technology
Laboratory and field range researches
IntroductionIntroduction
At present time even more attention is paid to the effect of long-range transport of continental atmospheric aerosol (AA) to the Polar region. The studies in Norway and Alaska have shown, that Western and Central Siberia may considerably contaminate the atmosphere in Arctic. The cities and many regions of Southern
Siberia are strongly contaminated by industrial emissions.
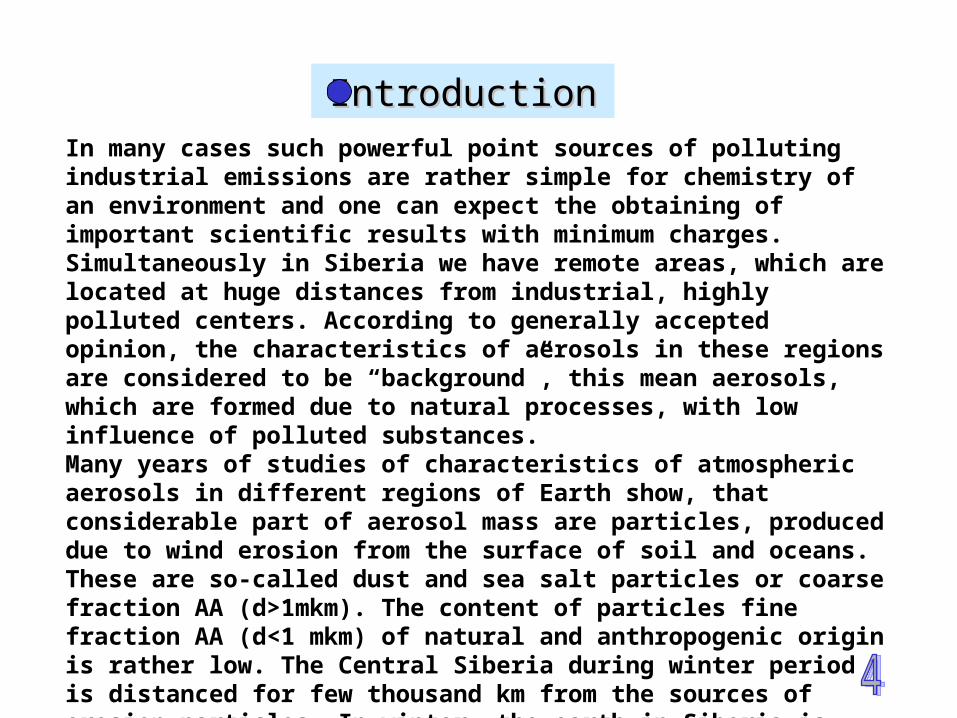
In many cases such powerful point sources of polluting industrial emissions are rather simple for chemistry of an environment and one can expect the obtaining of important scientific results with minimum charges. Simultaneously in Siberia we have remote areas, which are located at huge distances from industrial, highly polluted centers. According to generally accepted opinion, the characteristics of aerosols in these regions are considered to be “background”, this mean aerosols, which are formed due to natural processes, with low influence of polluted substances.Many years of studies of characteristics of atmospheric aerosols in different regions of Earth show, that considerable part of aerosol mass are particles, produced due to wind erosion from the surface of soil and oceans. These are so-called dust and sea salt particles or coarse fraction AA (d>1mkm). The content of particles fine fraction AA (d<1 mkm) of natural and anthropogenic origin is rather low. The Central Siberia during winter period is distanced for few thousand km from the sources of erosion particles. In winter, the earth in Siberia is covered by snow, and water surface, including ocean, is covered by ice. Therefore, during winter, the conditions are rather favorable for studying of long-range transport of industrial pollutants.
IntroductionIntroduction
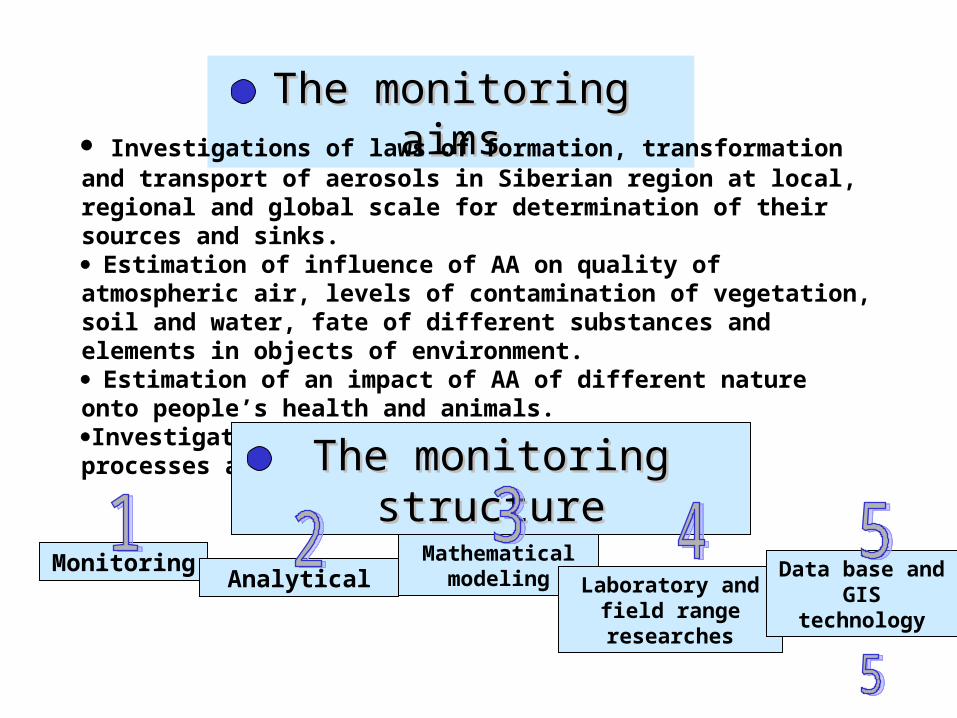
The monitoring aimsThe monitoring aimsInvestigations of laws of formation, transformation and transport of aerosols in Siberian region at local, regional and global scale for determination of their sources and sinks.Estimation of influence of AA on quality of atmospheric air, levels of contamination of vegetation, soil and water, fate of different substances and elements in objects of environment.Estimation of an impact of AA of different nature onto people’s health and animals.Investigation of AA influence onto atmospheric processes and climate.
MonitoringAnalytical
Mathematical modeling Laboratory and field
range researches
Data base and GIS technology
The monitoring structureThe monitoring structure
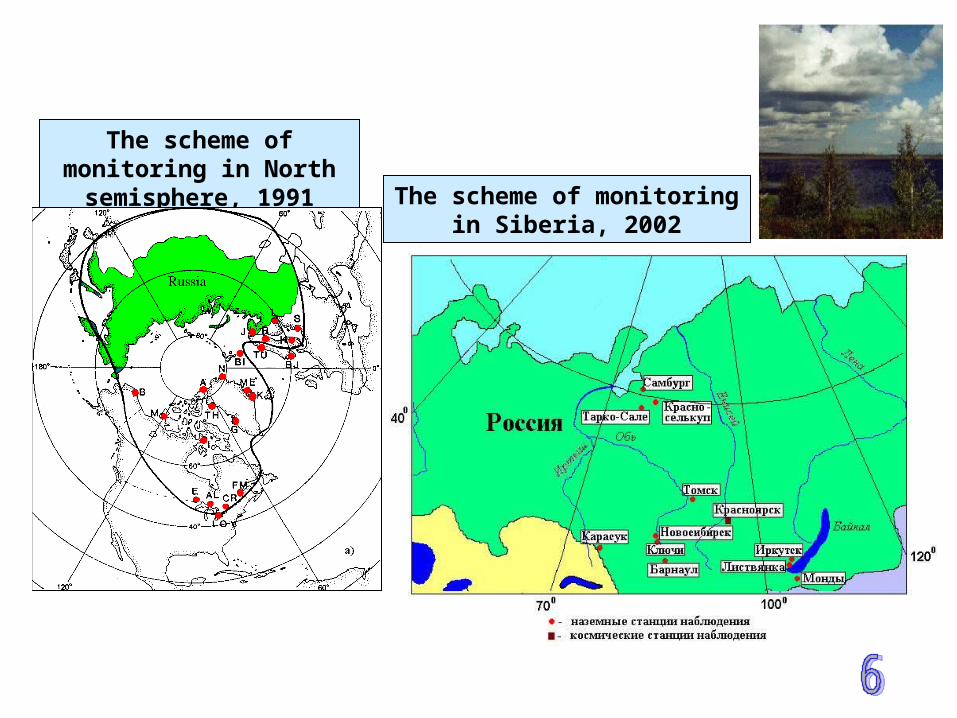
The scheme of monitoring in Siberia, 2002
The scheme of monitoring in North semisphere, 1991
Atmospheric aerosols sources in SiberiaAtmospheric aerosols sources in Siberia
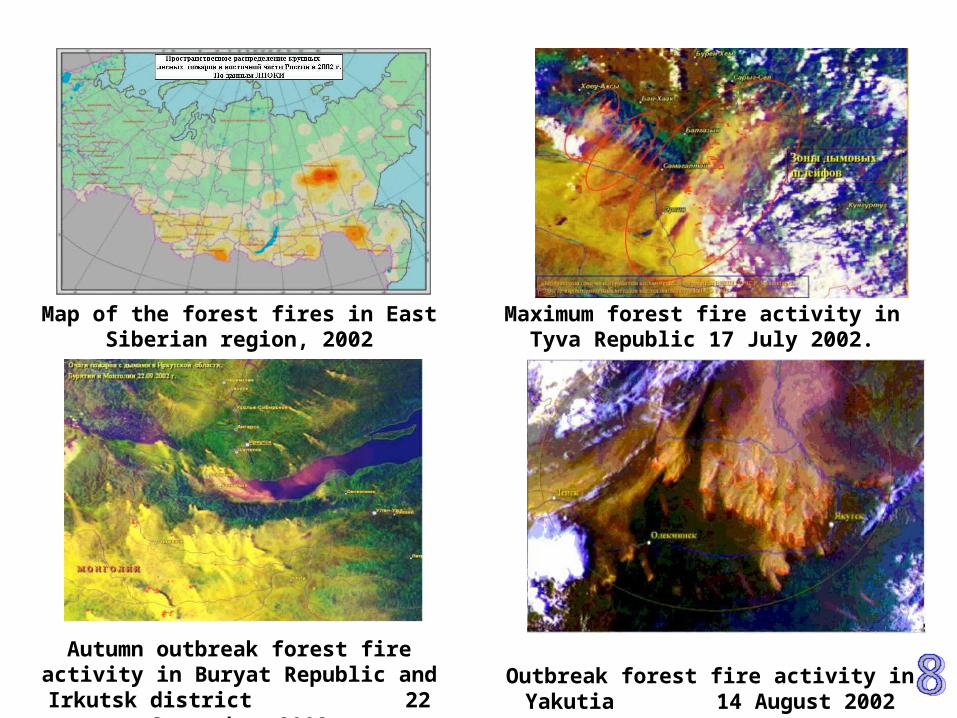
Map of the forest fires in East Siberian region, 2002
Maximum forest fire activity in Tyva Republic 17 July 2002.
Autumn outbreak forest fire activity in Buryat Republic and Irkutsk district
22 September 2002Outbreak forest fire activity in Yakutia
14 August 2002
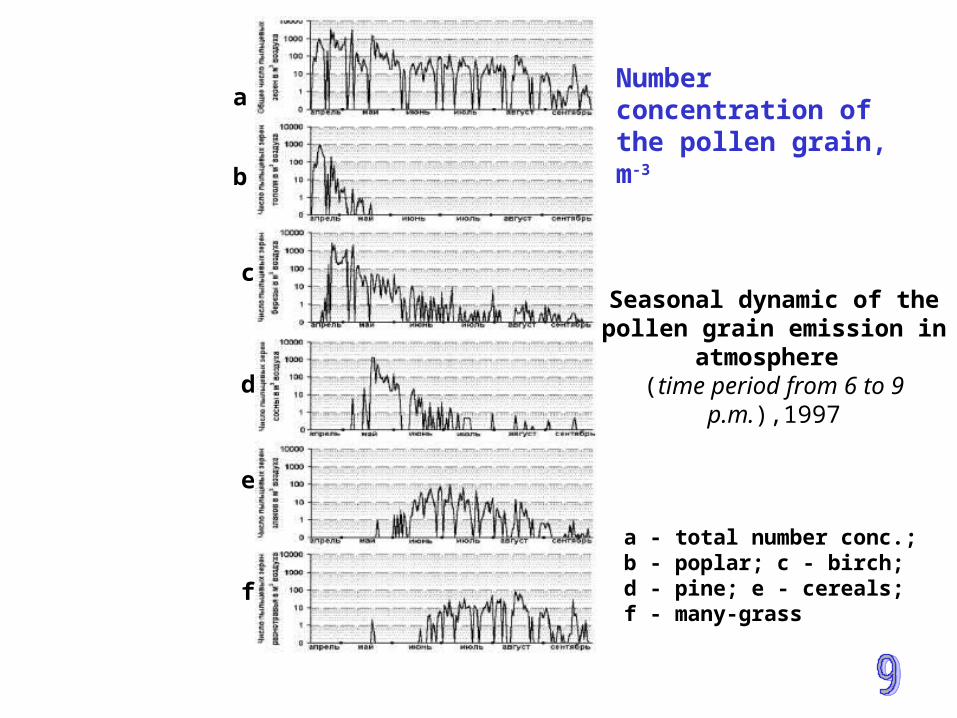
Seasonal dynamic of the pollen grain emission in atmosphere
(time period from 6 to 9 p.m.),1997
a
b
c
d
e
f
a - total number conc.; b - poplar; c - birch; d - pine; e - cereals; f - many-grass
Number concentration of the pollen grain, m-3
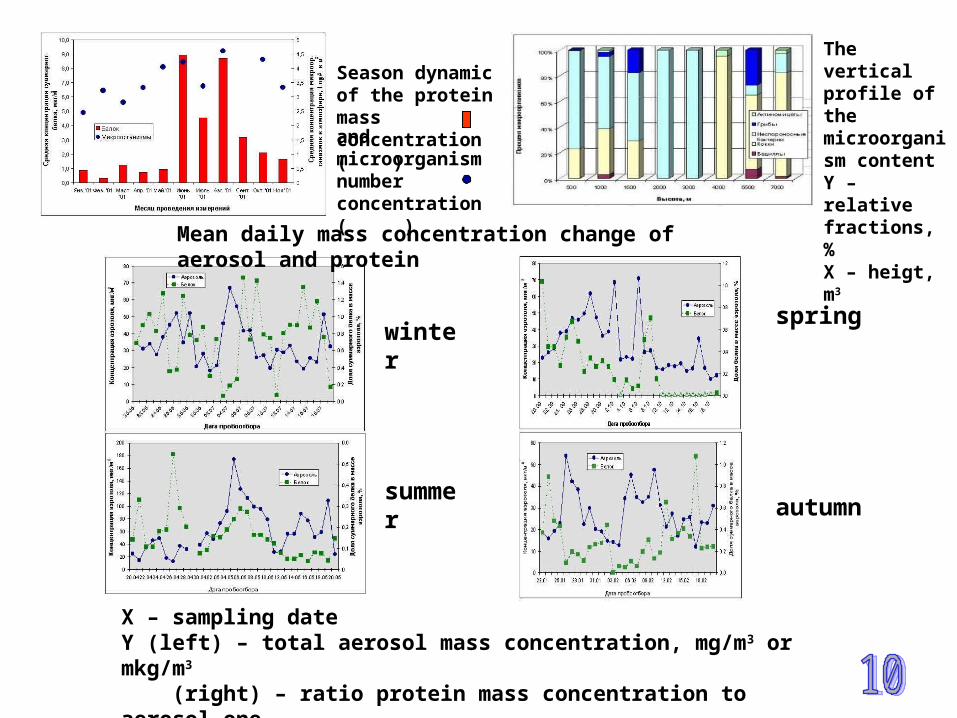
Season dynamic of the protein mass concentration ( )
The vertical profile of the microorganism contentY – relative fractions, %X – heigt, m3
winterspring
Mean daily mass concentration change of aerosol and protein
summerautumn
X – sampling dateY (left) – total aerosol mass concentration, mg/m3 or mkg/m3
(right) – ratio protein mass concentration to aerosol one
and microorganism number concentration ( )
Particle size distribution and chemical Particle size distribution and chemical composition, number and mass concentration composition, number and mass concentration atmospheric aerosol in Siberia. It’s spatial and atmospheric aerosol in Siberia. It’s spatial and temporal change.temporal change.
The technogenic impact estimation.The technogenic impact estimation.
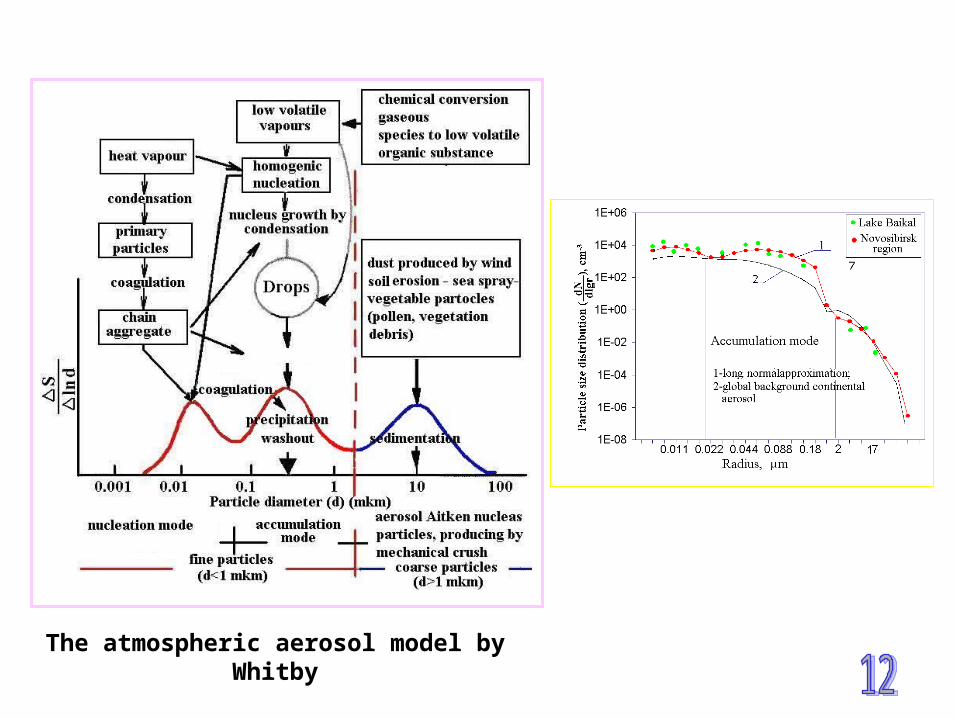
The atmospheric aerosol model by Whitby
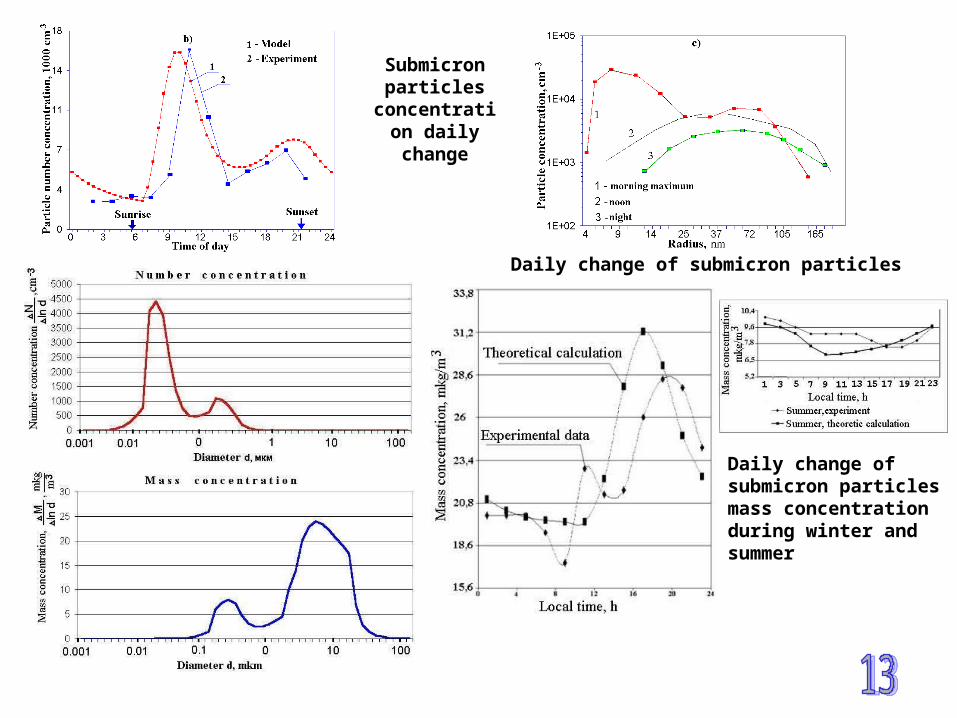
Daily change of submicron particles mass concentration during winter and summer
Daily change of submicron particles
Submicron particles
concentration daily change
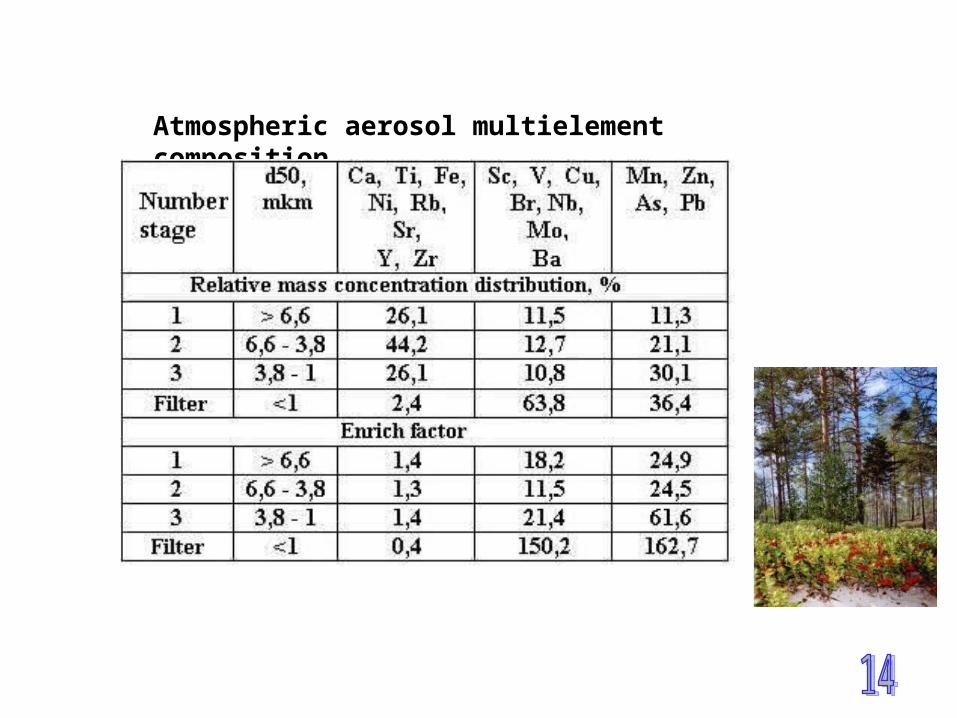
Atmospheric aerosol multielement composition
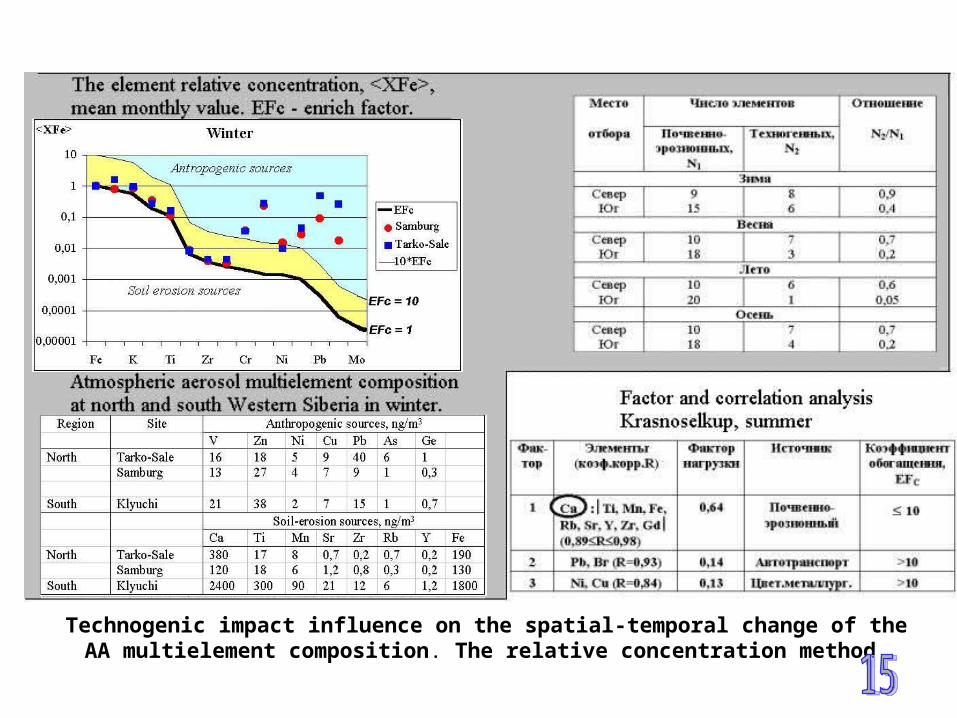
Technogenic impact influence on the spatial-temporal change of the AA multielement composition. The relative concentration method.
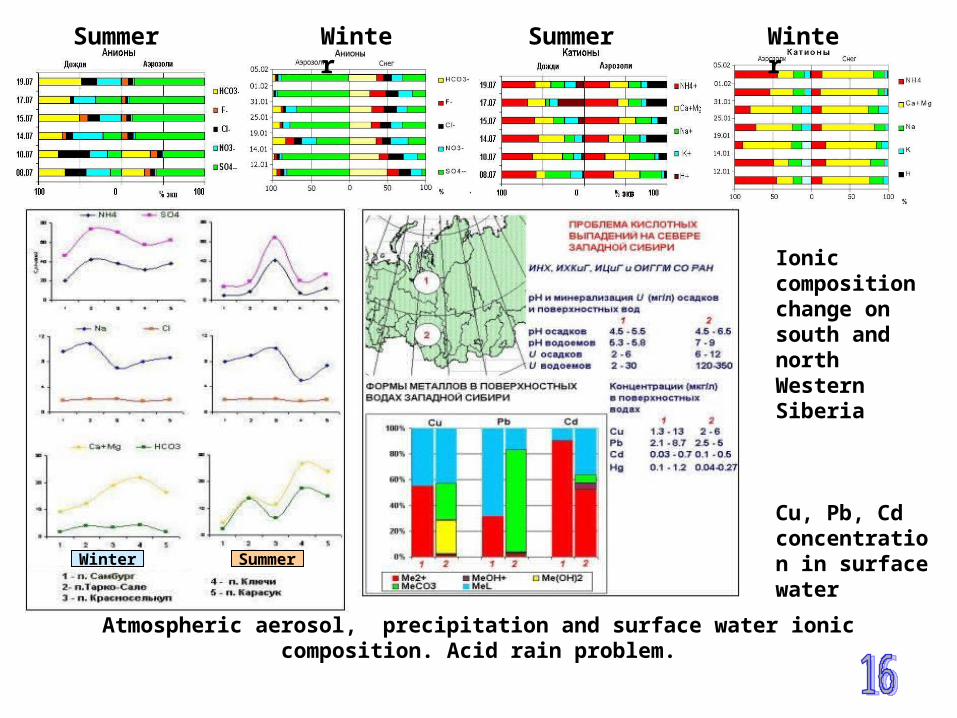
Summer Winter
Atmospheric aerosol, precipitation and surface water ionic composition. Acid rain problem.
Ionic composition change on south and north Western Siberia
Cu, Pb, Cd concentration in surface water
Summer Winter
Winter Summer
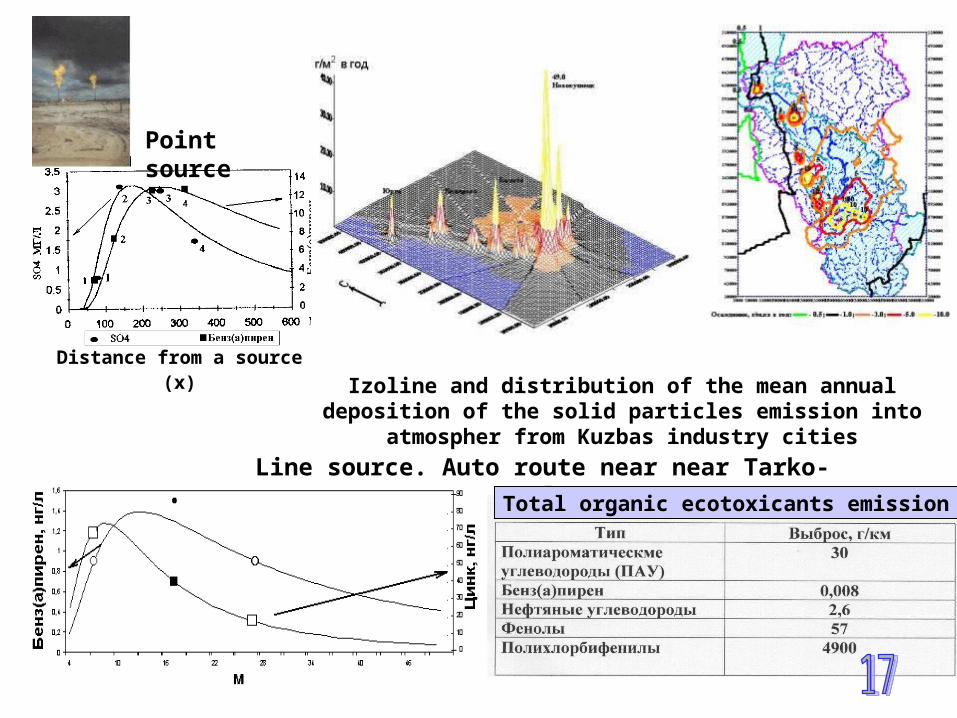
Distance from a source (х)
Izoline and distribution of the mean annual deposition of the solid particles emission into atmospher from Kuzbas industry cities
Point source
Line source. Auto route near near Tarko-Sale
Total organic ecotoxicants emission
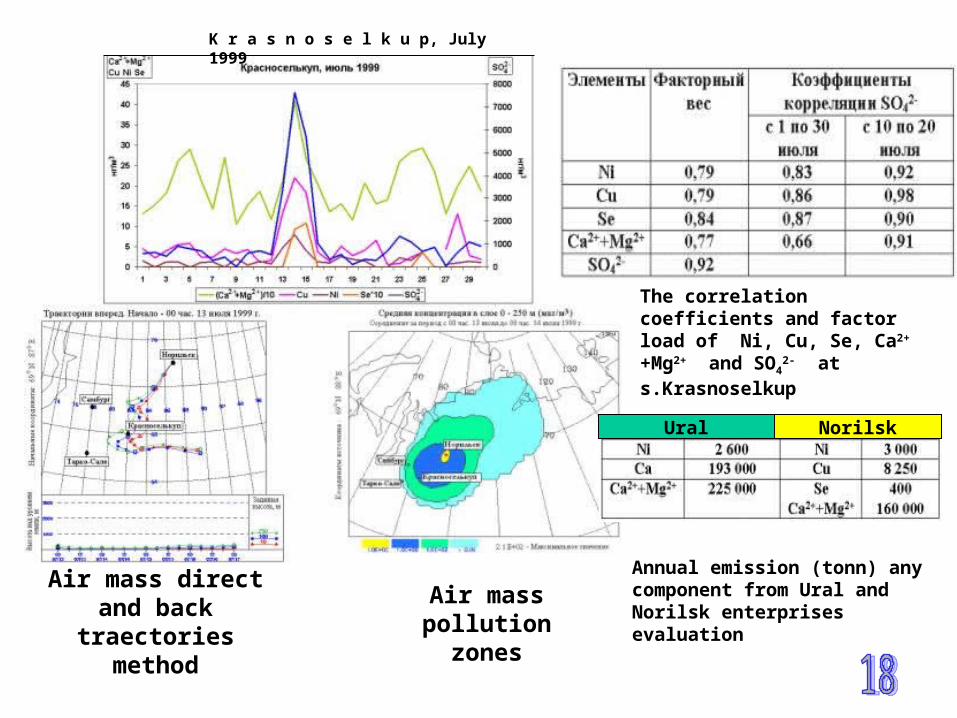
The correlation coefficients and factor load of Ni, Cu, Se, Ca2++Mg2+ and SO4
2- at s.Krasnoselkup
Annual emission (tonn) any component from Ural and Norilsk enterprises evaluation
Air mass direct and back traectories
method
Air mass pollution zones
K r a s n o s e l k u p, July 1999
Ural Norilsk
Laboratory-stand researchesLaboratory-stand researches
Mathematical modelingMathematical modeling
Data base and GIS-technologyData base and GIS-technology
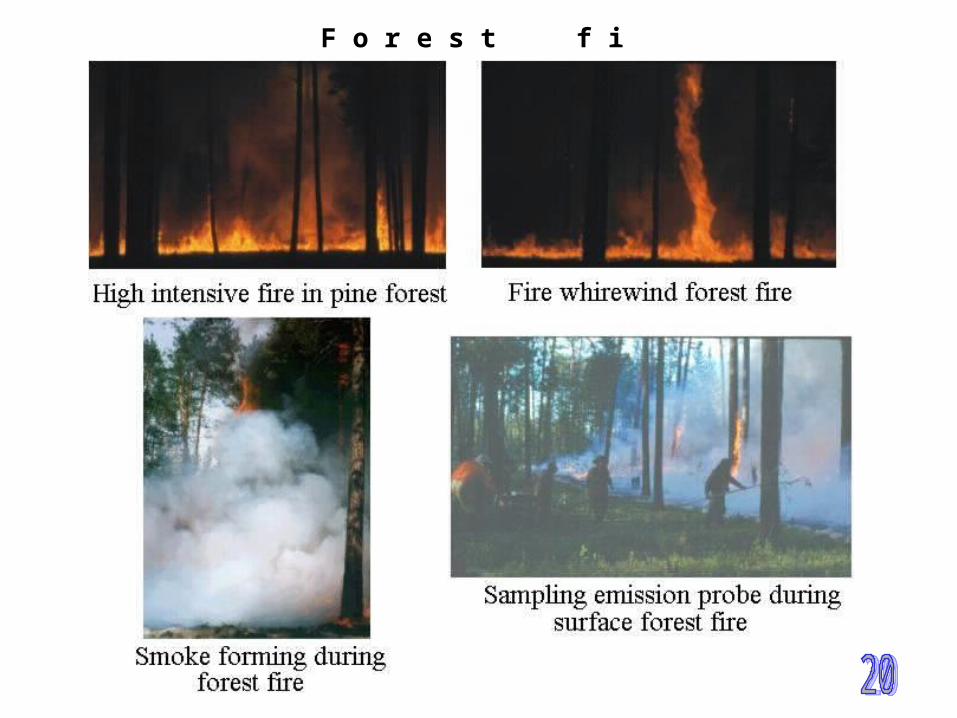
F o r e s t f i r e t y p e s
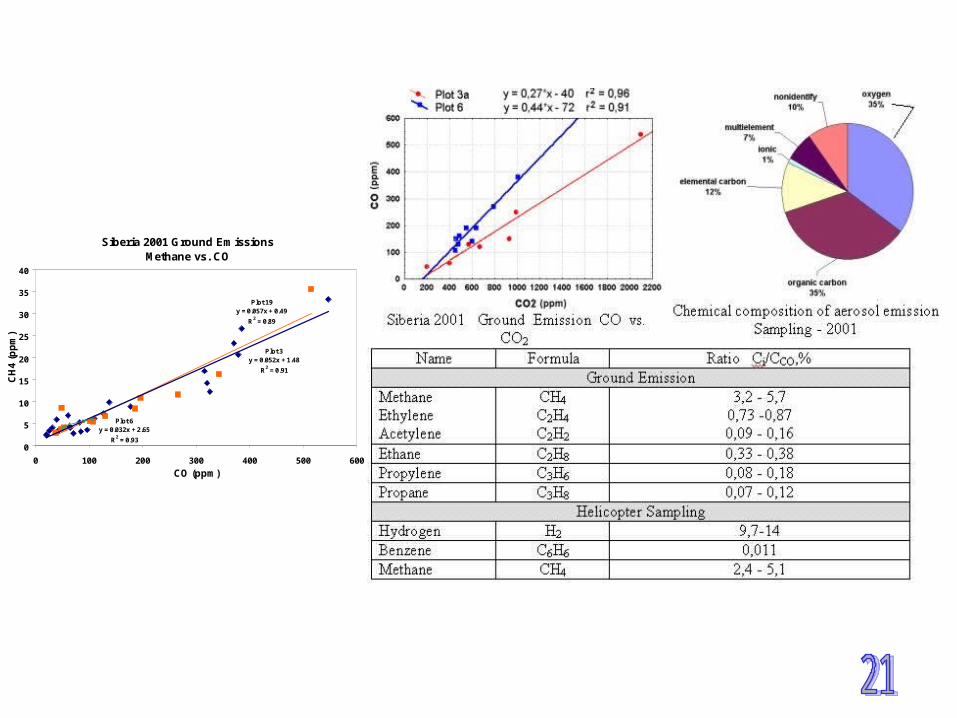
Siberia 2001 Ground EmissionsMethane vs. CO
Plot 19y = 0.057x + 0.49
R2 = 0.89
Plot 3y = 0.052x + 1.48
R2 = 0.91
Plot 6y = 0.032x + 2.65
R2 = 0.930
5
10
15
20
25
30
35
40
0 100 200 300 400 500 600
CO (ppm)
CH
4 (p
pm
)
0 20 40 60 80 100 1200
1
2
3
4
Рис. 4
Выкл.
4
3
21 (х2)
Чи
сло
мо
лек
ул х
10-1
5
Время / мин
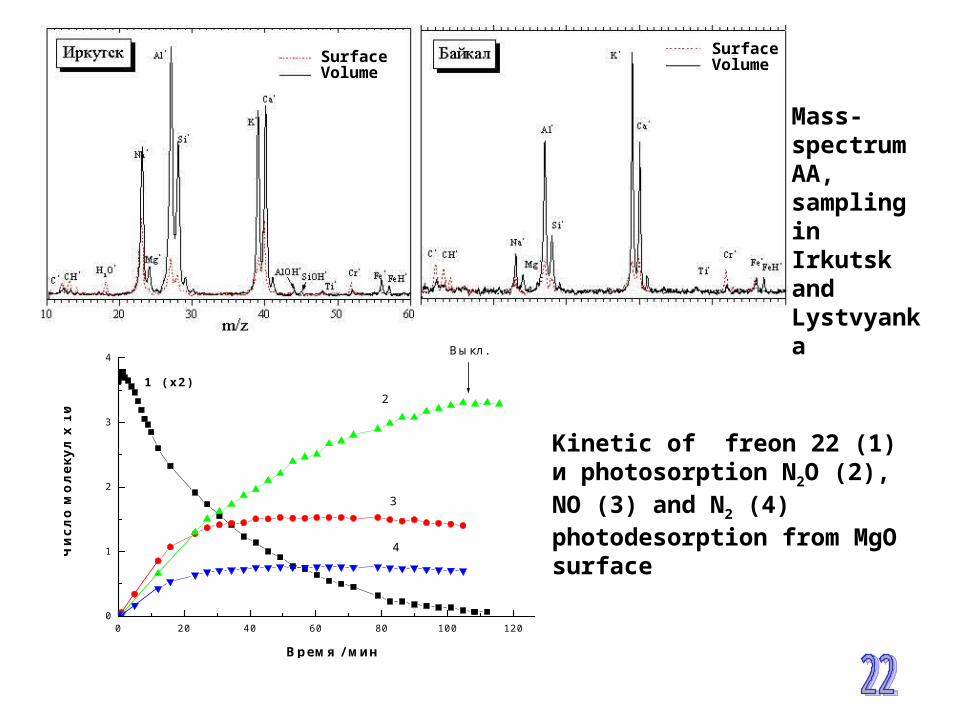
Kinetic of freon 22 (1) и photosorption N2O (2), NO (3) and N2 (4) photodesorption from MgO surface
Mass-spectrum AA, sampling in Irkutsk and Lystvyanka
SurfaceVolume
SurfaceVolume
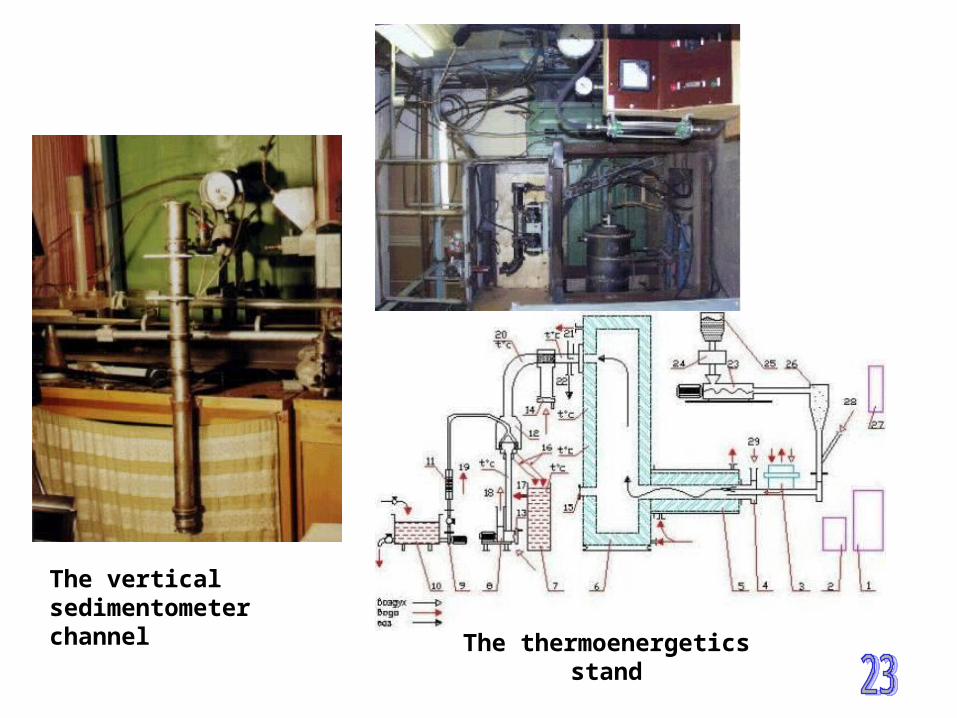
The vertical sedimentometer channel
The thermoenergetics stand
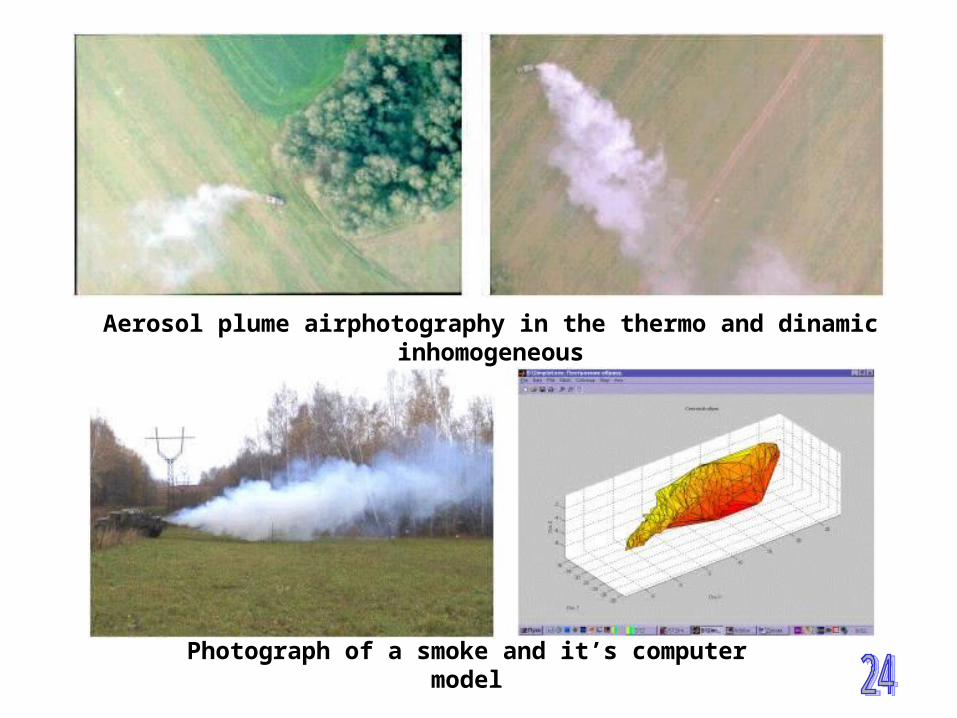
Photograph of a smoke and it’s computer model
Aerosol plume airphotography in the thermo and dinamic inhomogeneous
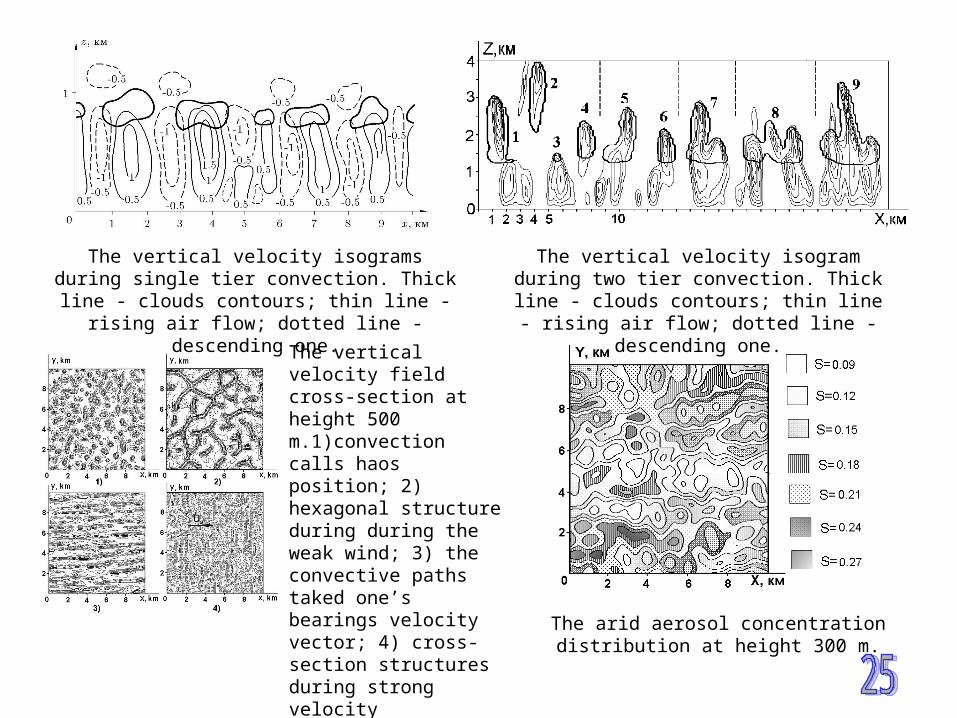
The vertical velocity isograms during single tier convection. Thick line - clouds contours; thin line -
rising air flow; dotted line - descending one.
The vertical velocity isogram during two tier convection. Thick line - clouds contours; thin line - rising air flow; dotted line - descending
one.
The vertical velocity field cross-section at height 500 m.1)convection calls haos position; 2) hexagonal structure during during the weak wind; 3) the convective paths taked one’s bearings velocity vector; 4) cross-section structures during strong velocity displacement.
The arid aerosol concentration distribution at height 300 m.
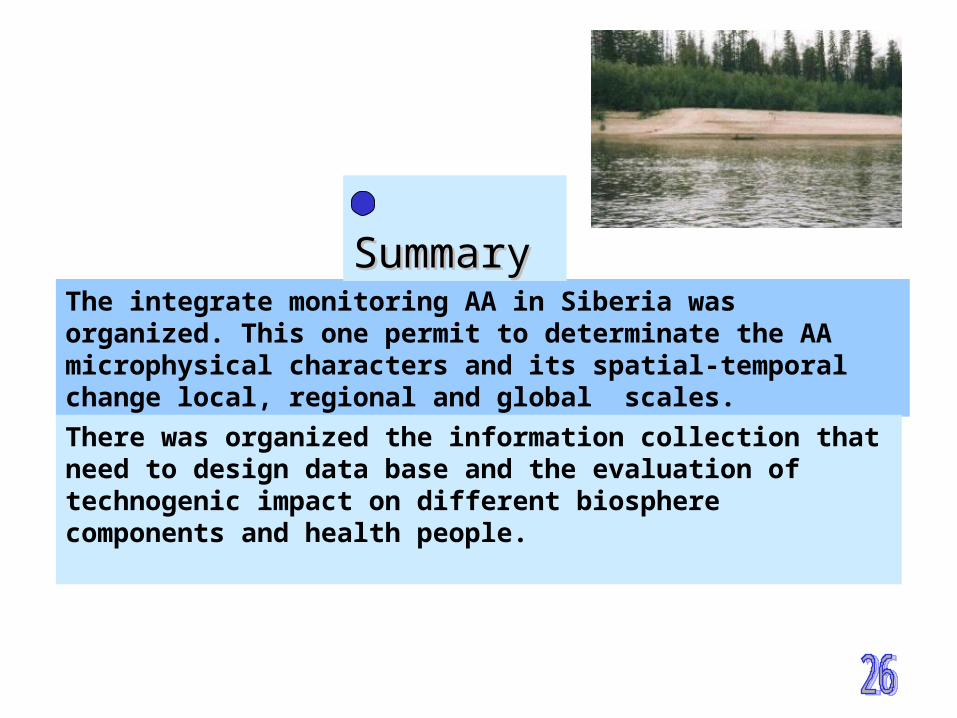
The integrate monitoring AA in Siberia was organized. This one permit to determinate the AA microphysical characters and its spatial-temporal change local, regional and global scales.
There was organized the information collection that need to design data base and the evaluation of technogenic impact on different biosphere components and health people.
SummarySummary
Acknowledgements
This research received partial support by INTAS, RFBR and SB RAS grants