Embed Size (px)
Citation preview
The inter-relationships between body build, body
composition, body fat distribution, metabolic syndrome and
inflammation in adult Aboriginal and Torres Strait
Islander people
by
Jaquelyne Tataka Hughes
BMed FRACP
A thesis submitted in fulfilment of the requirements
for the degree of Doctor of Philosophy
Menzies School of Health Research
Institute of Advanced Studies
Charles Darwin University
Australia
April, 2013

i
Originality Statement
I hereby declare that the work herein, now submitted as a thesis for the degree of
Doctor of Philosophy of the Charles Darwin University, is the result of my own
investigations, and all references to ideas and work of other researchers have been
specifically acknowledged. I hereby certify that the work embodied in this thesis has
not already been accepted in substance for any degree, and is not being currently
submitted in candidature for any other degree.
Jaquelyne Tataka Hughes
April 2013
ii
Abstract
A centralised pattern of fat distribution is a major risk factor for diabetes and
cardiovascular disease. In Australia, Aboriginal peoples and Torres Strait Islander
peoples have a disproportionately higher burden of disease, including diabetes,
cardiovascular disease and indicators of chronic kidney impairment than other
Australians. Despite this burden of illness, few studies report a detailed examination
of the body build and composition of Indigenous Australians. This is the first
detailed study of body composition and health indicators in large numbers of
Aboriginal people and Torres Strait Islander people.
The thesis reports on findings of two independent studies involving Indigenous
Australians. A healthy young adult group who underwent detailed body composition
and health assessment, and a larger population of Aboriginal adults and Torres Strait
Islander adults who had a spectrum of chronic disease risk markers.
We have reported two key differences in the dimensions of the upper body (trunk)
between Aboriginal adults and Torres Strait Islander adults. First, Aboriginal adults
and Torres Strait Islander adults demonstrate a proportionately shorter trunk than
Caucasians, and this was closely related to a central pattern of obesity in Aboriginal
adults and Torres Strait Islander adults. Second, Torres Strait Islander adults have a
broader skeleton than Caucasian adults who in turn have a broader skeleton than
Aboriginal participants, and skeletal size was strongly associated with proportion of
lean body mass.
Lean Aboriginal adults displayed numerous indicators of health. In contrast, even
modest levels of overweight were strongly related to intra-abdominal fat deposition,
and key cardiovascular risk markers: albuminuria, inflammation and low HDL-
cholesterol. Adiposity was also related to the pattern of fat-related biomarkers
(adipokines): high leptin and low adiponectin levels were associated with high body
fat, and high intra-abdominal fat respectively. Finally, we propose a link that high
leptin and low adiponectin levels are associated with albuminuria in Indigenous
Australians, which is a known independent risk marker for both cardiovascular
disease and kidney failure.
iii
Acknowledgements
As a child, I thought skin tags, acanthosis nigricans, and being overweight were
benign family traits among Torres Strait Islander family members. As a medical
student and trainee-physician, I learned these traits indicated preventable chronic
diseases that contribute to earlier mortality among many Aboriginal people and
Torres Strait Islander people.
I am grateful for the dedicated guidance of my supervisors, Dr Louise Maple-Brown
and Professor Kerin O’Dea. They provided a valuable opportunity for me to play a
small part towards advancing the health status of adult Aboriginal peoples and Torres
Strait Islander peoples with chronic diseases including chronic kidney disease
through this study. Louise and Kerin have each been powerful mentors. They
inspire and guide me to do better, again and again. I am extremely proud of this
work, and it has not been without struggle. I have also acquired other valuable skills
through this research project: including discussing health-risk in plain language,
which has improved communication with my own nephrology patients; engaging
individuals in health promotion and lifestyle change; confidently communicating
with an academic audience; and developing my own advocacy skills.
I am grateful to the participants, more than 750, who live throughout Northern and
Central Australia who willingly participated in this research project. Their
willingness is an indication of the support by Aboriginal communities and Torres
Strait Islander communities to move beyond describing chronic illness, but to find
practical solutions to the burden of preventable chronic diseases.
The data presented in the thesis was collected and managed by a large team. I
specifically acknowledge the Aboriginal staff and Torres Strait Islander staff with
whom I worked closely: Maria Nickels and Sian Graham were research assistants
who worked closely on my specific PhD project. Sian Graham and I worked
exclusively together on the Healthy Top-Enders’ Study. Maria and Sian both worked
on The eGFR Study; Loyla Leysley, a generous team-member who although based in
Darwin, has an amazing network of contacts throughout Northern Australia. Mary
Ward, my aunt, a long-serving nurse with the Thursday Island Hospital, a Torres
iv
Strait Islander elder, and an invaluable and ongoing team member on Thursday
Island who assisted in the baseline eGFR Study, and continues in the follow-up
phase of the study. Special mention also goes to other former and current eGFR
Study team members: Suresh Sharma, Kylie Tune and Alison Simmonds. Katrina
Drabsch moved into the eGFR Study Project Manager role in 2010, and worked
tirelessly arranging logistics of study recruitment, analysis of biochemical samples
and data management and cleaning. This was an intense two years period. Katrina
was always very generous towards assisting my PhD sub-study- thank you Katrina.
The PhD project was supported by numerous staff at Menzies School of Health
Research. Susan Hutton, Joanne Bex and Julie Green in Operations; Data
management and statistical support from Robyn Liddle, Linda Ward, Joseph
McDonnell, Mark Chatfield and Matthew Stevens. I thank Kim Piera for her
generous and careful attention to detail with processing ELISAs for adipokines on
the many samples I had for this project.
Others, unrelated to Menzies deserve special mention: Dr Leonard Sunil Piers who
has expertise in body composition techniques, but was also happy to advise on an
appropriate analytical approach; Dr Jarrod Meerkin, who generously supplied his
DXA unit, and his own time for the Thursday Island visit (described in Chapter 5);
Dr Jerry Greenfield provided expert direction to devising the CT methodology, and
introduced me to Ms Penelope Speight, who was a wonderful collaborator who
assisted in the design of the computed tomography protocol, and flew to Darwin to
set up the protocol with the dedicated staff of the Northern Territory Imaging group
who performed the CT scans. Penny also provided very prompt and thorough
analysis of data. Thank you to the NT Imaging Group: Business Managers, Mr
Rama Genga and Mr Aaron Hatcher, radiology staff including Fiona Schenkel, and
clerical staff who assisted with bookings. Thank you Yvonne Coleman, a brilliant
graphic artist, who assisted in the design of feedback material to participants and
communities, and more recently helped me format the thesis; Helen Fejo-Frith,
Aboriginal elder, inspirational leader in her community in Darwin and a friend.
Helen was often extremely busy, but always made me feel very welcome in her
community, supported our study (The eGFR Study and Healthy Top-Enders’ Study),
and facilitated community access and acceptance.
v
I gratefully acknowledge my funding sources. Thank you to the National Health and
Medical Research Council (NHMRC) Training Scholarship for Indigenous
Australian Health Research #490348, 2008-2011. Thank you to the Rio Tinto
Aboriginal Fund who sponsored me as a Role Model for Health, 2007-2010. Thank
you to the following for project support: Pfizer Cardio Vascular Lipid research grant
(2009); Douglas and Lola Douglas Scholarship Australian Academy of Science
Award (2008); NHMRC Centre of Clinical Research Excellence in Clinical Science
in Diabetes, University of Melbourne (2010); Gurdiminda Indigenous Health
Research Scholarship, Menzies School of Health Research (2008). The eGFR Study
was funded by an NHMRC Project Grant #545202.
Finally I thank my family. Darwin is my family’s home, and the place where I grew
up. I hadn’t lived in Darwin since high-school, and my husband Paul generously
moved to Darwin in order for me to undertake this project, and again live among my
family. I would not have been able to start or complete a PhD without his support. I
acknowledge the many inspirational women in my life, who have all shaped me, and
more recently supported me in this research journey: my mum, my grandma, my
sisters and my aunts.
vi
Publications
Refereed journals
Hughes, J., Nickels, M., Sharma, S., Tucker, L., O’Dea, K., Maple-Brown, L.
(2010). "Implementing the eGFR Study in a Remote Site: A Case Study." Aboriginal
and Islander Health Worker Journal 34(2): 6-8.
Conference proceedings
Hughes, J., Piers, L.S., Ward, L., Sharma, S.K., O’Dea, K., Maple-Brown, L. (2009).
The relationship between several measures of body composition in Indigenous
Australians World Congress of Nephrology 2009 Satellite Conference ‘Kidney
Disease in Disadvantaged Populations”, Aula Magna, University of Milan, Milan,
Italy.
Hughes, J., Lawton, P., Hoy, W., Cass, A., Piers, L.S., Sharma, S.K., Jones, G.,
O’Dea, K., Jerums, G., Maple-Brown, L. (2009). "Differences in body build within
Indigenous Australians may impact on estimates of renal function." Nephrology
14(s1): A1. *Young Investigator Award Category, Australian and New Zealand
Society of Nephrology, Annual Scientific Meeting, Hobart, 2009.
Invited Oral Presentations with abstract publication
Hughes, J., O'Dea, K., Maple-Brown, L. (2011). "Exploring the relationship between
health and body composition in Indigenous Australians" Internal Medicine Journal
41: 2-17. *Adult Medicine Division- Internal Medicine Society of Australia and
New Zealand – Orals.
Hughes, J. (2010). “Healthy Australian Aborigines have different body composition
compared with non-Indigenous Australians.” Obesity Research & Clinical Practice
4(Supplement): S83-S83. Australian and New Zealand Obesity Society, Annual
Scientific Meeting, Sydney, 2010.
Publications from data indirectly related to the thesis
Maple-Brown, L., Lawton, P.D., Hughes, J.T., Sharma, S.K., Jones, G.R.D., Ellis,
A.E., Hoy, W., Cass, A., MacIsaac, R.J., Sinha, A.K., Thomas, M.A.B., Piers, L.S.,
vii
Ward, L.C., Drabsch, K., Panagiotopoulos, S., McDermott, R., Warr, K., Cherian, S.,
Brown, A., Jerums. G., O’Dea, K. (2010). "Study Protocol - Accurate assessment of
kidney function in Indigenous Australians: aims and methods of the eGFR Study."
BMC Public Health 10(80).
Maple-Brown, L. J., Hughes, J., Peirs, L.S., Ward, L.C., Meerkin, J., Eisman, J.A.,
Centre, J.R., Pocock, N.A., Jerums, G., O’Dea, K. (2012). "Increased bone mineral
density in Aboriginal and Torres Strait Islander Australians: Impact of body
composition differences." Bone 51: 123-130.
Maple-Brown, LJ., Hughes, J.T., Lawton, P.D., Jones, G.R.D., Ellis, A.G., Drabsch,
K., Cass, A., Hoy, W.E., MacIsaac, R.J., O’Dea, K., Jerums, G. (2012). “Accurate
Assessment of Kidney Function in Indigenous Australians: the eGFR Study"
American Journal of Kidney Disease 60(4): 680-682.
Publications which are currently in progress from data directly related to this
thesis
Hughes J.T., L.J Maple-Brown et al. “The eGFR Study: Validation of lean body
mass in Aboriginal and Torres Strait Islander adults by whole body DXA and
indirect methods of body composition”
Hughes J.T., K. O’Dea et al. “The Healthy Top-Enders’ Study: Metabolic
Associations of Intra-abdominal obesity in young adult Aboriginal people”
viii
Personal Statement by the Researcher
One of the goals of the PhD study was to improve our understanding of the
relationship of obesity with the development of kidney damage among Aboriginal
peoples and Torres Strait Islander peoples. There were both professional and
personal reasons behind the topic of this research. As a practicing nephrologist, this
study was important to me in order to contribute to the evidence base to tackle
obesity related chronic disease including chronic kidney disease.
As a Torres Strait Islander woman there was a layer of personal prompts stimulating
this research: I know Torres Strait Islander peoples are different to Aboriginal
peoples, but why are Torres Strait Islander people “bigger” than Aboriginal
Asutralians or non-Indigenous Australians? It has also been an attempt to answer the
very important question for Aboriginal and Torres Strait Islander peoples: “why does
kidney disease affect my family?” The why question suggests someone may hear the
question, understand what it is that you are asking, care enough to determine the
reason, and be committed enough to return to share the answer. This question is best
understood with the recognition of Australia’s recent history of paternalistic
guardianship (“protectors”), assuming Aboriginal people and Torres Strait Islander
people cannot care for themselves or their families. This was partnered with subtle
undercurrents in my childhood, hearing things like “the doctor never explained that”,
“they didn’t take me seriously”, and the assumptions some make of others that
perhaps, “they don’t need to know that” or “I’m too busy (or I don’t care enough) to
understand why.” Therefore this research is an honest attempt to address the “why?”
question, to make the effort to find answers, and also inform Aboriginal and Torres
Strait Islander peoples. It has also allowed me to raise the profile of Aboriginal
peoples and Torres Strait Islander peoples with diabetes and chronic kidney disease
in the wider Australian health sphere.
ix
Table of Contents
Table of Contents......................................................................................................ix
List of figures ...........................................................................................................xiv
List of tables..............................................................................................................xv
Abbreviations.........................................................................................................xviii
Chapter 1. Introduction.........................................................................................1
1.1. General Comments about the Health of Australia’s Aboriginal Peoples and
Torres Strait Islander Peoples ..............................................................................1
1.2. Terminology..................................................................................................2
1.2.1. Use of terminology in the thesis.............................................................5
1.3. Origins and Aspects of Culture of Aboriginal Peoples and Torres Strait
Islander Peoples....................................................................................................6
Torres Strait Islander Peoples ..........................................................................6
Aboriginal Peoples ...........................................................................................9
Similarities and Differences of the Culture and Lifestyle of Aboriginal
Peoples and Torres Strait Islander Peoples prior to European Contact..........10
1.4. A Summary of the Diversity of Population, Culture, Lifestyle and Health
Among Aboriginal Peoples and Torres Strait Islander Peoples in recent times 10
1.5. The Burden of Chronic Diseases and the Metabolic Syndrome in Aboriginal
Peoples and Torres Strait Islander Peoples ........................................................14
1.5.1. Chronic Kidney Disease.......................................................................15
1.5.2. Cardiovascular Disease Risk: Prediction Scores and the Metabolic
Syndrome .......................................................................................................18
1.5.3. Overweight and Dysglycaemia ............................................................23
1.5.4. Dyslipidaemia.......................................................................................24
1.5.5. Albuminuria .........................................................................................26
1.5.6. Inflammation ........................................................................................26
1.6. Body Build and Body Composition ............................................................28
1.6.1. Body Composition Methods in Clinical Research ...............................28
1.6.2. Body Size, Alcohol and Cigarette Smoking.........................................38
1.6.3. Relationship of Body Shape and Composition with Gender, Aging,
Health and Chronic Kidney Disease ..............................................................39
x
1.6.4. Body Composition Differences between Ethnic Populations .............. 41
1.6.5. Body Composition in Indigenous Australians ..................................... 45
1.6.6. The Link Between Inflammation and Adiposity Defined by Detailed
Body Composition Assessments.................................................................... 51
1.7. The Relationship of Inflammatory Cytokines with Body Measures and
Features of the Metabolic Syndrome and Chronic Disease ............................... 53
1.7.1. Interleukin-6......................................................................................... 54
1.7.2. C-Reactive Protein ............................................................................... 55
1.7.3. Adiponectin .......................................................................................... 57
1.7.4. Leptin ................................................................................................... 58
1.7.5. Resistin................................................................................................. 59
1.7.6. Inflammation, Insulin Sensitivity and Dyslipidaemia in Chronic Kidney
Disease ........................................................................................................... 61
1.7.7. Obesity, Metabolic Syndrome, Adipokines and Kidney Damage ....... 62
1.8. Summary of the Introduction and Aims of the Study ................................. 65
Chapter 2. Methods.............................................................................................. 68
2.1. Choice of Studies ........................................................................................ 69
2.2. General Aspects Related to Both the Healthy Top-Enders’ and The eGFR
Study .................................................................................................................. 70
2.3. The eGFR Study: The Accurate Assessment of Kidney Function in
Indigenous Australians....................................................................................... 71
2.3.1. Participants........................................................................................... 73
2.3.2. Ethics.................................................................................................... 74
2.3.3. Clinical Assessment ............................................................................. 75
2.3.4. Questionnaire ....................................................................................... 76
2.3.5. Anthropometry ..................................................................................... 78
2.3.6. Bioelectrical Impedance Analysis........................................................ 79
2.3.7. eGFR Study Body Composition Sub-Study: Whole Body DXA
Assessments ................................................................................................... 80
2.4. Healthy Top-Enders’ Study......................................................................... 86
2.4.1. Participants........................................................................................... 87
2.4.2. Ethics.................................................................................................... 89
2.4.3. Clinical Assessments............................................................................ 89
2.4.4. Biochemical Analyses.......................................................................... 89
xi
2.4.5. Anthropometry .....................................................................................91
2.4.6. Bioelectrical Impedance Analysis ........................................................91
2.4.7. Complex Body Composition Assessments ..........................................92
2.5. Statistical Analyses .....................................................................................93
Chapter 3. Healthy Top-Enders’ Study: Body Composition and Skeletal
Proportions in Healthy Adult Aboriginal People ..............................................97
3.1. Introduction .................................................................................................98
3.2. Methods.......................................................................................................98
3.2.1. Participants and Measurments..............................................................98
3.2.2. Dual Energy X-ray Absorptiometry.....................................................99
3.2.3. Statistical Analysis .............................................................................100
3.3. Results .......................................................................................................103
3.3.1. Participant Characteristics: Healthy Top-Enders’ study ....................103
3.3.2. Body Composition: Healthy Top-Enders’ study................................103
3.3.3. Biochemical Characteristics: Healthy Top-Enders’ study .................106
3.3.4. Skeletal Proportions: Healthy Top-Enders’ study..............................108
3.3.5. Factor Analysis of Body Composition Measures in Healthy Top-
Enders’ study Participants............................................................................110
3.3.6. Accuracy and Precision of Predicted Fat Free Mass Equations: Healthy
Top-Enders’ study........................................................................................112
3.3.7. Determinants of Fat-Free Mass in Healthy Top-Enders’ study
Participants ...................................................................................................119
3.4. Discussion: Healthy Top-Enders’ study, Body Composition and Skeletal
Proportions .......................................................................................................120
Chapter 4. Healthy Top-Enders’ Study: ..........................................................126
4.1. Introduction ...............................................................................................127
4.2. Methods.....................................................................................................129
4.2.1. Participants .........................................................................................130
4.2.2. Setting.................................................................................................130
4.2.3. Protocol ..............................................................................................130
4.2.4. Statistical Analysis .............................................................................132
4.3. Results .......................................................................................................135
4.3.1. Body Composition Characteristics in Healthy Top-Enders’ study
Participants ...................................................................................................135
xii
4.3.2. Biochemical and Adipokine Characteristics of Healthy Top-Enders’
study Participants ......................................................................................... 137
4.3.3. Comparisons by Body Fat Percent Category ..................................... 139
4.3.4. Bivariate Relationships ...................................................................... 142
4.3.5. Multivariate Modelling of Log-Adiponectin ..................................... 143
4.3.6. Factor Analysis .................................................................................. 143
4.4. Discussion: Healthy Top-Enders’ study, Abdominal Fat Partitioning and
Inflammatory and Fat-related Biomarkers ....................................................... 145
Chapter 5. eGFR Study DXA Sub-study: The Relationship of Body Build and
Composition with Components of the Metabolic Syndrome in Indigenous
Australians who participated in the eGFR Study DXA sub-study................ 151
5.1. Introduction............................................................................................... 152
5.2. Methods..................................................................................................... 153
5.2.1. Participants......................................................................................... 153
5.2.2. Body Composition Analysis and Other Assessments ........................ 154
5.2.3. Metabolic and Inflammatory Profile.................................................. 156
5.2.4. Statistical Analysis ............................................................................. 157
5.3. Results: eGFR Study DXA sub-study....................................................... 159
5.3.1. eGFR Study DXA sub-study: General and Biochemical Characteristics
of Participants............................................................................................... 159
5.3.2. eGFR Study DXA sub-study: Body Composition Characteristics .... 161
5.3.3. eGFR Study DXA sub-study: Body Composition Adjusted for Age,
Gender, Diabetes and indicators of Kidney Damage. .................................. 163
5.3.4. eGFR Study DXA sub-study: Relationship of BMI and WHR in
Participants................................................................................................... 163
5.3.5. eGFR Study DXA sub-study: Skeletal Proportions........................... 166
5.3.6. eGFR Study DXA sub-study: Lean Body Mass and Resistance........ 167
5.3.7. eGFR Study DXA sub-study: Metabolic Syndrome.......................... 170
5.3.8. eGFR Study DXA sub-study: Relationship of Metabolic Syndrome
with Body Size and Composition................................................................. 172
5.3.9. eGFR Study DXA sub-study: Relationship of log-CRP concentration
with Body Composition and Metabolic Syndrome Factors ......................... 173
5.4. Discussion: eGFR Study DXA sub-study................................................. 176
xiii
Chapter 6. The eGFR Study: The Relationship Between Body Composition,
Metabolic Syndrome and Inflammatory Markers in Adul t Aboriginal and
Torres Strait Islander People ............................................................................185
6.1. Introduction: The eGFR Study..................................................................186
6.2. Methods: The eGFR Study........................................................................187
6.2.1. Inclusion Criteria................................................................................188
6.2.2. Exclusion Criteria...............................................................................189
6.2.3. Protocol ..............................................................................................189
6.2.4. Analysis..............................................................................................190
6.3. Results: The eGFR Study..........................................................................193
6.3.1. The eGFR Study: Body Composition ................................................195
6.3.2. The eGFR Study: Biochemical Differences.......................................195
6.3.3. The eGFR Study: Adiponectin Concentrations according to
Albuminuria Group ......................................................................................197
6.3.4. The eGFR Study: Adipokine Concentrations according to eGFR-Strata
......................................................................................................................198
6.3.5. The eGFR Study: Pair-wise Correlations of Adipokines with Body and
Biochemical Measures .................................................................................199
6.3.6. The eGFR Study: Multivariate Regression Model of Adiponectin
concentration ................................................................................................200
6.3.7. The eGFR Study: Factor Analysis .....................................................201
6.4. Discussion: The eGFR Study ....................................................................203
Chapter 7. Discussion and Conclusion .............................................................217
7.1. Addressing the Objectives of the thesis ....................................................218
7.2. Ethnicity, Ethnic Admixture, Body Composition and Metabolic Risk.....224
7.3. Implications for Clinical Practice and Policy............................................227
7.4. Limitations of the Methodology Used ......................................................229
7.5. Strengths of the study................................................................................231
7.6. Future Studies............................................................................................236
7.7. Conclusion.................................................................................................237
Appendix ..................................................................................................................239
References ................................................................................................................261
xiv
List of figures
Figure 2.1 Total and Regional Body Parameters with the Norland XR 46 Whole
Body DXA Scanner used in Darwin. ................................................................. 82
Figure 2.2 Total and Regional Body Parameters with Hologic Whole Body DXA
(Thursday Island Study Site).............................................................................. 85
Figure 3.1 Graphic of Skeletal Measures................................................................ 100
Figure 3.2 Longer leg-length Relative to overall Height was a consistent feature in
Aboriginal participants demonstrated by two females each 170 cm tall. ........ 108
Figure 4.1 Computed Tomography of the Abdomen at L2-3, Indicating Sagittal
Abdominal Diameter, and Abdominal Fat Partitioning................................... 131
Figure 4.2 Median Visceral Fat Area in Males by Ethnicity and Body Fat Percent.
.......................................................................................................................... 139
Figure 4.3 Median Fasting Insulin, HOMA and CRP concentrations in Males with
more than 20% Body Fat.................................................................................. 141
Figure 4.4 Median Fasting concentrations of HDL-cholesterol, Interleukin-6 and
Adiponectin in Females with more than 32% Body Fat .................................. 142
Figure 5.1 eGFR Study DXA sub-study: Scatter Plot of Waist to Hip Ratio v Body
Mass Index in Males, by Ethnic Group............................................................ 164
Figure 5.2 eGFR Study DXA sub-study: Scatter Plot of Waist to Hip Ratio v Body
Mass Index in Females, by Ethnic Group. ....................................................... 165
Figure 5.3 eGFR Study DXA sub-study: Differences in Pelvis Width as percent of
Height by Ethnic Groups.................................................................................. 166
Figure 5.4 eGFR Study DXA sub-study: Bar Graph of Differences in Resistance,
presented by Ethnicity and Gender .................................................................. 168
xv
List of tables
Table 1.1 Definitions of the Metabolic Syndrome....................................................21
Table 3.1 Body Composition Characteristics of Healthy Top-Enders’ study
Participants .......................................................................................................105
Table 3.2 Biochemical Characteristics of Healthy Top-Enders’ study Participants107
Table 3.3 Skeletal Frame and Proportions: Healthy Top-Enders’ study.................109
Table 3.4 Factor Analysis of Body Composition measures in Healthy Top-Enders’
study Participants .............................................................................................111
Table 3.5 Agreement of Measured Fat Free Mass and Fat Free Mass Predicted from
several Published Equations using Bioelectrical Impedance Analysis in non-
Indigenous Males. ............................................................................................113
Table 3.6 Agreement of Measured Fat Free Mass and Fat Free Mass Predicted from
Several Published Equations using Bioelectrical Impedance Analysis in
Aboriginal Males..............................................................................................115
Table 3.7 Agreement of Measured Fat Free Mass and Fat Free Mass Predicted from
Several Published Equations using Bioelectrical Impedance Analysis in
Aboriginal females. ..........................................................................................117
Table 3.8 Agreement of Measured Fat Free Mass and Fat Free Mass Predicted from
Several Published Equations using Bioelectrical Impedance Analysis in non-
Indigenous females...........................................................................................118
Table 3.9 Multiple Regression Analysis of Fat Free Mass (kg) in Healthy Top-
Enders’ study Participants................................................................................119
Table 4.1 Body Composition Characteristics in Healthy Top-Enders’ study
Participants .......................................................................................................136
Table 4.2 Biochemical Characteristics of Healthy Top-Enders’ study Participants138
Table 4.3 Multiple Linear Regression Analysis of Log-Adiponectin * ..................143
Table 4.4 Factor Analysis of Body Composition and Biochemical and Lifestyle
Measures in Healthy Top-Enders’ study Participants......................................144
Table 5.1 eGFR Study DXA sub-study: General and Biochemical Characteristics of
Participants. ......................................................................................................160
Table 5.2 eGFR Study DXA sub-study: Body Size and Composition Characteristics
of Participants...................................................................................................162
xvi
Table 5.3 eGFR Study DXA sub-study: Multivariate Regression Model of
Resistance (ohms) ............................................................................................ 168
Table 5.4 eGFR Study DXA sub-study: Multivariate Regression Model of Lean
Mass (kg).......................................................................................................... 169
Table 5.5 eGFR Study DXA sub-study: Frequency of Metabolic Syndrome Factors
in Participants Providing Data on all Five Factors........................................... 171
Table 5.6 eGFR Study DXA sub-study: Multivariate Logistic Regression Models of
Metabolic Syndrome. A model for each of Three Body Composition Measures
is Presented. ..................................................................................................... 173
Table 5.7 eGFR Study DXA sub-study: Multivariate regression model of log-CRP.
Four models for each of four body composition measures are presented........ 175
Table 6.1 The eGFR Study: General Characteristics and Metabolic Syndrome
Factors of Participants...................................................................................... 194
Table 6.2. The eGFR Study: Body Composition & Biochemical Characteristics of
Participants (n=593)......................................................................................... 196
Table 6.3. The eGFR Study: Median Adiponectin Concentrations by Albuminuria
Groups.............................................................................................................. 197
Table 6.4. The eGFR Study: Median Adiponectin and Leptin Concentrations by
eGFR-MDRD Strata ........................................................................................ 199
Table 6.5. The eGFR Study: Multivariate Regression Model of Log-Adiponectin
Concentration ................................................................................................... 200
Table 6.6. The eGFR Study: Results of Factor Analysis (n=454) .......................... 202
xvii
Appendix Tables
Appendix Table 1 Equations and Citations for Predicted Fat Free Mass used in
Chapter 3 ..........................................................................................................250
Appendix Table 2 Univariate Associations of Log-CRP with other Biomarkers:
Healthy Top-Enders’ Study, Chapter 4 ............................................................251
Appendix Table 3 Univariate Relationships of Body Composition Measures in
Healthy Top-Enders’ Study, Chapter 4 ............................................................252
Appendix Table 4 Univariate Relationships of Visceral Fat Area (VFA) and Sagittal
Abdominal Diameter (SAD) (L2-L3) and Biomarkers in the Healthy Top-
Enders’ Study ...................................................................................................253
Appendix Table 5 eGFR Study DXA sub-study: Main effects of Ethnicity, Gender,
Age, eGFR, Albuminuria (continuously) and Diabetes on Measures of Body
Size and Composition.......................................................................................254
Appendix Table 6 The eGFR Study: Median Adiponectin and Leptin Concentrations
in Participants, across Strata of Kidney Function, expressed as eGFR CKD-EPI.
..........................................................................................................................255
Appendix Table 7 The eGFR Study: Pair-wise Correlations of Log-Adiponectin with
Body & Biochemical Measures........................................................................256
Appendix Table 8 The eGFR Study: Pair-wise Correlations of Log-Leptin with
Body & Biochemical Measures........................................................................257
Appendix Table 9 The eGFR Study: Pair-wise Correlations of Log-A:L Ratio with
Body & Biochemical Measures........................................................................258
Appendix Table 10 The eGFR Study: Results of Factor Analysis in Males Without
Diabetes (n=113) ..............................................................................................259
Appendix Table 11 The eGFR Study: Results of Factor Analysis in Females Without
Diabetes (n=172) ..............................................................................................260
xviii
Abbreviations
A:L Adiponectin:Leptin ratio
ABS Australian Bureau of Statistics
ACR Albumin to creatinine ratio
AdipoR Adiponectin receptor
AIHW Australian Institute of Health and Welfare
AMP-kinase AMP-activated protein kinase
ANOVA Analysis of variance
ANZDATA Australian and New Zealand Dialysis and Transplantation registry
Apo (A, B, C, E) Apolipoprotiein (A, B, C, E)
ATP III Adult Treatment Panel report, III
BIA Bioelectrical impedance analysis
BIS Bioelectrical impedance spectroscopy
BMI Body mass index
BSA Body surface area
CKD Chronic kidney disease
CRP C-reactive protein
CT Computed tomography
DSAT Deep subcutaneous abdominal adipose tissue
DXA Dual-energy x-ray absorptiometry
DXA-BMC Bone mineral content measured by DXA
ECF Extracellular fluid
eGFR Estimated glomerular filtration rate
EGIR European Group for the study of insulin resistance
ESKD End stage kidney disease
FFM Fat free mass
FFM% Fat free mass as percent of body weight
GFR Glomerular filtration rate
HDL High density lipoprotein
HMW adiponectin High molecular weight adiponectin
HOMA Homeostasis model assessment
HOMA-IR Homeostasis model assessment score of insulin resistance
HU Hounsfield units
IAF Intra-abdominal fat
ICF Intracelleular fluid
IDF International Diabetes Federation
xix
IGT Impaired glucose tolerance
IL-1ra Interleukin-1 receptor antagonist
IL-6 Interleukin-6
IRS-1 Insulin-receptor substrate-1
kHz Kilo hertz
L (1,2,3,4,5) Lumbar vertebra
LDL Low-density lipoprotein
M1 (M2) M1 type macrophage (or M2 type macrophage)
MAP-kinase Mitogen-activated protein kinase
MDRD4 Modification of diet in renal disease study, 4 variable formula
MF-BIA Multi-frequency bioelectrical impedance analysis
mg/L Milligram per litre
MRI Magnetic resonance imaging
mRNA Messenger ribonucleic acid
NAHS National Aboriginal Health Strategy
NCEP National Cholesterol Education Program
NT Northern Territory
pg/ml picogram per millilitre
pH Phase angle (in reference to bioelectrical impedance analysis)
PI3 Phosphatidylinositol 3-kinase
pmol/L Picomol per litre
PPAR-g Peroxisome proliferator-activated receptor
R Resistance
RMSE Root mean square error
SAD Sagittal abdominal diameter
SAT Subcutaneous adipose tissue
SFB Selected frequency bioimpedance
SFT Skin-fold thickness
SIRE Self identified race or ethincicty
SSAT Superficial subcutaneous abdominal adipose tissue
T9-S1 Vertebral levels: Thoracic, Sacral
TBK Total body potassium
TBW Total body water
TNFa Tumour necrosis factor apha
uA Micro-Amps
ug/L Micro-gram per litre
xx
VAT Visceral adipose tissue
VLDL Very low density lipoprotein
WHO World Health Organisation
WHR Waist to hip ratio
Xc Reactance
Z Impedance
ρc The Lin concordance correlation coefficient

Chapter 1. Introduction

1
1.1. General Comments about the Health of Australia’s Aboriginal
Peoples and Torres Strait Islander Peoples
Up to half of the 17 years lower life expectancy among Indigenous Australians
(relative to other Australians) occurs due to the burden of adult chronic diseases
(Australian Institute of Health and Welfare (AIHW) 2008). This includes a
disproportionate burden of cardiovascular disease risk experienced at younger ages, a
higher than expected burden of disease among Indigenous Australian women
(compared with Indigenous men and non-Indigenous women), and higher rates of
chronic kidney disease (CKD) (McDonald 2010; Vos et al. 2009). Successful
management of chronic disease risk involves a partnership between health
practitioner and patient, where management plans are negotiated based on accurate
information about pathophysiology, prognosis and treatment options, in the context
of the patient’s expectations, and ultimately, their willingness to manage their
disease. Since the metabolic syndrome may precede the development of
cardiovascular disease by up to ten years, it’s early identification represents an ideal
clinical opportunity to modify the chronic disease burden in this high risk population.
Lifestyle modification is a key therapeutic goal in the treatment of metabolic
syndrome ('Third Report of the National Cholesterol Education Program (NCEP)
Expert Panel on Detection, Evaluation, and Treatment of High Blood Cholesterol in
Adults (Adult Treatment Panel III) Final Report' 2002)- therefore the major
responsibility is placed on the client. At this time, there is a paucity of detailed
information describing the relationship of excess body fat with metabolic syndrome
and the development of kidney damage in Aboriginal people and Torres Strait
Islander people.
The Introduction of this thesis will be composed of five parts. First the terminology
used in the thesis is discussed, as are the different origins (and the respective
diversity) of Aboriginal peoples and Torres Strait Islander peoples are described.
Second, the burden of chronic diseases including diabetes, chronic kidney disease
and cardiovascular disease risk in Aboriginal people and Torres Strait Islander
people will be reviewed. Third, since overweight and obesity are highly related to
risk of both cardiovascular disease and diabetes, a review of body build and body
composition techniques will be presented, including differences due to the impact of
2
aging, gender, chronic disease and ethnicity. Fourth, the relationship of adipose and
lean mass in modifying metabolic and inflammatory processes, and chronic disease
risk will be reviewed. Finally, the persisting knowledge gaps, and the specific aims
of the thesis will be summarised.
1.2. Terminology
Differences between groups of people are often described on the basis of race,
ancestry, ethnicity and indigenous status. Race and ethnic disparities in health
remain rooted in persisting socioeconomic disparities within populations (Pearce et
al. 2004). It was observed in a review of the medical literature, that while health may
have been reported on the basis of ethnicity, race, or locality, many reports did not
satisfactorily describe how race or ethnicity was defined (Shanawani et al. 2006).
Hence, ‘race’ has been used as a proxy for other more accurate and informative
variables, such as education and socioeconomic status (Paradies et al. 2007; Winker
2004). It is suggested that researchers should always indicate why race and/or
ethnicity are believed to be important to their particular study (Winker 2004). The
terms ‘race’, ‘ancestry’, ‘ethnicity’ and ‘indigenous’ status are briefly discussed
below.
‘Race’ has been used to describe the biologic differences between groups that are
assumed to be genetic (Pearce et al. 2004). The term ‘ancestry’ describes the
comparisons of groups that are genetically divergent, but whom share cultural and
environmental similarities (Rebbeck et al. 2005). This definition of ancestry
contrasts with ‘race’ which characterises comparisons of groups that diverge in most
respects (Rebbeck et al. 2005).
According to Callister et al. (Callister et al. 2007), ethnicity is not straightforward,
and cannot be easily identified or measured. Ethnicity is a complex composite of
biology, history, cultural orientation and practice, language, religion, lifestyle
(Pearce et al. 2004), country of birth, and/or nationality (Callister et al. 2007).
Ethnicity is also about affiliation (which can be different from descent or ancestry)
(Callister et al. 2007). Self-identified race or ethnicity (SIRE) can also be viewed as
a social construct (Rebbeck et al. 2005). As such, the membership or boundaries of
3
the SIRE evolves with time, reflecting and also influencing political and cultural
events (Rebbeck et al. 2005).
People may identify with multiple ethnic groups, either through migration or ethnic-
intermarriage, or the ability to record more than a single ethnic group (Callister et al.
2007). It is suggested that assigning individuals to a single ethnic group is
increasingly invalid (Callister et al. 2007). Several reasons exist as to why an
individual assigns one ethnic designation, when they could record more than one
based on ancestry (Callister et al. 2007); an individual may simplify their ethnicity
down to one group (‘self-prioritization’); their responses may be based primarily on
lived cultural experience, rather than ancestry; respondents may be influenced by the
networks around them; an individual may be reflecting how others view them;
respondents may record a single ethnicity as a political statement; economic
incentives (and disincentives) may have influenced how individuals identify to a
particular ethnic group (Callister et al. 2007).
The term ‘indigenous’ evolved through international law, and acknowledges the
particular relationship of aboriginal people to a territory from which they originate
(Australian Human Rights Commission (AHRC) 2005). Another definition of
‘indigenous’ peoples are those ‘(people) who originally, before intermarriage with
newcomers from overseas, had no other race history except for the country in which
they live’ (Flood 2006). The term ‘indigenous’ may also describe the experiences
shared by a group of people that have lived in a country for a few thousand years in
contrast with the experiences shared by a group of people who have lived in the same
country for a few hundred years (Cunningham et al. 2003). Despite the uniqueness
of indigenous nations throughout the world, indigenous peoples have shared a history
of colonisation, associated with loss of culture, land, voice, population size, dignity,
health and wellbeing (Durie 2004). It is those who are not ‘indigenous’ that have
coined this term. As such, ‘indigenous’ in contrast to the dominant culture may
describe ‘otherness’, or a ‘colonised people’ or those who have suffered from the
emotional and social repercussions of cultural domination and denigration
(Cunningham et al. 2003).
4
As opposed to a Christian philosophy, for example, which strongly identifies the
world and the heavenly realm, it is suggested an indigenous view sees people as
integral to the natural world, with a seamless relationship with the land, sea,
mountains, rivers, animals and plants (Cunningham et al. 2003; Durie 2004). Many
indigenous peoples throughout the world have a diverse profile. Cunningham et al.
(Cunningham et al. 2003) suggest that Aboriginal peoples and Torres Strait Islander
peoples have integrated into the wider Australian population to a greater extent than
First Nation peoples in north America, who are largely concentrated in reservations
(Cunningham et al. 2003).
Aboriginal with a lower case ‘a’ (aboriginal) describes an indigenous person from
any part of the world, whereas Aboriginal (with a capital ‘A’) refers to the
Aboriginal peoples of Australia (AHRC 2005). ‘Indigenous Australians’ refers to
Australia’s first peoples, that is, either Aboriginal peoples or Torres Strait Islander
peoples (AHRC 2012). While both groups are recognised as Indigenous Australians,
Torres Strait Islander peoples have a separate identity, culture and flag to that of
Aboriginal peoples (Flood 2006; Horton 1994; Shnukal 2001).
The Australian government definition of an Australian Aboriginal person or Torres
Strait Islander person is three-fold; a person who is of Aboriginal or Torres Strait
Islander descent and identifies as an Aboriginal person or Torres Strait Islander
person, and is accepted as an Aboriginal person or Torres Strait Islander person by
the community in which he or she lives or has lived (Gardiner-Garden 2000). The
pleural ‘peoples’ acknowledges the diversity among Australia’s Aboriginal
population and Torres Strait Islander population. In the strictest sense, ‘Aborigine’ is
the noun and ‘Aboriginal’ the adjective; however the preferred term is Aboriginal
people(s) (CDIP Toolkit 2004).
In addressing inequalities in health, it is proposed that sustainable solutions to
indigenous health problems need to acknowledge past practices, and allow people to
heal and address social determinants of health (Cunningham et al. 2003). And yet
defining ethnicity remains a sensitive issue for some Indigenous and other
Australians, including when attributing illness to genetic origins in Indigenous
populations without practically addressing social determinants of health (Paradies et
5
al. 2007). Perhaps the sensitivity around ethnicity for Indigenous Australians is also
a reflection of a lack of awareness of the heterogeneity between different regions and
communities, and diverse and complex aspects of health and wellbeing that may be
unique in different areas (National Aboriginal Health Strategy (NAHS) 1989). The
question of ethnicity for this thesis has relevance in understanding body composition
and related health risk of Aboriginal Australians and Torres Strait Islander
Australians. We have used self-identified ethnicity and asked participants how each
of 4 grandparents identified their ethnicity in order to explore the complex
relationships of body composition and chronic disease risk.
1.2.1. Use of terminology in the thesis
Several terms are used in the thesis, and require defining.
• Torres Strait Islander: peoples or persons (or participants) who are of Torres
Strait Islander descent, are accepted as such by their community as a Torres
Strait Islander person, and identify as a Torres Strait Islander person.
• Aboriginal: peoples or persons (or participants) who are of Aboriginal
descent, are accepted by their community as an Aboriginal person and
identify as an Aboriginal person.
• Both Aboriginal and Torres Strait Islander: peoples or persons (or
participants) who are of both Aboriginal and Torres Strait Islander descent
are accepted by their community as both Aboriginal and Torres Strait
Islander, and identify as such.
• Indigenous: describes the collective population (or participants) who are
Aboriginal or Torres Strait Islander or both Aboriginal and Torres Strait
Islander.
• non-Indigenous: refers to Australians who are non-Aboriginal and non-Torres
Strait Islander.
• Caucasian: refers to non-Indigenous Australians of a Caucasian background.
• other Australians: The wider Australian population with the exception of
Aboriginal peoples and Torres Strait Islander peoples.
In Chapter 1, the terms to describe Aboriginal people(s) or Torres Strait Islander
people(s) or Indigenous Australians are the terms used by authors that are cited in
6
this section, and the respective terminology of the authors has been retained. In the
following chapters, the terms used to describe participants specifically refer to either
Aboriginal adults, Torres Strait Islander adults, and adults who identify as both
Aboriginal and Torres Strait Islander. Where comparisons are made between
Caucasian participants and the rest of the study group, the term Indigenous
Australians is used, though the intention is not meant in any way to disrespect the
uniqueness and place of Aboriginal peoples in Australia, or the uniqueness and place
of Torres Strait Islander peoples in Australia. These definitions are revisited in
Chapter 5 and Chapter 6 with respect to stratification of participants in the PhD
study.
1.3. Origins and Aspects of Culture of Aboriginal Peoples and
Torres Strait Islander Peoples
More detail is provided for Torres Strait Islander people in this section since they are
a smaller population and as a result less information regarding their culture and
origins is published as compared with Aboriginal peoples. The information
describing Aboriginal peoples is intentionally sparse for two reasons: first, there are
many resources that describe Aboriginal culture and lifestyle. Secondly, since
Aboriginal peoples of Australia are diverse peoples, a single summary of one group
cannot adequately describe Aboriginal people in a different region of Australia. One
must also consider that Aboriginal peoples and Torres Strait Islander peoples of
today are more heterogeneous than these early descriptions.
Torres Strait Islander Peoples
The Oceania region was described in 1832, and included the peoples of Melanesia,
Micronesia, and Polynesia, and the countries of Australia and New Zealand.
Melanesia refers to the ethnic and geographical grouping of islands distinct from
Polynesia and Micronesia. Today Melanesia includes New Guinea (Irian Jaya and
Papua New Guinea), New Caledonia, Vanuatu, Fiji, and the Solomon Islands. Torres
Strait Islander peoples are of Melanesian origin, distinct from Aboriginal peoples in
both identity and culture (Florek 2005; Horton 1994; Lawrie 1972; Shnukal 2001).
Torres Strait Islander peoples are described as more closely resembling the physical
7
appearance and (aspects of) culture of the people of Papua New Guinea (than
Aboriginal peoples) (Flood 2006).
The Torres Strait region describes the hundred or so islands to the north of Cape
York Peninsula in Queensland; to the south of Papua New Guinea; and between the
Arafura Sea to the west and the Coral Sea to the east. The region was first settled by
Torres Strait Islander peoples, who have been able to maintain sovereignty from the
people of Papua New Guinea to the north, and Aboriginal people from mainland
Australia to the south (Horton 1994). It is reported that the region has been in
constant habitation by Torres Strait Islander peoples from ‘time immemorial’
(Horton 1994) or between 4000 (Morrissey 2001) up to 8000 years (Flood 2006).
Flooding of the land bridge between the Australian mainland and Papua New Guinea
created islands that were then settled by Torres Strait Islander people (Flood 2006).
There are four island regions within the Torres Strait (Horton 1994; Lawrence et al.
2004). The eastern group, composed of high volcanic islands and fertile soil,
permitted cultivation and agriculture. As the eastern islands are also located within
the region of the Great Barrier Reef, Islanders also enjoyed diets rich in marine life.
The central group of low sandy islands and reefs permitted fishing. The top western
(or northern) group near Papua New Guinea is characterised by its low islands of
mud flats and mangroves, permitting fishing and crabbing. The western group of
high islands are characterised by volcanic and granite rock, and sandy and acidic
soils. The lifestyle of the western group included hunting and fishing, and
cultivating gardens.
All Torres Strait Islander peoples are described as having exceptional seafaring
skills, and closely observed and understood the natural environment, wind and stars
for daily survival (Eseli et al. 1998). Within the region, Islanders were territorial
with other Torres Strait Islander groups, and encountered each other for trade,
warfare and marriage (Lawrence et al. 2004). Torres Strait Islander peoples were
known for being fierce warriors and head-hunters, though the latter was not readily
evident by the time of European contact (Florek 2005). The island of Moa, to the
south of Mabuiag and Badu islands in the western Torres Strait was said to
accommodate up to 500 people prior to 1875 (Florek 2005). The compiled legends
8
by Lawrie (Lawrie 1972) report a history of warfare between the peoples of Moa
Island and their neighbours on Badu and Mabuiag islands, to the end that very few
native Moa Island people exist now.
From the 1800’s, several events impacted on the lives of Torres Strait Islander
peoples. First, an influx of people of diverse nationalities encroached on island life
due to lucrative trepang harvesting (initially) and later pearling industries. The
Queensland government saw this as an important economic opportunity, and
consequently the Torres Strait was annexed to Queensland (and therefore Australia)
in the late 1800’s (Lawrence et al. 2004). Around this time, Christianity was brought
to the region by the London Missionary Society, and Torres Strait Islander peoples
were principally ministered to by Pacific Island missionaries. With ethnic
intermarriage, and an expanding Pacific Island community in the Torres Strait, the
community of St Paul’s on Moa Island was established (Eseli et al. 1998). Where
Torres Strait Islander peoples had initially been overlooked from the Aboriginal
protection policy on the mainland, life changed significantly with the imposition of
government appointed protectors. Protectors oversaw day to day life, quarantining
earnings, limiting marital unions and movement throughout the region, and even
relocating Aboriginal people from the mainland to settle in select communities
(Hammond and Moa islands) in the Torres Strait (Lawrence et al. 2004; Morrissey
2001). Within a short timeframe, Torres Strait Islander peoples had encountered,
worked with, and married Polynesians, Filipino, Japanese, Chinese and Aboriginal
peoples. Later, with lifting of restrictions, many Islanders moved to the Australian
mainland in search of work, settling throughout Queensland, the Northern Territory
and Western Australia.
Maintenance of Torres Strait Islander culture occurred (among other practices)
through the sharing of legends (Lawrie 1972), preservation and use of traditional
languages (Ray 2003), dance, singing, use of drums, masks and the feathered
headdress (Flood 2006; Lawrence et al. 2004). Torres Strait Island culture is strong
today, maintaining the strength of the past, but reflecting the adaptability of the
peoples to the often harsh encounters of recent history including the influences of
missionaries, government protectors, and government policy (Florek 2005; Shnukal
2001). Part of the cultural adaptation included dance, style of housing, adopting
9
introduced languages (English and Creole), and spiritual and religious practices. The
Torres Strait Regional Authority was established in the 1990’s in response to
Islanders desires for self-governance (Lawrence et al. 2004; Morrissey 2001). This
organisation allows the region to voice shared political and economic aspirations;
even if historically Torres Strait Islander peoples existed in smaller clan and island
groups.
Aboriginal Peoples
Australian Aboriginal peoples are described as having an ancient living culture and
heritage (Flood 2006). Aboriginal peoples may have arrived in Australia via a land
bridge from Asia, settling first in the north of Australia, and over time inhabiting the
coastal then inland regions (Flood 2006). Australian Aboriginal peoples are believed
to have arrived in Australia some 50,000 years ago (Flood 2006), and therefore are
likely to have arrived at a time much earlier than the arrival of Torres Strait Islander
peoples in Australia.
Aboriginal peoples survived and thrived on the Australian continent prior to
European settlement, although having very limited means of preserving food, this
meant frequently enduring feast and famine (Abbie 1969). Aboriginal peoples
observed nature, could locate water, were expert trackers of animals and learnt to
harvest food and medicines from the natural environment (Abbie 1969). Aboriginal
men hunted for large animals, birds and fish, whereas Aboriginal women (and
children) gathered plant-foods, smaller animals and in coastal areas, crustaceans
(Abbie 1969; Flood 2006). They lived in hierarchical and often small communities,
each member having specific roles, and understood the consequences of complex
kinship relationships. Gathered foods were shared by the group. Cooking of a
prized large animal was conducted by males, and a prized portion reserved for the
capable hunter (Abbie 1969).
10
Similarities and Differences of the Culture and Lifestyle of Aboriginal Peoples and Torres Strait Islander Peoples prior to European Contact
Torres Strait Islander people were very close to nature, and closely observed changes
in the stars, and winds to plan hunting, cultivation and sea travel (Eseli et al. 1998).
Unlike Aboriginal peoples, Torres Strait Islander peoples cultivated crops (Abbie
1969; Flood 2006). In particular, Torres Strait Islander men hunted and were
responsible for cultivating, harvesting and maintaining taro, yams and coconut in
family (or clan) vegetable gardens (Flood 2006). Aboriginal people of the Cape
York region would have been aware of the cultivating practices of Torres Strait
Islander peoples. The lack of gardening and cultivation among Aboriginal peoples
may have been because Aboriginal males observed this practice to be a woman’s role
(Abbie 1969).
Although territorial, Torres Strait Islander people were keen traders (Flood 2006).
Favourable trade winds occurred in the Dry Season (March-November) (Eseli et al.
1998). Traded items with the northern neighbours of Papua New Guinea included
bow and arrow, drums (Flood 2006) and outrigging canoes (Horton 1994). Although
many hunting tools are described, the bow and arrow were not a tool used by
Aboriginal peoples (Abbie 1969). The spear was the predominant hunting tool of
Aboriginal males, but a spear was also used by Torres Strait Islander hunters for fish,
dugong and turtle. Aboriginal people of North-Eastern Arnhemland also traded with
Macassan (Indonesian) seafarers who had been visiting Australian waters in the wet
season from the late 1400’s to harvest trepang (McMillan 2007), until the
government policy changed in the early 1900’s. Consequently, Aboriginal people in
this region adopted some aspects of Macassan culture (McMillan 2007).
1.4. A Summary of the Diversity of Population, Culture, Lifestyle
and Health Among Aboriginal Peoples and Torres Strait Islander
Peoples in recent times
Indigenous Australians are a heterogeneous population (NAHS 1989). The most
obvious distinctions within the Indigenous population as a whole are ethnicity
(Aboriginal and Torres Strait Islander populations, and non-Indigenous ethnic
11
admixture), geography (remote, regional and urban), an Indigenous language as a
first language, and lifestyle (urbanised, rural or culturally-rich within homelands).
In data from the 2006 Australian Bureau of Statistics national census, Aboriginal
people or Torres Strait Islander people comprised 2.5% of Australia’s population,
where 90% of people identified as an Aboriginal person, 6% as a Torres Strait
Islander person (the majority of whom live in Queensland) and 4% as both
Aboriginal and Torres Strait Islander (Australian Bureau of Statistics (ABS) 2006).
As a group, Aboriginal people, Torres Strait Islander people and people who identify
as both Aboriginal and Torres Strait Islander are classified as Indigenous Australians.
The majority (76%) of Indigenous Australians live in urban or regional areas
throughout Australia, although Indigenous Australians make up 24% and 45%
respectively of people living in remote and very-remote areas of Australia (AIHW
2008). In the Northern Territory, 32% of residents identify as an Indigenous
Australian. This compares to New South Wales, which has the largest population of
Indigenous Australians in the country, and yet this eqauates to only 2% of the NSW
population (ABS 2006).
The increasing prevalence of chronic diseases throughout the world has accompanied
changes in lifestyle, especially in those who transition from rural/traditional lifestyles
to industrial economies within short periods of time (Weil et al. 2010; Yajnik et al.
2008). There has been a variable transition in lifestyle for Aboriginal peoples and
Torres Strait Islander peoples throughout Australia, with some groups having a
longer transition period, particularly in south east Australia (Guest et al. 1992; O'Dea
et al. 1993; Williams et al. 1987) and much more recent lifestyle transition in some
areas of Northern Australia (O’Dea et al. 1988b).
The changes in lifestyle have also related to government policy to establish missions
or government settlements (Brimblecombe et al. 2006) (groupings of Aboriginal
peoples and or Torres Strait Islander peoples within settlements that did not reflect
usual clan or language groups, adoption of Western-lifestyle practices and variable
access to homelands), and inter-marriage or production of children with people of a
non-Aboriginal or Torres Strait Islander background, referred to as ethnic-admixture.
Northern Australia is a multicultural society. Within larger urbanised centres
12
Indigenous Australians have intermarried with Chinese, Malays, Europeans, and with
other Aboriginal and Torres Strait Islander families (Shnukal 2001), which inevitably
impacts on lifestyle, body size and composition.
The definition of Aboriginal health, paraphrased from the National Aboriginal Health
Strategy (NAHS) incorporates one’s physical wellness within the context of the
social, emotional and cultural well-being of their community, with aspirations that
each individual obtain their full potential in life (NAHS 1989). Connectedness with
traditional homelands, community and culture has also been linked with health, and
was an expression of mastery and control over one’s life (Burgess et al. 2009;
Rowley et al. 2008). Given the complexity of Indigenous Australian peoples and
communities, different factors and pressures are likely to exist within different
communities with regard to chronic disease risk. Much of the literature in this
review describes Aboriginal peoples which reflect the larger population group, and
which may have been more accessible than Torres Strait Islander peoples.
Nonetheless, health statistics and policies describe Indigenous Australians, without
any distinction of between within-group differences. One objective of this thesis is
to explore the relationship of health and body composition of Aboriginal and Torres
Strait Islander peoples separately in order to ascertain similarities and differences
between them.
It is now extremely rare for Aboriginal people to live a wholly traditionally-oriented
lifestyle. Increasing urbanisation even in remote parts of Australia has altered the
daily lifestyle of many Aboriginal people. O’Dea et al. (O’Dea et al. 1988b) reported
on the health and lifestyle of one small homelands community living a traditionally-
oriented lifestyle in Arnhem Land in Northern Australia in the mid-1980’s: they
lived in small clan groups and travelled frequently throughout their country; they
relied on the local environment for plant and animal-based nutrition, and in this
tropical community did not have refrigeration, so ate in proportion to food
availability; they also observed special governances, including a hierarchy with
access to community food. In addition, adults and children were demonstrably lean
and healthy (although was accompanied by the suggestion of fasting insulin
resistance). This contrasts to Aboriginal people living a more urbanised lifestyle.
Despite the leanness of young adult males living either in the township of Derby or
13
rural community in Kalumburu in the West Australian Kimberley region, compared
with healthy lean Caucasian males (mean BMI 21 kg/m2), Aboriginal males were
more likely to have an abnormal lipid profile (high triglycerides, low HDL-
cholesterol) and higher 2-hour glucose and insulin responses and than lean Caucasian
males (O’Dea et al. 1982).
Several studies link indicators of poverty with the development of diabetes, other
cardiovascular risk factors and chronic kidney disease in Aboriginal communities
(Cunningham et al. 2008; Hoy et al. 1997). Within remote Aboriginal communities
of the Northern Territory, high rates of poverty, poor living conditions and
unemployment were linked with high rates of preventable skin sores, lung disease
(high rates of smoking), indicators of rheumatic heart disease, and renal disease (Hoy
et al. 2003a). In an urban setting, relative to low educational attainment, lower
socioeconomic status was more strongly associated with diabetes (Cunningham et al.
2008).
In Aboriginal communities with less-traditional lifestyles (even if situated in remote
regions of Australia), older age was linked with higher degrees of overweight
(measured by BMI), and diabetes (Brimblecombe et al. 2006). In comparison, this
was not observed over a wide age-range in the small traditionally-oriented
Aboriginal clan group referred to earlier (O’Dea et al. 1988b). Several investigators
report more adverse chronic disease profiles among Aboriginal Australians living in
remote regions, compared with urban areas. From 2001 data, Aboriginal people and
Tores Strait Islander people living in the regions most remote from where dialysis
services were situated were more likely to require treatment for severe kidney failure
(Preston-Thomas et al. 2007). Similarly, for Aboriginal people with diabetes, those
from remote communities exhibited a more adverse vascular risk profile than
Aboriginal people in an urban community (Maple-Brown et al. 2007).
A divergence of health over time, between two closely situated Aboriginal
communities in Central Australia highlight the impact of westernised living (with
reliance on store-food and centralised services) and a community focussed on
homelands-oriented lifestyle. Reliance on store-provided foods was associated with
a higher prevalence of overweight and diabetes, especially in Aboriginal women
14
older than 35 years (McDermott et al. 1998; O'Dea et al. 1990). Yet in homeland-
communities, BMI, rates of impaired glucose tolerance and smoking and
cardiovascular deaths among Aboriginal residents were all lower than expected
(Rowley et al. 2008). The positive health impacts of Aboriginal homeland
communities was attributed by investigators to an individual’s positive sense of
control over their lives and futures (Rowley et al. 2008), and positive engagement
with culture and community (Burgess et al. 2009).
High quality diets, including regular fresh food and vegetables have not always been
available to Aboriginal peoples and Torres Strait Islander peoples, through
degradation of local traditional hunting grounds (Gault et al. 1996; O'Dea et al.
1988a), and reliance on community-stores supplying lower cost, energy-dense foods
(Brimblecombe et al 2009; O'Dea et al. 1990). Remote Aboriginal communities
impacted by urbanisation increasingly manifest overweight, insulin resistance,
diabetes and cardiovascular disease (Gault et al. 1996). Accessing healthy nutrition
(a basic necessity) in remote parts of Australia is a challenge, and poor nutrition has
been linked with abnormal markers of endothelial dysfunction in one remote
Aboriginal community (Rowley et al. 2003).
Poor quality diet, cigarette smoking and lack of regular physical activity explained
almost 80% of the population-attributable risk of cardiovascular disease in a large
international multi-ethnic study (Yusuf et al. 2004). It is significant therefore that
adult Aboriginal people with established diabetes demonstrated an exceptionally
positive capacity to improve glycaemic status and lose weight through the adoption
of healthy diet and lifestyle habits (by returning to country, and relying on hunting
and gathering foods) (O'Dea et al. 1980).
1.5. The Burden of Chronic Diseases and the Metabolic Syndrome in
Aboriginal Peoples and Torres Strait Islander Peoples
Aboriginal and Torres Strait Islander Australians have a younger mean age than
other Australians (21 v 37 years) (ABS 2006), due to a combination of high fertility
rates in younger people, and lower life-expectancy among older people (AIHW
2008). Based on 2003 data, non-communicable diseases, such as cardiovascular
15
disease, diabetes, mental illness and chronic lung disease explained 70% of the life-
years lost from death and disability (also called the health-gap) between Aboriginal
and Torres Strait Islander Australians and other Australians (Vos et al. 2007).
Aboriginal and Torres Strait Islander Australians younger than 54 years old were
responsible for 60% of the health gap (35% in 35-54 year olds, and 25% in 15-34
year olds (Vos et al. 2009), compared with other Australians. Ischemic heart disease
and diabetes were responsible for 37% of the health gap among Aboriginal and
Torres Strait Islander Australian’s aged 35-54 years old (Vos et al. 2009).
This data on the extent of non-communicable diseases is supported by a high
frequency of chronic disease risk markers which have been observed in Indigenous
Australians at a younger age than for Australians generally (Dunstan et al. 2002;
Glatthaar et al. 1985). The high frequency of cardiovascular disease risk markers in
Indigenous Australians was demonstrated in a large cross-sectional adult screening
study among Indigenous Australians in the Darwin urban region (of the Northern
Territory) by examining the frequency of six cardiovascular disease risk factors
(hypertension, dyslipidaemia, albuminuria, tobacco smoking, elevated waist to hip
ratio and diabetes) (O'Dea et al. 2008). In this study, almost one third of adult
Aboriginal people older than 35 years had diabetes and two additional cardiovascular
risk factors, whilst among younger Aboriginal adults (less than 35 years old), 45%
had at least 2 cardiovascular risk markers (O'Dea et al. 2008).
1.5.1. Chronic Kidney Disease
Individuals with end-stage kidney disease (ESKD) must rely on dialysis or another
renal replacement therapy modality in order to sustain life due to insufficient
excretory function of the kidney. ESKD is preceded by chronic kidney disease
(CKD), of which two hallmarks are low glomerular filtration rate (GFR) and
albuminuria (protein detected in the urine) (Levey et al. 2011; Mathew et al. 2007).
The Australian and New Zealand Dialysis and Transplantation (ANZDATA) registry
records longitudinal data of individuals with ESKD, collating information about the
causes and consequences of severe renal disease. However, there are no comparable
registries for Australians with chronic kidney disease.
16
The ANZDATA registry identifies Aboriginal peoples and Torres Strait Islander
peoples collectively as Indigenous Australians (McDonald 2010). Several
distinctions between Indigenous and other Australians are observed with respect to
end stage kidney disease. First, type 2 diabetes and presumed glomerulonephritis are
currently the most common causes of end-stage kidney disease (ESKD) in
Indigenous Australians (McDonald 2010), however the attributed diagnosis may be
clinically based, rather than biopsy proven. Type 2 diabetes was also identified as
the most frequent co-morbidity of ESKD in Indigenous Australians (McDonald
2010). Second, in contrast to other Australians, ESKD affects Indigenous Australian
females to a greater extent than Indigenous Australian males (Jose et al. 2009).
Third, Indigenous Australians aged 35-64 years are reported to have at least 10 times
higher an incidence rate of requiring dialysis treatment than similarly aged other
Australians (McDonald 2010). The authors postulate the following reasons for this
disparity: socioeconomic status (household income, overcrowding and
unemployment) in addition to the early onset of Type 2 diabetes among younger
Indigenous Austraians that was decribed above. Finally, data from 2006 showed at a
state level, the Northern Territory and Western Australia had the highest incidence
rates of Indigenous Australians requiring treatment for ESKD (1192 and 774 per
million population respectively) (Jose et al. 2009). From 2001 data, Indigenous
Australians who lived in the most remote regions from where dialysis services were
available had higher rates of ESKD than other Indigenous and non-Indigenous
Australians (Preston-Thomas et al. 2007).
In many populations, it has been shown that two markers of chronic kidney disease,
either low glomerular filtration rate (low GFR: a deficiency of water-soluble
excretory function of the kidney) or albuminuria (the detection of albumin in the
urine) (Levey et al. 1999; Levey et al. 2011) were independently associated with
higher cardiovascular disease mortality (Keith et al. 2004). Among many Indigenous
Australian communities, albuminuria has been identified more frequently than
impaired GFR (Maple-Brown et al. 2011; Rowley et al. 2000). Albuminuria is
reported to cluster with obesity and dysglycaemia which is also reported to explain
high community levels of cardiovascular disease (Hoy et al. 2006b; Rowley et al.
2000).
17
Origins of Kidney Damage in Aboriginal people: Lessons from Renal Biopsy
Studies
Remote living Aboriginal people (with no history of renal injury, and mean BMI 20
kg/m2) were described as having glomerulomegaly in the setting of low nephron
endowment compared with non-Indigenous Australians (Hoy et al. 2006a). The
authors suggested glomerulomegaly (the compensatory hypertrophy of remaining
glomeruli to maintain renal excretory function) was a significant susceptibility factor
to additional renal insults and progressive kidney damage. This was suggested by
their findings of even fewer glomeruli in the biopsies of Aboriginal people who had a
history of hypertension compared with the biopsies of Aboriginal people with normal
blood pressure (Hoy et al. 2006a). Many renal insults may occur over the life course
in Aboriginal people, including low birth weight (due to poor maternal nutrition and
smoking) (Hoy et al. 2010b), recurrent post-infectious nephritis episodes (in
childhood and adult life), and adult-related disease morbidity (hypertension,
overweight, smoking and diabetes) (Hoy et al. 2010a). Poverty, poor-community
housing and infrastructure and a high-frequency of skin-sores have been linked with
post-infectious glomerulonephritis (Hoy et al. 1997).
Moore et al. (Moore et al. 1996) described two key findings from a renal
histopathology series of more than 200 Aboriginal people with hypertension,
proteinuria or diabetes. First, a mixed pattern of renal injury was observed in
Aboriginal people (where only 23% of biopsies had primary diabetic lesions,
although 37% of the cohort had a clinical diagnosis of diabetes). Second,
glomerulomegaly was conservatively observed in 11% of biopsies as a primary
finding, though coincided with mesangiopathic renal lesions (a form of
glomerulonephritis) in many other biopsies (Moore et al. 1996).
These biopsy reports suggest that remote-living Aboriginal people are more likely to
have glomerulomegaly and therefore are more vulnerable to progressive kidney
damage in the setting of additional insults. It is not known, since Torres Strait
Islander people are not specifically identified in series of renal biopsy studies, if the
same risk exists for Torres Strait Islander people as was demonstrated for Aboriginal
people.
18
Finally, low nephron endowment has origins in neonatal development. Low-birth
weight (less than 2500 grams) and intra-uterine growth restriction may impact
nephron development, since nephrons develop in the final stages of pregnancy. Hoy
et al. (Hoy et al. 2010b) suggested a link for neonatal under-development with
cardiovascular disease risk in later life; proposing low-nephron endowment was
more likely to occur in babies born of teenage mothers, and exposed to maternal
smoking and under-nutrition. These babies were more likely to develop higher levels
of insulin resistance, albuminuria and cardiovascular disease in adulthood (Hoy et al.
2010b). Obesity, type 2 diabetes and diabetes in pregnancy is a more recent
phenomenon (Leonard et al. 2002; Valery et al. 2008), and the impact on kidney
function and cardiovascular disease risk among Aboriginal people and Torres Strait
Islander people in later-life requires further study.
1.5.2. Cardiovascular Disease Risk: Prediction Scores and the Metabolic Syndrome
Internationally cardiovascular disease is a major health concern, and several key risk
markers have been identified. The Framingham risk tool identified a combination of
older age, male-gender, current smoking, abnormal lipids (high total cholesterol and
low HDL-cholesterol), high systolic blood pressure and having diabetes predicted a
higher risk of cardiovascular disease over the next 10 years (Wilson et al. 1998). The
Framingham community were largely middle-class Americans of Caucasian
background (Wilson et al. 1998). The Framingham risk tool has not been validated
as a risk assessment tool that is transportable to other ethnic groups, such as
Aboriginal peoples or Torres Strait Islander peoples. As such, the Framingham risk
tool did not fully explain the increased burden of cardiovascular risk in young
Aboriginal women when evaluated in one remote Aboriginal community (Wang et
al. 2003). Several investigators suggest other unmeasured non-traditional risk factors
for cardiovascular disease risk require evaluation in Indigenous Australians including
albuminuria, inflammation, clotting factors, family history and genetic factors, other
atherogenic lipid parameters, psychological stress (Rowley et al. 2008) and low-birth
weight (Hoy et al. 2010b).
19
More recently, the Interheart study identified nine risk factors which contributed to
more than 90% of the population attributable-risk for myocardial infarction across all
major populations, recruiting adults from 52 countries across Asia, North America,
South America, Europe, Ausyralia, the Middle-East and Africa. The Interheart study
compared approximately 15,000 adults with a first myocardial infarction and 15,000
matched healthy adults from diverse ethnic and geographical regions internationally
for the prediction of myocardial infarction (Yusuf et al. 2004). These risk factors
were hypertension, abdominal obesity, diabetes, dyslipidaemia (specifically the ratio
of apolipoprotein B to apolipoprotein A1), smoking, alcohol (nil v regular weekly
alcohol consumption), physical activity (not active v weekly moderate-strenuous
activity), poor quality diet (lack of daily fruit and vegetable v daily fruit and
vegetable intake) and psychosocial stress (Yusuf et al. 2004). Of these nine factors,
three factors were protective: exercise (weekly moderate-strenuous exercise), diet
(daily fruit and vegetable intake) and alcohol (thrice weekly consumption of alcohol
v abstainers). The Interheart study has therefore extended the known risk markers
identified by the Framingham study to markers that are applicable across both
Caucasian and non-Caucasian populations. The combination of non-smoking,
regular moderate physical activity and daily consumption of fruit and vegetables was
associated with a cumulative lower risk of acute myocardial infarction (odds ratio
0.21, 99% confidence interval 0.17-0.25) (Yusuf et al. 2004).
The Interheart study population did not include the assessment of Aboriginal peoples
or Torres Strait Islander peoples. Although not directly assessing cardiovascular
disease risk, Vos et al. (Vos et al. 2007) reported that 37% of the disease burden (the
impact of death and disability), and 49% of the health gap (the life-years lost from
death and disability) of Indigenous Australians were predicted (in order) by: tobacco
use, obesity, physical inactivity, hyper-cholesterolaemia, alcohol, hypertension, low
fruit and vegetable intake, illicit drugs, interpersonal violence, child sexual abuse and
unsafe sex. Since cardiovascular disease is a major cause of disease burden and
health gap in Indigenous Australians, the similarities of these factors with Interheart
factors are noted. In contrast to a minor protective effect of alcohol intake on
cardiovascular disease risk in the Interheart study, alcohol was more likely to extert
harmful effects in Indigenous Australians, related to interpersonal violence and
mental disease (Vos et al. 2009). Furthermore, alcohol has been linked to kidney
20
damage in some remote Aboriginal communities through weight gain, and diabetes-
related kidney disease (Hoy et al. 1998).
The metabolic syndrome recognises a clustering of features linking abdominal
obesity, insulin resistance, increased cardiovascular risk, and premature mortality
(NCEP 2002; Alberti et al. 2006; Alberti et al. 1998). The metabolic syndrome
received major attention following the 1988 Banting Lecture on insulin resistance in
humans (Reaven 1988). Metabolic syndrome may exist for up to 10 years before the
development of Type 2 diabetes. This pre-clinical period is an important opportunity
to apply lifestyle interventions and medical management of risk factors to modify the
emergence of coronary heart disease.
Several definitions for the metabolic syndrome are in use, summarised in Table 1.1
and include: the World Health Organisation definition (WHO) (Alberti et al. 1998),
National Cholesterol Education Program (NCEP) Expert Panel on Detection,
Evaluation and Treatment of High Blood Cholesterol in Adults (Adult Treatment
panel III) definition (NCEP ATP III 2001), the European Group for the study of
insulin resistance (EGIR) and the International Diabetes Federation (IDF) definition
(Alberti et al. 2006).
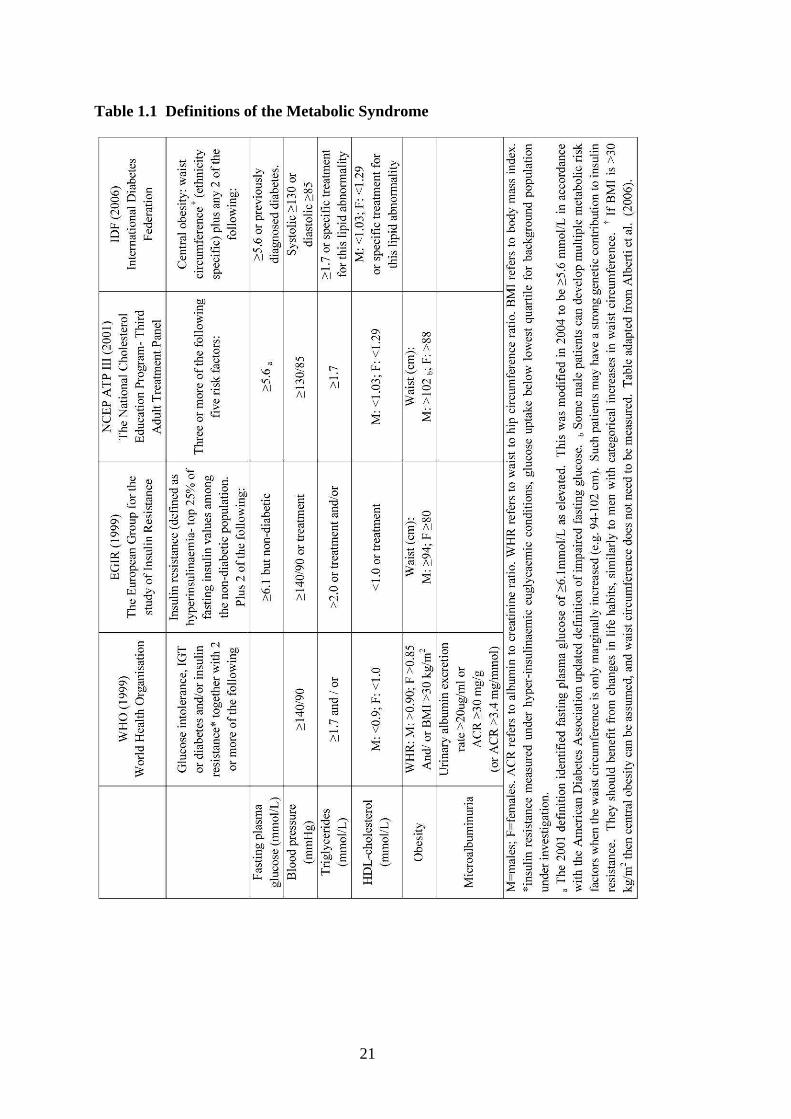
21
Table 1.1 Definitions of the Metabolic Syndrome

22
The key components of metabolic syndrome include central obesity, dysglycaemia,
hypertension, and atherogenic dyslipidaemia (either or both of hyper-
triglyceridaemia and low HDL-cholesterol). The syndrome definitions indicate
associations of features, rather than causality. Only the WHO definition considers
albuminuria as a key component, linking albuminuria to vascular dys-regulation,
whereas other definitions do not (Alberti et al. 2006). Some of these components can
be performed routinely in the clinic while others require a reseach setting. Certain
complex methodologies, such as hyper-insulinaemic-clamp testing are not
appropriate for either the clinic or field setting. The NCEP criteria allow use of non-
fasting HDL-cholesterol to indicate atherogenic dyslipidaemia, when fasting lipids
are not available (NCEP ATP III 2001). In each definition, different thresholds of
low concentration of HDL-cholesterol are defined for males and females. The IDF
criteria identifies the importance of ethnicity-specific waist measures, thereby
identifying risk may be different in different populations. Although several
investigators recommend use of lower waist circumference thresholds in Aboriginal
people (Wang et al. 2003), the exact threshold of a healthy waist circumference or
central body fat measures have not been defined. Insulin resistance is defined as the
top 25% of fasting insulin values among the non-diabetic population in the EGIR
definition, and requires population specific data (Alberti et al. 2006). This may be
problematic among Aboriginal peoples and Torres Strait Islander peoples, since
assessment of insulin resistance is not routinely performed, and among some
Aboriginal people, widely varying 2-hour insulin responses may accompany
otherwise similarconcentrations of fasting insulin (O'Dea et al. 1990).
Further research priorities were identified for the metabolic syndrome by Alberti et
al. (Albertiet al. 2006) including
• The use of improved measurements of body fat and fat distribution using
whole body dual energy x-ray absorptiometry (DXA), abdominal computed
tomography (CT) or magnetic resonance imaging (MRI)
• Measurement of liver fat content
• Measurement of adipose-specific biomarkers (adiponectin and leptin),
• Measurement of fasting insulin and insulin resistance scores
• inclusion of albuminuria, and
23
• pro-inflammatory markers: c-reactive protein (CRP), tumour necrosis factor
alpha (TNFa) and interleukin-6 (IL-6).
Numerous studies have described metabolic syndrome components in Aboriginal
people and Torres Strait Islander people. In other populations, the relationship of
inflammation and metabolic risk has been extended to more specific markers,
including interleukins, and adiponectin (Carvalho et al. 2010; Krakoff et al. 2003;
Yajnik et al. 2008). These markers, in combination with detailed assessment of body
combination measures have not yet been assessed in Indigenous Australians. This is
a goal of this thesis.
1.5.3. Overweight and Dysglycaemia
Aboriginal peoples have been reported to have a higher risk of developing diabetes at
lower levels of body mass index than observed among European populations (Daniel
et al. 1999; Rowley et al. 1997). Overweight in Aboriginal peoples is associated
with numerous metabolic abnormalities, which frequently cluster together and
worsen with weight gain from a relatively young adult age (by age 35 years) (O'Dea
et al. 2008). Overweight in Aboriginal adults (both men and women) is strongly
associated with an android or central fat distribution in the trunk and abdomen, rather
than on the thighs, hips and distal limbs (Gault et al. 1996; Rowley et al. 1997).
Heterogeneity in body size was evident between several remote Aboriginal
communities of the Northern Territory, where Aboriginal females across the
communities consistently had an elevated WHR across a range of body mass index
(Kondalsamy-Chennakesavan et al. 2008). It has also been demonstrated among
Aboriginal males and females of all adult age-groups (25-74 years old), compared
with an age-matched Caucasian comparator group in the AusDiab study, that the
adverse impacts of overweight and obesity are better indicated by a high WHR, than
a high body weight or BMI (Kondalsamy-Chennakesavan et al. 2008).
Hoy et al. (Hoy et al. 2006b) noted in other work that high waist circumference
(central obesity) in males and females, but not body mass index, was key to diabetes
and cardiovascular disease risk in remote Aboriginal people. Even among lean and
healthy Aboriginal people, a tendency to high fasting insulin concentrations has been
24
reported (O'Dea et al. 1990; O’Dea et al. 1988b). Improvements in insulin sensitivity
in response to acute and sustained positive lifestyle changes have been reported in
overweight Aboriginal adults. A recent study in overweight Aboriginal males
showed aerobic exercise acutely invoked an anti-inflammatory and insulin-
sensitising response (Mendham et al. 2012). Furthermore, weight-loss, in association
with improvements in the metabolic abnormalities related to diabetes were shown
following a 3 month lifestyle change among another group of adult Aboriginal
people (O'Dea et al. 1980).
Type 2 diabetes was first identified in the Torres Strait in the 1960’s and its
prevalence has since increased. Data from the late 1990’s showed Torres Strait
Islander people had almost 3 times the rate of obesity, 6 times the rate of type 2
diabetes, and a higher frequency of dyslipidaemia (high triglycerides and low HDL-
cholesterol concentrations) compared with age-matched Australians from the
AusDiab Study (Leonard et al. 2002). In this study, Torres Strait Islander people
exhibited very high rates of multiple cardiovascular risk factors. For example, 44.5%
of women and 49.8% of men had three or more risk factors, and only 6.5% of women
and 8.5% of men had no risk factors (Leonard et al. 2002).
In recent reports, young children in the Torres Strait were exhibiting clinical and
biochemical signs of insulin resistance (Valery et al. 2008). Seventy nine percent of
girls and 22% of boys had an enlarged waist circumference, and overall 46% of
children were overweight or obese by BMI criteria. The metabolic syndrome was
observed in 33% of children, some of whom were as young as 10 years old (Valery
et al. 2008). The finding of high rates of insulin resistance in addition to obesity in
girls and young women was highlighted as a serious concern for a self-perpetuating
cycle of obesity, gestational diabetes, large for gestational-age babies and
intergenerational metabolic illness in this community (Leonard et al. 2002; Valery et
al. 2008).
1.5.4. Dyslipidaemia
Cholesterol is an important essential lipid used in all cell membranes and in the
synthesis of steroid hormones and bile acids. It is carried in the blood in three major
25
lipoprotein classes, low-density lipoprotein (LDL-cholesterol, and Apo-B), high-
density lipoprotein (HDL-cholesterol, and Apo-A), and very low density lipoprotein
(VLDL), which is a triglyceride-rich particle and contains Apo-B100, Apo C and
Apo E. In many populations, cardiovascular disease risk is highly associated with
increased LDL-cholesterol, and inversely with HDL-cholesterol (Yusuf et al. 2004).
A low HDL-cholesterol level may also be a marker of other atherogenic factors.
LDL-cholesterol lowering remains a primary clinical focus in the prevention and
management of atherogenic risk (NCEP ATP III 2001).
The dyslipidaemia observed in the metabolic syndrome is characterised by increased
production of hepatic VLDL, small dense LDL-cholesterol, and a decrease in small
dense HDL-cholesterol (Cornier et al. 2008). In the presence of high fasting
triglycerides, small-dense LDL-cholesterol particles are found, even though the
LDL-cholesterol level may not be elevated.
Unlike European populations, the dominant lipid abnormality in Indigenous
Australians is elevated fasting triglycerides, and low HDL-cholesterol (Leonard et al.
2002; Maple-Brown et al. 2009; O'Neal et al. 2008; Shemesh et al. 2007; Wang et al.
2003). This pattern of dyslipidaemia is also observed in non-Indigenous Australians
with central obesity or diabetes (O'Neal et al. 2008) or chronic kidney disease (Chan
et al. 2009a).
Low concentration of HDL-cholesterol (≤1.0 mmol/L) is a consistent finding in
Aboriginal Australians and in Torres Strait Islander peoples of both genders (relative
to other Australians) (O'Neal et al. 2008). The atherogenic dyslipidaemia observed
in Aboriginal women (similar to Aboriginal men) may contribute to their higher
cardiovascular risk compared with non-Indigenous women (Hoy et al. 2006b; O'Dea
et al. 2008; Wang et al. 2003). It may not be appropriate to use gender-specific
thresholds in lipid abnormalities in Aboriginal Australians or in Torres Strait Islander
peoples, and further longitudinal investigation of cardiovascular disease risk
associated with low concentration of HDL-cholesterol among Indigenous women is
required.
26
1.5.5. Albuminuria
Albuminuria is a core component of the WHO definition of metabolic syndrome,
indicating vascular dys-regulation (Alberti et al. 1998). Several investigators
advocate for the inclusion of albuminuria in metabolic syndrome definitions used
within Indigenous Australian communities (Hoy et al. 1997; Hoy et al. 2003b;
Rowley et al. 2000). Albuminuria has been reported to be an early marker of future
severe renal disease, cardiovascular disease, all cause mortality and death from both
renal and cardiac disease in one remote Northern Territory community (Hoy et al.
1997; Hoy et al. 2003b). The risk associated with albuminuria in one Aboriginal
community occurred as both a dichotomous and continuous variable (Hoy et al.
2006b).
Albuminuria is observed among many Aboriginal communities throughout northern
Australia, including in people who do not have diabetes. Fifteen percent of
participants in a community health survey in Central Australia had isolated
microalbuminuria (defined as ACR <34 mg/mmol) without any other metabolic
syndrome features (Rowley et al. 2000). Higher degrees of albuminuria were
associated with higher blood pressure, overweight and central weight gain, hyper-
triglyceridaemia, insulin resistance, and higher age-adjusted prevalence of diabetes in
that study. Albuminuria was strongly related to the metabolic syndrome after
adjustment for concurrent microscopic haematuria among remote Central Australian
Aboriginal people of that study (Rowley et al. 2000). The clustering of features of
the metabolic syndrome (including albuminuria) across Australian Indigenous
communities is consistent with the widespread burden of diabetes, renal disease
(from diabetes and non-diabetes related conditions) and cardiovascular disease
(AIHW 2008).
1.5.6. Inflammation
Inflammation is not a key feature of the metabolic syndrome, but has been identified
among several key research priority areas for the syndrome (Alberti et al. 2006). C-
reactive protein (CRP) is produced by the liver in response to inflammation, infection
and injury. Chronically elevated levels of CRP are linked with increased risk of
cardiovascular disease in many populations (Ridker et al. 1998). Among Aboriginal
27
people, CRP levels (either high or low) have been shown to be stable even after
several years (Shemesh et al. 2009). C-reactive protein levels are associated with
adiposity in Aboriginal people living in remote and urban communities (Hodge et al.
2010; Maple-Brown et al. 2010a; Shemesh et al. 2007). For example in one remote
Aboriginal community, CRP levels were lower in very lean Aboriginal women than
very lean Aboriginal men, but rose much more steeply in Aboriginal women than
men as weight increased (Shemesh et al. 2007). The authors speculated that CRP
and gender may be differentially linked to cardiovascular disease in Aboriginal
people (Shemesh et al. 2007).
In another remote Aboriginal community (where high rates of kidney and
cardiovascular disease and infection coexist), several independent predictors of CRP
concentrations were reported: age, male gender, albuminuria, HDL-cholesterol,
diastolic blood pressure, and inflammation (or immune system stimulation)
(McDonald et al. 2004). Central adiposity was also associated with CRP
concentration in this community. The authors hypothesised that the multi-
determinant effects of CRP concentration were driven by high socioeconomic stress
manifest as poor housing quality, overcrowding, poor nutrition and unemployment in
this community (McDonald et al. 2004).
Inflammation was also related to endothelial dysfunction in a remote Aboriginal
community of Western Australia. Very high concentrations of e-selectin and CRP
were found in a community with high rates of chronic disease, insulin resistance and
the metabolic syndrome (Rowley et al. 2003). E-selectin is a serum marker of
endothelial dysfunction, and was positively correlated with CRP concentration in all
participants, and with central obesity and high blood pressure in women. High
concentrations of markers of inflammation and endothelial stress were associated
with low concentrations of antioxidants (Rowley et al. 2003). The authors
hypothesised that low concentrations of antioxidants may also reflect poor quality
diet, tobacco use, diabetes, central obesity and psychological stress (Rowley et al.
2003).
28
1.6. Body Build and Body Composition
Whilst obesity is a powerful risk factor for diabetes and related conditions in many
populations (Yusuf et al. 2004), there is a clear gap in knowledge with respect to 1)
identifying appropriate thresholds regarding body size and 2) understanding the
extent the extent of adverse health implications associated with overweight among
Indigenous Australian’s (WHO 1999). Some studies have also indicated differences
in body size between Aboriginal people and Torres Strait Islander people (Heitmann
et al. 1997), yet guidelines addressing health risk in relation to body size for
Indigenous Australians do not differentiate between these two groups. The accurate
measurement of body composition including total and regional adipose depots is
critical to better understanding the relationships of health and metabolic risk
associated with weight gain, for both Aboriginal people and Torres Strait Islander
people.
1.6.1. Body Composition Methods in Clinical Research
Body fat exists in numerous compartments in the human body. Because of the
complexity of fat depots, a technique that accurately measures total human body fat
does not exist (Ellis 2000; Wang et al. 1992). This section will describe several
terms used in body composition studies ‘reference tests of body composition’, the
‘five-level model of body-composition’, and the ‘compartment model of body
composition’. The complexity of the discussion of body composition tools
highlights that accurate assessment is the goal, but remains practically challenging in
large population studies.
Reference tests of body composition are the most accurate form of body composition
assessment, and have been performed in whole human cadavers, including direct
measurement of organs, and elemental studies. Since direct assessments on human
cadavers are not realistic for population studies, methods utilising parallel assessment
of a direct and indirect technique, which show both high correlation and agreement,
are highly desirable in order to support the use of indirect methods in larger
populations. Many have argued however, that body composition assumptions
validated in reference populations may be inaccurate in populations who are
29
sufficiently different on the basis of health, body build or ethnicity (Deurenberg et al.
2003; Deurenberg et al. 2002a; Gallagher et al. 1997; Heitmann et al. 1997).
Wang et al. (Wang et al. 1992) proposed a five-level model of body composition,
incorporating atomic (level 1), molecular (level 2), cellular (level 3), tissue-systems
(level 4), and whole-body (level 5). Level 1 is the most complex of the five levels,
and describes total body composition in its elemental form: oxygen alone accounts
for more than 60% of total body mass. Six elements (oxygen, carbon, hydrogen,
nitrogen, calcium and phosphorus) account for more than 98% of total body mass.
Total body weight is a function of fat mass and lean body mass (skeletal mass,
muscle mass and water) (Valentin 2002). The skeletal muscle system accounts for
40% body mass in mature adults, and up to three quarters of skeletal muscle mass is
found in the limbs (total appendicular skeletal muscle) (Valentin 2002). Age, gender
and ethnicity were significant independent determinants of total appendicular skeletal
muscle in a study of healthy adult African American people and Caucasian people
(Gallagher et al. 1997). Bone can be described by any of the 5 levels proposed by
Wang et al. (Wang et al. 1992): by tissue-systems (level 4), as extracellular solid
(level 3- cellular), measured as mineral (level 2) and at the most complex level, as
total body calcium and phosphorus (level 1). Likewise the determination of skeletal
muscle can be approached from different levels: total body water (level 2) and
electrolyte counting (level 1) can reliably predict lean body mass (Valentin 2002);
total body nitrogen counting may determine protein (level 2) and therefore the
muscular component (level 4) of lean-body mass. Hence the combinations of multi-
compartment assessments that incorporate different levels of the five-level model
present a picture of fat and lean-mass in the individual. Since there are different
components and levels, there are many combinations of modalities that may be used
to describe human body composition.
Clinicians require reliable and accurate body composition information for their high-
risk patients. Tools that can be applied to larger populations are valuable for public
health interventions. At the group and individual levels, these tools need to
accurately detect changes in body composition in response to interventions. A
30
variety of techniques have been used in body composition studies in various
populations in the literature.
1.6.1.1. Anthropometry
Anthropometry describes indirect measures of body composition derived using
height, weight and body circumferences. Body mass index (BMI) refers to the ratio
of weight/height2 (units are kg/m2). It was first described as the Quetelet Index (in
1832), and had a change in terminology to BMI in 1972. In prospective longitudinal
studies of both men and women of a Caucasian background, the body mass index
was shown to have a J-shape relationship with mortality and cardiovascular disease,
even after controlling for smoking status. The healthy range of BMI was identified
from prospective longitudinal data for mortality risk, where the lowest risk in life-
long non-smoking adult males and females occurred at BMI 24.3 kg/m2 and 23.9
kg/m2 respectively (Pischon et al. 2008).
BMI is simple to perform, and requires minimal intrusion to the individual. There
are a number of assumptions when comparing BMI between individuals: it assumes
increasing weight in overweight adults is due to gains in fat mass; it assumes
similarities in relative body proportions (trunk-length and leg-length) between
individuals and populations; it is a measure of total, and not regional body fat; it does
not allow for changes in body weight due to changes in lean mass due to exercise,
body building, sarcopenia or cachexia due to illness or aging.
Measurement of the waist and hip circumference, and their ratio are more recent
tools of body size, and indicate abdominal obesity. Weight gain occurring by
expansion of adipose tissue may deposit generally over the body, detected as both an
expanded hip and waist circumference or centrally (at the waist). The pattern of
weight gain in both individuals and populations may be variable, and are related to
different health risk. Waist circumference is an indirect measure of both
subcutaneous and intra-abdominal fat over the abdomen. There are several
techniques of measurement of the waist circumference: at the level of the umbilicus;
the position of minimum or maximum diameter over the abdomen; at the level of the
iliac crest; or mid-way between the inferior costal margin and iliac crest (in the mid-
31
axillary line) (Callaway et al. 1988). The umbilicus may be more inferiorly
displaced on an obese abdomen, in comparison to a lean abdomen. As long as bony
landmarks can be palpated, mid-way between the costal margin and iliac crest is a
satisfactory and reproducible measurement site for cross-sectional and longitudinal
assessments (Alberti et al. 2006).
The hip circumference can also be measured by several techniques: at the widest
circumference over the buttocks; at the level of the greater trochanter; or the site of
maximal projection of the buttocks. Hip circumference incorporates both gluteal
subcutaneous and gluteal lean mass (Seidell et al. 2001; Snijder et al. 2004a). Hip
circumference is affected by the breadth of the pelvis (and therefore reflects body
build) (Seidell et al. 2001), which may differ between populations (Katzmarzyk et al.
1999). The waist to hip ratio (WHR) is determined by waist circumference divided
by hip circumference.
Many of the anthropometric variables (waist circumference, hip circumference, waist
to hip ratio and body mass index) were shown to be highly correlated with more
direct measures of total fat and lean mass (estimated with underwater weighing and
computed tomography of the abdomen) among middle aged Canadians of European
background (Seidell et al. 2001). Waist circumference was strongly associated with
trunk fat mass measured by whole body DXA in both males and females (Snijder et
al. 2004a). In addition, in both male and female Caucasian adults, those with higher
trunk fat mass had higher fasting glucose, and homeostasis model assessment
(HOMA) score (Snijder et al. 2004a). Larger waist and smaller hip circumferences
were shown to be independently associated with low HDL-cholesterol, high
triglycerides and insulin levels, however these relationships were confounded by
assessment of the waist to hip ratio (Seidell et al. 1987). Higher hip girth has been
related to a more favourable insulin sensitivity profile in men and women. However
it was suggested this may be mediated by different mechanisms in men and women:
a higher proportion of lean mass over the hips in Caucasian males, but a higher
proportion of subcutaneous fat over the hips in females (Snijder et al. 2004a).
Compared to a body mass index alone, a combination of total and central obesity was
shown to provide improved risk prediction in healthy adult males in prospective
32
longitudinal studies. Both BMI and central adiposity (measured as waist
circumference divided by the width of the hips) were independently associated with
the future development of diabetes in healthy men who were followed up for 18
years (Cassano et al. 1992). The lowest risk of diabetes was found in men with
lowest BMI and lowest tertile of central adiposity (Cassano et al. 1992). These
studies show that differences in body composition are inherently related to health
risk, either in the form of differences in fat and lean mass over the gluteal region
(shown by Snijder et al. (Snijder et al. 2004b) above) or preferential abdominal
obesity, even in the presence of low BMI (shown by Cassano et al. (Cassano et al.
1992) above), and probably explains why WHR was a superior indicator of
cardiovascular disease risk than body mass index or waist circumference in
ethnically diverse (or heterogeneous) populations (Yusuf et al. 2004). Appropriate
thresholds of body mass index, central obesity or the waist circumference may vary
between populations, and remains a research priority in non-Caucasian populations
(WHO 2000; Alberti et al. 2006).
1.6.1.2. Skin Fold Thickness
Skin-fold thickness (SFT) is the thickness of a double fold of skin and subcutaneous
fat, designed for assessment of body fat in lean individuals, and part of an assessment
of malnutrition. Sum of skin-fold thicknesses have been compared against
underwater weighing methods to indirectly estimate body fat percent (Durnin et al.
1974). From that work, reference tables of body fat percent determined from sum of
4 skin-fold thicknesses were developed (Durnin et al. 1974). The assessment is
simple to perform by a trained operator, is non-invasive, and when a minimum of 4
sites is measured (including central and peripheral sites), reflects subcutaneous fat
mass in the body (Harrison et al. 1988). However, subcutaneous fat mass is affected
by hydration, age (loss of subcutaneous fat with age), and may also vary in different
ethnic populations (Harrison et al. 1988). Compression of the SFT site is affected by
the size of the fold, and thicker skin-folds (obesity) are associated with more
difficulty with reproducibility of the measure.
33
1.6.1.3. Hydrodensitometry
Underwater weighing, or hydodensitometry was one of the early body composition
tools developed in the 1940’s and regarded for many years as a gold standard
methodology in many laboratories (Ellis 2001). From a known body weight, body
density and therefore fat percent may be derived. The specific methodology is
complex to perform for both operator and participant, and the instruments need
careful maintenance, so is regarded as a useful tool in the laboratory, but limited in
field or clinical use (Ellis 2001). Abate et al. (Abate et al. 1995) described their
methodology of hydrodensitometery: the client wears a light weight swimsuit and
bathing cap; the client is then submerged up to the chin in a seated position and given
3000ml of gas (oxygen-helium-nitrogen) to rebreath, and then is fully submerged in
the water; the total volume of displacement is measured to the nearest 50 ml; the
exhaled gas is analysed with mass spectrometry to measure the helium concentration;
an equation is used to determine the total gas volume; total body volume minus total
gas volume provides body density, and therefore body fat percent (Abate et al. 1995).
Hughes et al. (Hughes et al. 2004) required participants to have an overnight fast
before the procedure, and performed 5-10 consecutive trials to determine body
density. Individual variations in fat free mass occur in the presence of physical
activity, gender, age, ethnicity, sexual maturity and human growth, yet these
variations are not accounted for in formulae calculating fat free mass, which assume
a constant density of skeletal muscle and bone mineral content (Ellis 2000).
Underwater weighing has been used to evaluate body composition of the elderly
(Hughes et al. 2004), and in field settings in indigenous populations (Swinburn et al.
1991). It has also been an adjunct tool of body composition along side skin-fold
thicknesses and magnetic resonance imaging (Abate et al. 1995).
1.6.1.4. Body Fat Percent and Bioelectrical Impedance Analysis
Using whole body DXA and a 4-compartment model of body composition,
differences in body fat percent were shown between healthy adults from different
ethnic groups (Gallagher et al. 2000). As an indicator of healthy body fat percent
range, among adult Caucasian men and women aged 20-39 years, those with a
“healthy BMI range, 18.5 to <25 kg/m2” had 9-20% and 21-32% body fat
respectively (Gallagher et al. 2000). By comparison, Japanese participants had
34
higher percent body fat at any BMI than Caucasian and African American
participants, and older participants had higher percent fat than younger participants
(Gallagher et al. 2000).
Bioelectrical impedance analysis (BIA) is another indirect method of body
composition, and an attractive tool for use in clinical and epidemiological studies
(Lukaski et al. 1986). Using BIA, body composition is described by impedance (z),
resistance (R) and reactance (Xc) of a conducting current of known frequency
through tissue of a known length and uniform cross-sectional area. Resistance (R) is
a good predictor of impedance, and impedance has a strong inverse relation with
total body water (TBW) (Lukaski et al. 1986), from which fat-free mass (FFM) may
be estimated. Fat free mass has a higher conductance of electrical current than fat
mass. Conductance is affected by body fluids and electrolytes, and resistivity. Fat
free mass was best predicted in both men and women aged 18-50 years by body
height and bioelectrical resistance indicated by the equation height2/resistance
(Ht2/R) (Lukaski et al. 1986). The equation was validated in healthy adults using
hydro-densitometry (underwater weighing) and sum of 4 skin fold thickness
(Lukaski et al. 1986). Ht2/R has been reported as an index of fat free mass in one
study of Aboriginal adults (Piers et al. 2003).
Different measurement methods of BIA are described, which include upright and
supine posture. In the supine posture, two electrodes placed on the dorsal surface of
the hand, with minimum 5 cm separation, and two on the dorsum of the foot (a tetra-
polar electrode arrangement). The two distal (or drive) electrodes of each limb
impart a constant alternating current between 300-800 uA. The two proximal
(measuring) electrodes of each limb measure the voltage-drop that occurs due to
tissue resistance to current flow (Lukaski et al. 1986).
Single-frequency, multi-frequency bioelectrical impedance analysis (MF-BIA), and
multi-frequency bioelectrical impedance spectroscopy (BIS) are available. At a
single high frequency (50 kHz) only total body water (TBW) is measured. At a
single low frequency (1 kHz) only extracellular fluid (ECF) is calculated. When
MF-BIA is used (traditionally performed using 1 kHz and 50 kHz frequencies), then
both ECF and ICF can be determined simultaneously. It is suggested that MF-BIA
35
may have greater clinical utility in circumstances of abnormal hydration such as liver
and kidney disease (Thomas et al. 1992). Multi-frequency bioelectrical impedance
spectroscopy uses more than one hundred frequencies in order to extrapolate outside
the range to obtain resistance at extreme frequencies (approaching zero and infinity)
(Thomas et al. 1992).
The use of bioelectrical impedance, its accuracy and reproducibility within an
individual and comparing across populations requires care to the applied current and
frequency used, proper and consistent electrode measurement sites and positioning,
and consideration of the individual (or groups) body build and co-morbid illness.
Prediction equations of body composition are generated from comparison against
reference methods. Caution should be exercised when applying prediction equations
based on BIA to another population with differing characteristics to the validated
study population, since this may result in bias (Deurenberg et al. 2003).
Characteristics which increase bias include gender and age, co-morbid illnesses and
body build differences which may be a function of ethnicity. Comparing impedance
measures between individuals will also rely on the adequacy of measurement
techniques in the reference population, the rigor of the applied impedance equation,
and the precision and accuracy of impedance instruments used. Despite these
limitations, BIA has been used in large epidemiological studies because it is non-
invasive, safe, and inexpensive and requires a protocol but not a highly skilled
operator (Heitmann et al. 1997).
1.6.1.5. Whole Body Dual Energy X-ray Absorptiometry (DXA)
Dual-energy x-ray absorptiometry describes the differential attenuation of a photon
or radiation source at two energy levels in tissue. DXA was first developed to
measure bone mineral density where it partitioned bone (as calcium hydroxyapatite)
from soft tissue, and later developed for assessment of total body composition.
Phantoms with known fat and lean content are used to generate calibrating equations,
used in the software to predict percentage of fat (or lean tissue). The use of whole
body DXA in clinical studies of body composition has been a valuable advance on
anthropometry, and more accurately identifies total fat mass, and lean mass, and
body fat distribution. Body composition assessed by DXA has strong positive linear
36
correlations with reference tests of body composition (Scholler et al. 2005). Others
have also supported the use of both computed tomography of the abdomen with
DXA measured trunk soft tissue to better predict intra-abdominal fat burden, and
metabolic risk (Carey et al. 1996; Jensen et al. 1995).
Whole body DXA is safe, with a scan dose equivalent to less than 2 hours (or
<0.0001 dose) of annual background radiation exposure (Heymsfield et al 1990).
Whole body DXA provides a non-invasive and rapid assessment of body
composition. Several problems with the use of whole body DXA are described, and
depend on reproducible and consistent positioning of the body (Brownbill et al.
2005; Hansen et al. 1999), accuracy with measurement of extreme obesity
(Brownbill et al. 2005), DXA software (Hansen et al. 1999), accuracy of
measurement between different commercial brands (Scholler et al. 2005), and
availability of scanners since they are large, and often operated by radiology
departments within hospitals or large research institutions. However, because of its
ease of use to both the individual and researcher, whole body DXA has been
described as a core reference test of body composition (Gallagher et al. 2000).
1.6.1.6. Computed Tomography
Abdominal imaging provides additional information (beyond a waist circumference)
about abdominal fat partitioning (subcutaneous and visceral fat), and has enabled
further study of cardio-metabolic risk associated with central obesity (Carey et al.
1996; Demerath et al. 2008; Greenfield et al. 2002; Seidell et al. 1987; Smith et al.
2001). Abdominal fat volume and cross-sectional area using computed tomography
(CT) and magnetic resonance imaging (MRI) are also described (Abate et al. 1995).
Precise measurement and comparison of abdominal anatomy, including subcutaneous
abdominal fat, and compartments of intra-abdominal fat are made possible with this
imaging. Abdominal subcutaneous adipose tissue (SAT) is located anterior to the
rectus abdominus muscle and identified as superficial subcutaneous abdominal fat
(SSAT) and deep subcutaneous abdominal fat (DSAT), separated by a fascial plane
(fascia superficialis) (Smith et al. 2001). The deep subcutaneous adipose tissue is
continuous anteriorly and posteriorly, and identified near the inferior ribs and as
37
distally as the proximal thighs (Smith et al. 2001). The term intra-abdominal fat
(IAF) is used interchangeably with visceral adipose tissues (VAT). IAF is
anatomically identified as fat inferior to the margins of the rectus abdominis muscle,
extending laterally around the peritoneum, quadratus lumborum and long back
muscles (Demerath et al. 2008; Smith et al. 2001).
Abdominal fat is identified by its density, the Hounsfield unit (HU), between -50 to -
150 HU (Jensen et al. 1995), using specialised software (Slice-O-Matic) or inbuilt
software summating designated Hounsfield units. Abdominal magnetic resonance
imaging provides an opportunity to measure volume without a radiation dose. It may
not always be practical, accessible or safe to perform sequential scans of the
abdomen with computed tomography, particularly with high exposure to ionising
radiation, especially with recurrent scans in intervention or longitudinal studies.
However, the use of MRI for clinical research has been limited by expense and
access to machines.
Intra-abdominal fat distribution was reported among healthy adult Caucasian
participants using sequential MRI scans between the thoracic and sacral vertebrae
(T9 to S1) (Demerath et al. 2008). From this technique, peak intra-abdominal fat
area was shown to be more consistently observed higher in the abdomen (toward the
head, relative to L4-L5 inter-vertebral space) in both men and women (Demerath et
al. 2008). Caucasian males and females deposit intra-abdominal fat differently. At
the level of L1-L3, males had more intra-abdominal fat than females (Grauer et al.
1984). Others have supported the level of L4 to predict intra-abdominal fat burden
(Seidell et al. 1987; Smith et al. 2001). Abdominal fat partitioning (of intra-
abdominal and subcutaneous fat) also differs between healthy males and females, of
presumably Caucasian background: males had more intra-abdominal and less
subcutaneous fat than women over a wide range of adiposity at L1, L3 and L5
vertebral levels (Grauer et al. 1984).
Despite others using one inter-vertebral level to indicate abdominal fat partitioning,
in a study by Greenfield et al. (Greenfield et al. 2002) in premenopausal women
(who had a mean BMI 24.9 kg/m2), significant intra-subject variability in visceral fat
area was shown over 4 vertebral levels. In that study, the authors suggested that a
38
single CT slice (at any vertebral level) to predict intra-abdominal fat volume has
clinical limitations, but was improved by using 2 levels. However, a further
technique was proposed where a single CT slice assessing the ratio of visceral fat to
total abdominal fat, in conjunction with a DXA central abdominal fat assessment,
successfully predicted intra-abdominal fat burden, whilst also limiting the radiation
exposure to the individual (Carey et al. 1996; Greenfield et al. 2002; Jensen et al.
1995). Hence combined modalities of cross-sectional CT with abdominal-region
DXA could enhance the assessment of body composition whilst minimising radiation
exposure to the participant.
1.6.2. Body Size, Alcohol and Cigarette Smoking
Many studies report high rates of smoking among Indigenous Australians, and
alcohol abuse among some but not all Indigenous Australians (AIHW 2008; Vos et
al. 2009). Alcohol and tobacco use (in addition to physical activity and diet choices)
are an important consideration for body composition and obesity (Komiya et al.
2006). Smoking cessation has been linked with weight gain via a combination of
lower resting metabolic rate, and higher food consumption (Moffatt et al. 1991).
Among adult males, those who currently smoked cigarettes had higher abdominal fat
burden than those who were non-smokers (Komiya et al. 2006). Adults with
alcoholism are at higher risk of low bone mineral density and osteoporosis. Alcohol
related muscle disorders are described, however these have generally been explained
by concurrent morbidity (including chronic liver disease). Alcohol is not stored by
the body, and has preferential metabolism. The chronic consumption of high
quantities of alcohol is associated with suppressed lipid oxidation in the liver and
skeletal muscle (Suter et al. 1997). Over time this presents an excess fat burden in
the body. Over five years, chronic high alcohol consumption (at least 30 grams per
day) in adult males was associated with a higher risk of obesity, compared with
males who drank fewer units of alcohol (Wannamethee et al. 2003). When matched
for age, body weight and body mass index, males with chronic alcohol abuse (but
who did not have chronic liver disease) had a higher waist to hip ratio, lower percent
body fat, and higher percent lean mass than age and BMI matched healthy males
(Addolorato et al. 2000). The higher percent lean mass was explained by use of the
DXA modality, measuring higher body water (extracellular fluid) rather than skeletal
39
muscle mass. However in this study, physical activity was a much stronger factor
related to body fat, than alcohol (Addolorato et al. 2000).
1.6.3. Relationship of Body Shape and Composition with Gender, Aging, Health and Chronic Kidney Disease
Among people of European background, healthy men have more bone mass and
skeletal muscle than women (Heymsfield et al. 1990), and more intra-abdominal fat,
and less abdominal subcutaneous fat than women (Grauer et al. 1984). Women have
more fat mass (Heymsfield et al. 1990; Valentin 2002), including more subcutaneous
fat than men (Seidell et al. 1987). As stated earlier, healthy Caucasian men and
women aged less than 35 years with a body mass index between 18.5 to <25 kg/m2,
were reported to have between 9-20% and 21-32% body fat respectively (Gallagher
et al. 2000).
Controlling for BMI, older age was associated with higher body fat percent, though
this rate of change was also affected by gender, ethnicity and individual differences
(Gallagher et al. 2000). Older age was associated with lower skeletal muscle mass in
a study of Caucasian women aged 51-84 years old (Hansen et al. 1999). Aging was
associated with higher visceral fat mass and a higher ratio of visceral fat to
subcutaneous fat mass in both genders, and particularly after the menopause in
women (Cartier et al. 2009; Seidell et al. 1987).
The metabolic profile of an individual may better indicate the pattern of abdominal
fat partitioning in adults that otherwise appear equally obese by indirect body
measures. In overweight postmenopausal women (of European background), a
combination of large waist circumference and high visceral fat area was associated
with metabolic abnormalities (Messier et al. 2010). Also, metabolically healthy
obese postmenopausal women had higher subcutaneous fat than females with a
metabolically unhealthy profile even if both groups had similar visceral fat area
(Messier et al. 2010). Among Caucasian males and females, compared with those
with normal glucose tolerance, those with impaired glucose tolerance were older, and
had a higher BMI, waist circumference and body fat percent (Snijder et al. 2004b).
In a comparison of non-diabetic and otherwise healthy adult Caucasian males, Abate
40
et al. (Abate et al. 1995) showed obesity (defined by a mean BMI of 37 kg/m2) was
associated with higher absolute mass in all abdominal compartments (subcutaneous
abdominal fat, intra-peritoneal and retroperitoneal) compared with lean males (BMI
23 kg/m2). In another study involving young adult non-Caucasian males, obesity
was associated with higher levels of inflammatory markers (CRP, interleukin-6,
fibrinogen and plasminogen activator inhibitor 1) (Mauras et al. 2010). The studies
do not implicitly allow comparison -however indicate that variable patterns of total
and abdominal (subcutaneous and visceral) obesity impact on metabolic and
inflammatory risk across levels of health and may vary between ethnic groups.
As noted above, skeletal muscle accounts for 40% body mass in mature adults, and
up to three quarters of skeletal mass is found in the limbs (total appendicular skeletal
muscle) (Valentin 2002). Skeletal muscle and bone mineral mass have been shown
to diminish with age and chronic disease. By early adulthood, lean body mass
(which includes skeletal muscle, connective tissue, organs and skeleton) comprises
80% and 70% of body mass in males and females respectively, which falls to 72%
and 58% in elderly males and females (Valentin 2002). Age, gender and ethnicity
were shown to be significant independent determinants of total appendicular skeletal
muscle in a study of healthy adult African American and Caucasian people
(Gallagher et al. 1997).
He et al. (He et al. 2003) demonstrated that total body potassium (TBK, an indicator
of lean body mass) peaked at 30 years of age in healthy adults of varying ethnicity
(Asian, African American, Hispanic and Caucasian). They also showed males had
more TBK than women; and whilst a linear loss of TBK occurred in healthy aging,
different slopes were observed in each ethnic group. Similar relationships of aging
and skeletal muscle are observed by others (Gallagher et al. 1997; Hansen et al.
1999).
1.6.3.1. Kidney Disease
Whole body muscle mass has also been indicated by the study of serum creatinine,
which is used as an indirect biomarker of kidney function (Levey et al. 1999; Taylor
et al. 2006). Creatinine is a myocyte-derived end-product of metabolism, however,
41
creatinine is difficult to use in predicting muscle mass because of the prolonged
length of time required to collect urine samples (Taylor et al. 2006), and determining
the origin of creatinine from either dietary or metabolic origins (Hsu et al. 2008).
Using serial whole body DXA scans, Fried et al. (Fried et al. 2007) investigated the
relationship of change in lean muscle mass over time in an independently-mobile
elderly populations who had a mean eGFR of 72.8 ml/min/1.73m2 (by the
modification of diet in renal disease study, 4 variable prediction equation of
estimated glomerular filtration rate, MDRD4 formula) (Levey et al. 1999). They
showed African American males had the highest skeletal mass (compared with
African American females, and Caucasian males and females), but African American
males also had the highest loss of skeletal muscle over the follow-up period. These
results highlight that whilst serum creatinine is a major indirect determinant of
estimated GFR, studies are lacking describing the relationship of serum creatinine
with lean body mass (and therefore indirect kidney function measures) over time in
aging individuals across different ethnic populations.
1.6.4. Body Composition Differences between Ethnic Populations
Differences in body composition (including the relationship of body fat percent with
body mass index) have been reported between ethnic groups (Craig et al. 2003;
Gallagher et al. 2000; He et al. 2003; Heitmann et al. 1997). This may reflect long
term environmental and climatic adaptations among indigenous peoples (Roberts
1953). Variability of body composition within ethnic groups (such as Asians) has
been reported (Gurrici et al. 1999). Gallagher et al. (Gallagher et al. 2000) reported
different body fat percent levels between different ethnic groups (Caucasian, African
American, and Japanese), when matched for body mass index. High body fat percent
at lower body mass index was partly explained by body build (trunk to leg-length
ratios, slenderness, and muscularity), and activity levels (Deurenberg et al 2002a).
Lean Australian Aboriginal people living in Northern Australia had very low body
weight for size, a feature consistent with South East Asian and African peoples
(Roberts 1953). The low weight relative to size of Aboriginal people and increased
surface area over a compact trunk allowed a greater surface area for heat exchange
42
and efficient cooling (Roberts 1953). Health in Aboriginal adults was associated
with low body mass index (Daniel et al. 1999; O’Dea et al. 1988b). Norgan (Norgan
1994) reported the lower BMI expected for a given height in Aboriginal males
(relative to European population) was due to relatively longer leg-length for a given
height.
1.6.4.1. Stature and Skeletal Proportions
As noted earlier, Lukaski et al. (Lukaski et al. 1986) reported body height and
resistance (measured by bioelectrical impedance analysis) accurately predicted fat
free mass in humans. Deurenberg et al. (Deurenberg et al. 2003) reported ethnic
differences in relative leg-length and frame size between populations impacted on
both expected body mass index and body fat percent. Without taking account of
these observed stature differences, shorter limbs relative to overall height and a
slender versus a stocky frame are reported to affect the accuracy of predicted fat
percent and fat mass determined by bioelectrical impedance analysis (Gurrici et al.
1999). Using detailed body composition methods, muscle mass (determined by total
body water and DXA), was shown to be highly correlated with the breadth of joints
(assessed by sliding anthropometer), and also shown to be highly correlated with
bone mineral content (using DXA) in Caucasians (Snijder et al. 1999). They also
showed that participants with a slender frame had less lean mass, which may have
occurred because of less bone mineral content, skeletal muscle, connective tissue or
cartilage (Snijder et al. 1999).
Katzmarzyk et al. (Katzmarzyk et al. 1999) reported differences in skeletal
dimensions and physique within Canadians of First Nation and European
background. The First Nation women in this study were heavier, had a higher BMI
than European women, and wider skeletal dimensions (bi-acromial, bi-epicondylar,
bi-condylar and bi-cristale breadths) (Katzmarzyk et al. 1999). First Nation men
however had only a trend to wider skeletal breadths (bi-epicondylar and bi-cristale
breadths) than Caucasian men (Katzmarzyk et al. 1999). The reported physique of
Australian Aboriginal people appears to be quite different compared with First
Nation Canadians, although no direct comparisons have been made. Australian
Aboriginal people are reported to have a linear body build, with narrow pelvis and
43
shoulder breadths and compact trunk (Roberts 1953), and retain slimness of physique
in the lower extremities in overweight (O'Dea et al. 1993; O’Dea et al. 1988b;
Roberts 1953). By comparison First Nation Canadian adults have a comparable or
wider skeletal breadths than Europeans (Katzmarzyk et al 1999).
Stature (or body height) is modified at key growth periods in antenatal and early
childhood, but are also impacted by socioeconomic stress. Precise measures of
skeletal proportions, and growth of skeletal dimensions have been reported in a
Caucasian paediatric population using whole body DXA (Abrahamyan et al. 2008).
A constant ratio of long-bone length to stature was found in healthy children across
the age range of 6-18 years old (Abrahamyan et al. 2008). Retrospective studies in
Caucasians growing up during World War II suggests restricted growth results in
shorter limb length thereby preserving growth of vital organs (trunk-length) (Davey
Smith et al. 2001; Lawlor et al. 2002). In adult life, shorter relative limb length was
associated with the development of adult onset diabetes and cardiovascular disease
(Davey Smith et al. 2001; Lawlor et al. 2002). Aboriginal people are reported to
have a longer distal limb segment (shin), which accounted for the longer relative leg-
length for overall height (Abbie 1969). Aboriginal babies born small for gestational
age are reported to remain small (by height and weight) in adulthood, though
differences in body proportions were not reported (Hoy et al. 2010b).
1.6.4.2. Bioelectrical Impedance Analaysis and Ethnicity Differences in
Populations
Most data about bioelectrical impedance analysis are reported among young, healthy
Caucasian populations. Factors that contribute to population specificity of
bioelectrical impedance prediction equations of body composition include: age,
gender, the body build, and distribution of body water (extracellular versus total
body water). Ethnicity may impact mostly in the area of body build with respect to
height, limb length, and skeletal build (Deurenberg et al. 2002b; Gurrici et al. 1999).
As noted above, electrical impedance is related to the length of the tissue under
study. In a height adjusted analysis, Caucasian participants with shorter limbs had
overall lower body impedance, which predicted higher fat free mass (and lower body
fat percent), regardless of adiposity (Snijder et al. 1999). Differences in predicted
44
body composition using BIA are reported between ethnic groups: of Malay, Indian
and Chinese people, Indians had the longest limbs, and Chinese the shortest limbs,
whilst Malay participants had the most slender body build of the 3 groups
(Deurenberg et al. 2002b). The difference in predicted body water (a surrogate of
lean mass) from BIA, and measured using body water from deuterium dilution was
explained by the differences in relative limb length (Deurenberg et al. 2002b). They
also showed BIA in a slender framed person compared with a stocky frame (at the
same height) predicts a higher body fat percent (Deurenberg et al. 2002b), consistent
with findings in Caucasian people that were discussed above (Snijder et al. 1999).
Deurenberg et al. (Deurenberg et al. 2002a) advocate that correction for differences
in body build improves the differences in bias in predicted body composition
amongst ethnic groups.
1.6.4.3. Ethnic Differences in Body Fat and Body Fat Distribution
At the same body mass index, Japanese adults have a higher body fat percentage than
African American and European adults (Gallagher et al. 2000). At a similar age and
height, adult Tongan people (in comparison to Caucasian people) have higher body
mass index, but similar body fat percent and abdominal fat percent, which was
explained by a more muscular physique (having also more total and abdominal lean
mass) (Craig et al. 2003). There are several reports where the physique of females
(skeletal proportions and measures of obesity) differs more across populations than
the physique of males (Katzmarzyk et al. 1998, 1999; Piers et al. 2003; Wang et al.
2003). This is also observed in Tongan females, compared with Caucasian females
(Craig et al. 2003). Despite similar age and height, Tongan females had a higher
body mass index than Caucasian females (34.3 kg/m2 v 26.2 kg/m2). With higher
BMI Caucasian women had higher total and abdominal fat mass and higher body fat
percent. In contrast, despite approximately 8 units higher BMI in Tongan females,
this corresponded to only of 3.2% higher total body fat percent, and only 5.7% higher
abdominal fat percent, which suggests a different pattern of body composition
between the two groups of females.
Ethnic differences in abdominal fat partitioning among young adults with obesity
have been reported (African American v Hispanics) (Lê et al. 2011; Liska et al.
45
2007). Furthermore, in the assessment of diabetes-risk in young adults with obesity,
the predominant pattern of visceral fat (compared with subcutaneous fat) was most
strongly related to the expression of inflammatory markers (Lê et al. 2011).
As noted earlier, the Interheart study reported a high waist: hip ratio was associated
with increased risk of myocardial infarction in a multiethnic cohort (Yusuf et al.
2004). This is consistent with Snijder et al. (Snijder et al. 2004b) who reported a
higher hip circumference was associated with a more favourable metabolic profile in
a multiethnic population, including Nauruan’s, Papuan New Guineans, Indians, and
indigenous people from the Island of Rodrigues in the Indian Ocean. This
relationship has several possible explanations. A higher hip circumference might
represent improved insulin sensitivity offered by higher lean mass (Yki-Jarvinen, et
al. 1985). Second, it may represent a higher gluteal subcutaneous fat mass in people
with a higher hip girth (which is an effective storage of lipid), thereby associated
with lower production of very low density lipoproteins which is associated with
visceral fat in overweight. Finally, the authors suggest in the presence of higher hip
girth, that waist circumference (a combination of both visceral and subcutaneous fat)
might have proportionately higher subcutaneous fat than intra-abdominal fat (Snijder
et al. 2004b).
1.6.5. Body Composition in Indigenous Australians
This thesis focuses on investigating the relationship of obesity with chronic disease
risk markers in Aboriginal and Torres Strait Islander Australians. A wide variety of
tools of body composition have been used to describe the Aboriginal people
including early anthropological studies (Roberts 1953). The majority of studies of
Indigenous Australians have described the level 5 model of body composition
proposed by Wang et al. (Wang et al. 1992) using skin-folds, body circumferences
and weight. Fewer studies describe body composition using bioelectrical impedance
analysis, one study used whole body DXA to describe metabolic and inflammatory
response to exercise within Aboriginal males (Mendham et al. 2012), and only one
group has described a small, very detailed study using whole body DXA, and total
body water and nitrogen counting comparing Aboriginal females and Caucasian
females (Raja et al. 2003).
46
Many investigators of Indigenous health who have used indirect models of body
composition such as skin-folds and bioelectrical impedance acknowledge the need
for further validation with more sophisticated body composition tools (Piers et al.
2003; Rutishauser et al. 1986). Whilst many reports shed light on the relationships
of overweight (using body mass index, skin-fold thicknesses and waist
circumference), there has been a paucity of body composition studies utilising
sophisticated methods of body composition techniques involving large numbers of
Aboriginal people and Torres Strait Islander people. However, through the use of
indirect methods of body composition, several distinctive body size and composition
features are known with respect to Aboriginal people, including their uniqueness
compared with Torres Strait Islander and Caucasian groups.
Roberts (Roberts 1953) reported that lean Australian Aboriginal people (both males
and females) have some of the lowest weight, adjusted for stature and climate-region
of ten indigenous international populations. Lean Australian Aboriginal adults were
also reported to have a longer relative leg-length for overall height and narrowness of
the skeleton (through the shoulders, and hips) which conferred a higher body surface
area (Abbie 1976; Norgan et al. 1995; Roberts 1953). It was suggested the higher
trunk surface area of Australian Aboriginal peoples allowed for more efficient heat
exchange in tropical north Australia (Roberts 1953). Compared with Caucasian
populations, lean Aboriginal people were observed to have healthy levels of body fat
(measured by skin-fold thicknesses), but at much lower BMI than expected in
European populations (Norgan 1994). This suggests an excellent capacity to store
lipid within subcutaneous fat depots at low body mass index. This is consistent with
a higher sum of skin-fold thickness measures at four sites in Aboriginal females at
the same BMI than observed in European females in other studies (Piers et al. 2003;
Rutishauser et al. 1986). Notably, a higher sum of four skin-fold thicknesses was
due to higher trunk skin-folds in Aboriginal females than Caucasian females (Piers et
al. 2003). Among healthy adult Aboriginal people (aged 25-35 years old), despite
Aboriginal females having similar BMI, and Aboriginal males lower BMI than
respective sex Caucasians, Aboriginal people consistently had a higher waist to hip
ratio (Piers et al. 2003). This was also observed with older age among Aboriginal
females, where older age was associated with higher body mass index and skin-fold
47
thickness, but with a truncal rather than general distribution of body fat
(Kondalsamy-Chennakesavan et al. 2008; Rutishauser et al. 1986).
There is less published information about body size and composition measures
among Torres Strait Islander people. Differences in body size and composition may
be explained by differences in ethnic origins of Torres Strait Islander people (who
are Melanesian). As described above, resistance is an indirect indicator of lean body
mass (Lukaski et al. 1986). Aboriginal males and females have lower lean mass
(estimated by bioelectrical impedance measures) than Caucasians after controlling
for height (Piers et al. 2003). Whilst the relationship of weight and resistance
(measured by bioelectrical impedance) was similar between Torres Strait Islander
people, Caucasians and Samoans, Aboriginal people were shown to have a very
different relationship of weight with resistance (Heitmann et al. 1997). It was
suggested these differences occurred because of differences in skeletal proportions
and linearity of body build (which were not measured in that study) and ultimately
reflected that components of weight (fat and lean mass) were different between
Aboriginal people and Torres Strait Islander people (Heitmann et al. 1997). In
independent work, it was obvious to Piers et al. (Piers et al. 2003) using combined
methods that the relationship of BMI, resistance and skin-fold thicknesses differed
significantly between Aboriginal people and Caucasian people, and was likely due to
different ratios of fat to fat free mass for a given BMI between groups.
Torres Strait Islander males and females had higher weight, height, waist and hip
circumference (but not WHR) than Aboriginal males and females in a large
epidemiological survey of cardiovascular disease risk (Li et al. 2010).
Cardiovascular disease risk was equally indicated by a waist: hip ratio of >0.9 in all
four gender-ethnicity groups, although a single indicator of waist or BMI was not
identified across the four groups (Aboriginal and Torres Strait Islander males and
females) (Li et al. 2010). The Framingham risk calculator (based on age, gender,
smoking status, total cholesterol, diabetes and blood pressure), provides a 10 year
cardiovascular risk score (Wilson et al. 1998). It was noted that while the
Framingham risk calculator was able to show higher cardiovascular disease risk
between Aboriginal people (males 1.4 and females 1.7 times higher risk) compared
with levels observed in Caucasians from the AusDiab study, it did not match the
48
actual hospitalisations and premature mortality that was experienced by Aboriginal
adults from one remote island community of the Northern Territory (Wang et al.
2003). Using the Framingham risk calculator, a similar 10-year cardiovascular risk
score was observed between adult Aboriginal people (from Central Australia) and
Torres Strait Islander people (assessed in the Torres Strait) (13 v 13.7%, p=ns)
(Wang et al. 2006). Wang et al. (Wang et al. 2006) also evaluated the performance
of anthropometric indices (waist, hip, WHR, BMI and waist to height ratio) with the
10-year risk score between Aboriginal and Torres Strait Islander people. It was
shown that higher hip circumference had an inverse-linear relationship with 10 year
cardiovascular disease risk in Torres Strait Islander people, compared with
Aboriginal people; that body mass index was a poor predictor of cardiovascular
disease risk across both groups, however WHR was the best predictor (across both
groups) for risk of diabetes and dyslipidaemia. They recommend the waist to hip
ratio as the best anthropometric measure across Aboriginal populations and Torres
Strait Islander populations, to estimate cardiovascular disease risk (Wang et al.
2006).
As discussed above, Snijder et al. (Snijder et al. 2004a) suggested that in groups with
high hip girth, similar to that reported in Torres Strait Islander people in the study by
Li et al. (Li et al. 2010), the high waist circumference may reflect a higher proportion
of subcutaneous fat than intra-abdominal fat. Abdominal fat partitioning in either
Aboriginal people or Torres Strait Islander people has not been reported. Heitmann
et al. (Heitmann et al. 1997) highlighted the steeper slope of the relationship between
body weight (as an indicator of size) and bioelectrical resistance for Aboriginal
people, compared with Torres Strait Islander people, Danes, and Samoans. They
made the assumption that Aboriginal adults may have a different relationship of fat
to lean mass for body weight, across a wide range of body weight that was not
evident in Torres Strait Islander people (or the other ethnic groups) (Heitmann et al.
1997). They hypothesised that at low body weight, Aboriginal adults have higher fat
mass, but at higher body weight, Aboriginal adults have less fat mass, which was
distinct to this ethnic group (Heitmann et al. 1997). It is noteworthy that skeletal
muscle (which as discussed above is a large determinant of lean body mass) is a key
modulator of insulin sensitivity (Wolsk et al. 2010; Yki-Jarvinen et al. 1985), and
anti-inflammatory processes (Mendham et al. 2012). Between individuals, healthy
49
males with higher relative lean mass have higher insulin-clearance rates than those
with lower relative lean mass (Yki-Jarvinen et al. 1985). Body composition,
particularly differences in lean mass, even in the setting of high body fat, may be an
important link between differences in diabetes, and cardiovascular disease risk that
Wang and Rowley et al. (Wang et al. 2006) reported above with respect to hip girth
in Torres Strait Islander people, and the usefulness of WHR which has been shown
across populations.
The availability of direct methods of body composition in a suitably representative
Aboriginal population and Torres Strait Islander population has been challenging.
Detailed body composition studies have not been undertaken in Torres Strait Islander
people. There are two published studies that describe body composition and health
risk using whole body DXA among Aboriginal people. Mendham et al. (Mendham
et al. 2012) recently reported health related effects of obesity in ten Aboriginal
males, who had no chronic medical conditions. The extent of body composition
description in this group consisted of a mean body mass index of 32 kg/m2, waist
circumference of 103.6 cm, WHR of 0.95, and body fat percent (measured by whole
body DXA) of 27.8%. The purpose of their report was to demonstrate abnormal
resting levels of inflammatory and insulin markers, which improved significantly
following aerobic exercise among middle aged males with this level of overweight
(Mendham et al 2012). Despite the absence of overt illness, this group of males had
total and central obesity which was accompanied by abnormal metabolic and
inflammatory markers. They performed a pre and post-exercise assessment within
the one group, and have not reported any comparison against other Aboriginal groups
(including women, for metabolic syndrome or diabetes, or lean adults) nor have they
compared with Caucasians. This is however a unique and important study showing
the favourable short-term metabolic response to exercise in Aboriginal men.
Raja et al. (Raja et al. 2003) had access to a sophisticated laboratory with detailed
body composition tools, yet their population sample was not representative of
Aboriginal women across the country. They undertook the most comprehensive
study of body composition among Aboriginal females, to measure fat free mass by
total body water (using deuterium oxide and bioelectrical impedance analysis), total
body mineral (using DXA) and total body protein (using in-vivo neutron capture
50
analysis of total body nitrogen). Their main conclusions include 1) that whole body
DXA accurately (and with high correlation) reported fat and lean mass in
“Aborigines” (authors term), even over a wide range of fat mass; 2) that both
Aboriginal females and non-Indigenous females had similar total fat percent, and
degree of central adiposity overall; 3) that older Aboriginal women had higher
abdominal fat than older Caucasian women, and almost twice as much central fat
than young Aboriginal women; and 4) that hip girth was highly correlated with total
and abdominal adiposity in women (Raja et al. 2003).
The study facilities were available at a university teaching hospital in Sydney, and
they compared the body composition of sixteen non-diabetic, age-matched
Aboriginal females and Caucasian females. The study group comprised a wide age
range, and its generalisability to other Aboriginal peoples or Torres Strait Islander
peoples is therefore limited, especially with Aboriginal females in Northern or
Central Australia, who are the people of interest in this thesis. Our main concerns
with Raja et al.’s (Raja et al. 2003) findings were hip circumference was a surrogate
of total and abdominal adiposity, which is inconsistent with the reporting of
preferential central obesity particularly shown by WHR in Aboriginal females with
age and overweight, that is not as apparent by body mass index or weight
(Kondalsamy-Chennakesavan et al. 2008; Maple-Brown et al. 2007; O'Dea et al.
1993). As briefly discussed earlier in the chapter, the heterogeneity of Aboriginal
people may derive from differences in lifestyle and adaptations to Western culture
and ethnic admixture, which have played a role in Raja et al.’s (Raja et al. 2003)
Aboriginal participants. Therefore whilst Raja et al.’s (Raja et al. 2003) study
provided a comprehensive assessment of body composition in a small group of
Aboriginal females, their findings require confirmation in further studies.
As reviewed above, studies examining the health risk associated with overweight and
obesity indicate the particular importance of abdominal obesity, rather than a
generalised pattern of excess body fat (Lê et al. 2011; Liska et al. 2007). Lean body
mass is particularly important for insulin sensitivity (Yki-Jarvinen et al. 1985) and
exercise is shown to both potently modify insulin resistance and demonstrate an anti-
inflammatory response (Mendham et al. 2012). Two known features of body
composition are described for Aboriginal and Torres Strait Islander people. First,
51
many studies indicate a stronger likelihood of abdominal obesity (rather than
generalised pattern of overweight) in adult Aboriginal people (O'Dea et al. 1993;
Piers et al. 2003). Second, differences in bioelectrical impedance (specifically
resistance, an inverse indicator of lean body mass) suggest lower lean body mass for
size among Aboriginal people than either Torres Strait Islander people or participants
of a Caucasian background (Heitmann et al. 1997). Three hypotheses may be
entertained: first, the pattern of abdominal fat partitioning is likely to differ between
Aboriginal peoples and Torres Strait Islander peoples; second, the threshold of health
risk may be potentiated by the proportion of lean mass in the individual; third, in
relation to Indigenous Australians with ethnic admixture, the pattern of obesity is
likely to more closely reflect the dominant racial group, though determining
‘dominant race’ may prove difficult. This may be difficult first, because people
identify ethnicity for different reasons, and second because ‘characteristic’ body
composition features for each race have not been defined, and given the diversity of
peoples internationally, may never by defined. This third hypothesis is complex, and
while important, is beyond the scope of this study.
1.6.6. The Link Between Inflammation and Adiposity Defined by Detailed Body Composition Assessments
Simplistically, the body is divided into 2 compartments, lean body mass, and fat
mass. Body fat can be described as essential and non-essential fat. Essential fat
includes the lipid component of cell membranes, brain and nervous tissue and small
deposits of fat surrounding vital organs. An idealised body fat mass of healthy adults
from Western Europe and North America was presented in the Annals of the
International Commission on Radiological Protection (Valentin 2002). Based on
data collected between the 1960’s until 1990, healthy 35 year old men and women
were reported to have 14.6 kg and 18 kg of body fat respectively (Valentin 2002).
Lean body mass however is not totally fat-free. Adipose tissue within stroma and
lipid in cell membranes make up 2% of lean body mass (Valentin 2002).
Lipid is stored within mature fully differentiated adipocytes. Adipose tissue is
composed of mature adipocytes (between 50-85%), stromal vascular cells (including
resident macrophages), and endothelial cells (Maury et al. 2010). Adipose tissue is
52
biologically active and involved in the synthesis and secretion of proteins and
cytokines (adipokines) linked with lipid metabolism, energy balance, insulin
sensitivity and inflammatory pathways (Zou et al. 2008). Resident adipose tissue
macrophages (M2 phenotype) are responsible for homeostasis and remodelling
locally (Shah et al. 2008), are activated by the alternate pathway of complement
activation and secrete anti-inflammatory cytokines (interleukin-10, and interleukin-1
receptor antagonist) (Shah et al. 2008). Adipose cell composition and the secretion
of adipokines are influenced by total fat mass and regional adipose depots (Abate et
al. 1995; Maury et al. 2010). These adipokines will be discussed in more detail later
in the chapter.
Non-essential fat are the fat deposits associated with energy excess. Since non-
essential body fat does not bind water or electrolytes, essentially all of the body's
water and electrolytes are contained in the lean body mass compartment. It is on this
basis that measures of total body water and total body potassium and nitrogen
counting can reliably predict lean body mass. Non-essential fat (excess lipid) may be
stored in numerous depots throughout the body: epicardial fat, skeletal muscle (either
as inter-muscular adipose tissue or as intra-myocellular lipid), the liver and bone
marrow (Gallagher et al. 2008) and the kidney (perirenal- between the capsule and
kidney, and as intra-renal triglyceride content) (Li et al. 2011). Within the abdomen,
visceral adipose tissue sub-compartments include omental adipose tissue (draining to
the portal circulation), mesenteric adipose tissue, and retro-peritoneal adipose tissue
(that drains to the systemic circulation).
Overweight is crudely indicated by weight gain, a high waist circumference and/or
body mass index. Excess of both total and central adipose mass are reported to be
associated with a higher risk of the metabolic syndrome, cardiovascular disease
(Maury et al. 2010) and type 2 diabetes (Zou et al. 2008). Macrophage infiltration is
common to chronic diseases associated with the metabolic syndrome (obesity, insulin
resistance, hepatic fibrosis, arterial disease). In obesity, the inflammatory process in
adipose tissue involves recruitment of activated macrophages (M1, pro-inflammatory
phenotype) altering the balance of the predominantly anti-inflammatory state of
resident macrophages (M2 phenotype) that is observed in the adipose tissue of lean
individuals (Lumeng et al. 2007). Macrophage infiltration (M1 phenotype) into
53
adipose tissue occurs in response to adipocyte hypertrophy (from enlarged lipid
droplets), is correlated with body mass index, and was observed preferentially in
visceral adipose tissue (relative to subcutaneous adipose tissue) (Fontana et al. 2007;
Shah et al. 2008). M1 phenotype macrophages are activated by the classical pathway
of complement activation and overexpress pro-inflammatory genes (including for IL-
6) (Lumeng et al. 2007). They also induce adipocyte neovascularisation, modify
insulin signalling, and secrete inducible nitric oxide synthase, and pro-inflammatory
cytokines (TNFa and IL-6). Furthermore in response to adipose inflammation,
endothelial cells express selectins and cell adhesion molecules that facilitate the
movement of white blood cells from the middle of the luminal blood flow to the
periphery in preparation for entering the extra-vascular tissue, and consequent tissue
inflammation.
The portal vein is the main blood supply to the liver, and drains visceral (omental
and mesenteric) adipose tissue beds. Age, gender, ethnicity, physical activity and
total fat mass are reported to influence the size of the visceral fat depot (Klein et al.
2007). Expanded visceral adipose tissue in particular, is associated with altered
hepatic insulin sensitivity, lipid metabolism, and the production of acute phase
proteins (like C-reactive protein) under the influence of IL-6. Less information
exists about the effects of ectopic fat storage in non-visceral fat storage sites, or if
cellular and receptor functions are equivalent in different adipose tissue sites, or in
the presence of chronic disease, like diabetes.
1.7. The Relationship of Inflammatory Cytokines with Body
Measures and Features of the Metabolic Syndrome and Chronic
Disease
There are many published examples of the relationship between insulin resistance,
inflammation and endothelial dysfunction. The use of these markers has been
assessed in many Caucasian populations who are healthy, or have cardiovascular risk
factors, and some chronic medical conditions. There are comparatively fewer studies
in large populations of people of a non-Caucasian background. To our knowledge
only one study has reported IL-6 levels in overweight Aboriginal males (Mendham et
54
al. 2012). There are no studies describing the relationship of adipose-derived
cytokines among Aboriginal people or Torres Strait Islander people who have
chronic disease risk markers or chronic kidney disease. A review of the literature is
presented below, describing the relationship of insulin resistance and inflammation
and adipose-derived biomarkers including C-reactive protein (CRP), interleukin- 6
(IL-6), leptin, adiponectin, and resistin, including where they relate to measures of
body composition, or their performance in non-Caucasian populations.
1.7.1. Interleukin-6
Interleukin-6 (IL-6) is reported to be released from visceral and subcutaneous
adipose tissue beds (Fontana et al. 2007; Mohamed-Ali et al. 1997), though visceral
adipose tissue was shown as the dominant site of IL-6 secretion among morbidly
obese humans (Fontana et al. 2007; Maury et al. 2010). Up to 30% of systemically
measured IL-6 was shown to be produced from adipose tissue macrophages (Zou et
al. 2008). Healthy adult males had serum IL-6 concentrations less than 1.0 pg/ml
(Wolsk et al. 2010), whereas chronically high IL-6 concentrations (such as >1, and
up to 8 pg/ml) have been reported in people who are obese or have diabetes (Petersen
et al. 2005).
IL-6 is involved in inflammation, tissue injury, host defence and insulin resistance
(where it modifies hepatic glucose production and insulin secretion) (Cornier et al.
2008; Zou et al. 2008). IL-6 is produced under the influence of TNFa, and stimulates
hepatocyte production of C-reactive protein. Several studies show IL-6
concentrations were positively associated with peripherally measured CRP
concentrations (Fontana et al. 2007; Yudkin et al. 1999), fasting insulin
concentrations (Maury et al. 2010; Shah et al. 2008), low HDL-cholesterol
concentrations (Cornier et al. 2008), and with body mass index, obesity and the
future development of diabetes.
High IL-6 concentrations are also observed acutely following exercise (Mendham et
al. 2012), where it acts via skeletal muscle, although was associated with the co-
secretion of anti-inflammatory cytokines (Wolsk et al. 2010). In overweight
Aboriginal males, following acute exercise, IL-6 concentrations rose acutely and
55
declined over four hours, accompanied by the expression of IL-1ra (interleukin-1
receptor antagonist, an anti-inflammatory interleukin) and lowering of glucose and
insulin concentrations compared with pre-exercise levels (Mendham et al. 2012). In
healthy males, who were matched for body mass index, total fat-free mass and lower-
limb fat free mass, an IL-6 infusion (mimicking acute exercise) was associated with
increased lipolysis (from the limb, but not abdominal adipose tissue), 20% lower
insulin concentrations and higher glucagon concentrations (compared with those who
received a placebo infusion) (Wolsk et al. 2010). The authors suggested that
exercise-stimulated IL-6, therefore, prevents intra-myocellular lipid accumulation by
mobilising energy from muscle fatty acid during exercise, whilst also improving
insulin sensitivity (Wolsk et al. 2010).
Tumour necrosis factor alpha is reported to induce IL-6 production, and has been
implicated in insulin resistance and lipolysis via reducing insulin-receptor substrate 1
(IRS-1) (Shah et al. 2008) and in the inhibition of lipoprotein lipase activity. TNFa
concentrations were not significantly associated with aging (Cartier et al. 2009) or
concentrations of other circulating adipokines (IL-6 or CRP) in a study of pre-
menopausal women with obesity (Browning et al. 2008). Several studies show a lack
of localisation of TNFa from abdominal adipose tissue, lack of association with BMI,
body fat mass (Mohamed-Ali et al. 1997), or visceral adipose tissue in men or
women (Browning et al. 2008; Cartier et al. 2009). In contrast, higher subcutaneous
thigh fat was shown to be inversely related with IL-6 and TNFa concentrations in
Caucasian males (Beasley et al. 2009), suggesting the importance of differing
adipose depots to health risk. The inflammatory burden of obesity is much lower
than systemic sepsis, hence serum levels of TNFa in obese populations may not
always represent its true function (Cartier et al. 2009). Therefore TNFa will not be
assessed in the proposed thesis study.
1.7.2. C-Reactive Protein
C-reactive protein (CRP) is an acute phase protein, synthesised in the liver in
response to IL-6 stimulation. It is an ideal acute phase protein because there are no
medical conditions associated with CRP-deficiency, and concentrations consistently
rise following trauma, bacterial infection or inflammation. Like many biological
56
markers, CRP is not normally distributed (Macy et al. 1997; Ridker et al. 1998), and
titres may change rapidly from as low as 1 mg/L in response to inflammation to a
value of several hundred (mg/L) in the setting of acute infection. CRP
concentrations are not influenced by age, gender or hormones in Caucasian
populations (Macy et al. 1997; Tietz 1990). In population studies, high CRP
concentrations were associated with metabolic syndrome, diabetes and
cardiovascular disease risk (Onat et al. 2008; Ridker et al. 1998). CRP
concentrations were also positively associated with waist circumference, body mass
index, fasting blood glucose and insulin resistance (Cornier et al. 2008).
It has been suggested that CRP concentrations below 10 mg/L indicate the absence of
acute inflammatory disease in an individual (Tietz 1990). CRP concentrations of less
than 15 mg/L have been arbitrarily applied in studies of cardio-metabolic risk (Onat
et al. 2008). However longitudinal studies of CRP concentrations in Aboriginal
people in community health screening surveys show a wide spectrum of CRP
concentrations (Shemesh et al. 2009). In healthy people, CRP concentrations were
shown to be stable acutely (over three days) and chronically (over 6 months) (Macy
et al. 1997). Shemesh et al. (Shemesh et al. 2009) showed high background
concentrations of CRP when tested at baseline and after more than 2 years (4.5 v 5.1
mg/L, p=0.22), among Aboriginal people from a remote community, including more
than two thirds of the 70 adults having levels higher than 3.0 mg/L at baseline and
follow-up. They demonstrated CRP concentrations were stable at either high or low
titre when retested up to 3 years later; that individuals did not have significant inter-
person variability when tested between the baseline and follow-up assessment; and
over time baseline CRP concentration provided a stronger association with
cardiovascular disease risk in this community than traditional risk markers (Shemesh
et al. 2009). In middle-aged women and other populations, models of cardiovascular
disease risk were improved by the inclusion of CRP concentration as a predictor
variable (Onat et al. 2008; Ridker et al. 1998).
Numerous Australian studies have linked elevated markers of inflammation with the
metabolic syndrome, and adiposity. As discussed earlier at Chapter 1.5.6, a
differential relationship of CRP with BMI was seen between Aboriginal males and
females in a remote Aboriginal community, where Aboriginal females with obesity
57
had much higher CRP concentrations than Aboriginal males with similarly high body
mass index (Shemesh. et al. 2007). Others have also linked CRP concentrations with
overweight in Aboriginal people in both urban and remote settings (Hodge et al.
2010; McDonald et al. 2004; Rowley et al. 2003; Shemesh. et al. 2007). CRP levels
remain stable, although IL-6 concentrations increased as part of an anti-inflammatory
response following an acute episode of exercise (Mendham et al. 2012). Following a
6 month weight loss program in obese middle aged insulin-resistant Caucasian
females, Browning et al. (Browning et al. 2008) reported the health improvement of
participants following the intervention was more strongly related to changes in
concentrations of CRP rather then IL-6.
Different populations report different mean and distribution of CRP titres, which
may in part explain differences in cardiovascular disease and metabolic syndrome
between groups (Anand et al. 2004). A high prevalence of insulin resistance and
central obesity are reported in Indians from South-East Asia (Yajnik et al. 2008). IL-
6 and CRP concentrations were also high among Indian males, and were influenced
by place of residence (urban-slum, urban middle-class and rural-living), overcrowded
living conditions, rapidity of lifestyle-transition, and measures of body fat (Yajnik et
al. 2008).
1.7.3. Adiponectin
Adiponectin is produced from mature adipocytes (Maury et al. 2010) and may be
measured in blood and urine (Shen et al. 2008). The adiponectin monomer readily
associates non-covalently forming trimers, hexamers or multimers (the multimers are
also referred to as high molecular weight adiponectin) within the adipocyte before
secretion (Zou et al. 2008). Adiponectin (especially high molecular weight
adiponectin) was shown to have anti-inflammatory, anti-atherogenic and insulin
sensitising properties (Kadowaki et al. 2006). Peripheral insulin sensitivity was
shown to be mediated by the receptor AdipoR1 in skeletal muscle, whereas hepatic
insulin sensitivity was mediated via the receptor AdipoR2 (and insulin-receptor
substrate -1 and AMP kinase) (Kadowaki et al. 2006). Adiponectin was negatively
associated with obesity, type 2 diabetes, and cardiovascular disease in adults (Maury
et al. 2010). Plasma adiponectin concentrations are higher in healthy females than
58
healthy males (Arita et al. 1999; Cnop et al. 2003; Hanley et al. 2003; Keun-Gyu et
al. 2004; Peake et al. 2005) and in people with chronic kidney disease compared with
those with preserved kidney function (Zoccali et al. 2002).
A low concentration of adiponectin at an initial assessment predicted the future
development of diabetes among Pima Indians of Arizona (USA), even though
participants had similar levels of obesity (BMI 36 kg/m2, waist 112 cm) and insulin
resistance (fasting insulin >250 pmol/L and 2-hr insulin both >795 pmol/L) (Krakoff
et al. 2003). Multiple cytokines were assessed at baseline (adiponectin, IL-6, TNFa,
high sensitivity CRP and markers of endothelial function) to predict the development
of diabetes, of which low-adiponectin concentration was the strongest predictor
(Krakoff et al. 2003). Among adult First Nation Canadians, after adjusting for more
traditional cardiovascular disease risk markers (age, gender, triglycerides, HDL-
cholesterol, hypertension and impaired glucose tolerance), incident diabetes was
predicted by low adiponectin concentrations and by high leptin concentrations and
low adiponectin: leptin (A:L) ratios (Ley et al. 2008). Among adults with chronic
kidney disease, low baseline adiponectin concentrations predicted a future
cardiovascular disease event (Zoccali et al. 2002).
1.7.4. Leptin
Leptin is secreted by adipocytes from subcutaneous adipose tissue (Maury et al.
2010), but also secreted in small amounts from gastric epithelium, muscle and
placenta (Zou et al. 2008). Serum leptin concentrations was shown to be
proportional to subcutaneous adipose tissue mass and nutritional status (Zou et al.
2008). In lean individuals, the fed state was associated with higher secretion of
leptin, and the fasted state with leptin deficiency (Zou et al. 2008). The central
effects of low leptin concentrations in a lean individual are to promote appetite, and
reduce energy expenditure from the thyroid, reproductive systems and immune
responses (Zou et al. 2008). Peripherally, leptin reduces the intracellular lipid
content in muscle and the liver. Leptin exerts its insulin sensitising effects via
mitogen-activated protein kinase (MAP kinase), phosphatidylinositol 3-kinase (PI3
kinase) and the insulin-receptor substrate (IRS-1) (Zou et al. 2008).
59
High concentrations of leptin may reflect leptin resistance (Maury et al. 2010), which
refers to reduced sensitivity (and signalling) of the hypothalamic leptin receptors to
the effects of leptin (Bluher et al. 2009), which are reported in obesity (Mantzoros et
al. 2011). Leptin concentrations are shown to correlate with total adiposity (BMI) in
Caucasian and non-Caucasian groups (Mente et al. 2010) and with fat mass, but not
with trunk-fat mass in Caucasian females (Jenkins et al. 2001). Leptin
concentrations are shown to be higher in people with renal disease, in part due to
poor clearance by the kidney. Other kidney related effects of leptin include
natriuresis, increased sympathetic nervous activity, and stimulation of reactive
oxygen species, glomerulo-sclerosis (fibrotic damage in the nephron), and
proteinuria (Wolf et al. 2002).
Among Peruvian women, those living in the urban city of Lima had higher fat mass,
leptin and insulin concentrations than females living in the high-altitude region of
Cuzco, which was partly explained by exercise, since both ate a similar diet, and had
similar ethnic heritage (Lindgarde et al. 2004).
1.7.5. Resistin
The mechanisms and role of resistin in human health and disease are not fully
understood. Resistin was found in high concentrations in adipocytes in mice, where
it was first identified in studies involving peroxisome proliferator-activated receptor
(PPAR-gamma receptor) response to insulin sensitising medication in the early
2000’s (Steppan et al. 2001). It is unclear how much the responses and relationships
of resistin in mice models reflects the behaviour of human resistin (Park et al. 2011).
Messenger ribonucleic acid levels (mRNA levels) for resistin were found in
peripheral mononuclear cells in adipose tissue, but very low levels were found in
adipocytes in humans (Cornier et al. 2008; Shah etal. 2008; Zou et al. 2008), hence it
was suggested resistin was linked to insulin-resistance through inflammatory
processes (Park et al. 2011). The descriptive studies in resistin discussed below
outline associations, but do not reveal any mechanisms asserting the link of resistin
with insulin resistance or inflammation, which again reinforces the current lack of
clarity surrounding the role of resistin in human health and disease.
60
Females have higher resistin concentrations than males (Norata et al. 2007; Silha et
al. 2003), and concentrations did not differ in females with respect to menopause
status (Norata et al. 2007), or in adults when compared for obesity (by BMI) (Norata
et al. 2007; Silha et al. 2003) or diabetes (Norata et al. 2007). Resistin
concentrations were shown to be positively associated with waist circumference,
blood pressure, adiposity, triglycerides, and negatively with HDL-cholesterol
(Cornier et al. 2008; Zou et al. 2008).
There is inconsistent reporting of the relationship of resistin and HOMA in humans.
Among adults (mean age 45 years), resistin concentrations were similar in lean
(BMI<25 kg/m2) and obese (BMI >30 kg/m2) adults without diabetes (21.5 ug/L v
28.8 ug/L, p>0.05). Resistin concentrations also correlated with HOMA-IR, but not
with body mass index (Silha et al. 2003). Norata et al. (Norata et al. 2007) examined
the relationship of resistin in a large adult European cardiovascular disease risk
screening study. They observed plasma resistin concentrations correlated with a
higher frequency of metabolic syndrome factors in both males and females, and with
a higher Framingham cardiovascular disease risk-prediction score. They also
reported that resistin did not correlate with HOMA score, or insulin concentration
(Norata et al. 2007). In this adult screening study, there was a stronger relationship
of systolic blood pressure and HDL-cholesterol with resistin levels in females, but
not in males, though they could not explain why this might have occurred (Norata et
al. 2007). In a comparison of First Nation and Caucasian Canadian women without
diabetes, Silha et al. (Silha et al. 2007) observed that First Nation females were
younger, had higher truncal obesity, higher IL-6 and lower adiponectin
concentrations, yet similar resistin and leptin concentrations. Resistin concentration
was shown to be positively correlated with total fat mass, and trunk fat mass in First
Nation, but not in Caucasian women. The lack of age-adjusted analysis may be an
important omission in this study by Silha et al. (Silha et al. 2007), since age
influenced resistin levels in work by others (Norata et al. 2007).
61
1.7.6. Inflammation, Insulin Sensitivity and Dyslipidaemia in Chronic Kidney Disease
The kidney is an essential organ in insulin metabolism (Rabkin et al. 1984). The
relationship of kidney impairment with insulin resistance and cardiovascular disease
risk has been the subject of multiple studies in people with kidney diseases
(Charlesworth et al. 2005). Kidney disease can be categorised by function
(creatinine clearance or other definition), by disease (primary renal disease or
systemic renal disease, like type 2 diabetes), or by modality of therapy (chronic
kidney disease, renal transplantation and dialysis).
Becker et al. (Becker et al. 2005) reported on the relationship of cardiovascular risk
and insulin resistance in 227 Caucasian adults with non-diabetic chronic kidney
disease, who were matched for body mass index with 78 healthy adults. The mean
glomerular filtration rate of kidney disease patients was 63 ml/min/1.73m2 (range 38-
96 ml/min/1.73m2). At baseline, serum adiponectin concentration was negatively
related with body mass index, fasting triglycerides, insulin and glucose. Kidney
disease patients had higher glucose and insulin concentrations and HOMA score than
healthy people. Low adiponectin concentrations in kidney disease participants
predicted a cardiovascular event in follow-up over a mean of 54 months (Becker et
al. 2005).
Charlesworth et al. (Charlesworth et al. 2005) undertook a much more detailed study
of insulin resistance in renal disease incorporating detailed body composition
analysis and the postprandial behaviour of lipids. Individuals with stable non-
diabetic chronic kidney disease were matched by age, gender and body-composition
with healthy adults. Participants with chronic kidney disease were grouped above
and below GFR 60 ml/min (measured by a 24 hour urine and plasma creatinine
clearance study). Several findings were shown: individuals with kidney disease had
a higher HOMA score for any measure of central fat mass than healthy people; the
insulin resistant profile increases in kidney disease patients with a GFR less than 60
ml/min (compared those with higher GFR); at low GFR (<60 ml/min) insulin
resistance occurred due to persistent pancreatic secretion of insulin; and finally in
CKD, following a meal, a delayed normalisation of triglyceride concentrations was
observed. The renal dyslipidaemia pattern of high triglycerides and low HDL-
62
cholesterol concentration was further evaluated by Chan et al. (Chan et al. 2009b) in
10 participants with CKD and twenty healthy adults who were carefully matched for
anthropometry, insulin sensitivity and inflammatory profile. Despite similarities
between CKD patients and healthy controls for waist circumference, weight, BMI,
WHR and inflammatory markers, CKD patients had a higher HOMA score, and
higher fasting triglyceride concentration. They reported through experimental
studies, that high fasting triglyceride concentrations were due to the delayed
catabolism of VLDL, which they proposed was due to abnormal catabolism of apo-
C-111 or an unmeasured toxin associated with kidney damage (Chan et al. 2009b).
1.7.7. Obesity, Metabolic Syndrome, Adipokines and Kidney Damage
Adiponectin is produced by adipocytes (and not inflammatory cells). Visceral
obesity refers to the storage of excess abdominal adipose tissue burden. In the
setting of preferential visceral obesity, subcutaneous tissue adipocytes have abnormal
structure and function: they have limited secretion of the ADIPO-Q gene, responsible
for the lower adiponectin expression (Kursawe et al. 2010); have limited capacity for
lipid storage (Kursawe et al. 2010); and develop additional supportive structures,
including poorly formed and irregular blood vessels, deposit fibrotic connective
tissue proteins, and express a pro-inflammatory response by tissue macrophages
(Spencer et al. 2011). In a pig model of visceral obesity and early metabolic
syndrome, abdominal visceral obesity was associated with fat deposition within the
kidney (intra-renal fat), and higher renal expression of IL-6 (Li et al. 2011). The
kidney responds to the additional excretory demands of excess adipose tissue, by
increasing glomerular filtration rate -primarily by increasing the volume and quantity
of new blood vessels in the cortex (Li et al. 2011). These newly formed cortical
blood vessels were reported to be particularly small in size, were more tortuous and
irregular than normal capillaries, and was postulated to be prone to excessive
endothelial leakiness of inflammatory substances (Li et al. 2011).
Whilst adiponectin and leptin concentrations may be higher in individuals with
kidney impairment (Adamczak et al. 2009; Wolf et al. 2002), several reports from
human and animal models indicate these proteins are functional in the presence of
63
poor kidney function, and the presence of leptin may also propagate kidney damage
(Tomaszewski et al. 2007; Wei et al. 2004; Wolf et al. 2002).
Leptin concentrations were positively related to creatinine clearance in healthy
young adult males. A high frequency of metabolic syndrome factors (e.g. four
compared with one factor) in young males without chronic disease, was associated
with higher creatinine clearance, and glomerular hyperfiltration (Tomaszewski et al.
2007). In a mouse model, Wei et al. (Wei et al. 2004) showed high leptin
concentrations preceded the development of glomerular hyper-filtration, which in
turn preceded a decline in GFR in a model of early type 2 diabetes. Some other
kidney-related effects of leptin include natriuresis, increased sympathetic nervous
system activity, stimulation of reactive oxygen species, glomerulo-sclerosis (fibrotic
damage in the nephron), and proteinuria (Wolf et al. 2002).
It has been suggested that since adiponectin concentrations are higher in situations of
low eGFR and or albuminuria, the kidney could be a clearance site for adiponectin,
however this has not been confirmed (Adamczak et al. 2009). Regardless, reports in
humans and animals show adiponectin to be functional in the presence of kidney
impairment. Adiponectin has been reported to act at the podocyte (Sharma et al.
2008) and proximal renal tubule (Shen et al. 2008), and the following reports suggest
compelling evidence for its role in the repair of kidney injury (Komura et al. 2010;
Peake et al. 2010).
Adiponectin receptors were shown to be equally functional and found in higher
concentration in dialysis patients than healthy controls (Shen et al. 2007a). The
authors suggested a negative biofeedback mechanism was operating in these patients
in response to the complex inflammatory-vascular milieu of renal disease and
dialysis (Shen et al. 2007a). In another study, despite similar serum adiponectin
concentrations, adults with renal disease and proteinuria, had higher urinary
adiponectin levels than was observed in healthy adults (Shen et al. 2008). In that
study of proteinuria, adiponectin was detected in the renal tubules in intact
physiologically active isoforms suggesting secretion in urine as opposed to local
degradation products, where it bound to local adiponectin receptors and inhibited the
64
secretion of inflammatory proteins, such as monocyte-chemoattractant protein-1
(Shen et al. 2008).
In other work, adiponectin was reported to stabilise the activation of the classical
pathway of complement, by binding to Factor H, an inhibitory complement protein
(Peake et al. 2010). Finally, another report showed adiponectin concentrations and
its respective mRNA levels were preserved in tissues in mice with subtotal
nephrectomy (Komura et al. 2010). In these mice with low-GFR, adiponectin was
associated with dampening the pro-inflammatory effects of TNF-a on the production
of vascular adhesion molecules (Komura et al. 2010). However, when Cystatin C
was applied to the model (mimicking severe clinical kidney impairment), the anti-
inflammatory effects of high adiponectin concentrations were cancelled (Komura et
al. 2010).
Sharma et al. (Sharma et al. 2008) makes a compelling argument for the relationship
of low-adiponectin states with albuminuria in a mouse model. Adiponectin knock-
out mice exhibit albuminuria, and higher levels of oxidative stress, than wild-type
mice, and these manifestations worsen in the presence of diabetes (Sharma et al.
2008). Podocytes are specialised cells in the glomerular basement membrane of
glomeruli, and act primarily to prevent leakage of large proteins, including albumin
(Pavenstädt et al. 2003). Adiponectin was shown to have important functional
effects in the kidney, and specifically the podocyte, irrespective of systemic effects
of adiponectin. Adiponectin knock-out mice displayed podocyte-fusion (making
nephrons highly permeable to large proteins including albumin) despite otherwise
normal architecture of the filtering unit of the nephron (that is they have preserved
glomerular basement membranes, mesangium and endothelium) (Sharma et al.
2008). Sharma et al. (Sharma et al. 2008) reported that exogenously supplied
adiponectin directly improved the permeability of damaged podocytes and was
associated with improved local AMP-kinase function. Overall, adiponectin knock-
out mice who received supplemental exogenous adiponectin had higher serum
adiponectin concentrations, restored podocyte function, and minimised albuminuria
levels in as little as 10 days (Sharma et al. 2008). To date, there are no human
studies of adiponectin supplementation.
65
1.8. Summary of the Introduction and Aims of the Study
The literature review has identified a number of factors relevant to the study of body
size and composition, metabolic syndrome, cardiovascular disease risk, and kidney
damage in Aboriginal peoples and Torres Strait Islander peoples. The
disproportionate burden of adult chronic disease in Australian Aboriginal peoples
and Torres Strait Islander peoples is strongly linked to a shorter life expectancy, and
increased disease burden. The traditional cardiovascular risk factors of smoking,
hypercholesterolaemia, hypertension and diabetes do not explain all of the increased
risk in Indigenous Australian communities. Identifying early predictors of chronic
illness, by the study of overweight, the metabolic syndrome, and chronic low-grade
inflammation are widely reported in international populations. For Indigenous
Australians, in the context of a high disease burden and health gap, compared with
other Australians, preventing cardiovascular risk in healthy people and identifying
higher than expected risk in people with established diseases like diabetes and
chronic kidney disease are equally important. Some Aboriginal Australians have
demonstrated a willingness to adopt lifestyle change and lose weight in short term
studies (O'Dea 1984), and use preventative medicines in interventional studies in
order to regress or stabilise chronic illness (Hoy et al. 2003b).
Among several Aboriginal communities, Aboriginal females experience a higher
level of cardiovascular disease burden than age-matched Caucasian females (Wang
et al. 2003), higher degree of inflammatory markers for the same degree of higher-
adiposity as Aboriginal males (Shemesh. et al. 2007), and a higher proportion of
Indigenous females than males receive dialysis treatment for end stage kidney
disease (Jose et al. 2009). It has also been reported that Aboriginal and Torres Strait
Islander people are requiring dialysis for end-stage kidney disease at a younger age
than other Australians, largely attributed to type 2 diabetes (McDonald 2010), which
is closely related to a large burden of diabetes and obesity in the communities
(Leonard et al. 2002; O'Dea et al. 2008). Furthermore, a high frequency of
albuminuria in many Indigenous community surveys was also reported (Hoy et al.
2003b; Maple-Brown et al. 2011; Rowley et al. 2000). In the context of the long-
term risk of cardiovascular disease associated with indicators of kidney damage
(impaired glomerular filtration rate and or albuminuria), recommendations suggest
66
addressing the burden of cardiovascular disease risk and diabetes would have the
greatest mortality benefit (Keith et al. 2004).
Heterogeneity in body size is reported between Aboriginal groups, between
Aboriginal people and Torres Strait Islander people, and between Caucasian and
Indigenous Australians (Kondalsamy-Chennakesavan et al. 2008; Piers et al. 2003;
Wang et al. 2006). Older Aboriginal females appear to have a very different body
size than older females in other population groups: a disproportionate level of central
obesity was reported in Aboriginal women, particularly with older age, despite lack
of significant change in weight or body mass index (Kondalsamy-Chennakesavan et
al. 2008). The waist to hip ratio, rather than the body mass index was identified as a
better indicator of diabetes, dyslipidaemia and cardiovascular disease risk across
differing Aboriginal communities (Kondalsamy-Chennakesavan et al. 2008),
between Aboriginal and Torres Strait Islander people (Wang et al. 2006), and across
multi-ethnic populations (Yusuf et al. 2004). Finally, differences between
individuals and between populations in obesity, inflammation, insulin-resistance and
chronic disease may be explained through specific differences in body build and
composition (Deurenberg-Yap et al. 2002; Snijder et al. 2004a).
The relationship of metabolic syndrome factors with body size and cytokines
produced from or associated with adipose tissue was also reviewed. There were no
studies that described a stratified population including health, chronic disease and
kidney damage in non-Caucasian populations which could provide a perspective to
relate to Aboriginal people and Torres Strait Islander people. Published reports
indicate several important findings: first, CRP and IL-6 resistance are reported to be
closely related to intra-abdominal or central obesity (Fontana et al. 2007; Hodge et
al. 2010); second, lean body mass has a role in anti-inflammatory pathways and
peripheral insulin sensitivity (Wolsk et al. 2010; Yki-Jarvinen et al. 1985); third non-
fasting serum markers, such as concentrations of adiponectin and leptin are related to
insulin resistance, future cardiovascular disease events (Ley et al. 2008), and may be
related to kidney damage (Sharma et al. 2008; Wei et al. 2004; Wolf et al. 2002).
67
Aim
The aim of this study was to understand how body build, composition, and markers
of kidney damage relates to metabolic syndrome components in adult Aboriginal
people and adult Torres Strait Islander people, within the context of two volunteering
adult health screening studies.
Objectives of the thesis
There are five objectives of the thesis.
1. What are the earliest chronic disease risk markers evident in otherwise
healthy young adult Aboriginal people?
2. To describe the characteristics of skeletal build in Aboriginal people and
Torres Strait Islander people.
3. If differences are observed, how do observed differences in skeletal build
relate to body composition in Aboriginal adults and Torres Strait Islander
adults?
4. To determine the best indirect measures of body composition in the
assessment of chronic disease risk in adult Aboriginal people and Torres
Strait Islander people.
5. To examine the relationships of adipose-derived cytokines with body
composition in healthy Aboriginal people, and in Aboriginal people and
Torres Strait Islander people with markers of chronic disease.

Chapter 2. Methods
69
2.1. Choice of Studies
The PhD study describes the clinical health assessment, body composition and
inflammatory marker analysis in 4 groups of Northern Australians (Aboriginal
participants, Torres Strait Islander participants, Aboriginal and Torres Strait Islander
participants, and Caucasian participants). Two clinical studies form the basis of this
PhD study into the relationship of body composition and health in adult Aboriginal
people and Torres Strait Islander people.
The thesis study commenced in 2008 as a sub-study of the NHMRC funded “The
eGFR Study.” The eGFR Study was an avenue to assess large numbers of adult
Aboriginal peoples and Torres Strait Islander peoples across Northern, Central and
Western Australia and the Torres Strait. It would not have been possible to
undertake this PhD study without this larger study. After the first 12-18 months of
data collection, preliminary data from The eGFR Study showed a stronger pattern of
central obesity in Aboriginal women without diabetes who lived in remote compared
to urban parts of the Northern Territory. This data was presented as part of the
Young Investigator Award at the Australian and New Zealand Society of Nephrology
Annual Scientific Meeting (2009).
The second study, the Healthy Top-Enders’ study was designed as a response to
these findings of predominant central obesity: specifically do young healthy adults
have a pattern of central body fat, and if present, is it related to a healthy or adverse
metabolic profile? I was responsible for the design of the Healthy Top-Enders’
study, whereas I worked within the framework available in the eGFR Study. I was
the lead investigator on the Healthy Top Enders’ study, whereas I was an Associate
Investigator on The eGFR Study. The Healthy Top-Enders’ study enabled me to
address the question of differences in body size between Aboriginal adults and non-
Indigenous Australian adults, and examine the accuracy and clinical potential of
portable tools of body composition.
These cross-sectional studies were developed to provide evidence for discrete and
measurable factors that could be incorporated in longitudinal and intervention studies
70
and programs to modify cardiovascular disease risk in Aboriginal peoples and Torres
Strait Islander peoples. Overcoming the social determinants that contribute to poor
health, and designing and conducting a longitudinal or intervention study was
beyond the scope of this thesis.
2.2. General Aspects Related to Both the Healthy Top-Enders’ and
The eGFR Study
The study question “how does body build, composition, and markers of kidney
damage relate to metabolic syndrome components” suggests a specific and ideal
methodology. A balance of ideal versus realistic and achievable methodologies must
be achieved. This realism considers facilities and modalities available for
assessment across all study sites. It is also a negotiation between investigators and
participants for the appropriate protocols required to answer key clinical-questions,
and not necessarily what is beautifully ideal to answer a more detailed scientific
hypothesis (that is beyond clinical relevance). Answers to these complex questions
may require staged research timetables, demonstrating to the community where early
findings support additional and more complex studies in order to improve the
community’s health and well-being.
Across the identified study population, the facilities do not exist to provide
supervised hyper-insulinaemic clamp tests. With this balance in mind, we have
chosen to assess glycaemic status with an HbA1c and medical history. In a small
sub-group, fasting bloods and insulin in addition to HbA1c were used. Estimates of
insulin-resistance may be made using non-fasting surrogates such as lipoprotein and
adiponectin levels. We have not analysed apo-lipoprotein levels, and have utilised
non-fasting HDL-cholesterol, where fasting lipids were not available.
The availability of sophisticated tools of body composition in Northern Australia is
quite limited to this geographically dispersed population. It will be necessary to
validate portable tools of body composition against criterion methods, if they are
available. The portable tools chosen in this thesis offered to all study participants
include body mass index, waist to hip ratio and bioelectrical impedance analysis.
71
2.3. The eGFR Study: The Accurate Assessment of Kidney Function
in Indigenous Australians
The eGFR Study was an NHMRC funded study (#545202) of the accurate
assessment of kidney function in Indigenous Australians. Aboriginal people and
Torres Strait Islander people with different degrees of health and illness were
recruited for The eGFR Study between November 2007 to May 2011. Data
collection for the PhD study commenced in 2008 with assessment of Aboriginal
adults and Torres Strait Islander adults in The eGFR Study. The methodology of The
eGFR Study has been reported in detail elsewhere (Maple-Brown et al. 2010b).
Data presented in this thesis relate to “The eGFR Study”, an adult health screening
and kidney function test study, in major cities (Darwin, Cairns and Alice Springs)
and regional and remote areas of Northern Australia. The larger eGFR Study
assessed approximately 600 adults (Aboriginal people and Torres Strait Islander
people). I was directly involved in the data collection and assessment of 250 eGFR
Study participants across the Top-End of the Northern Territory (NT) and Far North
Queensland. As an associate investigator to the study, I participated in the annual
investigator meetings, monthly management group meetings, communications and
steering of The eGFR Study, and was the study leader responsible for sample
collection, laboratory processing and statistical analysis of adipose-derived
cytokines.
The eGFR Study DXA sub-study involved 195 adults from The eGFR Study who
underwent whole body dual-energy x-ray absorptiometry (DXA). This included 87
people in Darwin, and 108 people in Thursday Island. I was responsible for
overseeing use of the whole body DXA facility in Darwin (Norland XR46), and
sourcing a mobile unit (Hologic Delphi W) to travel to Thursday Island.
The Darwin DXA sub-study was conducted between July 2008 and March 2010. The
Norland XR46 whole body scanner (Cooper Surgical Co., Trumbull, CT, USA) was
installed in July 2008 as the first (and only) whole body DXA available in the
Northern Territory. It was located in a private local radiology service, off site from
the clinical assessments of The eGFR Study, which were usually performed at the
72
Menzies School of Health Research. In the Darwin eGFR DXA sub-study, I was
responsible for all of the consents, recruitment, and coordination of the assessments.
I performed most of the DXA scans, and also trained two research assistants who
also performed the scans (SG, MN). All scan analysis was performed by a single
operator (JH) using Illuminatus software (version 4.2.4a).
Only one transportable whole-body DXA device, a Hologic Delphi W (SN-70034)
(Hologic Inc., Bedford, M.A.) was available in Australia during the recruitment
period of the eGFR Study. This device was secured for a three week field trip on
Thursday Island in February 2010. An experienced operator (Dr Jarrod Meerkin
PhD, MSc (Hons), BApp.Sc., ESSAM EAP, Body Composition Australia),
performed all of the scans, and used the same body positioning protocols as the
Darwin DXA sub-study. Hologic data was analysed using the QDR system software
for Windows (XP) Hologic software APEX 3.0 (Hologic). Data files were exported
from the Hologic instrument, and stored securely at Menzies on an Access Database.
I performed all further analyses of body composition, and comparison of body
composition between groups.
The Thursday Island DXA sub-study field trip involved a team of people employed
by the eGFR Study. I had several responsibilities in the preparation and conduct of
the visit. As both a Torres Strait Islander, and a researcher, I actively engaged with
the community and local health service to gain community support and participation.
I also negotiated the involvement of the mobile DXA into The eGFR Study, and
assisted in securing its use, and that of a trained operator. On site during the field
trip, I advertised the DXA study, provided study information and recruitment of
study participants and assisted with data collection (anthropometry, bioelectrical
impedance analysis and skin-fold thickness).
The recruitment of participants in The eGFR study was focussed on inclusion of
Indigenous Australians from dispersed geographical locations throughout Northern
Australia (including urban, regional, and remote sites). Whole body DXA was never
foreseen as a body composition tool that would be available in all recruiting sites.
Only Darwin and Thursday Island had accessible whole-body DXA scanning
facilities available for study participants.
73
2.3.1. Participants
Aboriginal people and Torres Strait Islander people with a minimum age of 16 years
were invited to participate in The eGFR Study. The eGFR Study was a national
study across Western Australia, Central Australia, the Top-End Northern Territory
and Far North Queensland. Within these large regions, research staff recruited
participants from urban, regional and remote areas. A comparator group of
Australians of Caucasian background was recruited across 5 pre-defined strata
(described below) from Darwin, Northern Territory, Australia. This group was not
intended to be a matched group for direct comparison with the Indigenous group, but
rather a group in which the equation performance could be assessed in comparison to
other published studies, thereby supporting the reference GFR methodology in the
current study.
The geographical context of the study population in Northern, Central and Western
Australia was guided by data from the Australian and New Zealand Dialysis and
Transplantation (ANZDATA) Registry (Cass et al. 2001; Jose et al 2009). These
regions identify Aboriginal people and Torres Strait Islander people with the highest
incidence rates of requiring dialysis therapy for severe kidney disease (Cass et al.
2001; Jose et al. 2009). The study population was also sought from urban, regional
and remote settings, since the disease burden in Indigenous Australians varies
between these sites, and Indigenous Australians live in diverse geographic and
residential settings.
The ethnicity of Indigenous Australians was self-identified as an Aboriginal person
or as a Torres Strait Islander person or as both an Aboriginal and Torres Strait
Islander person. Data pertaining to self-identified ethnic identity of Indigenous
Australians (and their 4 grandparents) was collected, in order to improve our
understanding of differences in body composition.
Participants were excluded if they were receiving dialysis, or had rapidly changing
kidney function. Females who were pregnant or breastfeeding were also excluded.
Participants were also excluded from analysis in this thesis study if their mobility
74
was severely impaired such that they could not stand independently (to measure their
height).
The recruitment process involved partnership with health organisations, local
community groups, employment of Indigenous facilitators in the local communities,
and word of mouth. Where appropriate, local media advertising was also used to
inform the community about the study, and opportunities for participation.
Participants were recruited across a spectrum of health and illness, and specifically
recruited across five pre-defined health strata using the MDRD-4 formula (Levey et
al. 1999) of estimated glomerular filtration rate (eGFR) as:
• Strata 1. “Healthy” group: this group was defined by the absence of type 2
diabetes, hypertension, chronic kidney disease (CKD) and albuminuria. The
classification of “healthy” was on the basis of history, and confirmed in this
assessment. The absence of CKD was by calculated eGFR (by MDRD-4)
formula of greater than 90 ml ml/min/1.73 m2 in the absence of diabetes or
microalbuminuria.
• Strata 2. Participants with a history or biochemical assessment confirming
type 2 diabetes (HbA1c >6.5%) or albuminuria (any level >2.5 mg/mmol in
men and > 3.5mg/mmol in females) & eGFR >90 ml/min/1.73 m2;
• Strata 3. Participants with an eGFR of 60-90 ml/min/1.73 m2;
• Strata 4. Participants with an eGFR of 30-59 ml/min/1.73 m2;
• Strata 5. Participants with an eGFR less than 15-29 ml/min/1.73 m2.
2.3.2. Ethics
Letters of support from local community organisations and health services were
provided for each of the major recruitment sites. Ethics approval was sought and
provided from the major regions. This included approval by the joint Menzies
School of Health Research –Northern Territory Department of Health Human
Research Ethics Committee (ref: 07/54). The Top-End eGFR Study project was
approved by the Aboriginal Ethics Subcommittee which has the power of veto over
75
research conducted in Indigenous Australians, and the main committee. The study
was also approved by the following Research Ethics committees in other regions:
• Cairns and Hinterland Health Services District Human Research
Ethics Committee (ref: #523).
• Central Australian Human Research Ethics Committee (ref:
2008.04.06)
• Western Australian Aboriginal Health Information and Ethics
Committee (ref: 228 12/08)
• Royal Perth Hospital Ethics Committee (ref: 2009/026)
The eGFR Study DXA sub-study also received ethics approval from the Northern
Territory Department of Health Human Research Ethics Committee (ref: 07/54) and
the Cairns and Hinterland Health Services District Human Research Ethics
Committee (ref: #523).
2.3.3. Clinical Assessment
Participants agreed to a number of clinical measures normally performed as part of
routine clinical care for an adult health check, or chronic disease health assessment.
Individuals were approached by the research officers to consider participation in the
study. Informed consent was obtained, and participants were provided with
information to avoid a large protein meal prior to the study. Due to the complexity
of the assessment, participants were not asked to provide a fasting blood sample. A
non-fasting blood sample was obtained.
A Welch Allyn Spot Vital Signs monitor (Welch Allyn Medical Products,
Skaneateles Falls, USA) blood pressure machine was used with an appropriate sized
cuff for the participants arm. Blood pressure and pulse rate were measured after a 5
minute rest with the participant sitting and arm resting on a pillow at the level of the
heart. Three readings of systolic and diastolic blood pressure and pulse rate were
recorded, separated by a 5 minute break. Medical history and medications were self-
reported by participants, and where possible, confirmed by medical chart review.
The following blood tests were analysed at local laboratories: electrolytes, serum
creatinine, liver function test, glycated haemoglobin (HbA1c), and non-fasting lipids
76
(HDL-cholesterol, triglycerides, LDL-cholesterol), C-reactive protein, full-blood
count and urine albumin to creatinine ratio. The methods of serum creatinine varied
by local laboratory, and have been previously described for The eGFR Study (Maple-
Brown et al. 2010b). Assays for adipose-derived cytokines (adiponectin and leptin)
are outlined in Chapter 2.4.4, in the description of the Healthy Top-Enders’ study.
Recruiting was limited to non-pregnant females. Female participants of child-
bearing potential were also asked to provide a urine sample for qualitative human
chorionic gonadotrophin testing.
2.3.4. Questionnaire
The questionnaire included information about socio-economic status and related
demographic information, and is found in Appendix 1. The questions related to place
of residence, first language, language spoken at home, income source, employment
status, education level, number of bedrooms and occupants in the house and housing
tenure and landlord type if applicable, self-identified ethnicity of self and 4
grandparents and health behaviours (including cigarette smoking).
A Critique of the Definitions of Ethnicity in the thesis
The Australian government definition of an Aboriginal person or Torres Strait
Islander person is a person who is of Aboriginal or Torres Strait Islander descent,
self-identifies as such, and is accepted as such by their community. Additionally
ethnicity is a complex of racial background, lifestyle, cultural practices and beliefs
(Callister et al. 2007).
I was both a designer and user of the ethnicity questions. The ethnicity question, of
“how do you identify?” is a standard question used to assess inclusion in the eGFR
Study. The questionnaire was initially framed as “Are you an Indigenous
Australian?” When I commenced on the project, I found that while the question was
sufficient for the purpose of the larger eGFR study, the question was deficient with
respect to the PhD study regarding anticipated differences in body composition for
those of Torres Strait Islander background compared to participants of Aboriginal
background. The question was subsequently amended for Indigenous participants to
77
capture Aboriginal only, Torres Strait Islander only, and both Aboriginal and Torres
Strait Islander. In this respect, we invited participants to self-identify (rather than
assign) their ethnicity, which we believe was a strength of the thesis.
At our institution, the Aboriginal Ethics sub-committee of the Human Research
Ethics Committee has the power of veto over studies involving Aboriginal peoples
and Torres Strait Islander peoples. Some negotiation was required with the Chair of
the Aboriginal ethics subcommittee to include the question about grandparents’
ethnicity. The Chair’s concern was first, that our ethnicity question conflicted with
the Australian government definition of Indigenous Australian ethnicity, and second,
to the purpose of the additional information (on grandparental ethnicity) that we
proposed, since if an individual makes a personal identification as Aboriginal (or
Torres Strait Islander) they are completely Aboriginal, regardless of other ethnic
admixture. Our question was included to ascertain individuals of a predominantly
Aboriginal rather than Torres Strait Islander background. In Chapter 5 and Chapter
6, the combination of personally identified ethnicity and the perceived ethnicity of all
4 grandparents was used to study differences in body composition between three
groups, Aboriginal (only), Torres Strait Islander (only) and people of both Aboriginal
and Torres Strait Islander background.
Assessing the background of four grandparents was an attempt to incorporate some
of this, since lifestyle (diet and exercise), and environment (services and
infrastructure) are also likely to impact on obesity risk (WHO 2000). These were not
explicitly examined in this PhD study, though the intent was to better understand our
participants. The participants did not mind answering the two ethnicity questions,
since they appreciated the differences between Aboriginal and Torres Strait Islander
peoples and that the questions were to be used to understand body composition, and
obesity.
A Critique of Smoking and Alcohol questions in the thesis
A brief summary of alcohol and cigarette smoking effects are summarised above in
Chapter 1.6.2. Briefly, the chronic consumption of high quantities of alcohol was
related to suppressed lipid oxidation, weight gain and obesity (Suter et al. 1997); a
higher basal metabolic rate and appetite suppression was reported among current
78
smokers (Moffatt et al. 1991); notably, the relationship of body size with these
lifestyle factors is complex to measure, and difficult to capture in cross-sectional
studies (Suter et al. 1997). The purpose of the thesis study was to describe in detail,
and for the first time, the body composition of adult Indigenous Australian
participants. Since there were no previously described detailed body composition
studies available for large numbers of adult Aboriginal or Torres Strait Islander
peoples, the investigator felt it was necessary for the feasibility of the study to focus
the study design on body composition measures, rather than perform a
comprehensive assessment of alcohol and tobacco use. Categorical questions
(yes/no) for tobacco and alcohol use were asked of participants in both The eGFR
Study and the Healthy Top-Enders’ study. A more detailed assessment of tobacco
and alcohol use was not feasible within the study design, which as it stood involved a
large amount of time given voluntarily by each participant. Differences in body
composition were not assessed by alcohol use or volumes consumed, or by years of
tobacco use. Longitudinal changes in body composition related to tobacco and
alcohol use were not examined in the current analysis, but may be investigated in
future research studies.
2.3.5. Anthropometry
2.3.5.1. Operators
Six trained research staff performed anthropometry assessments in The eGFR Study.
Two research staff (including JH) attended an International Standards for
Anthropometric Assessment course delivered by an exercise physiologist from the
Australian Institute of Sport (May 2008). These two research officers were
responsible for supervision, support and training of the additional staff. Periodic
inter-operator variability studies were performed between all research staff
conducting anthropometry. For The eGFR study, the maximum inter-operator
differences, in circumference measurements, were as follows: waist 3.1%; hip 2.1%.
The data collection form for The eGFR Study is included in Appendix 2.
79
2.3.5.2. Participants
Participants were asked to void early in the study appointment, and assessed in light
weight clothing, and without shoes. Height was measured with a fixed stadiometer
to the nearest 0.1cm, with the participant standing with heels together, and head in
the Frankfurt plane. Weight was measured on a portable digital scale (Seca digital
portable scale, Model 767 and 841, Seca Deutschland, Hamburg, Germany) to the
nearest 0.1kg. A mean of two measures was used for analysis. A third measure was
taken if the first two readings differed at all, and a mean of the three measures was
then used. Body mass index (BMI) was calculated as weight (kg) divided by height
squared (in metres).
The waist circumference was measured at the position midway between the most
inferior ribs and most superior iliac crest in the mid-axillary line (Callaway et al.
1988; Harrison et al. 1988). A 2-metre non-stretch flexible steel measuring tape
(Model W606PM Lufkin, Texas, USA) was placed in a horizontal plane to record
circumferences at the end of normal expiration for waist to the nearest 0.1cm. Hip
circumference was identified from the side as the widest projection over the buttocks
below the iliac crest (Callaway et al. 1988). If an enlarged peritoneal fold was
present, the hip circumference was taken underneath this. If the first two
measurements of either waist circumference or hip circumference differed by more
than 1.0cm, then a third measurement was taken for waist or hip as relevant. Waist:
hip ratio was calculated as waist circumference divided by hip circumference.
2.3.6. Bioelectrical Impedance Analysis
Due to the vast distances between assessment sites in the eGFR Study, and timetable
of assessment teams, two bioelectrical impedance analysis devices were used. These
were either a multi-frequency bioelectrical impedance spectroscopy device (BIS,
Model SFB7, ‘selected frequency bioimpedance’ 7 , Impedimed, Brisbane) or a
single frequency (50 kHz) bio-impedance device (BIA) was used (Model DF50,
Impedimed, Brisbane).
In The eGFR Study, only resistance, measured at 50 kHz was utilised in the current
analysis. The same protocol for measuring bioelectrical impedance analysis was
80
used regardless of the type of BIA device. BIA or BIS was not performed if a
participant had an indwelling cardiac device. Personal preparations were taken in all
participants. Each person voided prior to the bioelectrical impedance assessment.
All metal objects and shoes and socks were removed. Each person lay supine for a
minimum of 5 mins (and maximum 10 minutes) before the test. The arms and legs
were abducted to minimise skin touching. The skin at the electrode sites was
cleansed with an alcohol wipe to remove dust and oils, and allow drying before
applying the electrode dots. Eight electrodes (electrocardiograph-style gel
electrodes) were placed in a tetra-polar arrangement, as previously described
(Cornish et al. 1999). At the wrist, the proximal electrode was placed in the midline
of the wrist at the level of the ulnar styloid process. The distal electrode was placed
5 cm distal to the proximal electrode. At the ankle, the proximal electrode was
placed at the midpoint between the medial and lateral malleoli and the distal
electrode was placed 5 cm distal to the proximal electrode.
Whole body impedance measurements were recorded. An 800 uA excitation current
across 100 frequencies (from low to high frequency) were used in the bioelectrical
impedance spectroscopy device. The BIS device stores resistance, reactance,
impedance and phase angle over multiple frequencies. In the analysis of eGFR
Study participants in this thesis, resistance measured at 50 kHz frequency was
extracted using the Impedimed SFB7 Multi-Frequency Analysis software package
(version 5.4.4.0). An 800 uA excitation current at a single high frequency (50 kHz)
was used for the bioelectrical impedance analysis (BIA) assessment. Resistance,
reactance, impedance and phase angle were transcribed onto the data collection form
(see Appendix 2), and then transferred to a Microsoft access database for storage and
analysis.
2.3.7. eGFR Study Body Composition Sub-Study: Whole Body DXA Assessments
2.3.7.1. Whole Body DXA, Darwin
The whole body DXA assessment was a sub-study designed to determine the
accuracy of portable tools of body composition (bioimpedance). All DXA studies in
81
the Northern Territory were performed in Darwin on a single Norland XR46 whole
body scanning device (Norland XR46, Cooper Surgical Co., Fort Atkinson, WI,
USA). All scans were performed by a trained operator. Scan analysis was
performed by the study investigator (JH) using the Illuminatus software (version
4.2.4a). Standard positioning of participants was observed at each scan. Scans were
performed in light weight non-restrictive clothing, and after voiding. Females wore a
lycra and Velcro ‘boob-tube’ over the gown to minimise spread (but not constriction)
of breast tissue to overlap the upper limbs, so that trunk and upper limb soft tissue
was clearly demarcated. In-vivo precision is affected by inherent system errors,
operator technique, and the in-vivo nature of the measurement. We achieved best
precision by performing a daily calibration of the instrument for bone mineral and
soft tissue using phantoms, and using three trained operators at the Darwin site (JH
supervised training of MN and SG), and one trained operator at the Thursday island
site (JM). We used consistent positioning protocols, which were jointly designed by
JH and JM prior to performing whole body DXA at both sites. The coefficient of
variation for Norland whole body DXA over a three month period was 0.79% and
0.48% for fat and lean mass respectively.
Participants completed a single whole body scan. Participants lay supine on the
examining table with vertex (head) in the middle of the scan width. As much as
scan-width permitted arms were abducted from the torso. Legs were not abducted.
To avoid movement artefact by eversion of the feet during the scan, and for client
comfort, the feet were secured at the lower third of the foot in neutral position by a
non-opaque strap.
Scan regions were defined as per Norland specifications: Norland Illuminatus DXA
Operators Guide 2000-2007. 434D142 Rev. G. This allowed analysis of whole body
bone mineral content, lean tissue mass and fat mass for the following 8 body regions
shown by Figure 2.1: head, chest, mid-riff, pelvis, left and right upper limb and left
and right lower limb. The trunk region encompasses the combined regions of the
chest, midriff and pelvis.
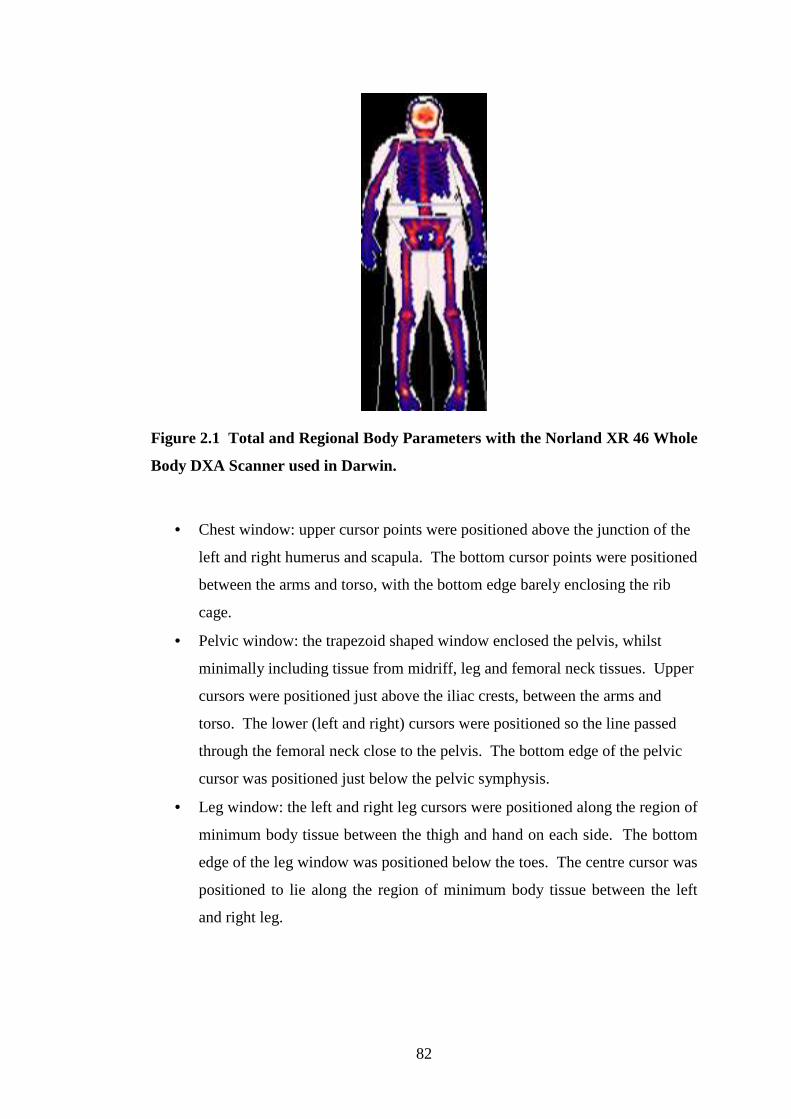
82
Figure 2.1 Total and Regional Body Parameters with the Norland XR 46 Whole
Body DXA Scanner used in Darwin.
• Chest window: upper cursor points were positioned above the junction of the
left and right humerus and scapula. The bottom cursor points were positioned
between the arms and torso, with the bottom edge barely enclosing the rib
cage.
• Pelvic window: the trapezoid shaped window enclosed the pelvis, whilst
minimally including tissue from midriff, leg and femoral neck tissues. Upper
cursors were positioned just above the iliac crests, between the arms and
torso. The lower (left and right) cursors were positioned so the line passed
through the femoral neck close to the pelvis. The bottom edge of the pelvic
cursor was positioned just below the pelvic symphysis.
• Leg window: the left and right leg cursors were positioned along the region of
minimum body tissue between the thigh and hand on each side. The bottom
edge of the leg window was positioned below the toes. The centre cursor was
positioned to lie along the region of minimum body tissue between the left
and right leg.
83
Body Proportions
Body proportions and limb measurements were made using the “ruler tool” function
of the Norland software (reporting at 0.1mm accuracy), using easily identified bone
landmarks (Abrahamyan et al. 2008). These measurements were chosen because of
their good visibility on DXA scan images.
Leg-length (mm): a straight-line distance between two horizontal lines marking the
most proximal and distal landmarks of the leg-length was used. The proximal
landmark was the most superior aspect of the greater trochanter. The inferior
landmark was the most inferior part of the malleolus.
Trunk-Length (mm): was defined as standing height minus leg-length (defined
above).
Tibia length (mm): a straight line distance from the joint space of the knee and the
most inferior part of the malleolus.
Femur length (mm): a straight line distance between the most superior aspect of the
greater trochanter and the knee joint space.
Pelvis width (mm): the distance between the most superior aspect of the left and
right greater trochanter.
Shoulder width (mm): shoulder width was described by the distance between the
most lateral aspect of the left and right acromium.
Upper Arm Length (mm): the proximal aspect of the upper arm was the most
lateral aspect of the acromium (used to describe shoulder width). The midpoint of
the widest distance between the medial and lateral epicondyle of the humerus was
used to demarcate the most inferior portion of the upper arm, and most superior
aspect of the forearm.
Forearm length (mm): the proximal aspect of the forearm was described above in
upper arm length. The distal aspect of the forearm is marked by the horizontal line
between the ulnar styloid and carpal joints of the wrist.
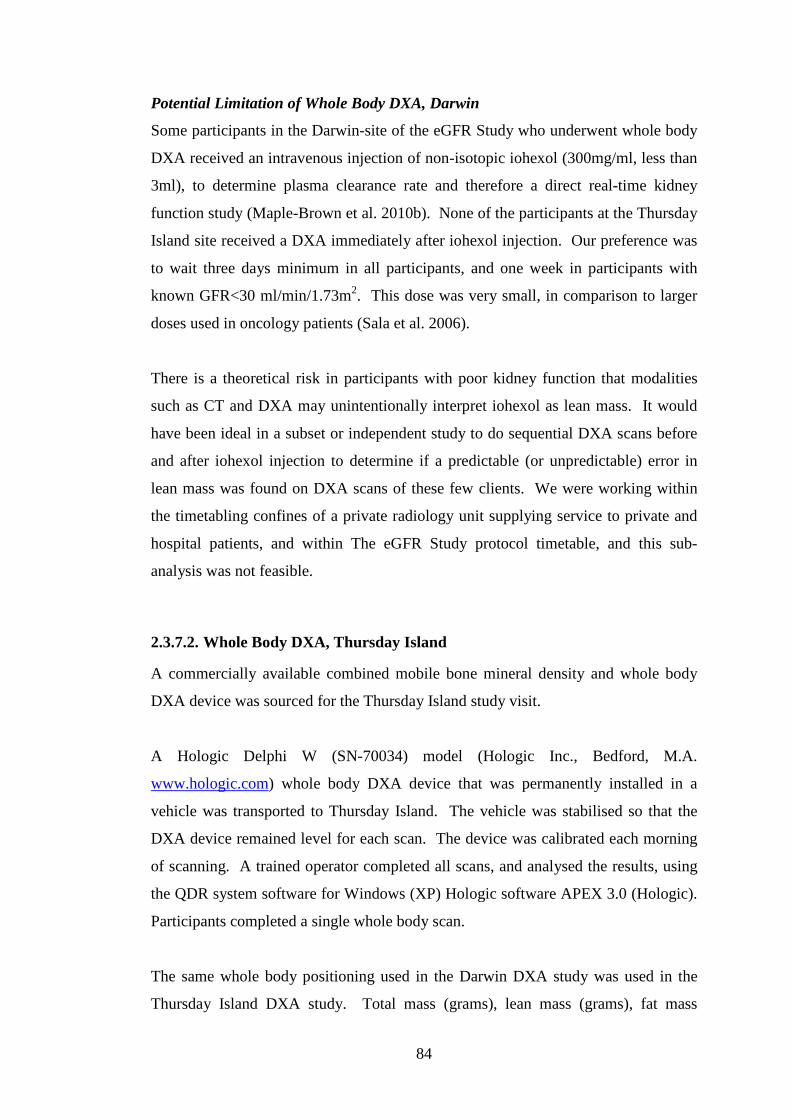
84
Potential Limitation of Whole Body DXA, Darwin
Some participants in the Darwin-site of the eGFR Study who underwent whole body
DXA received an intravenous injection of non-isotopic iohexol (300mg/ml, less than
3ml), to determine plasma clearance rate and therefore a direct real-time kidney
function study (Maple-Brown et al. 2010b). None of the participants at the Thursday
Island site received a DXA immediately after iohexol injection. Our preference was
to wait three days minimum in all participants, and one week in participants with
known GFR<30 ml/min/1.73m2. This dose was very small, in comparison to larger
doses used in oncology patients (Sala et al. 2006).
There is a theoretical risk in participants with poor kidney function that modalities
such as CT and DXA may unintentionally interpret iohexol as lean mass. It would
have been ideal in a subset or independent study to do sequential DXA scans before
and after iohexol injection to determine if a predictable (or unpredictable) error in
lean mass was found on DXA scans of these few clients. We were working within
the timetabling confines of a private radiology unit supplying service to private and
hospital patients, and within The eGFR Study protocol timetable, and this sub-
analysis was not feasible.
2.3.7.2. Whole Body DXA, Thursday Island
A commercially available combined mobile bone mineral density and whole body
DXA device was sourced for the Thursday Island study visit.
A Hologic Delphi W (SN-70034) model (Hologic Inc., Bedford, M.A.
www.hologic.com) whole body DXA device that was permanently installed in a
vehicle was transported to Thursday Island. The vehicle was stabilised so that the
DXA device remained level for each scan. The device was calibrated each morning
of scanning. A trained operator completed all scans, and analysed the results, using
the QDR system software for Windows (XP) Hologic software APEX 3.0 (Hologic).
Participants completed a single whole body scan.
The same whole body positioning used in the Darwin DXA study was used in the
Thursday Island DXA study. Total mass (grams), lean mass (grams), fat mass
85
(grams) and fat percent was calculated for the whole body and for individual regions
of interest. These whole body regions were the head, upper limbs, lower limbs, and
trunk, as shown in Figure 2.2.
Figure 2.2 Total and Regional Body Parameters with Hologic Whole Body DXA
(Thursday Island Study Site)
Upon analysis the software places a matrix over the body for regional analysis. The
operator defines the placement of these lines:
• Head: immediately below the mandible,
• Trunk: enclosing the chest, midriff and pelvis.
• Left and right upper limbs: the line was placed medial to the head of
the humerus.
• Left and right legs: a line joins the outside of the thigh through to the
middle of both legs by being placed through the femoral neck and
lateral to the pubic ramus.
Body Proportions
A ruler tool function in the Hologic software was not available to the investigator at
the later time of data analysis. PDF printouts of each participant’s whole body DXA
scan were evaluated for body proportions. A single analyst (JH) measured the
following body proportions with a ruler to the nearest 0.1cm. Data were converted to
86
proportion of height by comparing measured standing height with body length from
the PDF printout.
The measurement methods for leg-length, trunk-length, pelvis-width, shoulder-width,
upper arm length and forearm length, were the same as described for body
proportions measured on the Norland DXA instrument. Variations to measurement
in the Hologic study are as follows:
Hologic body length: vertex of head to the most inferior part of the malleolus or
joint margin if the malleolus was not visible.
2.4. Healthy Top-Enders’ Study
The Healthy Top-Enders’ study was designed and conducted in Darwin, the capital
city of the Northern Territory. The purpose was to determine ethnicity-dependent
differences in a young general population; hence young adults participating in elite
sporting programs, as well as pregnant women were excluded. Fifty-six adults (aged
17 to 25 years old), who were matched for age, gender and body mass index
completed a detailed health, body composition and inflammatory cytokine
assessment during October 2009 and May 2010. The Healthy Top-Enders’ study
provides a healthy baseline of body composition, and assesses the relationships
between inflammatory markers, total adiposity and abdominal fat partitioning.
Abdominal computed tomography (the criterion model of abdominal fat partitioning
in the study), whole body DXA and bioelectrical impedance analysis were
performed. Fasting blood samples (measuring a range of parameters including
glucose and insulin, C-reactive protein (CRP), interleukin-6 (IL-6), resistin, and
leptin, adiponectin, and high molecular weight (HMW) adiponectin) were collected.
Insulin resistance was assessed by fasting glucose and insulin levels and HOMA
score. In the thesis, the HOMA-IR score (Matthews et al. 1985), is here-after
referred to as HOMA, and was defined as
= (fasting glucose, mmol/L x fasting insulin, mU/L)/22.5.
87
The relationship of total and regional adiposity with inflammatory markers and
cytokines was assessed.
I was the Principal Investigator in The Healthy Top-Enders’ study and was
responsible for development of the protocol, obtaining human research ethics
committee approval, community consultation and gaining support from the
community. I trained an Indigenous research assistant (SG) to assist with completion
of the detailed assessment protocol. I was also responsible for overseeing
development of an Access database, procedures for data collection, data storage and
data analysis.
Most of the body composition assessments in The eGFR Study and Healthy Top-
Enders’ study have the same protocols to allow for comparisons between studies.
Any variation to the methodology of the Healthy Top-Enders’ study has been
described below.
2.4.1. Participants
Volunteering and consenting Indigenous Australians and non-Indigenous Australians
aged at least 16 years and to maximum of 25 years were invited to participate. Each
participant was required to be healthy, by self report, and not pregnant or
breastfeeding. Health status was further evaluated in the protocol by blood pressure,
urinalysis, and fasting blood tests (described below). Specific exclusion criteria
beyond ethnic identity and age were chronic medical illnesses including pacemaker,
anticoagulation for rheumatic heart disease, type 1 or type 2 diabetes, kidney
impairment, peripheral vascular disease and cerebrovascular disease.
Indigenous Australians were accepted to the study if they self-identified as an
Aboriginal person. As much as possible we recruited Aboriginal participants with 4
grandparents who identified as an Aboriginal person, and where possible, remote
living Aboriginal participants who were in Darwin (for school or employment), or
identified with a homeland region. Torres Strait Islander people who identified as
only-Torres Strait Islander were excluded. Two participants identified as both
88
Aboriginal and Torres Strait Islander, and each had only 1 grandparent who
identified as a Torres Strait Islander. Aboriginal participants were recruited and
assessed first. Self-identifying non-Indigenous participants were recruited and
matched to Aboriginal participants by gender and body mass index. Non-Indigenous
participants were recruited if they had 4 grandparents who identified as Caucasian.
Fifty-six adults completed the assessments for the Healthy Top-Enders’ study. Data
are presented in Chapter 3 and Chapter 4 for 52 participants. Three Aboriginal males
with high BMI (including two with newly diagnosed diabetes as a result of the study
assessment) were unable to be matched for BMI with non-Indigenous males, and
were therefore not included in the analysis. One non-Indigenous female with a high
BMI that was unable to be matched to an Aboriginal female was also excluded from
the analysis presented in Chapter 3 and Chapter 4.
The identified demographic for this study (age 16-25 years) was in transition from
child health services, and adult health services. Many of the clients did not have a
dedicated primary health care practitioner. There was no single centre where young
people congregate to learn information about the study. The target age group
included young people either at high school or other further education, engaged in
the workplace or training programs or unemployed people.
Recruitment relied upon several strategies. This included word of mouth, posters
and launch of the study in the Indigenous academic unit of the Charles Darwin
University. Community facilitators were employed to assist with making contact
with potential Aboriginal participants, and assisted with translation if required. We
actively liaised with Aboriginal communities in the Darwin region, Centrelink,
Indigenous Employment and Housing organisations, meeting with young people in
shopping centres, and recruited from a high school with a community-based boarding
program for remote Indigenous students. We wanted to assess health and body
composition in young adults who were non-elite athletes. We did not recruit from
top-tier sporting organisations.
89
2.4.2. Ethics
Ethics approval for the Healthy Top-Enders’ study (application reference number
09/69) was provided by the Human Research Ethics committee (HREC) of the
Northern Territory Department of Health and Families and Menzies School of Health
Research, Darwin. Both the main ethics committee and the Aboriginal subcommittee
of the Human Research Ethics Committee (which has the power of veto over
applications concerning Aboriginal and Torres Strait Islander people) provided their
approval.
2.4.3. Clinical Assessments
Individuals were approached by the research officers to consider participation in the
study. Informed consent was obtained, and participants were provided with
information to fast for a minimum 10 hours (and maximum 12 hours) overnight in
preparation for a fasting blood test the following morning.
Medical history and medications were self-reported by participants, and where
possible, confirmed by medical chart review. A questionnaire was administered by a
trained research officer in English (attached at Appendix 3), and included
demographic information, self-identified ethnicity of self and 4 grandparents and
health behaviours. Female participants also consented to urine pregnancy testing
(qualitative human chorionic gonadotrophin test) to confirm they were not pregnant.
Blood pressure was measured in the Healthy Top-Enders’ study using the same
protocol described for blood pressure in The eGFR Study.
2.4.4. Biochemical Analyses
Venepuncture was performed after a minimum 10 hour overnight fast into seven
vacutainers containing EDTA, fluoride, lithium heparin and plain (serum). Tubes
were kept on ice and then centrifuged within 1 hour. An urgent courier service to a
commercial laboratory (Westerns Diagnostic Pathology, Winnellie Darwin, NT) was
routine to avoid deterioration in specific samples (insulin and PTH). Serum for
90
inflammatory cytokines was stored at Menzies in a minus 80 degree freezer. This
protocol is described below.
The following biochemical analyses were performed by Westerns Diagnostic
Pathology, a commercial laboratory in Darwin.
Glucose was analysed by enzymatic reference method with hexokinase on a Cobas
Integra 800 machine using serum. Insulin was analysed with chemiluminesence
immunometric assay on a Siemens Immunlite 2000 Xpi machine using serum.
HbA1c was assayed using turbidimetric inhibition immunoassay (TINIA) for
haemolysed whole blood on a Cobas Integra 800 machine using EDTA whole blood.
Electrolytes (urea, creatinine, sodium and potassium), albumin, total protein, and
lipids (total cholesterol, triglycerides, HDL-cholesterol and LDL-cholesterol) were
measured on a Cobas Integra 800 machine using serum.
Urea was measured using kinetic test with urease and glutamate dehydrogenase.
Creatinine was measured using buffered kinetic Jaffe reaction without
deproteinization. Sodium and potassium were measured using ion-selective
electrodes using undiluted specimens. Albumin was measured using colorimetric
assay with endpoint method. Total protein was measured using colorimetric assay.
Total cholesterol, triglycerides, HDL-cholesterol and LDL-cholesterol was measured
using enzymatic colorimetric tests. High sensitivity C-reactive protein (CRP) was
measured by latex enhanced nephelometric assay on a Beckman Immage device
using serum.
Urine albumin was measured by immunoturbidimetric assay on a Cobas Integra 800
instrument. Urine creatinine was also analysed on a Cobas Integra 800 instrument by
the buffered kinetic Jaffe reaction without deproteinization principle. Albumin to
creatinine ratio in urine was calculated as urine albumin divided by urine creatinine
(mg/mmol).
Plasma and serum samples that were retained at Menzies School of Health Research
for analysis at a later date were centrifuged at 3000 RPM for 10 minutes by the
91
investigator (JH), then aliquotted in a class II biosafety cabinet into separate
cryovials, then stored in a minus 80 degree freezer with corresponding urine samples.
The following analyses were conducted at Menzies School of Health Research by an
experienced scientist (Ms Kim Piera). Human serum IL-6 (catalogue number:
DY206), leptin (catalogue number: DY398), resistin (catalogue number: DY1359),
and total adiponectin (catalogue number: DY1065) were assayed using an R&D
Systems Duoset ELISA kit (R&D Systems, Inc. Minneapolis). High molecular
weight adiponectin was assayed on an ALPCO multimeric ELISA kit (ALPCO
Diagnostics, Salem US Catalogue Number: 47-ADPHU-E01 version ALPCO
6/1/2010). High sensitivity IL-6 (catalogue Number: HS600B) was also assayed on a
Quantikine High Sensitivity ELISA (R & D systems, Minneapolis) as a number of
Healthy Top-Enders’ study participants had IL-6 levels that were below detectable
limits using the R&D Duoset ELISA kit. In our laboratory, the coefficient of
variation for leptin, adiponectin and HMW adiponectin were: 0.09, 0.10, and 0.08
respectively.
Twice thawed serum was used for all of the above assays. The method for the initial
thaw involved is as follows. Several serum tubes were thawed on ice at a time (over
5 minutes maximum). Tubes were inverted twice to mix, and then flicked to settle
serum in the lid prior to aliquotting (which took approximately 30 seconds per
sample). Tubes were then returned to the minus 80 degree freezer and thawed just
prior to testing at a subsequent date.
2.4.5. Anthropometry
The protocol for anthropometry was the same in both studies. A single experienced
operator performed all of the waist and hip circumferences in this study (JH). The
data collection form for the Healthy Top-Enders’ study is attached in Appendix 4.
2.4.6. Bioelectrical Impedance Analysis
Bioelectrical impedance analysis was used on all Healthy Top-Enders’ study
participants using the same protocol as those who completed BIA in The eGFR
92
Study. Whole body impedance measurements were recorded according to previously
described methods (Cornish et al. 1999).
2.4.7. Complex Body Composition Assessments
2.4.7.1. Whole Body DXA, Darwin
The same protocol employed in the eGFR Study for whole body DXA was used in
the Healthy Top-Enders’ study. Scanning was performed by a single trained operator
(research assistant SG). Analysis of all scans was performed by a single investigator
(JH). The same methodology for the measurement of body proportions in The eGFR
Study was also used in the Healthy Top-Enders’ study (see Chapter 2.3.7.1).
2.4.7.2. Computed Tomography
The methodology for computed tomography in the Healthy Top-Enders’ study is
reviewed in detail below. A further detailed description of the CT protocol is found
in Chapter 3.2. All scans were performed by a trained radiographer at the Darwin
Private Hospital, Darwin on the same day as the Healthy Top-Enders’ study protocol
using an Aquilion 16 (Toshiba, Japan) computed tomography scanner. The protocol
was written and provided by a collaborator (Penny Speight (PS), Radiographer and
Radiation Scientist, Diabetes Clinical Research Unit, St Vincent’s Hospital, Sydney)
who also provided local training and supervision of the protocol.
Participants wore light weight clothing, and were examined in the supine position.
Three scans were taken at the end of light expiration. A scout view was taken to
determine the reference points of each CT slice. Two cross sectional CT scans each
8 mm wide were performed, centred on the L2-L3, L4-L5 inter-vertebral disc spaces
to assess abdominal adipose tissue distribution.
Each scan was obtained at 120kv (peak), with a scanning time of 3 seconds duration
at arrested expiration (at the end of light expiration) and the majority were scanned
at 100mA. Some overweight participants were scanned at higher values including
two participants scanned at the maximum value of 350mA. Images were stored onto
93
CD and analysed by a single trained operator (PS) using a Gemini workstation (GXL
Host System; Phillips, the Netherlands) (Samocha-Bonet et al. 2010). In each scan
level of L2-L3 and L4-L5, the total adipose tissue area was measured by delineating
manually the outer abdominal wall and then calculating the pixel distribution in this
area with attenuation range –150 to –50 HU. The intra-abdominal region was
defined by encircling the intra-abdominal cavity at the innermost aspect of the
abdominal and oblique muscle walls surrounding the cavity and the posterior aspect
of the vertebral body. The encircled area with attenuation range –150 to –50 HU
was then calculated by the computed and taken as the intra-abdominal fat area (IAF)
or visceral fat area (VFA). The subcutaneous fat area (SFA) was then calculated by
subtracting the IAF area from the total adipose tissue area (TFA). Adipose area was
calculated in mm2 by the scanner-software, and divided by 100 to convert to cm2.
Total abdominal fat area, subcutaneous fat area and visceral fat area were reported at
the level of L2-L3 and L4-L5. Sagittal abdominal diameter (SAD) of the abdomen
(mm) was measured on the frozen CT image at inter-vertebral space of L2-L3 and
L4-L5 in expiration.
The data was returned to the investigators in a secure spreadsheet after each scan,
and stored securely in the Healthy Top-Enders’ study Microsoft Access database at
Menzies School of Health Research.
2.5. Statistical Analyses
Statistical methods will be described in detail in each of the results Chapters (found
in Chapters 3.2.3, 4.2.4, 5.2.4, and 6.2.4). Data recorded onto data collection forms
were transcribed into an Access database. Data was analysed using STATA v10.0
(Stata Corporation, TX, USA). A summary of descriptive statistics are provided in
Chapter 3.3, Chapter 4.3, Chapter 5.3, and Chapter 6.3), followed by tests of
bivariate associations, and then multiple regression analyses.
Hypothesis testing in the thesis
In the PhD thesis a statistically significant difference between groups was considered
for p values <0.05. In Chapter 3 and Chapter 4, due to smaller numbers of
participants (compared with Chapter 5 and Chapter 6), statistically significant values
94
were considered when the p values were <0.05. In Chapter 5 and Chapter 6, whilst
the overall numbers of participants were larger, several subgroups existed within the
respective cohorts. Hence in Chapter 5 and Chapter 6, a stronger statistically
significant relationship was considered if p values were <0.01.
Model building, selection of variables and testing for interactions between pairs
of variables.
In the thesis, multiple regression analyses were performed using a backwards
selection process. An initial model was built with all predictor variables (if clinically
indicated to be associated or if a strong relationship with the outcome variable was
demonstrated by bivariate analysis (by p value <0.05 and r value >0.8)). Predictor
variables were retained in the regression model if they were not highly inter-
correlated with other predictor variables using the variance of inflation test. Using a
stepwise backwards process, the final significant model was obtained by removing
one variable at a time if its main effect in the model had a p-value >0.05, and the
likelihood ratio test for exclusion of the variable from the model was p>0.05. This
process continued until the final model demonstrated all predictor variables with p
value <0.05. The final assessment of the multiple regression models included an
assessment of first-order interactions between all pairs of variables in the final
model. All pairs of variables were tested for first order interactions (even if not
biologically plausible). The interaction term was retained in the final model if it was
biologically plausible (such as in Chapter 3 and Chapter 6).
Issue of multiple comparisons and statistical power
Two different cohorts are described in the thesis study. The Healthy Top-Enders’s
study cohort were carefully recruited to be matched for age, gender, body mass
index, and health, and a specified criteria for ethnicity. This contrasts with
participants within The eGFR Study: who had a wider age range, may have been
healthy or had complex medical issues, lived in different geographical settings, and
again a specified criteria for ethnicity. Bivariate relationships were examined in all
chapters of the thesis, however the strength of their associations are often
confounded by unmeasured variables, and hence further tests were performed. An
analysis of covariance (ANCOVA) was used in the Healthy Top-Enders’ study when
examining differences in skeletal proportions (Chapter 3) and adiponectin
95
concentrations (Chapter 4). The intention of The eGFR Study was to examine if
differences exist between Aboriginal participants and Torres Strait Islander
participants, rather than demonstrate absolute differences between groups. Hence
data was presented as unadjusted observed means, with an analysis of covariance to
indicate when differences may be influenced by gender, ethnicity or the interaction
term in Chapter 5. In the ANCOVA, at the level of statistical significance of p=0.05,
there is an expectation that one in twenty comparisons between an exposure and the
outcome would be statistically significant, even if no association between the
exposure and outcome variable exists. Therefore, the main effect of the exposure
variable was more strongly regarded when the p value was <0.01 than comparisons
with p values closer to 0.05.
In Chapter 6; an analysis of covariance was initially performed to examine the main
effect of ethnicity, gender , the ethnicity*gender interaction term and kidney function
(as a continuous variable) on adiponectin concentrations in the whole cohort. As the
main effect of ethnicity*gender or ethnicity was non-significant, subgroup analysis
was not performed (by strata of kidney function- which is another way that kidney
function can be described). Sub-group analyses are likely to be non-significant if the
main effect is not significant in the overall population, and any significant results
should be regarded with caution in this instance. In the Chapter 6 cohort, several
potential subgroups existed (gender, ethnicity, strata of kidney function), and there
were low and unequal numbers of participants in some of the subgroups to be
examined- hence an analysis of covariance is not permitted in this setting. A
Bonferroni correction for multiple comparisons was not used in this instance, as a
multifactorial analysis method is preferred if unequal groups exist, there are multiple
subgroups and as the Bonferroni method is overly conservative with respect to
detecting differences between groups. Instead differences in adiponectin
concentrations were examined with a multifactorial analysis (a multivariate
regression model). The issue of multiple comparisons in the multiple regression
analysis models was dealt with by addressing the number of variables used in the
initial model (fewer than 10 variables were examined), and the p-value of the main
effects in the final model. At the level of statistical significance of p<0.05, the
expectation of a Type 1 error is 1/20. In the analysis, the expectation of a Type 1
error is expected to be <1, due to selection of only 10 variables (i.e. fewer than 20

96
variables) in the initial multiple regression model. In the final multiple regression
model, the final model was accepted if each of the main effects had p-values <0.01.
Post test analysis for normality of residuals and assessment for interactions between
pairs of predictor variables and leverage and undue influence in the final model.
Chapter 3. Healthy Top-Enders’ Study:
Body Composition and
Skeletal Proportions in
Healthy Adult Aboriginal People
98
3.1. Introduction
Obesity and overweight are highly prevalent among Indigenous and non-Indigenous
Australians (AIHW 2011). Obesity has also been linked to the development of
several chronic diseases, including type 2 diabetes, vascular disease, kidney failure
and some cancers (WHO 2000). Accurately assessing body composition among
Aboriginal people has been limited due to the geographic dispersal of many
Aboriginal people, and the limited portability of sophisticated body composition
tools. Indirect and portable body composition methods such as height and weight,
body circumferences, skin-fold thicknesses and bioelectrical impedance analysis
have been used in community surveys (Kondalsamy-Chennakesavan et al. 2008;
Piers et al. 2003; Rutishauser et al. 1986). However, these methods have not been
validated against whole body dual energy x-ray absorptiometry (DXA).
Aim
The aim of this study was to (a) accurately describe skeletal proportions and body
composition, and (b) accurately predict body composition in healthy young adult
Aboriginal people using methods that can be easily used in field settings.
3.2. Methods
3.2.1. Participants and Measurments
The methods for this study have been previously described in detail in Chapter 2.4.
Healthy young adults (16-25 years old) were approached to participate in the Healthy
Top-Enders’ study. Ethnicity was self-identified, and Aboriginal participants were
recruited first, with non-Indigenous participants recruited to be matched for age
(within 1 year), gender, and body mass index (± 1.5 kg/m2). Participants fasted for
10 hours, and assessments commenced at 8 am the following morning with a fasting
blood test, mid stream urinalysis, and body composition assessments. All
measurements were performed in standard light-weight clothing. These included
height (0.1 cm), weight (0.1 kg), waist (0.1 cm) and hip (0.1 cm) circumferences.
Resistance (R) was measured by bioelectrical impedance analysis using a tetra-polar
99
electrode arrangement recorded on a selected frequency bioimpedance device (SFB)
(Impedimed, Brisbane) at 50 kHz while the participant lay supine, and observed
standard preparations (see Chapter 2.3.6).
3.2.2. Dual Energy X-ray Absorptiometry
Participants also completed a whole body dual energy x-ray absorptiometry scan
(DXA) (see Chapter 2.3.7.1). Fat mass, fat percent, lean tissue mass (referring to
non-bone non-adipose tissue mass) and bone mineral content was reported by the
Norland XR 46 whole body composition scanner. Midriff fat refers to fat measured
in the space bordered by horizontal lines between the lowermost ribs, and iliac
spines, extending laterally out to the margin of soft tissue in the abdomen (shown in
Figure 2.1). Body regions were described as trunk (non-appendicular, and
encompasses the DXA regions of interest in the chest, midriff and pelvis described in
Chapter 2.3.7.1), and peripheral (appendicular, encompassing the regions of the
upper and lower limbs). Fat free mass (FFM) was calculated as body weight minus
fat mass recorded by the Norland software. Peripheral lean tissue mass refers to the
sum of lean mass (non-bone non-adipose mass) of the four limbs. Trunk lean mass
refers to the total lean mass minus the sum of head lean mass and peripheral lean
mass.
Skeletal proportions were determined from Norland XR 46 ruler tool software using
easily defined bony landmarks (Abrahamyan et al. 2008), and are depicted in the
graphic below (Figure 3.1). Detailed measurements of skeletal proportions are
described in Chapter 2.3.7.1. Leg length, tibia length, femur length, pelvis-width,
shoulder-width, upper arm length and forearm length was measured using the DXA
ruler tool software (in millimetres), and converted to centimetres for analysis.
Trunk-length was reported in centimetres, as the difference between standing height
and leg-length measured by DXA ruler tool. Skeletal proportions were also
expressed as length’s adjusted for body height (e.g. leg length%= [leg-length
(cm)/height (cm)x 100]).
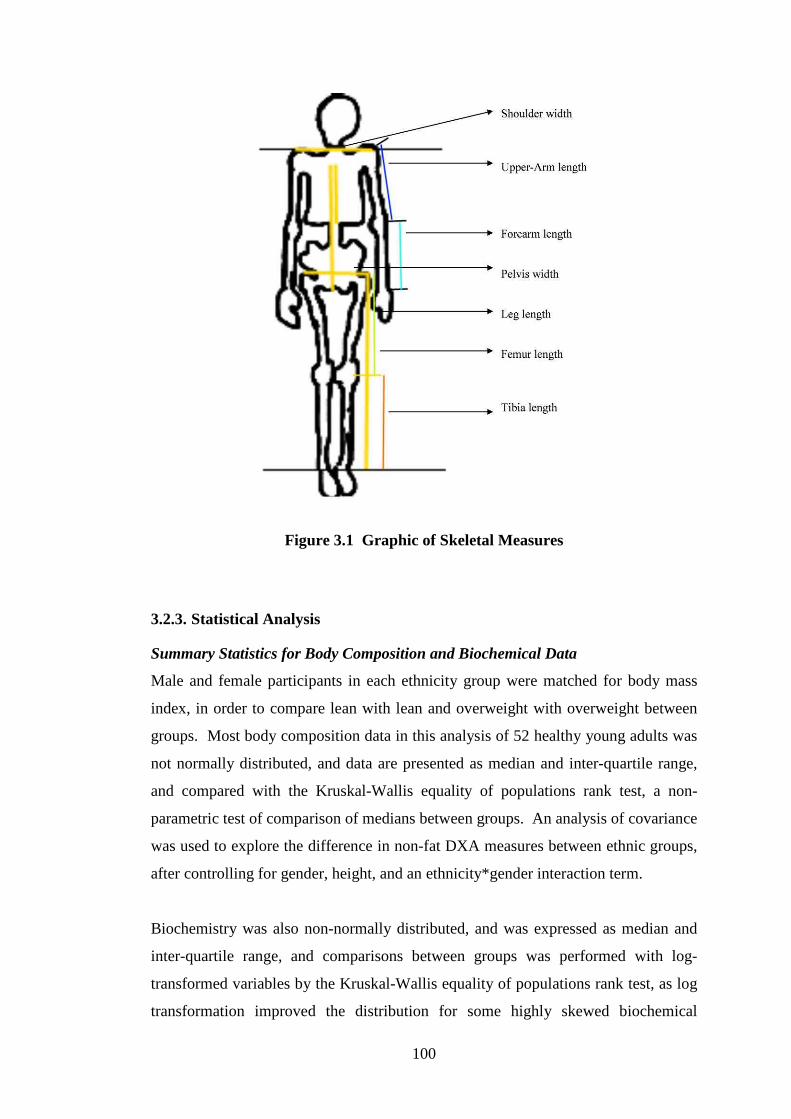
100
Figure 3.1 Graphic of Skeletal Measures
3.2.3. Statistical Analysis
Summary Statistics for Body Composition and Biochemical Data
Male and female participants in each ethnicity group were matched for body mass
index, in order to compare lean with lean and overweight with overweight between
groups. Most body composition data in this analysis of 52 healthy young adults was
not normally distributed, and data are presented as median and inter-quartile range,
and compared with the Kruskal-Wallis equality of populations rank test, a non-
parametric test of comparison of medians between groups. An analysis of covariance
was used to explore the difference in non-fat DXA measures between ethnic groups,
after controlling for gender, height, and an ethnicity*gender interaction term.
Biochemistry was also non-normally distributed, and was expressed as median and
inter-quartile range, and comparisons between groups was performed with log-
transformed variables by the Kruskal-Wallis equality of populations rank test, as log
transformation improved the distribution for some highly skewed biochemical
101
variables (such as CRP and ACR). In each sex an analysis of covariance
(ANCOVA) was performed to examine for any differences in urinary albumin to
creatinine ratio with fat free mass as a covariate.
Comparison of Skeletal Proportions between Groups
Data on skeletal proportions (as length, or length as percentage of standing height)
were normally distributed, and presented as mean (standard deviation), and
compared with an analysis of covariance (ANCOVA) in Table 3.3
Factor Analysis of Body Composition Measures
Factor analysis was used to examine the clustering of variables around ethnicity, fat
and fat free mass in this cohort. The principal component method was used to reduce
the information in many measured variables into a smaller set of “factors.” Kaiser’s
criterion (eigen values >1) was used to determine the number of factors that best
described the underlying relationship among variables. The extracted factors were
rotated using the varimax rotation. Significant correlations were considered for
variables loading at ≥0.40.
Assessment of the Accuracy of published Prediction Equations of Fat Free Mass
using Bioelectrical Impedance Analysis
A number of published prediction equations for fat free mass based on bioelectrical
impedance analysis exist. Raw data from participants in this study were applied to
several previously published equations (and presented in Appendix Table 1). In
addition a Tanita bioelectrical impedance device was used to record fat free mass
when available. Participants stood on the electrode plates. An equation was not
available with this device, and data was printed out after each reading. Tanita fat
free mass (in kg) was assessed for agreement with measured fat free mass (by DXA)
in a similar method to other prediction equations. The tests of agreement included
analysis of distribution of differences between measured FFM (by DXA) and the
prediction equation, the Lin concordance correlation coefficient (Steichen et al.
1998), and a paired t-test of the measured FFM and predicted FFM (Bland 2000).
The ‘Lin concordance correlation coefficient’ (ρc) expresses an overall value for
agreement of two methods by assessing accuracy, precision and bias. Excellent
agreement is given by a ρc of close to 1.0, with narrow 95% confidence limits of the
102
statistic, and low p-value of the ρc statistic. The Lin coefficient (ρc) assesses error of
the prediction method by the correction of bias (C-b, where a value close to 1.0
indicates very low error), and produces a reduced major axis of the prediction
method which is compared against the reference method (DXA) which has a slope of
one, and intercept of zero (Steichen et al. 1998). Accuracy of the prediction method
(against the reference method, DXA) is depicted graphically by assessing
concordance of the reduced major axis to the 45 degree line of the reference method.
Any departure of the reduced major axis from the reference line indicates low
accuracy of the prediction method. Precision of the prediction method is assessed by
how closely individual measures are to the reduced major axis (Steichen et al. 1998).
Multivariate Analysis of Fat Free Mass in Participants
The goal was to determine a prediction equation of fat free mass (FFM) in
Aboriginal participants using portable tools which also included bioelectrical
impedance analysis. In all participants, multiple regression analysis with a
backwards selection of independent variables (which included gender, ethnicity,
anthropometric measures and skeletal proportions) was used to predict FFM
measured by whole body DXA (dependent variable). Selection of independent
variables was based on a statistically significant bivariate relationship between the
predictor variable and fat free mass (the outcome variable), where the r-value was
>0.8, and p value for this relationship was <0.05. Selection was also based on
clinical interpretation of the determinants of fat free mass, and variables that
clustered with fat free mass in the factor analysis. Variables were retained in the
model if they contributed low individual and mean variance inflation factor in the
model, had a statistically significant p value (p<0.05) or the likelihood-ratio test was
statistically significant (p<0.05) if the predictor variable was removed from the
model (Dupont 2009; Kirkwood et al. 2003; Long et al. 2006). Post-test analysis of
the regression model included analysis of residuals, assessing for all first-order
interactions between pairs of independent variables, and assessing the model for
undue leverage and Cook’s distance of individual participants with the independent
variable (Dupont 2009).
103
3.3. Results
3.3.1. Participant Characteristics: Healthy Top-Enders’ study
31 Aboriginal adults and 21 non-Indigenous adults matched for gender, age and body
mass index were assessed. All non-Indigenous participants reported four
grandparents who identified as non-Indigenous (of European background). Seventy-
four percent of Aboriginal participants (n=23) reported 4 grandparents who identified
as an Aboriginal person. Six Aboriginal participants (2 males, 4 females) reported 3
Aboriginal grandparents and one non-Indigenous (European) grandparent. Two
female participants reported 3 Aboriginal grandparents and one other grandparent a
(Japanese, and a both Aboriginal and Torres Strait Islander grandparent
respectively). One Aboriginal female reported 2 Aboriginal and 2 non-Indigenous
(European) grandparents. Two thirds of Aboriginal participants (68%) identified
with an Aboriginal community, which may have been within the Darwin area, or
other regions.
Cigarette smoking was common in Aboriginal participants (Aboriginal v Caucasian:
61% v 24%, p<0.01). Aboriginal males were slightly younger than non-Indigenous
males (19.3 v 22.0 years, p=0.04), though there was no difference in the age of
female participants (Aboriginal v Caucasian: 20.3 v 20.3 years, p=0.62).
3.3.2. Body Composition: Healthy Top-Enders’ study
A small and non-statistically significant difference in median BMI between
Aboriginal and non-Indigenous males is shown in Table 3.1 (2.2 kg/m2, p=0.27).
Despite no significant difference in total fat free mass, Aboriginal males had lower
trunk lean mass than non-Indigenous males (p=0.03). While not statistically
significant, despite similar WHR, Aboriginal males displayed a trend to lower total
fat mass (p=0.20) and fat percent (p=0.34) than non-Indigenous males.
In the whole cohort, fat free mass was positively associated with standing height
(r=0.85, p<0.0001), therefore comparison of body composition between groups were
also adjusted for height. Aboriginal males had a similar height as non-Indigenous
104
males (p>0.05). Aboriginal males had lower absolute bone mineral content (DXA-
BMC) and lower absolute trunk lean mass, however this failed to reach statistical
significance using analysis of covariance (ANCOVA), after adjustment for height
(BMC, p=0.26, trunk-lean mass, p=0.07).
Aboriginal females were 5.9 cm shorter than non-Indigenous females (p=0.003), and
had higher waist to hip ratio, midriff fat mass and higher ratio of trunk:peripheral fat
mass. DXA measures of fat mass were not related to height (p>0.05). Aboriginal
females had lower absolute measures of bone mineral content, fat free mass, trunk
lean mass, and lower ratio of trunk:peripheral lean mass than non-Indigenous
females. After adjusting for height, Aboriginal females had lower bone mass (0.27
kg, p=0.015), trunk-lean mass (2.2 kg, p=0.014), and trunk:peripheral lean mass ratio
(15%, p=0.002).
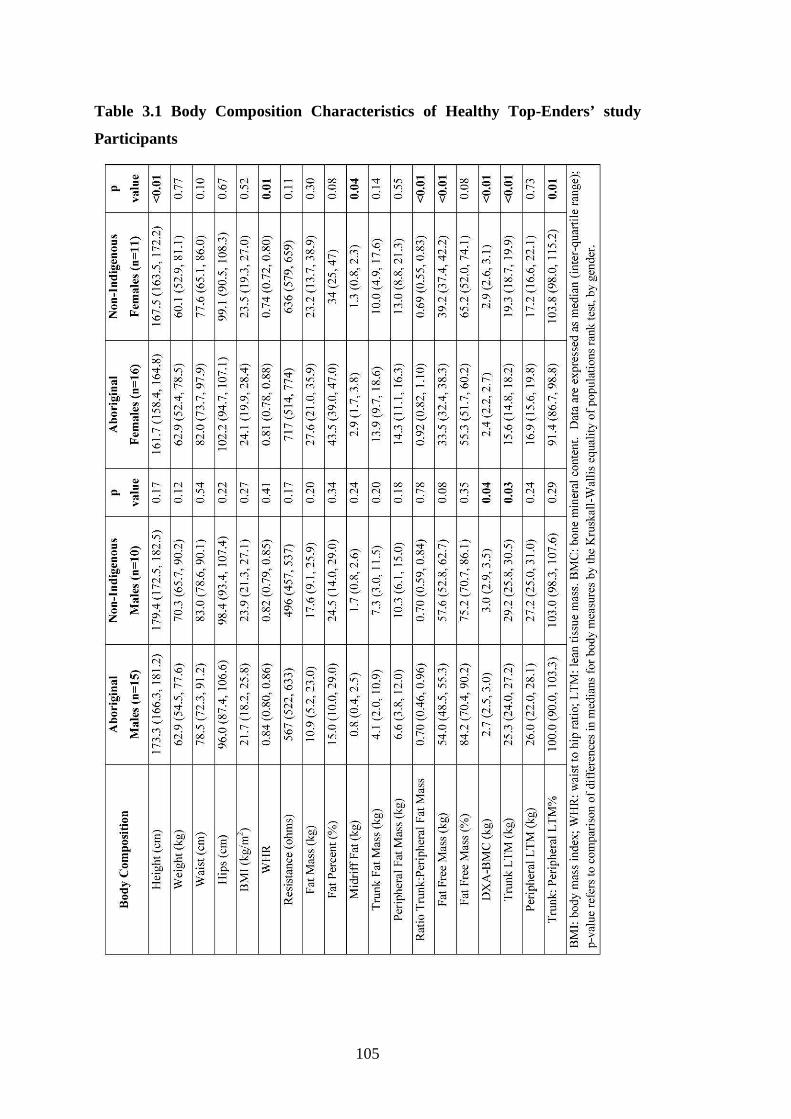
105
Table 3.1 Body Composition Characteristics of Healthy Top-Enders’ study
Participants
106
3.3.3. Biochemical Characteristics: Healthy Top-Enders’ study
Table 3.2 describes the biochemical results of participants. Aboriginal males had
higher fasting triglycerides, and trended to higher fasting insulin compared with non-
Indigenous males. Aboriginal females had a lower fasting HDL-cholesterol level
and trended to higher CRP levels (p=0.06) compared with non-Indigenous females.
All participants had a normal urine ACR, though a statistical difference was noted
between Aboriginal and non-Indigenous females. In males, when urinary ACR was
examined with fat free mass as a covariate, there was no statistically significant
difference by ethnic group. In females, Aboriginal ethnicity was associated with
lower urinary ACR. This relationship in females remained when fat free mass was
included as a covariate.
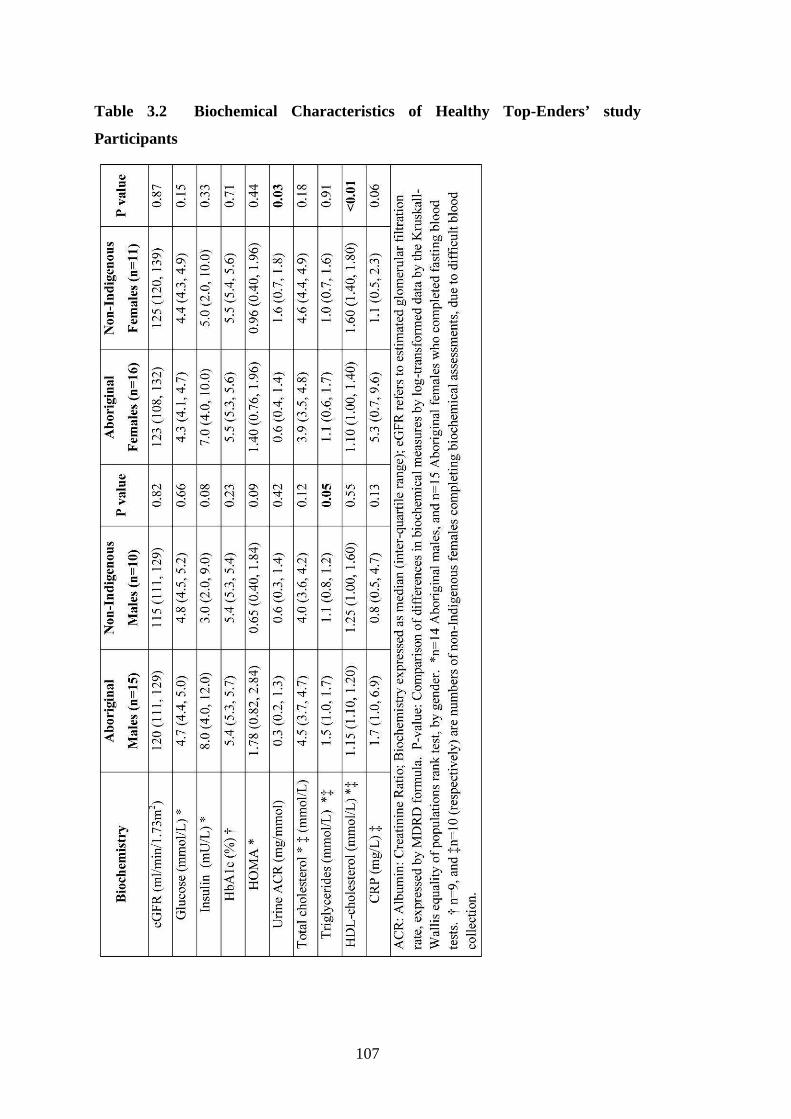
107
Table 3.2 Biochemical Characteristics of Healthy Top-Enders’ study
Participants
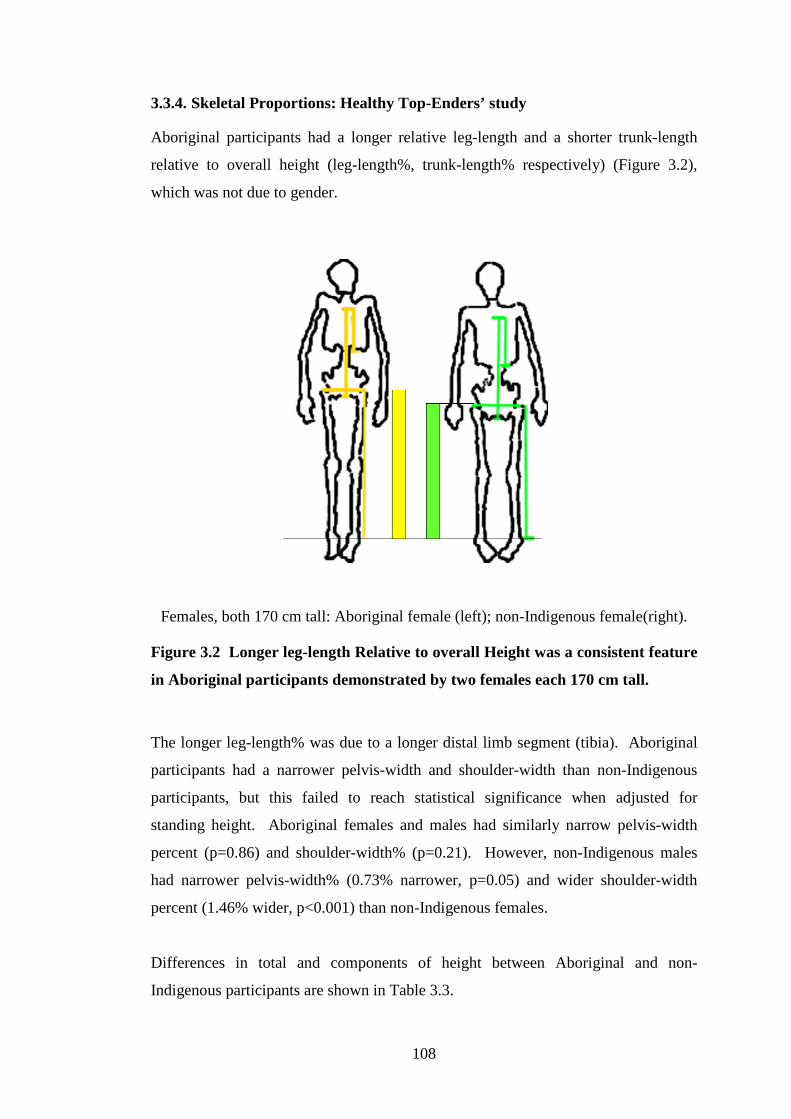
108
3.3.4. Skeletal Proportions: Healthy Top-Enders’ study
Aboriginal participants had a longer relative leg-length and a shorter trunk-length
relative to overall height (leg-length%, trunk-length% respectively) (Figure 3.2),
which was not due to gender.
Females, both 170 cm tall: Aboriginal female (left); non-Indigenous female(right).
Figure 3.2 Longer leg-length Relative to overall Height was a consistent feature
in Aboriginal participants demonstrated by two females each 170 cm tall.
The longer leg-length% was due to a longer distal limb segment (tibia). Aboriginal
participants had a narrower pelvis-width and shoulder-width than non-Indigenous
participants, but this failed to reach statistical significance when adjusted for
standing height. Aboriginal females and males had similarly narrow pelvis-width
percent (p=0.86) and shoulder-width% (p=0.21). However, non-Indigenous males
had narrower pelvis-width% (0.73% narrower, p=0.05) and wider shoulder-width
percent (1.46% wider, p<0.001) than non-Indigenous females.
Differences in total and components of height between Aboriginal and non-
Indigenous participants are shown in Table 3.3.
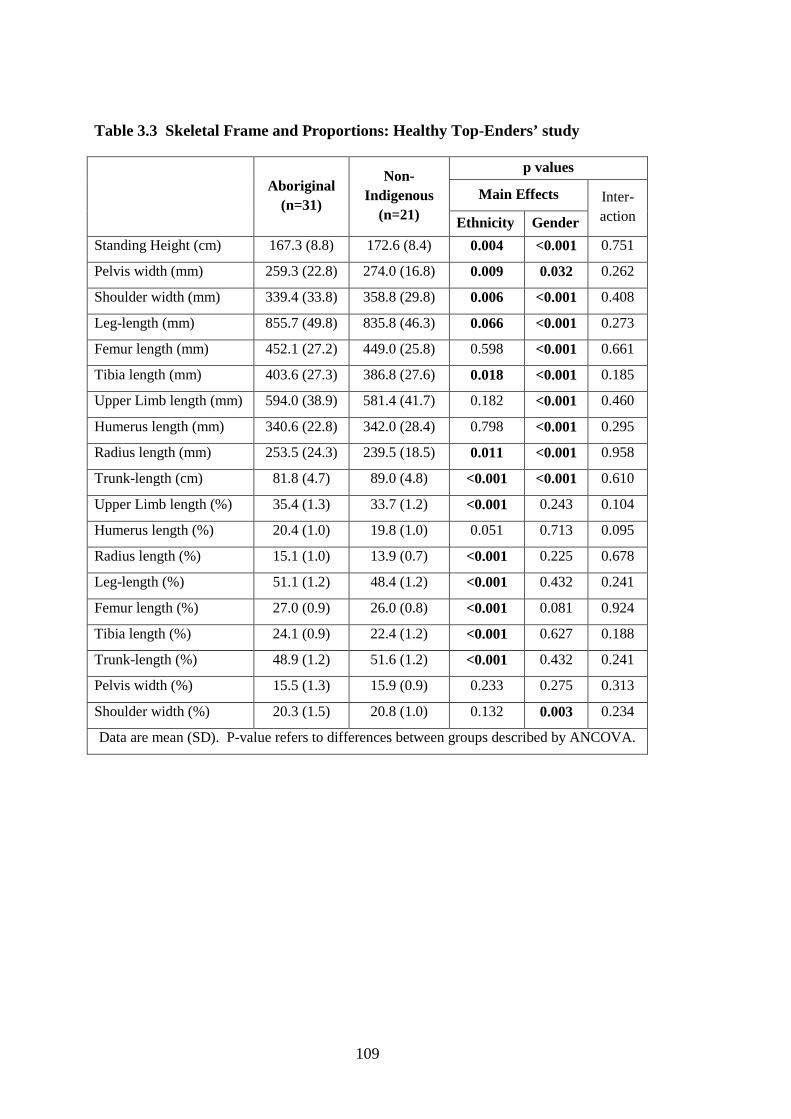
109
Table 3.3 Skeletal Frame and Proportions: Healthy Top-Enders’ study
p values
Main Effects Aboriginal
(n=31)
Non-Indigenous
(n=21) Ethnicity Gender
Inter-action
Standing Height (cm) 167.3 (8.8) 172.6 (8.4) 0.004 <0.001 0.751
Pelvis width (mm) 259.3 (22.8) 274.0 (16.8) 0.009 0.032 0.262
Shoulder width (mm) 339.4 (33.8) 358.8 (29.8) 0.006 <0.001 0.408
Leg-length (mm) 855.7 (49.8) 835.8 (46.3) 0.066 <0.001 0.273
Femur length (mm) 452.1 (27.2) 449.0 (25.8) 0.598 <0.001 0.661
Tibia length (mm) 403.6 (27.3) 386.8 (27.6) 0.018 <0.001 0.185
Upper Limb length (mm) 594.0 (38.9) 581.4 (41.7) 0.182 <0.001 0.460
Humerus length (mm) 340.6 (22.8) 342.0 (28.4) 0.798 <0.001 0.295
Radius length (mm) 253.5 (24.3) 239.5 (18.5) 0.011 <0.001 0.958
Trunk-length (cm) 81.8 (4.7) 89.0 (4.8) <0.001 <0.001 0.610
Upper Limb length (%) 35.4 (1.3) 33.7 (1.2) <0.001 0.243 0.104
Humerus length (%) 20.4 (1.0) 19.8 (1.0) 0.051 0.713 0.095
Radius length (%) 15.1 (1.0) 13.9 (0.7) <0.001 0.225 0.678
Leg-length (%) 51.1 (1.2) 48.4 (1.2) <0.001 0.432 0.241
Femur length (%) 27.0 (0.9) 26.0 (0.8) <0.001 0.081 0.924
Tibia length (%) 24.1 (0.9) 22.4 (1.2) <0.001 0.627 0.188
Trunk-length (%) 48.9 (1.2) 51.6 (1.2) <0.001 0.432 0.241
Pelvis width (%) 15.5 (1.3) 15.9 (0.9) 0.233 0.275 0.313
Shoulder width (%) 20.3 (1.5) 20.8 (1.0) 0.132 0.003 0.234
Data are mean (SD). P-value refers to differences between groups described by ANCOVA.
110
3.3.5. Factor Analysis of Body Composition Measures in Healthy Top-Enders’ study Participants
Factor analysis was used to identify the clustering of variables around fat mass, fat
free mass and ethnicity in the Healthy Top-Enders’ Study (see Table 3.4). Variables
included in the factor analysis model were gender and ethnicity, height, weight,
waist, hips, WHR and BMI, trunk-length, trunk-length%, pelvis-width, resistance, fat
mass, fat%, fat free mass, fat free mass%, and DXA indices of regional fat
distribution. Three factors were identified by these 20 variables, and explained 85%
of the total variance of the Principal Components Analysis. Fat mass clustered with
other DXA measures of total and regional fat, with BMI and waist and hip
circumferences, and WHR. Fat mass also clustered with low fat free mass percent.
Fat free mass clustered with male gender, height, weight, trunk-length and pelvis-
width, WHR, low-fat percent and low-resistance. The third factor highlighted the
clustering of body measures around ethnicity. Non-Indigenous ethnicity was
associated with longer trunk-length, longer trunk-length%, wider pelvis-width and
low WHR, and explained 14% of the variance of the factor analysis. Therefore,
Aboriginal ethnicity clustered with the inverse of these variables: high WHR, shorter
trunk-length, shorter trunk-length% and narrower pelvis-width.
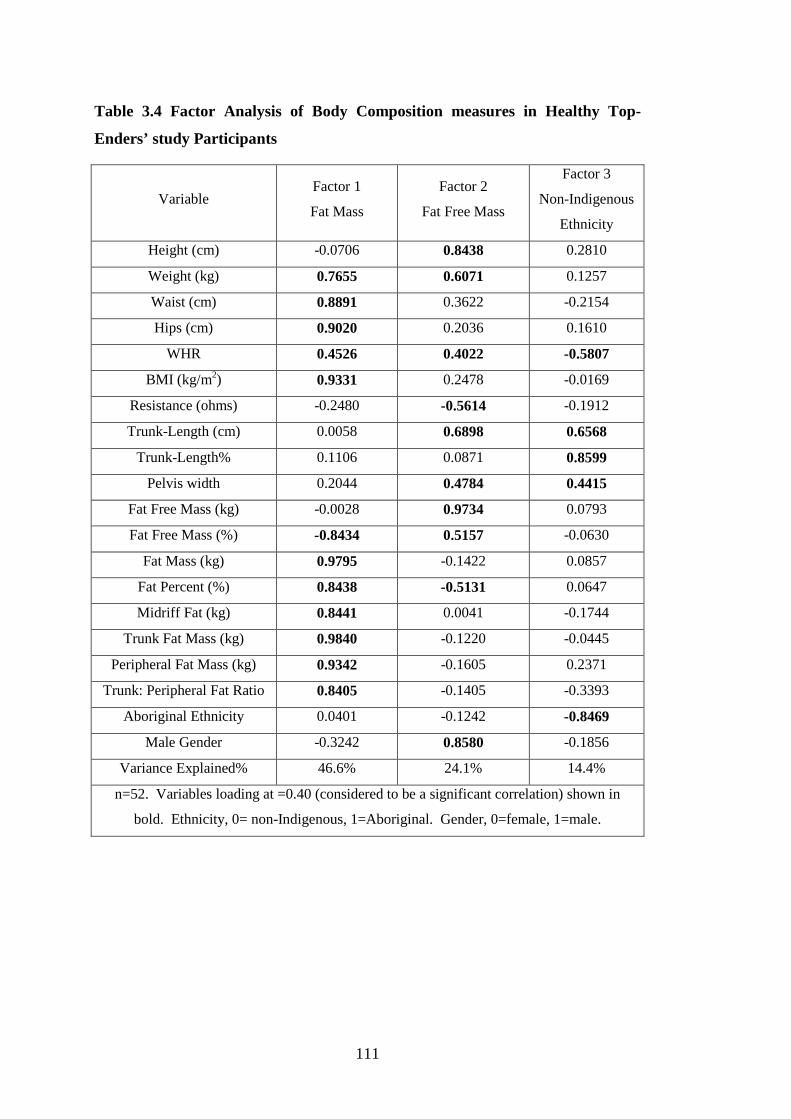
111
Table 3.4 Factor Analysis of Body Composition measures in Healthy Top-
Enders’ study Participants
Variable Factor 1
Fat Mass
Factor 2
Fat Free Mass
Factor 3
Non-Indigenous
Ethnicity
Height (cm) -0.0706 0.8438 0.2810
Weight (kg) 0.7655 0.6071 0.1257
Waist (cm) 0.8891 0.3622 -0.2154
Hips (cm) 0.9020 0.2036 0.1610
WHR 0.4526 0.4022 -0.5807
BMI (kg/m2) 0.9331 0.2478 -0.0169
Resistance (ohms) -0.2480 -0.5614 -0.1912
Trunk-Length (cm) 0.0058 0.6898 0.6568
Trunk-Length% 0.1106 0.0871 0.8599
Pelvis width 0.2044 0.4784 0.4415
Fat Free Mass (kg) -0.0028 0.9734 0.0793
Fat Free Mass (%) -0.8434 0.5157 -0.0630
Fat Mass (kg) 0.9795 -0.1422 0.0857
Fat Percent (%) 0.8438 -0.5131 0.0647
Midriff Fat (kg) 0.8441 0.0041 -0.1744
Trunk Fat Mass (kg) 0.9840 -0.1220 -0.0445
Peripheral Fat Mass (kg) 0.9342 -0.1605 0.2371
Trunk: Peripheral Fat Ratio 0.8405 -0.1405 -0.3393
Aboriginal Ethnicity 0.0401 -0.1242 -0.8469
Male Gender -0.3242 0.8580 -0.1856
Variance Explained% 46.6% 24.1% 14.4%
n=52. Variables loading at =0.40 (considered to be a significant correlation) shown in
bold. Ethnicity, 0= non-Indigenous, 1=Aboriginal. Gender, 0=female, 1=male.
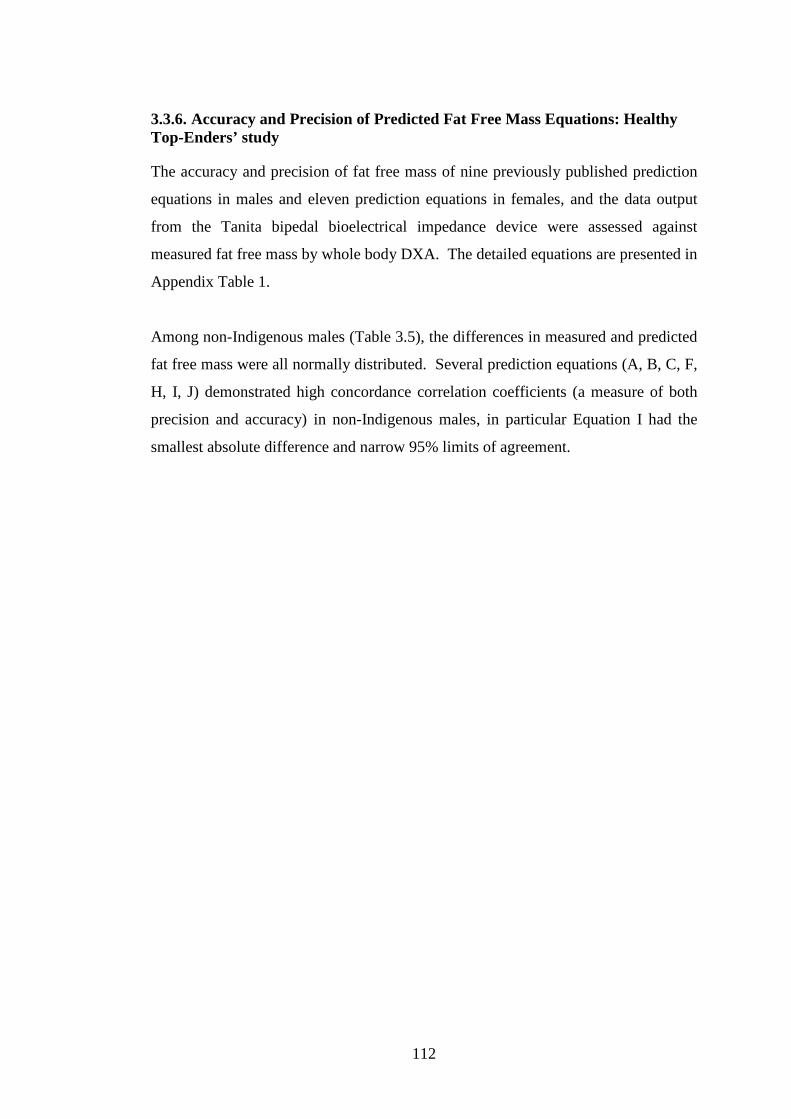
112
3.3.6. Accuracy and Precision of Predicted Fat Free Mass Equations: Healthy Top-Enders’ study
The accuracy and precision of fat free mass of nine previously published prediction
equations in males and eleven prediction equations in females, and the data output
from the Tanita bipedal bioelectrical impedance device were assessed against
measured fat free mass by whole body DXA. The detailed equations are presented in
Appendix Table 1.
Among non-Indigenous males (Table 3.5), the differences in measured and predicted
fat free mass were all normally distributed. Several prediction equations (A, B, C, F,
H, I, J) demonstrated high concordance correlation coefficients (a measure of both
precision and accuracy) in non-Indigenous males, in particular Equation I had the
smallest absolute difference and narrow 95% limits of agreement.
113
Table 3.5 Agreement of Measured Fat Free Mass and Fat Free Mass Predicted from several Published Equations using Bioelectrical
Impedance Analysis in non-Indigenous Males.
Non-Indigenous
Males (n=10)
Fat free Mass
Mean (SD)
(kg)
CV
(%)
ρc
(p value)
Difference **
Mean (SD)
(kg)
95% LOA
(kg)
Pearson’s
Correlation
Coefficient r (p)
Paired
T-test
FFM (DXA) 58.9 (8.0) 13.5
Ht2/R 64.8 (13.7) 21.1 0.625 (0.000) 5.9 (8.3) -10.5, 22.3 0.83 (0.003) 0.052
Tanita FFM * 59.8 (24.7) 41.3 0.465 (0.001) -0.4 (19.0) -37.6, 36.7 0.80 (0.029) 0.954
Equation A 59.2 (11.0) 18.6 0.816 (0.000) 0.3 (5.8) -11.1, 11.7 0.86 (0.001) 0.871
Equation B 58.0 (8.7) 14.9 0.871 (0.000) -1.0 (4.1) -9.0, 7.1 0.88 (0.001) 0.477
Equation C 60.6 (10.2) 16.8 0.849 (0.000) 1.7 (4.8) -7.6, 11.0 0.89 (0.001) 0.286
Equation F 61.7 (11.2) 18.1 0.825 (0.000) 2.7 (5.1) -7.2, 12.7 0.91 (0.000) 0.122
Equation G 65.7 (12.6) 19.2 0.679 (0.000) 6.8 (6.0) -5.0, 18.6 0.93 (0.000) 0.006
Equation H 59.1 (10.3) 17.4 0.903 (0.000) 0.2 (4.0) -7.7, 8.1 0.93 (0.000) 0.893
Equation I 57.2 (9.0) 15.7 0.903 (0.000) -1.7 (3.3) -8.2, 4.8 0.93 (0.000) 0.132
Equation J 59.9 (9.5) 15.9 0.910 (0.000) 0.9 (3.6) -6.1, 8.0 0.93 (0.000) 0.430
ρc is Lin’s concordance correlation coefficient. LOA, limits of Agreement. **Differences refers to Measured minus predicted fat free mass (kg) expressed as mean (standard deviation). * Tanita FFM: in non-Indigenous males (n=7): FFM (measured) =*FFM 60.26 (7.8).
114
This contrasted with Aboriginal males (shown in Table 3.6), where a normal
distribution of differences between measured and predicted fat free mass was
observed in only four prediction equations. Only 2 prediction equations (H and I)
demonstrated accuracy and agreement in predicted fat free mass in Aboriginal males,
though the difference and limits of agreement were not as small as non-Indigenous
males.
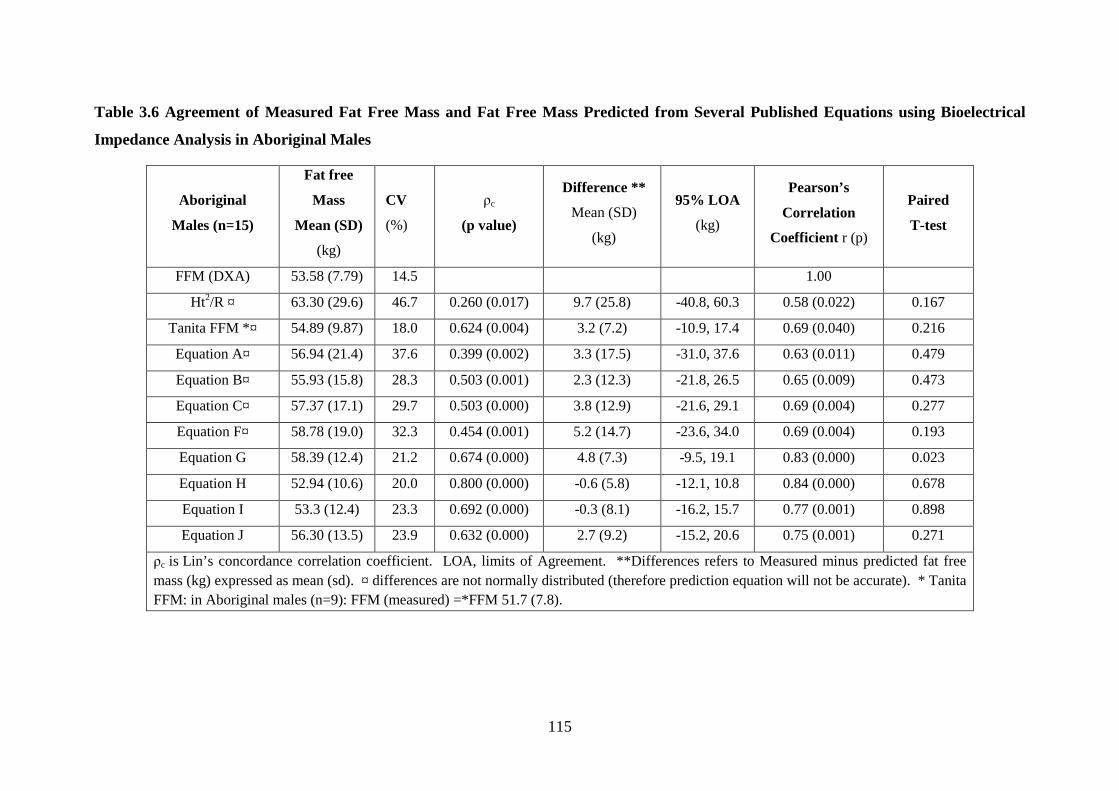
115
Table 3.6 Agreement of Measured Fat Free Mass and Fat Free Mass Predicted from Several Published Equations using Bioelectrical
Impedance Analysis in Aboriginal Males
Aboriginal
Males (n=15)
Fat free
Mass
Mean (SD)
(kg)
CV
(%)
ρc
(p value)
Difference **
Mean (SD)
(kg)
95% LOA
(kg)
Pearson’s
Correlation
Coefficient r (p)
Paired
T-test
FFM (DXA) 53.58 (7.79) 14.5 1.00
Ht2/R ¤ 63.30 (29.6) 46.7 0.260 (0.017) 9.7 (25.8) -40.8, 60.3 0.58 (0.022) 0.167
Tanita FFM *¤ 54.89 (9.87) 18.0 0.624 (0.004) 3.2 (7.2) -10.9, 17.4 0.69 (0.040) 0.216
Equation A¤ 56.94 (21.4) 37.6 0.399 (0.002) 3.3 (17.5) -31.0, 37.6 0.63 (0.011) 0.479
Equation B¤ 55.93 (15.8) 28.3 0.503 (0.001) 2.3 (12.3) -21.8, 26.5 0.65 (0.009) 0.473
Equation C¤ 57.37 (17.1) 29.7 0.503 (0.000) 3.8 (12.9) -21.6, 29.1 0.69 (0.004) 0.277
Equation F¤ 58.78 (19.0) 32.3 0.454 (0.001) 5.2 (14.7) -23.6, 34.0 0.69 (0.004) 0.193
Equation G 58.39 (12.4) 21.2 0.674 (0.000) 4.8 (7.3) -9.5, 19.1 0.83 (0.000) 0.023
Equation H 52.94 (10.6) 20.0 0.800 (0.000) -0.6 (5.8) -12.1, 10.8 0.84 (0.000) 0.678
Equation I 53.3 (12.4) 23.3 0.692 (0.000) -0.3 (8.1) -16.2, 15.7 0.77 (0.001) 0.898
Equation J 56.30 (13.5) 23.9 0.632 (0.000) 2.7 (9.2) -15.2, 20.6 0.75 (0.001) 0.271
ρc is Lin’s concordance correlation coefficient. LOA, limits of Agreement. **Differences refers to Measured minus predicted fat free mass (kg) expressed as mean (sd). ¤ differences are not normally distributed (therefore prediction equation will not be accurate). * Tanita FFM: in Aboriginal males (n=9): FFM (measured) =*FFM 51.7 (7.8).
116
All equations tested showed poor agreement in females in both ethnic groups
(ρc<0.55 in all equations for females) (shown in Table 3.7 and Table 3.8). In
particular, all prediction equations over-predicted fat free mass in Aboriginal females
(Table 3.7).
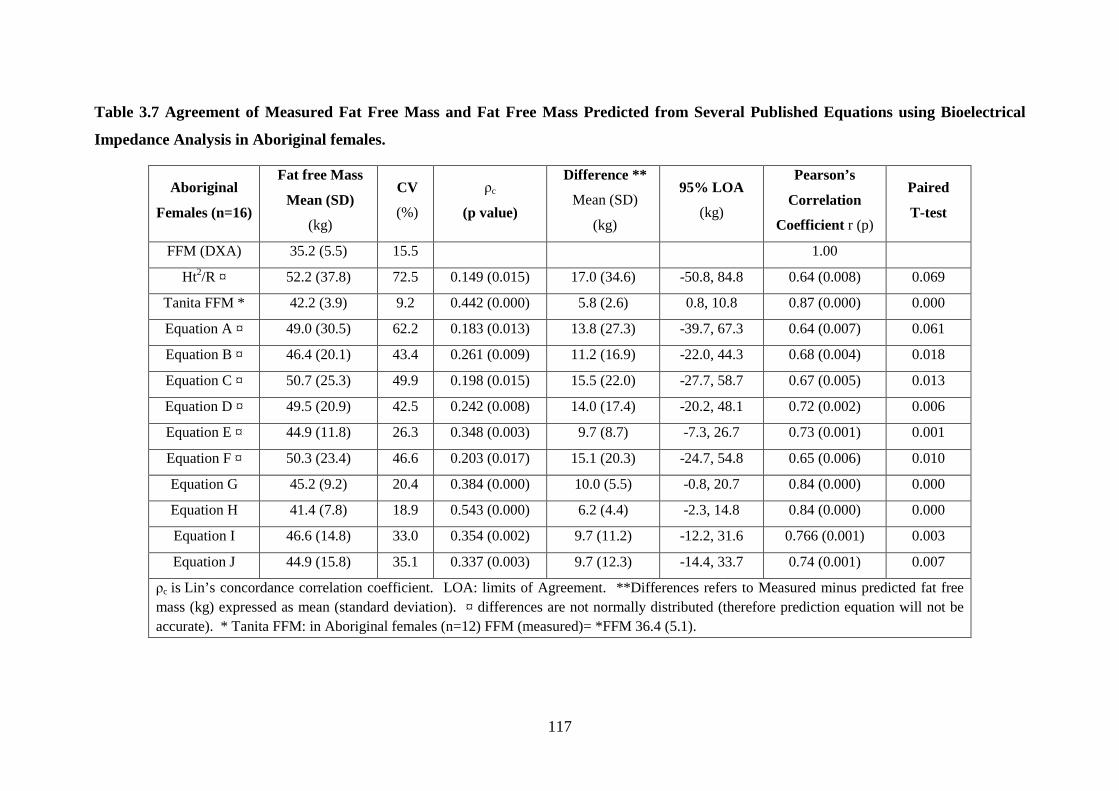
117
Table 3.7 Agreement of Measured Fat Free Mass and Fat Free Mass Predicted from Several Published Equations using Bioelectrical
Impedance Analysis in Aboriginal females.
Aboriginal
Females (n=16)
Fat free Mass
Mean (SD)
(kg)
CV
(%)
ρc
(p value)
Difference **
Mean (SD)
(kg)
95% LOA
(kg)
Pearson’s
Correlation
Coefficient r (p)
Paired
T-test
FFM (DXA) 35.2 (5.5) 15.5 1.00
Ht2/R ¤ 52.2 (37.8) 72.5 0.149 (0.015) 17.0 (34.6) -50.8, 84.8 0.64 (0.008) 0.069
Tanita FFM * 42.2 (3.9) 9.2 0.442 (0.000) 5.8 (2.6) 0.8, 10.8 0.87 (0.000) 0.000
Equation A ¤ 49.0 (30.5) 62.2 0.183 (0.013) 13.8 (27.3) -39.7, 67.3 0.64 (0.007) 0.061
Equation B ¤ 46.4 (20.1) 43.4 0.261 (0.009) 11.2 (16.9) -22.0, 44.3 0.68 (0.004) 0.018
Equation C ¤ 50.7 (25.3) 49.9 0.198 (0.015) 15.5 (22.0) -27.7, 58.7 0.67 (0.005) 0.013
Equation D ¤ 49.5 (20.9) 42.5 0.242 (0.008) 14.0 (17.4) -20.2, 48.1 0.72 (0.002) 0.006
Equation E ¤ 44.9 (11.8) 26.3 0.348 (0.003) 9.7 (8.7) -7.3, 26.7 0.73 (0.001) 0.001
Equation F ¤ 50.3 (23.4) 46.6 0.203 (0.017) 15.1 (20.3) -24.7, 54.8 0.65 (0.006) 0.010
Equation G 45.2 (9.2) 20.4 0.384 (0.000) 10.0 (5.5) -0.8, 20.7 0.84 (0.000) 0.000
Equation H 41.4 (7.8) 18.9 0.543 (0.000) 6.2 (4.4) -2.3, 14.8 0.84 (0.000) 0.000
Equation I 46.6 (14.8) 33.0 0.354 (0.002) 9.7 (11.2) -12.2, 31.6 0.766 (0.001) 0.003
Equation J 44.9 (15.8) 35.1 0.337 (0.003) 9.7 (12.3) -14.4, 33.7 0.74 (0.001) 0.007
ρc is Lin’s concordance correlation coefficient. LOA: limits of Agreement. **Differences refers to Measured minus predicted fat free mass (kg) expressed as mean (standard deviation). ¤ differences are not normally distributed (therefore prediction equation will not be accurate). * Tanita FFM: in Aboriginal females (n=12) FFM (measured)= *FFM 36.4 (5.1).
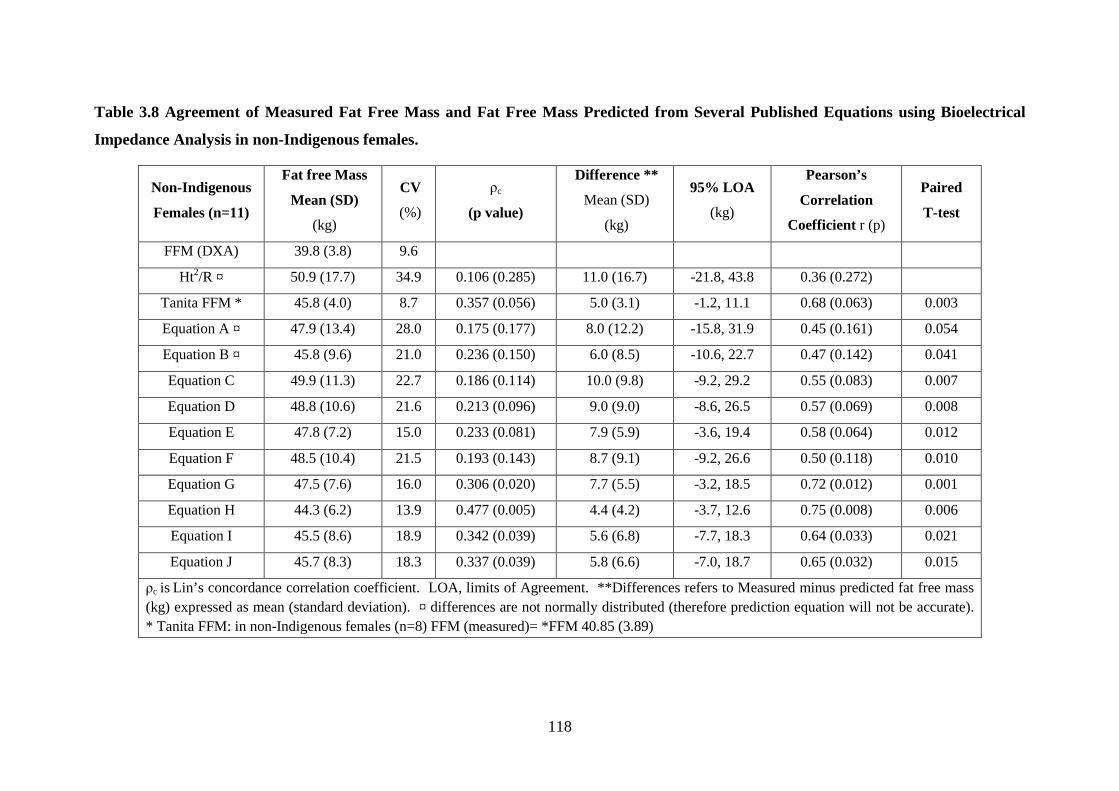
118
Table 3.8 Agreement of Measured Fat Free Mass and Fat Free Mass Predicted from Several Published Equations using Bioelectrical
Impedance Analysis in non-Indigenous females.
Non-Indigenous
Females (n=11)
Fat free Mass
Mean (SD)
(kg)
CV
(%)
ρc
(p value)
Difference **
Mean (SD)
(kg)
95% LOA
(kg)
Pearson’s
Correlation
Coefficient r (p)
Paired
T-test
FFM (DXA) 39.8 (3.8) 9.6
Ht2/R ¤ 50.9 (17.7) 34.9 0.106 (0.285) 11.0 (16.7) -21.8, 43.8 0.36 (0.272)
Tanita FFM * 45.8 (4.0) 8.7 0.357 (0.056) 5.0 (3.1) -1.2, 11.1 0.68 (0.063) 0.003
Equation A ¤ 47.9 (13.4) 28.0 0.175 (0.177) 8.0 (12.2) -15.8, 31.9 0.45 (0.161) 0.054
Equation B ¤ 45.8 (9.6) 21.0 0.236 (0.150) 6.0 (8.5) -10.6, 22.7 0.47 (0.142) 0.041
Equation C 49.9 (11.3) 22.7 0.186 (0.114) 10.0 (9.8) -9.2, 29.2 0.55 (0.083) 0.007
Equation D 48.8 (10.6) 21.6 0.213 (0.096) 9.0 (9.0) -8.6, 26.5 0.57 (0.069) 0.008
Equation E 47.8 (7.2) 15.0 0.233 (0.081) 7.9 (5.9) -3.6, 19.4 0.58 (0.064) 0.012
Equation F 48.5 (10.4) 21.5 0.193 (0.143) 8.7 (9.1) -9.2, 26.6 0.50 (0.118) 0.010
Equation G 47.5 (7.6) 16.0 0.306 (0.020) 7.7 (5.5) -3.2, 18.5 0.72 (0.012) 0.001
Equation H 44.3 (6.2) 13.9 0.477 (0.005) 4.4 (4.2) -3.7, 12.6 0.75 (0.008) 0.006
Equation I 45.5 (8.6) 18.9 0.342 (0.039) 5.6 (6.8) -7.7, 18.3 0.64 (0.033) 0.021
Equation J 45.7 (8.3) 18.3 0.337 (0.039) 5.8 (6.6) -7.0, 18.7 0.65 (0.032) 0.015
ρc is Lin’s concordance correlation coefficient. LOA, limits of Agreement. **Differences refers to Measured minus predicted fat free mass (kg) expressed as mean (standard deviation). ¤ differences are not normally distributed (therefore prediction equation will not be accurate). * Tanita FFM: in non-Indigenous females (n=8) FFM (measured)= *FFM 40.85 (3.89)
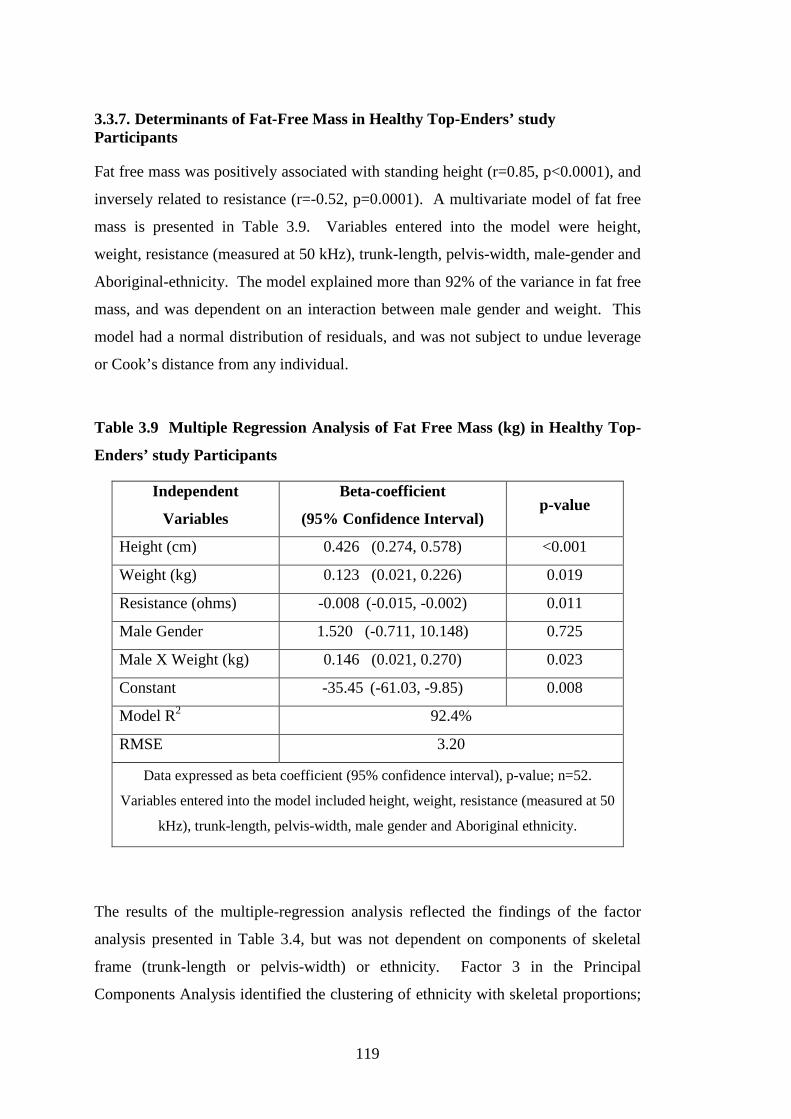
119
3.3.7. Determinants of Fat-Free Mass in Healthy Top-Enders’ study Participants
Fat free mass was positively associated with standing height (r=0.85, p<0.0001), and
inversely related to resistance (r=-0.52, p=0.0001). A multivariate model of fat free
mass is presented in Table 3.9. Variables entered into the model were height,
weight, resistance (measured at 50 kHz), trunk-length, pelvis-width, male-gender and
Aboriginal-ethnicity. The model explained more than 92% of the variance in fat free
mass, and was dependent on an interaction between male gender and weight. This
model had a normal distribution of residuals, and was not subject to undue leverage
or Cook’s distance from any individual.
Table 3.9 Multiple Regression Analysis of Fat Free Mass (kg) in Healthy Top-
Enders’ study Participants
Independent
Variables
Beta-coefficient
(95% Confidence Interval) p-value
Height (cm) 0.426 (0.274, 0.578) <0.001
Weight (kg) 0.123 (0.021, 0.226) 0.019
Resistance (ohms) -0.008 (-0.015, -0.002) 0.011
Male Gender 1.520 (-0.711, 10.148) 0.725
Male X Weight (kg) 0.146 (0.021, 0.270) 0.023
Constant -35.45 (-61.03, -9.85) 0.008
Model R2 92.4%
RMSE 3.20
Data expressed as beta coefficient (95% confidence interval), p-value; n=52.
Variables entered into the model included height, weight, resistance (measured at 50
kHz), trunk-length, pelvis-width, male gender and Aboriginal ethnicity.
The results of the multiple-regression analysis reflected the findings of the factor
analysis presented in Table 3.4, but was not dependent on components of skeletal
frame (trunk-length or pelvis-width) or ethnicity. Factor 3 in the Principal
Components Analysis identified the clustering of ethnicity with skeletal proportions;
120
however this was not reflected in the multivariate regression model of fat free mass
above. In Factor 2, pelvis-width, trunk-length and male gender clustered with fat
free mass, but again were not reflected above in the multivariate regression model of
fat free mass. Trunk-length was highly related to fat free mass (r=0.71, p<0.0001),
but was also highly inter-correlated with height (r=0.86, p<0.0001), hence both
variables could not contribute to a valid multivariate model of fat free mass. A valid
multiple regression model focussing on skeletal proportions (without standing
height), was prone to undue leverage and Cook’s distance from several participants.
When these individuals were dropped from the model, trunk-length percent was no
longer a significant independent variable predicting fat free mass, and a valid model
was therefore unable to be generated.
3.4. Discussion: Healthy Top-Enders’ study, Body Composition and
Skeletal Proportions
There are three main findings in this analysis. First, Aboriginal participants had a
shorter trunk-length, and longer leg-length relative to height compared with non-
Indigenous participants. Second, Aboriginal females had lower bone mass, lower
trunk lean mass and higher fat measures than non-Indigenous females. Third, a
central pattern of weight distribution (WHR), associated with more compact trunk
dimensions was characteristic of Aboriginal participants in this study.
The first finding was a shorter trunk-length, and longer leg-length relative to height
in Aboriginal compared with non-Indigenous participants. This analysis has
confirmed, by precise and accurate methods, the previously described linear body
build of Aboriginal people (Abbie 1969; Abbie 1976; Roberts 1953). It was
suggested that the compact truncal dimensions of Aboriginal people was associated
with higher relative body surface area, allowing more efficient thermoregulation
(Roberts 1953).
The longer relative-limb length among Aboriginal adults was due to a longer distal
portion of the limb, and has been observed from childhood (Abbie 1969). In the
present analysis, the longer limb-length of Aboriginal participants was due to longer
121
tibial lengths, which confirms these reports (Abbie 1969). Healthy European
children maintain a constant proportion of skeletal growth that is observed in
adulthood (Abrahamyan et al. 2008). Growth retardation in European children
during World War II was associated with sparing of trunk-length, and shortening of
limbs, and later development of type 2 diabetes (Davey Smith et al. 2001), whereas
Aboriginal people born small for gestational age are more likely to be proportionally
small (Hoy et al. 2010b). We did not assess for birth weight and age of gestation in
the Healthy Top-Enders’ study.
Skeletal-width and relative limb-length impacts on body build in many populations.
In lean populations, longer relative leg-length, at a similar body fat percent was
associated with a lower body mass index (Deurenberg et al. 2002a; Norgan et al.
1995). The heterogeneity in body build observed within and between racial groups
has been explained by differences in relative limb-lengths, width of large joints, and
skeletal breadth (Deurenberg et al. 2002b; Katzmarzyk et al. 1999; Norgan et al.
1995; Snijder et al. 1999).
Norgan et al. (Norgan 1994) described a similar estimated body fat percent (by skin-
fold thicknesses) in Aboriginal people occurred at much lower BMI than would be
expected in Caucasian populations, and suggested this was due to lower sitting height
ratios of Aboriginal people (i.e. a longer relative leg-length%). Others report
excellent health status of Aboriginal adults with BMI’s lower than 18 kg/m2 (O’Dea
et al. 1988b).
In this study of adults with a broad spectrum of BMI, factor analysis showed truncal
obesity (WHR) clustered with compact skeletal dimensions of the trunk. Truncal
obesity with overweight in Aboriginal people with longer relative limb-length may
explain Daniel et al.’s (Daniel et al. 1999) observation of a lower prospective risk of
diabetes in a Central Australian Aboriginal community in those with lower rather
than higher BMI (<22.5 v <25 kg/m2).
In this study, factor analysis also showed pelvis-width clustered with fat free mass.
A broad pelvis and wider joint-widths were associated with a heavier body build in
Europeans (Snijder et al.1999). This study has shown Aboriginal males and females
122
each had equally narrow skeletal widths. This contrasted with non-Indigenous
participants, where as expected, males had wider shoulder breadths and narrower
pelvis-width than females. Wider joints was shown to be highly correlated with bone
mineral content (Snijder et al. 1999). Differences in bone mineral content between
female ethnic groups in this study will be discussed further below.
An accurate and precise model of fat free mass was produced for study participants.
The components of the fat free mass model were similar to the prediction equation H
(Segal et al. 1988) shown in Appendix Table 1. Equation H incorporated height,
bioelectrical resistance, weight and age, was validated in an obese population of
Caucasians, and published in 1988. The use of published equations is limited if the
new study population (such as Healthy Top-Ender study participants) is sufficiently
different to the reference study population. “Equation H” showed the most promise
for males in this study. The assessment group for “Equation H” were described as
obese. Healthy Top-Enders’ study participants were recruited over a spectrum of
normal and overweight BMI; however the means of each male ethnic group in the
present analysis satisfied the published Equation H prediction model.
The published equations were not useful in females, and specifically over-predicted
fat free mass in Aboriginal women. This was not surprising since Aboriginal
women, shown in this analysis by precise and detailed analysis methods, have lower
trunk-lean mass (even after adjustment for height) than non-Indigenous females.
Overall, the clinical usefulness of prediction equations for an individual (rather than
a group) may be limited, especially if used for longitudinal follow-up of that
individual, as was demonstrated by the wide differences in measured and predicted
values of fat free mass.
Aboriginal Females: Body Composition Differences and its Potential Links with
Metabolic Risk
Aboriginal females have a more unique body composition relative to non-Indigenous
females, than was observed between Aboriginal and non-Indigenous males when
matched for age, height and BMI. Aboriginal males had a similar pattern of fat
distribution, and total and regional lean mass as non-Indigenous males. This
contrasted with Aboriginal females, who after adjusting for height, had lower bone
123
mineral content, lower trunk-lean mass and higher central body fat measures than
non-Indigenous females.
The clinical significance of 300 grams lower bone mineral content in Aboriginal
females compared with non-Indigenous females, when matched for age, height and
BMI in this analysis is presently unknown. Lower bone mineral content may reflect
narrower skeletal dimensions and a linear body build of Aboriginal participants,
though differences in pelvis-breadths between female ethnic groups did not reach
statistical significance after adjustment for height. There is very little information
about bone health of Australian Aboriginal people, and only a few reports describe
aspects of bone health in Aboriginal children and adults (Tan et al. 2010; Vanlint et
al. 2011).
Aboriginal females as a group had similar fasting insulin levels, HbA1c and HOMA
score, but lower trunk lean mass compared with non-Indigenous females. Lower
lean mass percent has been linked with lower insulin clearance rates in healthy adults
(Yki-Jarvinen et al. 1985). Understanding the relationship between percent lean
body mass and diabetes risk in adult Aboriginal people is clinically necessary due to
a high burden of chronic non-communicable diseases in older Aborigines (Vos et al.
2009) but was not possible with the present study design.
Aboriginal women demonstrate a strong tendency to central weight deposition (fat
mass), observed by higher: WHR, midriff fat mass, and trunk:peripheral fat mass
ratio. Central obesity in Aboriginal women is widely reported across Northern and
Central Australian communities (Rowley et al. 1997; Wang & Hoy 2003).
Rutishauser et al. (Rutishauser et al. 1986) compared the body shape and fat
distribution of 114 Aboriginal women from the remote Kimberley region of Western
Australia. Women aged 20 to 30 years old had higher: mid-arm circumference, waist
and hip circumferences, WHR, and truncal skin-fold thickness than younger
Aboriginal women (Rutishauser et al. 1986). Our findings of central weight
distribution in adult Aboriginal women are consistent with Rutishauser et al.
(Rutishauser et al. 1986) and also with Piers et al. (Piers et al. 2003). They reported
a higher WHR, skin-fold measures and resistance in healthy Aboriginal women
compared with Caucasian women (Piers et al. 2003).
124
Aboriginal women in the Healthy Top-Enders’ study had a high-risk metabolic
profile characterised by central obesity, higher CRP, lower HDL-cholesterol and
were also more likely to currently smoke cigarettes, compared with non-Indigenous
females. Low HDL-cholesterol is frequently reported among Aboriginal women
(O'Neal et al. 2008) with levels often as low as in Aboriginal men (Gault et al. 1996;
Wang et al. 2003). Low HDL-cholesterol is also accompanied by abdominal obesity
in Indigenous Australian men and women (O'Neal et al. 2008). Chronically elevated
levels of CRP in healthy women are associated with higher future risk of
cardiovascular disease (Ridker et al. 1998). The relationship of inflammation and
adiposity in this study group is explored further in Chapter 4.
Limitations
Recruiting healthy young people, particularly men, to health and lifestyle studies is
difficult (Dunstan et al. 2002; Glatthaar et al. 1985; O'Dea et al. 2008). Craig et al.
(Craig et al. 2003) assessed the body composition of healthy Caucasian males in
Sydney, and reported similar height and lean tissue mass to our data. Their male
comparator group was older than the Tongan group in their study, and selected from
employees in a major university teaching hospital (Craig et al. 2003). Liberato et al.
(Liberato et al. 2008) described an Australian group of healthy males aged 18 to 25
years with a wide BMI and body fat percent range, recruited from universities and
fitness centres. The Healthy Top-Enders’ study participants were not recruited from
fitness centres, though a number of males (both Aboriginal and non-Indigenous)
participated in premier division sports (Australian Rules football, rugby, and
hockey). Our findings demonstrate shorter trunk-length% of Aboriginal participants,
matched for age, BMI and height. Narrowness of the skeletal frame was anticipated
in this study, and clustered with Aboriginal ethnicity in the Principal Components
Analysis. However differences in skeletal widths between ethnic groups were not
statistically significant after adjustment for height in the present analysis. This may
reflect the restricted inclusion criteria of our study (healthy and BMI matched to
Aboriginal adults who were recruited first), therefore we may have inadvertently
recruited Caucasian participants with a more narrow skeletal body build. This should
be explored in a larger cohort.
125
We report ethnicity-dependent differences in central obesity in Aboriginal adults
associated with the linear skeletal build. However we have not measured other
lifestyle, psycho-social, environmental or socio-economic status factors that are
associated with adiposity and chronic disease risk (Cunningham et al. 2008; Yusuf et
al. 2004). This study group was intended to demonstrate the body build and habitus
of healthy young adult Aboriginal people of the current era, who were not engaged in
an elite athletic program in order to provide a perspective on an older Indigenous
chronic disease population (which is described later in the thesis).
Conclusion
In conclusion, among young healthy adults, the tendency to preferential central
obesity in Aboriginal people is strongly associated with the linear body build,
characterised by shorter trunk-length for overall height. This study size was
relatively small, however, has shown clinically important differences in the body
composition of Aboriginal females, compared with non-Indigenous females. The
present study better informs the results of many studies of Indigenous Australians
with chronic diseases (such as diabetes, cardiovascular disease and chronic kidney
disease) where many cardiovascular disease risk markers are increasingly manifest
after 35 years old. Further study focussing on limiting weight gain in young
Aboriginal adults, and minimising additional risk factors (cigarette use) may confer
long-term health benefits, especially for Aboriginal women.
Chapter 4. Healthy Top-Enders’ Study:
The Relationship of Total and Abdominal
Adiposity with Adipokines in
Healthy Adult Aboriginal People
127
4.1. Introduction
Indigenous Australians represent a group of diverse peoples who collectively are
reported to have higher rates of cigarette smoking, sedentary behaviour (AIHW
2011) and chronic diseases compared with other Australians. This includes a higher
prevalence of overweight and type 2 diabetes, which affects Aboriginal people and
Torres Strait Islander people at younger ages than other Australians (Hoy et al. 2007;
O'Dea et al. 2008; O'Neal et al. 2008). Differences in the body build and body
composition between healthy Aboriginal adults and non-Indigenous adults were
demonstrated in Chapter 3, using anthropometry and whole body DXA. Norgan
(Norgan 1994) described healthy Australian Aboriginal people had a lower body
mass index (BMI) relative to expected levels in a Caucasian comparator group, and
was associated with higher skin-fold thicknesses, especially in a truncal distribution
in women. This was confirmed in a more recent assessment of body composition in
healthy adult Aboriginal females who although having similar BMI (<22.5 kg/m2)
compared with non-Indigenous females, had a higher WHR, higher sum of skin-
folds, and a higher truncal skin-fold thicknesses (Piers et al. 2003). Aboriginal
males had a lower BMI (22.5 v 23.8 kg/m2, p<0.05) and higher WHR than non-
Indigenous males, but a similar distribution of skin-folds than non-Indigenous males
(Piers et al. 2003). To date these body composition differences and particularly the
abdominal obesity have not been further examined by a study of detailed abdominal
fat partitioning in conjunction with objectives measures of health in Indigenous
Australians.
Detailed body composition studies in combination with adipokines and other
biomarkers have extended the relationship of health and chronic disease risk with
overweight and central obesity (Abate et al. 1995; Cartier et al. 2009; Demerath et
al. 2008; Smith et al. 2001). Across several healthy populations, females are
reported to have higher subcutaneous abdominal fat, and lower visceral abdominal
fat than males (Demerath et al. 2007). Older age has been reported to be associated
with higher visceral fat areas (VFA) in both males and females (Cartier et al. 2009;
Koh et al. 2008). In Caucasians, younger people are reported to tolerate a higher
waist circumference at the same intra-abdominal fat area as older people (Lemieux et
al 1996), which indicates the critical threshold of visceral adipose tissue that is
128
associated with metabolic abnormalities is likely to change with age, or is influenced
by a difference in relative subcutaneous fat mass that occurs with aging.
Numerous studies have assessed the relationship of adipokines and markers of
inflammation and insulin resistance in healthy people, people with the metabolic
syndrome, and those with established chronic diseases. These measures include
high-sensitivity C-reactive protein (CRP), interleukin-6 (IL-6), low HDL-
cholesterol, adiponectin and leptin. CRP is a non-specific marker of inflammation,
produced by the liver under the influence of IL-6. Chronic low-grade elevations in
CRP are linked epidemiologically with cardiovascular disease in many populations
(Ridker et al. 1998). As summarised above in Chapter 1.7.1, IL-6 is reported to be
secreted from both intra-abdominal and subcutaneous adipose tissue (Mohamed-Ali
et al. 1997), though in the setting of morbid obesity, the secretion of IL-6 localised
more from intra-abdominal fat (omental fat) than subcutaneous adipose tissue beds
(Fontana et al. 2007).
Hyper-cholesterolaemia is a major cardiovascular disease risk marker (Wilson et al.
1998), although is not a major lipid abnormality in many surveys of Aboriginal
people living in remote communities (Wang et al. 2003). Aboriginal people with
chronic disease show a predominant pattern of high fasting triglycerides and low
HDL-cholesterol which is also accompanied by high WHR (O'Neal et al. 2008;
Wang et al. 2003). This pattern of dyslipidaemia is similar to the pattern of
dyslipidaemia observed in people who have diabetes.
Adiponectin is an abundantly produced protein from mature adipocytes, and has
anti-inflammatory, anti-atherogenic and insulin-sensitising properties (Wiecek et al.
2007). Healthy females have higher concentrations of adiponectin compared to
healthy males (Peake et al. 2005). Compared with healthy people, lower adiponectin
concentrations are reported in those who have diabetes (Bluher et al. 2005; Peake et
al. 2005). Several reports have shown that low adiponectin concentrations in
otherwise healthy adults predicted the future development of diabetes (Heidemann et
al. 2008; Krakoff et al. 2003). Compared with adiponectin, the high-molecular
weight (HMW) adiponectin isoform has been reported to more strongly relate to
insulin sensitivity in adults (Hara et al. 2006).
129
Leptin is secreted from subcutaneous adipose tissue, and other non-adipose sites
(Maury et al. 2010; Zou et al. 2008). Leptin concentrations are higher in obesity,
and correlate with total adiposity, (Mantzoros et al. 2011) rather than central obesity
(Jenkins et al. 2001). Leptin has been linked with inflammation. In Caucasian
females (compared with males), higher CRP concentrations was strongly related to
fat mass, but the investigators also observed this relationship was partly explained by
leptin concentrations (Rossi et al. 2012). They did not perform detailed studies of
body composition or assess other adipokines, but postulated that leptin may have a
role in mediating the relationship of CRP with adiposity, particularly in women
(Rossi et al. 2012). Others have reported an inverse relationship of BMI (or fat
mass) with the ratio of adiponectin to leptin (A:L) in otherwise healthy adult
Japanese men and women (Inoue et al. 2006). It has also been suggested that the
combination of both low adiponectin and high leptin levels, or a low A:L ratio
indicates insulin resistance in a number of populations (Inoue et al. 2006; Mente et
al. 2010).
The combined assessments of detailed body composition with adipokines and other
biomarkers have not been performed in Indigenous Australians to date. Identifying
healthy body shape in Indigenous Australians that incorporates the absence of
biomarkers known to be associated with development of chronic disease would be of
significant clinical and public health value.
Aim
The aim of this study was to describe total and abdominal fat mass and its
relationship with inflammatory and adipose related biomarkers in young healthy
adult Aboriginal people.
4.2. Methods
The data in this chapter includes an analysis of abdominal fat partitioning and
inflammatory and adipokine-related biomarkers in the Healthy Top-Enders’ study,
which was described in Chapter 2.4 and Chapter 3.2.
130
4.2.1. Participants
As described in Chapter 2.4.1, 52 healthy adult Aboriginal participants and non-
Indigenous participants who were matched for BMI, age and gender were recruited.
They each provided written and verbal consent to undertake the study.
4.2.2. Setting
Since participants underwent computed tomography (CT) and whole body DXA,
participants were recruited from the Darwin area, and the study protocol was
completed in Darwin, the largest city in the Northern Territory.
4.2.3. Protocol
The clinical, biochemical and body composition protocols for the Healthy Top-
Enders’ study are outlined in Chapter 2.4. In brief, participants fasted for 10-12
hours prior to the morning assessment. Fasting blood tests were collected and
clinical measures and detailed body composition assessments were completed
through the course of 4-5 hours under the supervision of two trained researchers (JH,
SG). Two non-Indigenous females did not provide sufficient blood to complete an
assessment of adipokines. One male and one female Aboriginal participant did not
fast for the full 10 hours, and fasting lipids, insulin and HOMA were therefore not
able to be assessed.
Current smoking status was described categorically (as yes or no), and a subjective
assessment of the participants time spent in vigorous physical activity was also
recorded, and used in the factor analysis (described below). The methods for the
inflammatory marker assays have been described in detail in Chapter 2.4.4 and for
whole body DXA in Chapter 2.4.7.1.
The methodology for computed tomography in the Healthy Top-Enders’ study was
briefly addressed in Chapter 2.4.7.2, and the detailed protocol is outlined below. All
scans were performed by a trained radiographer at the Darwin Private Hospital,
Darwin on the same day as DXA and body measures using an Aquilion 16 (Toshiba,
Japan) computed tomography scanner. The protocol was written and provided by a
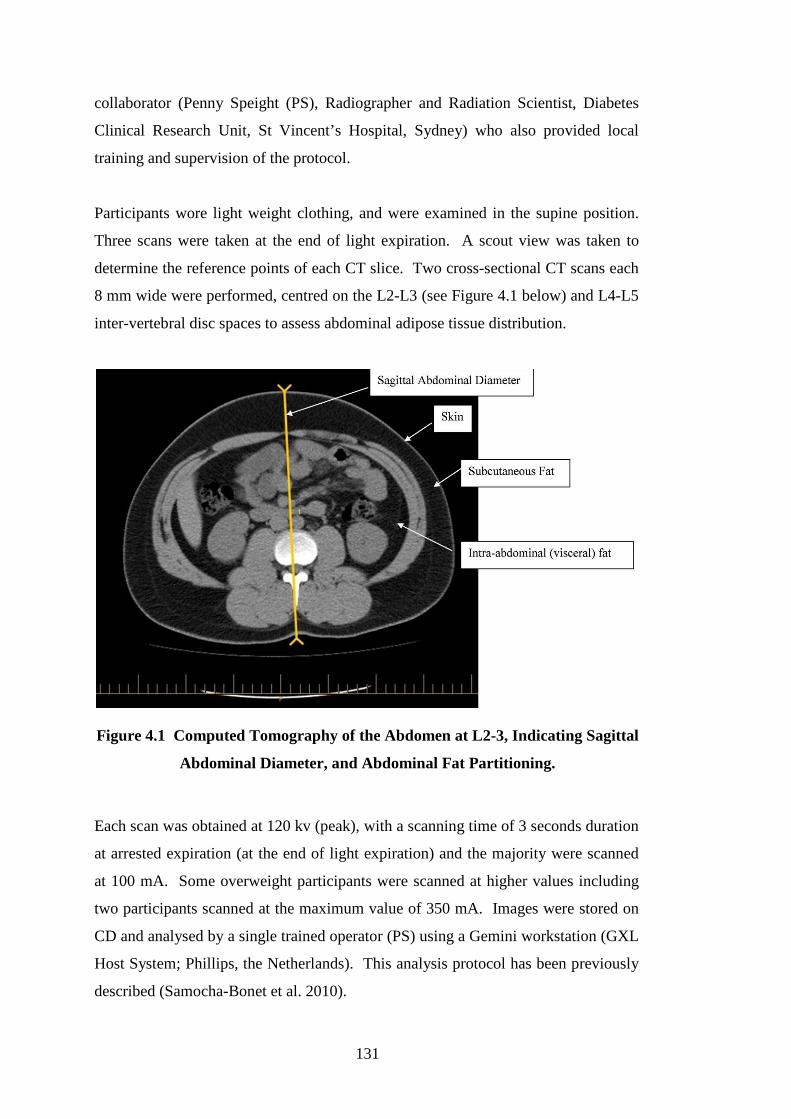
131
collaborator (Penny Speight (PS), Radiographer and Radiation Scientist, Diabetes
Clinical Research Unit, St Vincent’s Hospital, Sydney) who also provided local
training and supervision of the protocol.
Participants wore light weight clothing, and were examined in the supine position.
Three scans were taken at the end of light expiration. A scout view was taken to
determine the reference points of each CT slice. Two cross-sectional CT scans each
8 mm wide were performed, centred on the L2-L3 (see Figure 4.1 below) and L4-L5
inter-vertebral disc spaces to assess abdominal adipose tissue distribution.
Figure 4.1 Computed Tomography of the Abdomen at L2-3, Indicating Sagittal
Abdominal Diameter, and Abdominal Fat Partitioning.
Each scan was obtained at 120 kv (peak), with a scanning time of 3 seconds duration
at arrested expiration (at the end of light expiration) and the majority were scanned
at 100 mA. Some overweight participants were scanned at higher values including
two participants scanned at the maximum value of 350 mA. Images were stored on
CD and analysed by a single trained operator (PS) using a Gemini workstation (GXL
Host System; Phillips, the Netherlands). This analysis protocol has been previously
described (Samocha-Bonet et al. 2010).
132
In each scan level of L2-L3 and L4-L5, the total adipose tissue area was measured
by delineating manually the outer abdominal wall and then calculating the pixel
distribution in this area with attenuation range –150 to –50 HU. The intra-abdominal
region was defined by encircling the intra-abdominal cavity at the innermost aspect
of the abdominal and oblique muscle walls surrounding the cavity and the posterior
aspect of the vertebral body. The encircled area with attenuation range –150 to –50
HU was then calculated by the computer and taken as the intra-abdominal fat (IAF)
area or visceral fat area (VFA). The subcutaneous fat area (SFA) was then
calculated by subtracting the IAF area from the total adipose tissue area (TFA).
Adipose area was calculated in mm2 by the scanner-software, and divided by 100 to
convert to cm2. Total abdominal fat area, subcutaneous fat area and visceral fat area
were reported at the level of L2-L3 and L4-L5. Sagittal abdominal diameter (SAD)
of the abdomen (mm) was measured on the frozen CT image at inter-vertebral space
of L2-L3 and L4-L5 in expiration (see Figure 4.1 above).
The data was returned to the investigators in a secure spreadsheet after each scan,
and stored securely in the Healthy Top-Enders’ study Microsoft Access database
(Microsoft Office Access 2003, Microsoft Office Professional Edition, Microsoft
Corporation, Redmond, Wash, USA) at Menzies School of Health Research.
4.2.4. Statistical Analysis
Summary data for body composition and biochemical variables are presented for 52
participants. Body composition and biochemical variables were not normally
distributed and described as median and inter-quartile range. Comparison of median
body measures between groups were performed using the Kruskill Wallis equality of
populations rank test. Comparisons of median biochemical variables were
performed based on log-transformed data, using the Kruskill Wallis equality of
populations rank test. The relationship of log-adiponectin concentrations with the
explanatory variables body fat percent and ethnicity was performed by an analysis of
covariance (ANCOVA), to determine if concentrations differed within each gender
on the basis of ethnicity after correcting for body fat percent.
133
Median body fat percent is presented in the summary table (Table 4.1) for
individuals with a BMI <22.5 kg/m2, and also for participants with BMI >25 kg/m2,
which reflects Daniel et al.’s (Daniel et al. 1999) suggestion of BMI <22.5 kg/m2
was more indicative of health in Aboriginal peoples.
Healthy adult Caucasians (aged 20-39 years old) with a BMI <25kg/m2 were
reported to have less than 20% and 32% body fat in males and females respectively
(Gallagher et al. 2000). This threshold of less than 20% and 32% in males and
females respectively is used in the current analyses to denote lean and non-lean
(overweight) groups. A comparison of body composition and biomarkers in this
analysis was assessed around the gender-specific body fat percent threshold using
chi squared test, described by Gallagher at al. (Gallagher et al. 2000). In males,
differences in body composition and biochemical markers between ethnic groups
was assessed within males who had a low body fat percent (BF<20%), and between
males with a high body fat percent (BF>20%), in each category a comparison was
made by the chi-squared test. Differences in body composition and biochemical
measures was also assessed between BF<20% v BF>20%, again compared with the
chi squared test. In females, differences between ethnic groups for body
composition and biochemical measures was made within the high body fat percent
group (BF>32%), and compared with the chi squared test, since very few Aboriginal
women had body fat percent lower than 32%.
Univariate relationships of direct and indirect measures of body composition
(anthropometry, whole body DXA and CT) were assessed against log-transformed
biochemical measures to examine the strongest associations of these measures in
participants. A full description of these relationships is found in Appendix Table 2
and Appendix Table 3.
A multivariate regression analysis of log-adiponectin concentration was performed in
50 participants with data for adiponectin. Predictor variables were included in the
initial model if they had a strong bivariate relationship with log-adiponectin
concentration (based on a Pearson’s correlation coefficient r>0.8, p<0.05), or if a
clinical relationship with log-adiponectin existed. Variables were retained in the
model if they contributed low individual and mean variance inflation factor in the
134
model, had a statistically significant p value (p<0.05) or if the likelihood-ratio test
was statistically significant (p<0.05) if the independent variable was removed from
the model (Dupont 2009; Kirkwood et al. 2003; Long et al. 2006). Post-test analysis
of the regression model included analysis of normal distribution of residuals,
assessing for multi-collinearity in the model, and an assessment for the impact of
leverage and Cook’s distance of individual participants with the independent variable
(Dupont 2009).
A factor analysis was used to examine the clustering around fat mass and abdominal
obesity based on 50 participants with data for adiponectin (Table 4.4). The Principal
Component method was used to reduce the information of the many measured
variables into a smaller set of “factors.” Kaiser’s criterion (eigen values >1) was
used to determine the number of factors that best described the underlying
relationship among variables. The extracted factors were rotated using the varimax
rotation. Significant correlations were considered for variables loading at ≥0.40.
The variables included in the factor analysis included measures for which the cohort
displayed a range of low to high results. Due to the selection criteria of health in the
study, albuminuria and HbA1c were not included in the factor analysis modelling.
Due to the inter-relatedness of HOMA and insulin, HOMA was assessed in the factor
analysis in preference to fasting insulin.
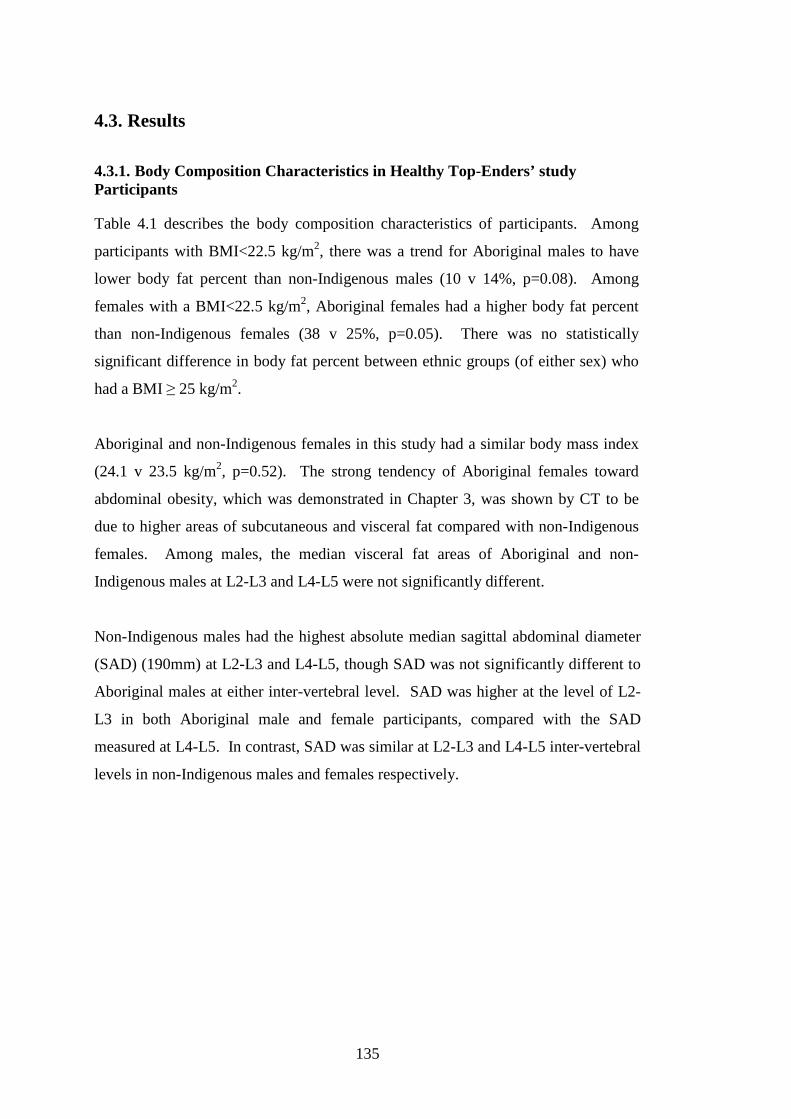
135
4.3. Results
4.3.1. Body Composition Characteristics in Healthy Top-Enders’ study Participants
Table 4.1 describes the body composition characteristics of participants. Among
participants with BMI<22.5 kg/m2, there was a trend for Aboriginal males to have
lower body fat percent than non-Indigenous males (10 v 14%, p=0.08). Among
females with a BMI<22.5 kg/m2, Aboriginal females had a higher body fat percent
than non-Indigenous females (38 v 25%, p=0.05). There was no statistically
significant difference in body fat percent between ethnic groups (of either sex) who
had a BMI ≥ 25 kg/m2.
Aboriginal and non-Indigenous females in this study had a similar body mass index
(24.1 v 23.5 kg/m2, p=0.52). The strong tendency of Aboriginal females toward
abdominal obesity, which was demonstrated in Chapter 3, was shown by CT to be
due to higher areas of subcutaneous and visceral fat compared with non-Indigenous
females. Among males, the median visceral fat areas of Aboriginal and non-
Indigenous males at L2-L3 and L4-L5 were not significantly different.
Non-Indigenous males had the highest absolute median sagittal abdominal diameter
(SAD) (190mm) at L2-L3 and L4-L5, though SAD was not significantly different to
Aboriginal males at either inter-vertebral level. SAD was higher at the level of L2-
L3 in both Aboriginal male and female participants, compared with the SAD
measured at L4-L5. In contrast, SAD was similar at L2-L3 and L4-L5 inter-vertebral
levels in non-Indigenous males and females respectively.
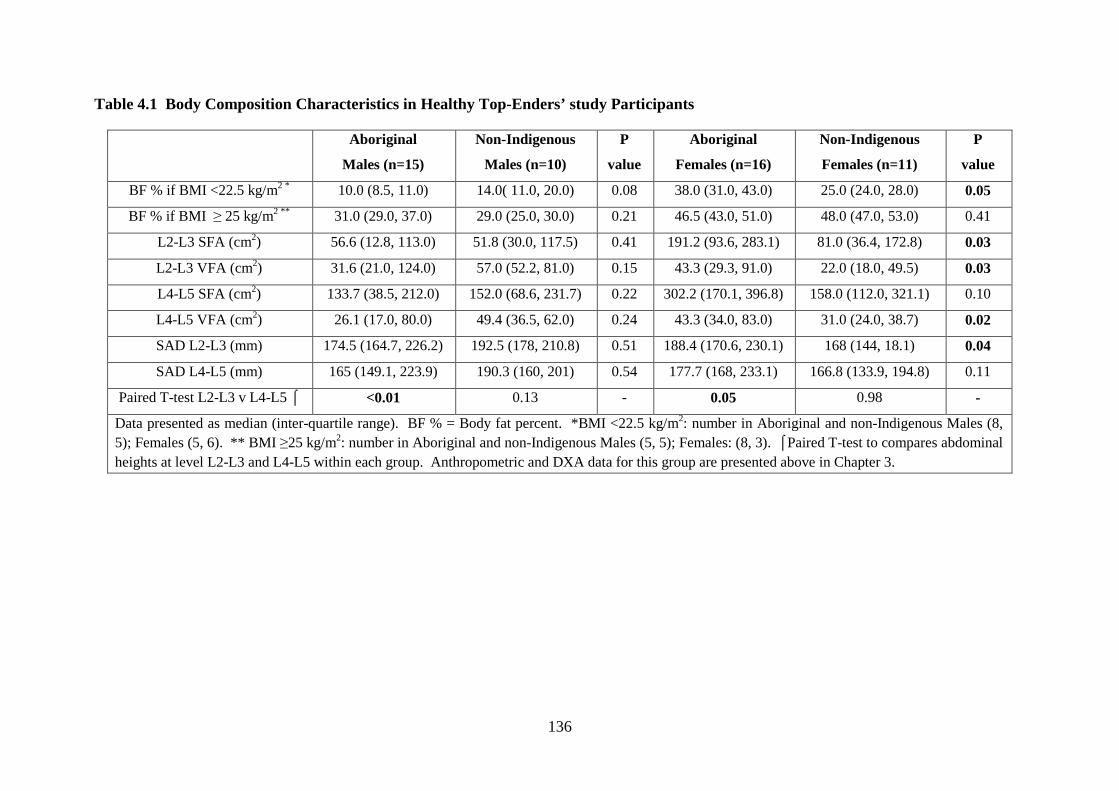
136
Table 4.1 Body Composition Characteristics in Healthy Top-Enders’ study Participants
Aboriginal
Males (n=15)
Non-Indigenous
Males (n=10)
P
value
Aboriginal
Females (n=16)
Non-Indigenous
Females (n=11)
P
value
BF % if BMI <22.5 kg/m2 * 10.0 (8.5, 11.0) 14.0( 11.0, 20.0) 0.08 38.0 (31.0, 43.0) 25.0 (24.0, 28.0) 0.05
BF % if BMI ≥ 25 kg/m2 ** 31.0 (29.0, 37.0) 29.0 (25.0, 30.0) 0.21 46.5 (43.0, 51.0) 48.0 (47.0, 53.0) 0.41
L2-L3 SFA (cm2) 56.6 (12.8, 113.0) 51.8 (30.0, 117.5) 0.41 191.2 (93.6, 283.1) 81.0 (36.4, 172.8) 0.03
L2-L3 VFA (cm2) 31.6 (21.0, 124.0) 57.0 (52.2, 81.0) 0.15 43.3 (29.3, 91.0) 22.0 (18.0, 49.5) 0.03
L4-L5 SFA (cm2) 133.7 (38.5, 212.0) 152.0 (68.6, 231.7) 0.22 302.2 (170.1, 396.8) 158.0 (112.0, 321.1) 0.10
L4-L5 VFA (cm2) 26.1 (17.0, 80.0) 49.4 (36.5, 62.0) 0.24 43.3 (34.0, 83.0) 31.0 (24.0, 38.7) 0.02
SAD L2-L3 (mm) 174.5 (164.7, 226.2) 192.5 (178, 210.8) 0.51 188.4 (170.6, 230.1) 168 (144, 18.1) 0.04
SAD L4-L5 (mm) 165 (149.1, 223.9) 190.3 (160, 201) 0.54 177.7 (168, 233.1) 166.8 (133.9, 194.8) 0.11
Paired T-test L2-L3 v L4-L5 ⌠ <0.01 0.13 - 0.05 0.98 -
Data presented as median (inter-quartile range). BF % = Body fat percent. *BMI <22.5 kg/m2: number in Aboriginal and non-Indigenous Males (8, 5); Females (5, 6). ** BMI ≥25 kg/m2: number in Aboriginal and non-Indigenous Males (5, 5); Females: (8, 3). ⌠Paired T-test to compares abdominal heights at level L2-L3 and L4-L5 within each group. Anthropometric and DXA data for this group are presented above in Chapter 3.
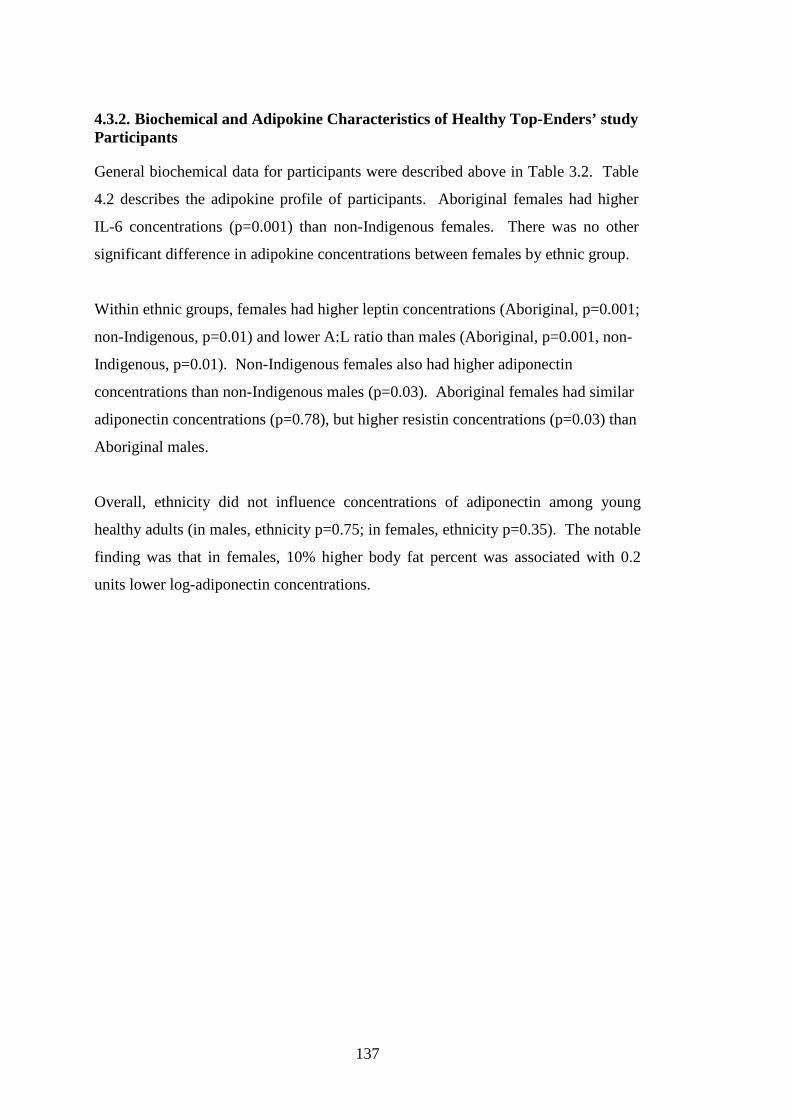
137
4.3.2. Biochemical and Adipokine Characteristics of Healthy Top-Enders’ study Participants
General biochemical data for participants were described above in Table 3.2. Table
4.2 describes the adipokine profile of participants. Aboriginal females had higher
IL-6 concentrations (p=0.001) than non-Indigenous females. There was no other
significant difference in adipokine concentrations between females by ethnic group.
Within ethnic groups, females had higher leptin concentrations (Aboriginal, p=0.001;
non-Indigenous, p=0.01) and lower A:L ratio than males (Aboriginal, p=0.001, non-
Indigenous, p=0.01). Non-Indigenous females also had higher adiponectin
concentrations than non-Indigenous males (p=0.03). Aboriginal females had similar
adiponectin concentrations (p=0.78), but higher resistin concentrations (p=0.03) than
Aboriginal males.
Overall, ethnicity did not influence concentrations of adiponectin among young
healthy adults (in males, ethnicity p=0.75; in females, ethnicity p=0.35). The notable
finding was that in females, 10% higher body fat percent was associated with 0.2
units lower log-adiponectin concentrations.
138
Table 4.2 Biochemical Characteristics of Healthy Top-Enders’ study Participants
Biochemistry Aboriginal
Males (n=15)
Non-Indigenous
Males (n=10)
P
value
Aboriginal
Females (n=16)
Non-Indigenous
Females (n=11)
P
value
Adiponectin (ug/ml) † 3.56 (3.00, 4.08) 3.49 (2.51, 4.05) 0.82 3.62 (2.75, 5.38) 4.95 (4.65, 5.23) 0.19
Leptin (ng/ml) † 1.49 (0.96, 11.25) 4.18 (1.25, 7.14) 0.85 26.27 (17.59, 35.52) 21.24 (15.95, 31.33) 0.57
A:L Ratio (ug/ml) † 2.21 (0.20, 5.46) 1.16 (0.44, 3.05) 0.62 0.14 (0.09, 0.24) 0.23 (0.18, 0.31) 0.23
HMW adiponectin (ug/ml) † 1.18 (0.78, 1.83) 1.26 (0.56, 2.54) 0.78 1.65 (0.79, 2.55) 2.03 (1.72, 2.78) 0.34
HMWA fraction 2.8 (2.1, 3.3) 2.85 (1.81, 5.15) 0.91 2.42 (1.78, 3.22) 2.39 (2.00, 2.87) 0.95
Resistin (ug/ml) † 6.47 (5.46, 9.72) 6.67 (5.51, 8.43) 1.00 9.68 (8.15, 13.14) 7.43 (6.73, 9.83) 0.10
IL-6 (pg/ml) † 2.47 (0.93, 5.80) 1.12 (0.75, 25.87) 0.51 4.29 (1.58, 5.73) 0.92 (0.84, 1.08) 0.001
Data presented as median (inter-quartile range). HMW(A): high molecular weight (adiponectin); A:L ratio: adiponectin:leptin ratio; HOMA: homeostasis model assessment of insulin resistance. P value: comparison of differences in biochemical measures by log-transformed data by the Kruskall-Wallis equality of populations rank test, by gender. *n=14 Aboriginal males, and n=15 Aboriginal females completed fasting blood tests. † n=9, and ‡n=10 (respectively) are numbers of non-Indigenous females completing biochemical assessments, due to difficult blood collection.
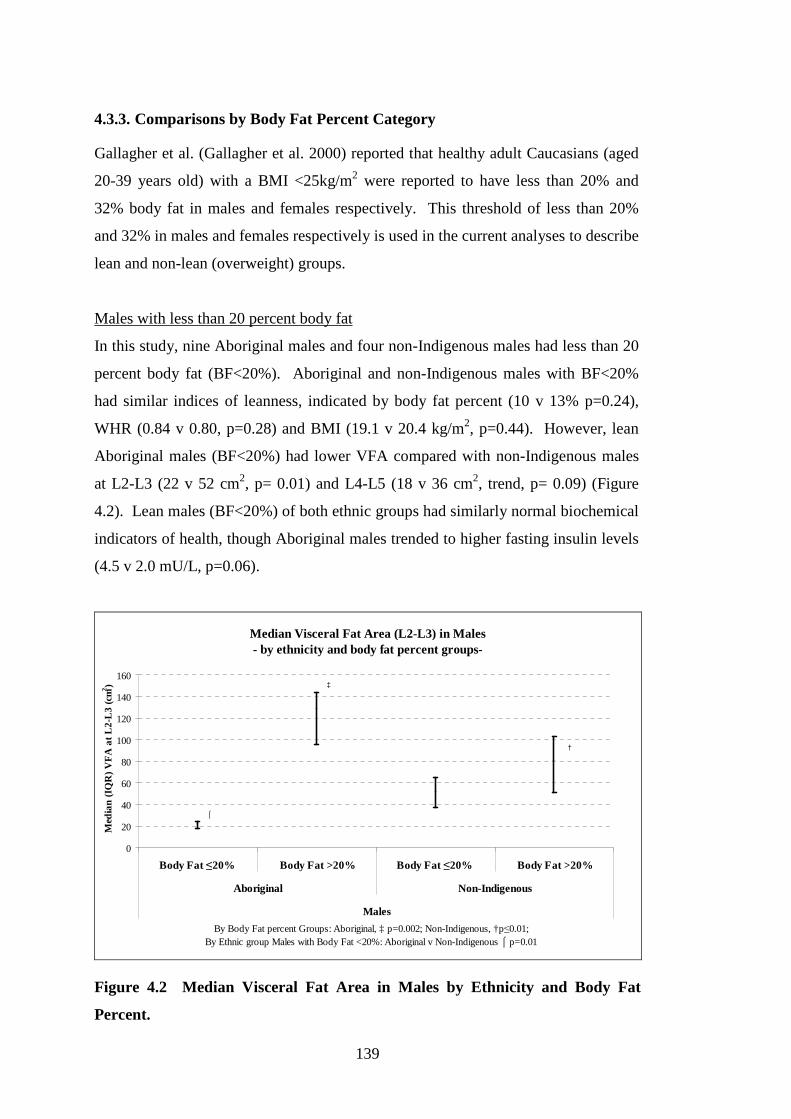
139
4.3.3. Comparisons by Body Fat Percent Category
Gallagher et al. (Gallagher et al. 2000) reported that healthy adult Caucasians (aged
20-39 years old) with a BMI <25kg/m2 were reported to have less than 20% and
32% body fat in males and females respectively. This threshold of less than 20%
and 32% in males and females respectively is used in the current analyses to describe
lean and non-lean (overweight) groups.
Males with less than 20 percent body fat
In this study, nine Aboriginal males and four non-Indigenous males had less than 20
percent body fat (BF<20%). Aboriginal and non-Indigenous males with BF<20%
had similar indices of leanness, indicated by body fat percent (10 v 13% p=0.24),
WHR (0.84 v 0.80, p=0.28) and BMI (19.1 v 20.4 kg/m2, p=0.44). However, lean
Aboriginal males (BF<20%) had lower VFA compared with non-Indigenous males
at L2-L3 (22 v 52 cm2, p= 0.01) and L4-L5 (18 v 36 cm2, trend, p= 0.09) (Figure
4.2). Lean males (BF<20%) of both ethnic groups had similarly normal biochemical
indicators of health, though Aboriginal males trended to higher fasting insulin levels
(4.5 v 2.0 mU/L, p=0.06).
Median Visceral Fat Area (L2-L3) in Males - by ethnicity and body fat percent groups-
0
20
40
60
80
100
120
140
160
Body Fat ≤20% Body Fat >20% Body Fat ≤20% Body Fat >20%
Aboriginal Non-Indigenous
Males
Med
ian
(IQ
R)
VF
A a
t L2-
L3 (
cm2 ) ‡
†
⌠
By Body Fat percent Groups: Aboriginal, ‡ p=0.002; Non-Indigenous, †p≤0.01; By Ethnic group Males with Body Fat <20%: Aboriginal v Non-Indigenous ⌠ p=0.01
Figure 4.2 Median Visceral Fat Area in Males by Ethnicity and Body Fat
Percent.
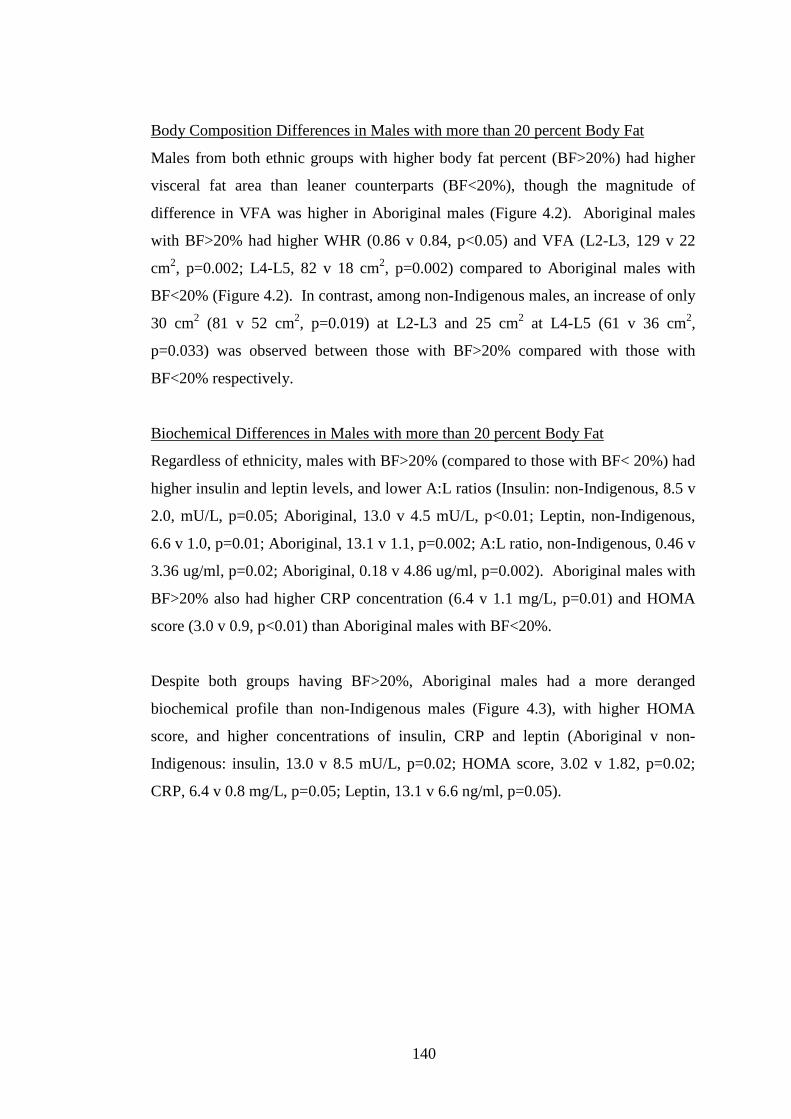
140
Body Composition Differences in Males with more than 20 percent Body Fat
Males from both ethnic groups with higher body fat percent (BF>20%) had higher
visceral fat area than leaner counterparts (BF<20%), though the magnitude of
difference in VFA was higher in Aboriginal males (Figure 4.2). Aboriginal males
with BF>20% had higher WHR (0.86 v 0.84, p<0.05) and VFA (L2-L3, 129 v 22
cm2, p=0.002; L4-L5, 82 v 18 cm2, p=0.002) compared to Aboriginal males with
BF<20% (Figure 4.2). In contrast, among non-Indigenous males, an increase of only
30 cm2 (81 v 52 cm2, p=0.019) at L2-L3 and 25 cm2 at L4-L5 (61 v 36 cm2,
p=0.033) was observed between those with BF>20% compared with those with
BF<20% respectively.
Biochemical Differences in Males with more than 20 percent Body Fat
Regardless of ethnicity, males with BF>20% (compared to those with BF< 20%) had
higher insulin and leptin levels, and lower A:L ratios (Insulin: non-Indigenous, 8.5 v
2.0, mU/L, p=0.05; Aboriginal, 13.0 v 4.5 mU/L, p<0.01; Leptin, non-Indigenous,
6.6 v 1.0, p=0.01; Aboriginal, 13.1 v 1.1, p=0.002; A:L ratio, non-Indigenous, 0.46 v
3.36 ug/ml, p=0.02; Aboriginal, 0.18 v 4.86 ug/ml, p=0.002). Aboriginal males with
BF>20% also had higher CRP concentration (6.4 v 1.1 mg/L, p=0.01) and HOMA
score (3.0 v 0.9, p<0.01) than Aboriginal males with BF<20%.
Despite both groups having BF>20%, Aboriginal males had a more deranged
biochemical profile than non-Indigenous males (Figure 4.3), with higher HOMA
score, and higher concentrations of insulin, CRP and leptin (Aboriginal v non-
Indigenous: insulin, 13.0 v 8.5 mU/L, p=0.02; HOMA score, 3.02 v 1.82, p=0.02;
CRP, 6.4 v 0.8 mg/L, p=0.05; Leptin, 13.1 v 6.6 ng/ml, p=0.05).
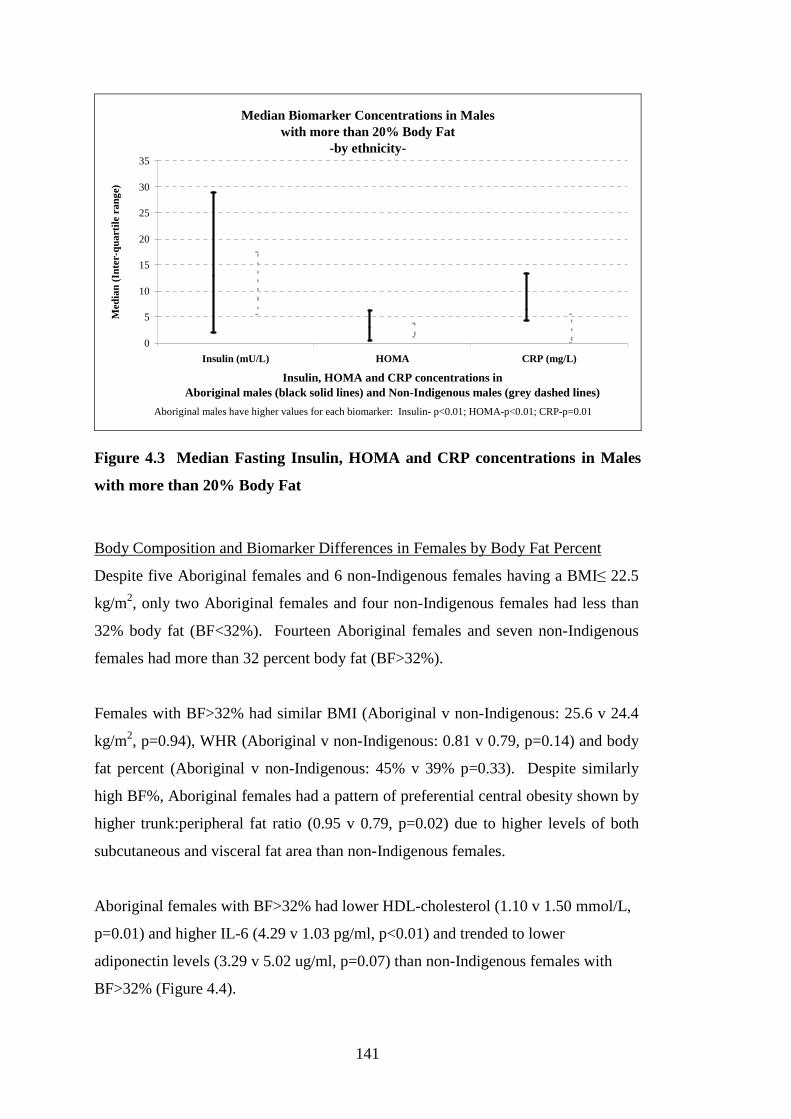
141
Median Biomarker Concentrations in Males with more than 20% Body Fat
-by ethnicity-
0
5
10
15
20
25
30
35
Insulin (mU/L) HOMA CRP (mg/L)
Insulin, HOMA and CRP concentrations in Aboriginal males (black solid lines) and Non-Indigenous males (grey dashed lines)
Med
ian
(Int
er-q
uart
ile r
ange
)
Aboriginal males have higher values for each biomarker: Insulin- p<0.01; HOMA-p<0.01; CRP-p=0.01
Figure 4.3 Median Fasting Insulin, HOMA and CRP concentrations in Males
with more than 20% Body Fat
Body Composition and Biomarker Differences in Females by Body Fat Percent
Despite five Aboriginal females and 6 non-Indigenous females having a BMI≤ 22.5
kg/m2, only two Aboriginal females and four non-Indigenous females had less than
32% body fat (BF<32%). Fourteen Aboriginal females and seven non-Indigenous
females had more than 32 percent body fat (BF>32%).
Females with BF>32% had similar BMI (Aboriginal v non-Indigenous: 25.6 v 24.4
kg/m2, p=0.94), WHR (Aboriginal v non-Indigenous: 0.81 v 0.79, p=0.14) and body
fat percent (Aboriginal v non-Indigenous: 45% v 39% p=0.33). Despite similarly
high BF%, Aboriginal females had a pattern of preferential central obesity shown by
higher trunk:peripheral fat ratio (0.95 v 0.79, p=0.02) due to higher levels of both
subcutaneous and visceral fat area than non-Indigenous females.
Aboriginal females with BF>32% had lower HDL-cholesterol (1.10 v 1.50 mmol/L,
p=0.01) and higher IL-6 (4.29 v 1.03 pg/ml, p<0.01) and trended to lower
adiponectin levels (3.29 v 5.02 ug/ml, p=0.07) than non-Indigenous females with
BF>32% (Figure 4.4).
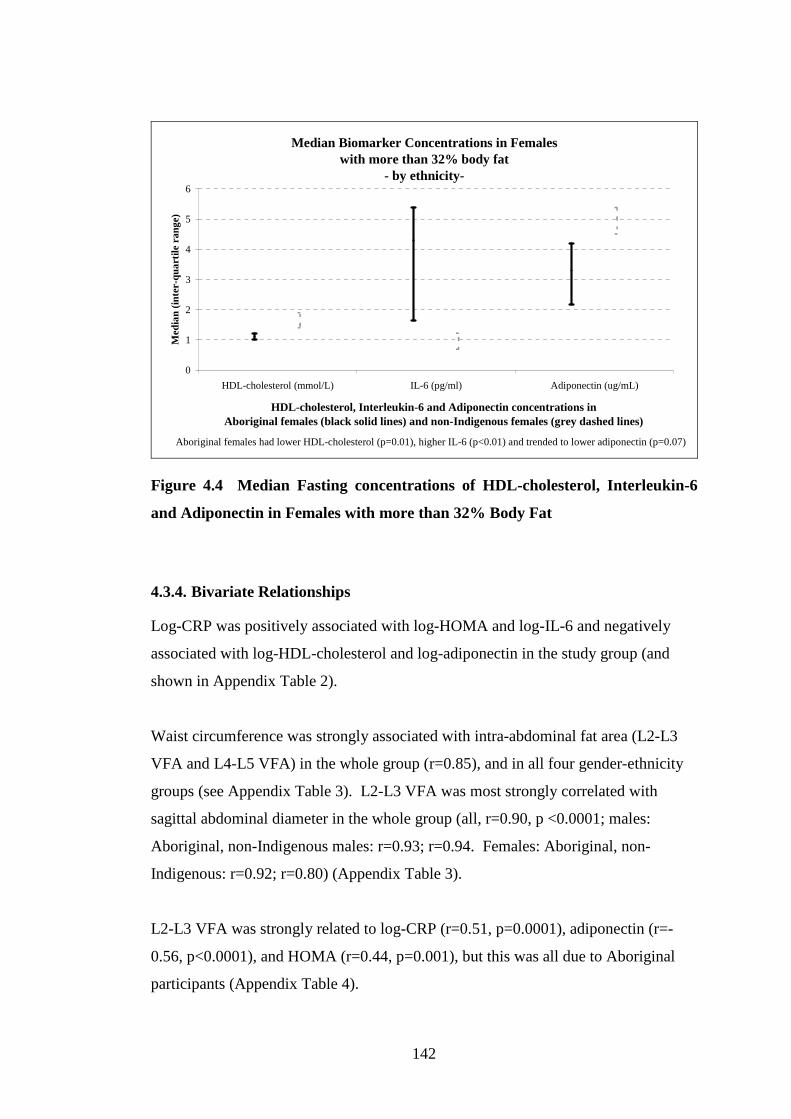
142
Median Biomarker Concentrations in Females with more than 32% body fat
- by ethnicity-
0
1
2
3
4
5
6
HDL-cholesterol (mmol/L) IL-6 (pg/ml) Adiponectin (ug/mL)
HDL-cholesterol, Interleukin-6 and Adiponectin concentrations in Aboriginal females (black solid lines) and non-Indigenous females (grey dashed lines)
Med
ian
(inte
r-qu
artil
e ra
nge)
Aboriginal females had lower HDL-cholesterol (p=0.01), higher IL-6 (p<0.01) and trended to lower adiponectin (p=0.07)
Figure 4.4 Median Fasting concentrations of HDL-cholesterol, Interleukin-6
and Adiponectin in Females with more than 32% Body Fat
4.3.4. Bivariate Relationships
Log-CRP was positively associated with log-HOMA and log-IL-6 and negatively
associated with log-HDL-cholesterol and log-adiponectin in the study group (and
shown in Appendix Table 2).
Waist circumference was strongly associated with intra-abdominal fat area (L2-L3
VFA and L4-L5 VFA) in the whole group (r=0.85), and in all four gender-ethnicity
groups (see Appendix Table 3). L2-L3 VFA was most strongly correlated with
sagittal abdominal diameter in the whole group (all, r=0.90, p <0.0001; males:
Aboriginal, non-Indigenous males: r=0.93; r=0.94. Females: Aboriginal, non-
Indigenous: r=0.92; r=0.80) (Appendix Table 3).
L2-L3 VFA was strongly related to log-CRP (r=0.51, p=0.0001), adiponectin (r=-
0.56, p<0.0001), and HOMA (r=0.44, p=0.001), but this was all due to Aboriginal
participants (Appendix Table 4).
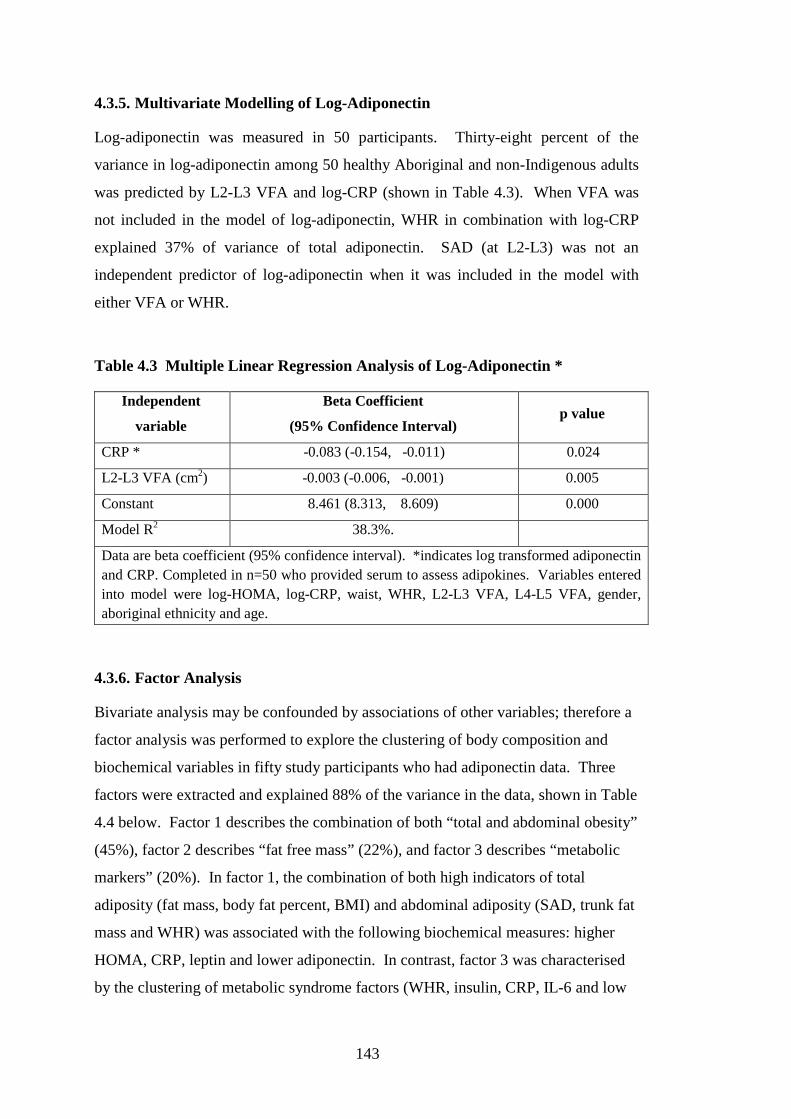
143
4.3.5. Multivariate Modelling of Log-Adiponectin
Log-adiponectin was measured in 50 participants. Thirty-eight percent of the
variance in log-adiponectin among 50 healthy Aboriginal and non-Indigenous adults
was predicted by L2-L3 VFA and log-CRP (shown in Table 4.3). When VFA was
not included in the model of log-adiponectin, WHR in combination with log-CRP
explained 37% of variance of total adiponectin. SAD (at L2-L3) was not an
independent predictor of log-adiponectin when it was included in the model with
either VFA or WHR.
Table 4.3 Multiple Linear Regression Analysis of Log-Adiponectin *
Independent
variable
Beta Coefficient
(95% Confidence Interval) p value
CRP * -0.083 (-0.154, -0.011) 0.024
L2-L3 VFA (cm2) -0.003 (-0.006, -0.001) 0.005
Constant 8.461 (8.313, 8.609) 0.000
Model R2 38.3%.
Data are beta coefficient (95% confidence interval). *indicates log transformed adiponectin and CRP. Completed in n=50 who provided serum to assess adipokines. Variables entered into model were log-HOMA, log-CRP, waist, WHR, L2-L3 VFA, L4-L5 VFA, gender, aboriginal ethnicity and age.
4.3.6. Factor Analysis
Bivariate analysis may be confounded by associations of other variables; therefore a
factor analysis was performed to explore the clustering of body composition and
biochemical variables in fifty study participants who had adiponectin data. Three
factors were extracted and explained 88% of the variance in the data, shown in Table
4.4 below. Factor 1 describes the combination of both “total and abdominal obesity”
(45%), factor 2 describes “fat free mass” (22%), and factor 3 describes “metabolic
markers” (20%). In factor 1, the combination of both high indicators of total
adiposity (fat mass, body fat percent, BMI) and abdominal adiposity (SAD, trunk fat
mass and WHR) was associated with the following biochemical measures: higher
HOMA, CRP, leptin and lower adiponectin. In contrast, factor 3 was characterised
by the clustering of metabolic syndrome factors (WHR, insulin, CRP, IL-6 and low
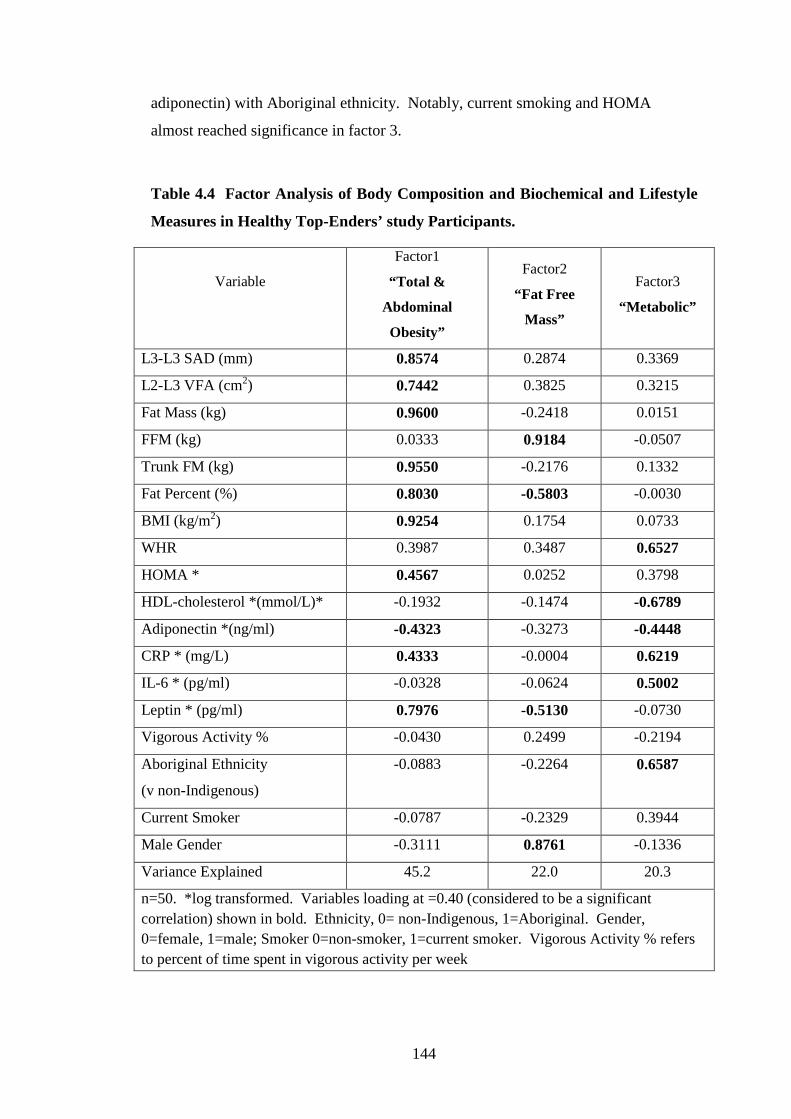
144
adiponectin) with Aboriginal ethnicity. Notably, current smoking and HOMA
almost reached significance in factor 3.
Table 4.4 Factor Analysis of Body Composition and Biochemical and Lifestyle
Measures in Healthy Top-Enders’ study Participants.
Variable
Factor1
“Total &
Abdominal
Obesity”
Factor2
“Fat Free
Mass”
Factor3
“Metabolic”
L3-L3 SAD (mm) 0.8574 0.2874 0.3369
L2-L3 VFA (cm2) 0.7442 0.3825 0.3215
Fat Mass (kg) 0.9600 -0.2418 0.0151
FFM (kg) 0.0333 0.9184 -0.0507
Trunk FM (kg) 0.9550 -0.2176 0.1332
Fat Percent (%) 0.8030 -0.5803 -0.0030
BMI (kg/m2) 0.9254 0.1754 0.0733
WHR 0.3987 0.3487 0.6527
HOMA * 0.4567 0.0252 0.3798
HDL-cholesterol *(mmol/L)* -0.1932 -0.1474 -0.6789
Adiponectin *(ng/ml) -0.4323 -0.3273 -0.4448
CRP * (mg/L) 0.4333 -0.0004 0.6219
IL-6 * (pg/ml) -0.0328 -0.0624 0.5002
Leptin * (pg/ml) 0.7976 -0.5130 -0.0730
Vigorous Activity % -0.0430 0.2499 -0.2194
Aboriginal Ethnicity
(v non-Indigenous)
-0.0883 -0.2264 0.6587
Current Smoker -0.0787 -0.2329 0.3944
Male Gender -0.3111 0.8761 -0.1336
Variance Explained 45.2 22.0 20.3
n=50. *log transformed. Variables loading at =0.40 (considered to be a significant correlation) shown in bold. Ethnicity, 0= non-Indigenous, 1=Aboriginal. Gender, 0=female, 1=male; Smoker 0=non-smoker, 1=current smoker. Vigorous Activity % refers to percent of time spent in vigorous activity per week
145
4.4. Discussion: Healthy Top-Enders’ study, Abdominal Fat
Partitioning and Inflammatory and Fat-related Biomarkers
Three important findings are evident from this analysis. First, the pattern of
overweight observed in young adult Aboriginal people is signified by the expansion
of intra-abdominal fat, with females particularly displaying android obesity. Second,
despite the young adult age and similar BMI, cardio-metabolic risk was more
strongly related to the burden of intra-abdominal fat in Aboriginal compared with
non-Indigenous participants. Third, insulin resistance (measured by fasting HOMA)
was more pronounced in Aboriginal participants, and clustered with total and intra-
abdominal adiposity, and high leptin and low-adiponectin levels.
Healthy Aboriginal females of a similar age to our study group have been previously
described as having higher WHR and truncal subcutaneous skin-fold thicknesses
than Caucasian females (Piers et al. 2003; Rutishauser et al. 1986). In this analysis,
for the first time, we show that despite the young age of Aboriginal females, the high
WHR is due to expanded abdominal subcutaneous and visceral fat areas. At lower
than expected BMI, Aboriginal people have comparatively higher skin-fold
thicknesses (subcutaneous fat) than Caucasians (Norgan 1994; Roberts 1953). As
was evident in Aboriginal males in the present analysis, the capacity of subcutaneous
adipose tissue to store excess lipid in overweight may become more easily saturated
with smaller increments of weight gain in Aboriginal people. At low BMI (<22.5
kg/m2), Aboriginal males had similar body fat percent, associated with a relatively
healthy metabolic profile, but had half the intra-abdominal fat area of Caucasian
males. In contrast, with higher body weight (BMI>25 kg/m2), Aboriginal and
Caucasian males again had similar total fat percent, but Aboriginal males had a
higher intra-abdominal fat burden, and more deranged metabolic abnormalities than
Caucasians. Among Aboriginal females, although very few had low body fat
percent, those with high BMI (>25kg/m2) show a pattern of more serious
biochemical abnormalities than overweight Caucasian females. We have therefore
described, for the first time, differences in the critical visceral adipose tissue
threshold between Aboriginal and Caucasian people, showing clearly that Aboriginal
people have low metabolic tolerance for excess body weight.
146
Several reports support the use of CT at more than one inter-vertebral level to
confirm visceral fat area (Demerath et al. 2008; Greenfield et al. 2002). High
visceral fat area was demonstrated over L2-L3 and L4-L5 in Aboriginal males and
females compared with Caucasians, in addition to higher SAD at L2-L3 relative to
lower in the abdomen. In Asians, abdominal height (the sagittal abdominal
diameter) was strongly related to VFA, whilst the breadth of the supine abdomen
(transverse abdominal diameter) more strongly associated with subcutaneous adipose
(Yim et al. 2010). VFA was strongly associated with SAD and with several
metabolic syndrome factors in this analysis, which is consistent with other reports
(Demerath et al. 2008; Koster et al. 2010; Ohrvall et al. 2000; Wennersberg et al.
2009). Since SAD has been shown to closely correlate with VFA by this study, and
in other populations (Yim et al. 2010), SAD represents an important clinical risk
marker across populations who have different body compositions.
The android pattern of obesity is characterised by upper body fat deposition, rapid
lipolysis and liposynthesis, hypertension and the development of premature
cardiovascular disease (Vague 1956). Android obesity is usually expected in males
(Kvist et al. 1988), and was only confirmed in Aboriginal females by the detailed
body composition methodology used. The metabolically healthy obese phenotype in
Caucasian females is characterised by lower VFA, higher SFA (at the same waist
circumference) and lower triglycerides, insulin levels and higher HDL-cholesterol
(Messier et al. 2010). It was suggested that in obesity, low adiponectin levels permit
unsuppressed lipase activity which promotes HDL clearance (Cnop et al. 2003). In
the present analysis, 14/16 Aboriginal females had more than 32 percent body fat,
and eleven had a low HDL-cholesterol (< 1.29 mmol/L). Low HDL-cholesterol is a
recognised cardiovascular disease risk marker (Wilson et al. 1998), and in
Indigenous males and females was associated with central obesity (O'Neal et al.
2008). The NCEP definition of low HDL-cholesterol has gender-specific thresholds
(NCEP ATP III 2002) which recognises that Caucasian females do not readily
deposit intra-abdominal fat (as shown in our analysis) unless very overweight, or
post-menopausal (Messier et al. 2010). Use of different HDL-cholesterol levels to
identify risk in male and female Indigenous Australians is therefore misleading,
since Aboriginal women readily deposit intra-abdominal fat, and experience higher
147
cardiovascular disease burden than similarly aged Caucasian females (Wang et al.
2003).
Chronic low-grade elevations in CRP concentrations are linked with increased risk
of cardiovascular disease (Kaptoge et al. 2010; Ridker et al. 1998; Ridker et al.
2002). In the present analysis, Aboriginal participants demonstrated an adverse
metabolic profile, though high CRP, IL-6 and low HDL-cholesterol and adiponectin
levels were more characteristic of females; in contrast high HOMA score, and
insulin and CRP concentrations was more characteristic of males. Aboriginal
females have a large burden of cardiovascular disease that is not predicted by
traditional cardiovascular risk factors (Wang et al. 2003). Aboriginal females from a
remote community showed a strong linear relationship of CRP concentration with
higher BMI that was not observed in males, and was also consistent with a high
community-level prevalence of cardiovascular disease (Shemesh. et al. 2007). In the
present analysis, CRP concentrations had a strong inverse relationship with HDL-
cholesterol and adiponectin concentrations and strong positive association with
VFA. Therefore abdominal obesity is an important modifiable link to cardiovascular
disease risk in Aboriginal women.
Adiponectin has anti-inflammatory, anti-atherogenic and insulin-sensitising
properties (Wiecek et al. 2007). Two of the three factors identified in the Principal
Components Analysis in this study linked body composition with metabolic
syndrome factors and low-adiponectin levels. Factor-1 described the combination of
high total and abdominal obesity which clustered with low adiponectin and high
leptin, HOMA and CRP levels. Factor-2 clustered Aboriginal ethnicity with
abdominal obesity, high CRP, low adiponectin and low HDL-cholesterol. First
Nation Canadian populations with both of these characteristics (high leptin and low
adiponectin concentrations) are reported to have a higher risk of incident diabetes
(Ley et al. 2008). In the present analysis, low adiponectin levels were therefore
shown to associate with inflammation, vascular risk and insulin resistance in young
adults. Lower adiponectin levels were reported in people with predominant visceral
obesity (Kursawe et al. 2010; Spencer et al. 2011). In addition, their subcutaneous
abdominal adipocytes (compared with adults with subcutaneous predominant pattern
of obesity) showed lower adiponectin gene expression, pro-inflammatory
148
macrophage activation, abnormal adipocyte size and lipid storage capacity (Kursawe
et al. 2010; Spencer et al. 2011). Abnormal subcutaneous adipocyte size and storage
capacity was postulated by the investigators to promote ectopic intra-abdominal
adipose deposition (Kursawe et al. 2010).
Insulin sensitivity or resistance may be influenced by several factors including body
composition (Yki-Jarvinen et al. 1985), renal clearance (Charlesworth et al. 2005;
Rabkin et al. 1984), diet (Johnston et al. 2010) and physical activity (Mendham et al.
2012). High HOMA score clustered with high leptin and low adiponectin
concentrations in the factor analysis in the present study. Adiponectin concentration
was reported to be highly related to insulin sensitivity (Bluher et al. 2005) and low
A:L ratio, or low adiponectin or low HMW adiponectin concentrations were shown
to strongly indicate insulin resistance (Ley et al. 2008). Higher than expected
triglyceride and insulin concentrations have been previously reported among lean
healthy Aboriginal populations (O'Dea et al. 1980; O’Dea et al. 1988b). In addition,
a higher risk of diabetes was reported among Aboriginal people with higher rather
than lower BMI (Daniel et al. 1999). The present study has identified total and
abdominal adiposity was linked with high HOMA, and since high relative abdominal
adiposity occurs at a relatively low BMI in Aboriginal people, provides some
evidence for the higher risk of diabetes at marginally elevated BMI reported above
by Daniel et al. (Daniel et al. 1999).
Sedentary behaviour may also explain some of this insulin resistance; however it
was not possible in the present study to undertake dynamic studies to explore this.
Among overweight, but otherwise healthy middle aged Aboriginal males, Mendham
et al. (Mendham et al. 2012) showed high fasting IL-6, CRP and insulin levels while
at rest, but dramatic acute anti-inflammatory and insulin sensitising response
following exercise. The persistence of insulin resistance in lean Aboriginal people
may have been an important survival advantage in a demanding traditional nomadic
lifestyle (O’Dea et al. 1988b). It is noted that the adverse metabolic profiles
characterised by low physical activity and poor quality, energy-dense foods are
improved in as little as seven weeks in Aboriginal people who undertake healthy
lifestyle modification (O'Dea 1984).
149
Limitations
A number of limitations are identified in this study. Studies involving detailed
health and body composition assessments in non-athlete adults are prone to
recruitment difficulties. Ideally equal numbers of Aboriginal and non-Indigenous
participants were sought in our study. Kvist et al. (Kvist et al. 1988) took 10 years to
collate a “healthy” Caucasian cohort to demonstrate the equivalence of a single CT
slice (either L2-L3 or L4-L5) with CT volume. Others have assessed healthy
participants, but over a wider age range (Carey et al. 1996), or a specific community
such as a church group (Craig et al. 2003) or employment group (Ohrvall et al.
2000). Our health and body composition assessments were strengthened by limiting
recruitment to a narrow age-range, confirming health (rather than relying on self-
reported health) (Gallagher et al. 2000), assessing direct with indirect body
composition modalities, and extending the relationship of common biochemical
studies with detailed adipokines. Detailed glucose homeostasis studies, and even 2
hour glucose and insulin (post oral glucose challenge) are more sensitive to
demonstrate changes in insulin sensitivity. However, research facilities which
enable supervised overnight fasting and euglycaemic clamp studies are not feasible
in the Northern Territory. An oral glucose tolerance test would have been useful in
this analysis however the complexity of the study protocol did not permit this
additional assessment. Measurement of abdominal fat volume was also not possible,
due to the high clinical demand on the single MRI scanning device (servicing
Northern Australia), and the ethical limitation of large radiation doses in otherwise
healthy people with fat volume measures by CT. Further study of Aboriginal
females with less than 32% body fat would further assist in the understanding of
magnitude of metabolic changes involved with excess body fat in females.
Conclusion
In conclusion, young adult Aboriginal people (and particularly women) display a
higher risk of chronic disease with modest gains in body weight, compared with non-
Indigenous adults. This has been demonstrated by higher truncal body fat, intra-
abdominal fat area and lower peripheral subcutaneous fat with overweight.
Furthermore abnormal concentrations of insulin, HOMA, inflammatory and
adipokine markers was associated with this high-risk body composition, though were
notably absent (except for a trend to insulin resistance) in Aboriginal participants
150
with low body fat, consistent with reports of excellent health in lean Aboriginal
peoples. In Aboriginal peoples, diabetes risk may therefore be driven by a body
composition typified by high total and abdominal adiposity. In combination with
high community levels of cigarette smoking and sedentary behaviour, the high risk
body composition of young adult Aboriginal people who are overweight requires
urgent attention to modify the progression of risk towards the emergence of
preventable chronic diseases.
Chapter 5. eGFR Study DXA Sub-study:
The Relationship of Body Build
and Composition with
Components of the
Metabolic Syndrome in
Indigenous Australians who
participated in the eGFR Study
DXA sub-study
152
5.1. Introduction
Aboriginal peoples and Torres Strait Islander peoples are grouped under a unifying
identity as Australia’s Indigenous peoples. A high prevalence of chronic disease and
chronic disease risk markers are reported in both Aboriginal and Torres Strait
Islander communities, and contribute to the wide disparity in health status of adults
(Vos et al. 2009). Numerous studies in larger populations and over a number of
regions of Australia have used portable anthropometric tools to associate body size
with chronic disease indicators, including body circumferences (waist, hip), waist:
hip ratio (WHR), body mass index (BMI), and in some studies bioelectrical
impedance analysis. Studies involving detailed body composition in Australia’s
Aboriginal peoples and Torres Strait Islander peoples are limited to one small study
involving sixteen healthy Aboriginal and Caucasian females in a university research
hospital facility in Sydney (Raja et al. 2003). Although differences in body fat were
shown between the groups, the results may not be applicable to other settings,
including participants with chronic disease, males, other Aboriginal groups and
Torres Strait Islander people. Heitmann et al. (Heitmann et al. 1997) showed that the
relationship of body size and bioelectrical impedance in Aboriginal people differed
compared with Torres Strait Islander and Caucasian people. Waist circumference
and body mass index are simple portable tools to assess obesity, yet have not been
validated against sophisticated body composition methods in Aboriginal people and
Torres Strait Islander people (beyond data presented in Chapter 4). Ascertaining the
appropriate thresholds for total and abdominal obesity is a health priority in many
non-Caucasian populations (WHO 2000).
Objectives
The primary objective was to explore ethnicity-dependent differences in body build
and body composition among Indigenous Australian adults (Aboriginal, Torres Strait
Islander, and Both-ATSI), who participated in the DXA sub-study of The eGFR
Study (herewith referred to as “eGFR Study DXA sub-study”). The relationships of
body build and body composition with components of the metabolic syndrome in
Indigenous Australians was also assessed.
153
5.2. Methods
5.2.1. Participants
194 people from the Top-End region of the Northern Territory and Thursday Island
in Far North Queensland were recruited in The eGFR Study and also completed
whole body dual energy x-ray absorptiometry (DXA). One hundred and eighty nine
people were assessed, including 51 Aboriginal participants, 81 Torres Strait Islander
participants, 30 Both-ATSI participants (those of mixed Aboriginal and Torres Strait
Islander heritage) and 27 Caucasian participants. The following people were
excluded from the analysis: four participants were non-Indigenous, and non-
Caucasian, and one morbidly obese Torres Strait Islander male (BMI >60 kg/m2) had
an inadequate whole body scan of soft tissue regions.
Participants were compared for differences in body composition based on self-
identified ethnicity, and reported ethnicity of 4 grandparents. Ethnicity was defined
as:
• “Aboriginal” participants: self-identified as an Aboriginal person and had no
Torres Strait Islander grandparents;
• “Torres Strait Islander” participants: self-identified as Torres Strait Islander
person (TSI ) and had no Aboriginal grandparents;
• “Both Aboriginal and Torres Strait Islander (Both-ATSI)” participants: self-
identified as both Aboriginal and Torres Strait Islander. They also had
grandparents who identified as Both-ATSI, or had both an Aboriginal and a
Torres Strait Islander grandparent. Additionally, if a person identified as
either an Aboriginal person (alone) or Torres Strait Islander person (alone),
but had an Indigenous grandparent who identified in another Indigenous
group, the participant was classified in the Both-ATSI group. This occurred
in five participants: 3 Aboriginal males and two Torres Strait Islander females
were assigned to Both-ATSI based on grandparent ethnicity.
154
• “Caucasian” participants: self-identified as a non-Indigenous Australian and
reported four grandparents who were of Caucasian background.
• “Indigenous”: refers to a combined cohort of Aboriginal participants, Torres
Strait Islander participants and Both-ATSI participants.
All participants (n=189) reported their gender and age, completed an adequately
positioned and analysed whole body DXA study, and permitted measurement of their
height and weight. All participants were invited (but were not obliged) to complete
other measures including anthropometry, blood pressure, bioelectrical impedance
analysis, urinalysis for albumin to creatinine ratio, a non-fasting blood test and a
medical and social questionnaire. All five metabolic syndrome factors were assessed
in 165 participants.
5.2.2. Body Composition Analysis and Other Assessments
The assessment protocol for The eGFR Study is reported in Chapter 2.3. Each adult,
at least 16 years old received information about the objectives of the study, and
provided written informed consent to participate. Body composition was assessed by
the following measures in all participants, regardless of assessment site: height,
weight, waist and hip circumference. WHR and BMI were calculated. Bioelectrical
impedance analysis (BIA) was recorded by tetra-polar electrode arrangement in the
supine position after minimum 5 minutes rest. The participant was requested to void
prior to the BIA test. Participants were not assessed with BIA if they had a metal in-
dwelling device, or prosthesis. The protocols for height, weight, waist and hip
circumferences and bioelectrical impedance are reported in detail in Chapter 2.
A questionnaire was administered by study staff to ascertain age, gender, medical
history, smoking status, self-identified ethnicity and reported ethnicity of each 4
grandparents (see Appendix 1). A rested sitting blood pressure was also recorded.
Non-fasting blood tests included serum creatinine, HbA1c, non-fasting lipids and C-
reactive protein (CRP). A mid-stream urine was assessed for urinary albumin to
creatinine ratio (ACR). Kidney function was reported in this analysis as estimated
glomerular filtration rate (eGFR) by the 4-variable modification of diet in renal
155
disease study (Levey et al. 1999), based on serum creatinine measured in local
laboratories, which was in accordance with Australian standard clinical care
(Mathew et al. 2007).
Whole body DXA was offered at two sites (Darwin and Thursday Island) in the
eGFR Study DXA sub-study. In Darwin, a whole body DXA scan (Norland XR-46)
was offered to all eGFR Study participants between July 2008 and May 2010. This
offer was extended to participants who resided in Darwin, or to participants who
lived regionally or remotely when they were visiting Darwin. A Hologic whole body
DXA scanner, mounted in a transportable vehicle was transferred from Sydney to
Thursday Island coinciding with an eGFR Study recruitment visit over a two week
period in February 2010. Participants at each scan location underwent the same
preparation, wore light-weight clothing, and were scanned using the same
positioning protocols.
The method of skeletal proportions was described in detail in Chapter 2.3.7.1. Data
was reported as leg-length (most superior aspect of the greater trochanter to most
inferior part of malleolus), and trunk-length (defined as standing height minus leg-
length). Pelvis-width was defined by the inter-trochanteric distance, measured
between the most superior aspect of the left and right greater trochanter. Leg-length
and pelvis-width was calculated relative to standing height, reported as leg-length
percent ([leg-length (cm)/ standing height (cm)] x 100%) and pelvis-width percent of
height ([pelvis width (cm)/ standing height (cm)] x 100%).
Total fat mass, lean (non-bone) mass and bone mass were described for each
participant. Trunk mass (fat or lean) concerns the regions enclosing the chest,
midriff and pelvis. Peripheral mass (fat or lean) concerns the regions of upper and
lower limbs (excluding the buttocks and head). Trunk:peripheral fat ratio was
calculated as (trunk fat mass/peripheral fat mass).
There are no published soft tissue conversion equations for Hologic to Norland
available to test in this group. We were unable to assess participants on each scan
device on the same day.

156
5.2.3. Metabolic and Inflammatory Profile
Five metabolic syndrome factors were assessed categorically (as five individual
factors and as a binary outcome measure of ≥3 versus <3 factors) to assess the
relationship of total fat mass and fat distribution between ethnic groups. The
protocol was based on a non-fasting blood assessment.
• Diabetes was defined as a previous diagnosis of diabetes or an HbA1c ≥ 6.5%
where no former diagnosis was known (American Diabetes Association
(ADA) 2011; Saudek et al. 2008; Selvin et al. 2011). Diabetes status was
determined in 187 participants. Two older Aboriginal females who were not
assessed at a health clinic did not provide a medical history or medications
list in order to classify diabetes status, and were excluded in the analysis of
the metabolic syndrome.
• Low non-fasting HDL-cholesterol (NCEP ATP III 2001) was defined as less
than 1.0 mmol/L regardless of gender, since low levels of HDL-cholesterol
are reported in both Indigenous men and women (O'Neal et al. 2008;
Shemesh et al. 2008).
• Hypertension was defined as a positive medical history of hypertension, or
either a systolic blood pressure ≥ 130 mmHg or diastolic blood pressure ≥ 85
mmHg on the day of assessment (NCEP ATP III 2001).
• Obesity was defined as a WHR ≥ 0.90 in males, or ≥ 0.85 in females, or a
BMI > 30 kg/m2 (WHO 1999).
• Albuminuria was defined as ACR ≥ 2.5 mg/mmol in males, or ACR ≥ 3.5
mg/mmol in females (Tapp et al. 2004). There were no females who were
concurrently menstruating with borderline albuminuria (3.5-5 mg/mmol).
157
5.2.4. Statistical Analysis
The main purpose of the analysis was to describe body composition differences
between adult Aboriginal participants and adult Torres Strait Islander participants,
who comprised the two largest groups in this analysis. The unadjusted observed
means within ethnic groups reflects data combined for both males and females.
Since ethnicity and gender impact on body composition (Gallagher et al. 2000),
analysis of covariance (ANCOVA), adjusting for these variables and the interaction
term ethnicity*gender was presented in summary statistics. The relationship of body
composition with biochemical abnormalities was also explored, however strong
conclusions are limited in this analysis since the cohort was not a population-
representative sample.
Data was expressed as means (standard deviation) for age, anthropometry, DXA
body composition measures, and eGFR which were all normally distributed.
Biochemical variables (except eGFR) were expressed as median (inter-quartile
range). Differences between groups, and assessment of biochemical data in
modelling was performed using log-transformed biochemical data.
A comparison of general characteristics and biochemistry was assessed (in Table
5.1). Differences in body size, skeletal proportions and composition was assessed
between ethnic groups (in Table 5.2) using ANCOVA for continuous variables, and
logistic regression for categorical variables. Data was presented as unadjusted
observed means for each ethnic group. The main effects of ethnicity, gender and the
interaction term (ethnicity*gender) was indicated by the p-value. As age, gender,
and chronic disease affect body composition, differences in body measures and
composition were further assessed for the impact of eGFR, diabetes, albuminuria and
age between ethnic groups, and was presented in Appendix Table 5. The main
effects were examined as follows: first, if the post-estimation test showed the
ethnicity*gender interaction was not statistically significant (p>0.05), the interaction
term was dropped from the model, and the main effect of ethnicity independent of
gender was assessed. If the interaction term was statistically significant (p<0.05),
assessment of body measures between ethnic groups was assessed separately in each
gender.
158
The relationship of WHR and BMI was investigated in males and females separately
with pair-wise correlations and demonstrated by scatter plots in Figure 5.1 and
Figure 5.2 for males and females respectively. Differences in skeletal proportions
between groups were also described in further detail (in Chapter 5.3.3). The
relationship of lean body mass and resistance was examined by multivariate
regression analysis, and shown in Table 5.3 and Table 5.4.
The frequency of five metabolic syndrome factors in participants (zero to five
factors, and categorically as ≥3 v <3 factors) was presented by ethnic group in Table
5.5. Logistic regression with post-estimation testing indicated the significance of
ethnicity, gender and the ethnicity*gender interaction term for each metabolic
syndrome factor. Logistic regression was used to assess the odds of metabolic
syndrome (≥ 3 factors v <3 factors) with DXA measures of adiposity, adjusted for
age, gender, ethnicity, and eGFR (shown in Table 5.6). Inflammation is highly
associated with cardiovascular disease risk and the metabolic syndrome, and the
relationship of log-CRP with total and central adiposity and metabolic syndrome was
explored in a multivariate regression model in Table 5.7.
159
5.3. Results: eGFR Study DXA sub-study
5.3.1. eGFR Study DXA sub-study: General and Biochemical Characteristics of Participants
Table 5.1 shows statistically significant ethnicity-dependent differences in kidney
function (eGFR), albuminuria, and concentration of HDL-cholesterol. The
Caucasian group were older, had a higher proportion of males, and a lower
proportion of current smokers than the three Indigenous groups. Caucasian
participants had a lower eGFR than Indigenous participants. Despite a lower
proportion of impaired kidney function (eGFR<60 ml/min/1.73m2), Aboriginal
participants had a higher median ACR (and higher proportion of albuminuria) than
other groups. Females had a higher log-CRP concentration than males. The
relationship of log-CRP concentration with other variables is described in more detail
below (in section 5.3.9).
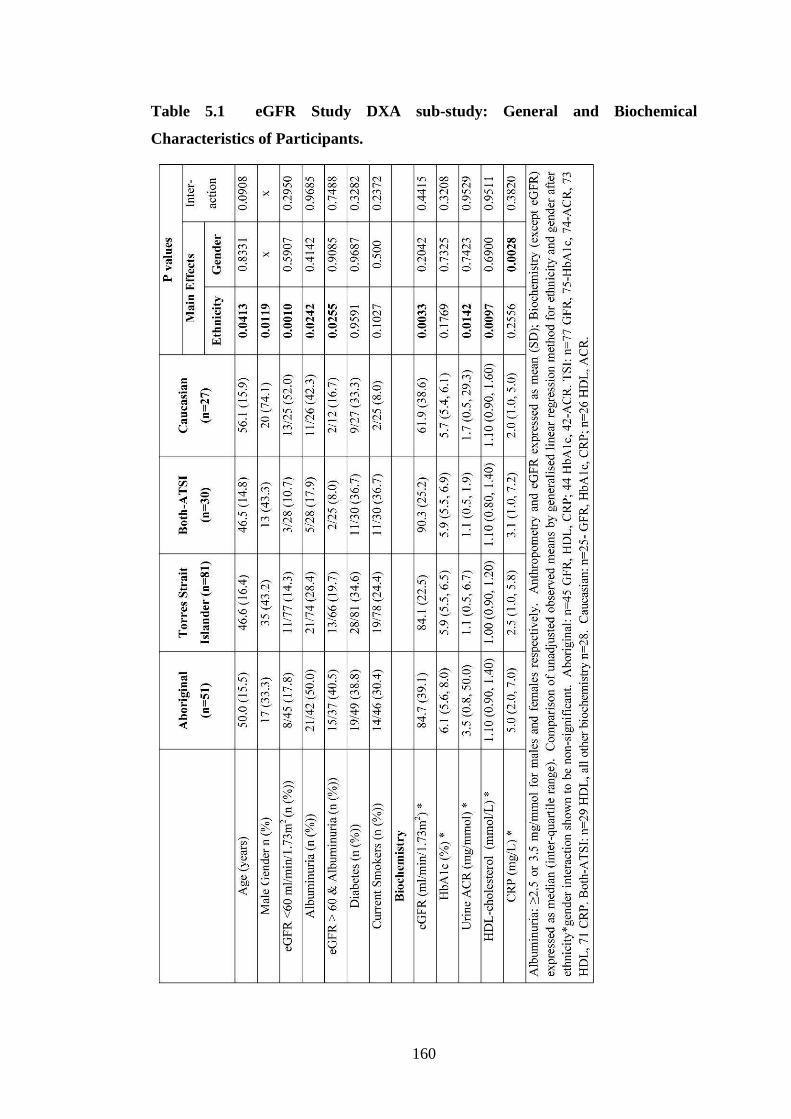
160
Table 5.1 eGFR Study DXA sub-study: General and Biochemical
Characteristics of Participants.
161
5.3.2. eGFR Study DXA sub-study: Body Composition Characteristics
Ethnicity-dependent differences in body size, skeletal proportions, fat measures, and
lean mass are shown in Table 5.2. Aboriginal participants had the highest body fat
percent and trunk:peripheral fat ratio than the other three groups, regardless of
gender.
Participants with a Torres Strait Islander background (either Torres Strait Islander or
Both-ATSI) had the lowest WHR despite the highest weight, highest body mass
index, and highest total and regional lean mass.
The ethnicity*gender interaction term was significant for waist circumference
(p=0.02). Therefore ethnicity-dependent differences in waist circumference were
assessed separately in males and females. This revealed a trend to ethnicity-
dependent differences in waist circumference in females (p=0.07), but not males
(p=0.23). Caucasian females had a lower waist circumference than Torres Strait
Islander females and Both-ATSI females.
The ethnicity*gender interaction term was significant for hip circumference
(p=0.01). Torres Strait Islander and Both-ATSI females had a higher hip
circumference than Aboriginal females and Caucasian females; whereas hip
circumference was similar between Aboriginal females and Caucasian females.
There was no ethnicity-dependent differences in hip circumference between males
(p=0.94).
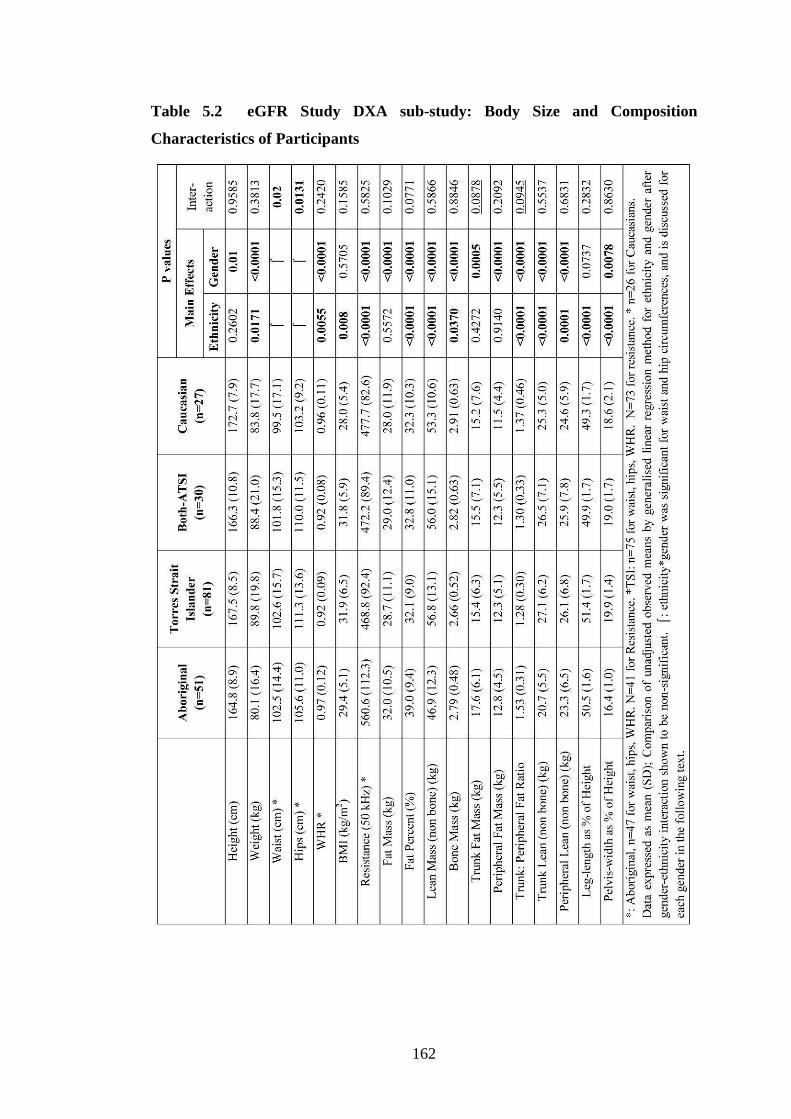
162
Table 5.2 eGFR Study DXA sub-study: Body Size and Composition
Characteristics of Participants
163
5.3.3. eGFR Study DXA sub-study: Body Composition Adjusted for Age, Gender, Diabetes and indicators of Kidney Damage.
As expected, age, gender, ethnicity and indicators of chronic disease influence body
size and composition in this multi-ethnic stratified chronic disease cohort. A detailed
presentation of these relationships is found in Appendix Table 5.
5.3.4. eGFR Study DXA sub-study: Relationship of BMI and WHR in Participants
As outlined in the methods (Chapter 5.2.3), obesity was defined as WHR ≥0.9 in
males or ≥0.85 in females, or a BMI > 30 kg/m2. Half of the cohort was obese by
BMI criteria alone. There was a strong positive correlation between WHR and BMI
in males and females, as indicated in Figure 5.1 and Figure 5.2 respectively. The
relationship of WHR and BMI was not significant in each sex-stratified ethnic group.
This may have been due to small numbers of participants. When the ethnicity term
was included as a covariate, it also did not explain differences in the strength of the
relationship between sex-stratified groups.
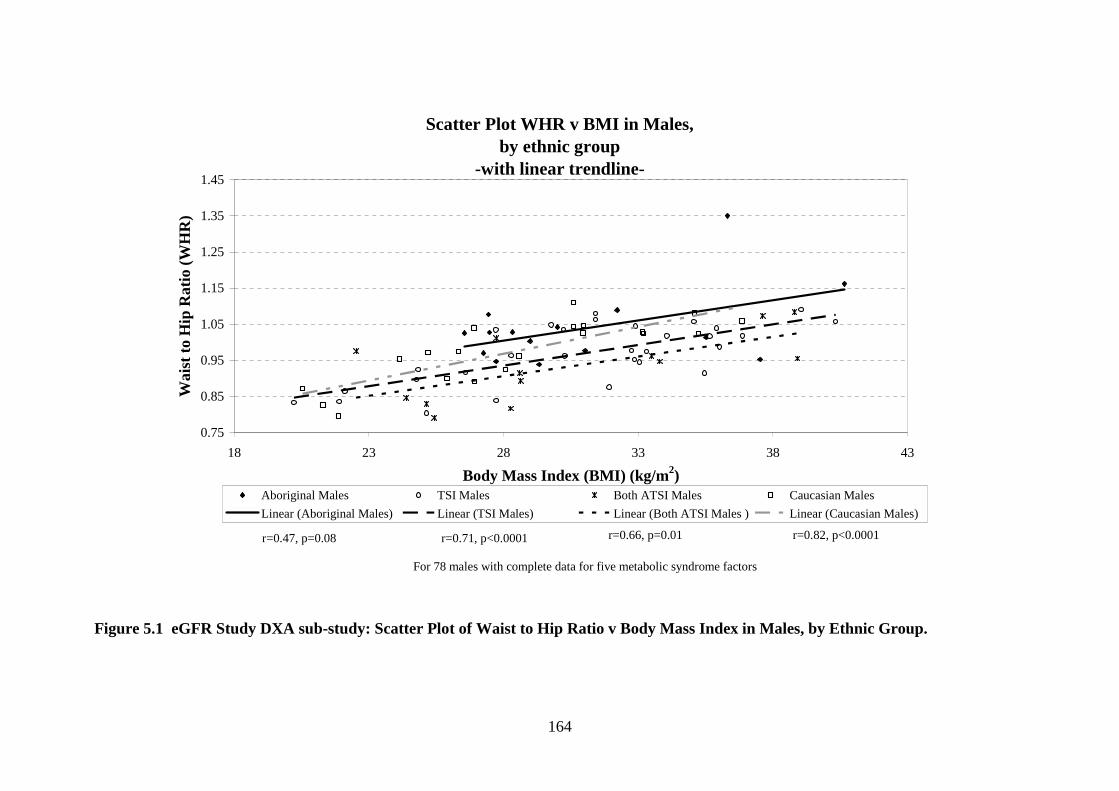
164
Scatter Plot WHR v BMI in Males, by ethnic group
-with linear trendline-
0.75
0.85
0.95
1.05
1.15
1.25
1.35
1.45
18 23 28 33 38 43
Body Mass Index (BMI) (kg/m2)
Wai
st to
Hip
Rat
io (
WH
R)
Aboriginal Males TSI Males Both ATSI Males Caucasian Males
Linear (Aboriginal Males) Linear (TSI Males) Linear (Both ATSI Males ) Linear (Caucasian Males)
For 78 males with complete data for five metabolic syndrome factors
r=0.47, p=0.08 r=0.71, p<0.0001 r=0.66, p=0.01 r=0.82, p<0.0001
Figure 5.1 eGFR Study DXA sub-study: Scatter Plot of Waist to Hip Ratio v Body Mass Index in Males, by Ethnic Group.
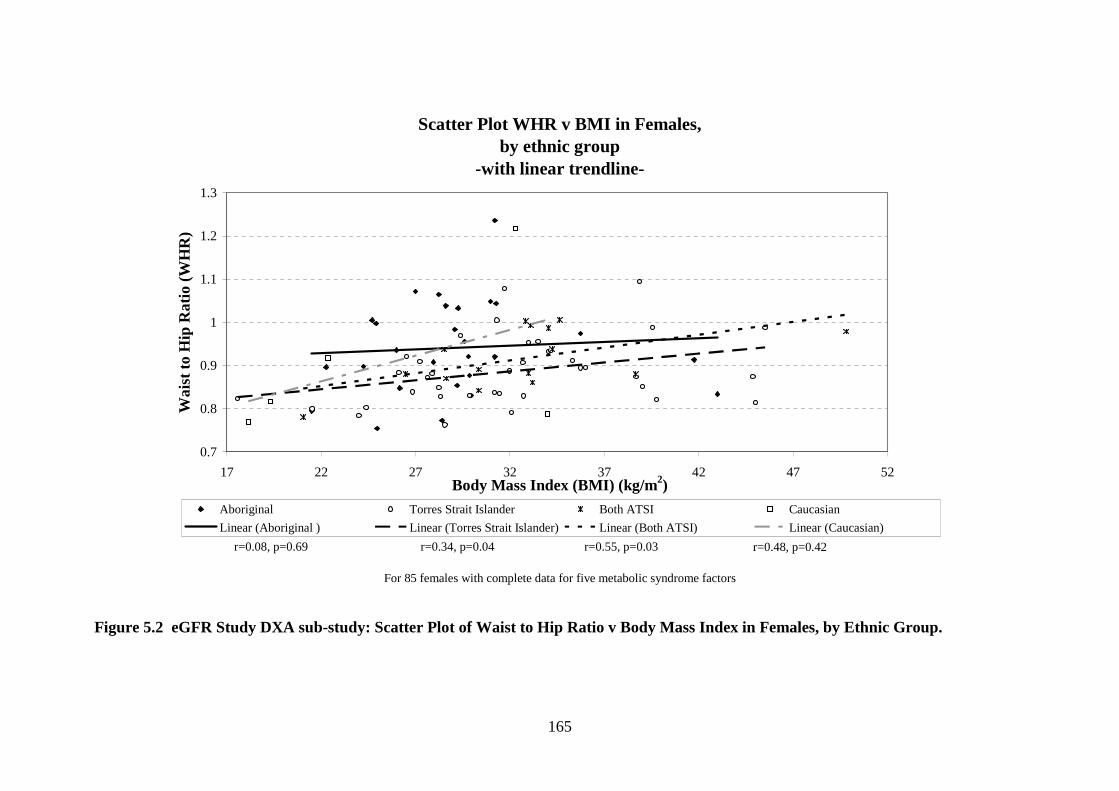
165
Scatter Plot WHR v BMI in Females, by ethnic group
-with linear trendline-
0.7
0.8
0.9
1
1.1
1.2
1.3
17 22 27 32 37 42 47 52Body Mass Index (BMI) (kg/m2)
Wai
st to
Hip
Rat
io (
WH
R)
Aboriginal Torres Strait Islander Both ATSI Caucasian
Linear (Aboriginal ) Linear (Torres Strait Islander) Linear (Both ATSI) Linear (Caucasian)
For 85 females with complete data for five metabolic syndrome factors
r=0.08, p=0.69 r=0.34, p=0.04 r=0.55, p=0.03 r=0.48, p=0.42
Figure 5.2 eGFR Study DXA sub-study: Scatter Plot of Waist to Hip Ratio v Body Mass Index in Females, by Ethnic Group.
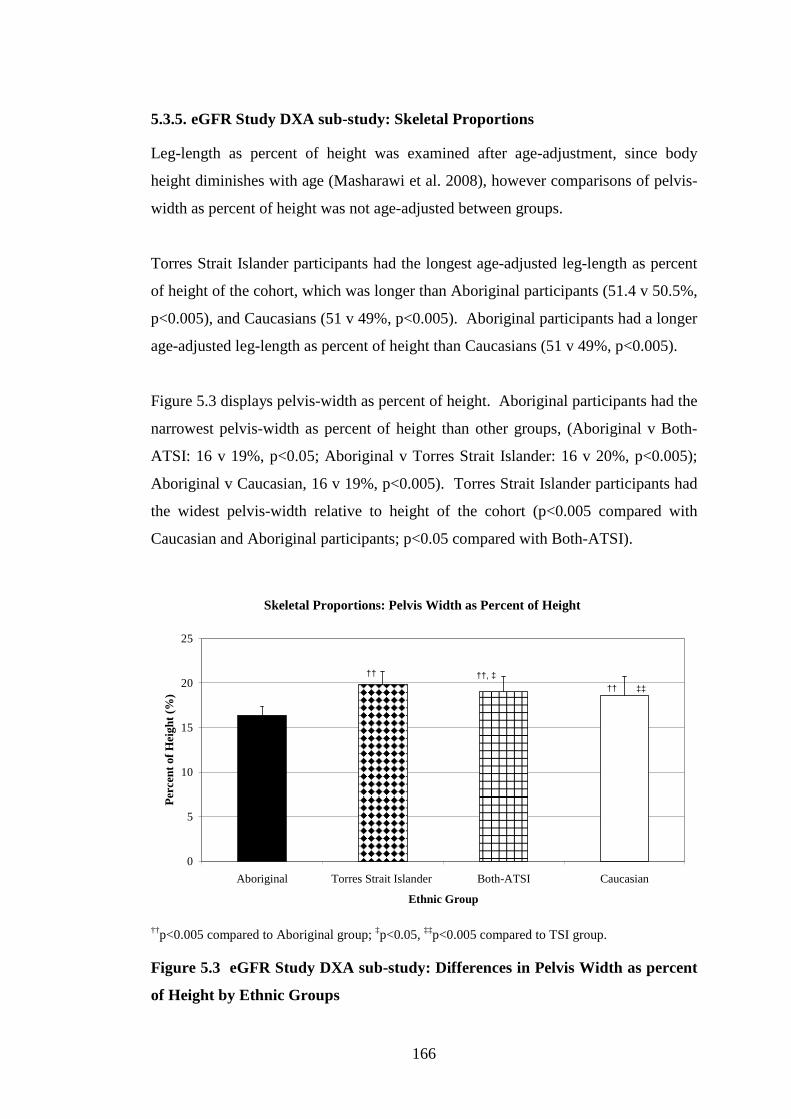
166
5.3.5. eGFR Study DXA sub-study: Skeletal Proportions
Leg-length as percent of height was examined after age-adjustment, since body
height diminishes with age (Masharawi et al. 2008), however comparisons of pelvis-
width as percent of height was not age-adjusted between groups.
Torres Strait Islander participants had the longest age-adjusted leg-length as percent
of height of the cohort, which was longer than Aboriginal participants (51.4 v 50.5%,
p<0.005), and Caucasians (51 v 49%, p<0.005). Aboriginal participants had a longer
age-adjusted leg-length as percent of height than Caucasians (51 v 49%, p<0.005).
Figure 5.3 displays pelvis-width as percent of height. Aboriginal participants had the
narrowest pelvis-width as percent of height than other groups, (Aboriginal v Both-
ATSI: 16 v 19%, p<0.05; Aboriginal v Torres Strait Islander: 16 v 20%, p<0.005);
Aboriginal v Caucasian, 16 v 19%, p<0.005). Torres Strait Islander participants had
the widest pelvis-width relative to height of the cohort (p<0.005 compared with
Caucasian and Aboriginal participants; p<0.05 compared with Both-ATSI).
Skeletal Proportions: Pelvis Width as Percent of Height
0
5
10
15
20
25
Aboriginal Torres Strait Islander Both-ATSI Caucasian
Ethnic Group
Per
cent
of H
eigh
t (%
)
†† ††, ‡
†† ‡‡
††p<0.005 compared to Aboriginal group; ‡p<0.05, ‡‡p<0.005 compared to TSI group.
Figure 5.3 eGFR Study DXA sub-study: Differences in Pelvis Width as percent
of Height by Ethnic Groups
167
Torres Strait Islander females compared with Torres Strait Islander males, had a
shorter leg-length as percent of height (51 v 52%, p=0.023) and wider pelvis-width
as percent of height (20 v 19%, p=0.010). Torres Strait Islander females also had a
wider pelvis-width as percent of height than Caucasian females (20 v 19%, p<0.05).
Aboriginal females had a similarly narrow pelvis-width as percent of height as
Aboriginal males (16 v 17%, p>0.05). The pelvis-width as percent of height was the
narrowest in Aboriginal females (Aboriginal: 17%; Caucasian 19%; Both-ATSI
19%; Torres Strait Islander 20%, all p<0.005).
5.3.6. eGFR Study DXA sub-study: Lean Body Mass and Resistance
Lean mass was associated with weight (r=0.80, p<0.0001), body mass index (r=0.49,
p<0.0001), and skeletal dimensions (leg-length percent, r=0.21, p=0.0041; pelvis-
width as percent of height, r=0.19, p=0.0096). Resistance was strongly and inversely
related to lean mass (r=-0.79, p<0.0001), weight (r=-0.69, p<0.0001), and pelvis-
width as percent of height (r=-0.30, p=0.0001) in this cohort. Resistance was not
related to fat mass (r=-0.12, p>0.05).
Ethnicity, gender and diabetes had significant main effects on both resistance and
lean mass (shown above in Figure 5.4). As shown in Figure 5.4, females had higher
resistance than males (p<0.0001). Within gender groups, Aboriginal male and
female participants had higher resistance than Torres Strait Islander male and female
participants respectively.
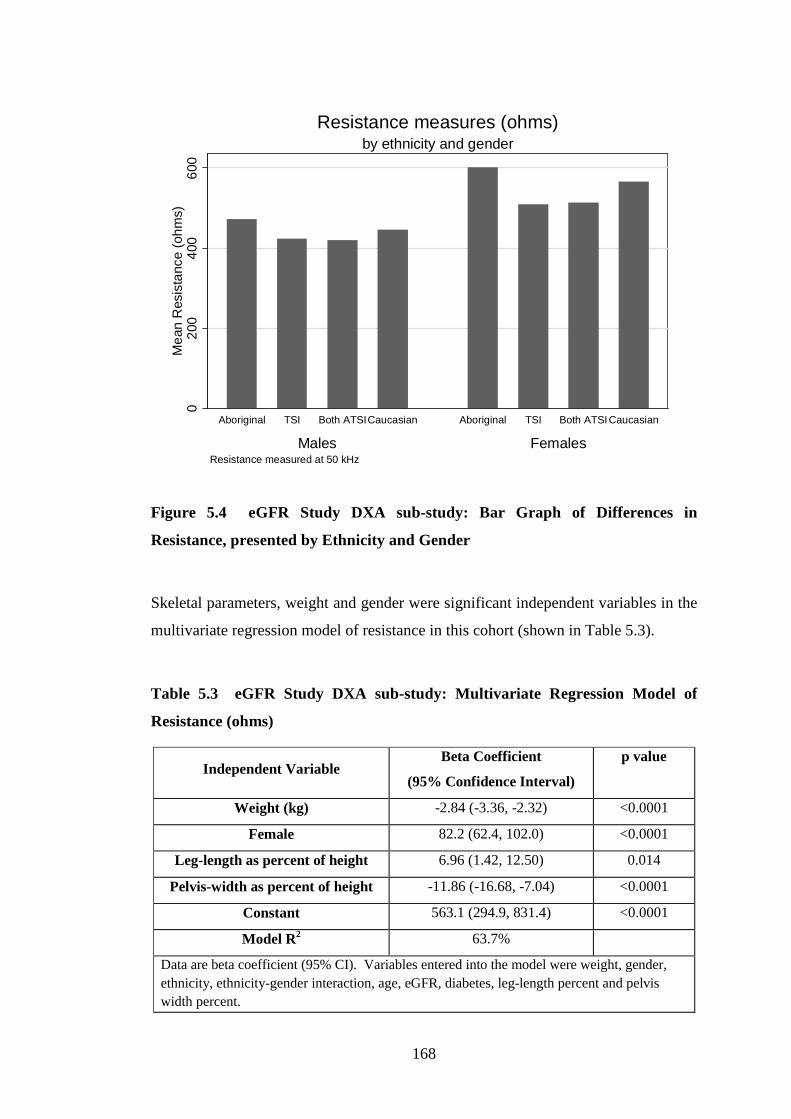
168
020
040
060
0M
ean
Res
ista
nce
(ohm
s)
Males Females
Aboriginal TSI Both ATSICaucasian Aboriginal TSI Both ATSICaucasian
Resistance measured at 50 kHz
by ethnicity and genderResistance measures (ohms)
Figure 5.4 eGFR Study DXA sub-study: Bar Graph of Differences in
Resistance, presented by Ethnicity and Gender
Skeletal parameters, weight and gender were significant independent variables in the
multivariate regression model of resistance in this cohort (shown in Table 5.3).
Table 5.3 eGFR Study DXA sub-study: Multivariate Regression Model of
Resistance (ohms)
Independent Variable Beta Coefficient
(95% Confidence Interval)
p value
Weight (kg) -2.84 (-3.36, -2.32) <0.0001
Female 82.2 (62.4, 102.0) <0.0001
Leg-length as percent of height 6.96 (1.42, 12.50) 0.014
Pelvis-width as percent of height -11.86 (-16.68, -7.04) <0.0001
Constant 563.1 (294.9, 831.4) <0.0001
Model R2 63.7%
Data are beta coefficient (95% CI). Variables entered into the model were weight, gender, ethnicity, ethnicity-gender interaction, age, eGFR, diabetes, leg-length percent and pelvis width percent.
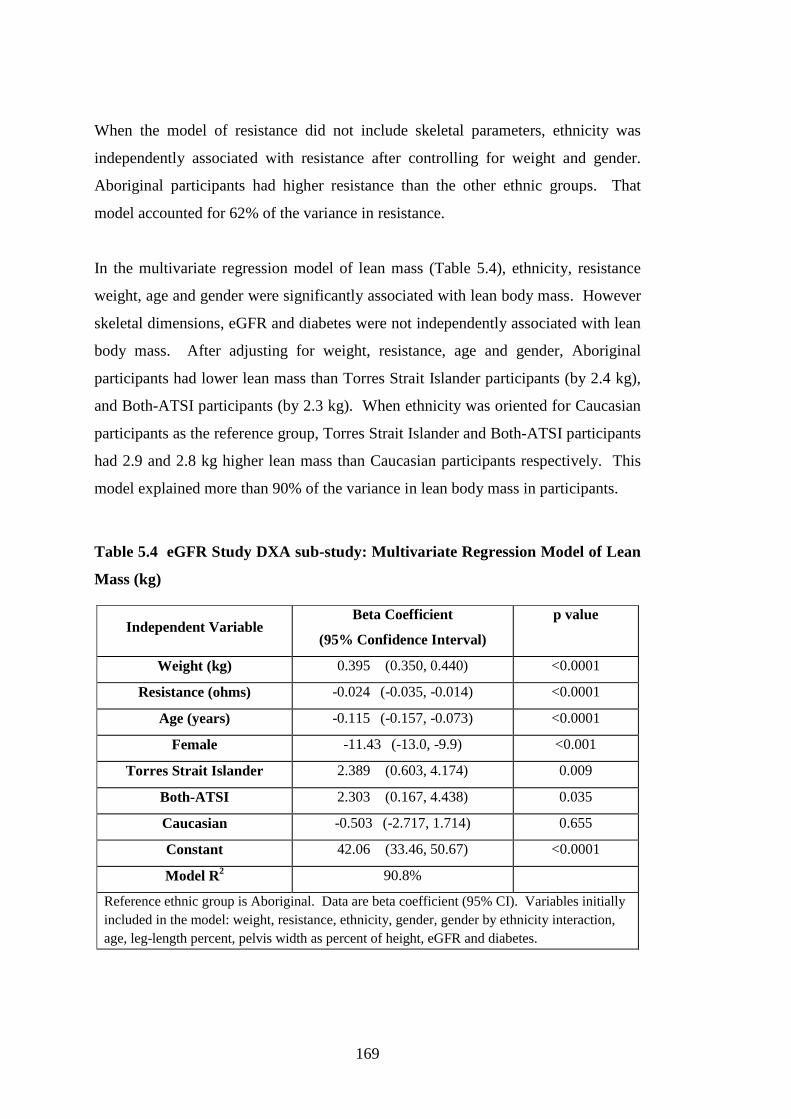
169
When the model of resistance did not include skeletal parameters, ethnicity was
independently associated with resistance after controlling for weight and gender.
Aboriginal participants had higher resistance than the other ethnic groups. That
model accounted for 62% of the variance in resistance.
In the multivariate regression model of lean mass (Table 5.4), ethnicity, resistance
weight, age and gender were significantly associated with lean body mass. However
skeletal dimensions, eGFR and diabetes were not independently associated with lean
body mass. After adjusting for weight, resistance, age and gender, Aboriginal
participants had lower lean mass than Torres Strait Islander participants (by 2.4 kg),
and Both-ATSI participants (by 2.3 kg). When ethnicity was oriented for Caucasian
participants as the reference group, Torres Strait Islander and Both-ATSI participants
had 2.9 and 2.8 kg higher lean mass than Caucasian participants respectively. This
model explained more than 90% of the variance in lean body mass in participants.
Table 5.4 eGFR Study DXA sub-study: Multivariate Regression Model of Lean
Mass (kg)
Independent Variable Beta Coefficient
(95% Confidence Interval)
p value
Weight (kg) 0.395 (0.350, 0.440) <0.0001
Resistance (ohms) -0.024 (-0.035, -0.014) <0.0001
Age (years) -0.115 (-0.157, -0.073) <0.0001
Female -11.43 (-13.0, -9.9) <0.001
Torres Strait Islander 2.389 (0.603, 4.174) 0.009
Both-ATSI 2.303 (0.167, 4.438) 0.035
Caucasian -0.503 (-2.717, 1.714) 0.655
Constant 42.06 (33.46, 50.67) <0.0001
Model R2 90.8%
Reference ethnic group is Aboriginal. Data are beta coefficient (95% CI). Variables initially included in the model: weight, resistance, ethnicity, gender, gender by ethnicity interaction, age, leg-length percent, pelvis width as percent of height, eGFR and diabetes.
170
5.3.7. eGFR Study DXA sub-study: Metabolic Syndrome
In the eGFR Study DXA sub-study, 165 participants (87%) provided anthropometric
and medical information to assess all five metabolic syndrome factors (albuminuria,
low HDL-cholesterol, obesity, hypertension and diabetes) (Table 5.5).
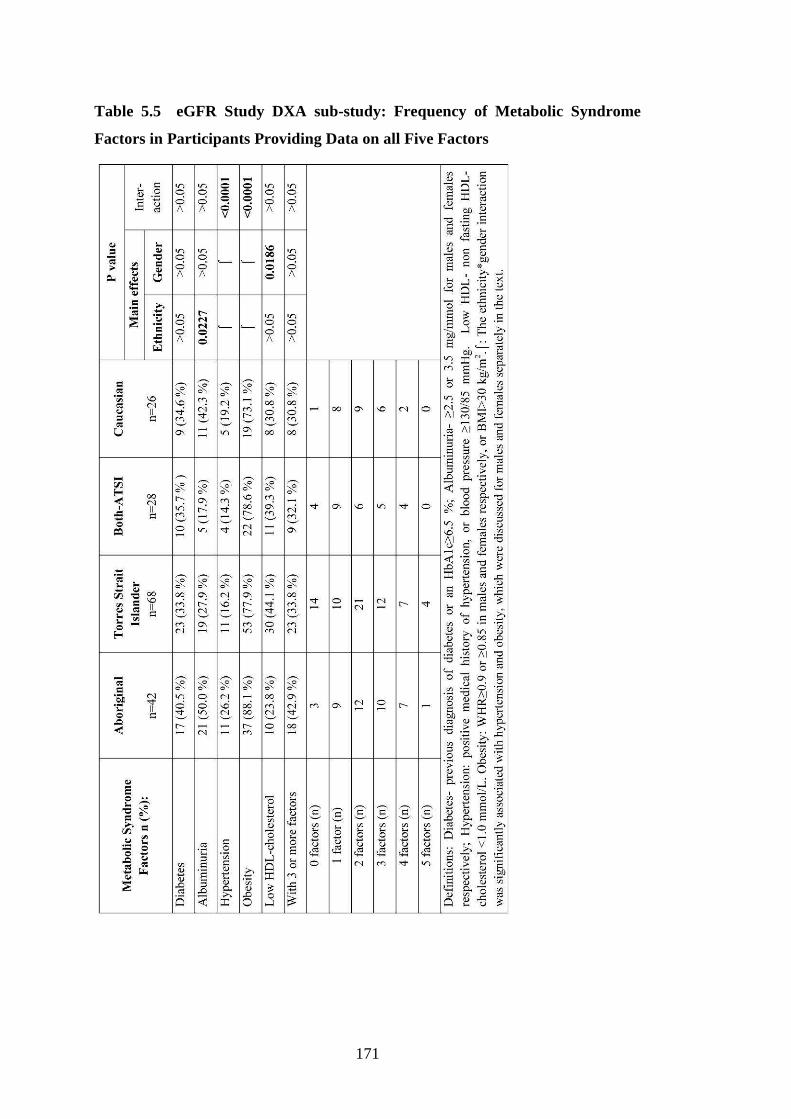
171
Table 5.5 eGFR Study DXA sub-study: Frequency of Metabolic Syndrome
Factors in Participants Providing Data on all Five Factors
172
Caucasian participants were more likely to be older, and had a higher proportion of
male participants compared with other groups. Aboriginal participants were also
older than Torres Strait Islander participants (6.1 years, p<0.05). Seventy
participants (42%) had at least 3 metabolic syndrome factors. There was no
significant difference in the proportions of participants with ≥3 metabolic syndrome
factors, or with diabetes between ethnic groups.
Aboriginal participants had higher odds of albuminuria than Torres Strait Islander
participants (p=0.02) and Both-ATSI participants (p=0.01). Aboriginal participants
had higher odds of hypertension than Torres Strait Islander participants (p=0.03).
Caucasians also had a higher odds of hypertension than people of a Torres Strait
Islander background (v Torres Strait Islander: p=0.001; v Both-ATSI: p=0.03).
There was no difference in the proportions of females with obesity between ethnic
groups. However, a higher proportion of Aboriginal males were obese compared
with Torres Strait Islander males (p<0.001) and compared with Caucasian males
(p<0.001). There was no ethnicity-dependent difference in the proportions of people
with low HDL-cholesterol. However, females had lower odds of low HDL-
cholesterol concentration than males (odds 0.42, 95% CI: 0.24, 0.89).
5.3.8. eGFR Study DXA sub-study: Relationship of Metabolic Syndrome with Body Size and Composition
The relationship of metabolic syndrome (the presence of ≥3 factors) with DXA
indicators of adiposity, age and eGFR was examined with bivariate analysis and
logistic regression.
In bivariate analysis, metabolic syndrome was significantly associated with
(unadjusted odds ratio (95% confidence interval)): eGFR 0.98 (0.97, 0.99); age, 1.08
(1.05, 1.11); fat mass 1.06 (1.03, 1.09); trunk fat mass 1.13 (1.07, 1.20); and
trunk:peripheral fat ratio 16.57 (5.44, 50.47). Metabolic syndrome was not related to
peripheral fat mass (p>0.05).
As shown in Table 5.6, older age and lower eGFR were associated with a higher
odds of metabolic syndrome when assessed in separate logistic regression models
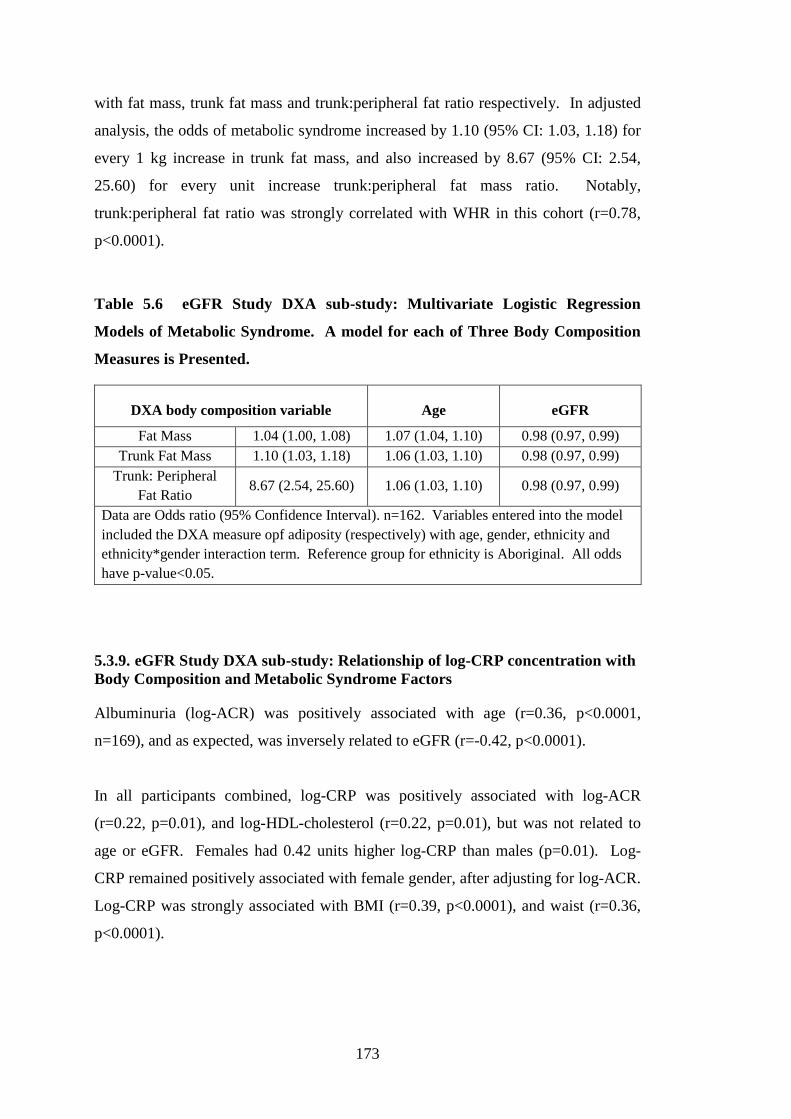
173
with fat mass, trunk fat mass and trunk:peripheral fat ratio respectively. In adjusted
analysis, the odds of metabolic syndrome increased by 1.10 (95% CI: 1.03, 1.18) for
every 1 kg increase in trunk fat mass, and also increased by 8.67 (95% CI: 2.54,
25.60) for every unit increase trunk:peripheral fat mass ratio. Notably,
trunk:peripheral fat ratio was strongly correlated with WHR in this cohort (r=0.78,
p<0.0001).
Table 5.6 eGFR Study DXA sub-study: Multivariate Logistic Regression
Models of Metabolic Syndrome. A model for each of Three Body Composition
Measures is Presented.
DXA body composition variable Age eGFR
Fat Mass 1.04 (1.00, 1.08) 1.07 (1.04, 1.10) 0.98 (0.97, 0.99) Trunk Fat Mass 1.10 (1.03, 1.18) 1.06 (1.03, 1.10) 0.98 (0.97, 0.99)
Trunk: Peripheral Fat Ratio
8.67 (2.54, 25.60) 1.06 (1.03, 1.10) 0.98 (0.97, 0.99)
Data are Odds ratio (95% Confidence Interval). n=162. Variables entered into the model included the DXA measure opf adiposity (respectively) with age, gender, ethnicity and ethnicity*gender interaction term. Reference group for ethnicity is Aboriginal. All odds have p-value<0.05.
5.3.9. eGFR Study DXA sub-study: Relationship of log-CRP concentration with Body Composition and Metabolic Syndrome Factors
Albuminuria (log-ACR) was positively associated with age (r=0.36, p<0.0001,
n=169), and as expected, was inversely related to eGFR (r=-0.42, p<0.0001).
In all participants combined, log-CRP was positively associated with log-ACR
(r=0.22, p=0.01), and log-HDL-cholesterol (r=0.22, p=0.01), but was not related to
age or eGFR. Females had 0.42 units higher log-CRP than males (p=0.01). Log-
CRP remained positively associated with female gender, after adjusting for log-ACR.
Log-CRP was strongly associated with BMI (r=0.39, p<0.0001), and waist (r=0.36,
p<0.0001).
174
Log-CRP was also positively related to DXA measures of adiposity, in order of
strength of association with trunk fat mass (r=0.50, p<0.0001); total fat mass (r=0.49,
p<0.0001); peripheral fat (r=0.43, p<0.0001) and trunk:peripheral fat ratio (r=0.20,
p=0.01). Females had a stronger positive relationship of log-CRP with DXA
measures of adiposity than males: (trunk fat mass, r=0.59, p<0.0001; total fat mass,
r=0.55, p<0.0001; peripheral fat mass, r=0.43, p<0.0001, trunk:peripheral fat ratio,
r=0.39, p=0.0001).
The highest variance in log-CRP was explained (in order) by models based on trunk
fat mass, total fat mass, waist circumference and trunk:peripheral fat ratio (shown in
Table 5.7). Each of the four models initially included gender, and ethnicity and the
ethnicity*gender interaction term, diabetes and log-ACR. The model of log-CRP
was affected by multi-collinearity when log-HDL and log-ACR were both included.
As albuminuria was a frequent abnormality in the cohort, log-ACR was retained in
the model of log-CRP in preference to log-HDL.
Although females had a higher log-CRP than males (noted above), gender was not an
independent determinant in the relationship of log-CRP with either total fat mass,
and trunk fat mass. Gender was a significant determinant in models of log-CRP
based on waist circumference or trunk:peripheral fat ratio.
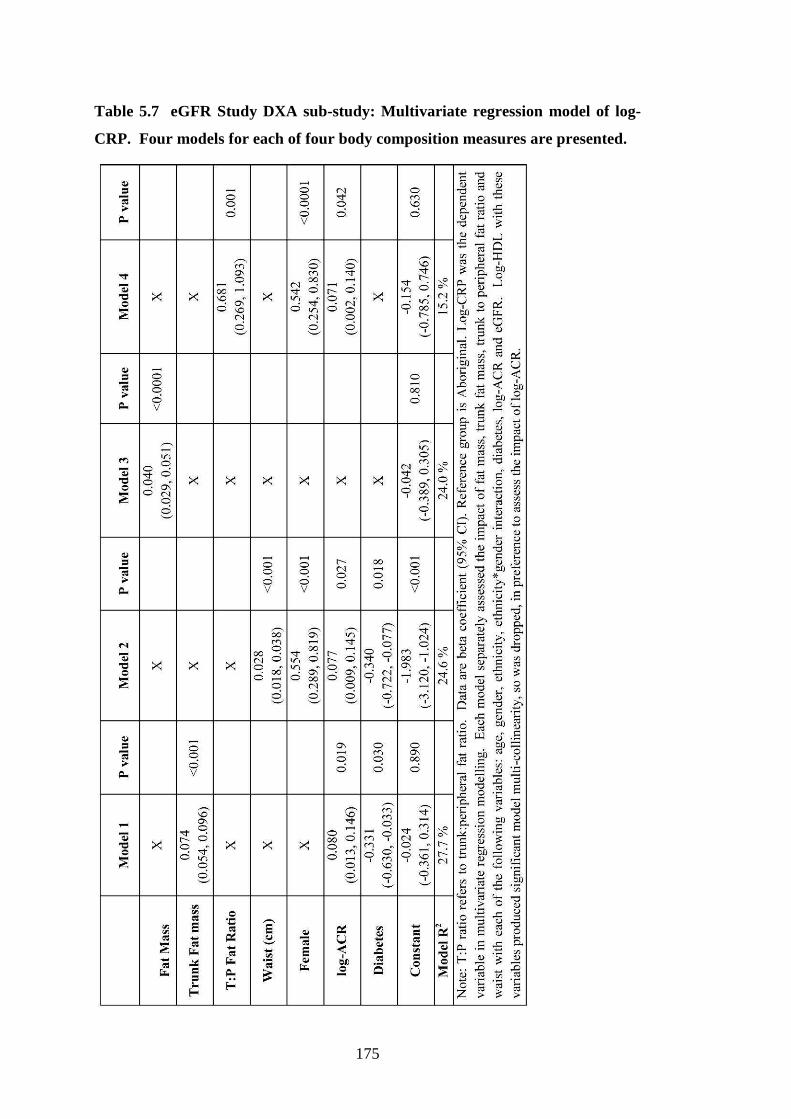
175
Table 5.7 eGFR Study DXA sub-study: Multivariate regression model of log-
CRP. Four models for each of four body composition measures are presented.
176
5.4. Discussion: eGFR Study DXA sub-study
There are three important findings in this analysis. First, differences in skeletal
proportions, lean mass and the distribution of body fat were demonstrated between
ethnic groups, particularly between Aboriginal participants and Torres Strait Islander
participants. Second, Aboriginal participants had a preferential pattern of central
obesity compared with other ethnic groups of the same gender, even when adjusted
for chronic disease markers. Third, total and central adiposity were strongly
associated with markers of inflammation and the metabolic syndrome in this multi-
ethnic adult study.
The heterogeneity of body build in Indigenous Australians was shown by distinct
differences in lean mass and skeletal proportions in this analysis. In the present
analysis, Torres Strait Islander participants had higher total lean mass, (and higher
lean mass adjusted for body weight), yet Aboriginal participants and Torres Strait
Islander participants had much longer relative leg-lengths than Caucasians. The two
groups were also defined by differences in pelvis-widths (relative to height). The
present analysis has confirmed Heitmann et al’s (Heitmann et al. 1997) hypothesis
that differences in resistance were dependent on differences in skeletal proportions.
We show that differences in skeletal proportions in this cohort were characteristic of
ethnicity. Despite a more ethnically-admixed group of the present study (in
comparison to the Healthy Top-Enders’ study group), the linear body build of
Australian Aboriginal people (Abbie 1969; Roberts 1953) was again demonstrated
by a narrow pelvis-width and longer leg-length relative to height compared with
Caucasians in the present analysis. In adult females with similar height and relative
limb-lengths, a broader skeletal frame was associated with higher BMI (and body
weight), which as a group, distinguished First Nation Canadian from European
females (Katzmarzyk et al. 1999). In European females with a similar BMI, those
with a wider skeleton have lower measured-body fat percent (from underwater
weighing), than would be otherwise predicted from the BMI (Snijder et al. 1999).
The Healthy Top-Enders’ study described Aboriginal participants and Caucasian
participants who were matched for age, gender and body mass index (described in
177
Chapter 3). That study showed that shorter trunk-length percent of standing height
was related to a central distribution of body weight (with weight gain), and is
consistent with the findings of Aboriginal participants in the present analysis. The
new finding in the present analysis was that higher skeletal breadth (than leg-length
percent) more strongly indicated proportionately higher lean body mass.
Aboriginal females share more features of body build with Aboriginal males, than
Torres Strait Islander females. Aboriginal participants, regardless of gender had
narrow pelvis-breadth, and short trunk. In contrast, Torres Strait Islander females
had slightly longer trunk-lengths and wider pelvis-breadths than Torres Strait
Islander males. This difference between Aboriginal females and Torres Strait
Islander females may explain why Aboriginal females have a strong tendency to
central obesity, whilst Torres Strait Islander females show a more generalised pattern
of obesity. Therefore Aboriginal people and Torres Strait Islander people each have
a distinct body build, which in turn was distinct from Caucasian people. Defining
differences in skeletal proportions was necessary to explain why body fat percent
was lower in Torres Strait Islander people who otherwise had a higher BMI
compared with Aboriginal participants in the present study.
Total and abdominal obesity was closely associated with cardiovascular disease risk
markers in this cohort, and other populations (Yusuf et al. 2004). Fat mass is
intrinsically difficult to measure independently (Ellis 2000; Wang et al. 1992), and is
therefore inferred by measuring fat free mass. Valentin et al. (Valentin 2002)
reported that lean mass comprised the majority of body weight in healthy non-
overweight European adults. Resistance, measured with bioelectrical impedance was
reported to correlate highly with skeletal mass (Janssen et al. 2000) and fat free mass
(Lukaski et al. 1986). In the present analysis, more than 90% of the variance of lean
mass in participants was explained by a model that included resistance, measured by
bioelectrical impedance analysis, a relatively cheap, portable, safe and non-invasive
body composition assessment tool. Other independent determinants of lean mass
were ethnicity, gender, age and weight. Notably, eGFR and diabetes were not
significant independent determinants of lean mass in the present cohort. The model
prediction in the present analysis was as strong as other published models of skeletal
mass in heterogeneous adult populations (Janssen et al. 2000). To reiterate from
178
above, in the present study group, lean mass was significantly and independently
related to lower resistance. In turn, resistance was significantly and independently
predicted by skeletal proportions (and pelvis-width was a stronger indicator of low
resistance than leg-length%). When skeletal dimensions were included in the model
of resistance, ethnicity was not significantly related; however, when skeletal
dimensions were not included in the model, ethnicity was a significant independent
determinant of resistance. The two models explained a similarly high variance of
resistance.
Whilst all ethnic groups had a similar frequency of metabolic syndrome markers,
Aboriginal participants in the present study were overweight and had a preferential
central obesity compared with other groups. Others have reported that high WHR
was associated with low HDL-cholesterol (O'Neal et al. 2008), or other metabolic
syndrome factors (Rowley et al. 2003) in Indigenous Australians. Central obesity
was also reported among Aboriginal adults who do not have chronic medical
conditions (Piers et al. 2003; Rutishauser et al. 1986). Body mass index was not
linearly related to WHR in Aboriginal participants in the present analysis, which is
consistent with other reports: obesity-related risk between Aboriginal people and
Torres Strait Islander people, and between Aboriginal groups have been more
strongly identified by WHR, rather than BMI (Kondalsamy-Chennakesavan et al.
2008; Li et al. 2010). In the present study, high BMI in Torres Strait Islander
participants was due to higher percent-lean mass, which distinguishes this group
from Aboriginal participants. Even though the criteria for obesity in the metabolic
syndrome in the present analysis was dependent on BMI or high WHR, Aboriginal
males had a mean WHR>0.9 whilst their mean BMI was lower than 30 kg/m2. This
measure of obesity has been strongly linked with multiple metabolic syndrome
factors (hypertension, diabetes and dyslipidaemia) in larger studies of Aboriginal
people and Torres Strait Islander people (Li et al. 2010). In the present study, older
age was associated per year with higher odds of metabolic syndrome. Whilst this
study group was not population-representative, higher risks of cardiovascular and
diabetes illness are reported at a younger age among Indigenous Australians than
Caucasians, and this may stem from the early accumulation of intra-abdominal
obesity of Aboriginal people in particular, that was demonstrated in the Healthy Top-
Enders’ study (in Chapter 4).
179
Torres Strait Islander participants had the highest weight, body mass index, and hip
girth but the lowest body fat percent in our analysis. Polynesian people (Tongans)
have a body composition characterised by higher total and abdominal lean mass,
associated with higher body mass index than Caucasians (Craig et al. 2003). The
Tongan body build and composition bears some similarities with Torres Strait
Islander participants in the eGFR Study DXA sub-study. The association of
metabolic syndrome factors with body composition was not studied by Craig et al.
(Craig et al. 2003), however, the relationship of hip-girth with metabolic syndrome
abnormalities was reported in another multi-ethnic study by Snijder et al. (Snijder et
al. 2004b). A larger hip-girth in adults without diabetes or hypertension was
associated with a more favourable metabolic profile, than those with a narrower hip
circumference (Snijder et al. 2004b).
The eGFR Study DXA sub-study cohort assessed adults across a spectrum of health
and chronic disease within each ethnic group. Each group had a high frequency of
metabolic syndrome factors. Cardiovascular disease risk has been independently
associated with chronic low-grade inflammation (Ridker et al. 1998), albuminuria
(Hoy et al. 2001b; Keith et al. 2004), dyslipidaemia (NCEP ATP III 2002) and
central obesity (Yusuf et al. 2004). In the present analysis, log-CRP was highly
inter-related with both albuminuria and low HDL-cholesterol. Log-CRP was related
to DXA measures of adiposity, but was not related to DXA measures of lean mass.
Rossi et al. (Rossi et al. 2012) recently reported that the different relationship of CRP
levels with fat mass (determined by bioelectrical impedance) in Caucasian females
(compared to males) nearly disappeared when adjusted for leptin levels. We do not
report adipokines in this analysis, however the multivariate regression analysis of
log-CRP using fat mass or trunk fat mass was not independently determined by
gender, which may have been explained by use of precisely measured adiposity (with
DXA) in the present study.
The findings of the present analysis are consistent with findings of a larger urban
Indigenous Australian volunteer study of cardiovascular risk (Hodge et al. 2010).
They showed CRP was inversely related to HDL-cholesterol, was higher in females,
180
and highly related to waist circumference, after adjusting for gender (Hodge et al.
2010).
Shen et al. (Shen et al. 2005) presented a literature review linking insulin resistance
and the metabolic syndrome with kidney damage. Others report higher insulin
resistance in patients with chronic kidney disease, even after adjusting for central
body fat (Charlesworth et al. 2005). Aboriginal participants in this analysis were
more likely to have albuminuria associated with relatively preserved GFR, which
was consistent with reports in other Indigenous Australians (Maple-Brown et al.
2011). In addition, low eGFR was associated with higher odds of metabolic
syndrome in the present analysis. Although participants in the present study were
not population-representative, they demonstrate a high burden of cardiovascular
disease risk.
The examination of metabolic syndrome in this analysis did not assess the impact of
cigarette smoking, attitudes to exercise or success with diet and lifestyle
modifications prior to this assessment. Finally, since indicators of chronic disease
risk were shown to influence body composition (Appendix Table 5), the contribution
of abdominal fat partitioning, and limb-fat, in addition to the proportion of total and
central lean mass with metabolic syndrome factors warrants further investigation in
larger numbers of Aboriginal people and Torres Strait Islander people.
Strengths and Limitations of the study
Skeletal proportions change through childhood (Abrahamyan et al. 2008), and the
impact of early life nutrition may be observed in adult body size (Gunnell et al. 1998;
Hoy et al. 2010b; Lawlor et al. 2002). We analysed a cohort of adults across a
spectrum of health and chronic disease, and have not specifically targeted the
recruitment of adults with early life nutritional deficits. Although age-related loss in
trunk-length is reported in older adults without osteoporosis (Masharawi et al. 2008),
the width of the skeleton should not change. The skeletal proportions and body
composition observed in Aboriginal adults in the present analysis are consistent with
findings of Aboriginal participants in the Healthy Top-Enders’ study (Chapter 3):
they both have shorter relative trunk-height (and longer relative leg-length) for
181
overall height, show a narrow skeletal frame and high WHR in relation to BMI, and
high trunk fat mass.
DXA has allowed precise measurement and description of the Torres Strait Islander
body composition for the first time. This analysis has confirmed differences in
skeletal proportions between Aboriginal people and Torres Strait Islander people,
demonstrating proportionately higher lean body mass in people of Torres Strait
Islander background than Aboriginal people, after adjusting for age, gender,
resistance and body weight. Across populations with different body composition,
this analysis has also confirmed the limitation of body mass index to indicate
abdominal obesity, consistent with larger samples of Aboriginal people and Torres
Strait Islander people (Li et al. 2008), and large international multi-ethnic
populations (Yusuf et al. 2004).
This analysis has also demonstrated the relationship of metabolic syndrome and
higher log-CRP with indicators of total and central obesity (using DXA measures or
the waist circumference), which were not dependent on ethnicity. The data for
Aboriginal participants in the present study is not inconsistent with a recent report by
Mendham et al. (Mendham et al. 2012) of 10 overweight (but otherwise healthy)
middle-aged Aboriginal males. They reported Aboriginal males with high body fat
percent, WHR and BMI (respectively: 27%, 0.95, 32 kg/m2), had high biomarkers of
inflammation and insulin resistance (Mendham et al. 2012).
Three limitations are identified in this analysis: first the study included a sample that
was not population-representative; second, the definition of the metabolic syndrome
used in the present analyses differs from the definition used in clinical practice, in
that factors were measured at a single time point only in this study (rather than
confirmed on repeat measurement); third, a different DXA device was used at the
two study sites.
This study was conducted in a volunteer cohort, and was not intended to be a
population-representative study, which was demonstrated by the similar proportion
of metabolic syndrome between ethnic groups, although Caucasians had a quite
different age and gender mix to the Indigenous groups. Severe kidney disease in
182
non-Indigenous Australians affects older people, who are more likely to be male, and
who develop albuminuria in the setting of low eGFR compared with the pattern of
kidney disease observed in Indigenous Australians. This reflects current differences
in the median age and health burden between Indigenous and other Australians (ABS
2006; Vos et al. 2007). Chronic disease risk and anthropometry have been
previously studied in Indigenous Australians, but more detailed investigations of
body size have only been conducted in healthy groups (Piers et al. 2003; Raja et al.
2003). Therefore despite the limitations of this study, the findings are unique and
provide a clinically valuable guide to identify high-risk adiposity in Aboriginal
people and Torres Strait Islander people.
The definition of metabolic syndrome in this study differs from definitions used in
clinical practice which require repeat measures over time for blood pressure and
urine albumin to creatinine ratio. Several measures over time are required to
clinically confirm the presence of albuminuria and hypertension. Whilst optimal,
duplicate measures were not feasible in the PhD study, and this is an acknowledged
limitation of research studies. Therefore this analysis is limited by the possible
overestimation of rates of hypertension and albuminuria due to measurement at a
single time point only.
Concern regarding the accuracy of body composition between different DXA brands
has been reported (Hansen et al. 1999). Others have reported unadjusted DXA data,
particularly when study sites are remote, and it was impossible to share the device
between sites (Gallagher et al. 2000). There was only one whole body DXA
machine available in the Northern Territory, a Norland XR 46 scanner, installed by a
private company offsite from the research facility, in Darwin. There was also only
one portable whole body composition scanner available in Australia in 2010 when
the study visit was scheduled in Thursday Island, and no whole body scanning device
in the nearest major centre to Thursday Island, Cairns, which was 2 hours flying
distance away.
Total and regional fat mass using a Norland device was shown to be accurate over a
wide range of adiposity against a 4-compartment body composition method in
Aboriginal women (Raja et al. 2003). As mentioned above, a small study described
183
the biochemical abnormalities associated with overweight (using Norland DXA) in
Aboriginal males (Mendham et al. 2012). Whole body DXA has never been
described in a Torres Strait Islander population. Conversion equations for Hologic
and Norland in a chronic disease population are not available at this time. Whilst the
magnitude of fat and lean mass differences between ethnic groups may therefore be
prone to bias (due to different DXA brands), the direction of difference in fat and
lean mass are consistent with the direction of difference in anthropometry observed
between groups.
Future studies should assess the accuracy and equivalence of different DXA devices
in populations with chronic diseases. Where possible, future follow-up studies
involving DXA should be performed with the same machine. Detailed body
composition studies using other modalities such as computed tomography and
magnetic resonance imaging are not available in Northern Australia for clinical
research purposes, and if available, the high cost and/or radiation doses would have
precluded assessments in such a large study population. As shown in the Healthy
Top-Enders’ study (Chapter 4), differentiation of abdominal obesity to subcutaneous
and visceral fat depots may have improved the prediction of metabolic syndrome
factors, and better explained the higher burden of CRP in females relative to males in
this cohort. Adipokines may be a useful surrogate of subcutaneous and visceral fat
depots, where detailed body composition measures are not available.
Conclusion
In conclusion, despite a unifying identity of “Indigenous Australians”, we show
different body compositions of Aboriginal compared with Torres Strait Islander
participants in this study. Differences in skeletal width, despite similarities in trunk
length, and an upper body fat distribution were demonstrated between Aboriginal
participants and Torres Strait Islander participants, compared with Caucasian
participants. Furthermore, Torres Strait Islander participants characteristically had
higher relative lean mass for size than Aboriginal participants and Caucasians in the
present analysis. This pattern of truncal adiposity was also more strongly associated
with a higher frequency of metabolic syndrome factors in a volunteer survey across a
spectrum of health and chronic disease. These results link total and central obesity

184
with metabolic syndrome and chronic inflammation in adult Aboriginal and Torres
Strait Islander people.
Chapter 6. The eGFR Study:
The Relationship Between Body
Composition, Metabolic Syndrome
and Inflammatory Markers in
Adult Aboriginal and Torres
Strait Islander People
186
6.1. Introduction: The eGFR Study
The increasing burden of insulin-resistance, metabolic syndrome and obesity
throughout developed nations has been linked with an increasing burden of obesity-
related kidney injury (Hunley et al. 2010; Shen et al. 2005; Wang et al. 2007).
Albuminuria and low eGFR are indicators of chronic kidney disease (CKD) (Levey
et al. 2011; Mathew et al. 2007). Both of these indicators are independently related
to heightened cardiovascular disease risk in Aboriginal Australians and other
populations (Hoy et al. 2001b; Keith et al. 2004). Keith et al. (Keith et al. 2004)
advocated for interventions targeting cardiovascular disease mortality and diabetes,
since they were more likely outcomes than progressive renal disease for adults with
impaired kidney function.
Albuminuria and Impaired eGFR in Indigenous Australians
As observed in other populations (Chang et al. 2006; Thoenes et al. 2009), several
investigators link albuminuria with overweight and central obesity in Indigenous
Australians (Hoy et al. 2006b; Hoy et al. 2001b; Rowley et al. 2000). Albuminuria
has been a more frequently reported marker of kidney damage in Indigenous
Australians compared with impaired glomerular filtration rate (Hoy et al. 2001b;
Maple-Brown et al. 2011). Although diabetes has been frequently observed in many
Indigenous Australians (AIHW CKD 2011; Hoy et al. 2007; Leonard et al. 2002),
albuminuria was often observed in individuals without diabetes (Hoy et al. 2001b).
Albuminuria was also more likely to accompany multiple metabolic syndrome
factors, rather than one or two factors in Aboriginal people from a remote Central
Australian community (Rowley et al. 2000). However, when macroscopic
albuminuria was observed, it was also more likely to be accompanied by low eGFR
and subsequent kidney failure (Hoy et al. 2001b). The origins of kidney disease in
Indigenous Australians were discussed in more detail in the Introduction (Chapter
1.5.1).
Studies Linking Obesity, Metabolic Syndrome, Adipokines and Kidney Damage
Low adiponectin and or high leptin concentrations are reported in overweight and
obesity (Kursawe et al. 2010; Mantzoros et al. 2011). This combination of
187
adiponectin and leptin concentrations are also associated with cardio-metabolic
disease (Hara et al. 2006) or incident diabetes (Ley et al. 2008) in the general
population, and in groups with indicators of kidney damage (Becker et al. 2005;
Looker et al. 2004).
Several studies link overweight with hyper-leptinaemia and glomerular hyper-
filtration. A high burden of intra-abdominal fat was linked with glomerular hyper-
filtration in a pig model of early metabolic syndrome (Li et al. 2011). Additionally,
high leptin concentrations were shown to precede glomerular hyper-filtration, which
in turn preceded the decline in GFR in a mouse model of early type 2 diabetes (Wei
et al. 2004). Finally, Sharma et al. (Sharma et al. 2008) demonstrated the normal
function of glomerular epithelial podocytes, and therefore the defence against
albuminuria, was closely dependent on adequate serum adiponectin concentrations.
While adiponectin and leptin concentrations are higher in the setting of impaired
kidney function, activation of receptors for each adipokine has been shown to
independently exert beneficial (adiponectin) and detrimental (leptin) effects in the
kidney (Komura et al. 2010; Shen et al. 2007a; Shen et al. 2008; Wei et al. 2004).
Obviously the beneficial effects of adiponectin at poor kidney function are not
possible in the setting of hypo-adiponectinaemia.
Objective
This summary has outlined that a relationship exists between overweight and obesity,
metabolic syndrome, abnormal adipokine concentrations and the risk of kidney
damage. The first objective of this chapter was to describe adiponectin and leptin
concentrations in adult Aboriginal people and Torres Strait Islander people with
indicators of obesity and chronic disease. The second objective was to explore the
relationship of adiponectin and leptin concentrations with indicators of kidney
damage in adult Aboriginal people and Torres Strait Islander people.
6.2. Methods: The eGFR Study
The study was conducted in adults (minimum age 16 years), who presented for a
health assessment and specialised kidney function test using plasma disappearance
rate of intravenous iohexol (requiring minimum four hours), as part of The eGFR
188
Study. Participant information was provided in a plain language summary and with
the use of local Indigenous facilitators where necessary. Written consent was
provided.
Participants were recruited to the specialised kidney function test study (The eGFR
Study) across pre-specified health strata as follows:
Healthy (Adults without diabetes, hypertension or albuminuria, and who have
an eGFR ≥90 ml/min/1.73m2);
Diabetes with eGFR ≥90 ml/min/1.73m2;
eGFR 60-89 ml/min/1.73m2
eGFR 30-59 ml/min/1.73m2
eGFR <30 ml/min/1.73m2
In this analysis, eGFR was calculated using the 4-variable MDRD equation (MDRD-
eGFR) (Levey et al. 1999), and also by the CKD-EPI formula (CKD-EPI-eGFR)
(Levey et al. 2009), based on serum creatinine measures from local laboratories.
6.2.1. Inclusion Criteria
755 participants were recorded in the eGFR Study dataset. Only Aboriginal
participants and Torres Strait Islander participants are examined in this analysis
(n=593). The definition of ethnicity used in Chapter 5.2.1 was also used in this
analysis, as follows:
Aboriginal (n=465, 62%) refers to individuals who self-identify as an Aboriginal
person, and have no Torres Strait Islander grandparents. Four participants from
remote communities who self-identified as “Indigenous” and provided no details of
grandparent ethnicity were assigned Aboriginal (2 in NT, 2 in WA).
Torres Strait Islander (n=128, 17%) refers to participants who self-identify as a
Torres Strait Islander person, and have no Aboriginal grandparents.
189
6.2.2. Exclusion Criteria
We excluded other participants on the basis of ethnicity. ATSI (n=59, 7.7%) referred
to participants who either identified as both Aboriginal and Torres Strait Islander, or
had both an Aboriginal grandparent and a Torres Strait Islander grandparent, and
were excluded from the current analysis.
Caucasian (n=103, 13%) referred to participants who self-identified as non-
Indigenous and all four grandparents were of Caucasian background, and were
excluded from the current analysis. An additional two participants did not provide
any data to assign ethnicity and were also excluded from the analysis.
Pregnant and breastfeeding women and participants who were acutely unwell or had
rapidly changing kidney function were excluded from The eGFR Study.
6.2.3. Protocol
Participants were invited to complete all components of the assessment. The
assessment (attached at Appendix 2) comprised anthropometry (weight, height, and
body circumferences), bioelectrical impedance analysis using supine tetra-polar
arrangement of whole body right side, resting blood pressure, non-fasting blood tests
and urine analysis (albumin to creatinine ratio, ACR). A medical and socio-
demographic questionnaire was administered to participants regarding age, ethnic
identity (of self and each of four grandparents), current medical conditions, and
tobacco use (Appendix 1).
Non-fasting blood tests included concentrations of total and HDL-cholesterol,
electrolytes, HbA1c, C-reactive protein (CRP), and were all performed by local
pathology providers. Adiponectin and leptin concentrations were measured using
enzyme linked immunosorbant assay (R&D, Minneapolis, USA) with coefficients of
variation (which is the standard deviation/ average, (pg/ml)) in our laboratory of 0.10
and 0.09 respectively. Waist to hip ratio (WHR), body mass index (BMI) and
adiponectin to leptin ratio (A:L ratio) were calculated.
190
6.2.4. Analysis
Characteristics of participants across groups are described in Table 6.1 and Table 6.2.
Data are presented as mean (standard deviation) for normally distributed variables.
Biochemical variables (except MDRD-eGFR) were not normally distributed, and
described as median (inter-quartile range), and compared using log-transformed data.
Biochemical data that was log-transformed was then exponentiated in order to
present the average difference between groups. Results are described for differences
between Aboriginal and Torres Strait Islander males and females separately.
Comparisons between continuous and categorical variables were performed using
Students t-test and chi-squared analysis respectively.
Five metabolic syndrome variables were assessed. Fasting blood tests or an oral
glucose tolerance test were not available in this analysis. The definition of metabolic
syndrome in this analysis was defined as three or more of the following:
• Diabetes- previous diagnosis of diabetes or an HbA1c ≥6.5% (ADA 2011;
Saudek et al. 2008; Selvin et al. 2011).
• Albuminuria- ≥2.5 or 3.5 mg/mmol for males and females respectively (Tapp
et al. 2004).
• Hypertension: positive medical history of hypertension, or a blood pressure
≥130/85 mmHg (NCEP ATP III 2002).
• Low non-fasting HDL-cholesterol: (NCEP ATP III 2001), <1.0mmol/L
irrespective of gender (O'Neal et al. 2008).
• Obesity: WHR ≥0.9 or ≥ 0.85 in males and females respectively, or a BMI
>30 kg/m2 (WHO 1999).
The frequency of each metabolic syndrome categorical variable and metabolic
syndrome (at least 3 factors) was assessed, and ethnic groups compared using chi-
squared analysis (Table 6.1).
In the whole cohort, median concentrations of adipokines were compared using an
analysis of covariance with the following covariates: ethnicity (categorical), gender
(categorical), the interaction term (ethnicity*gender) and kidney function
(continuous) as either log-ACR or MDRD-eGFR. The ethnicity*gender interaction
191
term was not significantly associated with differences in median adipokine
concentrations (adiponectin, leptin or A:L ratio), and further subgroup analysis was
therefore not permitted. However, higher concentrations of adipokines were
significantly associated with lower kidney function in the aforementioned
ANCOVA, and data for median adipokines was presented according to strata of
kidney function in participants in Table 6.3 and Table 6.4, which is an acceptable
convention for describing the severity of kidney damage in individuals or groups
(Levey et al. 2011; Mathew et al. 2007).
Kidney function was categorised according to three albuminuria groups (Table 6.3):
normo-albuminuria (<2.5 mg/mmol in males, <3.5 mg/mmol in females);
microalbuminuria (≥2.5-25 mg/mmol in males, ≥3.5-25 mg/mmol in females), and
macro-albuminuria (≥25mg/mmol) (Tapp et al. 2004). Kidney function was also
assessed categorically according to three strata according to eGFR expressed for
eGFR by MDRD 4-variable formula of kidney function (MDRD-eGFR), and eGFR
CKD-EPI formula (CKD-EPI-eGFR) of kidney function (in Table 6.4 and Appendix
Table 11). The African-American correction for ethnicity was not applied for
Aboriginal and Torres Strait Islander participants in the present analysis, since there
is no a-priori reason to consider that the populations are similar. The three eGFR
strata groups were defined as:
eGFR ≥90 ml/min/1.73m2;
eGFR 60-89 ml/min/1.73m2 ;
eGFR <60 ml/min/1.73m2.
Bivariate associations of log-adiponectin and log-leptin concentrations were
examined in adult Aboriginal people and Torres Strait Islander people with indicators
of obesity (BMI, WHR and waist circumference) and chronic disease risk
(concentrations of log-HDL log-CRP). As it was not permitted in an analysis of
covariance to ascertain significant differences in median adipokines concentrations
between numerous subgroups (gender, ethnicity, and strata of kidney damage), the
association of adipokine concentrations with other variables was assessed with a
multivariate regression model (for log-adiponectin concentration) and a Principal
Components Analysis.
192
A multiple regression analysis was performed to identify predictors of log-
adiponectin concentration in the cohort since bivariate associations may be prone to
confounding, and secondly, as participants had complex medical co-morbidities,
varying body size, and comprised of several sub-groups (gender and ethnicity). Thus
log-adiponectin concentration was examined by the multivariate regression model
(Table 6.5) with continuous measures of cardiovascular disease risk and kidney
damage. At a p-value<0.05, one in twenty associations between a predictor and
outcome variable may be statistically significant when an association does not
actually exist. Hence only nine predictor variables were included in the initial
multiple regression model in this analysis. Gender, ethnicity and adiposity (BMI,
waist circumference, WHR) are clinically associated with log-adiponectin in other
populations, and were five of the nine predictor variables. Two measures of kidney
damage (log-ACR concentration, eGFR-MDRD), and two biomarkers of
cardiovascular disease risk (concentration of log-HDL-cholesterol and log-CRP) that
are often observed to be low among adult cohorts of Aboriginal and Torres Strait
Islander peoples (and was also evident in Chapter 4) were also selected as predictor
variables of log-adiponectin concentration among this cohort.
Predictor variables were retained in the regression model if they were not highly
inter-correlated with other predictor variables using the variance of inflation test.
Using a stepwise backwards process, the final significant model was obtained by
removing one variable at a time if its main effect in the model had a p-value>0.05.
This process continued until the final model demonstrated all predictor variables with
p<0.05. Finally, all first-order interactions between pairs of variables in the final
model were assessed. The interaction term was retained in the final model if it was
biologically plausible. Model fit was also assessed by normality of distribution of
residuals and assessment of leverage and influence (using Cook’s distance) in the
final models.
A Principal Components Analysis was performed to examine the clustering of 15
body composition, biochemical and demographic measures (shown in Table 6.6).
Hip circumference was not included in the Principal Components Analysis since it
did not improve the clarity of an adipokine or metabolic profile when included with
or without WHR. The Principal Component Analysis method was used to reduce the
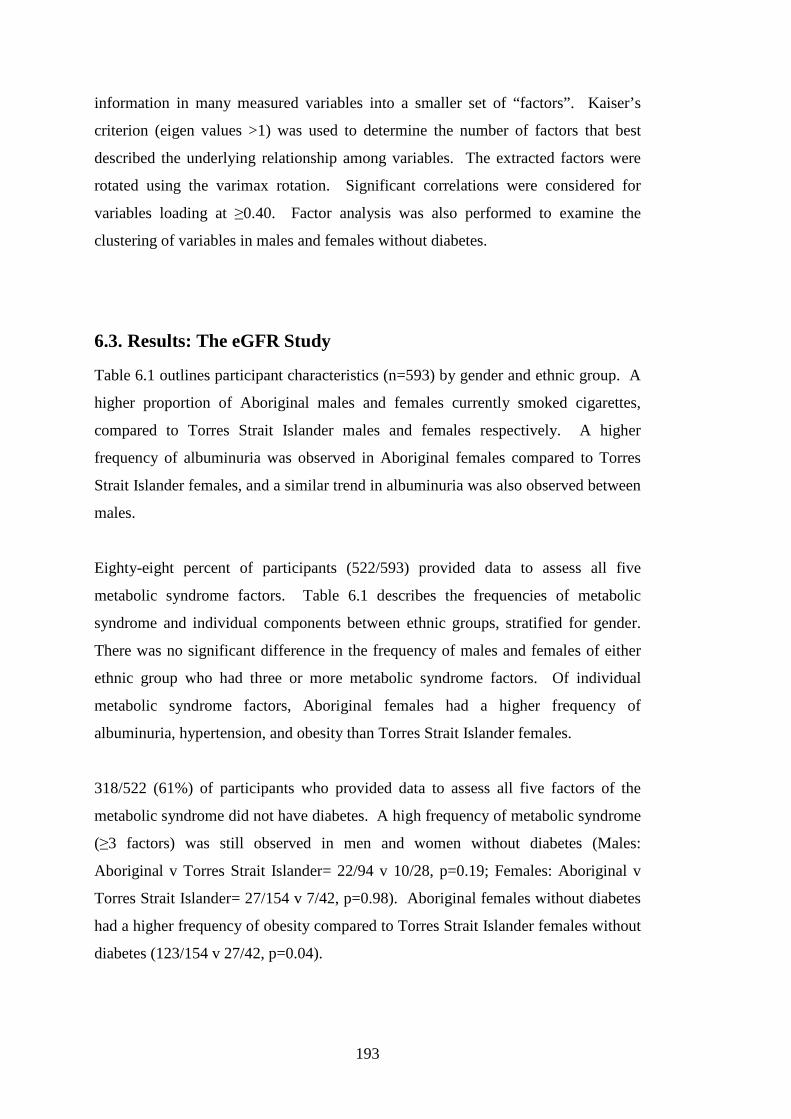
193
information in many measured variables into a smaller set of “factors”. Kaiser’s
criterion (eigen values >1) was used to determine the number of factors that best
described the underlying relationship among variables. The extracted factors were
rotated using the varimax rotation. Significant correlations were considered for
variables loading at ≥0.40. Factor analysis was also performed to examine the
clustering of variables in males and females without diabetes.
6.3. Results: The eGFR Study
Table 6.1 outlines participant characteristics (n=593) by gender and ethnic group. A
higher proportion of Aboriginal males and females currently smoked cigarettes,
compared to Torres Strait Islander males and females respectively. A higher
frequency of albuminuria was observed in Aboriginal females compared to Torres
Strait Islander females, and a similar trend in albuminuria was also observed between
males.
Eighty-eight percent of participants (522/593) provided data to assess all five
metabolic syndrome factors. Table 6.1 describes the frequencies of metabolic
syndrome and individual components between ethnic groups, stratified for gender.
There was no significant difference in the frequency of males and females of either
ethnic group who had three or more metabolic syndrome factors. Of individual
metabolic syndrome factors, Aboriginal females had a higher frequency of
albuminuria, hypertension, and obesity than Torres Strait Islander females.
318/522 (61%) of participants who provided data to assess all five factors of the
metabolic syndrome did not have diabetes. A high frequency of metabolic syndrome
(≥3 factors) was still observed in men and women without diabetes (Males:
Aboriginal v Torres Strait Islander= 22/94 v 10/28, p=0.19; Females: Aboriginal v
Torres Strait Islander= 27/154 v 7/42, p=0.98). Aboriginal females without diabetes
had a higher frequency of obesity compared to Torres Strait Islander females without
diabetes (123/154 v 27/42, p=0.04).
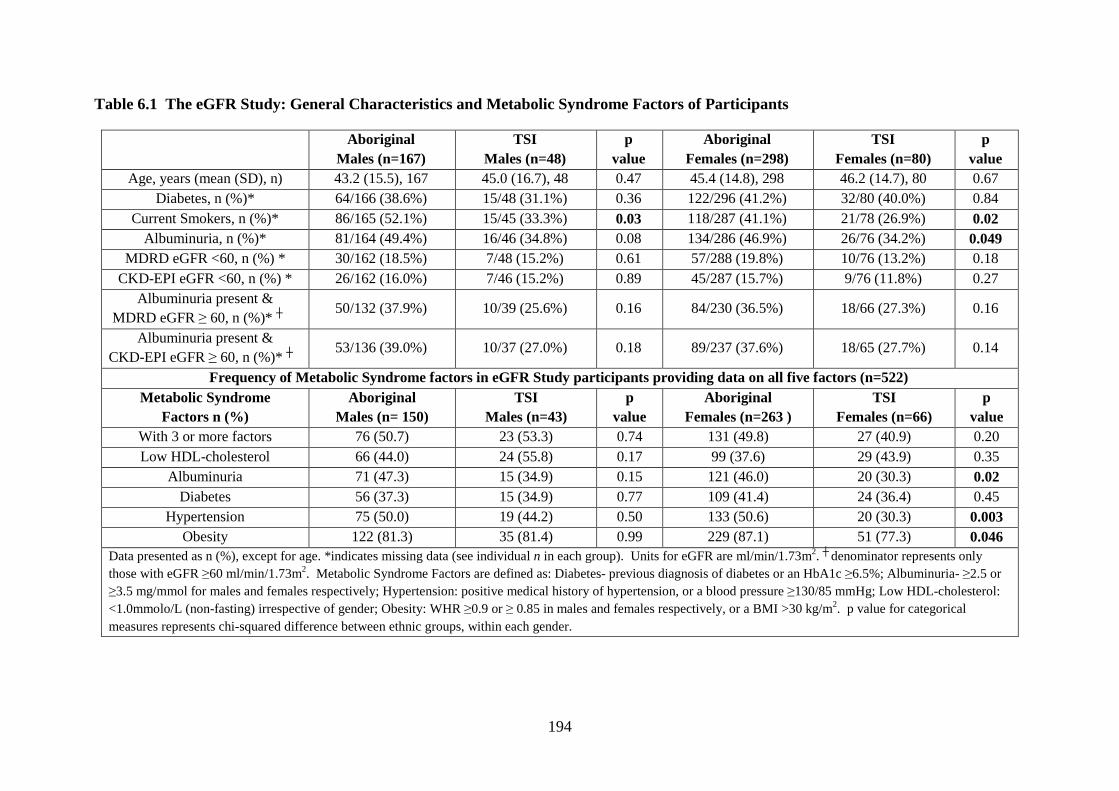
194
Table 6.1 The eGFR Study: General Characteristics and Metabolic Syndrome Factors of Participants
Aboriginal
Males (n=167) TSI
Males (n=48) p
value Aboriginal
Females (n=298) TSI
Females (n=80) p
value Age, years (mean (SD), n) 43.2 (15.5), 167 45.0 (16.7), 48 0.47 45.4 (14.8), 298 46.2 (14.7), 80 0.67
Diabetes, n (%)* 64/166 (38.6%) 15/48 (31.1%) 0.36 122/296 (41.2%) 32/80 (40.0%) 0.84 Current Smokers, n (%)* 86/165 (52.1%) 15/45 (33.3%) 0.03 118/287 (41.1%) 21/78 (26.9%) 0.02
Albuminuria, n (%)* 81/164 (49.4%) 16/46 (34.8%) 0.08 134/286 (46.9%) 26/76 (34.2%) 0.049 MDRD eGFR <60, n (%) * 30/162 (18.5%) 7/48 (15.2%) 0.61 57/288 (19.8%) 10/76 (13.2%) 0.18
CKD-EPI eGFR <60, n (%) * 26/162 (16.0%) 7/46 (15.2%) 0.89 45/287 (15.7%) 9/76 (11.8%) 0.27 Albuminuria present &
MDRD eGFR ≥ 60, n (%)* ┼ 50/132 (37.9%) 10/39 (25.6%) 0.16 84/230 (36.5%) 18/66 (27.3%) 0.16
Albuminuria present & CKD-EPI eGFR ≥ 60, n (%)* ┼
53/136 (39.0%) 10/37 (27.0%) 0.18 89/237 (37.6%) 18/65 (27.7%) 0.14
Frequency of Metabolic Syndrome factors in eGFR Study participants providing data on all five factors (n=522) Metabolic Syndrome
Factors n (%) Aboriginal
Males (n= 150) TSI
Males (n=43) p
value Aboriginal
Females (n=263 ) TSI
Females (n=66) p
value With 3 or more factors 76 (50.7) 23 (53.3) 0.74 131 (49.8) 27 (40.9) 0.20 Low HDL-cholesterol 66 (44.0) 24 (55.8) 0.17 99 (37.6) 29 (43.9) 0.35
Albuminuria 71 (47.3) 15 (34.9) 0.15 121 (46.0) 20 (30.3) 0.02 Diabetes 56 (37.3) 15 (34.9) 0.77 109 (41.4) 24 (36.4) 0.45
Hypertension 75 (50.0) 19 (44.2) 0.50 133 (50.6) 20 (30.3) 0.003 Obesity 122 (81.3) 35 (81.4) 0.99 229 (87.1) 51 (77.3) 0.046
Data presented as n (%), except for age. *indicates missing data (see individual n in each group). Units for eGFR are ml/min/1.73m2. ┼ denominator represents only those with eGFR ≥60 ml/min/1.73m2. Metabolic Syndrome Factors are defined as: Diabetes- previous diagnosis of diabetes or an HbA1c ≥6.5%; Albuminuria- ≥2.5 or ≥3.5 mg/mmol for males and females respectively; Hypertension: positive medical history of hypertension, or a blood pressure ≥130/85 mmHg; Low HDL-cholesterol: <1.0mmolo/L (non-fasting) irrespective of gender; Obesity: WHR ≥0.9 or ≥ 0.85 in males and females respectively, or a BMI >30 kg/m2. p value for categorical measures represents chi-squared difference between ethnic groups, within each gender.
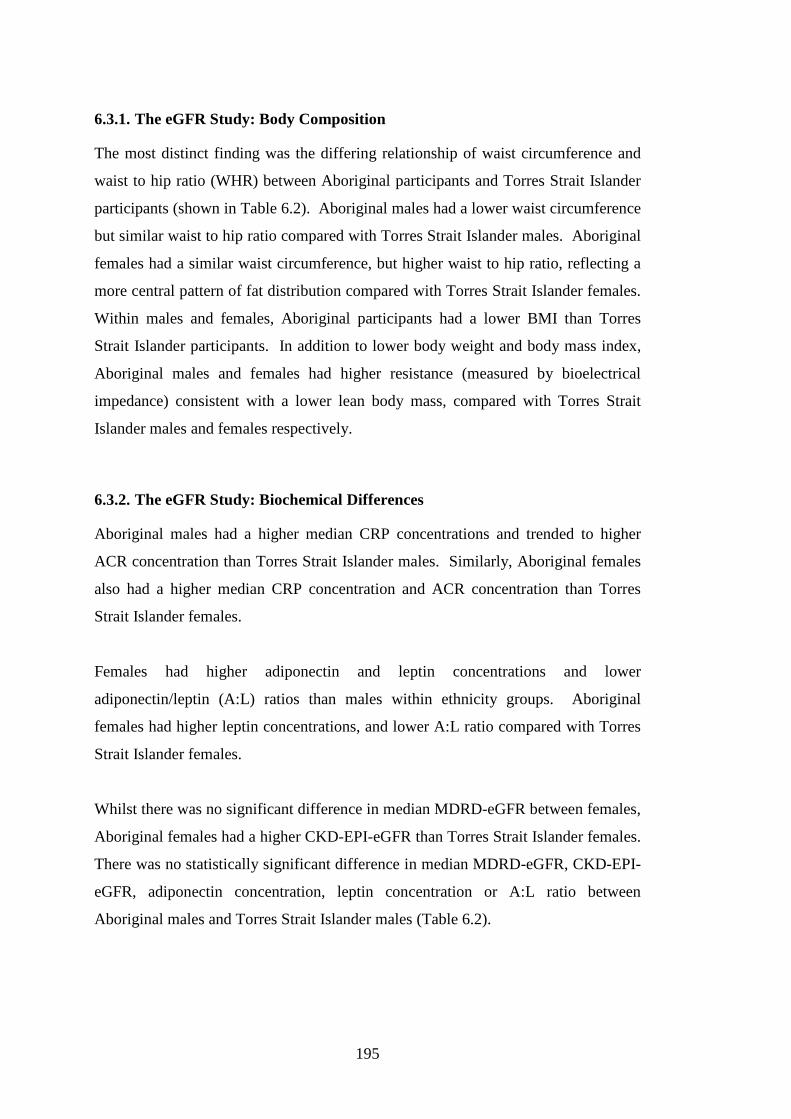
195
6.3.1. The eGFR Study: Body Composition
The most distinct finding was the differing relationship of waist circumference and
waist to hip ratio (WHR) between Aboriginal participants and Torres Strait Islander
participants (shown in Table 6.2). Aboriginal males had a lower waist circumference
but similar waist to hip ratio compared with Torres Strait Islander males. Aboriginal
females had a similar waist circumference, but higher waist to hip ratio, reflecting a
more central pattern of fat distribution compared with Torres Strait Islander females.
Within males and females, Aboriginal participants had a lower BMI than Torres
Strait Islander participants. In addition to lower body weight and body mass index,
Aboriginal males and females had higher resistance (measured by bioelectrical
impedance) consistent with a lower lean body mass, compared with Torres Strait
Islander males and females respectively.
6.3.2. The eGFR Study: Biochemical Differences
Aboriginal males had a higher median CRP concentrations and trended to higher
ACR concentration than Torres Strait Islander males. Similarly, Aboriginal females
also had a higher median CRP concentration and ACR concentration than Torres
Strait Islander females.
Females had higher adiponectin and leptin concentrations and lower
adiponectin/leptin (A:L) ratios than males within ethnicity groups. Aboriginal
females had higher leptin concentrations, and lower A:L ratio compared with Torres
Strait Islander females.
Whilst there was no significant difference in median MDRD-eGFR between females,
Aboriginal females had a higher CKD-EPI-eGFR than Torres Strait Islander females.
There was no statistically significant difference in median MDRD-eGFR, CKD-EPI-
eGFR, adiponectin concentration, leptin concentration or A:L ratio between
Aboriginal males and Torres Strait Islander males (Table 6.2).
196
Table 6.2. The eGFR Study: Body Composition & Biochemical Characteristics of Participants (n=593)
Aboriginal
Males (n=167)
TSI
Males (n=48)
p
value
Aboriginal
Females (n=298)
TSI
Females (n=80)
p
value
Height, cm * 173.4 (6.1), 165 174.2 (6.3), 48 0.42 162.5 (6.7), 296 162.4 (14.7), 80 0.88
Weight, kg * 84.2 (21.1), 167 97.5 (23.1), 48 0.0002 78.3 (19.5), 296 86.8 (20.7), 80 0.001
Waist, cm * 99.3 (17.4), 161 105.3 (18.1), 46 0.04 99.9 (15.7), 275 101.6 (16.1), 74 0.41
Hips, cm * 101.1 (11.9), 163 109.0 (14.3), 46 0.0002 108.1 (14.8), 283 113.0 (14.4), 74 0.01
Waist: Hip ratio * 0.98 (0.10), 159 0.96 (0.09), 46 0.23 0.93 (0.09), 274 0.90 (0.08), 73 0.01
BMI, kg/m2 * 27.8 (6.5), 165 32.2 (7.9), 48 0.0001 29.6 (7.0), 296 32.9 (7.5), 80 0.001
Resistance, ohms* 513.4 (99.9), 139 428.6 (75.6), 46 <0.0001 618.2 (123.4), 269 509.8 (93.3), 68 <0.0001
MDRD-eGFR * 86.6 (31.8), 162 82.3 (25.9), 46 0.41 87.0 (35.5), 288 89.2 (24.0), 76 0.61
CKD-EPI-eGFR * 98.4 (81.0, 112.2), 162 90.7 (75.1, 105.5), 46 0.78 99.7 (75.6, 113.1), 287 84.5 (99.5, 113.1), 76 0.04
HbA1c,% * 5.99 (5.58,7.32), 160 5.87 (5.70, 6.69), 47 0.58 6.05 (5.58, 7.32), 279 5.87 (5.47, 7.03), 73 0.52
Urine ACR, mg/mmol * 2.41 (0.70, 34.5), 160 1.11 (0.60, 14.01), 46 0.05 2.61 (0.80, 28.22), 278 1.51 (0.80, 6.69), 73 0.01
HDL-cholesterol, mmol/L * 1.00 (0.80, 1.20), 154 0.90 (0.60, 1.51), 45 0.31 1.11 (0.90, 1.30), 274 1.11 (0.70, 2.10), 62 0.19
CRP, mg/L * 5.0 (3.0, 10.0), 158 2.5 (1.0, 4.5), 42 <0.0001 7.0 (4.0, 15.0), 281 4.3 (1.7, 8.0), 71 <0.0001
Adiponectin, ug/ml * 3.01(1.96, 4.32), 159 3.00 (2.02, 3.69), 45 0.34 3.56 (2.65, 4.77), 282 3.50 (2.81, 5.06), 68 0.76
Leptin, ng/ml * 7.18 (2.97, 19.00), 159 10.05 (3.96, 18.11), 45 0.46 35.32 (22.43, 56.58), 282 26.86 (17.99, 46.18), 68 0.01
A:L ratio, ug/ml * 0.36 (0.14, 1.30), 159 0.24 (0.14, 1.02), 45 0.32 0.08 (0.05, 0.19), 282 0.11 (0.07, 0.21), 68 0.049
Data presented as mean (SD), n (number) for anthropometry and MDRD-eGFR, and median (inter-quartile range), n for other biochemical data). A:L is Adiponectin:
Leptin ratio. Units for eGFR (MDRD or CKD-EPI) are ml/min/1.73m2 * refers to missing data, and is indicated by (n) in each gender-ethnicity group.
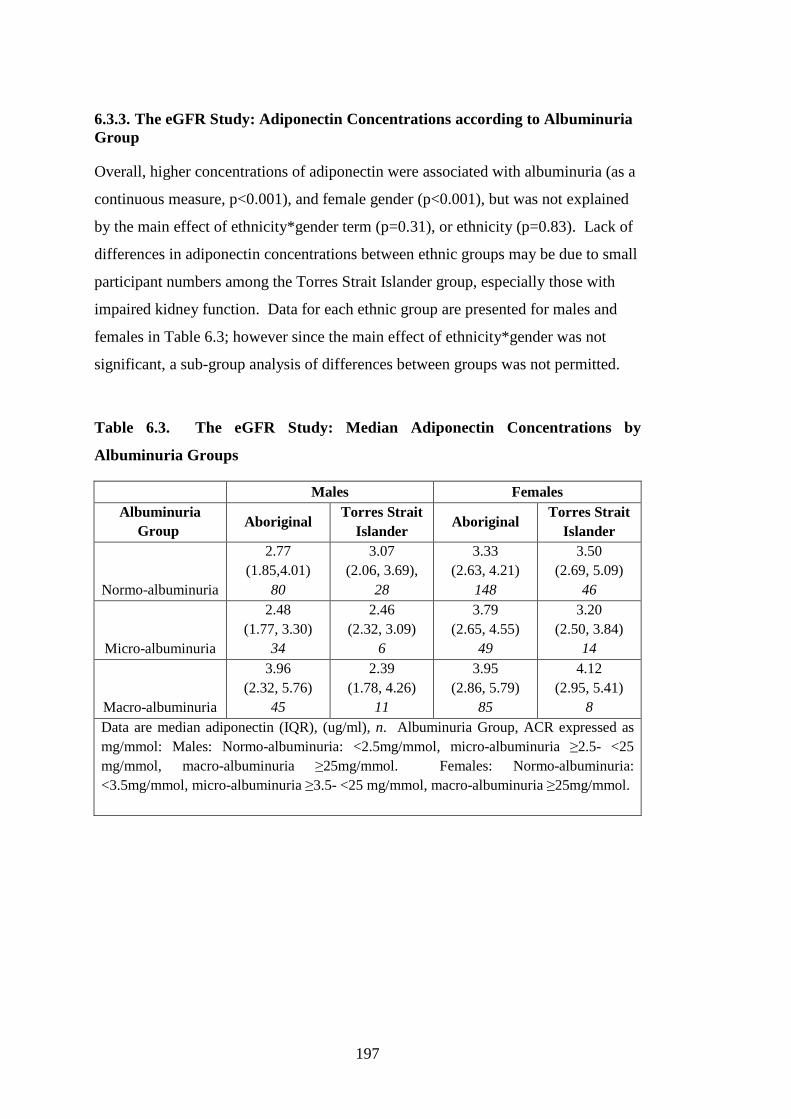
197
6.3.3. The eGFR Study: Adiponectin Concentrations according to Albuminuria Group
Overall, higher concentrations of adiponectin were associated with albuminuria (as a
continuous measure, p<0.001), and female gender (p<0.001), but was not explained
by the main effect of ethnicity*gender term (p=0.31), or ethnicity (p=0.83). Lack of
differences in adiponectin concentrations between ethnic groups may be due to small
participant numbers among the Torres Strait Islander group, especially those with
impaired kidney function. Data for each ethnic group are presented for males and
females in Table 6.3; however since the main effect of ethnicity*gender was not
significant, a sub-group analysis of differences between groups was not permitted.
Table 6.3. The eGFR Study: Median Adiponectin Concentrations by
Albuminuria Groups
Males Females Albuminuria
Group Aboriginal
Torres Strait Islander
Aboriginal Torres Strait
Islander
Normo-albuminuria
2.77 (1.85,4.01)
80
3.07 (2.06, 3.69),
28
3.33 (2.63, 4.21)
148
3.50 (2.69, 5.09)
46
Micro-albuminuria
2.48 (1.77, 3.30)
34
2.46 (2.32, 3.09)
6
3.79 (2.65, 4.55)
49
3.20 (2.50, 3.84)
14
Macro-albuminuria
3.96 (2.32, 5.76)
45
2.39 (1.78, 4.26)
11
3.95 (2.86, 5.79)
85
4.12 (2.95, 5.41)
8 Data are median adiponectin (IQR), (ug/ml), n. Albuminuria Group, ACR expressed as mg/mmol: Males: Normo-albuminuria: <2.5mg/mmol, micro-albuminuria ≥2.5- <25 mg/mmol, macro-albuminuria ≥25mg/mmol. Females: Normo-albuminuria: <3.5mg/mmol, micro-albuminuria ≥3.5- <25 mg/mmol, macro-albuminuria ≥25mg/mmol.
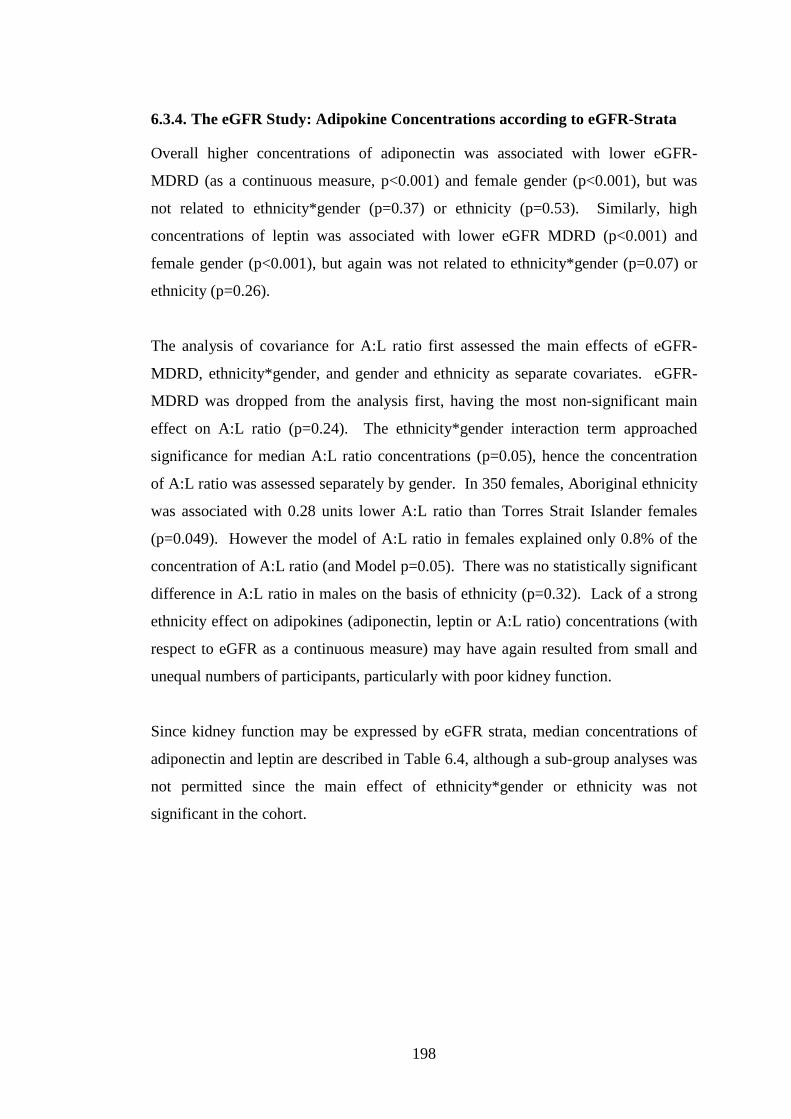
198
6.3.4. The eGFR Study: Adipokine Concentrations according to eGFR-Strata
Overall higher concentrations of adiponectin was associated with lower eGFR-
MDRD (as a continuous measure, p<0.001) and female gender (p<0.001), but was
not related to ethnicity*gender (p=0.37) or ethnicity (p=0.53). Similarly, high
concentrations of leptin was associated with lower eGFR MDRD (p<0.001) and
female gender (p<0.001), but again was not related to ethnicity*gender (p=0.07) or
ethnicity (p=0.26).
The analysis of covariance for A:L ratio first assessed the main effects of eGFR-
MDRD, ethnicity*gender, and gender and ethnicity as separate covariates. eGFR-
MDRD was dropped from the analysis first, having the most non-significant main
effect on A:L ratio (p=0.24). The ethnicity*gender interaction term approached
significance for median A:L ratio concentrations (p=0.05), hence the concentration
of A:L ratio was assessed separately by gender. In 350 females, Aboriginal ethnicity
was associated with 0.28 units lower A:L ratio than Torres Strait Islander females
(p=0.049). However the model of A:L ratio in females explained only 0.8% of the
concentration of A:L ratio (and Model p=0.05). There was no statistically significant
difference in A:L ratio in males on the basis of ethnicity (p=0.32). Lack of a strong
ethnicity effect on adipokines (adiponectin, leptin or A:L ratio) concentrations (with
respect to eGFR as a continuous measure) may have again resulted from small and
unequal numbers of participants, particularly with poor kidney function.
Since kidney function may be expressed by eGFR strata, median concentrations of
adiponectin and leptin are described in Table 6.4, although a sub-group analyses was
not permitted since the main effect of ethnicity*gender or ethnicity was not
significant in the cohort.
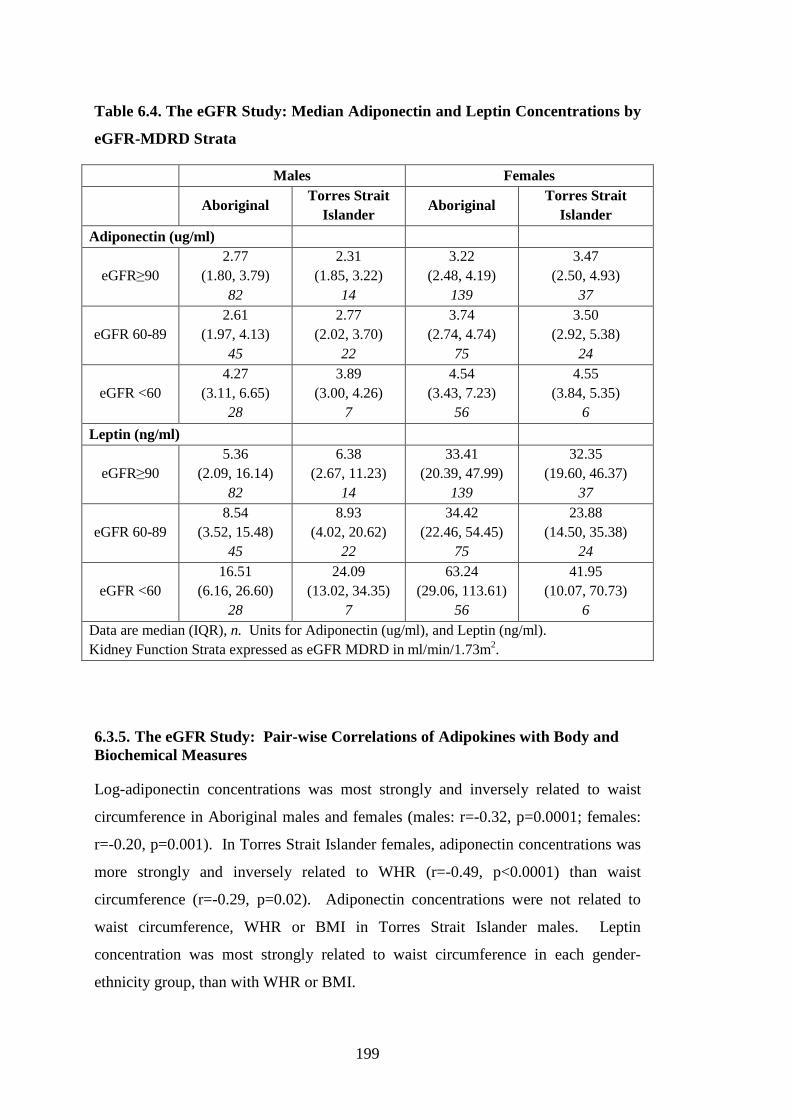
199
Table 6.4. The eGFR Study: Median Adiponectin and Leptin Concentrations by
eGFR-MDRD Strata
Males Females
Aboriginal
Torres Strait Islander
Aboriginal Torres Strait
Islander
Adiponectin (ug/ml)
eGFR≥90 2.77
(1.80, 3.79) 82
2.31 (1.85, 3.22)
14
3.22 (2.48, 4.19)
139
3.47 (2.50, 4.93)
37
eGFR 60-89 2.61
(1.97, 4.13) 45
2.77 (2.02, 3.70)
22
3.74 (2.74, 4.74)
75
3.50 (2.92, 5.38)
24
eGFR <60 4.27
(3.11, 6.65) 28
3.89 (3.00, 4.26)
7
4.54 (3.43, 7.23)
56
4.55 (3.84, 5.35)
6
Leptin (ng/ml)
eGFR≥90 5.36
(2.09, 16.14) 82
6.38 (2.67, 11.23)
14
33.41 (20.39, 47.99)
139
32.35 (19.60, 46.37)
37
eGFR 60-89 8.54
(3.52, 15.48) 45
8.93 (4.02, 20.62)
22
34.42 (22.46, 54.45)
75
23.88 (14.50, 35.38)
24
eGFR <60 16.51
(6.16, 26.60) 28
24.09 (13.02, 34.35)
7
63.24 (29.06, 113.61)
56
41.95 (10.07, 70.73)
6 Data are median (IQR), n. Units for Adiponectin (ug/ml), and Leptin (ng/ml). Kidney Function Strata expressed as eGFR MDRD in ml/min/1.73m2.
6.3.5. The eGFR Study: Pair-wise Correlations of Adipokines with Body and Biochemical Measures
Log-adiponectin concentrations was most strongly and inversely related to waist
circumference in Aboriginal males and females (males: r=-0.32, p=0.0001; females:
r=-0.20, p=0.001). In Torres Strait Islander females, adiponectin concentrations was
more strongly and inversely related to WHR (r=-0.49, p<0.0001) than waist
circumference (r=-0.29, p=0.02). Adiponectin concentrations were not related to
waist circumference, WHR or BMI in Torres Strait Islander males. Leptin
concentration was most strongly related to waist circumference in each gender-
ethnicity group, than with WHR or BMI.
200
Overall log-CRP concentrations were most strongly and inversely related to A:L
ratio in females (Aboriginal: r=-0.35, p<0.0001; Torres Strait Islander: r=-0.41,
p=0.0007). Log-CRP concentration was not significantly related to any adipokine
measure in males. A complete description of bivariate relationships is presented in
Appendix Table 7, Appendix Table 8 and Appendix Table 9.
6.3.6. The eGFR Study: Multivariate Regression Model of Adiponectin concentration
The independent determinants of the model of log-adiponectin concentrations
(shown in Table 6.5) were male-gender, waist circumference, WHR, log-CRP
concentration, log-ACR, MDRD-eGFR and the interaction term “MDRD-eGFR X
Log-ACR”. Overall in this model, high WHR, waist circumference and log-CRP
concentration were related to lower log-adiponectin concentrations. The model
explained 25% of the variance of adiponectin concentrations in this cohort and had a
normal distribution of residuals. All first order interactions were assessed. The only
significant first order interaction in the final model included “eGFR-MDRD X
albuminuria” (as expected). This model does not involve any individuals who exert
high leverage or influence.
Table 6.5. The eGFR Study: Multivariate Regression Model of Log-
Adiponectin Concentration
Independent Variables Beta Coefficient
(95% Confidence Interval) p value
MDRD-eGFR (ml/min/1.73m2) -0.003 (-0.005, -0.001) * 0.003 Log-ACR 0.087 (0.041, 0.133) * <0.0001
MDRD-eGFR X Log-ACR -0.001 (-0.001, -0.0003) 0.001 Log-CRP -0.062 (-0.102, -0.021) 0.003
WHR -1.136 (-1.696, -0.574) <0.001
Waist -0.004 (-0.007, -0.001) 0.006
Male gender -0.129 (-0.214, -0.045) 0.003
Constant 9.931 (9.474, 10.388) <0.001
Model R2, RMSE
24.6 % 0.42
Data are beta coefficient (95% Confidence Interval), n=485. * refers to variables that are involved in an interaction. Variables entered in the model were: eGFR-MDRD, log-ACR, log-CRP, log-HDL cholesterol, WHR, waist, BMI, Aboriginal ethnicity, male gender.
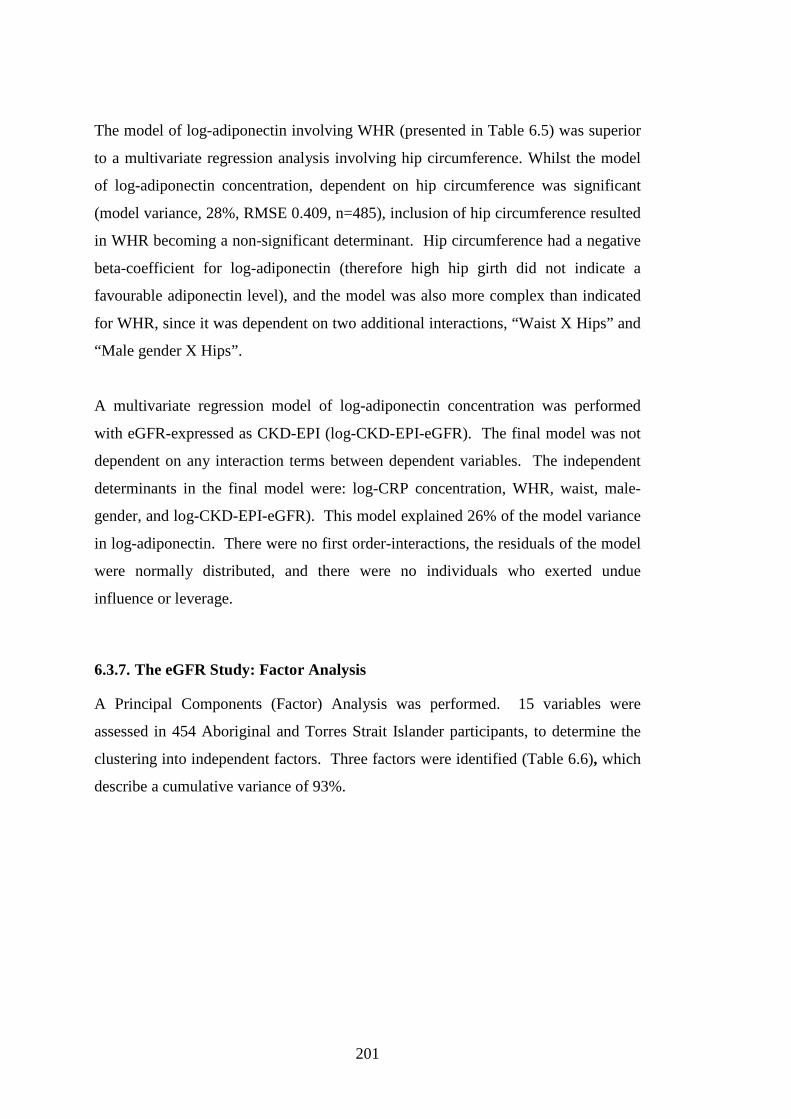
201
The model of log-adiponectin involving WHR (presented in Table 6.5) was superior
to a multivariate regression analysis involving hip circumference. Whilst the model
of log-adiponectin concentration, dependent on hip circumference was significant
(model variance, 28%, RMSE 0.409, n=485), inclusion of hip circumference resulted
in WHR becoming a non-significant determinant. Hip circumference had a negative
beta-coefficient for log-adiponectin (therefore high hip girth did not indicate a
favourable adiponectin level), and the model was also more complex than indicated
for WHR, since it was dependent on two additional interactions, “Waist X Hips” and
“Male gender X Hips”.
A multivariate regression model of log-adiponectin concentration was performed
with eGFR-expressed as CKD-EPI (log-CKD-EPI-eGFR). The final model was not
dependent on any interaction terms between dependent variables. The independent
determinants in the final model were: log-CRP concentration, WHR, waist, male-
gender, and log-CKD-EPI-eGFR). This model explained 26% of the model variance
in log-adiponectin. There were no first order-interactions, the residuals of the model
were normally distributed, and there were no individuals who exerted undue
influence or leverage.
6.3.7. The eGFR Study: Factor Analysis
A Principal Components (Factor) Analysis was performed. 15 variables were
assessed in 454 Aboriginal and Torres Strait Islander participants, to determine the
clustering into independent factors. Three factors were identified (Table 6.6), which
describe a cumulative variance of 93%.
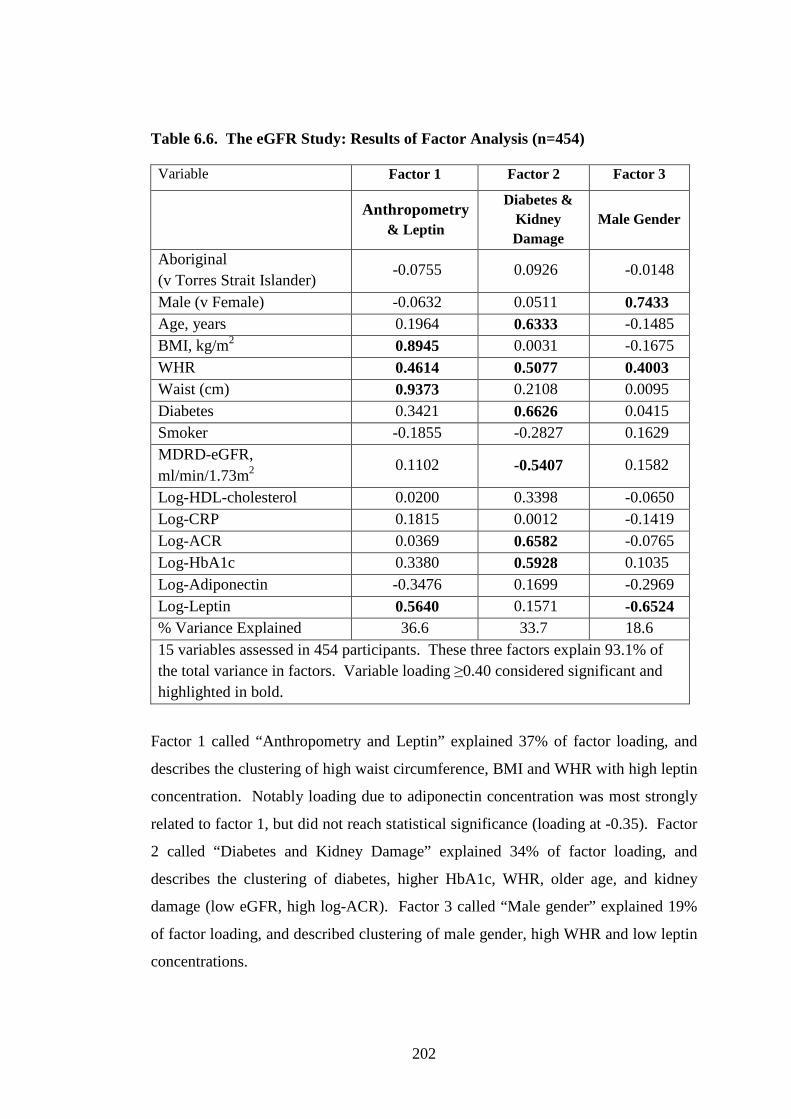
202
Table 6.6. The eGFR Study: Results of Factor Analysis (n=454)
Variable Factor 1 Factor 2 Factor 3
Anthropometry
& Leptin
Diabetes & Kidney Damage
Male Gender
Aboriginal (v Torres Strait Islander)
-0.0755 0.0926 -0.0148
Male (v Female) -0.0632 0.0511 0.7433 Age, years 0.1964 0.6333 -0.1485 BMI, kg/m2 0.8945 0.0031 -0.1675 WHR 0.4614 0.5077 0.4003 Waist (cm) 0.9373 0.2108 0.0095 Diabetes 0.3421 0.6626 0.0415 Smoker -0.1855 -0.2827 0.1629 MDRD-eGFR, ml/min/1.73m2
0.1102 -0.5407 0.1582
Log-HDL-cholesterol 0.0200 0.3398 -0.0650 Log-CRP 0.1815 0.0012 -0.1419 Log-ACR 0.0369 0.6582 -0.0765 Log-HbA1c 0.3380 0.5928 0.1035 Log-Adiponectin -0.3476 0.1699 -0.2969 Log-Leptin 0.5640 0.1571 -0.6524 % Variance Explained 36.6 33.7 18.6 15 variables assessed in 454 participants. These three factors explain 93.1% of the total variance in factors. Variable loading ≥0.40 considered significant and highlighted in bold.
Factor 1 called “Anthropometry and Leptin” explained 37% of factor loading, and
describes the clustering of high waist circumference, BMI and WHR with high leptin
concentration. Notably loading due to adiponectin concentration was most strongly
related to factor 1, but did not reach statistical significance (loading at -0.35). Factor
2 called “Diabetes and Kidney Damage” explained 34% of factor loading, and
describes the clustering of diabetes, higher HbA1c, WHR, older age, and kidney
damage (low eGFR, high log-ACR). Factor 3 called “Male gender” explained 19%
of factor loading, and described clustering of male gender, high WHR and low leptin
concentrations.
203
In participants without diabetes, two factors were each identified in males and
females. Anthropometric variables of total and central obesity (BMI, waist
circumference and WHR) clustered with high-leptin concentration and low-
adiponectin concentration in both males and females. As expected age and kidney
damage clustered in both males and females. However, in females without diabetes,
the combination of total and central adiposity was associated with other metabolic
factors (high log-HbA1c, high log-CRP concentration). The complete factor analysis
for males and females without diabetes is presented in Appendix Table 10 and
Appendix Table 11.
Factor analysis revealed similar clustering of variables for eGFR expressed as Log-
eGFR–CKD-EPI in all participants, and in males without diabetes. In females
without diabetes, factor 1 was the same as observed in eGFR expressed as MDRD.
However, factor 2 identified the clustering of age, eGFR (inversely) and log-ACR,
but did not cluster with log-HDL-cholesterol (in females).
6.4. Discussion: The eGFR Study
An assessment of adipokine concentrations, body measures and markers of chronic
disease was performed in this analysis. Limitations of the study include that it was a
volunteer cohort, and as such we are unable to comment if this was a population
representative sample of Aboriginal and Torres Strait Islander peoples. Despite this,
in this sample, high rates of chronic disease risk markers was observed in all adults,
and was particularly marked among Aboriginal females. Firstly, Aboriginal females
have a body composition associated with both high total and abdominal obesity
(Table 6.2) which occurred at a lower body mass index than Torres Strait Islander
females. Secondly, a higher frequency of metabolic syndrome markers, including
albuminuria, and a higher CRP concentration and a combination of low-adiponectin
and high-leptin was observed in Aboriginal females (compared to Torres Strait
Islander females) (Table 6.2). Overall, indices of abdominal obesity along with
indicators of kidney damage were associated with lower adiponectin concentrations
in participants (Table 6.5). The findings of this analysis suggest a potential
204
hypothesis: abnormal adipokine concentrations associated with the presence of both
total and abdominal obesity are functionally linked to renal injury.
A High Burden of Chronic Disease Risk Markers in the Whole Cohort of
Indigenous Australians
The frequency of cardiovascular disease risk markers observed in Aboriginal
participants and Torres Strait Islander participants in this analysis are consistent with
reports in other large community based studies of risk for Indigenous Australians
(Leonard et al. 2002; O'Dea et al. 2008). Despite a high background risk in all
groups, the particularly high-risk metabolic profile of females who had high
measures of both total and central obesity was demonstrated by the present study.
The description of metabolic syndrome and related risk has been reviewed in Chapter
1.5, and is therefore not revisited here. However, although the study was not likely
to be population representative, it has demonstrated a large burden of cardiovascular
disease risk markers, and the following discussion exploring the relationship of body
composition, adipokines and kidney damage is likely to be highly relevant to many
Aboriginal people and Torres Strait Islander people.
Adipokine Concentrations in Indigenous Australians
Overall, in the present analysis, median adiponectin concentrations were less than 4.0
ug/ml in male and female participants, including in participants without moderate
kidney impairment (MDRD-eGFR >60 ml/min/1.73m2). In Asian populations
without renal disease, adiponectin concentrations <4.0 ug/ml were more likely to
identify individuals with higher cardio-metabolic risk (Hara et al. 2006), although
others suggest this threshold (<4.0 ug/ml) may not be universally appropriate for
other ethnic groups (Im et al. 2006). Higher cardiovascular disease risk burden was
also observed by a combination of high leptin and low adiponectin concentrations
among Indian people (Kanjilal et al. 2008), which is also consistent with the pattern
of chronic disease risk markers observed here.
Among healthy adult females (shown in Chapter 4), lower adiponectin
concentrations in Aboriginal than non-Indigenous females was explained by a higher
percent body fat, and not by ethnicity. In the present analysis, consistent with other
studies of adults with kidney disease, adiponectin concentrations were higher in
205
participants with a lower eGFR than individuals with less impaired kidney function
(Looker et al. 2004; Shen et al. 2007a). In the context of adults with kidney damage,
the cardiovascular consequences of low adiponectin concentrations were
demonstrated in other populations: in adults with moderate kidney impairment (GFR
60 ml/min/1.73m2), those among the cohort with lower adiponectin concentrations
were predicted to have a cardiovascular disease event in the ensuing 54 months of
follow-up (Becker et al. 2005). Similar findings of low relative adiponectin
concentrations and cardiovascular disease risk were observed in adults who required
dialysis (Zoccali et al. 2002). Prospective follow-up of cardiovascular disease
outcomes in The eGFR Study cohort will be required to identify if a threshold of A:L
ratio, or adiponectin concentration may identify individuals with higher than
background risk, for Indigenous Australian adults with and without significant
kidney impairment. This is planned in the follow-up phase of The eGFR Study.
Potential Link between Adiposity, Metabolic Syndrome, Adipokines and Renal
Injury in Indigenous Australians
Body Composition
As presented in Chapter 5, while Aboriginal people and Torres Strait Islander people
both had relatively longer limbs and short torso for a given height, Torres Strait
Islander participants had a significantly heavier body build: wider across the
shoulders and pelvis and a more muscular build. A higher hip circumference relative
to central body fat appeared to be protective for either factor 1 or factor 2 (in the
Principal Components Analysis that included WHR rather than absolute hip
circumference). Therefore, a higher BMI appears to be less of a risk in Torres Strait
Islander participants, due to a higher lean body mass for size, than is observed for
Aboriginal participants.
Waist circumference or BMI are indicative of central and total obesity, but are not
sensitive enough to describe abdominal fat partitioning, particularly across different
populations. CRP concentration was likely to be related to the burden of intra-
abdominal fat in the setting of a large waist circumference in the multivariate model
of log-adiponectin concentration in the present study. The model may have been
further improved by the addition of sagittal abdominal diameter (which was not
206
measured in this study, but could be measured in future studies). Like the sagittal
abdominal diameter, WHR was a superior indicator of intra-abdominal fat burden
(than BMI) across populations with different body compositions (shown in the
Healthy Top-Enders’ study, Chapter 4). WHR was also a superior indicator of
cardiovascular disease risk than BMI across multi-ethnic international populations
(Yusuf et al. 2004), and between Aboriginal populations and Torres Strait Islander
populations with cardio-metabolic diseases (Kondalsamy-Chennakesavan et al. 2008;
Li et al. 2010).
High Resistance and CRP Concentration are Both Related to High Central
Body Fat in Aboriginal People
Aboriginal participants in this study had a body composition characterised by both
high total and abdominal obesity. Despite similarities in body height in males and
females between ethnic groups, higher resistance in Aboriginal participants in the
present study indicates higher relative proportion of fat and therefore proportionately
lower lean mass than Torres Strait Islander participants. As shown in Chapter 4,
Aboriginal males and females with high WHR also had high percent body fat, high
intra-abdominal fat burden and abnormalities in vascular disease risk biomarkers
(particularly high CRP concentration, and low concentatiosns of HDL-cholesterol,
and adiponectin).
In summary, heightened cardiovascular disease risk in Aboriginal participants and
Torres Strait Islander participants was exemplified by the combined presence of high
CRP concentration, abdominal obesity and kidney damage (shown in Appendix
Table 11). These markers were all independent determinants of log-adiponectin
concentration in the multivariate regression model in the present analysis (shown in
Table 6.5).
Body Composition and Adipokine Concentrations: Adipose Tissue
The pathophysiological consequences of obesity, adipose tissue remodelling, and the
expression of adipokines and other biomarkers was reviewed in the Introduction
(Chapter 1.7.7). In Aboriginal participants in the present study, the pattern of
predominant visceral obesity was shown to be related to low adiponectin
207
concentration, low A:L ratio and high CRP concentration (and IL-6 concentration, as
seen in Chapter 4). The following studies explain how this pattern of body
composition is related to this pattern of biomarkers.
Subcutaneous adipose tissue is the preferred storage site of lipid. Healthy lean
Aboriginal adults have higher subcutaneous fat measures at very low body mass
index than was expected compared with Caucasian populations (Norgan 1994).
Subcutaneous adipocytes are responsible for the production of adiponectin, under the
influence of ADIPO-Q gene (Kursawe et al. 2010). Visceral abdominal fat reflects
excess lipid deposited within the abdomen that cannot be accommodated by
subcutaneous depots. In individuals with predominantly visceral obesity, Kursawe et
al. (Kursawe et al. 2010) reported subcutaneous adipocytes were unable to produce
adiponectin. Visceral obesity was also associated with a local pro-inflammatory
response of tissue macrophages (secreting inflammatory factors including IL-6), and
associated with an abnormal extra-cellular matrix, fibrotic tissue and poorly
developed local capillaries (Spencer et al. 2011). IL-6 was shown to be secreted
from both subcutaneous and intra-abdominal adipose sites (Mohamed-Ali et al.
1997), but was preferentially secreted from intra-abdominal fat (measured by portal
vein sampling) in individuals with large intra-abdominal fat burden or a predominant
pattern of visceral obesity (Fontana et al. 2007).
Differences in abdominal fat partitioning were observed between Aboriginal adults
and Caucasian adults in the Healthy Top-Enders’ study (Chapter 4). Differences in
abdominal fat partitioning have been described between other ethnic populations
(Beasley et al. 2009). As described above and in earlier chapters, overweight
Aboriginal females readily deposit intra-abdominal fat with weight gain, but were
also observed to maintain a high subcutaneous adipose mass, and have high percent
body fat. The combination of high total and abdominal obesity in overweight
Aboriginal females therefore explains the association of an abnormal metabolic and
adipokine profile observed in the present analysis.
In contrast, overweight Torres Strait Islander females have a different body
composition to that of overweight Aboriginal females, characterised by a more
generalised obesity, and higher relative lean body mass than Aboriginal females.
208
This is consistent with overweight Torres Strait Islander females having higher leptin
concentration, preserved A:L ratio, and lower CRP concentrations than Aboriginal
females (Table 6.2). It was not feasible in the methodology of the study to examine
abdominal fat partitioning of Torres Strait Islander peoples to determine if (and to
what extent) a large waist circumference and hip circumference is associated with
higher subcutaneous adipose depots than is observed in Aboriginal participants.
Torres Strait Islanders: Protected by their Robust Body Build and Associated
High Muscle Mass?
Hip girth reflects gluteal lean mass and subcutaneous adipose tissue. Yki-Jarvinen et
al. (Yki-Jarvinen et al. 1985) showed that individuals with higher relative lean mass
had higher relative insulin clearance rates than individuals with lower relative lean
mass. Across populations of different body builds, higher insulin sensitivity was
reported to associate more strongly in those with higher hip circumferences (Snijder
et al. 2004b). In females, higher hip circumference (and improved insulin
sensitivity) was attributed to higher subcutaneous gluteal adipose tissue (Snijder et
al. 2004a). In males, higher hip circumference (and improved insulin sensitivity)
was attributed to higher gluteal lean mass (Snijder et al. 2004b). The most deranged
adipokine profile observed in this cohort was in participants who had both a high
WHR and high waist circumference (Table 6.6, Appendix Table 11). That Torres
Strait Islander participants have high BMI, high waist circumference but lower WHR
than Aboriginal participants is suggestive of a metabolic resilience which in the
argument of Snijder et al. (Snijder et al. 2004a; Snijder 2004b) may be due to a
combination of both higher gluteal subcutaneous adipose and lean mass in this ethnic
group.
Body Composition and Adipokine Concentrations: Lean Body Mass
Dysglycaemia is a key risk marker of cardiovascular disease risk in Indigenous
Australians (McDermott et al. 2004), and low lean mass for size may be an early
predisposing factor for this in Aboriginal people. Aboriginal people may therefore
have higher cardiovascular disease risk in the setting of low lean mass (and thus
lower insulin clearance rates), and therefore a very low tolerance of higher body fat
due to their unique body composition.
209
Whilst adipocytes have regenerative capacity, skeletal muscle cells do not. It is not
known if Aboriginal participants in the present cohorts have a lower complement of
myocytes (explaining the lower lean mass for size) which explains their difference in
body composition, or if a challenging intrauterine environment was universally
responsible for this. It was previously reported that remote-living Aboriginal people
born with low birth weight were proportionately small in adult life, and had a higher
risk of mortality from natural causes (Hoy et al. 2010b; Hoy et al. 1998). Two
additional factors (not previously examined) relating to low relative lean mass for
size may be differences in normal age-related change in sarcopenia between the two
ethnic groups, which has been identified in other populations (He et al. 2003), or the
additive burden of current smoking in Aboriginal people (more so than Torres Strait
Islander people) with changes in body composition. These factors require a
prospective study design.
The more preserved A:L ratio in overweight Torres Strait Islander females relative to
overweight Aboriginal females may be indicative of a more preserved insulin-
sensitivity profile due to larger gluteal lean mass, a more efficient subcutaneous
adipocyte storage capacity with overweight (thereby preserved adiponectin
secretion), and/or differences in ectopic adipose storage sites. Whole body MRI
would have demonstrated any differences in abdominal fat partitioning, non-
abdominal ectopic adipose depots, and relative gluteal fat and lean mass between
Aboriginal and Torres Strait Islander people (however such facilities were not
available at all recruitment sites). In this study, it was not feasible to perform
assessments for insulin sensitivity in the field. Total adiponectin concentration was
reported in this analysis, and has been inversely related to insulin sensitivity in other
populations (Mente et al. 2010). The concentration of high-molecular weight
adiponectin isoform has been described as a more superior indicator of insulin-
sensitivity than total adiponectin or other adiponectin isoforms (Hara et al. 2006;
Shen et al. 2007b), and may be an alternative marker of insulin-sensitivity profile
between groups with different body composition.
210
Adipokines and Kidney Damage
Several reports indicate receptors for adiponectin and leptin remain functional in the
presence of impaired kidney function (Shen et al. 2007a). Low adiponectin and high
leptin concentrations are also likely to exacerbate kidney damage (Sharma et al.
2008; Wei et al. 2004). Low adiponectin concentrations were directly linked with
podocyte damage and manifested as albuminuria (Sharma et al. 2008). In addition,
obesity associated with high leptin concentrations resulted (in order) in early
glomerular hyper-filtration, later nephron fibrosis, albuminuria and subsequent loss
in GFR (Wei et al. 2004). Therefore in the setting of obesity, the combination of
both high leptin and low adiponectin concentrations represents a high-risk situation
for the development of kidney damage and cardiovascular disease risk.
Thus, several mechanisms indicate the relationship of hypo-adiponectinaemia and
hyper-leptinaemia with renal injury. These mechanisms also provide some context
to the pattern of albuminuria seen among Aboriginal and Torres Strait Islander
populations. This pattern of renal injury due to obesity and hyper-leptinaemia is
consistent with the reporting of albuminuria with multiple metabolic syndrome
indicators, but preserved GFR in many studies involving Aboriginal people (Maple-
Brown et al. 2011; Rowley et al. 2000). These studies may have therefore assessed
participants at an earlier spectrum of renal injury, prior to the development of
nephron fibrosis and GFR loss. McDermott et al. (McDermott et al. 2004) reported
that Torres Strait Islander people with diabetes were more likely to have a higher
HbA1c, but lower albuminuria and diastolic blood pressure compared to Aboriginal
people with diabetes. The origins of albuminuria may therefore be different between
the groups: where albuminuria manifests in the setting of diabetes in Torres Strait
Islander people, however, reflects endothelial damage in Aboriginal people, since it
is often observed in non-diabetic individuals, and often clusters with abdominal
obesity (Rowley et al. 2000). The latter may be a reason for the high frequency of
Indigenous Australians with the clinical diagnosis of “presumed glomerulonephritis
without biopsy” recorded in the ANZDATA registry who require dialysis. As we
propose above, this propensity to low A:L ratio (independent of indicators of kidney
damage) may lie in the combination of low metabolic resilience with lower relative
lean body mass (lack of insulin sensitivity), or a more pronounced visceral obesity
(and low absolute adiponectin production and secretion).
211
Finally, Aboriginal people may have less resistance to kidney damage in the setting
of low A:L ratio due to glomerulomegaly. As discussed above (Chapter 1.5.1),
glomerulomegaly was frequently observed in remote living Aboriginal people
(Bertram et al. 1998; Moore et al. 1996), represents a compensatory response to low
nephron endowment (Hughson et al. 2003), and individuals with glomerulomegaly
are prone to accelerated renal injury with additional insults (Hoy et al. 2010a).
Therefore, Aboriginal people may be vulnerable to the effects of high leptin and low-
adiponectin concentrations. It is not possible to comment how accurate this
statement is for Torres Strait Islander peoples, since they were not represented in the
kidney biopsy studies that examined nephron size and endowment (Bertram et al.
1998). Nonetheless, multiple renal insults are reported over the life-course in
Aboriginal people (Hoy et al. 2010b), which may also contribute to nephron stress
and later decline in kidney function in the setting of obesity and hyper-leptinaemia.
In addition, our findings in Torres Strait Islander participants may be limited by
small numbers in that group.
The opportunity to modify kidney damage in the setting of low adiponectin and high
leptin requires investigation. Macro-albuminuria is associated with worse renal and
cardiovascular outcome than micro-albuminuria (Hoy et al. 2001b). Albuminuria
was reported to resolve in mice with low serum adiponectin levels in as little as 10
days following adiponectin supplementation, and was directly related to podocyte
repair (Sharma et al. 2008). However, there are no human studies using
supplemental adiponectin, though this may be clinically possible by lifestyle
modification. Improvements in urinary protein excretion rate was observed
following weight-loss in obese adults with albuminuria and early stage chronic
kidney damage (Navaneethan et al. 2009). The study did not report if weight loss
was primarily due to the loss of fat or lean mass, and did not report adipokines or the
trajectory of kidney function (GFR) in response to weight loss. The relatedness of
adiponectin, kidney function and central obesity identified in the multivariate model
of adiponectin in the present analysis suggests that a lower WHR and/or lower
degree of albuminuria may impact eGFR result, though it was not possible in this
cross-sectional analysis to quantify the impact on eGFR trajectory from any such
intervention to modify WHR or albuminuria. Hoy et al. (Hoy et al. 2001a) reported
212
macro-albuminuria was a major risk marker for renal and cardiovascular disease in
one remote Aboriginal community, however the study should be repeated in a larger
sample of Indigenous Australians across diverse geographic settings to identify other
indicators of rapid GFR loss. Abdominal obesity or A:L ratio may be identified as a
high risk indicator of progressive kidney damage, and this will be addressed in the
follow-up phase of The eGFR Study.
Body Composition Differences and the Reporting of estimated GFR
This analysis presents estimated kidney function using eGFR formulae, in line with
national standards of reporting kidney function (Mathew et al. 2007). The analysis
does not include results of a reference test of kidney function, as that was beyond the
scope of research questions addressed in the thesis. However, the potential bias of
reporting kidney function in Aboriginal and Torres Strait Islander people is briefly
considered.
Serum creatinine has been used for many years as an indirect biomarker of kidney
function, reflecting dietary origins, and endogenous creatinine as a myocyte-derived
protein (from lean mass). Formulae that indirectly report kidney function using
creatinine interpret lean mass using age, gender and ethnicity (Levey et al. 1999;
Levey et al. 2009), and express kidney function as estimated glomerular filtration
rate, eGFR, in units of ml/min/1.73m2. As described in the Introduction (Chapter 1),
lean mass declines with age (Valentin 2002), males have more lean mass than
females (Heymsfield et al. 1990) and African American people were shown to have
higher lean body mass than Caucasian people (Gallagher et al. 2000; Levey et al.
1999). The normalised reporting of kidney function, by correcting for 1.73m2 body
surface area (as an index of nephron number), in order to compare between
individuals was criticised by Ruggieri et al. (Ruggieri et al. 2010) in a recent review.
Two specific reasons were the difficulty in accurately predicting body surface area,
and second, a more overweight population today promotes a lower actual body
surface area (for a given body weight) than was originally described in the reference
group (from early 1900’s) (Ruggieri et al. 2010). The further potential bias of eGFR
applies to any population with high levels of overweight and obesity (Jesudason et al.
2011).
213
The potential bias in eGFR for either Aboriginal people or Torres Strait Islander
people may reflect one or all of:
1. Differences in skeletal proportions, that infer a different trunk geometry
(shown in Chapter 3 and Chapter 5), and likely a different body surface area
between Aboriginal, Torres Strait Islander and Caucasian groups
2. Differences in relative lean mass for size (shown in Chapter 3);
3. Lack of information regarding rates of sarcopenia with normal aging, since
this was demonstrated in other ethnic groups when compared with Caucasian
people, (He et al. 2003);
4. Aboriginal participants and Torres Strait Islander participants in the present
analysis were overweight. A reference test of kidney function performed in
combination with reference methods of body composition to control for lean
and fat mass may provide useful clinical information regarding the accuracy
of MDRD formula (and CKD-EPI formula) of kidney function in overweight
and obese populations (Jesudason et al. 2011), and is planned in a future
analysis as part of the larger eGFR Study.
Limitations
The study was not designed as a population-based study. Participants were recruited
across five pre-defined strata of health, diabetes and kidney damage, and as such are
unlikely to be representative of their own community or the wider population in
either age or body composition. A difference in body size and composition between
Aboriginal and Torres Strait Islander participants was presented in Chapter 5. In the
present study, ethnicity was not a significant main effect explaining adiponectin or
leptin concentrations in males and females. This may be interpreted in several ways.
The analytical approach in this Chapter described the cardio-metabolic risk markers
in the cohort, and the associated concentrations of adipokines. Statistical power is
dependent on the true difference between the ethnic groups (which is unknown with
regards to adipokines), the sample size (including in subgroups, such as strata of
kidney function), and the balance between the alpha level (the level of statistical
significance set to detect a difference) and the number of comparisons to be made
(the k value). If the number of comparisons is high, then the alpha level should be
214
low to maintain statistical power. It was challenging to achieve statistical power in
this analysis. First, Torres Strait Islander peoples are a minority group compared
with Aboriginal Australians; hence achieving an adequate sample size that was
population representative was not likely. Second, whilst severe kidney disease is
associated with morbidity for individuals, it is not a common finding in the general
population, and is a less common finding in remote regions of Australia, particularly
where the Torres Strait Islander participants were primarily recruited (Thursday
Island). Large numbers of Torres Strait Islander adults were recruited in the present
study, however fewer Torres Strait Islander participants had macro-albuminuria or
low eGFR (<60 ml/min/1.73m2) than Aboriginal participants. Low and unequal
numbers of participants with poor kidney function has likely affected the statistical
power in this analysis to detect differences between the groups. The findings from
this analysis are likely to more strongly reflect the group of participants with the
largest sample size (Aboriginal participants). The lack of difference in adiponectin
concentrations in the Torres Strait Islander subgroup likely relates to the small
number of participants in that group. Since a comparatively smaller sample of
Torres Strait Islander participants was assessed, and there was no main effect of
ethnicity between the groups for adipokines, further studies would be strengthened
by the recruitment of similar numbers of Torres Strait Islander participants as
Aboriginal participants in each strata, which would confirm the findings and our
interpretation of the present analysis.
A multivariate regression model was the multifactorial method used to describe
differences in adiponectin concentration in the study population. It was used in
preference to an alternate method, such as the Bonferroni correction for several
reasons: since the data was taken from a survey, the variables assessed in the model
may have not been as independent as required (and this was addressed by the
variance of inflation test for multicollinearity of variables in the multiple regression
model); comparisons in adiponectin concentrations between participants involved
multiple subgroups (for which Bonferroni method is overly conservative in
describing differences); and unequal participants in each subgroup may have
erroneously detected a difference when a true difference did not exist- where this can
be addressed by the post test analysis of the multivariate regression model by
assessing for interactions.
215
An alternative interpretation to the lack effect of ‘ethnicity’ on adipokine
concentrations is also considered. Among the Aboriginal and Torres Strait Islander
participants in the present analysis, a stronger biochemical indicator of
cardiovascular risk was shown by body composition and particularly the propensity
to total and abdominal obesity rather than an ethnicity term. In this analysis the
study sample did not have a clearly defined control or healthy group. However,
Chapter 4 provides this perspective, and showed there was no expectation that
adiponectin concentrations differed between Aboriginal and Caucasian participants
on the basis of ethnicity. In fact, adiponectin concentrations were lower in
Aboriginal females (than non-Indigenous females) on the basis of higher percent
body fat. Aboriginal Australians and Torres Strait Islander Australians are diverse
peoples. The heterogeneity in the wider Indigenous population was reflected to some
extent in the present analysis with respect to age, albuminuria, eGFR, smoking
status, recruitment locality and comorbid illness. In spite of this heterogeneity, a
higher cardiovascular risk profile was observed in individuals who have high total
and abdominal obesity, and kidney damage. This finding is likely to be clinically
useful, although should be confirmed in prospective studies. Thus, differences
observed in the current study may relate to small participant numbers and hence a
lack of statistical power in some groups, or alternatively may relate to differences in
body composition (such as percent body fat) between groups.
Adipose related biomarkers and their association with other metabolic indicators of
cardiovascular disease risk were the focus of the present analysis. In Chapter 5, the
careful characterisation of body composition of Aboriginal compared with Torres
Strait Islander participants was examined: a more robust body build with higher
proportion of lean mass for size of Torres Strait Islander participants; and a linear
skeletal build with lower lean mass, and capacity for higher WHR for the same BMI
was evident in Aboriginal participants was presented from Chapter 5. We have thus
demonstrated a greater knowledge of the body composition of Aboriginal and Torres
Strait Islander participants with overweight and obesity through these studies. In the
present analysis, ethnicity was not a significant main effect of low adiponectin
concentrations; however the PhD study has shown that the two groups clearly
diverge with respect to waist circumference and WHR when overweight. In better
216
understanding the two populations with respect to obesity risk, these two easily
performed clinical measures may assist in identifying the clinical context of low
adiponectin concentrations, and ideally stratify high risk individuals among a diverse
population.
Conclusion
Torres Strait Islander people have a fundamentally different body build and
composition compared with Aboriginal people. It was on the basis of differences in
body build that the clearest indication of deranged adipokine concentrations was
observed in this study population. Despite the assessment having been undertaken in
a population with a high frequency of components of the metabolic syndrome, there
was strong evidence for a relationship between abdominal obesity and an adverse
adipokine profile, particularly in women. This requires further confirmation in a
prospective study.
Opportunities to sustainably modify the high risk of cardiovascular disease and
diabetes that is associated with albuminuria and impaired kidney function in
Aboriginal people and Torres Strait Islander people should be a high priority in the
short and long-term. This is likely to include prevention of excessive weight gain,
particularly early in adult life, and early in the evolution of chronic disease to achieve
critical gains in health. Lifestyle interventions incorporating detailed body
composition and adipokine studies should occur in partnership with communities,
and may require a tailored approach due to inherent differences in body build and
composition between Aboriginal people and Torres Strait Islander people, and for
different health strata.

Chapter 7. Discussion and Conclusion
7.1. Addressing the Objectives of the thesis
The aim of this study was “to understand how body build, composition, and markers
of kidney damage relate to metabolic syndrome components in adult Aboriginal
people and adult Torres Strait Islander people, within the context of two volunteering
adult health screening studies”.
Objective 1. What are the earliest chronic disease risk markers evident in
otherwise healthy young adult Aboriginal people?
Abdominal obesity is the earliest chronic disease risk marker evident in otherwise
healthy adult Aboriginal people. This was best demonstrated in Aboriginal males in
the Healthy Top-Enders’ study (Chapter 4). Aboriginal males with a low body fat
percent had lower intra-abdominal fat (IAF) area than lean Caucasian males. Both
Aboriginal and Caucasian males with low body fat percent were objectively healthy,
although a higher fasting insulin concentration (trend p=0.06) was observed in
Aboriginal males. Aboriginal males with higher body fat percent had higher intra-
abdominal fat area, HOMA score, and concentrations of insulin and CRP than
Caucasian males with high percent body fat.
Among females, despite a mean BMI <25 kg/m2 in the group, there was a trend for
Aboriginal females to have higher body fat percent compared with BMI-matched
non-Indigenous females. It was therefore not possible to determine the best
biochemical profile associated with a lean physique in Aboriginal females.
Aboriginal females had higher IAF area measured over two inter-vertebral levels of
the abdomen than Caucasian females. This was a striking finding for two reasons:
firstly, because it highlights an android pattern of obesity that has not been described
for healthy young females of any ethnic group in the literature; secondly, high IAF
areas are more characteristically seen in post-menopausal females. In the presence of
high IAF areas, Aboriginal females in the Healthy Top-Enders’ study retained high
abdominal subcutaneous fat areas, however had proportionately less limb fat,
consistent with other reports of Aboriginal women (Piers et al. 2003; Rutishauser et
al. 1986). This pattern of high total and abdominal adiposity in Aboriginal females
was associated with high CRP concentration (trend) and IL-6 concentration.
219
Notably, despite the higher total and abdominal adiposity of young adult Aboriginal
females, none had albuminuria. Lack of albuminuria in this group is consistent with
reports, that (in the absence of a primary renal disease) albuminuria accompanies
established metabolic risk markers, especially abdominal obesity, and does not
precede it (Hoy et al. 2006b; Rowley et al. 2000). The relationship of albuminuria
and central obesity has been demonstrated in other popuations (Chang et al. 2006;
Thoenes et al. 2009).
Objective 2. To describe the characteristics of skeletal build in Aboriginal people
and Torres Strait Islander people.
Aboriginal males and females consistently had a longer leg-length as percent of
height than Caucasian participants. This was observed in both the Healthy Top-
Enders’ study, and the eGFR Study DXA sub-study. Aboriginal males and females
in the Healthy Top-Enders’ study also had narrower absolute pelvis-width and
shoulder-width. Aboriginal females in the eGFR Study DXA sub-study had the
narrowest pelvis-width as percent of height than other female groups. The longer
leg-length for overall height was primarily due to longer distal portion of the limb
(tibia), which supports previous descriptions of Aboriginal people (Abbie 1969;
Roberts 1953).
Two striking observations of the Torres Strait Islander skeletal build was first, the
relatively longer leg-length than Caucasian and Aboriginal participants, and second,
wider skeletal-breadths. Torres Strait Islander females consistently had a wider
pelvis-width than Torres Strait Islander males, and wider than Aboriginal females.
Aboriginal participants had the narrowest and lightest skeletal build of the three
groups.
Objective 3. How do observed differences in skeletal build relate to body
composition in Aboriginal adults and Torres Strait Islander adults?
In this study, lean body mass was positively related to standing height, skeletal width
and inversely related to resistance (by BIA). Aboriginal participants in the Healthy
Top-Enders’ study had similar body mass index to Caucasian participants,
220
proportionately longer leg-length and lower total fat free mass (though only a trend
in males). However, despite matching for BMI, the differences in lean mass between
Aboriginal males and Caucasian males failed to reach statistical significance when
adjusted for height. Components of standing height were related to the pattern of fat
distribution (where shorter trunk-length % identified a truncal-pattern of adiposity),
but were not independently related to lean body mass between Aboriginal
participants and Caucasian participants in the Healthy Top-Enders’ study.
Torres Strait Islander participants had the highest BMI, and lowest WHR of the
eGFR Study DXA sub-study groups. Torres Strait Islander participants and
Aboriginal participants both had proportionately longer leg-lengths than Caucasian
participants in the eGFR DXA sub-study, and both groups also had high indices of
truncal adiposity, though Aboriginal participants, regardless of gender had the
highest body fat percent and trunk:peripheral fat ratio. Hence, longer leg-length in
Aboriginal participants and Torres Strait Islander participants in the eGFR Study
DXA sub-study was consistent with the preferential truncal pattern of adiposity
shown in the Healthy Top–Enders’ study however Aboriginal participants had a
stronger pattern of central obesity of the two groups. This may be influenced by
differences in skeletal width and/or lean mass between the groups.
In multivariate analyses, of the two skeletal proportion measures, pelvis-width was
most strongly (and inversely) related to resistance than trunk-length %, regardless of
ethnicity. In turn, resistance was strongly and inversely related to lean body mass in
the multivariate analysis in the eGFR Study DXA sub-study, and individuals of
Torres Strait Islander background (either Torres Strait Islander or Both Aboriginal
and Torres Strait Islander) had higher lean mass than Aboriginal participants. Hence,
greater skeletal-width characterises people of a Torres Strait Islander background,
and in turn independently determined higher lean body mass.
Torres Strait Islander females have a more muscular build but lower central obesity
than Aboriginal females. Craig et al. (Craig et al. 2003) showed that Tongan women
without chronic disease had a higher body mass index and lean mass, but lower
tendency to central adiposity than overweight Caucasian females (without chronic
disease). It is not clear if (or how) the presence of high lean mass influences the
221
pattern of ectopic fat distribution in overweight, though a higher proportion of lean
mass has been associated with a more favourable metabolic profile relative to less
muscularly built people (Yki-Jarvinen et al. 1985).
In other studies, the breadth of other large joints (using callipers), such as the knee or
elbow also indicate the muscularity of body build (Snijder et al. 1999). These
measures were not assessed in the current analysis, but could be determined from
whole body DXA using the ruler tool function. This is another potential indicator of
skeletal build that may be less intrusive to participants, and perhaps offer fewer
technical difficulties with reproducibility since little overlying adipose or lean tissue
is observed in the respective regions.
Finally skeletal dimensions indicate a tendency toward a particular body build, and
have been widely described in different populations who are both lean and healthy
(Deurenberg et al. 2002a; Gurrici et al. 1999; Katzmarzyk et al. 1999; Snijder et al.
1999). Accurately predicting body composition at an individual level remains
difficult, since several factors influence actual body composition, including age,
gender and physical activity. This analysis was unique, since it described an adult
cohort with wide age distribution and chronic disease risk markers, including
overweight. We have described differences in skeletal build and revealed clear
differences in body fat distribution and the proportion of lean mass between
Aboriginal participants and Torres Strait Islander participants.
Objective 4. To determine the best indirect measures of body composition in the
assessment of chronic disease risk in adult Aboriginal people and adult Torres
Strait Islander people.
Chronic disease risk was strongly indicated by central obesity in both the Healthy
Top-Enders’ study and The eGFR Study. Aboriginal participants and non-
Indigenous participants in the Healthy Top-Enders’ study each had a distinct body
composition. Regardless of differences in body composition, intra-abdominal fat
burden was most strongly indicated by the waist to hip ratio and sagittal abdominal
diameter of the abdomen. WHR was a better surrogate of chronic disease risk than
222
BMI and indicated truncal distribution of body fat (observed by DXA), and CT
measures of intra-abdominal fat burden.
In the eGFR Study DXA-sub-study, Aboriginal participants and Torres Strait
Islander participants both had higher WHR than Caucasians, and higher than
recommendations for health (Alberti et al. 2006). The presence of at least 3 markers
of the metabolic syndrome, and higher CRP concentration has been independently
related to higher risk of cardiovascular disease in other populations (Ridker et al.
1998). In the eGFR Study DXA sub-study, trunk:peripheral fat ratio (measured by
DXA) was strongly correlated with WHR, and central obesity was most strongly
linked with at least three metabolic syndrome markers in the multivariate logistic
model of metabolic syndrome. In separate multivariate regression models, a high
concentration of CRP was most strongly related (in order) to trunk fat mass, fat mass
(both were not dependent on gender) and waist circumference. Gender and waist
were independent determinants of log-CRP concentration in the multivariate
regression analysis in the eGFR Study DXA sub-study, and all three (gender, waist
circumference and log-CRP concentration) were independent determinants of log-
adiponectin concentration in the multivariate regression analysis in The eGFR Study.
Objective 5. To examine the relationships of adipose-derived cytokines with body
composition in healthy Aboriginal people, and in Aboriginal and Torres Strait
Islander people with markers of chronic disease.
The thesis has identified that chronic disease risk starts with weight gain and
manifests as intra-abdominal obesity in Aboriginal people. This weight gain
precedes albuminuria. Albuminuria was shown to cluster with other chronic disease
markers in other studies (Hoy et al. 2006b; Rowley et al. 2000), particularly
abdominal obesity, hypertension, dysglycaemia and low HDL-cholesterol
concentration.
Albuminuria was a significant independent determinant of adiponectin concentration
in The eGFR Study. Even after controlling for gender and eGFR, higher ACR was
associated with low adiponectin concentrations. The multivariate regression model
of determinants of log-adiponectin also identified waist circumference, WHR, and
223
log-CRP concentration, suggesting a relationship between abdominal obesity and
albuminuria, and is therefore consistent with reports in other populations (Chang et
al. 2006; Thoenes et al. 2009).
As shown by factor analysis in participants without diabetes in The eGFR Study
(Appendix Table 10, Appendix Table 11), ethnicity was not a key determinant of
metabolic risk. In males and females, the combination of high leptin concentration
and low adiponectin concentration clustered with a body composition typified by
high total and abdominal obesity (rather than high total and general obesity). Both
Aboriginal participants and Torres Strait Islander participants have high total and
central obesity, however Aboriginal participants have a stronger pattern of central
obesity of the two groups. This, together with the proportionately lower muscle mass
of Aboriginal adults, is likely to explain the high burden of chronic disease in both
groups, when compared with non-Indigenous Australians (Hoy et al. 2007; Li et al.
2010; Maple-Brown et al. 2009).
Females without diabetes had a more serious pattern of risk associated with high total
and abdominal adiposity, indicated by the clustering of log-CRP concentration and
HbA1c with high leptin concentration and low-adiponectin concentration. Log-CRP
concentration was shown in the Healthy Top-Enders’ study to best indicate IAF
burden. Therefore CRP concentration was likely to indicate the burden of IAF
associated with a given waist circumference in these studies. The burden of IAF may
have also been indicated by the sagittal abdominal diameter, and is worth pursuing
the relationship of SAD, IAF and CRP concentrations in future studies.
HbA1c was the final factor clustering with high total and abdominal obesity
measures in females without diabetes. Higher insulin sensitivity is related to higher
insulin-clearance rates due to better preserved kidney function (Rabkin et al. 1984),
higher relative lean mass (Yki-Jarvinen et al. 1985) and lower central abdominal fat
(Charlesworth et al. 2005). Insulin sensitivity has also been strongly indicated by
adiponectin concentrations (Hara et al. 2006), and lower adiponectin concentrations
are associated with a higher burden of intra-abdominal fat (as shown in the Healthy
Top-Enders’ study). Torres Strait Islander females had a better preserved A:L ratio
(despite high total and abdominal obesity), and this may be due to higher lean body
224
mass for size (which we have conclusively shown in this study), but may also reflect
a more favorable abdominal fat partitioning profile (higher subcutaneous fat to intra-
abdominal fat burden), and perhaps a higher subcutaneous fat mass over the buttocks
(contributing to higher hip circumference, and lower WHR). The relationship of lean
body mass with health risk requires further investigation, which was beyond the
scope of the present study.
Finally, in agreement with other human and animal models, the burden of
progressive kidney damage was considered for females, and particularly Aboriginal
females since several findings relevant to a model of kidney injury are plausible: the
combination of high leptin and low adiponectin concentrations in overweight (in the
eGFR Study), a higher burden of intra-abdominal fat for size (Healthy Top-Enders’
study), less metabolic resilience due to lower lean body mass for size (shown in
Chapter 3, Chapter 4 and Chapter 5), and susceptibility to progressive kidney
damage in the setting of glomerulomegaly (Bertram et al. 1998) which was described
in Chapter 1. Studies of exercise and weight loss that measure both fat and lean mass
and adipokine profile in conjunction with accurate measures of kidney function may
provide evidence for this hypothesis.
7.2. Ethnicity, Ethnic Admixture, Body Composition and Metabolic
Risk
The final aspect of body composition is the discussion of ethnic admixture in
Indigenous participants. Genetics influence body composition, and ethnicity impacts
lifestyle habits. Researchers have been encouraged to avoid describing differences
between groups on the basis of ethnicity when other more sensitive and
discriminating variables may be used (Winker 2004). As reviewed in Chapter 1,
several factors are reflected in a respondent’s self-identified ethnicity: biology,
ancestry, culture, the lived experience, and affiliation or membership (Callister et al.
2007).
The ‘lived experience of ethnicity’ was not examined in the current study, and may
be pursued in future analysis of the data. The lived experience includes the impact of
socioeconomic factors that impact on lifestyle choices, housing, drug and alcohol
225
use, family size and employment opportunity on chronic disease risk (Cunningham et
al. 2008; Weil et al. 2010). Attitudes and opportunities to exercise presents an
important aspect to obesity risk that should be examined in healthy young adult, and
the more mature and at-risk population of Aboriginal and Torres Strait Islander
peoples.
A strength of the PhD study was the stratification of participants based firstly on the
self-assigned ethnicity of each participant, and secondly participants disclosing the
ethnicity of each of their four grandparents. The resultant stratification of
participants based on the definition of ethnic group used in the thesis (Chapter 2)
permitted a careful examination of the differences in body size and composition
between groups. The strong differences in body composition between groups may
not have been as evident if the three Indigenous groups (Aboriginal, Torres Strait
Islander and both Aboriginal and Torres Strait Islander) were not so carefully
defined.
The relationship of admixture and obesity related health risk for Aboriginal peoples
and Torres Strait Islander peoples was not examined in detail in this analysis. It
remains a valid consideration however, given the large burden of preventable chronic
diseases among adult Aboriginal and Torres Strait Islander peoples. Two aspects of
ethnic admixture in relation to obesity-risk require consideration. First is to examine
if ethnic admixture was considered in previously published studies. Secondly, one
must consider in this era that defining groups based solely on a singly assigned
ethnicity may of itself be a limitation in studies of body composition.
The Australian government definition of an Aboriginal or a Torres Strait Islander
person (which has been appropriately used by many investigators) acknowledges
group membership, self-identification, and descent (Gardiner-Garden 2000), and
does not require an examination of minimum ancestry. The issue of admixture has
been variably dealt with in previously published reports, which may indicate that
assessing admixture in Australia in relation to chronic disease risk is difficult to
measure, and may have also been a sensitive issue for both researchers and
participants. Heitmann et al. (Heitmann et al. 1997) described the differences in
body composition of Aboriginal people compared to Torres Strait Islander people,
226
but carefully excluded those with racial admixture. Others have described the
relationship of diabetes between Aboriginal people of two different towns suggesting
lifestyle impacts, but also the impacts of racial admixture, particularly in Southern
Australia (Cameron et al. 1986; Guest et al. 1992; Williams et al. 1987).
Finally, the issue of body composition and ethnic admixture at the margin might be
considered. Ethnicity may be viewed as a social construct (Rebbeck et al. 2005), and
defined by affiliation and membership in the group (Callister et al. 2007). Outsiders
to the ‘group’ may impose a notion that an individual at an ethnic margin is not fully
included. However, this view may not be accepted by the ‘group’ and ethnic
admixture at the margin may not even exist in terms of the relevant group according
to this definition. For example, the Torres Strait was one of the first truly
multicultural communities in Australia, and Islanders readily accepted and
incorporated the new children and families that have resulted (Shnukal 2001). Yet
body composition is likely to vary in admixed populations, but this change may of
itself reflect any combination and dose of dietary patterns and habits, economic and
social opportunities, differences in priorities, and racial heritage.
In the current analysis, the examination of differences in body composition was not
based on the proportion of a participants’ non-Aboriginal ethnicity (or non-Torres
Strait Islander ethnicity). Instead the intent was to differentiate Aboriginal ethnicity
from Torres Strait Islander ethnicity and from non-Indigenous ethnicity, and identify
a dominant pattern of body composition of each of these groups.
The Healthy Top-Enders’ study primarily recruited Aboriginal participants who had
4 grandparents who identified as Aboriginal, therefore the Healthy Top-Enders’
study more closely reflects the body composition and body-build of remote living
Aboriginal people, and may not reflect that of Aboriginal peoples in urban areas, or
Aboriginal peoples with greater non-Aboriginal ethnic admixture (Guest et al. 1992;
Raja et al. 2003; Williams et al. 1987). The recruitment of participants in the
Healthy Top-Enders’ study contrasts with The eGFR Study: Aboriginal, Torres Strait
Islander and the both Aboriginal and Torres Strait Islander groups in The eGFR
Study have some non-Indigenous admixture, and while their self-identified and
grandparent ethnicity was known, analysis of differences in body composition and
227
cardio-metabolic risk was not explored beyond their self-assigned ethnicity. This
may be a limitation in understanding the full implications of the body composition
differences in this study however it presents a real-life circumstance of this
population group. Nonetheless, using our criteria of ethnicity, Aboriginal
participants demonstrated a different body composition to Torres Strait Islander
participants in our studies: other recommendations may be reflective of more
admixed Indigenous Australians. A dominant body composition was best observed
among the both Aboriginal and Torres Strait Islander group in Chapter 5, whose
indicators of lean body mass were more strongly related to Torres Strait Islander
participants rather than Aboriginal participants. This may be related to the
recruitment of Torres Strait Islander participants in the Torres Strait, rather than from
a population group elsewhere in mainland Australia, where the body composition
might not as strongly reflect the Torres Strait Islander group.
Our response to this difficult issue of ethnic admixture is to assess objective
measures of body composition in relation to health risk, as was performed in the
thesis. That is, the waist to hip ratio, skeletal width, and trunk to height ratio may
provide the best indicators of obesity-related risk even when ethnic admixture is not
an issue. This could be most accurately ascertained with detailed methods of body
composition validating against portable measures as we have done in the present
studies, but in larger populations and accounting for other elements of ethnicity that
have been discussed here.
7.3. Implications for Clinical Practice and Policy
Indigenous Ethnicity
Data relating to obesity-related diseases should capture self-identified ethnicity, and
report for Aboriginal ethnicity, Torres Strait Islander ethnicity and both Aboriginal
and Torres Strait Islander ethnicity separately rather than a convenient grouping as
“Indigenous Australians”. This would best capture differences in Aboriginal peoples
relative to Torres Strait Islander peoples, but would still be challenging to describe
the both Aboriginal and Torres Strait Islander ethnicity group. Our recommendation
is that WHR be used across populations with different body compositions, and
228
particularly in populations with variable ethnic admixture, since it provided the best
assessment of obesity-related risk than a waist circumference or BMI.
Central Obesity and Kidney Disease in Aboriginal & Torres Strait Islander
Australians
Inclusion of waist to hip ratio, in addition to the BMI may greatly improve the
epidemiological study of central obesity with numerous outcomes in patients
requiring renal replacement therapy. Central obesity is likely to be an important
confounder in the relationship of outcomes of end-stage kidney disease with
inflammation, cardiovascular morbidity and mortality, and diabetes outcomes. These
additional measures could be incorporated by the Australian and New Zealand
Dialysis and Transplantation registry, which already conducts a twice-yearly survey
of renal replacement therapy patients through all Australian nephrology units.
Relationship of obesity with renal hyperfiltration
There is now justification for studying the relationship of adiposity with hyper-
filtration injury in Indigenous Australians. From late 2011, eGFR Study participants
were being followed up between 2 to 4 years after baseline assessment, presenting an
ideal opportunity to compare baseline body size, adipokines, and clinical morbidity
with current status (without a specific intervention beyond specialist advice to
treating clinicians). Chronic kidney disease registries should be established in adults
in Australia to monitor the trajectory of kidney function, albuminuria and identify
high-risk clinical situations that may be amenable to lifestyle and therapeutic
interventions.
Maintenance of regular physical activity and high quality nutrition across the
lifespan and particularly during periods of rapid weight gain (adolescence and child-
bearing). Physical activity and nutrition were not assessed in this thesis, however are
integral to controlling obesity-related chronic diseases in Indigenous Australians.
229
7.4. Limitations of the Methodology Used
Both the Healthy Top-Enders’ and eGFR Studies were conducted as intended from
our chosen methods. Whole body DXA was completed in Thursday Island, a remote
island in the Torres Strait, where whole body DXA could only be transported by
barge. At the time, the Hologic brand DXA was the only transportable whole body
DXA in use in Australia. We have not made adjustments for differences in DXA
brand between the two sites since validating equations do not exist for overweight
and obese adults with chronic disease risks. Other collaborative research studies
conducting DXA across widely separated sites acknowledge this potential source of
bias (and have not adjusted their results) (Gallagher et al. 2000). Unavoidably we
had to use two different DXA machines for Aboriginal people in Darwin and Torres
Strait Islander people on Thursday Island.
Multiple comparisons and statistical power
The descriptive body composition studies presented in Aboriginal participants and
Torres Strait Islander participants in the thesis are novel. Chapter 5 and Chapter 6
provided an opportunity to describe the body composition and its metabolic
associations among a large population of Aboriginal and Torres Strait Islander
participants: hence the first study to describe a complex medical cohort of Aboriginal
and Torres Strait Islander peoples. In the analysis of The eGFR Study, several
subgroups of the cohort were identified. An analysis adjusting for the covariates of
gender, ethnicity and the interaction term in Chapter 5 was performed, since several
exposure variables (including demographic and clinical associations) were likely to
influence the unadjusted mean (or median) values. This was particularly relevant for
the non-Indigenous comparator in The eGFR Study (Chapter 5), who had similar
indices of impaired kidney damage, but were also older than Indigenous participants.
Multivariate regression models were presented to describe the relationship of specific
outcomes in the thesis (fat free mass, resistance, and log adiponectin concentration).
The multivariate regression model was preferred to the Bonferroni correction
analysis. The Bonferroni method was not used since the cohort comprised several
potential subgroups, the predictor variables were not likely to be independent (such
as high CRP concentration occurring with low HDL-concentration, which cannot be
230
accounted for by this method), and the presence of low and unequal numbers of
participants in some subgroups is not handled well by the Bonferroni method- all
these factors are accounted for in the approach by the multivariate regression model.
In each multivariate regression model, a type 1 error was minimised by using ten or
fewer predictor variables in the initial model, and ensuring after backwards selection
process, that the final model was free of undue leverage or influence, did not contain
interactions that were not biologically plausible, and finally, that each main effect in
the final model had a p value <0.05. One objective of the thesis was to examine the
relationship of body composition with adiponectin concentrations among Aboriginal
and Torres Strait Islander peoples. This objective was thus framed in order to
explore how indices of obesity (a potentially modifiable risk factor for cardiovascular
diseases) related to adiponectin concentrations (an adipokine with several beneficial
health qualities, including protective against albuminuria when found in sufficient
quantity). The key finding of this analysis was ethnicity was not a key driver of low
adiponectin concentrations, but was due to both kidney damage and obesity. As a
result of the statistical methods employed, opportunities to modify cardiovascular
disease risk are supported through minimising abdominal obesity. This presents an
important opportunity to address the current health inequality of Indigenous
Australians compared with other Australians.
The data presented in the thesis indicate a difference in body composition between
Aboriginal participants and Torres Strait Islander participants. Differences in the
biochemical profile between ethnic groups were not explained by ethnicity, but by
indicators of adiposity (body fat percent in Chapter 4, and the waist circumference
and WHR in Chapter 6). The recruitment of similar numbers of Torres Strait
Islander and Aboriginal participants in Chapter 6 would have been ideal, and have
minimised a concern about lack of statistical power in the analysis. However,
recruiting similar numbers of participants was not an objective of the larger eGFR
Study (for which the data in the thesis is a sub-study). However, as described in
Chapter 1, Indigenous Australians are a minority group in Australia’s population.
Furthermore, Torres Strait Islander peoples are a minority group relative to the
Aboriginal population. Hence, the discrepancy in population size in wider Australia
was also reflected in the discrepant size of Torres Strait Islander participants
compared with Aboriginal participants in the thesis study. Thus our findings may be
231
limited by lack of statistical power due to small numbers of participants, particularly
in sub-groups such as Torres Strait Islander participants.
7.5. Strengths of the study
Healthy Top-Enders’ Study
The Healthy Top-Enders’ study involved a detailed and methodologically rigorous
assessment of metabolic and inflammatory parameters and adipocyte-derived
proteins in combination with sensitive body composition measures. The purpose of
the Healthy Top-Enders’ study was to compare the metabolic and inflammatory
profile with total and regional adiposity in healthy adult Aboriginal people and
Caucasian people.
Several studies have assessed body composition in healthy adults (including a
comparison between Caucasian and other ethnic groups), but involved volunteering
adults who had a higher mean age, and wider age range than assessed in the Healthy
Top-Enders’ study (Carey et al. 1996; Craig et al. 2003). Body composition has been
described in healthy adult populations, however relied on participants self-described
health, rather than objective assessments of health (Gallagher et al. 2000). In the
Healthy Top-Enders’ study, health was assessed by questionnaire, biochemical
measures and blood pressure. The assessment of young adults in a narrow age-range,
and confirmation of health by several objective measures in the Healthy Top-Enders’
study were important inclusion criteria, since a recent cardiovascular disease
screening study identified the presence of two cardiovascular risk factors among
many Indigenous adults younger than 35 years old (O'Dea et al. 2008). Limiting
recruitment to non-elite athletes in the Healthy Top-Enders’ study was felt to provide
the best perspective on older adults with chronic diseases. This recruiting decision
was based on two known factors: adults participating in elite sporting programs may
have variable body compositions (fat and lean mass) (Pineau et al. 2009); and
exercise is associated with anti-inflammatory and insulin sensitising effects in young
and older adults (Lambert et al. 2008; Mendham et al. 2012; Wolsk et al. 2010).
Differences in body composition have been previously reported between racial
groups (Gallagher et al. 2000; Liska et al. 2007). Some studies assessing body
232
composition or diabetes have limited analysis to clearly defined Aboriginal people or
Torres Strait Islander ethnic groups (Heitmann et al. 1997; O'Dea et al. 1993;
Williams et al. 1987). Recruitment in the Healthy Top-Enders’ study was limited to
adults with minimal non-Aboriginal or non-Caucasian ethnic admixture
(respectively), defined by self-identified ethnicity, and the ethnicity of 4
grandparents. Recruitment of Aboriginal participants was sought first, before the
recruitment of the age, gender and BMI-matched Caucasian comparator group.
Several investigators acknowledge the difficulty of recruiting young healthy adults to
detailed body composition and metabolic studies (Glatthaar et al. 1985), which may
be overcome by extended recruitment periods (Kvist et al. 1988).
Inclusion of Indigenous research staff and facilitators are essential to engagement
with the target population, and delivering the research program (Brimblecombe et al.
2006; Hoy et al. 1997; Hoy et al. 2003b; O'Dea et al. 1993; Williams et al. 1987).
Cunningham et al. (Cunningham et al. 2006) identified numerous recruitment
challenges for Indigenous health research studies, that were managed by involvement
of Indigenous people in study design and delivery, involvement in steering
committees, and principles of engagement with the local communities (Cunningham
et al. 2006). The research team for the Healthy Top-Enders’ study comprised two
Indigenous members (SG, and JH- also study leader). The Aboriginal research
assistant (SG), was similarly aged to our target population (aged less than 30 years
old), had grown up in the area, and had established local contacts within the
community. The research team was extensively engaged with different sectors of the
Indigenous community, sought support from local Indigenous facilitators in local
urban Aboriginal communities, with employment program providers, Indigenous
hostel providers, and secondary schools that supported and housed remote
Indigenous students in private homes. The study investigators provided a thank-you
gift as an acknowledgement of each participant’s time in the study, though this was
not advertised at recruitment. These combined methods were designed to recruit a
cross-section of healthy non-elite athlete adults.
Body build and body composition was assessed using a combination of instruments
so that indirect and portable anthropometric tools could be compared against more
sensitive and precise body composition instruments. This included a detailed
233
examination of differences in skeletal proportions using a ruler function with whole
body DXA. Relative limb-length was previously described with sitting height ratios
(Norgan et al. 1995). Since overweight is much more prevalent now than has been in
the past, precise measures of skeletal proportions overcome any bias involved with
sitting height ratios due to excess gluteal fat mass (Norgan et al. 1995). The bone
landmarks used in our analysis approach could be easily identified by both clinical
examination and DXA software, and were previously described in a paediatric
population (Abrahamyan et al. 2008).
The relationship of total adiposity, and abdominal fat partitioning was examined by
DXA and CT in the Healthy Top-Enders’ study. This combination of modalities has
not been examined before, and addresses a specific knowledge gap surrounding body
composition of Aboriginal adults. Furthermore, the relationship of precise measures
of body composition was assessed with biochemical measures and adipokines in the
Healthy Top-Enders’ study, which again addresses a specific knowledge gap
surrounding the relationship of markers of inflammation and dyslipidaemia with
central obesity in Aboriginal adults.
The use of a single abdominal CT slice as opposed to assessment of two inter-
vertebral levels to describe visceral fat area has been described in different
populations. In particular, Greenfield et al. (Greenfield et al. 2002) reported visceral
fat area was more accurately described by measurement of two levels where feasible.
The computed tomography protocol in the Healthy Top-Enders’ study involved
measuring two inter-vertebral sites in the abdomen, as recommended by Greenfield
et al. (Greenfield et al. 2002), who was also an investigator in this study, and whose
laboratory provided expertise in the protocol and analysis of abdominal fat
partitioning.
The eGFR Study
A large population of Aboriginal people and Torres Strait Islander people were
recruited over diverse settings (urban, regional and remote areas) in order to assess
the accuracy of the estimated measures of glomerular filtration rate. This included
an assessment of body composition and markers of health and chronic disease. We
do not report on the reference measure of kidney function in the thesis since that
234
investigation was beyond the scope of the research aim of this study. However the
eGFR Study cohort were an ideal group to assess the relationship of body
composition with indicators of health, as described below.
First, recruitment across urban regional and remote settings reflects the diversity of
lifestyles of Aboriginal peoples and Torres Strait Islander peoples. Second, since the
study was designed to assess the accuracy of measures of eGFR, recruitment was
targeted to regions in Northern, Central and Western Australia which have the
highest incidence rates of Aboriginal people and Torres Strait Islander people who
require treatment for end stage kidney disease (Cass et al. 2001). Third, whilst
albuminuria has been frequently described in screening studies of Aboriginal people
and Torres Strait Islander people, the assessment of both low eGFR and albuminuria
has not been performed across such a large region, even though morbidity due to
CKD and ESKD has become more frequent over the last 15-20 years (McDonald
2010).
The eGFR Study incorporated a detailed body composition sub-study, performed at
study sites where whole body DXA was available. Whole body DXA was used to
describe total and regional lean mass and adiposity in Darwin in the Northern
Territory to best capture data in a predominantly Aboriginal population, and in
Thursday Island to best capture data for a Torres Strait Islander population. There
was no facility to measure body composition with DXA in Cairns, the nearest large
regional centre to Thursday Island in far North Queensland. We therefore sought the
availability of a transportable whole body DXA device to use in Thursday Island.
Through the use of whole body DXA, unique differences in body build and
composition have been described for the first time among Torres Strait Islander
people compared to Caucasian and Aboriginal adults. Specifically, whole body
DXA among Torres Strait Islander people has allowed validation of sensitive
measures of body composition against bioelectrical impedance; an examination of
the relationships of body mass index and lean mass with skeletal proportions; and a
comparison of total and regional fat distribution among Aboriginal people and Torres
Strait Islander people.
235
The study hypothesis considered the role of ethnicity in the relationship of body
build among Aboriginal adults and Torres Strait Islander adults. A combination of
self-reported ethnicity and grandparent ethnicity was used to differentiate these
groups. By recruiting and clearly identifying their separate identity, we have shown
differences in body composition between Aboriginal and Torres Strait Islander
people.
The detailed and precise measures of body composition examined in the Healthy
Top-Enders’ study established a foundation to examine the relationship of body mass
index and waist to hip ratio with adipocyte-related cytokines including adiponectin
and leptin in adult Aboriginal people and adult Torres Strait Islander people in The
eGFR Study. The thesis specifically recruited a healthy control group (Healthy Top-
Enders’ study) to provide a perspective for adults with chronic disease, where health
was specifically demonstrated by the absence of both visceral obesity and
albuminuria. The eGFR Study has demonstrated through detailed and precise body
composition measures, a population of Aboriginal people and Torres Strait Islander
people who had both albuminuria and central obesity, and were also more likely to
have other markers of chronic disease risk.
Differences in the expression of adipokines among Aboriginal people and Torres
Strait Islander people, and across the stratified health categories has supported the
findings of laboratory, human and animal-based studies that link visceral obesity
with early and sustained kidney damage. There was no prior knowledge of the
applicability of adiponectin and leptin concentrations in adult Aboriginal people and
Torres Strait Islander people, therefore a complete adipokine profile in each
participant was not performed. Samples which could be used to assess the adipokine
profile (including high molecular weight adiponectin in serum, and a urinary
adiponectin profile) are stored, and analysis is planned (subject to funding).
236
7.6. Future Studies
Numerous persisting knowledge gaps are identified through this detailed study of
body composition, inflammation and chronic disease risk in Aboriginal people and
Torres Strait Islander people. Potential research questions to some of these issues are
outlined below.
The use of a 2-hour 75 gram oral glucose tolerance test and the measurement of
fasting and 2-hour glucose and insulin in future studies of body composition and
health risk in Aboriginal people and Torres Strait Islander people. This would
provide a more robust evaluation of insulin sensitivity profile in individuals. It was
not possible to incorporate this test into an already detailed thesis methodology.
Glucose clamp methodology is not a realistic option for this population. Assessment
of insulin sensitivity could also be achieved in a small study comparing a single
serum adipokine measure (adiponectin, or high molecular weight isoform) with a
frequently measured glucose tolerance test in Aboriginal adults and Torres Strait
Islander adults, providing a useful clinical reference of insulin sensitivity in future
studies.
Extending body composition and health risk studies to the potential renal
transplant recipient. Transplantation offers numerous health advantages (over
maintenance dialysis therapy), however access to transplantation and outcomes are
poor for Indigenous Australians, compared to other Australians (McDonald 2010;
Rogers et al. 2006). Currently a BMI more than 30 kg/m2 precludes transplant
assessment in our area (Darwin, NT) due to anaesthetic and acute surgical risk. We
suggest a BMI threshold of 30 kg/m2 is excessive in Aboriginal patients and does not
present sufficient cardio-metabolic risk protection in the pre or post-transplant
setting. A more appropriate cut-off may be the waist to hip ratio, with maximal
threshold of 0.9 and 0.85 in Indigenous men and women respectively. Further study
would be required to ascertain the long-term safety of these targets in Indigenous
adults with severe renal disease.
Extending body composition and health risk studies to the dialysis patient. A
paradox of low-BMI and higher cardiovascular risk is reported in Caucasian adults
237
requiring dialysis (Johansen 2010). We have shown a higher WHR for BMI in
Aboriginal people was associated with an unfavourable cardio-metabolic profile,
therefore, this reported paradox may not be accurate for Aboriginal people.
Assessment of outcomes of diabetes complications and cardiovascular disease risk in
relation to WHR may identify a healthy optimal level of adiposity in Indigenous
Australians who require dialysis.
Body surface area (BSA). Body surface area is a function of measured weight and
height in an individual. The normalisation of kidney function based on the 1.73 m2
body surface area used in the reporting of estimated-GFR (Levey et al. 1999), was
based on a theoretical mathematical model of surface area in 9 adults conducted in
1916 (Du Bois et al. 1916). The bias of normalised BSA for Indigenous Australians
may result from different geometry of body build to the original sample compared
with the present day, where higher prevalence of obesity is more likely to result in
lower relative BSA. The use of whole body DXA (fat and lean mass and skeletal
dimensions), in combination with body weight and body circumferences may provide
the evidence for the relationship of weight to lean mass, and therefore lean mass to
BSA. This may improve creatinine-based measures of body composition, rather than
assuming the relationship of a given serum creatinine for lean body mass is similar
for all populations.
7.7. Conclusion
The convenience of labelling Aboriginal people and Torres Strait Islander people as
“Indigenous Australians” should now be considered inaccurate in reference to body
size and obesity, since they each have very specific body composition characteristics.
This is the first study to apply precise and accurate measures of body composition to
these high risk populations. Several important insights have emerged. First, despite
both groups having a longer leg-length and shorter torso than Caucasians, Torres
Strait Islander participants have a more robust skeleton and relatively more muscle
mass for a given height and weight than Aboriginal participants. Second, the high
relative lean mass is likely to protect Torres Strait Islander people to some extent
from the adverse impacts of weight gain in comparison to Aboriginal people. Third,
238
Aboriginal participants (particularly women) appeared to have a more adverse
metabolic response to even modest weight gain, with very little capacity to store
excess lipid in peripheral subcutaneous fat depots (in contrast to Caucasian and
Torres Strait Islander participants). Therefore, Aboriginal participants demonstrate a
strong tendency to deposit fat intra-abdominally without substantial change in body
mass index, in contrast to other ethnic groups. Finally, among Aboriginal
participants and Torres Strait Islander participants the pattern of high leptin and low
adiponectin concentrations was closely related to a combination of high total and
abdominal obesity, and as discussed (in Chapter 6) has the potential to lay a
foundation for the establishment of kidney damage, and associated cardiovascular
disease risk.
Appendix
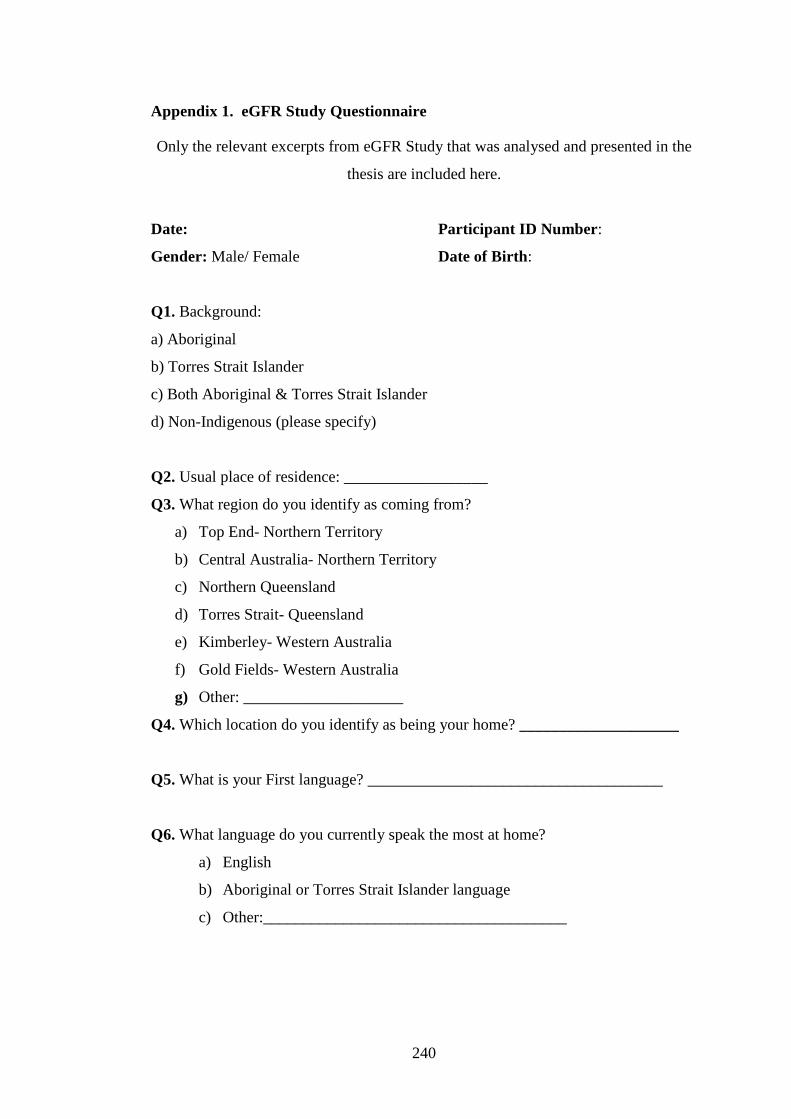
240
Appendix 1. eGFR Study Questionnaire
Only the relevant excerpts from eGFR Study that was analysed and presented in the
thesis are included here.
Date: Participant ID Number :
Gender: Male/ Female Date of Birth:
Q1. Background:
a) Aboriginal
b) Torres Strait Islander
c) Both Aboriginal & Torres Strait Islander
d) Non-Indigenous (please specify)
Q2. Usual place of residence: __________________
Q3. What region do you identify as coming from?
a) Top End- Northern Territory
b) Central Australia- Northern Territory
c) Northern Queensland
d) Torres Strait- Queensland
e) Kimberley- Western Australia
f) Gold Fields- Western Australia
g) Other: ____________________
Q4. Which location do you identify as being your home? ____________________
Q5. What is your First language? _____________________________________
Q6. What language do you currently speak the most at home?
a) English
b) Aboriginal or Torres Strait Islander language
c) Other:______________________________________
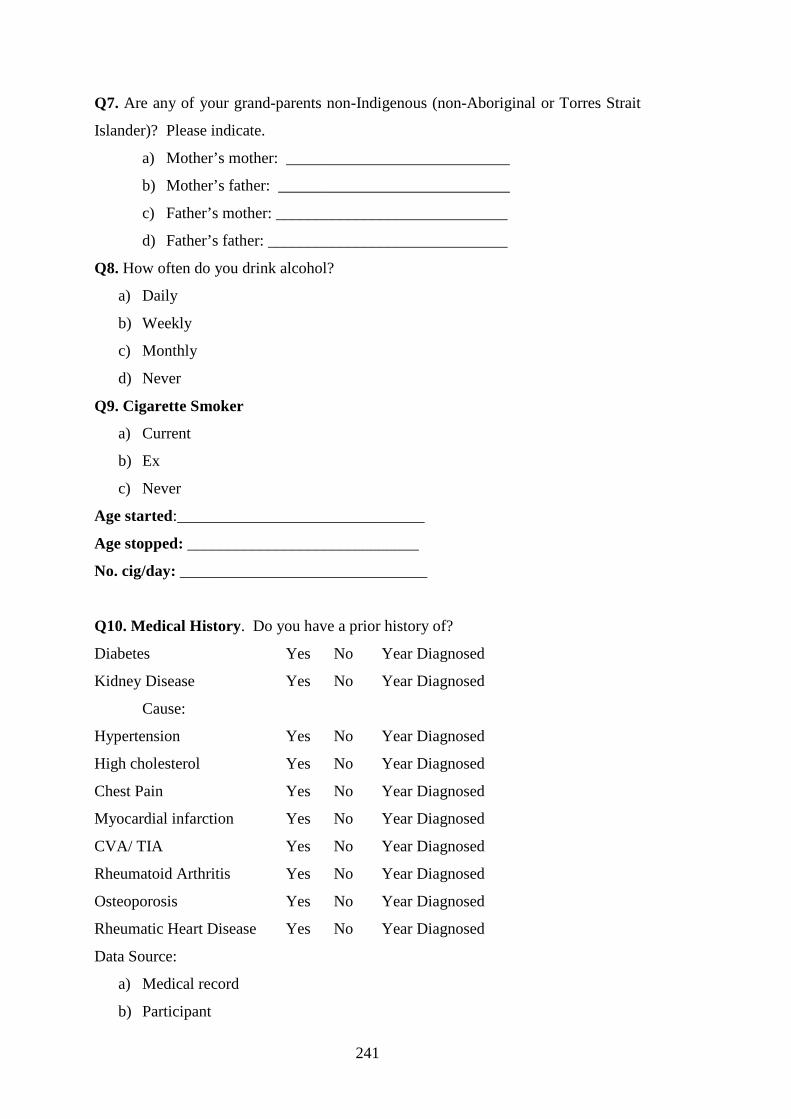
241
Q7. Are any of your grand-parents non-Indigenous (non-Aboriginal or Torres Strait
Islander)? Please indicate.
a) Mother’s mother: ____________________________
b) Mother’s father: _____________________________
c) Father’s mother: _____________________________
d) Father’s father: ______________________________
Q8. How often do you drink alcohol?
a) Daily
b) Weekly
c) Monthly
d) Never
Q9. Cigarette Smoker
a) Current
b) Ex
c) Never
Age started:_______________________________
Age stopped: _____________________________
No. cig/day: _______________________________
Q10. Medical History . Do you have a prior history of?
Diabetes Yes No Year Diagnosed
Kidney Disease Yes No Year Diagnosed
Cause:
Hypertension Yes No Year Diagnosed
High cholesterol Yes No Year Diagnosed
Chest Pain Yes No Year Diagnosed
Myocardial infarction Yes No Year Diagnosed
CVA/ TIA Yes No Year Diagnosed
Rheumatoid Arthritis Yes No Year Diagnosed
Osteoporosis Yes No Year Diagnosed
Rheumatic Heart Disease Yes No Year Diagnosed
Data Source:
a) Medical record
b) Participant
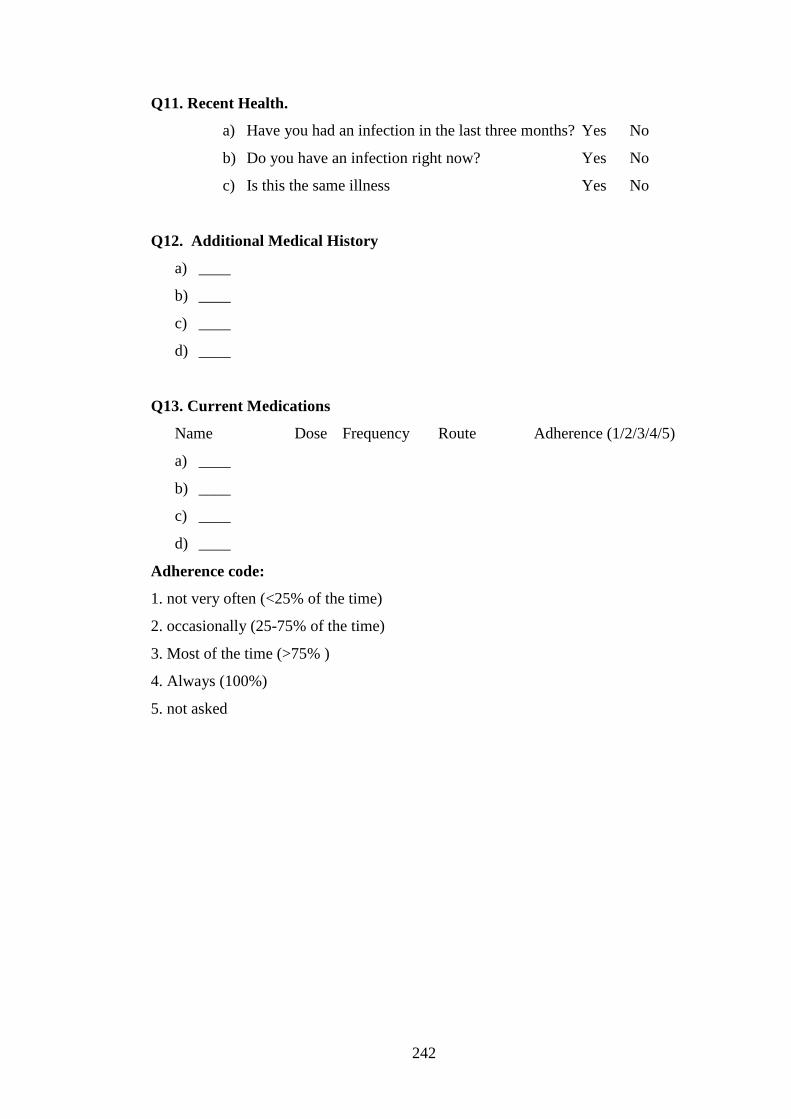
242
Q11. Recent Health.
a) Have you had an infection in the last three months? Yes No
b) Do you have an infection right now? Yes No
c) Is this the same illness Yes No
Q12. Additional Medical History
a) ____
b) ____
c) ____
d) ____
Q13. Current Medications
Name Dose Frequency Route Adherence (1/2/3/4/5)
a) ____
b) ____
c) ____
d) ____
Adherence code:
1. not very often (<25% of the time)
2. occasionally (25-75% of the time)
3. Most of the time (>75% )
4. Always (100%)
5. not asked
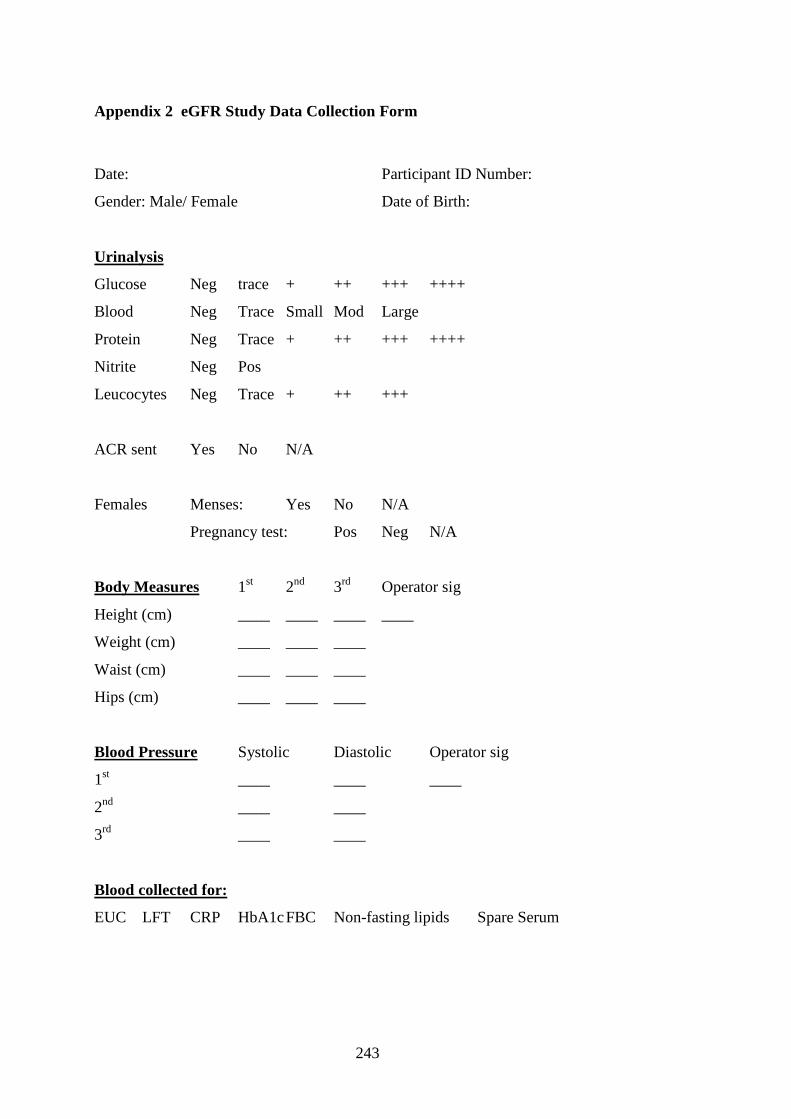
243
Appendix 2 eGFR Study Data Collection Form
Date: Participant ID Number:
Gender: Male/ Female Date of Birth:
Urinalysis
Glucose Neg trace + ++ +++ ++++
Blood Neg Trace Small Mod Large
Protein Neg Trace + ++ +++ ++++
Nitrite Neg Pos
Leucocytes Neg Trace + ++ +++
ACR sent Yes No N/A
Females Menses: Yes No N/A
Pregnancy test: Pos Neg N/A
Body Measures 1st 2nd 3rd Operator sig
Height (cm) ____ ____ ____ ____
Weight (cm) ____ ____ ____
Waist (cm) ____ ____ ____
Hips (cm) ____ ____ ____
Blood Pressure Systolic Diastolic Operator sig
1st ____ ____ ____
2nd ____ ____
3rd ____ ____
Blood collected for:
EUC LFT CRP HbA1c FBC Non-fasting lipids Spare Serum
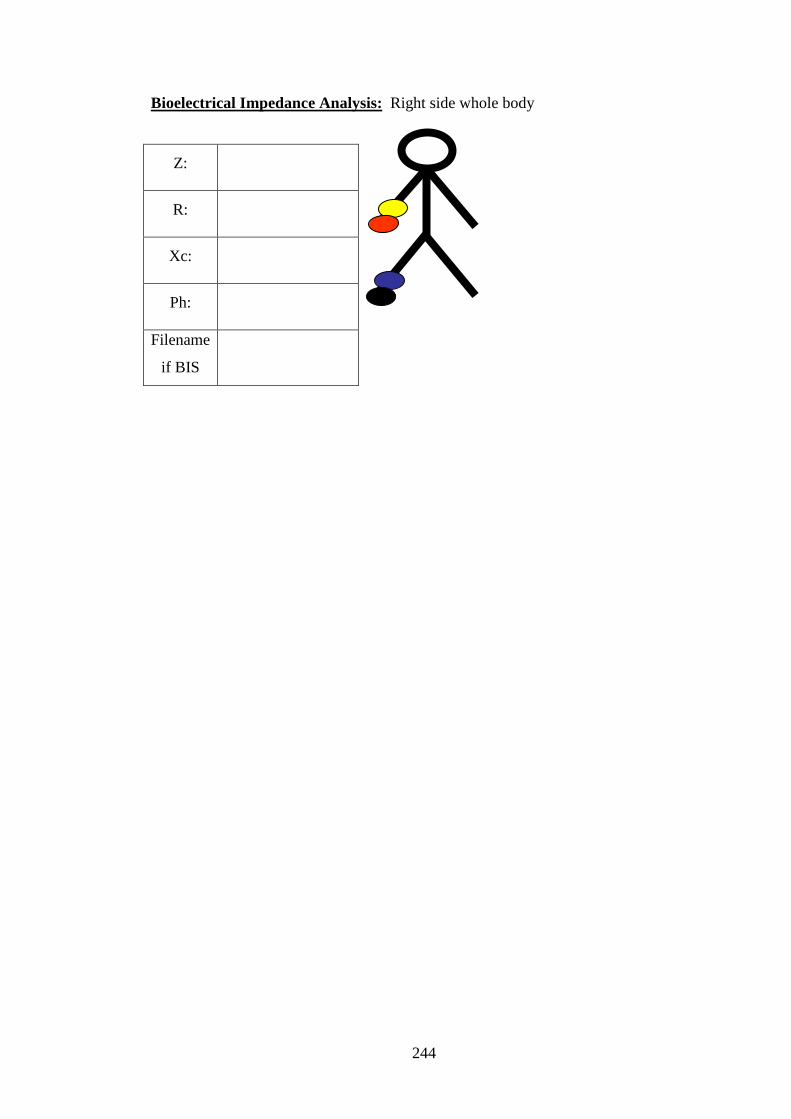
244
Bioelectrical Impedance Analysis: Right side whole body
Z:
R:
Xc:
Ph:
Filename
if BIS

245
Appendix 3 Healthy Top-Enders’ Study Questionairre
Only the relevant excerpts from The Healthy Top-Enders’ study that was analysed
and presented in the thesis are included here.
Date: Participant ID Number :
Gender: Male/ Female Date of Birth:
Q1. How do you describe your background?
a) Aboriginal but not Torres Strait Islander
b) Torres Strait Islander but not Aboriginal
c) Both Aboriginal & Torres Strait Islander
d) Neither Aboriginal or Torres Strait Islander
Q2. We are assessing “Top-Ender’s”, but we know people move around a lot. What
region of Australia do you most strongly identify with?
h) Top End- Northern Territory
i) Other: ____________________
Q3. Usual place of residence: __________________
Q4. Some people move for work (for example), but they call “home” somewhere
else. What location do you call home? ____________________
Q5. What was the first language you spoke when you were growing up?
__________
Q6. What language do you speak at home the most now?
d) English
e) Aboriginal or Torres Strait Islander language
f) Other:______________________________________
Q7. The ethnic background of our family influences what body shape we develop.
What is the background of each of your grandparents?
e) Mother’s mother: ____________________________
f) Mother’s father: _____________________________
g) Father’s mother: _____________________________
h) Father’s father: ______________________________
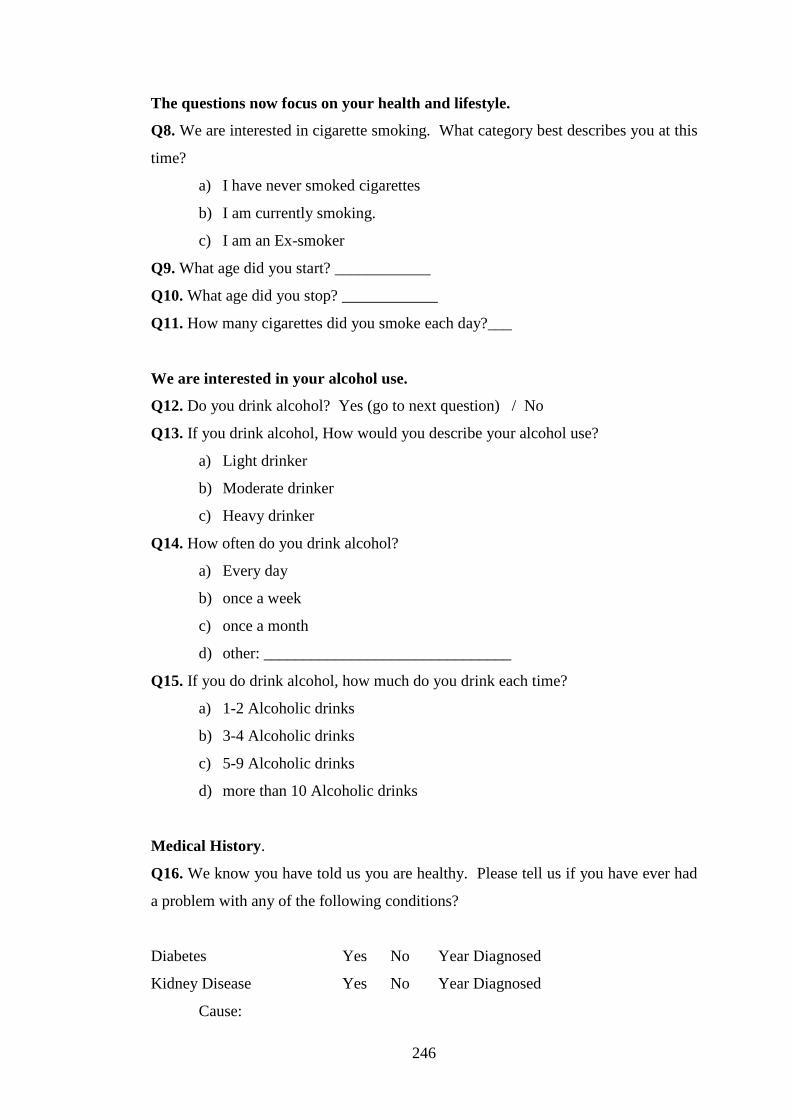
246
The questions now focus on your health and lifestyle.
Q8. We are interested in cigarette smoking. What category best describes you at this
time?
a) I have never smoked cigarettes
b) I am currently smoking.
c) I am an Ex-smoker
Q9. What age did you start? ____________
Q10. What age did you stop? ____________
Q11. How many cigarettes did you smoke each day?___
We are interested in your alcohol use.
Q12. Do you drink alcohol? Yes (go to next question) / No
Q13. If you drink alcohol, How would you describe your alcohol use?
a) Light drinker
b) Moderate drinker
c) Heavy drinker
Q14. How often do you drink alcohol?
a) Every day
b) once a week
c) once a month
d) other: _______________________________
Q15. If you do drink alcohol, how much do you drink each time?
a) 1-2 Alcoholic drinks
b) 3-4 Alcoholic drinks
c) 5-9 Alcoholic drinks
d) more than 10 Alcoholic drinks
Medical History .
Q16. We know you have told us you are healthy. Please tell us if you have ever had
a problem with any of the following conditions?
Diabetes Yes No Year Diagnosed
Kidney Disease Yes No Year Diagnosed
Cause:
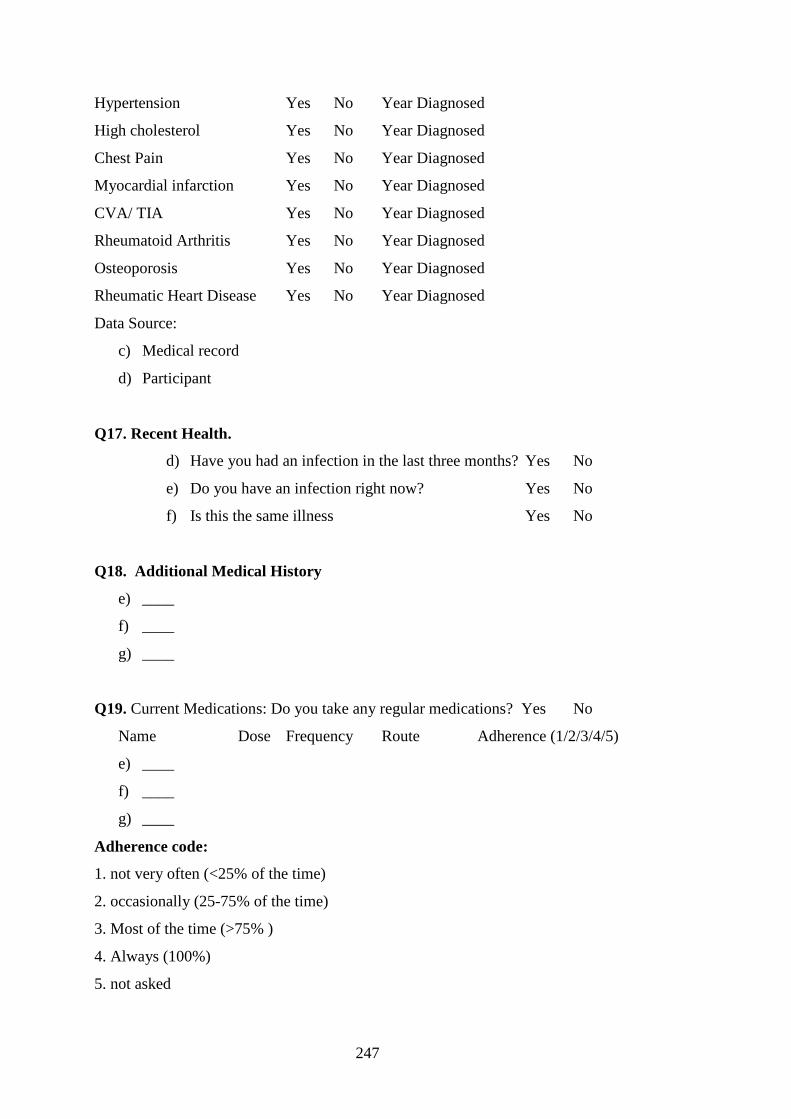
247
Hypertension Yes No Year Diagnosed
High cholesterol Yes No Year Diagnosed
Chest Pain Yes No Year Diagnosed
Myocardial infarction Yes No Year Diagnosed
CVA/ TIA Yes No Year Diagnosed
Rheumatoid Arthritis Yes No Year Diagnosed
Osteoporosis Yes No Year Diagnosed
Rheumatic Heart Disease Yes No Year Diagnosed
Data Source:
c) Medical record
d) Participant
Q17. Recent Health.
d) Have you had an infection in the last three months? Yes No
e) Do you have an infection right now? Yes No
f) Is this the same illness Yes No
Q18. Additional Medical History
e) ____
f) ____
g) ____
Q19. Current Medications: Do you take any regular medications? Yes No
Name Dose Frequency Route Adherence (1/2/3/4/5)
e) ____
f) ____
g) ____
Adherence code:
1. not very often (<25% of the time)
2. occasionally (25-75% of the time)
3. Most of the time (>75% )
4. Always (100%)
5. not asked
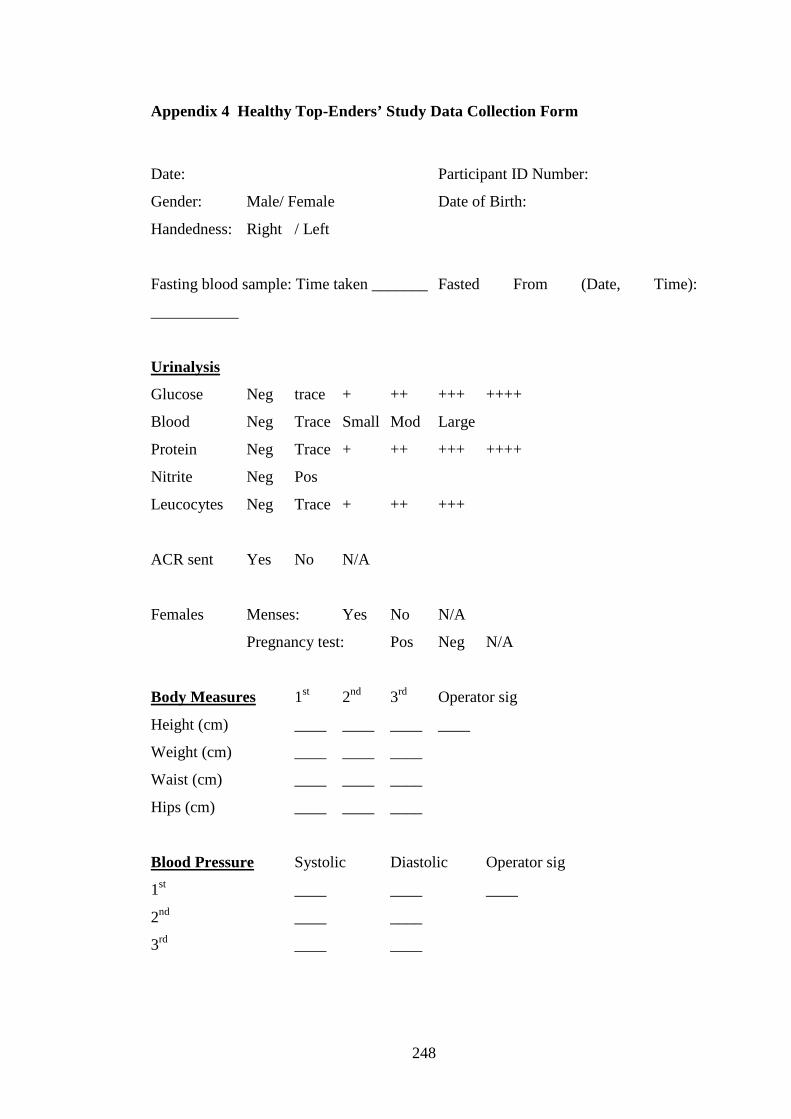
248
Appendix 4 Healthy Top-Enders’ Study Data Collection Form
Date: Participant ID Number:
Gender: Male/ Female Date of Birth:
Handedness: Right / Left
Fasting blood sample: Time taken _______ Fasted From (Date, Time):
___________
Urinalysis
Glucose Neg trace + ++ +++ ++++
Blood Neg Trace Small Mod Large
Protein Neg Trace + ++ +++ ++++
Nitrite Neg Pos
Leucocytes Neg Trace + ++ +++
ACR sent Yes No N/A
Females Menses: Yes No N/A
Pregnancy test: Pos Neg N/A
Body Measures 1st 2nd 3rd Operator sig
Height (cm) ____ ____ ____ ____
Weight (cm) ____ ____ ____
Waist (cm) ____ ____ ____
Hips (cm) ____ ____ ____
Blood Pressure Systolic Diastolic Operator sig
1st ____ ____ ____
2nd ____ ____
3rd ____ ____
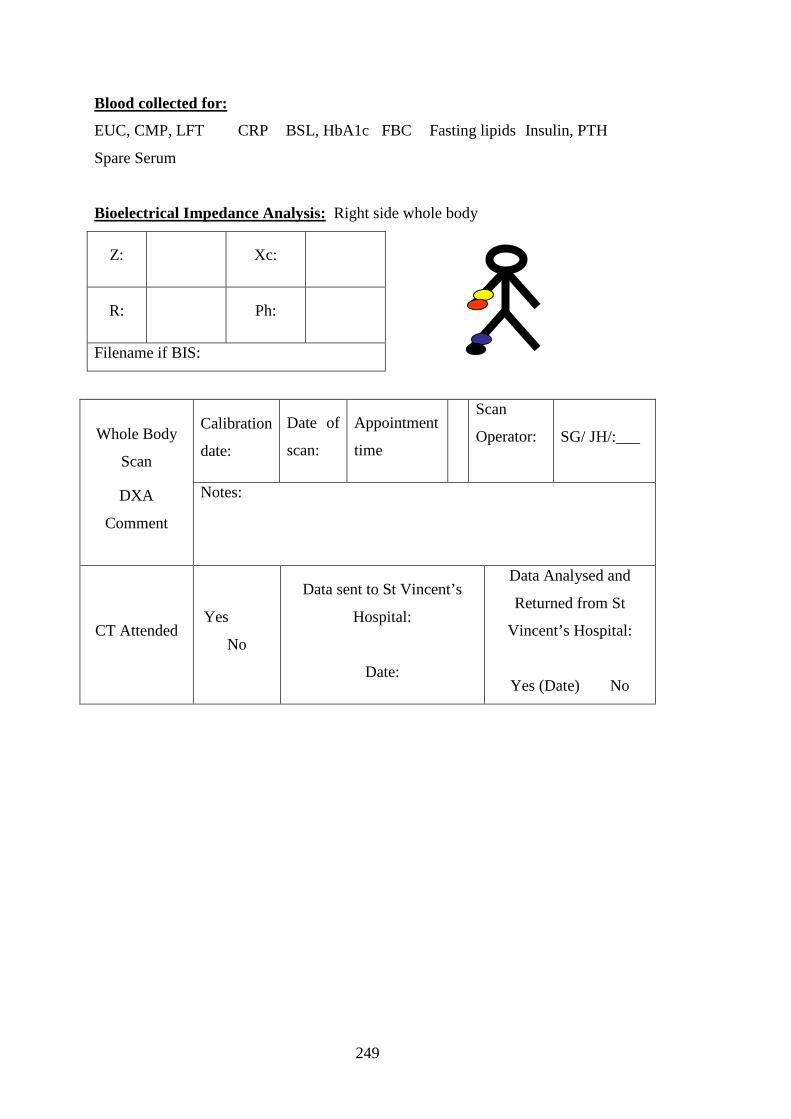
249
Blood collected for:
EUC, CMP, LFT CRP BSL, HbA1c FBC Fasting lipids Insulin, PTH
Spare Serum
Bioelectrical Impedance Analysis: Right side whole body
Z:
Xc:
R:
Ph:
Filename if BIS:
Calibration
date:
Date of
scan:
Appointment
time
Scan
Operator:
SG/ JH/:___ Whole Body
Scan
DXA
Comment
Notes:
CT Attended Yes
No
Data sent to St Vincent’s
Hospital:
Date:
Data Analysed and
Returned from St
Vincent’s Hospital:
Yes (Date) No
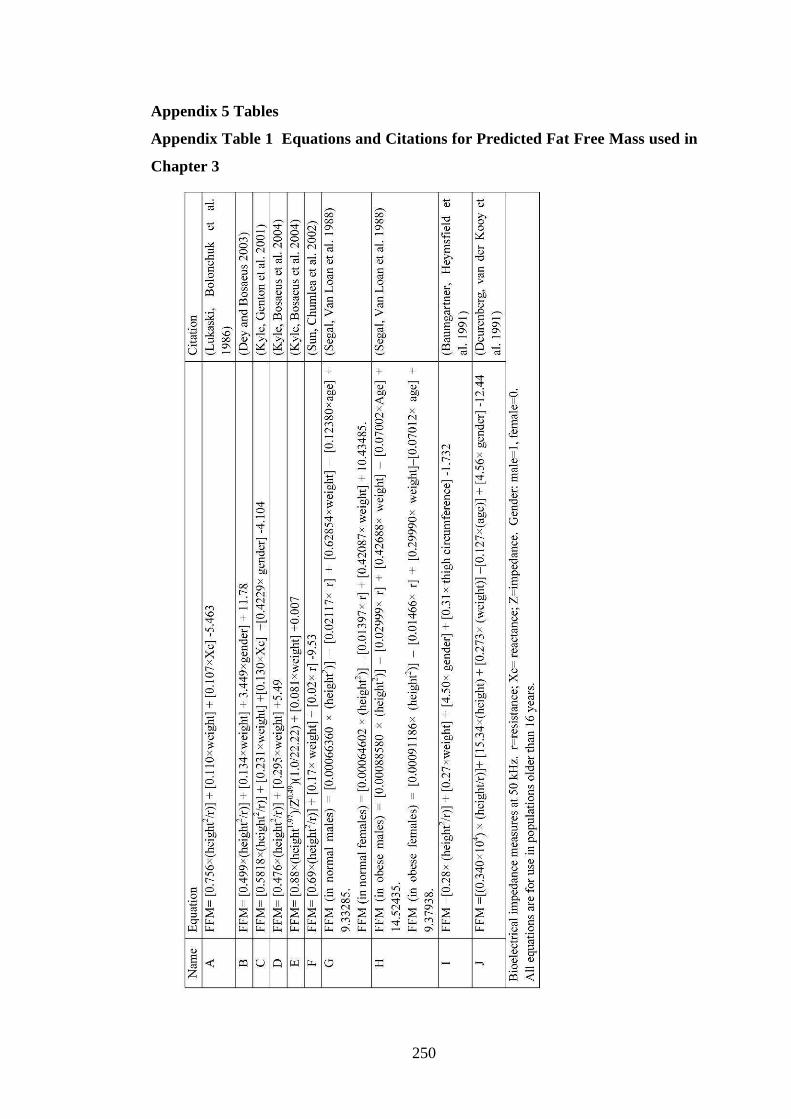
250
Appendix 5 Tables
Appendix Table 1 Equations and Citations for Predicted Fat Free Mass used in
Chapter 3
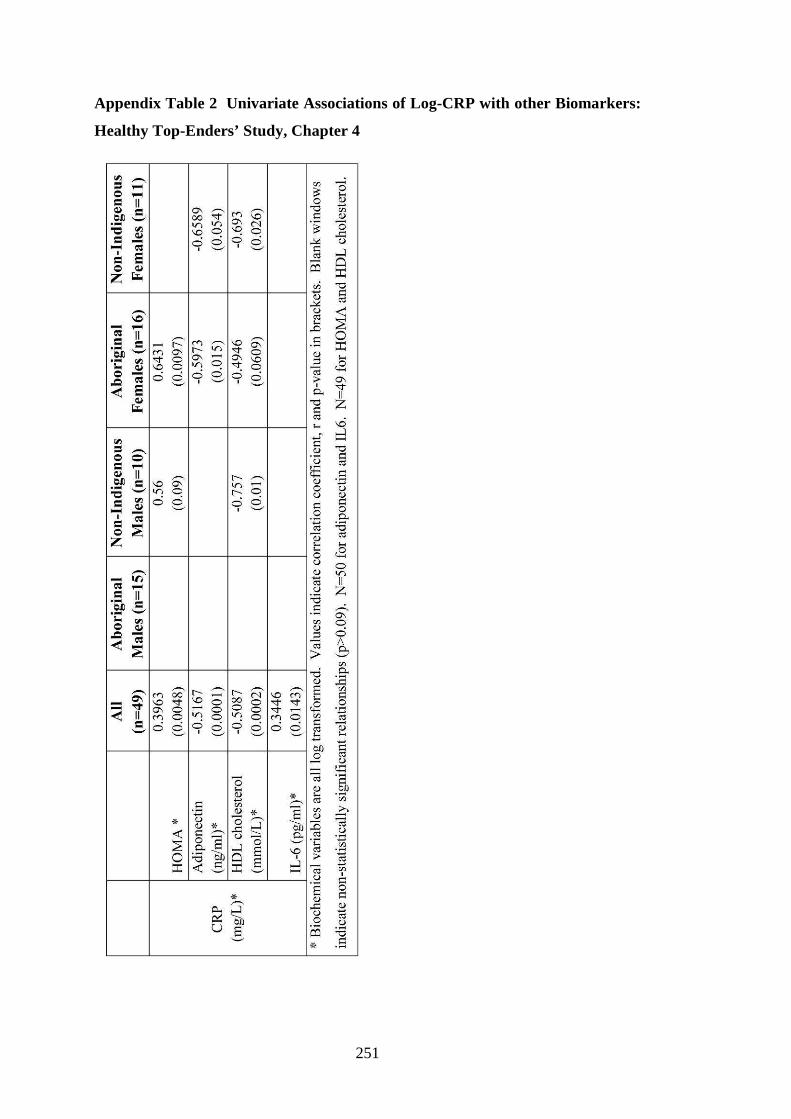
251
Appendix Table 2 Univariate Associations of Log-CRP with other Biomarkers:
Healthy Top-Enders’ Study, Chapter 4
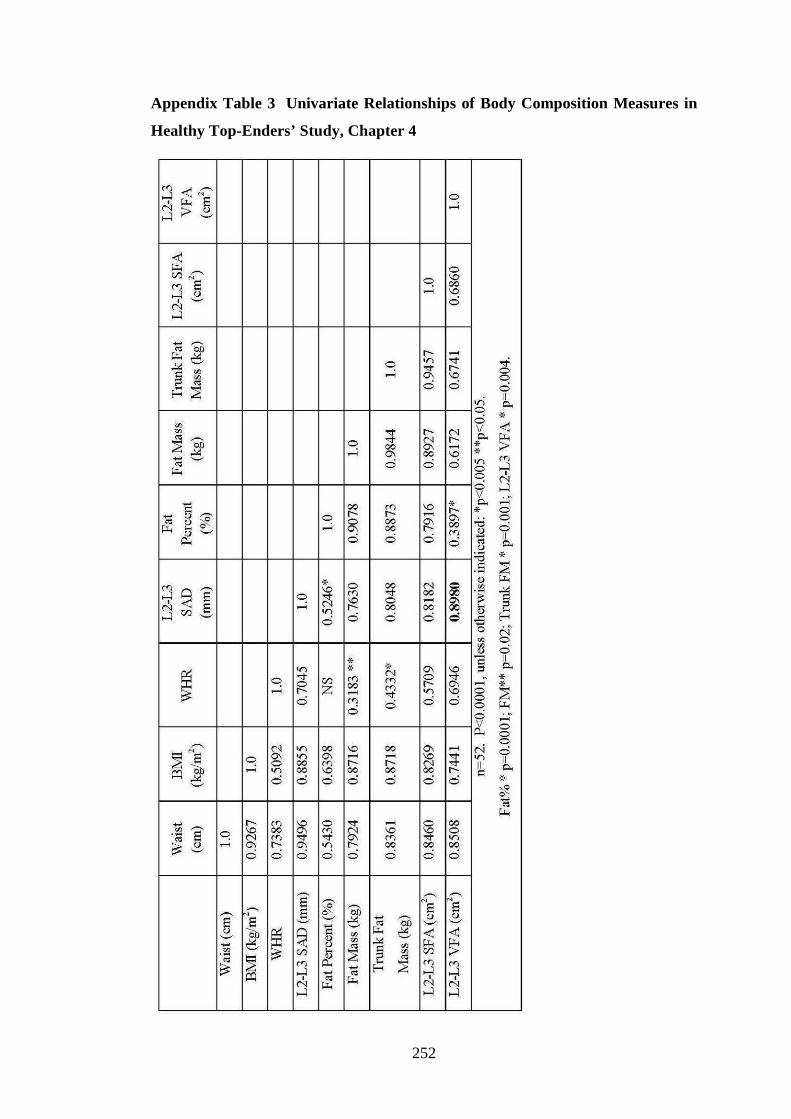
252
Appendix Table 3 Univariate Relationships of Body Composition Measures in
Healthy Top-Enders’ Study, Chapter 4
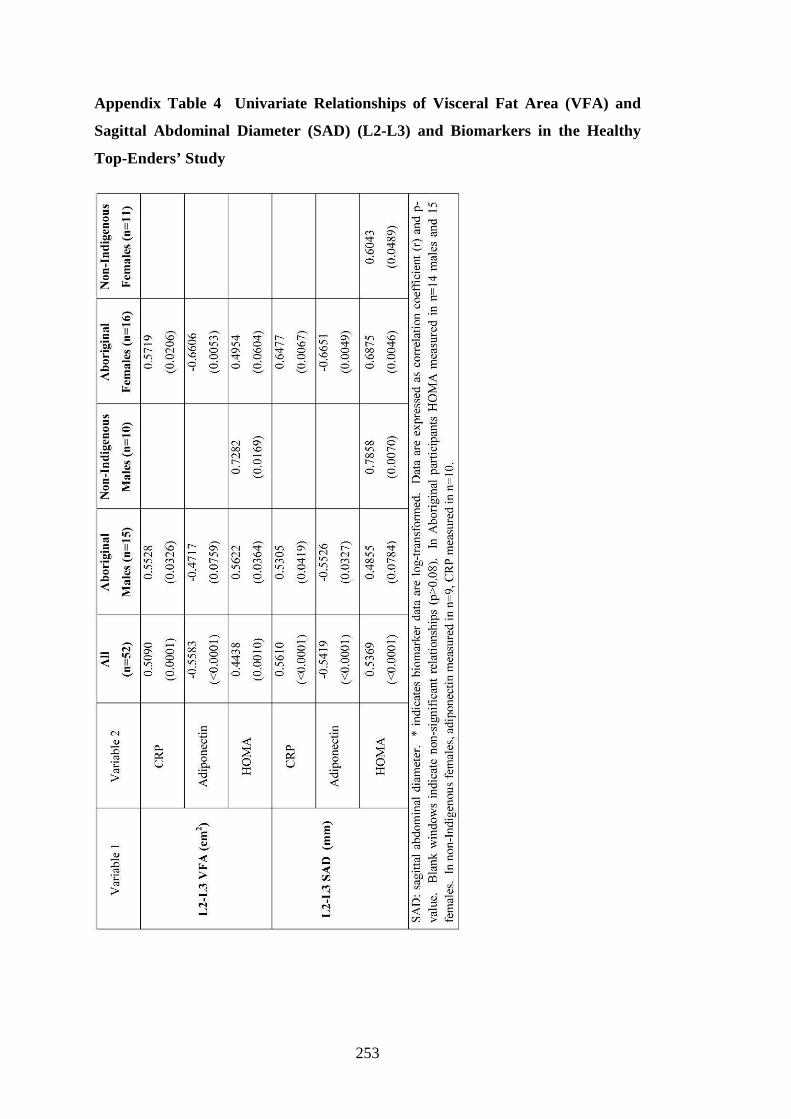
253
Appendix Table 4 Univariate Relationships of Visceral Fat Area (VFA) and
Sagittal Abdominal Diameter (SAD) (L2-L3) and Biomarkers in the Healthy
Top-Enders’ Study
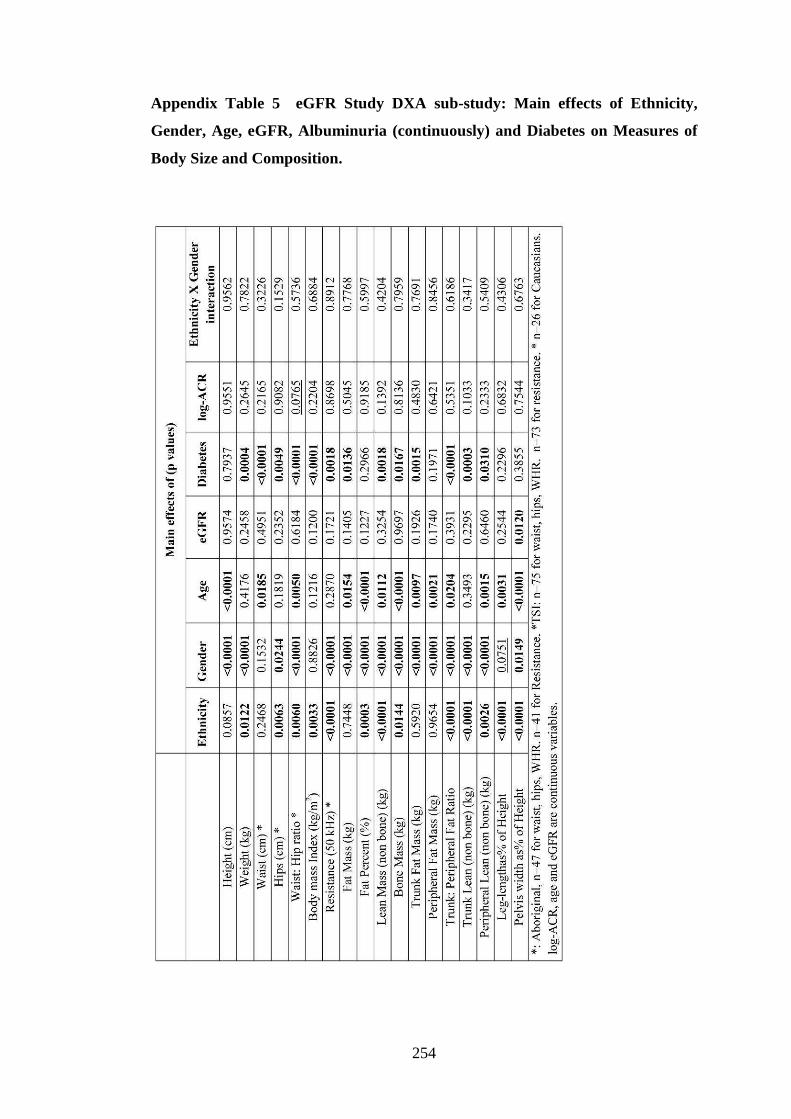
254
Appendix Table 5 eGFR Study DXA sub-study: Main effects of Ethnicity,
Gender, Age, eGFR, Albuminuria (continuously) and Diabetes on Measures of
Body Size and Composition.
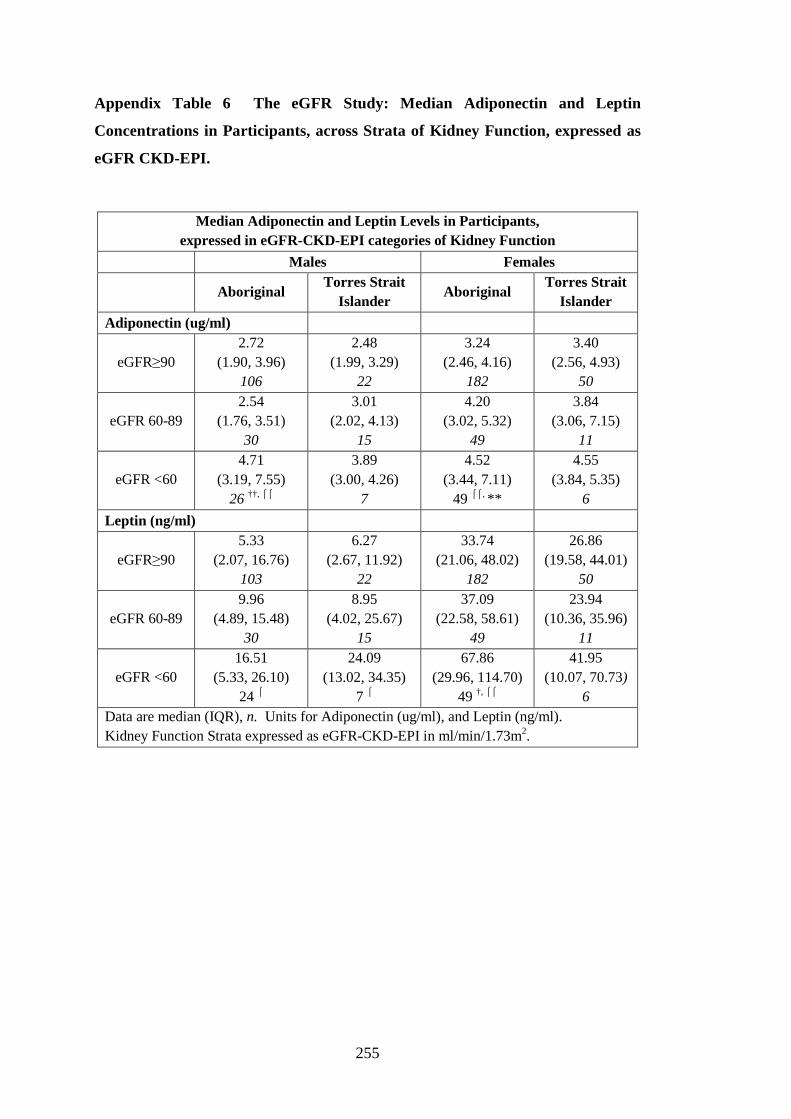
255
Appendix Table 6 The eGFR Study: Median Adiponectin and Leptin
Concentrations in Participants, across Strata of Kidney Function, expressed as
eGFR CKD-EPI.
Median Adiponectin and Leptin Levels in Participants, expressed in eGFR-CKD-EPI categories of Kidney Function
Males Females
Aboriginal
Torres Strait Islander
Aboriginal Torres Strait
Islander
Adiponectin (ug/ml)
eGFR≥90 2.72
(1.90, 3.96) 106
2.48 (1.99, 3.29)
22
3.24 (2.46, 4.16)
182
3.40 (2.56, 4.93)
50
eGFR 60-89 2.54
(1.76, 3.51) 30
3.01 (2.02, 4.13)
15
4.20 (3.02, 5.32)
49
3.84 (3.06, 7.15)
11
eGFR <60 4.71
(3.19, 7.55) 26 ††, ⌠⌠
3.89 (3.00, 4.26)
7
4.52 (3.44, 7.11)
49 ⌠⌠, **
4.55 (3.84, 5.35)
6
Leptin (ng/ml)
eGFR≥90 5.33
(2.07, 16.76) 103
6.27 (2.67, 11.92)
22
33.74 (21.06, 48.02)
182
26.86 (19.58, 44.01)
50
eGFR 60-89 9.96
(4.89, 15.48) 30
8.95 (4.02, 25.67)
15
37.09 (22.58, 58.61)
49
23.94 (10.36, 35.96)
11
eGFR <60 16.51
(5.33, 26.10) 24 ⌠
24.09 (13.02, 34.35)
7 ⌠
67.86 (29.96, 114.70)
49 †, ⌠⌠
41.95 (10.07, 70.73)
6 Data are median (IQR), n. Units for Adiponectin (ug/ml), and Leptin (ng/ml). Kidney Function Strata expressed as eGFR-CKD-EPI in ml/min/1.73m2.
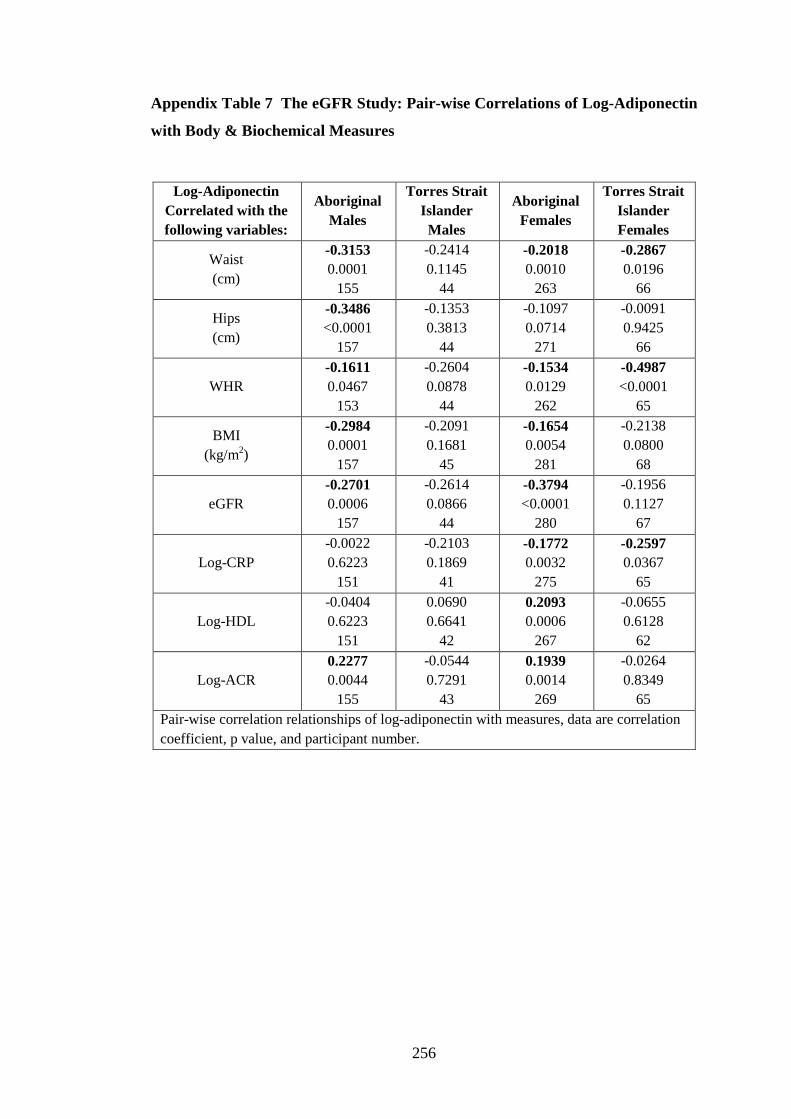
256
Appendix Table 7 The eGFR Study: Pair-wise Correlations of Log-Adiponectin
with Body & Biochemical Measures
Log-Adiponectin Correlated with the following variables:
Aboriginal Males
Torres Strait Islander Males
Aboriginal Females
Torres Strait Islander Females
Waist (cm)
-0.3153 0.0001
155
-0.2414 0.1145
44
-0.2018 0.0010
263
-0.2867 0.0196
66
Hips (cm)
-0.3486 <0.0001
157
-0.1353 0.3813
44
-0.1097 0.0714
271
-0.0091 0.9425
66
WHR -0.1611 0.0467
153
-0.2604 0.0878
44
-0.1534 0.0129
262
-0.4987 <0.0001
65
BMI (kg/m2)
-0.2984 0.0001
157
-0.2091 0.1681
45
-0.1654 0.0054
281
-0.2138 0.0800
68
eGFR -0.2701 0.0006
157
-0.2614 0.0866
44
-0.3794 <0.0001
280
-0.1956 0.1127
67
Log-CRP -0.0022 0.6223
151
-0.2103 0.1869
41
-0.1772 0.0032
275
-0.2597 0.0367
65
Log-HDL -0.0404 0.6223
151
0.0690 0.6641
42
0.2093 0.0006
267
-0.0655 0.6128
62
Log-ACR 0.2277 0.0044
155
-0.0544 0.7291
43
0.1939 0.0014
269
-0.0264 0.8349
65 Pair-wise correlation relationships of log-adiponectin with measures, data are correlation coefficient, p value, and participant number.
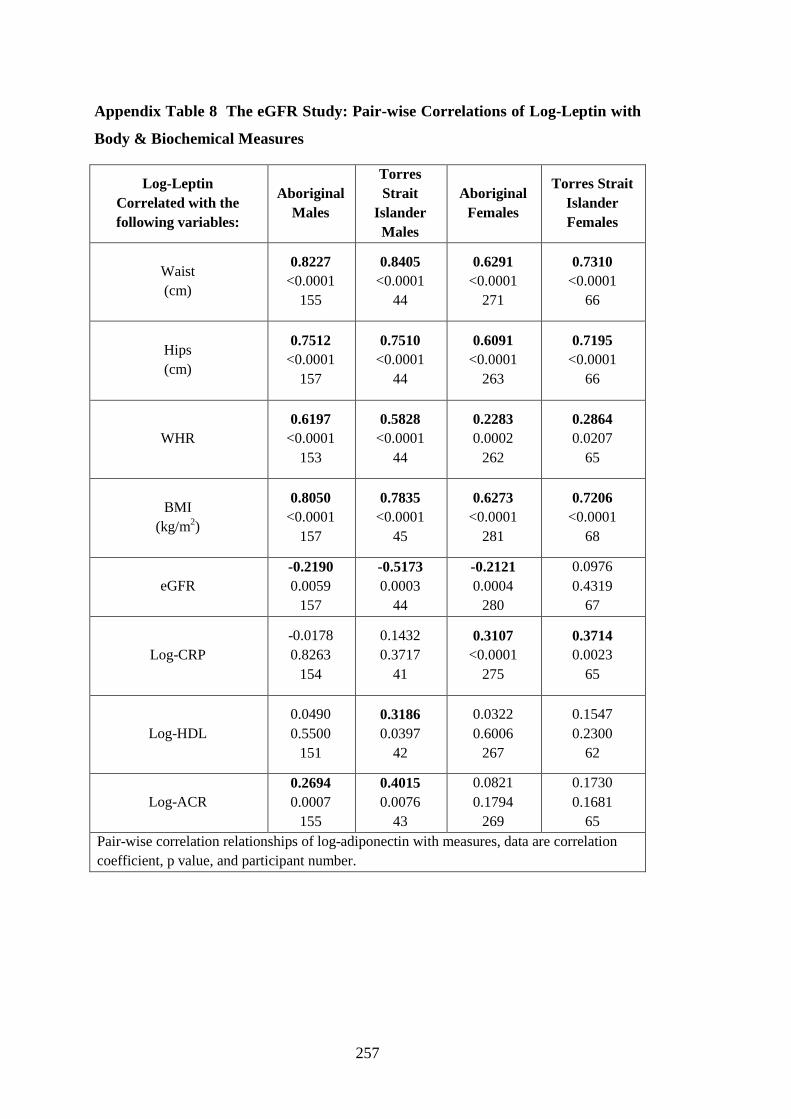
257
Appendix Table 8 The eGFR Study: Pair-wise Correlations of Log-Leptin with
Body & Biochemical Measures
Log-Leptin Correlated with the following variables:
Aboriginal Males
Torres Strait
Islander Males
Aboriginal Females
Torres Strait Islander Females
Waist (cm)
0.8227 <0.0001
155
0.8405 <0.0001
44
0.6291 <0.0001
271
0.7310 <0.0001
66
Hips (cm)
0.7512 <0.0001
157
0.7510 <0.0001
44
0.6091 <0.0001
263
0.7195 <0.0001
66
WHR 0.6197
<0.0001 153
0.5828 <0.0001
44
0.2283 0.0002
262
0.2864 0.0207
65
BMI (kg/m2)
0.8050 <0.0001
157
0.7835 <0.0001
45
0.6273 <0.0001
281
0.7206 <0.0001
68
eGFR -0.2190 0.0059
157
-0.5173 0.0003
44
-0.2121 0.0004
280
0.0976 0.4319
67
Log-CRP -0.0178 0.8263
154
0.1432 0.3717
41
0.3107 <0.0001
275
0.3714 0.0023
65
Log-HDL 0.0490 0.5500
151
0.3186 0.0397
42
0.0322 0.6006
267
0.1547 0.2300
62
Log-ACR 0.2694 0.0007
155
0.4015 0.0076
43
0.0821 0.1794
269
0.1730 0.1681
65 Pair-wise correlation relationships of log-adiponectin with measures, data are correlation coefficient, p value, and participant number.
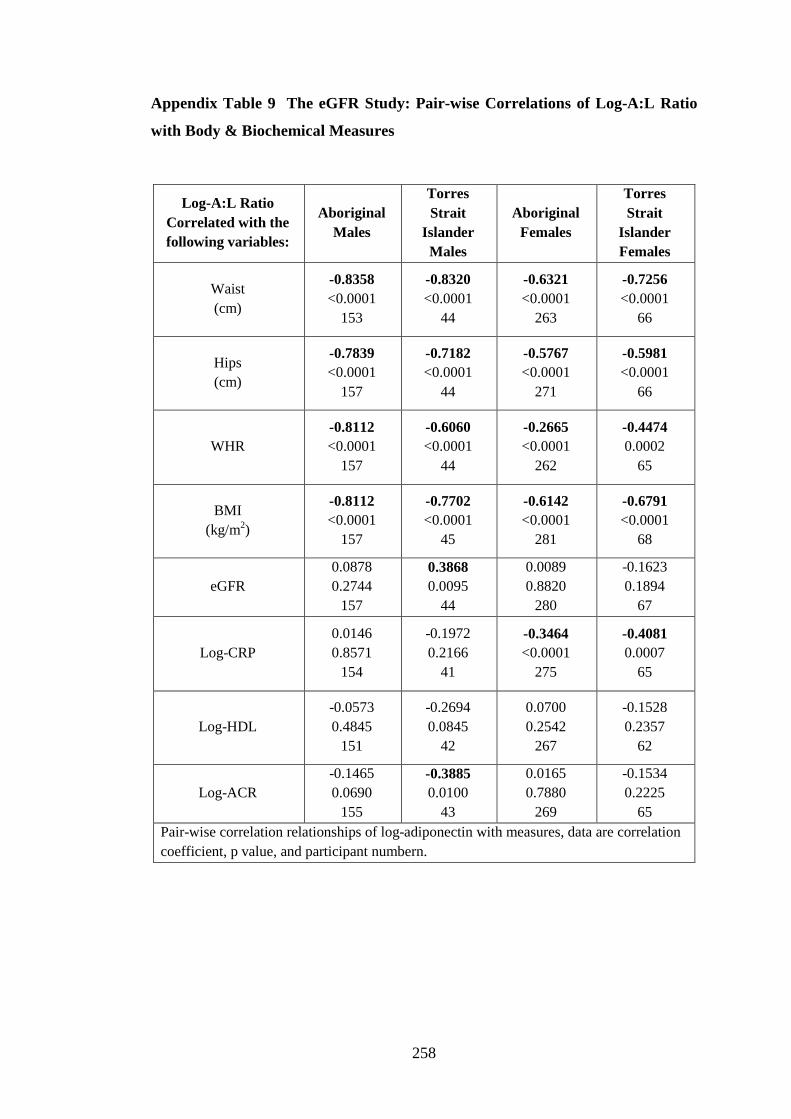
258
Appendix Table 9 The eGFR Study: Pair-wise Correlations of Log-A:L Ratio
with Body & Biochemical Measures
Log-A:L Ratio Correlated with the following variables:
Aboriginal Males
Torres Strait
Islander Males
Aboriginal Females
Torres Strait
Islander Females
Waist (cm)
-0.8358 <0.0001
153
-0.8320 <0.0001
44
-0.6321 <0.0001
263
-0.7256 <0.0001
66
Hips (cm)
-0.7839 <0.0001
157
-0.7182 <0.0001
44
-0.5767 <0.0001
271
-0.5981 <0.0001
66
WHR -0.8112 <0.0001
157
-0.6060 <0.0001
44
-0.2665 <0.0001
262
-0.4474 0.0002
65
BMI (kg/m2)
-0.8112 <0.0001
157
-0.7702 <0.0001
45
-0.6142 <0.0001
281
-0.6791 <0.0001
68
eGFR 0.0878 0.2744
157
0.3868 0.0095
44
0.0089 0.8820
280
-0.1623 0.1894
67
Log-CRP 0.0146 0.8571
154
-0.1972 0.2166
41
-0.3464 <0.0001
275
-0.4081 0.0007
65
Log-HDL -0.0573 0.4845
151
-0.2694 0.0845
42
0.0700 0.2542
267
-0.1528 0.2357
62
Log-ACR -0.1465 0.0690
155
-0.3885 0.0100
43
0.0165 0.7880
269
-0.1534 0.2225
65 Pair-wise correlation relationships of log-adiponectin with measures, data are correlation coefficient, p value, and participant numbern.
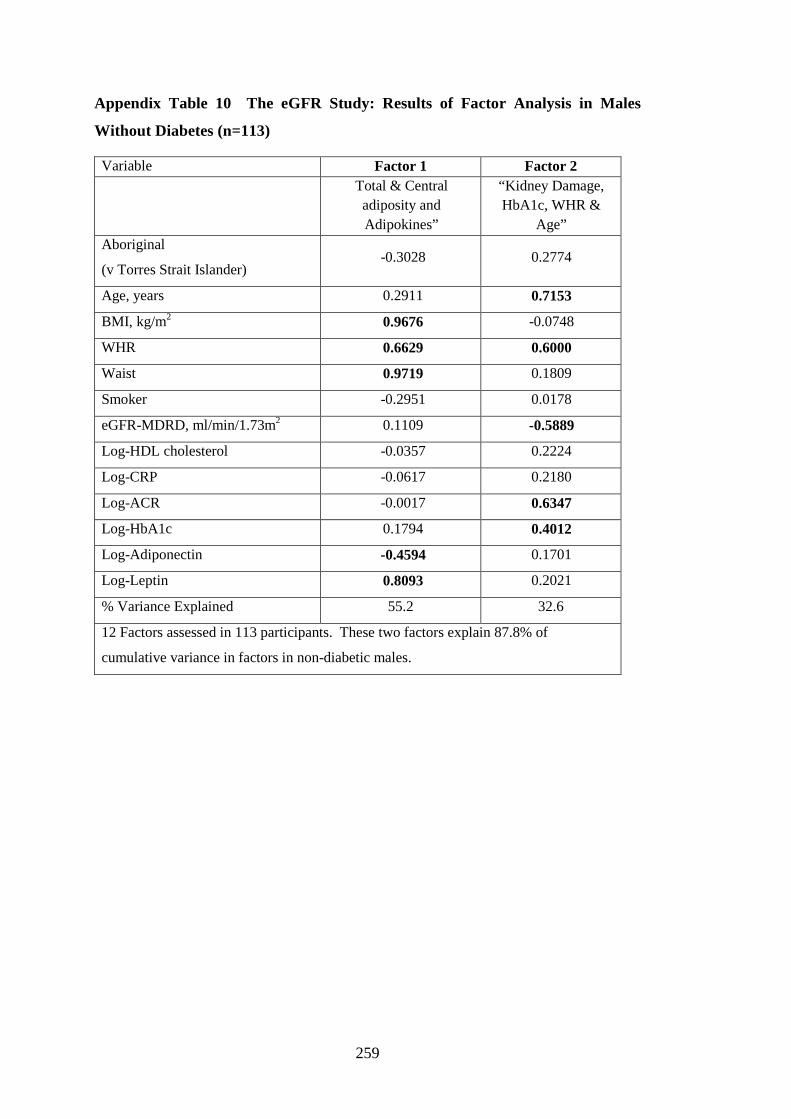
259
Appendix Table 10 The eGFR Study: Results of Factor Analysis in Males
Without Diabetes (n=113)
Variable Factor 1 Factor 2
Total & Central adiposity and Adipokines”
“Kidney Damage, HbA1c, WHR &
Age” Aboriginal
(v Torres Strait Islander) -0.3028 0.2774
Age, years 0.2911 0.7153
BMI, kg/m2 0.9676 -0.0748
WHR 0.6629 0.6000
Waist 0.9719 0.1809
Smoker -0.2951 0.0178
eGFR-MDRD, ml/min/1.73m2 0.1109 -0.5889
Log-HDL cholesterol -0.0357 0.2224
Log-CRP -0.0617 0.2180
Log-ACR -0.0017 0.6347
Log-HbA1c 0.1794 0.4012
Log-Adiponectin -0.4594 0.1701
Log-Leptin 0.8093 0.2021
% Variance Explained 55.2 32.6
12 Factors assessed in 113 participants. These two factors explain 87.8% of
cumulative variance in factors in non-diabetic males.
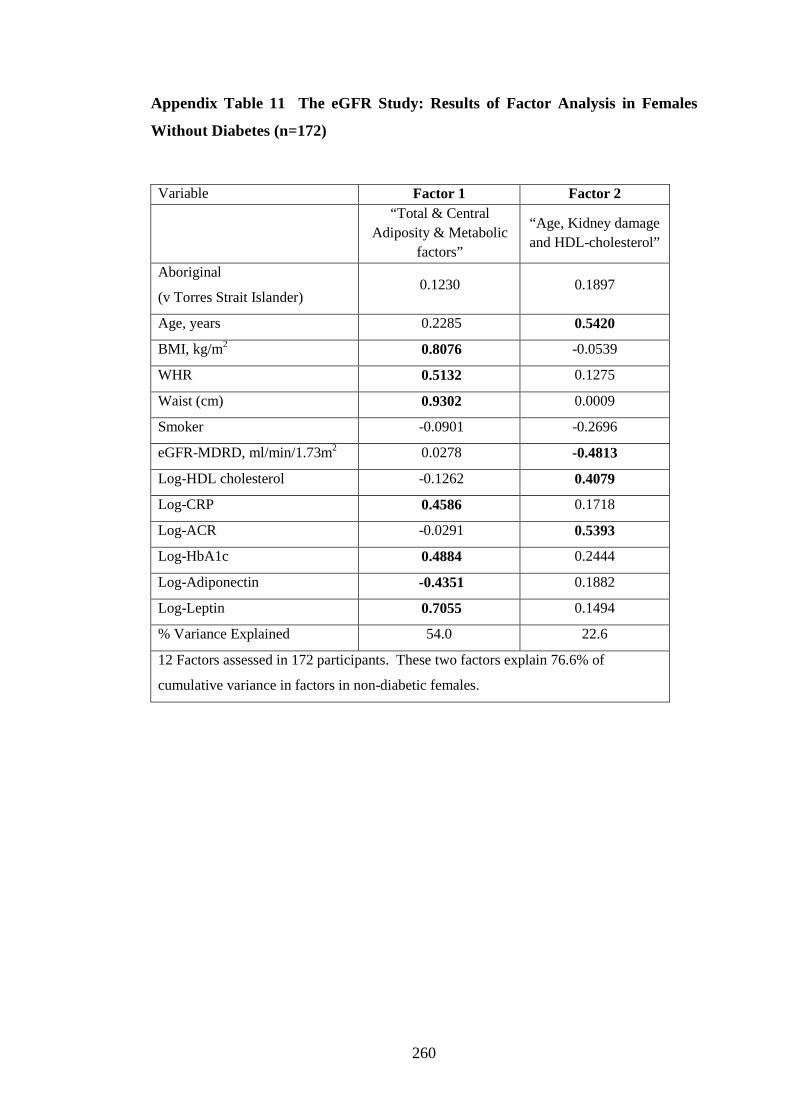
260
Appendix Table 11 The eGFR Study: Results of Factor Analysis in Females
Without Diabetes (n=172)
Variable Factor 1 Factor 2
“Total & Central
Adiposity & Metabolic factors”
“Age, Kidney damage and HDL-cholesterol”
Aboriginal
(v Torres Strait Islander) 0.1230 0.1897
Age, years 0.2285 0.5420
BMI, kg/m2 0.8076 -0.0539
WHR 0.5132 0.1275
Waist (cm) 0.9302 0.0009
Smoker -0.0901 -0.2696
eGFR-MDRD, ml/min/1.73m2 0.0278 -0.4813
Log-HDL cholesterol -0.1262 0.4079
Log-CRP 0.4586 0.1718
Log-ACR -0.0291 0.5393
Log-HbA1c 0.4884 0.2444
Log-Adiponectin -0.4351 0.1882
Log-Leptin 0.7055 0.1494
% Variance Explained 54.0 22.6
12 Factors assessed in 172 participants. These two factors explain 76.6% of
cumulative variance in factors in non-diabetic females.

References
262
ABS 2006. Population Characteristics, Aboriginal and Torres Strait Islander
Australians. Australian Bureau of Statistics. Canberra 2006, viewed 5 December
2012,
<http://www.abs.gov.au/ausstats/[email protected]/productsbytitle/17C0ED9A3FD1AE2FC
A2570BF007B06C7?OpenDocument>.
ADA 2011. 'American Diabetes Association. Diagnosis and Classification of
Diabetes Mellitus', 2011, Diabetes Care, vol. 34, no. Supplement 1, pp. S62-S9.
AHRC 2005. Australian Human Rights Commission 2005, Face the Facts 2005.
Section 1. Questions and answers about Aboriginal and Torres Strait Islander
Peoples., viewed 6 December 2012 2012,
<http://humanrights.gov.au/racial_discrimination/face_facts_05/atsi.html>.
AHRC 2012. Face the Facts 2012, Australian Human Rights Commission 2012,
viewed 6 February 2013 2013,
<http://www.humanrights.gov.au/racial_discrimination/face_facts/index.html>.
AIHW 2008. Australia’s Health 2008. Canberra, Australia: Australian Institute of
Health and Welfare; 2008. AIHW cat. no. AUS 99., 2008, viewed 5 December 2012,
<www.aihw.gov.au/WorkArea/DownloadAsset.aspx?id=6442453679>.
AIHW 2011. “AIHW 2011. Key indicators of progress for chronic disease and
associated determinants: data report. Cat. no. PHE 142. Canberra: AIHW.”
<http://www.aihw.gov.au/publication-detail/?id=10737419245>.
AIHW CKD 2011. AIHW 2011. Chronic kidney disease in Aboriginal and Torres
Strait Islander people. Cat. no. PHE 151. Canberra: AIHW. viewed 5 December
2012 <http://www.aihw.gov.au/publication-detail/?id=10737419983>. 2011.
NAHS 1989. National Aboriginal Health Strategy Working Party. 1989. "A
national Aboriginal health strategy". Canberra: Department of Aboriginal Affairs.,
1989, Canberra, viewed 5 December 2012,
263
<http://www.health.gov.au/internet/main/publishing.nsf/Content/health-oatsih-pubs-
NAHS1998>.
NCEP ATP III 2001. 'Executive Summary of The Third Report of The National
Cholesterol Education Program (NCEP) Expert Panel on Detection, Evaluation, And
Treatment of High Blood Cholesterol In Adults (Adult Treatment Panel III)', 2001,
The Journal of the American Medical Association, vol. 285, no. 19, pp. 2486-97.
NCEP ATP III 2002. 'Third Report of the National Cholesterol Education Program
(NCEP) Expert Panel on Detection, Evaluation, and Treatment of High Blood
Cholesterol in Adults (Adult Treatment Panel III) Final Report', 2002, Circulation,
vol. 106, no. 25, pp. 3143-.
WHO 1999. 'World Health Organization. Definition, Diagnosis and Classification of
Diabetes Mellitus and its Complications; Part 1: Diagnosis and Classification of
Diabetes Mellitus. Geneva: Department of Noncommunicable Disease Surveillance,
WHO, 1999.'
WHO 2000. World Health Organisation. 2000. The Asia-pacific perspective.
Redefining obesity and its treatment. Melbourne: International Obesity Taskforce.
International Diabetes Institute., 2000, viewed 5 December 2012,
<http://biotech.law.lsu.edu/obesity/who/obesity_final.pdf>
Abate, N, Garg, A, Peshock, R, Stray-Gundersen, J & Grundy, S 1995,
'Relationships of generalized and regional adiposity to insulin sensitivity in men.',
The Journal of Clinical Investigation, vol. 96, no. 1, pp. 88-98.
Abbie, A 1969, The original Australians, A.H & A.W. Reed, Sydney, pp 41, 63-4,
69-70, 75-6, 122.
Abbie, AA 1976, 'Morphologal variation in the adult Australian Aboriginal', in RL
Kirk & AG Thorne (eds), The Origins of Australians, Humanities Press Inc., New
Jersey, pp. 211-4.
264
Abrahamyan, D, Gazarian, A & Braillon, P 2008, 'Estimation of stature and length of
limb segments in children and adolescents from whole-body dual-energy X-ray
absorptiometry scans', Paediatric Radiology, vol. 38, no. 3, pp. 311-5.
Adamczak, M, Chudek, J & Wicek, A 2009, 'Progress in uremic toxin research:
Adiponectin in patients with chronic kidney disease', Seminars in Dialysis, vol. 22,
no. 4, pp. 391-5.
Addolorato, G, Capristo, E, Marini, M, Santini, P, Scognamiglio, U, Attilia, ML,
Messineo, D, Sasso, GF, Gasbarrini, G & Ceccanti, M 2000, 'Body composition
changes induced by chronic ethanol abuse: evaluation by dual energy x-ray
absorptiometry', American Journal of Gastroenterology, vol. 95, no. 9, pp. 2323-7.
Alberti, KGMM, Zimmet, P & Shaw, J 2006, 'Metabolic syndrome—a new world-
wide definition. A Consensus Statement from the International Diabetes Federation',
Diabetic Medicine, vol. 23, no. 5, pp. 469-80.
Alberti, KGMM & Zimmet, PZ 1998, 'Definition, diagnosis and classification of
diabetes mellitus and its complications. Part 1: diagnosis and classification of
diabetes mellitus. Provisional report of a WHO Consultation', Diabetic Medicine,
vol. 15, no. 7, pp. 539-53.
Anand, SS, Razak, F, Yi, Q, Davis, B, Jacobs, R, Vuksan, V, Lonn, E, Teo, K,
McQueen, M & Yusuf, S 2004, 'C-Reactive Protein as a Screening Test for
Cardiovascular Risk in a Multiethnic Population', Arteriosclerosis, Thrombosis, and
Vascular Biology, vol. 24, no. 8, pp. 1509-15.
Arita, Y, Kihara, S, Ouchi, N, Takahashi, M, Maeda, K, Miyagawa, J-i, Hotta, K,
Shimomura, I, Nakamura, T, Miyaoka, K, Kuriyama, H, Nishida, M, Yamashita, S,
Okubo, K, Matsubara, K, Muraguchi, M, Ohmoto, Y, Funahashi, T & Matsuzawa, Y
1999, 'Paradoxical Decrease of an Adipose-Specific Protein, Adiponectin, in
Obesity', Biochemical and Biophysical Research Communications, vol. 257, no. 1,
pp. 79-83.
265
Beasley, LE, Koster, A, Newman, AB, Javaid, MK, Ferrucci, L, Kritchevsky, SB,
Kuller, LH, Pahor, M, Schaap, LA, Visser, M, Rubin, SM, Goodpaster, BH & Harris,
TB 2009, 'Inflammation and Race and Gender Differences in Computerized
Tomography-measured Adipose Depots', Obesity, vol. 17, no. 5, pp. 1062-9.
Becker, B, Kronenberg, F, Kielstein, J, Haller, H, Morath, C, Ritz, E, Fliser, D &
Group, MtMKDS 2005, 'Renal insulin resistance syndrome, adiponectin and
cardiovascular events in patients with kidney disease: the mild and moderate kidney
disease study', Journal of the American Society of Nephrology, vol. 16, no. 4, pp.
1091 - 8.
Bertram, J, Young, R, Seymour, A, Kincaid-Smith, P & Hoy, W 1998,
'Glomerulomegaly in Australian Aborigines', Nephrology, vol. 4, no. s2, pp. s46-s53.
Bland, M 2000, 'An Introduction to Medical Statistics', in 3rd edn, Oxford University
Press, Oxford, pp. 156-84.
Bluher, M, Fasshauer, M, Tonjes, A, Kratzsch, J, Schon, MR & Paschke, R 2005,
'Association of Interleukin-6, C-reactive Protein, Interleukin-10 and Adiponectin
Plasme Concentrations with measures of Obesity, Insulin Sensitivity and Glucose
Metabolism', Experimental and clinical endocrinology and diabetes, vol. 113, pp.
534-7.
Bluher, S & Mantzoros, CS 2009, 'Leptin in humans: lessons from translational
research', The American Journal of Clinical Nutrition, vol. 89, no. Supplement, pp.
1S-7S.
Brimblecombe, J, Mackerras, D, Garnggulkpuy, J, Maypilama, E, Bundhala, L,
Dhurrkay, R, Fitz, J, Maple-Brown, L, Shemesh, T, Rowley, KG & O'Dea, K 2006,
'Leanness and type 2 diabetes in a population of indigenous Australians', Diabetes
Research and Clinical Practice, vol. 72, no. 1, pp. 93-9.
266
Brimblecombe, J & O'Dea, K 2009, 'The role of energy cost in food choices for an
Aboriginal population in northern Australia', The Medical Journal of Australia, vol.
190, no. 10, pp. 549-51.
Brownbill, RA & Ilich, JZ 2005, 'Measuring body composition in overweight
individuals by dual energy x-ray absorptiometry', BMC Medical Imaging, vol. 5, no.
1, viewed 5 December 2012, <http://www.biomedcentral.com/1471-2342/5/1>.
Browning, LM, Krebs, JD, Magee, EC, Frühbeck, G & Jebb, SA 2008, 'Circulating
Markers of Inflammation and Their Link to Indices of Adiposity', Obesity Facts, vol.
1, no. 5, pp. 259-65.
Burgess, C, Johnston, F, Berry, H, McDonnell, J, Yibarbuk, D, Gunabarra, C,
Mileran, A & Bailie, R 2009, 'Healthy country, healthy people: the relationship
between Indigenous health status and “caring for country”', The Medical Journal of
Australia, vol. 190, no. 10, pp. 567-72.
Callaway, C, Chumlea, W, Bouchard, C, Himes, J, Lohman, T, Martin, A, Mitchell,
C, Mueller, W, Roche, A & Seefeldt, V 1988, 'Circumferences.', in T Lohman, A
Roche & R Martorell (eds), Anthropometric Standardisation Reference Manual,
Human Kinetics Books, Champaign, IL, pp. 39-54.
Callister, P, Didham, R, Potter, D & Blakely, T 2007, 'Measuring Ethnicity in New
Zealand: Developing Tools for Health Outcomes Analysis', Ethnicity and health, vol.
12, no. 4, pp. 299-320.
Cameron, WI, Moffitt, PS & Williams, DRR 1986, 'Diabetes mellitus in the
Australian Aborigines of Bourke, New South Wales', Diabetes Research and
Clinical Practice, vol. 2, no. 5, pp. 307-14.
Carey, DG, Jenkins, AB, Campbell, LV, Freund, J & Chisholm, DJ 1996,
'Abdominal fat and insulin resistance in normal and overweight women: Direct
measurements reveal a strong relationship in subjects at both low and high risk of
NIDDM', Diabetes, vol. 45, no. 5, pp. 633-8.
267
Cartier, A, Côté, M, Lemieux, I, Pérusse, L, Tremblay, A, Bouchard, C & Després, J-
P 2009, 'Age-related differences in inflammatory markers in men: contribution of
visceral adiposity', Metabolism, vol. 58, no. 10, pp. 1452-8.
Carvalho, G, Pereira, P, Serrano, H, Franceschini, S, Paula, S, Priore, S & Peluzio, M
2010, 'Peripheral expression of inflammatory markers in overweight female
adolescents and eutrophic female adolescents with a high percentage of body fat',
Applied Physiology Nutrition and Metabolism, vol. 35, pp. 464-70.
Cass, A, Cunningham, J, Wang, Z & Hoy, W 2001, 'Regional variation in the
incidence of end-stage renal disease in Indigenous Australians', The Medical Journal
of Australia, vol. 175, no. 1, pp. 24 - 7.
Cassano, PA, Rosner, B, Vokonas, PS & Weiss, ST 1992, 'Obesity and Body Fat
Distribution in Relation to the Incidence of Non-lnsulin-dependent Diabetes
Mellitus', American Journal of Epidemiology, vol. 136, no. 12, pp. 1474-86.
CDIP Toolkit- Appropriate terminology, Indigenous Australian Peoples, 2004,
General Information Folio:5 edn, Adeliade, pp1-5.
<http://www.flinders.edu.au/equal-opportunity_files/documents/cdip/folio_5.pdf>.
Chan, DC, Hugh, P, Barrett, R, Ooi, EMM, Ji, J, Chan, DT & Watts, GF 2009, 'Very
Low Density Lipoprotein Metabolism and Plasma Adiponectin as Predictors of
High-Density Lipoprotein Apolipoprotein A-I Kinetics in Obese and Nonobese Men',
The Journal of Clinical Endocrinology and Metabolism, vol. 94, no. 3, pp. 989-97.
Chan, DT, Dogra, GK, Irish, AB, Ooi, EM, Barrett, PH, Chan, DC & Watts, GF
2009, 'Chronic kidney disease delays VLDL-apoB-100 particle catabolism: potential
role of apolipoprotein C-III ', Journal of Lipid research, vol. 50, no. 12, pp. 2524-31.
Chang, Y, Yoo, T, Ryu, S, Huh, BY, Cho, BL, Sung, E, Park, M & Yoo, SH 2006,
'Abdominal obesity, systolic blood pressure, and microalbuminuria in normotensive
and euglycemic Korean men', Int J Obes, vol. 30, no. 5, pp. 800-4.
268
Charlesworth, JA, Kriketos, AD, Jones, JE, Erlich, JH, Campbell, LV & Peake, PW
2005, 'Insulin resistance and postprandial triglyceride levels in primary renal disease',
Metabolism, vol. 54, no. 6, pp. 821-8.
Cnop, M, Havel, P, Utzschneider, K, Carr, D, Sinha, M, Boyko, E, Retzlaff, B,
Knopp, R, Brunzell, J & Kahn, S 2003, 'Relationship of adiponectin to body fat
distribution, insulin sensitivity and plasma lipoproteins: evidence for independent
roles of age and sex', Diabetologia, vol. 46, no. 4, pp. 459 - 69.
Cornier, M-A, Dabelea, D, Hernandez, TL, Lindstrom, RC, Steig, AJ, Stob, NR, Van
Pelt, RE, Wang, H & Eckel, RH 2008, 'The Metabolic Syndrome', Endocrine
Reviews, vol. 29, no. 7, pp. 777-822.
Cornish, BH & Jacobs, A 1999, 'Optimizing electrode sites for segmental
bioimpedance measurements', Physiological Measurement, vol. 20, no. 3, pp. 241-
50.
Craig, P, Samaras, K, Freund, J, Culton, N, Halavatau, V & Campbell, L 2003, 'BMI
inaccurately reflects total body and abdominal fat in Tongans', Acta Diabetologica,
vol. 40, no. 1 Suppement, pp. s282-s5.
Cunningham, C & Stanley, F 2003, 'Indigenous by definition, experience, or world
view', British Medical Journal, vol. 327, no. 7412, pp. 403-4.
Cunningham, J, O'Dea, K, Dunbar, T, Weeramanthri, T, Shaw, J & Zimmet, P 2008,
'Socioeconomic status and diabetes among urban Indigenous Australians aged 15-64
years in the DRUID study', Ethnicity and health, vol. 13, no. 1, pp. 23 - 37.
Cunningham, J, O'Dea, K, Dunbar, T, Weeramanthri, T, Zimmet, P & Shaw, J 2006,
'Study protocol-Diabetes and related conditions in urban indigenous people in the
Darwin, Australia region: aims, methods and participation in the DRUID Study',
BMC Public Health, vol. 6, p. 8.
269
Daniel, M, Rowley, KG, McDermott, R, Mylvaganam, A & O'Dea, K 1999,
'Diabetes incidence in an Australian aboriginal population. An 8-year follow-up
study', Diabetes Care, vol. 22, no. 12, pp. 1993-8.
Davey Smith, G, Greenwood, R, Gunnell, D, Sweetnam, P, Yarnell, J & Elwood, P
2001, 'Leg length, insulin resistance, and coronary heart disease risk: The Caerphilly
Study', Journal of Epidemiology and Community Health, vol. 55, pp. 867-72.
Demerath, EW, Reed, D, Rogers, N, Sun, SS, Lee, M, Choh, AC, Couch, W,
Czerwinski, SA, Chumlea, WC, Siervogel, RM & Towne, B 2008, 'Visceral
adiposity and its anatomical distribution as predictors of the metabolic syndrome and
cardiometabolic risk factor levels', The American Journal of Clinical Nutrition, vol.
88, no. 5, pp. 1263-71.
Demerath, EW, Shen, W, Lee, M, Choh, AC, Czerwinski, SA, Siervogel, RM &
Towne, B 2007, 'Approximation of total visceral adipose tissue with a single
magnetic resonance image', The American Journal of Clinical Nutrition, vol. 85, no.
2, pp. 362-8.
Deurenberg-Yap, M, Chew, SK & Deurenberg, P 2002, 'Elevated body fat
percentage and cardiovascular risks at low body mass index levels among
Singaporean Chinese, malays and Indians', Obesity Reviews, vol. 3, pp. 209-15.
Deurenberg, P & Deurenberg-Yap, M 2003, 'Validity of body composition methods
across ethnic population groups', Acta Diabetologica, vol. 40, no. S1, pp. s246-s9.
Deurenberg, P, Deurenberg-Yap, M & Guricci, S 2002, 'Asians are different from
Caucasians and from each other in their body mass index/body fat per cent
relationship', Obesity Reviews, vol. 3, pp. 141-6.
Deurenberg, P, Deurenberg-Yap, M & Schouten, F 2002, 'Validity of total and
segmental impedance measurements for prediction of body composition across
ethnic population groups', European Journal of Clinical Nutrition, vol. 56, pp. 214-
20.
270
Du Bois, D & Du Bois, E 1916, 'Clinical calorimetry: Tenth paper a formula to
estimate the approximate surface are if height and weight be known', Archives of
Internal Medicine, vol. 17, no. 6-2, pp. 863-71.
Dunstan, D, Zimmet, P, Welborn, T, de Courten, M, Cameron, A, Sicree, R, Dwyer,
T, Colagiuri, S, Jolley, D, Knuiman, M, Atkins, R & Shaw, J 2002, 'The Rising
Prevalence of Diabetes and Impaired Glucose Tolerance: The Australian Diabetes,
Obesity and Lifestyle Study', Diabetes Care, vol. 25, no. 5, pp. 829-34.
Dupont, W 2009, 'Statistical Modelling for Biomedical Researchers: a simple
introduction to the analysis of coomplex data', in 2nd edn, Cambridge University
Press, Melbourne, pp. 97-133, 216-20.
Durie, M 2004, 'Understanding health and illness: research at the interface between
science and indigenous knowledge', International Journal of Epidemiology, vol. 33,
no. 5, pp. 1138-43.
Durnin, JVGA & Womersley, J 1974, 'Body fat assessed from total body density and
its estimation from skinfold thickness: measurments on 481 mean and women aged
16-72 years', British Journal of Nutrition, vol. 32, pp. 77-97.
Ellis, K 2000, 'Human Body Composition: In Vivo Methods', Physiological Reviews,
vol. 80, no. 2, pp. 649-80.
Ellis, KJ 2001, 'Selected Body Composition Methods Can Be Used in Field Studies',
The Journal of Nutrition, vol. 131, no. 5, pp. 1589S-95S.
Eseli, P, Shnukal, A, Mitchell, R & University of Queensland 1998, 'Aboriginal and
Torres Strait Islanders Studies Unit. Eseli's notebook', in Aboriginal and Torres
Strait Islander Studies Unit Research Report Series, The University of Queensland,
Brisbane, vol. 3, pp. 19, 30.
271
Flood, J 2006, The original Australians: story of the Aboriginal people, Allen &
Unwin, Crows Nest, pp. xiv, 20-1, 26, 53,164, 175, 181-2.
Florek, S 2005, The Torres Strait Islands Collection at the Australian Museum, The
Australian Museum, pp. 8, 13, 16, 64
<www.amonline.net.au/pdf/publications/1464_complete.pdf>.
Fontana, L, Eagon, J, Trujillo, M, Scherer, P & Klein, S 2007, 'Visceral Fat
Adipokine Secretion Is Associated With Systemic Inflammation in Obese Humans ',
Diabetes, vol. 56, pp. 1010-3.
Fried, LF, Boudreau, R, Lee, JS, Chertow, G, Kurella-Tamura, M, Shlipak, MG,
Ding, J, Sellmeyer, D, Tylavsky, FA, Simsonick, E, Kritchevsky, SB, Harris, TB &
Newman, AB 2007, 'Kidney function as a predictor of loss of lean mass in older
adults: health, aging and body composition study', Journal of the American
Geriatrics Society, vol. 55, no. 10, pp. 1578-84.
Gallagher, D, Heymsfield, SB, Heo, M, Jebb, SA, Murgatroyd, PR & Sakamoto, Y
2000, 'Healthy percentage body fat ranges: an approach for developing guidelines
based on body mass index', The American Journal of Clinical Nutrition, vol. 72, no.
3, pp. 694-701.
Gallagher, D, Shaheen, I & Kaleem, Z 2008, 'State-of-the-art measurements in
human body composition: A moving frontier of clinical importance', International
Journal of Body Composition Research, vol. 6, no. 4, pp. 141-8.
Gallagher, D, Visser, M, De Meersman, R, Sepúlveda, D, Baumgartner, R, Pierson,
R, Harris, T & Heymsfield, S 1997, 'Appendicular skeletal muscle mass: effects of
age, gender, and ethnicity', Journal of Applied Physiology, vol. 83, pp. 229-39.
Gardiner-Garden, J. Department of the Parliamentary Library 2000, The Definition
of Aboriginality: 18, 2000–01 (2000) Parliament of Australia, 2., by Gardiner-
Garden, J, Infomation and Research Services, viewed 10 December 2010,
272
<http://parlinfo.aph.gov.au/parlInfo/download/library/prspub/7M036/upload_binary/
7m0366.pdf;fileType=application%2Fpdf#search=%22library/prspub/7M036%22>.
Gault, A, O'Dea, K, Rowley, KG, McLeay, T & Traianedes, K 1996, 'Abnormal
glucose tolerance and other coronary heart disease risk factors in an isolated
aboriginal community in central Australia.', Diabetes Care, vol. 19, no. 11, p. 1269.
Glatthaar, C, Wellborn, TA, Stenhouse, NS & Garcia-Webb, P 1985, 'Diabetes and
Impaired Glucose Tolerance. A prevalence estimate based on the Busselton 1981
survey', The Medical Journal of Australia, vol. 143, pp. 778-83.
Grauer, W, Moss, A, Cann, C & Goldberg, H 1984, 'Quantification of body fat
distribution in the abdomen using computer tomography', The American Journal of
Clinical Nutrition, vol. 39, no. 4, pp. 631-7.
Greenfield, JR, Samaras, K, Chisholm, DJ & Campbell, LV 2002, 'Regional Intra-
Subject Variability in Abdominal Adiposity Limits Usefulness of Computed
Tomography', Obesity, vol. 10, no. 4, pp. 260-5.
Guest, CS, O'Dea, K, Hopper, JL, Nankervis, AJ & Larkins, RG 1992, 'The
prevalence of glucose intolerance in Aborigines and Europids of south-eastern
Australia', Diabetes Research and Clinical Practice, vol. 15, no. 3, pp. 227-35.
Gunnell, D, Smith, GD, Frankel, S, Kemp, M & Peters, T 1998, 'Socio-economic and
dietary influences on leg length and trunk length in childhood: a reanalysis of the
Carnegie (Boyd Orr) survey of diet and health in prewar Britain (1937-39)',
Paediatric & Perinatal Epidemiology, vol. 12, no. S1, pp. 96-113.
Gurrici, S & Hartriyanti, Y 1999, 'Differences in the relationship between body fat
and body mass index between two different Indonesian ethnic groups: the effect of
body build', European Journal of Clinical Nutrition, vol. 53, no. 6, p. 468.
273
Hanley, AJG, Connelly, PW, Harris, SB & Zinman, B 2003, 'Adiponectin in a Native
Canadian Population Experiencing Rapid Epidemiological Transition', Diabetes
Care, vol. 26, no. 12, pp. 3219-25.
Hansen, RD, Raja, C, Aslani, A, Smith, RC & Allen, BJ 1999, 'Determination of
skeletal muscle and fat-free mass by nuclear and dual-energy X-ray absorptiometry
methods in men and women aged 51–84 y', The American Journal of Clinical
Nutrition, vol. 70, no. 2, pp. 228-33.
Hara, K, Horikoshi, M, Yamauchi, T, Yago, H, Miyazaki, O, Ebinuma, H, Imai, Y,
Nagai, R & Kadowaki, T 2006, 'Measurement of the high-molecular weight form of
adiponectin in plasma is useful for the prediction of insulin resistance and metabolic
syndrome', Diabetes Care, vol. 29, no. 6, pp. 1357-62.
Harrison, G, Busrick, E, Carter, J, Johnston, F, Lohman, T, Pollack, M, Roche, A &
Wilmore, J 1988, 'Skinfold thicknesses and measurement technique', in T Lohman, A
Roche & R Martorell (eds), Anthropometric standardisation reference manual,
Human Kinetics Books, Champaign, IL, pp. 55-69.
He, Q, Heshka, S, Wang, J, Pierson, R, Albu, J, Wang, Z, Heymsfield, S &
Gallagher, D 2003, 'Total Body Potassium differs by sex and race across the adult
age span', The American Journal of Clinical Nutrition, vol. 78, no. 1, pp. 72-7.
Heidemann, C, Sun, Q, van Dam, RM, Meigs, JB, Zhang, C, Tworoger, SS,
Mantzoros, CS & Hu, FB 2008, 'Total and High-Molecular-Weight Adiponectin and
Resistin in Relation to the Risk for Type 2 Diabetes in Women', Annals of Internal
Medicine, vol. 149, no. 5, pp. 307-16.
Heitmann, BL, Swinburn, BA, Carmichael, H, Rowley, K, Plank, L, McDermott, R,
Leonard, D & O'Dea, K 1997, 'Are there ethnic differences in the association
between body weight and resistance, measured by bioelectrical impedance?',
International Jounal of Obesity, vol. 21, no. 12, pp. 1085-92.
274
Heymsfield, S, Smith, R, Aulet, M, Bensen, B, Lichtman, S, Wang, J & Pierson, R
1990, 'Appendicular skeletal muscle mass: measurment by dual photon
absorptiometry', The American Journal of Clinical Nutrition, vol. 52, pp. 214-8.
Hodge, A, Maple-Brown, L, Cunningham, C, Boyle, J, Dunbar, T, Weeramanthri, T,
Shaw, J & O'Dea, K 2010, 'Abdominal obesity and other risk factors largely explain
the high CRP in Indigenous Australians relative to the general population, but not
gender differences: a cross-sectional study', BMC Public Health, vol. 10, p. 700.
Horton, D 1994, Australian Institute of Aboriginal and Torres Strait Islander
Studies. The Encyclopedia of Aboriginal Australia: Aboriginal and Torres Strait
Islander History, Society and Culture Aboriginal Studies Press for the Australian
Institute of Aboriginal and Torres Strait Islander Studies, Canberra. pp. 1089, 1092.
Hoy, W, Douglas-Denton, R, Hughson, M, Cass, A, Johnson, K & Bertram, J 2003a,
'A stereological study of glomerular number and volume: preliminary findings in a
multiracial study of kidneys at autopsy', Kidney International, vol. 63, no. s83, pp.
S31-S7.
Hoy, W, Kincaid-Smith, P, Hughson, M, Fogo, A, Sinniah, R, Dowling, J, Samuel,
T, Mott, S, Douglas-Denton, R & Bertram, J 2010a, 'CKD in Aboriginal Australians',
American Journal of Kidney Diseases, vol. 56, no. 5, pp. 983-93.
Hoy, W & Nicol, J 2010b, 'Birthweight and natural deaths in a remote Australian
Aboriginal community', The Medical Journal of Australia, vol. 192, no. 1, pp. 14-9.
Hoy, WE, Hughson, MD, Singh, GR, Douglas-Denton, R & Bertram, JF 2006a,
'Reduced nephron number and glomerulomegaly in Australian Aborigines: A group
at high risk for renal disease and hypertension', Kidney International, vol. 70, pp.
104-10.
Hoy, WE, Kondalsamy-Chennakesavan, S, McDonald, S & Wang, Z 2006b, 'Renal
disease, the metabolic syndrome, and cardiovascular disease', Ethnicity and Disease,
vol. 16, no. S2, pp. S2-46-S2-51.
275
Hoy, WE, Kondalsamy-Chennakesavan, S, Wang, Z, Briganti, E, Shaw, J,
Polkinghorne, K & Chadban, S 2007, 'Quantifying the excess risk for proteinuria,
hypertension and diabetes in Australian Aborigines: comparison of profiles in three
remote communities in the Northern Territory with those in the AusDiab study',
Australian and New Zealand Journal of Public Health, vol. 31, pp. 177 - 83.
Hoy, WE, Norman, RJ, Hayhurst, BG & Pugsley, DJ 1997, 'A health profile of adults
in a Northern Territory aboriginal community, with an emphasis on preventable
morbidities', Australian and New Zealand Journal of Public Health, vol. 21, no. 2,
pp. 121-6.
Hoy, WE, Rees, M, Kile, E, Mathews, JD, McCredie, DA, Pugsley, DJ & Wang, Z
1998, 'Low birthweight and renal disease in Australian aborigines', The Lancet, vol.
352, no. 9143, pp. 1826-7.
Hoy, WE, Wang, Z, Baker, PRA & Kelly, AM 2003b, 'Secondary Prevention of
Renal and Cardiovascular Disease: Results of a Renal and Cardiovascular Treatment
Program in an Australian Aboriginal Community', Journal of American Society of
Nephrology, vol. 14, no. Supplement 2, pp. S178-85.
Hoy, WE, Wang, Z, vanBuynder, P, Baker, PRA & Mathews, JD 2001a, 'The natural
history of renal disease in Australian Aborigines. Part 1. Changes in albuminuria and
glomerular filtration rate over time', Kidney International, vol. 60, no. 1, pp. 243-8.
Hoy, WE, Wang, Z, vanBuynder, P, Baker, PRA, McDonald, SM & Mathews, JD
2001b, 'The natural history of renal disease in Australian Aborigines. Part 2.
Albuminuria predicts natural death and renal failure', Kidney International, vol. 60,
no. 1, pp. 249-56.
Hsu, J, Johansen, KL, Hsu, C, Kaysen, GA & Chertow, GM 2008, 'Higher Serum
Creatinine Concentrations in Black Patients with Chronic Kidney Disease: Beyond
Nutritional Status and Body Composition', Clinical Journal of the American Society
of Nephrology, vol. 3, no. 4, pp. 992-7.
276
Hughes, VA, Roubenoff, R, Wood, M, Frontera, WR, Evans, WJ & Fiatarone Singh,
MA 2004, 'Anthropometric assessment of 10-y changes in body composition in the
elderly', The American Journal of Clinical Nutrition, vol. 80, no. 2, pp. 475-82.
Hughson, M, Farris, A, III, Douglas-Denton, R, Hoy, W & Bertram, J 2003,
'Glomerular number and size in autopsy kidneys: The relationship to birth weight',
Kidney International, vol. 63, no. 6, pp. 2113-22.
Hunley, TE, Ma, L & Kon, V 2010, 'Scope and mechanisms of obesity-related renal
disease', Current Opinion in Nephrology and Hypertension, vol. 19, no. 3, pp. 227-
34
Im, J-A, Kim, S-H, Lee, J-W, Shim, J-Y, Lee, H-R & Lee, D-C 2006, 'Association
between hypoadiponectinemia and cardiovascular risk factors in nonobese healthy
adults', Metabolism, vol. 55, no. 11, pp. 1546-50.
Inoue, M, Yano, M, Yamakado, M, Maehata, E & Suzuki, S 2006, 'Relationship
between the adiponectin-leptin ratio and parameters of insulin resistance in subjects
without hyperglycemia', Metabolism: Clinical And Experimental, vol. 55, no. 9, pp.
1248-54.
Janssen, I, Heymsfield, S, Baumgartner, R & Ross, R 2000, 'Estimation of skeletal
muscle mass by bioelectrical impedance analysis', Journal of Applied Physiology,
vol. 89, pp. 465-71.
Jenkins, AB, Samaras, K, Gordon, MA, Snieder, H, Spector, T & Campbell, LV
2001, 'Lack of heritability of circulating leptin concentration in humans after
adjustment for body size and adiposity using a physiological approach', International
Jounal of Obesity, vol. 25, no. 11, pp. 1625-32.
Jensen, M, Kanaley, J, Reed, J & Sheedy, P 1995, 'Measurement of abdominal and
vasceral fat with computed tomography and dual-energy x-ray absorptiometry', The
American Journal of Clinical Nutrition, vol. 61, pp. 274-8.
277
Jesudason, D & Clifton, P 2011, 'Interpreting different measures of glomerular
filtration rate in obesity and weight loss: pitfalls for the clinician', International
Journal of Obesity, vol. 36, pp. 1421-7.
Johansen, KL 2010, 'Association of Body Composition with Survival Among
Patients on Hemodialysis', Clinical Journal of the American Society of Nephrology,
vol. 5, no. 12, pp. 2144-5.
Johnston, KL, Thomas, EL, Bell, JD, Frost, GS & Robertson, MD 2010, 'Resistant
starch improves insulin sensitivity in metabolic syndrome', Diabetic Medicine, vol.
27, no. 4, pp. 391-7.
Jose, M, McDonald, S & Excell, L 2009, End Stage Kidney Disease Among
Indigenous Peoples of Australia and New Zealand (Chapter 12), Australia and New
Zealand Dialysis and Transplant Registry, Adelaide, South Australia.
Kadowaki, T, Yamauchi, T, Kubota, N, Hara, K, Ueki, K & Tobe, K 2006,
'Adiponectin and adiponectin receptors in insulin resistance, diabetes, and the
metabolic syndrome', The Journal of Clinical Investigation, vol. 116, no. 7, pp.
1784-92.
Kanjilal, S, Rao, V, Mukherjee, M, BK Natesha, B, Renuka, K, Sibi, K, SS Iyengar,
S & Kakkar, V 2008, 'Application of cardiovascular disease risk prediction models
and the relevance of novel biomarkers to risk stratification in Asian Indians',
Vascular Health and Risk Management, vol. 4, no. 1, pp. 199-211.
Kaptoge, S, Di Angelantonio, E, Lowe, G, Pepys, M, Thompson, S & Collins, R
2010, 'C-reactive protein concentration and risk of coronary heart disease, stroke, and
mortality: an individual participant meta-analysis', The Lancet, vol. 375, no. 9709,
pp. 132-40.
278
Katzmarzyk, PT & Malina, RM 1998, 'Obesity and relative subcutaneous fat
distribution among Canadians of First Nation and European ancestry', International
Journal of Obesity, vol. 22, pp. 1127-31.
Katzmarzyk, PT & Malina, RM 1999, 'Body size and physique among Canadians of
First Nation and European ancestry', American Journal of Physical Anthropology,
vol. 108, no. 2, pp. 161-72.
Keith, DS, Nichols, GA, Gullion, CM, Brown, JB & Smith, DH 2004, 'Longitudinal
Follow-up and Outcomes Among a Population With Chronic Kidney Disease in a
Large Managed Care Organization', Archives of Internal Medicine, vol. 164, no. 6,
pp. 659-63.
Keun-Gyu, P, Kyong Soo, P, Mi-Jung, K, Hye-Soon, K, Young-Sung, S, Jong Doek,
A, Kwan-Kyu, P, Young-Chae, C & In-Kyu, L 2004, 'Relationship between serum
adiponectin and leptin concentrations and body fat distribution', Diabetes Research
and Clinical Practice, vol. 63, no. 2, pp. 135-42.
Kirkwood, BR & Sterne, JAC 2003, Essentials of Modern Statistics, 2nd edn,
Blackwell Scientific, Malden. pp. 101.
Klein, S, Allison, DB, Heymsfield, SB, Kelley, DE, Leibel, RL, Nonas, C & Kahn, R
2007, 'Waist Circumference and Cardiometabolic Risk: A Consensus Statement from
Shaping America's Health: Association for Weight Management and Obesity
Prevention; NAASO, The Obesity Society; the American Society for Nutrition; and
the American Diabetes Association', Diabetes Care, vol. 30, no. 6, pp. 1647-52.
Koh, SJ, Hyun, YJ, Choi, SY, Chae, JS, Kim, JY, Park, S, Ahn, C, Jang, Y & Lee,
JH 2008, 'Influence of age and visceral fat area on plasma adiponectin concentrations
in women with normal glucose tolerance', Clinica Chimica Acta, vol. 389, no. 1-2,
pp. 45-50.
279
Komiya, H, Mori, Y, Yokose, T & Tajima, N 2006, 'Smoking as a risk factor for
visceral fat accumulation in Japanese men. ', Tohoku Journal of Experimental
Medicine, vol. 208, no. 2, pp. 123-32.
Komura, N, Kihara, S, Sonoda, M, Maeda, N, Tochino, Y, Funahashi, T &
Shimomura, I 2010, 'Increment and impairment of adiponectin in renal failure',
Cardiovascular Research, vol. 86, no. 3, pp. 471-7.
Kondalsamy-Chennakesavan, S, Hoy , WE, Wang, Z, Briganti, E, Polkinghorne, K,
Chadban, S, Shaw, J & Group, OBotAS 2008, 'Anthropometric measurements of
Australian Aboriginal adults living in remote areas: Comparison with nationally
representative findings', American Journal of Human Biology, vol. 20, no. 3, pp.
317-24.
Krakoff, J, Funahashi, T, Stehouwer, CDA, Schalkwijk, CG, Tanaka, S, Matsuzawa,
Y, Kobes, S, Tataranni, PA, Hanson, RL, Knowler, WC & Lindsay, RS 2003,
'Inflammatory Markers, Adiponectin, and Risk of Type 2 Diabetes in the Pima
Indian', Diabetes Care, vol. 26, no. 6, pp. 1745-51.
Kursawe, R, Eszlinger, M, Narayan, D, Liu, T, Bazuine, M, Cali, AMG, D'Adamo,
E, Shaw, M, Pierpont, B, Shulman, GI, Cushman, SW, Sherman, A & Caprio, S
2010, 'Cellularity and Adipogenic Profile of the Abdominal Subcutaneous Adipose
Tissue From Obese Adolescents: Association With Insulin Resistance and Hepatic
Steatosis', Diabetes, vol. 59, no. 9, pp. 2288-96.
Kvist, H, Chowdhury, B, Grangard, U, Tylen, U & Sjostrom, L 1988, 'Total and
visceral adipose-tissue volumes derived from measurements with computed
tomography in adult men and women: predictive equations', The American Journal
of Clinical Nutrition, vol. 48, no. 6, pp. 1351-61.
Lambert, CP, Wright, NR, Finck, BN & Villareal, DT 2008, 'Exercise but Not Diet-
Induced Weight Loss Decreases Skeletal Muscle Inflammatory Gene Expression in
Frail Obese Elderly', Journal of Applied Physiology, vol. 105, no. 2, pp. 473-8.
280
Lawlor, Lawlor, D, Ebrahim, Ebrahim, S, Davey, S & Smith, GD 2002, 'The
association between components of adult height and Type II diabetes and insulin
resistance: British Women's Heart and Health Study', Diabetologia, vol. 45, no. 8,
pp. 1097-106.
Lawrence, D & Lawrence, HR 2004, 'Torres Strait: the region and its people', in R
Davis (ed.), Woven Histories, Dancing Lives: Torres Strait Islander Identity, Culture
and History, Aboriginal Studies Press, pp. 15-29, viewed 6 December 2012,
<http://www.ebooks.com/272059/woven-histories/davis-richard-ed/>.
Lawrie, M 1972, Tales from Torres Strait, University of Queensland Press, St Lucia,
Queensland. pp. ix, 50.
Lê, K-A, Ventura, EE, Fisher, JQ, Davis, JN, Weigensberg, MJ, Punyanitya, M, Hu,
HH, Nayak, KS & Goran, MI 2011, 'Ethnic Differences in Pancreatic Fat
Accumulation and Its Relationship With Other Fat Depots and Inflammatory
Markers', Diabetes Care, vol. 34, no. 2, pp. 485-90.
Leonard, D, McDermott, R, O'Dea, K, Rowley, KG, Pensio, P, Sambo, E, Twist, A,
Toolis, R, Lowson, SK & Best, JD 2002, 'Obesity, diabetes and associated
cardiovascular risk factors among Torres Strait Islander people', Australian and New
Zealand Journal of Public Health, vol. 26, no. 2, pp. 144-9.
Levey, AS, Bosch, JP, Lewis, JB, Greene, T, Rogers, N, Roth, D, for the
Modification of Diet in Renal Disease Study Group, 1999, 'A More Accurate Method
To Estimate Glomerular Filtration Rate from Serum Creatinine: A New Prediction
Equation', Annals of Internal Medicine, vol. 130, no. 6, pp. 461-70.
Levey, AS, de Jong, PE, Coresh, J, Nahas, ME, Astor, BC, Matsushita, K,
Gansevoort, RT, Kasiske, BL & Eckardt, K-U 2011, 'The definition, classification,
and prognosis of chronic kidney disease: a KDIGO Controversies Conference report',
Kidney International, vol. 80, no. 1, pp. 17-28.
281
Levey, AS, Stevens, LA, Schmid, CH, Zhang, Y, Castro III, AF, Feldman, HI,
Kusek, JW, Eggers, P, Van Lente, FG, T & Coresh, J 2009, 'A New Equation to
Estimate Glomerular Filtration Rate', Annals of Internal Medicine, vol. 150, pp. 604-
12.
Ley, S, Harris, S, Connelly, P, Mamakeesick, M, Gittelsohn, J, Hegele, R,
Retnakaran, R, Zinman, B & Hanley, A 2008, 'Adipokines and Incident Type 2
diabetes in an Aboriginal Canadian Population', Diabetes Care, vol. 31, no. 7, pp.
1410-5.
Li, D, Xu, T, Takase, H, Tokimitsu, I, Zhang, P, Wang, Q, Yu, X & Zhang, A 2008,
'Diacylglycerol-induced improvement of whole-body insulin sensitivity in type 2
diabetes mellitus: a long-term randomized, double-blind controlled study', Clinical
Nutrition, vol. 27, no. 2, pp. 203-11.
Li, M & McDermott, R 2010, 'Using anthropometric indices to predict cardio-
metabolic risk factors in Australian indigenous populations', Diabetes Research and
Clinical Practice, vol. 87, pp. 401-6.
Li, Z, Woollard, JR, Wang, S, Korsmo, MJ, Ebrahimi, B, Grande, JP, Textor, SC,
Lerman, A & Lerman, LO 2011, 'Increased glomerular filtration rate in early
metabolic syndrome is associated with renal adiposity and microvascular
proliferation', American Journal of Physiology -Renal Physiology, vol. 301, no. 5,
pp. F1078-F87.
Liberato, SC, Bressan, J & Hills, AP 2008, 'A quantitative analysis of energy intake
reported by young men', Nutrition & Dietetics, vol. 65, no. 4, pp. 259-65.
Lindgarde, F, Ercilla, MB, Correa, LR & Ahren, B 2004, 'Body adiposity, insulin,
and leptin in subgroups of Peruvian Amerindians', High Altitude Medicine and
Biology, vol. 5, no. 1, pp. 27-31.
Liska, D, Dufour, S, Zern, TL, Taksali, S, Cali, AM, Dziura, J, Shulman, GI,
Pierpont, BM & Caprio, S 2007, 'Interethnic differences in muscle, liver and
282
abdominal fat partitioning in obese adolescents', PLoS ONE, vol. 2, no. 6, p. e569,
DOI 10.1371/journal.pone.0000569,
<http://www.plosone.org/article/info%3Adoi%2F10.1371%2Fjournal.pone.0000569
>.
Long, J & Freese, J 2006, Regression Models for Categorical Variables using Stata,
2nd edn, Stata Press, Texas. pp. 101.
Looker, HC, Krakoff, J, Funahashi, T, Matsuzawa, Y, Tanaka, S, Nelson, RG,
Knowler, WC, Lindsay, RS & Hanson, RL 2004, 'Adiponectin concentrations are
influenced by renal function and diabetes duration in Pima Indians with type 2
diabetes', The Journal of Clinical Endocrinology and Metabolism, vol. 89, no. 8, pp.
4010-7.
Lukaski, H, Bolonchuk, W, Hall, C & Siders, W 1986, 'Validation of tetrapolar
bioelectrical impedance method to assess human body composition ', Journal of
Applied Physiology, vol. 60, pp. 1327-32.
Lumeng, CN, Bodzin, JL & Saltiel, AR 2007, 'Obesity induces a phenotypic switch
in adipose tissue macrophage polarization', The Journal of Clinical Investigation,
vol. 117, pp. 175-84.
Macy, EM, Hayes, TE & Tracy, RP 1997, 'Variability in the measurement of C-
reactive protein in healthy subjects: implications for reference intervals and
epidemiological applications', Clinical Chemistry, vol. 43, no. 1, pp. 52-8.
Mantzoros, CS, Magkos, F, Brinkoetter, M, Sienkiewicz, E, Dardeno, TA, Kim, S-Y,
Hamnvik, O-PR & Koniaris, A 2011, 'Leptin in human physiology and
pathophysiology', American Journal of Physiology - Endocrinology And Metabolism,
vol. 301, no. 4, pp. E567-E84.
Maple-Brown, L, Cunningham, C, Nandi, N, Hodge, A & O’Dea, K 2010a,
'Fibrinogen and associated risk factors in a high-risk population: urban Indigenous
Australians, the Druid study', Cardiovascular Diabetology, vol. 9, p. 69.
283
Maple-Brown, L, Cunningham, J, Celermajer, DS & O'Dea, K 2007, 'Increased
carotid intima-media thickness in remote and urban Indigenous Australians: impact
of diabetes and components of the metabolic syndrome', Clinical Endocrinology, vol.
66, no. 3, pp. 419-25.
Maple-Brown, L, Cunningham, J, Hodge, A, Weeramanthri, T, Dunbar, T, Lawton,
P, Zimmet, P, Chadban, S, Polkinghorne, K, Shaw, J & O'Dea, K 2011, 'High rates
of albuminuria but not of low eGFR in Urban Indigenous Australians: the DRUID
Study', BMC Public Health, vol. 11, no. 1, p. 346.
Maple-Brown, L, Lawton, P, Hughes, J, Sharma, S, Jones, G, Ellis, A, Hoy, W, Cass,
A, Macisaac, R, Sinha, A, Thomas, M, Piers, L, Ward, L, Drabsch, K,
Panagiotopoulos, S, McDermott, R, Warr, K, Cherian, S, Brown, A, Jerums, G &
O'Dea, K 2010b, 'Study Protocol-accurate assessment of kidney function in
Indigenous Australians: aims and methods of the eGFR study', BMC Public Health,
vol. 10, p. 80.
Maple-Brown, LJ, Cunningham, J, Barry, RE, Leylsey, L, O'Rourke, MF,
Celermajer, DS & O'Dea, K 2009, 'Impact of dyslipidaemia on arterial structure and
function in urban Indigenous Australians', Atherosclerosis, vol. 202, no. 1, pp. 248-
54.
Masharawi, Y, Salame, K, Mirovsky, Y, Peleg, S, Dar, G, Steinberg, N &
Hershkovitz, I 2008, 'Vertebral body shape variation in the thoracic and lumbar
spine: Characterization of its asymmetry and wedging', Clinical Anatomy, vol. 21,
no. 1, pp. 46-54.
Mathew, TH, Johnson, DW & Jones, GR 2007, 'Chronic kidney disease and
automatic reporting of estimated glomerular filtration rate: revised
recommendations', The Medical Journal of Australia, vol. 187, no. 8, pp. 459-63.
Matthews, D, Hosker, J, Rudenski, A, Naylor, B, Treacher, D & Turner, R 1985,
'Homeostasis model assessment: Insulin resistance and beta cell function from
284
fasting plasma glucose and nsulin concentrations in man.', Diabetologia, vol. 28, pp.
412-9.
Mauras, N, DelGiorno, C, Kollman, C, Bird, K, Morgan, M, Sweeten, S, Balagopal,
P & Damaso, L 2010, 'Obesity without Established Comorbidities of the Metabolic
Syndrome Is Associated with a Proinflammatory and Prothrombotic State, Even
before the Onset of Puberty in Children', The Journal of Clinical Endocrinology and
Metabolism, vol. 95, no. 3, pp. 1060-8.
Maury, E & Brichard, SM 2010, 'Adipokine dysregulation, adipose tissue
inflammation and metabolic syndrome', Molecular and Cellular Endocrinology, vol.
314, no. 1, pp. 1-16.
McDermott, R, O’Dea, K & Rowley, K 1998, 'Beneficial impact of the homelands
movement on health outcomes in central Australian Aborigines', Australian and New
Zealand Journal of Public Health, vol. 22, no. 6, pp. 653-8.
McDermott, RA, Tulip, F & Schmidt, B 2004, 'Diabetes care in remote northern
Australian Indigenous communities', The Medical Journal of Australia, vol. 180, no.
10, pp. 512 - 6.
McDonald, S 2010, 'Incidence and treatment of ESRD among indigenous people of
Australasia', Clinical Nephrology, vol. 73, no. S1, pp. S28-S31.
McDonald, S, Maguire, G, Duarte, N, Wang, XL & Hoy, W 2004, 'C-reactive
protein, cardiovascular risk, and renal disease in a remote Australian Aboriginal
community', Clinical Science, vol. 106, no. 2, pp. 121-8.
McMillan, A 2007, 'An Intruders Guide to East Arnhem Land', in S Niblock (ed.),
Niblock Publishing, Nightcliff, pp. 22-5.
Mendham, AE, Coutts, AJ & Duffield, R 2012, 'The acute effects of aerobic exercise
and modified rugby on inflammation and glucose homeostasis within Indigenous
Australians.', European Journal of Applied Physiology, vol. 112, no. 11, pp. 3787-95.
285
Mente, A, Razak, F, Blankenberg, S, Vuksan, V, Davis, AD, Miller, R, Teo, K,
Gerstein, H, Sharma, AM, Yusuf, S, Anand, SS, Assessment, ftSoH, Evaluation, R &
Investigators, SiAP 2010, 'Ethnic Variation in Adiponectin and Leptin Levels and
Their Association With Adiposity and Insulin Resistance', Diabetes Care, vol. 33,
no. 7, pp. 1629-34.
Messier, V, Karelis, AD, Prud'homme, D, Primeau, V, Brochu, M & Rabasa-Lhoret,
R 2010, 'Identifying Metabolically Healthy but Obese Individuals in Sedentary
Postmenopausal Women', Obesity, vol. 18, no. 5, pp. 911-7.
Moffatt, RJ & Owens, SG 1991, 'Cessation from cigarette smoking: Changes in body
weight, body composition, resting metabolism, and energy consumption',
Metabolism, vol. 40, no. 5, pp. 465-70.
Mohamed-Ali, V, Goodrick, S, Rawesh, A, Katz, DR, Miles, JM, Yudkin, JS, Klein,
S & Coppack, SW 1997, 'Subcutaneous Adipose Tissue Releases Interleukin-6, But
Not Tumor Necrosis Factor-α, in Vivo', The Journal of Clinical Endocrinology and
Metabolism, vol. 82, no. 12, pp. 4196-200.
Moore, L, Lloyd, M, Pugsley, D & Seymour, A 1996, 'Renal Disease in the
Australian Aboriginal population: a pathological study', Nephrology, vol. 2, pp. 315-
21.
Morrissey, P 2001, 'Torres Strait Islands', in S Singh, D Andrew, B Andy, M Choy,
H Finlay, P Greenway, K Kenny, P Morriey, D O'Byrne & B Scott (eds), Aboriginal
Australia and the Torres Strait Islands: guide to Indigenous Australia, 1 edn, Lonely
Planet Publications, Melbourne, pp. 335-50.
Navaneethan, SD, Yehnert, H, Moustarah, F, Schreiber, MJ, Schauer, PR & Beddhu,
S 2009, 'Weight Loss Interventions in Chronic Kidney Disease: A Systematic
Review and Meta-analysis', Clinical Journal of the American Society of Nephrology,
vol. 4, no. 10, pp. 1565-74.
286
Norata, GD, Ongari, M, Garlaschelli, K, Raselli, S, Grigore, L & Catapano, AL
2007, 'Plasma resistin levels correlate with determinants of the metabolic syndrome',
European Journal of Endocrinology, vol. 156, no. 2, pp. 279-84.
Norgan, N 1994, 'Interpretation of Low Body Mass Indices: Australian Aborigines',
American Journal of Physical Anthropology, vol. 94, pp. 229-37.
Norgan, NG & Jones, PR 1995, 'The effect of standardising the body mass index for
relative sitting height', International Journal of Obesity, vol. 19, no. 3, pp. 206-8.
O'Dea, K 1984, 'Marked improvement in carbohydrate and lipid metabolism in
diabetic Australian aborigines after temporary reversion to traditional lifestyle',
Diabetes, vol. 33, no. 6, pp. 596-603.
O'Dea, K, Cunningham, J, Maple-Brown, L, Weeramanthri, T, Shaw, J, Dunbar, T &
Zimmet, P 2008, 'Diabetes and cardiovascular risk factors in urban Indigenous
adults: Results from the DRUID study', Diabetes Research and Clinical Practice,
vol. 80, no. 3, pp. 483-9.
O'Dea, K, Lion, RJ, Lee, A, Traianedes, K, Hopper, JL & Rae, C 1990, 'Diabetes,
hyperinsulinemia, and hyperlipidemia in small aboriginal community in northern
Australia', Diabetes Care, vol. 13, no. 8, pp. 830-5.
O'Dea, K, Patel, M, Kubisch, D, Hopper, J & Traianedes, K 1993, 'Obesity, diabetes,
and hyperlipidemia in a central Australian aboriginal community with a long history
of acculturation', Diabetes Care, vol. 16, no. 7, pp. 1004-10.
O'Dea, K, Spargo, R & Akerman, K 1980, 'The effect of transition from traditional to
urban life-style on the insulin secretory response in Australian Aborigines', Diabetes
Care, vol. 3, no. 1, pp. 31-7.
O'Dea, K, Traianedes, K, Hooper, J & Larkins, R 1988, 'Impaired glucose tolerance,
hyperinsulinaemia, and hypertriglyceridaemia in Australian Aborigines from the
desert.', Diabetes Care, vol. 11, no. 1, pp. 23-9.
287
O'Neal, DN, Piers, LS, Iser, DM, Rowley, KG, Jenkins, AJ, Best, JD & O'Dea, K
2008, 'Australian Aboriginal people and Torres Strait Islanders have an atherogenic
lipid profile that is characterised by low HDL-cholesterol level and small LDL
particles', Atherosclerosis, vol. 201, no. 2, pp. 368-77.
O’Dea, K, Spargo, R & Nestel, P 1982, 'Impact of Westernization on Carbohydrate
and Lipid Metabolism in Australian Aborigines', Diabetologia, vol. 22, pp. 148-53.
O’Dea, K, White, N & Sinclair, A 1988, 'An investigation of nutrition-related fators
in an isolated Aboriginal community in Northern Australia: advantages of a
traditionally-oriented life-style', The Medical Journal of Australia, vol. 148, pp. 177-
80.
Ohrvall, M, Berglund, L & Vessby, B 2000, 'Sagittal abdominal diameter compared
with other anthropometric measurements in relation to cardiovascular risk',
International Journal of Obesity, vol. 24, no. 4, pp. 497-501.
Onat, A, Can, G & Hergenç, G 2008, 'Serum C-reactive protein is an independent
risk factor predicting cardiometabolic risk', Metabolism, vol. 57, no. 2, pp. 207-14.
Paradies, YC, Montoya, MJ & Fullerton, SM 2007, 'Racialized genetics and the
study of complex diseases: the thrifty genotype revisited', Perspectives in Biology
and Medicine, vol. 50, no. 2, pp. 203-27.
Park, H-K, Qatanani, M, Briggs, ER, Ahima, RS & Lazar, MA 2011, 'Inflammatory
Induction of Human Resistin Causes Insulin Resistance in Endotoxemic Mice',
Diabetes, vol. 60, no. 3, pp. 775-83.
Pavenstädt, H, Kriz, W & Kretzler, M 2003, 'Cell Biology of the Glomerular
Podocyte', Physiological Reviews, vol. 83, no. 1, pp. 253-307.
288
Peake, P & Shen, Y 2010, 'Factor H binds to the N-terminus of adiponectin and
modulates complement activation', Biochemical and Biophysical Research
Communications, vol. 397, no. 2, pp. 361-6.
Peake, PW, Kriketos, AD, Campbell, LV, Shen, Y & Charlesworth, JA 2005, 'The
metabolism of isoforms of human adiponectin: studies in human subjects and in
experimental animals', European Journal of Endocrinology, vol. 153, no. 3, pp. 409-
17.
Pearce, N, Foliaki, S, Sporle, A & Cunningham, C 2004, 'Genetics, race, ethnicity,
and health', British Medical Journal, vol. 328, no. 7447, p. 1070(3).
Petersen, AMW & Pedersen, BK 2005, 'The anti-inflammatory effect of exercise',
Journal of Applied Physiology, vol. 98, no. 4, pp. 1154-62.
Piers, LS, Rowley, KG, Soares, MJ & O'Dea, K 2003, 'Relation of adiposity and
body fat distribution to body mass index in Australians of Aboriginal and European
ancestry', European Journal of Clinical Nutrition, vol. 57, no. 8, pp. 956-63.
Pineau, J-C, Filliard, JR & Bocquet, M 2009, 'Ultrasound Techniques Applied to
Body Fat Measurement in Male and Female Athletes', Journal of Athletic Training,
vol. 44 no. 2, pp. 142-7.
Pischon, T, Boeing, H, Hoffmann, K, Bergmann, M, Schulze, MB, Overvad, K, van
der Schouw, YT, Spencer, E, Moons, KGM, Tjonneland, A, Halkjaer, J, Jensen, MK,
Stegger, J, Clavel-Chapelon, F, Boutron-Ruault, MC, Chajes, V, Linseisen, J, Kaaks,
R, Trichopoulou, A, Trichopoulos, D, Bamia, C, Sieri, S, Palli, D, Tumino, R,
Vineis, P, Panico, S, Peeters, PHM, May, AM, Bueno-de-Mesquita, HB, van
Duijnhoven, FJB, Hallmans, G, Weinehall, L, Manjer, J, Hedblad, B, Lund, E,
Agudo, A, Arriola, L, Barricarte, A, Navarro, C, Martinez, C, Quiros, JR, Key, T,
Bingham, S, Khaw, KT, Boffetta, P, Jenab, M, Ferrari, P & Riboli, E 2008, 'General
and Abdominal Adiposity and Risk of Death in Europe', The New England Journal
of Medicine, vol. 359, no. 20, pp. 2105-20.
289
Preston-Thomas, A, Cass, A & O'Rourke, P 2007, 'Trends in the incidence of treated
end-stage kidney disease among Indigenous Australians and access to treatment',
Australian and New Zealand Journal of Public Health, vol. 31, no. 5, pp. 419-21.
Rabkin, R, Ryan, M & Duckworth, W 1984, 'The renal metabolism of insulin',
Diabetologia, vol. 27, no. 3, pp. 351-7.
Raja, C, Hansen, RD, Colagiuri, S & Allen, BJ 2003, 'Body composition of
Aboriginal Australian women: comparison with age-matched Caucasians', Acta
Diabetologica, vol. 40, no. 0, pp. s314-s6.
Ray, SH 2003, Dictionary of Torres Strait Languages, 3 edn, The Rams Skull Press,
Kuranda. pp 6,8.
Reaven, G 1988, 'Banting Lecture 1988. Role of insulin resistance in human disease',
Diabetes, vol. 37, pp. 1595-607.
Rebbeck, TR & Sankar, P 2005, 'Ethnicity, Ancestry, and Race in Molecular
Epidemiologic Research', Cancer Epidemiology Biomarkers and Prevention, vol. 14,
no. 11, pp. 2467-71.
Ridker, PM, Buring, JE, Shih, J, Matias, M & Hennekens, CH 1998, 'Prospective
Study of C-Reactive Protein and the Risk of Future Cardiovascular Events Among
Apparently Healthy Women', Circulation, vol. 98, no. 8, pp. 731-3.
Ridker, PM, Rifai, N, Rose, L, Buring, JE & Cook, NR 2002, 'Comparison of C-
Reactive Protein and Low-Density Lipoprotein Cholesterol Levels in the Prediction
of First Cardiovascular Events', The New England Journal of Medicine, vol. 347, no.
20, pp. 1557-65.
Roberts, DF 1953, 'Body weight, race and climate', American Journal of Physical
Anthropology, vol. 11, no. 4, pp. 533-58.
290
Rogers, N, Lawton, P & Jose, M 2006, 'Kidney Transplant Outcomes in the
Indigenous Population in the Northern Territory of Australia', Transplantation, vol.
82, no. 7, pp. 882-6.
Rossi, I, Bochud, M, Bovet, P, Paccaud, F, Waeber, G, Vollenweider, P & Taffé, P
2012, 'Sex difference and the role of leptin in the association between high-
sensitivity C-reactive protein and adiposity in two different populations', European
Journal of Epidemiology, pp. 1-6.
Rowley, K, Walker, KZ, Cohen, J, Jenkins, AJ, O'Neal, D, Su, Q, Best , JD & O'Dea,
K 2003, 'Inflammation and vascular endothelial activation in an Aboriginal
population: relationships to coronary disease risk factors and nutritional markers',
The Medical Journal of Australia, vol. 178, no. 10, pp. 495-500.
Rowley, KG, Best, JD, McDermott, R, Green, EA, Piers, LS & O'Dea, K 1997,
'Insulin resistance syndrome in Australian Aboriginal people. Proceedings of the
Australian Physiological and Pharmacological Society Symposium: Diabetes',
Clinical and Experimental Pharmacology and Physiology, vol. 24, no. 9-10, pp. 776-
81.
Rowley, KG, Iser, DM, Best, JD, O'Dea, K, Leonard, D & McDermott, R 2000,
'Albuminuria in Australian Aboriginal people: prevalence and associations with
components of the metabolic syndrome', Diabetologia, vol. 43, no. 11, pp. 1397-403.
Rowley, KG, O'Dea, K, Anderson, I, McDermott, R, Saraswati, K, Tilmouth, R,
Roberts, I, Fitz, J, Wang, Z, Jenkins, A, Best, JD, Wang, Z & Brown, A 2008,
'Lower than expected morbidity and mortality for an Australian Aboriginal
population: 10-year follow-up in a decentralised community', The Medical Journal of
Australia, vol. 188, no. 5, pp. 283-7.
Ruggieri, G & Rocca, AR 2010, 'Analysis of Past and Present Methods of Measuring
and Estimating Body Surface Area and the Resulting Evaluation of Its Doubtful
Suitability to Universal Application', Blood Purification, vol. 30, no. 4, pp. 296-305.
291
Rutishauser, I & McKay, H 1986, 'Anthropometric status and body composition in
Aboriginal women of the Kimberley region', The Medical Journal of Australia, vol.
144, pp. S8-10.
Sala, A, Webber, C, Halton, J, Morrison, J, Beaumont, L, Zietak, A & Barr, R 2006,
'Effect of Diagnostic Radioisotopes and Radiographic Contrast Media on
Measurements of Lumbar Spine Bone Mineral Density and Body Composition by
Dual-Energy X-Ray Absorptiometry', Journal of Clinical Densitometry, vol. 9, no. 1,
pp. 91-6.
Samocha-Bonet, D, Campbell, LV, Viardot, A, Freund, J, Tam, CS, Greenfield, JR &
Heilbronn, LK 2010, 'A family history of type 2 diabetes increases risk factors
associated with overfeeding', Diabetologia, vol. 53, pp. 1700-8.
Saudek, CD, Herman, WH, Sacks, DB, Bergenstal, RM, Edelman, D & Davidson,
MB 2008, 'A New Look at Screening and Diagnosing Diabetes Mellitus', The
Journal of Clinical Endocrinology and Metabolism, vol. 93, no. 7, pp. 2447-53.
Scholler, D, Tylavsky, F, Baer, D, Chumlea, W, Earthman, C, Fuerst, T, Harris, T,
Heymsfield, S, Horlick, M, Lohman, T, Lukaski, H, Shepherd, J, Siervogel, R &
Borrud, L 2005, 'QDR 4500A dual-energy X-ray absorptiometer underestimates fat
mass in comparison with criterion methods in adults', The American Journal of
Clinical Nutrition, vol. 81, pp. 1018-28.
Segal, K, Van Loan, M, Fitzgerald, P, Hodgdon, J & Van Itallie, T 1988, 'Lean body
mass estimation by bioelectrical impedance analysis: a four- site cross-validation
study', The American Journal of Clinical Nutrition, vol. 47, no. 1, pp. 7-14.
Seidell, J, Arie Oosterlee, Martin AO Thijssen, Burema, J, Deurenberg, P, Hautvast,
JG & Ruzjs, JH 1987, 'Assessment of intra-abdominal and subcutaneous abdominal
fat: relation between anthropometry and computed tomography', The American
Journal of Clinical Nutrition, vol. 45, pp. 7-13.
292
Seidell, JC, Perusse, L, Despres, J-P & Bouchard, C 2001, 'Waist and hip
circumferences have independent and opposite effects on cardiovascular disease risk
factors: the Quebec Family Study', The American Journal of Clinical Nutrition, vol.
74, no. 3, pp. 315-21.
Selvin, E, Steffes, MW, Gregg, E, Brancati, FL & Coresh, J 2011, 'Performance of
A1C for the Classification and Prediction of Diabetes', Diabetes Care, vol. 34, no. 1,
pp. 84-9.
Shah, A, Mehta, N & Reilly, MP 2008, 'Adipose Inflammation, Insulin Resistance,
and Cardiovascular Disease', Journal of Parenteral Enteral Nutrition, vol. 32, no. 6,
pp. 638-44.
Shanawani, H, Dame, L, Schwartz, DA & Cook-Deegan, R 2006, 'Non-reporting and
inconsistent reporting of race and ethnicity in articles that claim associations among
genotype, outcome, and race or ethnicity', Journal of Medical Ethics, vol. 32, no. 12,
pp. 724-8.
Sharma, K, Ramachandra Rao, S, Qiu, G, Usui, HK, Zhu, Y, Dunn, SR, Ouedraogo,
R, Hough, K, McCue, P, Chan, L, Falkner, B & Goldstein, B 2008, 'Adiponectin
regulates albuminuria and podocyte function in mice ', The Journal of Clinical
Investigation, vol. 118, no. 5, pp. 1645-56.
Shemesh, T, Rowley, K, Jenkins, A, Best, J & O'Dea, K 2009, 'C-reactive protein
concentrations are very high and more stable over time than traditional vascular risk
factors total cholesterol and systolic blood pressure in an Australian Aboriginal
cohort', Clinical Chemistry, vol. 55, no. 2, pp. 336-41.
Shemesh, T, Rowley, KG, Jenkins, A, Brimblecombe, J, Best, JD & O'Dea, K 2007,
'Differential association of C-reactive protein with adiposity in men and women in an
Aboriginal community in northeast Arnhem Land of Australia', International Jounal
of Obesity, vol. 31, no. 1, pp. 103-8.
293
Shemesh, T, Rowley, KG, Piers, LS, Best, JD & O'Dea, K 2008, 'Low high-density
lipoprotein-cholesterol is the most prevalent metabolic abnormality for Australian
Aboriginal men and women even when lean', European Journal of Cardiovascular
Prevention & Rehabilitation, vol. 15, no. 1, pp. 49-51.
Shen, Y, Peake, PW & Kelly, JJ 2005, 'Should we quantify insulin resistance in
patients with renal disease? (Review Article)', Nephrology, vol. 10, no. 6, pp. 599-
605.
Shen, YY, Charlesworth, JA, Kelly, JJ, Loi, KW & Peake, PW 2007a, 'Up-regulation
of adiponectin, its isoforms and receptors in end-stage kidney disease', Nephrology
Dialysis Transplantation, vol. 22, no. 1, pp. 171-8.
Shen, YY, Charlesworth, JA, Kelly, JJ & Peake, PW 2007b, 'The effect of renal
transplantation on adiponectin and its isoforms and receptors', Metabolism: Clinical
And Experimental, vol. 56, no. 9, pp. 1201-8.
Shen, YY, Hughes, JT, Charlesworth, JA, Kelly, JJ & Peake, PW 2008, 'Adiponectin
is present in the urine in its native conformation, and specifically reduces the
secretion of MCP-1 by proximal tubular cells', Nephrology, vol. 13, no. 5, pp. 405-
10.
Shnukal, A 2001, 'Torres Strait Islanders', in M Brandle (ed.), Multicultural
Queensland 2001, Multicultural Affairs Queensland, Brisbane, pp. 21-35.
Silha, J, Krsek, M, Skrha, J, Sucharda, P, Nyomba, B & Murphy, L 2003, 'Plasma
resistin, adiponectin and leptin levels in lean and obese subjects: correlations with
insulin resistance', European Journal of Endocrinology, vol. 149, no. 4, pp. 331-5.
Silha, JV, Nyomba, BLG, Leslie, WD & Murphy, LJ 2007, 'Ethnicity, Insulin
Resistance, and Inflammatory Adipokines in Women at High and Low Risk for
Vascular Disease', Diabetes Care, vol. 30, no. 2, pp. 286-91.
294
Smith, SR, Lovejoy, JC, Greenway, F, Ryan, D, deJonge, L, de la Bretonne, J,
Volafova, J & Bray, GA 2001, 'Contributions of total body fat, abdominal
subcutaneous adipose tissue compartments, and visceral adipose tissue to the
metabolic complications of obesity', Metabolism, vol. 50, no. 4, pp. 425-35.
Snijder, MB, Dekker, JM, Visser, M, Bouter, LM, Stehouwer, CDA, Yudkin, JS,
Heine, RJ, Nijpels, G & Seidell, JC 2004a, 'Trunk Fat and Leg Fat Have Independent
and Opposite Associations With Fasting and Postload Glucose Levels: The Hoorn
Study', Diabetes Care, vol. 27, no. 2, pp. 372-7.
Snijder, MB, Kuyf, BEM & Deurenberg, P 1999, 'Effect of Body Build on the
Validity of Predicted Body Fat from Body Mass Index and Bioelectrical Impedence',
Annals of Nutrition and Metabolism, vol. 43, no. 5, pp. 277-85.
Snijder, MB, Zimmet, PZ, Visser, M, Dekker, JM, Seidell, JC & Shaw, JE 2004b,
'Independent Association of Hip Circumference with Metabolic Profile in Different
Ethnic Groups', Obesity Research, vol. 12, no. 9, pp. 1370-4.
Spencer, M, Unal, R, Zhu, B, Rasouli, N, McGehee, RE, Peterson, CA & Kern, PA
2011, 'Adipose Tissue Extracellular Matrix and Vascular Abnormalities in Obesity
and Insulin Resistance', The Journal of Clinical Endocrinology and Metabolism, vol.
96, no. 12, pp. E1990-E8.
Steichen, T & Cox, N 1998, 'Concordance correlation coefficient', in H Newton (ed.),
Stata Technical Bulletin 43: 35-38, Texas.
Steppan, CM, Shannon, T, Bhat, S, Brown, E, Banerjee, R, Wright, C, Patel, H,
Ahima, R & Lazar, M 2001, 'The hormone resistin links obesity to diabetes', Nature,
vol. 409, no. 6818, pp. 307-12.
Suter, PM, Hasler, E & Vetter, W 1997, 'Effects of Alcohol on Energy Metabolism
and Body Weight Regulation: Is Alcohol a Risk Factor for Obesity?', Nutrition
Reviews, vol. 55, no. 5, pp. 157-71.
295
Swinburn, BA, Nyomba, BL, Saad, MF, Zurlo, F, Raz, I, Knowler, WC, Lilloja, S,
Bogardus, C & Ravussin, E 1991, 'Insulin resistance associated with lower rates of
weight gain in Pima Indians', The Journal of Clinical Investigation, vol. 88, no. 1,
pp. 168-73.
Tan, J, Martin, A, Kearns, P, Smythe, Z, Fitzpatrick, J & Siafarikas, A 2010,
'Vitamin D Deficiency in Aboriginal Children and Adolescents in Metropolitan and
Rural Western Australia', Journal of Paediatrics and Child Health, vol. 46, no. s2, p.
14.
Tapp, R, Shaw, J, Zimmet, P, Balkau, B, Chadban, S, Tonkin, A, Welborn, T &
Atkins, R 2004, 'Albuminuria is evident in the early stages of diabetes onset: results
from the Australian Diabetes, Obesity, and Lifestyle Study (AusDiab)', American
Journal of Kidney Diseases, vol. 44, pp. 792 - 8.
Taylor, TP, Wang, W, Shrayyef, MZ, Cheek, D, Hutchison, FN & Gadegbeku, CA
2006, Glomerular filtration rate can be accurately predicted using lean mass
measured by dual-energy X-ray absorptiometry, 1, January 1, 2006,
<http://ndt.oxfordjournals.org/cgi/content/abstract/21/1/84 >.
Thoenes, M, Reil, JC, Khan, BV, Bramlage, P, Volpe, M, Kirch, W & Böhm, M
2009, 'Abdominal obesity is associated with microalbuminuria and an elevated
cardiovascular risk profile in patients with hypertension', Vascular Health and Risk
Management, vol. 5, pp. 577-85.
Thomas, B, Cornish, B & Ward, L 1992, 'Bioelectrical impedance analysis for
measurement of body fluid volumes: a review.', Journal of Clinical Engineering, vol.
17, no. 6, pp. 505-10.
Tietz, N 1990, Clinical guide to laboratory tests, 2nd edn, Saunders, Philadelphia.
pp. 166-7.
Tomaszewski, M, Charchar, F, Maric, C, McClure, J, Crawford, L, Grzeszczak, W,
Sattar, N, Zukowska-Szczechowska, E & Dominiczak, A 2007, 'Glomerular
296
Hyperfiltration: A new marker of metabolic syndrome', Kidney International, vol.
71, no. 8, pp. 816-21.
Vague, J 1956, 'The Degree of Masculine Differentiation of Obesities: A factor
determining predisposition to diabetes, atherosclerosis, gout, and uric calculous
disease', The American Journal of Clinical Nutrition, vol. 4, no. 1, pp. 20-34.
Valentin, J 2002, 'Basic anatomical and physiological data for use in radiological
protection: reference values: ICRP Publication 89', Annals of the International
Commission on Radiological Protection, vol. 32, no. 3, pp. 1-277.
Valery, PC, Moloney, A, Cotterill, A, Harris, M, Sinha, AK & Green, AC 2008,
'Prevalence of obesity and metabolic syndrome in Indigenous Australian youths',
Obesity Reviews, vol. 10, pp. 255-61.
Vanlint, S, Morris, H, Newbury, J & Crockett, A 2011, 'Vitamin D insufficiency in
Aboriginal Australians', The Medical Journal of Australia, vol. 194, no. 3, pp. 131-4.
Vos, T, Barker, B, Begg, S, Stanley, L & Lopez, AD 2009, 'Burden of disease and
injury in Aboriginal and Torres Strait Islander Peoples: the Indigenous health gap',
International Journal of Epidemiology, vol. 38, no. 2, pp. 470-7.
Vos, T, Barker, B, Stanley, L & Lopez, A 2007, The Burden of Disease and Injury in
Aboriginal and Torres Strait Islander Peoples 2003, University of Queensland,
Brisbane.
Wang, Y, Chen, X, Song, Y, Caballero, B & Cheskin, LJ 2007, 'Association between
obesity and kidney disease: A systematic review and meta-analysis', Kidney
International, vol. 73, no. 1, pp. 19-33.
Wang, Z & Hoy, WE 2003, 'Hypertension, dyslipidaemia, body mass index, diabetes
and smoking status in Aboriginal Australians in a remote community', Ethnicity and
Disease, vol. 13, no. Summer, pp. 324-30.
297
Wang, Z, Pierson, R & Heymsfield, S 1992, 'The five-level model: a new approach
to organizing body-composition research', The American Journal of Clinical
Nutrition, vol. 56, no. 1, pp. 19-28.
Wang, Z, Rowley, K, Wang, Z, Piers, L & O'Dea, K 2006, 'Anthropometric indices
and their relationship with diabetes, hypertension and dyslipidemia in Australian
Aboriginal people and Torres Strait Islanders', European Journal of Cardiovascular
Prevention and Rehabilitation, vol. 14, no. 2, pp. 172-8.
Wannamethee, SG & Shaper, AG 2003, 'Alcohol, body weight, and weight gain in
middle-aged men', The American Journal of Clinical Nutrition, vol. 77, no. 5, pp.
1312-7.
Wei, P, Lane, P, Lane, J, Padanilam, B & Sansom, S 2004, 'Glomerular structural
and functional changes in a high-fat diet mouse model of early-stage Type 2
diabetes', Diabetologia, vol. 47, no. 9, pp. 1541-9.
Weil, E, Curtis, J, Hanson, R, Knowler, W & Nelson, R 2010, 'The impact of
disadvantage on the development and progression of diabetic kidney disease',
Clinical Nephrology, vol. 74, no. S1/2010, pp. S32-S8.
Wiecek, A, Adamczak, M & Chudek, J 2007, 'Adiponectin-an adipokine with unique
metabolic properties', Nephrology Dialysis Transplantation, vol. 22, no. 4, pp. 981-8.
Williams, DR, Moffitt, PS, Fisher, JS & Bashir, HV 1987, 'Diabetes and glucose
tolerance in New South Wales coastal Aborigines: possible effects of non-Aboriginal
genetic admixture', Diabetologia, vol. 30, no. 2, pp. 72-7.
Wilson, PWF, D'Agostino, RB, Levy, D, Belanger, AM, Silbershatz, H & Kannel,
WB 1998, 'Prediction of Coronary Heart Disease Using Risk Factor Categories',
Circulation, vol. 97, no. 18, pp. 1837-47.
Winker, MA 2004, 'Measuring Race and Ethnicity: Why and How?', The Journal of
the American Medical Association, vol. 292, no. 13, pp. 1612-4.
298
Wolf, G, Chen, S, Han, DC & Ziyadeh, FN 2002, 'Leptin and renal disease',
American Journal of Kidney Diseases, vol. 39, no. 1, pp. 1-11.
Wolsk, E, Mygind, H, Grondahl, TS, Pedersen, BK & van Hall, G 2010, 'IL-6
selectively stimulates fat metabolism in human skeletal muscle', Amercian Journal of
Physiology Endocrinology and Metabolism, vol. 299, no. 5, pp. E832-40.
Yajnik, C, Joglekar, C, Lubree, H, Rege, S, Naik, S, Bhat, D, Uradey, B, Raut, K,
Shetty, P & Yudkin, J 2008, 'Adiposity, inflammation and hyperglycaemia in rural
and urban Indian men: Coronary Risk of Insulin Sensitivity in Indian Subjects
(CRISIS) Study', Diabetologia, vol. 51, no. 1, pp. 39-46.
Yim, J, Kim, D, Lim, S, Park, M, Choi, S, Lee, C, Kim, S & Cho, S 2010, 'Sagittal
Abdominal Diameter Is a Strong Anthropometric Measure of Visceral Adipose
Tissue in the Asian General Population', Diabetes Care, vol. 33, no. 12, pp. 2665-70.
Yki-Jarvinen, H, Koivisto, VA & Karonen, SL 1985, 'Influence of body composition
on insulin clearance', Clinical Physiology, vol. 5, no. 1, pp. 45-52.
Yudkin, JS, Stehouwer, CDA, Emeis, JJ & Coppack, SW 1999, 'C-Reactive Protein
in Healthy Subjects: Associations With Obesity, Insulin Resistance, and Endothelial
Dysfunction : A Potential Role for Cytokines Originating From Adipose Tissue?',
Arteriosclerosis, Thrombosis, and Vascular Biology, vol. 19, no. 4, pp. 972-8.
Yusuf, S, Hawken, S, Ôunpuu, S, Dans, T, Avezum, A, Lanas, F, McQueen, M,
Budaj, A, Pais, P, Varigos, J & Lisheng, L 2004, 'Effect of potentially modifiable
risk factors associated with myocardial infarction in 52 countries (the
INTERHEART study): case-control study', The Lancet, vol. 364, no. 9438, pp. 937-
52.
Zoccali, C, Mallamaci, F, Tripepi, G, Benedetto, FA, Cutrupi, S, Parlongo, S,
Malatino, LS, Bonanno, G, Seminara, G, Rapisarda, F, Fatuzzo, P, Buemi, M,
Nicocia, G, Tanaka, S, Ouchi, N, Kihara, S, Funahashi, T & Matsuzawa, Y 2002,
299
'Adiponectin, Metabolic Risk Factors, and Cardiovascular Events among Patients
with End-Stage Renal Disease', Journal of the American Society of Nephrology, vol.
13, no. 1, pp. 134-41.
Zou, C & Shao, J 2008, 'Role of adipocytokines in obesity-associated insulin
resistance', The Journal of Nutritional Biochemistry, vol. 19, no. 5, pp. 277-86.