Embed Size (px)
Citation preview
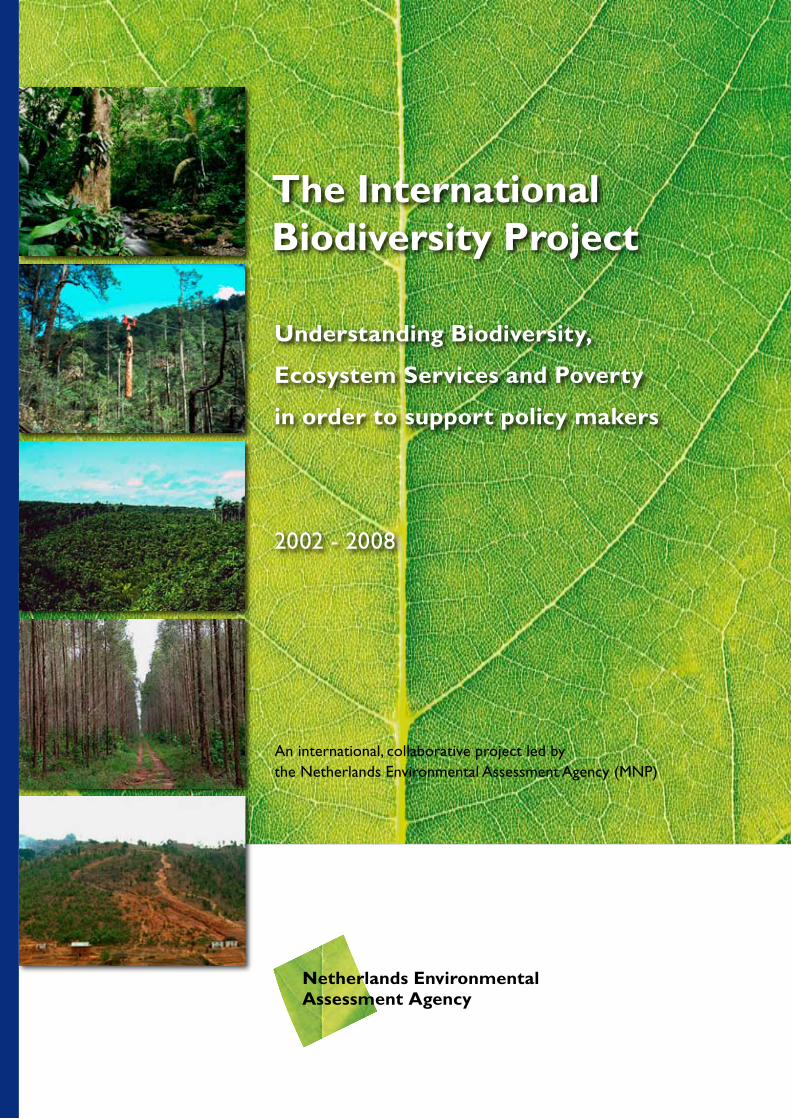
The International Biodiversity Project
Understanding Biodiversity,
Ecosystem Services and Poverty
in order to support policy makers
2002 - 2008
An international, collaborative project led by the Netherlands Environmental Assessment Agency (MNP)
2 MNP The International Biodiversity Project
The International Biodiversity Project
The problem
Biodiversity is worldwide in decline and this is affecting the goods and services that depend on vital ecosys-
tems. Goods and services in turn, influence human well-being and poverty. Policy makers take decisions on
these issues every day. However, information on impacts from policy decisions on biodiversity and ecosystem
services is usually hardly available, in contrast to information on impacts from socio-economic developments.
This hampers balanced decision making and is thus an obstacle to sustainable development.
Strong support for biodiversity-related policies
Our vision is that policy makers around the world have reliable information available on biodiversity, eco-
system services and their linkages with poverty, which they can use in their decision making. This will help
them to get a better understanding of the possible consequences of their decisions. With this vision in mind,
the ultimate goal of the International Biodiversity (IB) project is to build tools and institutional capacity for
continuous support of biodiversity-related policies such as the Convention on Biological Diversity (CBD), the
Millennium Development Goals, Poverty Reduction Strategy Papers, Socio-Economic Development Plans and
National Biodiversity Action Plans.
A toolkit of indicators, monitoring and models
In achieving our goal, we try to establish globally accepted assessment tools, including indicators, monitoring
networks and models. These tools provide information on the historical and possible future status of and
trends in biodiversity, ecosystem goods and services, and poverty. Coherence between these tools and their
applicability at national, regional and global levels is essential for consistent assessments.
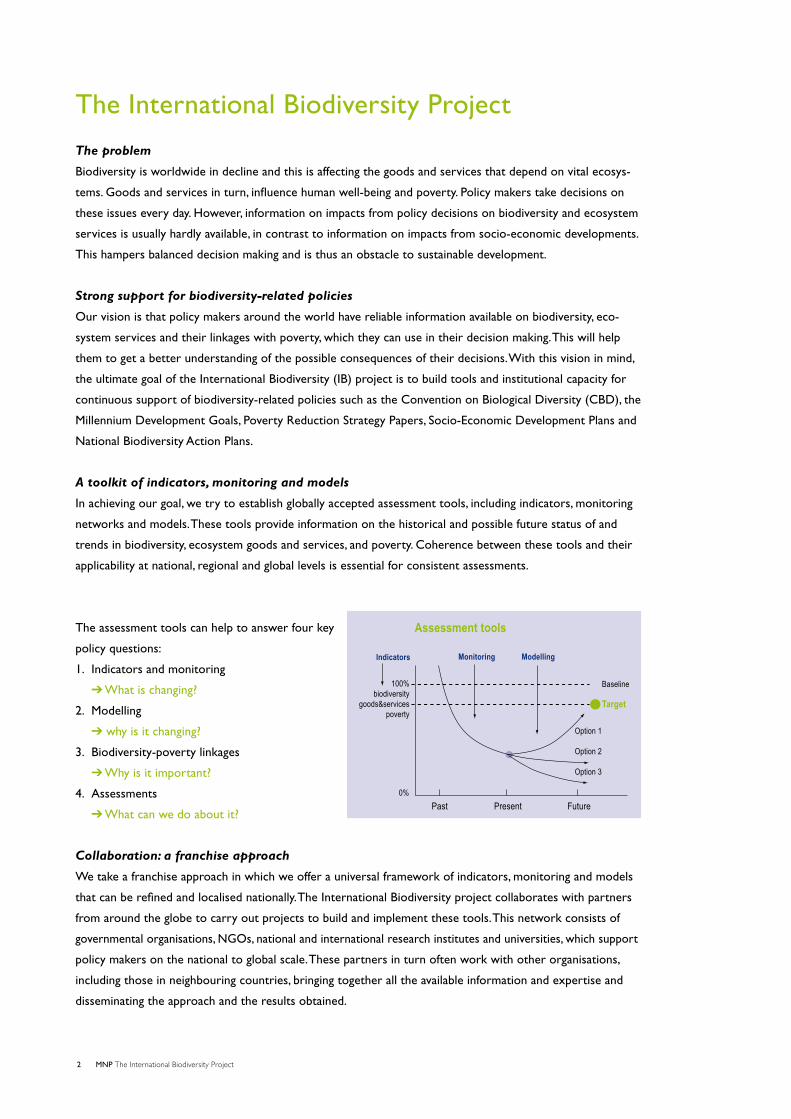
The assessment tools can help to answer four key
policy questions:
1. Indicators and monitoring
➔ What is changing?
2. Modelling
➔ why is it changing?
3. Biodiversity-poverty linkages
➔ Why is it important?
4. Assessments
➔ What can we do about it?
Collaboration: a franchise approach
We take a franchise approach in which we offer a universal framework of indicators, monitoring and models
that can be refined and localised nationally. The International Biodiversity project collaborates with partners
from around the globe to carry out projects to build and implement these tools. This network consists of
governmental organisations, NGOs, national and international research institutes and universities, which support
policy makers on the national to global scale. These partners in turn often work with other organisations,
including those in neighbouring countries, bringing together all the available information and expertise and
disseminating the approach and the results obtained.
Assessment tools
Indicators
100%biodiversity
goods&servicespoverty
0%
Past Present Future
Monitoring Modelling
Baseline
Target
Option 1
Option 2
Option 3
3 MNP The International Biodiversity Project
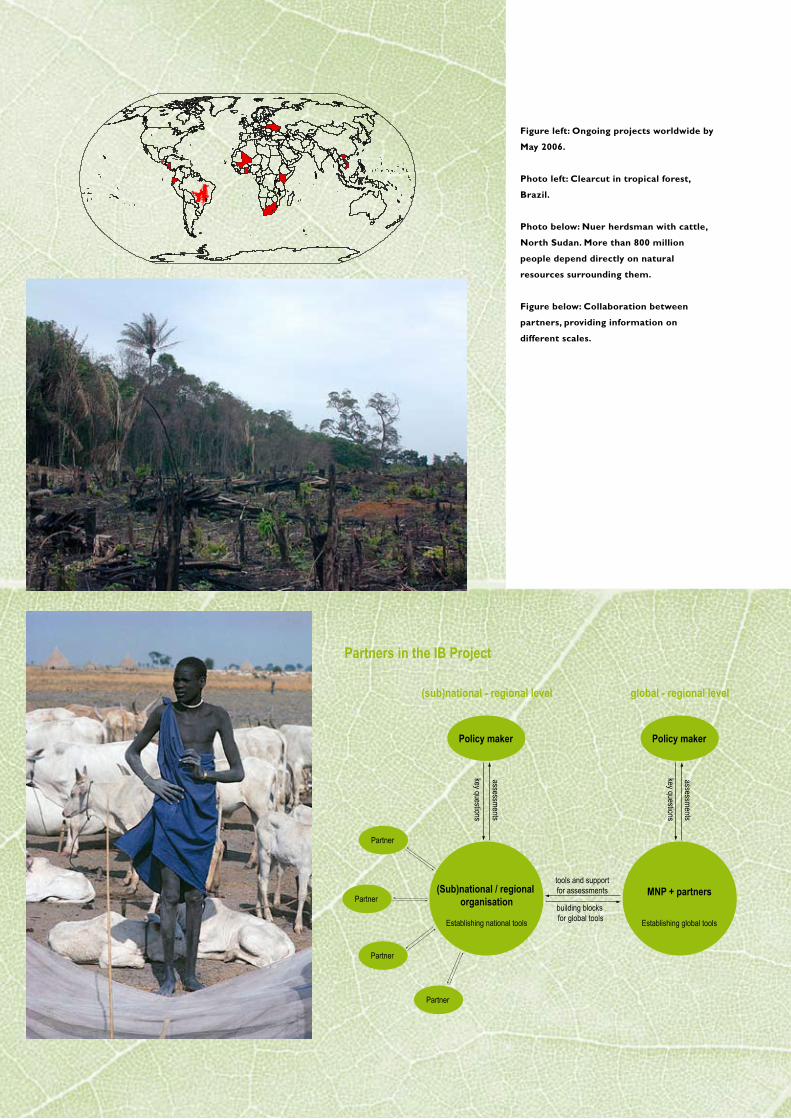
Policy maker
(Sub)national / regional organisation
Establishing national tools
(sub)national - regional level
key questions
assessments
Policy maker
MNP + partners
Establishing global tools
global - regional level
key questions
assessments
building blocks for global tools
tools and supportfor assessments
Partner
Partner
Partner
Partner
Partners in the IB Project
Figure left: Ongoing projects worldwide by
May 2006.
Photo left: Clearcut in tropical forest,
Brazil.
Photo below: Nuer herdsman with cattle,
North Sudan. More than 800 million
people depend directly on natural
resources surrounding them.
Figure below: Collaboration between
partners, providing information on
different scales.
Indicators keep track of changes in biodiversity, ecosystem goods and services and poverty in the context
of policy goals. The challenge is to create powerful, tangible indicators that accurately describe trends in bio-
diversity loss and ecosystem goods and services. Indicators should be quantitative, sensitive, affordable in use,
linkable to socio-economic scenarios and universally applicable. Once indicators have been designed, cost-
effective monitoring programmes are needed to collect data for frequent and reliable updates.
Biodiversity indicators for the 2010 target
To evaluate progress towards the 2010 target, the CBD has selected a set of headline indicators (Kuala
Lumpur 2004). This set covers a broad range of issues, including ecosystem extent, species abundance, the
status of threatened species, coverage of protected areas, sustainable use, pressures (e.g. nitrogen deposition
and alien invasions), the marine trophic index and freshwater quality. Coherence between the indicators is of
the utmost importance, as it is ultimately the set of indicators that will tell the story of biodiversity loss.
The IB project team has actively contributed to the design of this set of indicators and promoted the design
of indicators by the EU and OECD, consistent with those of the CBD.
Work has started at the global, regional and national level to implement the indicators for the 2010 target.
The IB project team is closely involved in the project 'Streamlining European Biodiversity Indicators' (SEBI),
and applies the indicators in modelling and assessments. For poverty the project team uses socio-economic
indicators related to the Millennium Development Goals, such as income, daily food intake and access to
clean water.
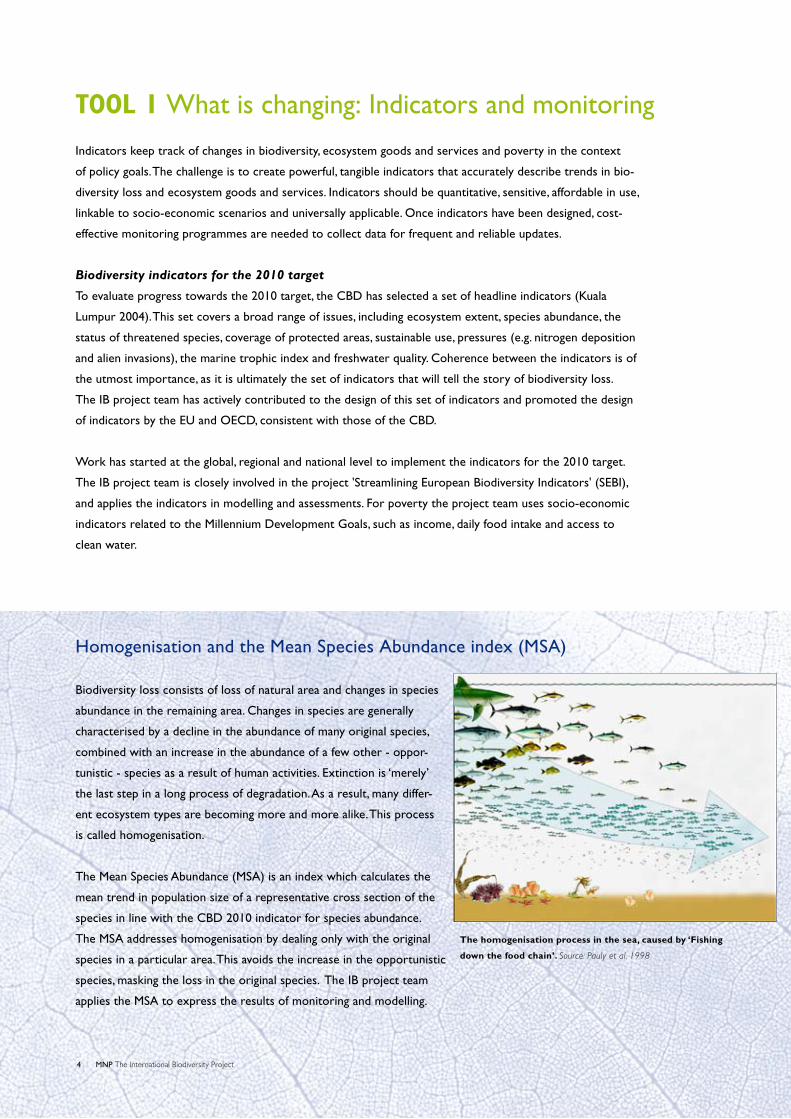
Homogenisation and the Mean Species Abundance index (MSA)
Biodiversity loss consists of loss of natural area and changes in species
abundance in the remaining area. Changes in species are generally
characterised by a decline in the abundance of many original species,
combined with an increase in the abundance of a few other - oppor-
tunistic - species as a result of human activities. Extinction is ‘merely’
the last step in a long process of degradation. As a result, many differ-
ent ecosystem types are becoming more and more alike. This process
is called homogenisation.
The Mean Species Abundance (MSA) is an index which calculates the
mean trend in population size of a representative cross section of the
species in line with the CBD 2010 indicator for species abundance.
The MSA addresses homogenisation by dealing only with the original
species in a particular area. This avoids the increase in the opportunistic
species, masking the loss in the original species. The IB project team
applies the MSA to express the results of monitoring and modelling.
4 MNP The International Biodiversity Project
The homogenisation process in the sea, caused by ‘Fishing
down the food chain’. Source: Pauly et al. 1998
TOOL 1 What is changing: Indicators and monitoring
1981 1990 2000
1,0
0,5
0
Bird trends on Lake Naivasha, KenyaIn Kenya, BINU indicators such as ‘Bird trends on Lake
Naivasha’ have supported national policies in a number of
ways, for example:
- Fishery in Lake Naivasha was stopped for one year
because of overfishing
- Indicators were used to underpin the new Kenyan
wetlands policy
- BINU results were used as input for the 2005 State of
the Environment report. Indicators are now seen as a
standard tool for reporting on the environment.
Source: Kenya Wildlife Services
In the Philippines fishing is the main livelihood and source
of protein for a large part of the population. However, the
BINU report shows that fish stocks are in decline (indicated
by a fall in the catch per unit of effort - CPUE) because
of overfishing. The findings of BINU were included in
the draft medium term industry development plan, with
protection and rehabilitation of degraded fishery habitats
as a top priority.
Once approved, the Philippines Congress will provide
funds for projects to support new policy on biodiversity.
Source: Bureau of Fisheries and Aquatic Resources, PhilippinesYear
CPU
E (m
t/hp)
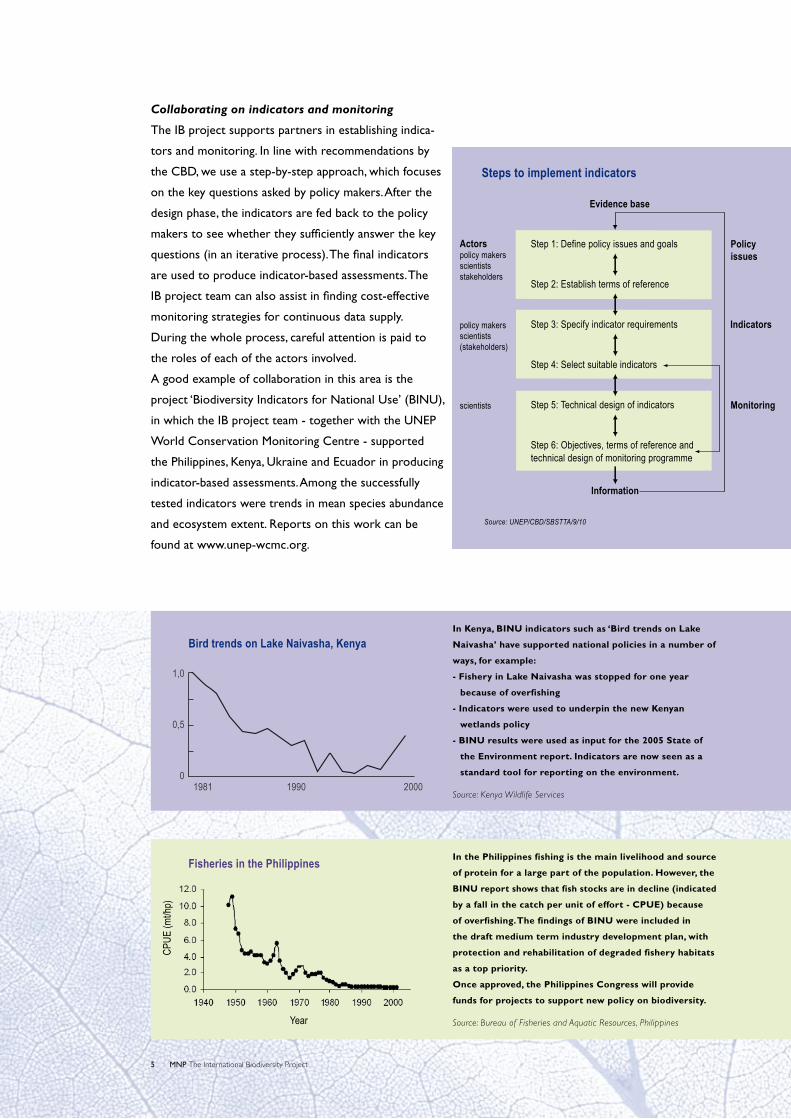
Collaborating on indicators and monitoring
The IB project supports partners in establishing indica-
tors and monitoring. In line with recommendations by
the CBD, we use a step-by-step approach, which focuses
on the key questions asked by policy makers. After the
design phase, the indicators are fed back to the policy
makers to see whether they sufficiently answer the key
questions (in an iterative process). The final indicators
are used to produce indicator-based assessments. The
IB project team can also assist in finding cost-effective
monitoring strategies for continuous data supply.
During the whole process, careful attention is paid to
the roles of each of the actors involved.
A good example of collaboration in this area is the
project ‘Biodiversity Indicators for National Use’ (BINU),
in which the IB project team - together with the UNEP
World Conservation Monitoring Centre - supported
the Philippines, Kenya, Ukraine and Ecuador in producing
indicator-based assessments. Among the successfully
tested indicators were trends in mean species abundance
and ecosystem extent. Reports on this work can be
found at www.unep-wcmc.org.
� MNP The International Biodiversity Project
Step 1: Define policy issues and goals
Step 2: Establish terms of reference
Step 3: Specify indicator requirements
Step 4: Select suitable indicators
Step 5: Technical design of indicators
Step 6: Objectives, terms of reference and technical design of monitoring programme
Actorspolicy makersscientistsstakeholders
policy makersscientists(stakeholders)
scientists
Policy issues
Indicators
Monitoring
Evidence base
Information
Source: UNEP/CBD/SBSTTA/9/10
Steps to implement indicators
Fisheries in the Philippines
TOOL 2 Why is it changing: Biodiversity modelling
Models help us to understand the relationship between human activities, the environment and biodiversity.
They can thus help answer questions on the impacts of policies on biodiversity, ecosystem goods and services
and poverty. A model may also help us to find the major reasons for change and identify the areas where
impact is greatest. Furthermore, models are used to explore whether, how and when targets can be met.
The GLOBIO 3 model
The Netherlands Environmental Assessment Agency, the UNEP World Conservation Monitoring Centre and
UNEP-GRID Arendal have developed the GLOBIO 3 model. GLOBIO 3 uses quantitative relationships between
environmental pressure factors and biodiversity, based on state-of-the-art knowledge from literature.
Pressure factors used in the model comprise changes in land use (agriculture, forestry and settlements),
climate change, infrastructure, fragmentation and nitrogen deposition. By combining results related to individual
pressures, the overall change in biodiversity is calculated in terms of mean species abundance (MSA) and the
extent of ecosystems. The model is linked to several other global models, including the global fisheries model
EcoOcean of the University of British Colombia. Relationships with poverty will be added to the model.
In 200� a review panel of international scientists concluded that the GLOBIO 3 approach is scientifically
sound and fit for this purpose (Leemans et al. 2006, available on request). Following the recommendations, the
GLOBIO 3 team - together with national partners - is now focusing on further developing a poverty module
and species-based modelling.
primaryforest
lightlyused
secon-dary
agro-forestry
planta-tion
low inputagriculture
pasture intensiveagriculture
0,0
0,2
0,4
0,6
0,8
1,0
mean species abundance (MSA)
Impact of land use
Figure right: An example of a pressure-biodiversity relation-
ship in the GLOBIO 3 model: the impacts of changes in land
use on biodiversity, in terms of the mean species abundance
(MSA). Similar relationships are available for the other
pressures.
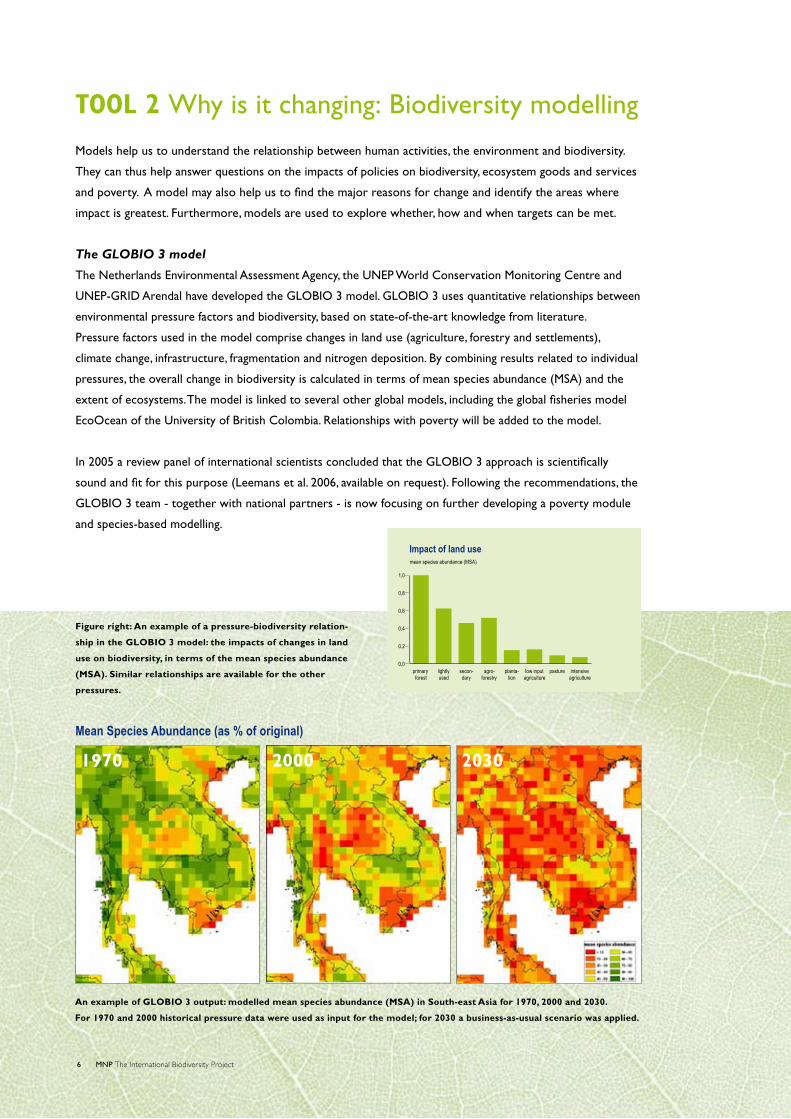
An example of GLOBIO 3 output: modelled mean species abundance (MSA) in South-east Asia for 1970, 2000 and 2030.
For 1970 and 2000 historical pressure data were used as input for the model; for 2030 a business-as-usual scenario was applied.
1970 2000 2030
Mean Species Abundance (as % of original)
6 MNP The International Biodiversity Project
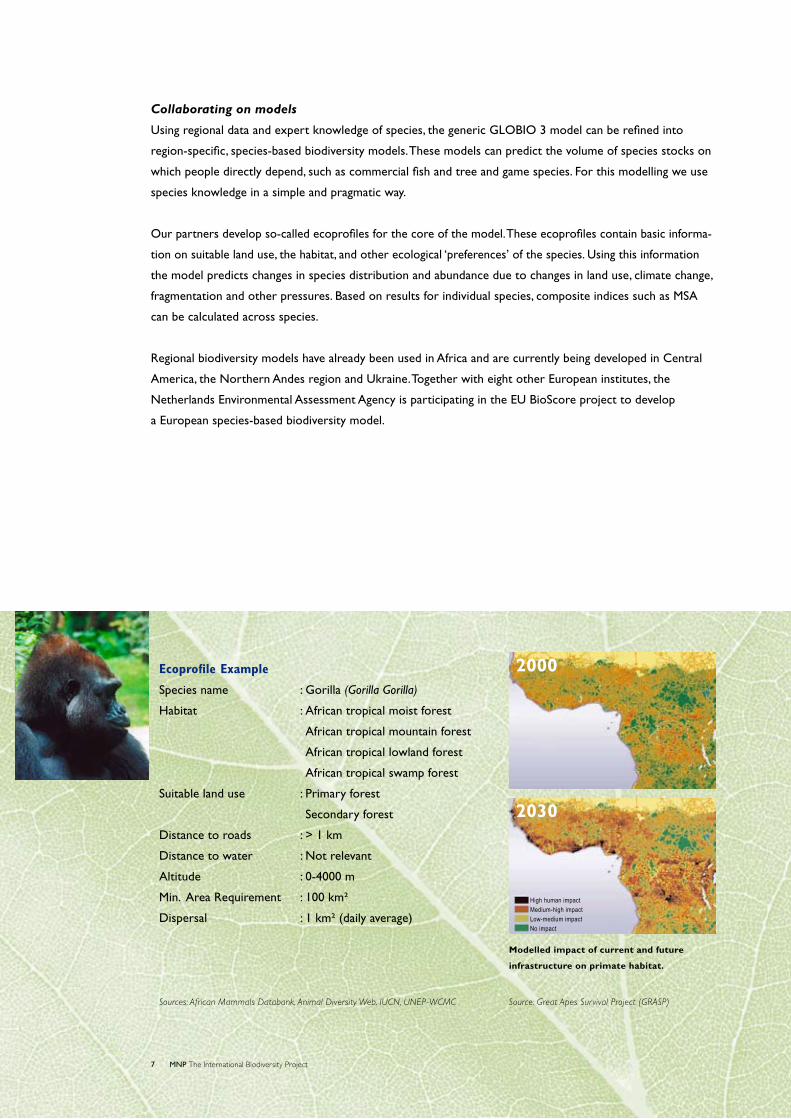
Ecoprofile Example
Species name : Gorilla (Gorilla Gorilla)
Habitat : African tropical moist forest
African tropical mountain forest
African tropical lowland forest
African tropical swamp forest
Suitable land use : Primary forest
Secondary forest
Distance to roads : > 1 km
Distance to water : Not relevant
Altitude : 0-4000 m
Min. Area Requirement : 100 km²
Dispersal : 1 km² (daily average)
Sources: African Mammals Databank, Animal Diversity Web, IUCN, UNEP-WCMC
Collaborating on models
Using regional data and expert knowledge of species, the generic GLOBIO 3 model can be refined into
region-specific, species-based biodiversity models. These models can predict the volume of species stocks on
which people directly depend, such as commercial fish and tree and game species. For this modelling we use
species knowledge in a simple and pragmatic way.
Our partners develop so-called ecoprofiles for the core of the model. These ecoprofiles contain basic informa-
tion on suitable land use, the habitat, and other ecological ‘preferences’ of the species. Using this information
the model predicts changes in species distribution and abundance due to changes in land use, climate change,
fragmentation and other pressures. Based on results for individual species, composite indices such as MSA
can be calculated across species.
Regional biodiversity models have already been used in Africa and are currently being developed in Central
America, the Northern Andes region and Ukraine. Together with eight other European institutes, the
Netherlands Environmental Assessment Agency is participating in the EU BioScore project to develop
a European species-based biodiversity model.
Modelled impact of current and future
infrastructure on primate habitat.
Source: Great Apes Survival Project (GRASP)
� MNP The International Biodiversity Project
High human impact
Medium-high impact
Low-medium impact
No impact
2000
2030
8 MNP The International Biodiversity Project
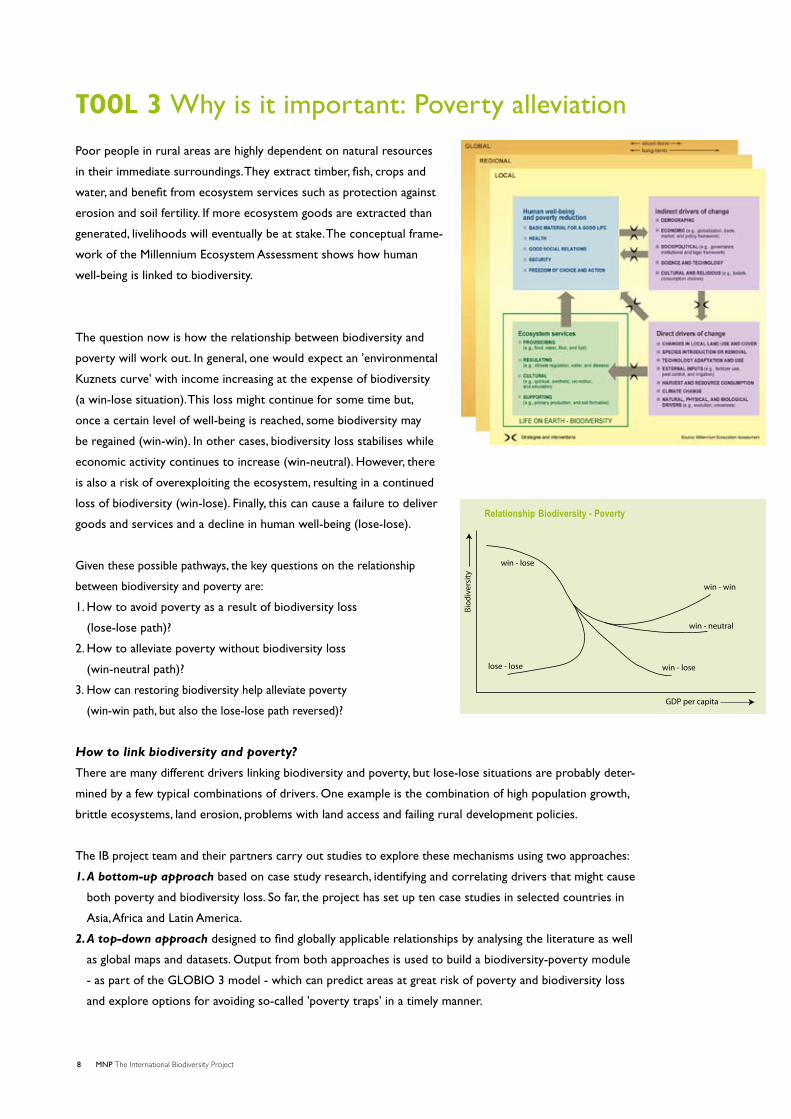
Poor people in rural areas are highly dependent on natural resources
in their immediate surroundings. They extract timber, fish, crops and
water, and benefit from ecosystem services such as protection against
erosion and soil fertility. If more ecosystem goods are extracted than
generated, livelihoods will eventually be at stake. The conceptual frame-
work of the Millennium Ecosystem Assessment shows how human
well-being is linked to biodiversity.
The question now is how the relationship between biodiversity and
poverty will work out. In general, one would expect an 'environmental
Kuznets curve' with income increasing at the expense of biodiversity
(a win-lose situation). This loss might continue for some time but,
once a certain level of well-being is reached, some biodiversity may
be regained (win-win). In other cases, biodiversity loss stabilises while
economic activity continues to increase (win-neutral). However, there
is also a risk of overexploiting the ecosystem, resulting in a continued
loss of biodiversity (win-lose). Finally, this can cause a failure to deliver
goods and services and a decline in human well-being (lose-lose).
Given these possible pathways, the key questions on the relationship
between biodiversity and poverty are:
1. How to avoid poverty as a result of biodiversity loss
(lose-lose path)?
2. How to alleviate poverty without biodiversity loss
(win-neutral path)?
3. How can restoring biodiversity help alleviate poverty
(win-win path, but also the lose-lose path reversed)?
How to link biodiversity and poverty?
There are many different drivers linking biodiversity and poverty, but lose-lose situations are probably deter-
mined by a few typical combinations of drivers. One example is the combination of high population growth,
brittle ecosystems, land erosion, problems with land access and failing rural development policies.
The IB project team and their partners carry out studies to explore these mechanisms using two approaches:
1. A bottom-up approach based on case study research, identifying and correlating drivers that might cause
both poverty and biodiversity loss. So far, the project has set up ten case studies in selected countries in
Asia, Africa and Latin America.
2. A top-down approach designed to find globally applicable relationships by analysing the literature as well
as global maps and datasets. Output from both approaches is used to build a biodiversity-poverty module
- as part of the GLOBIO 3 model - which can predict areas at great risk of poverty and biodiversity loss
and explore options for avoiding so-called 'poverty traps' in a timely manner.
Bio
div
ersi
ty
GDP per capita
Relationship Biodiversity - Poverty
win - neutral
win - lose
win - lose
win - win
lose - lose
TOOL 3 Why is it important: Poverty alleviation
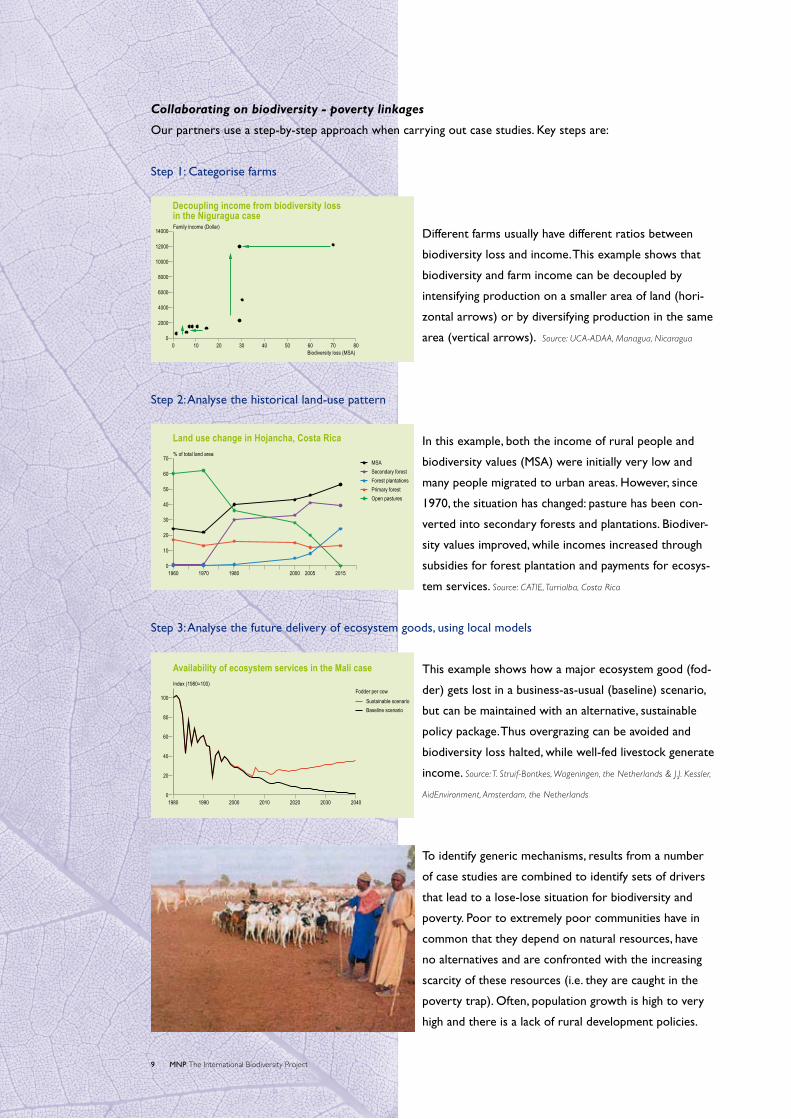
Collaborating on biodiversity - poverty linkages
Our partners use a step-by-step approach when carrying out case studies. Key steps are:
Step 1: Categorise farms
Different farms usually have different ratios between
biodiversity loss and income. This example shows that
biodiversity and farm income can be decoupled by
intensifying production on a smaller area of land (hori-
zontal arrows) or by diversifying production in the same
area (vertical arrows). Source: UCA-ADAA, Managua, Nicaragua
Step 2: Analyse the historical land-use pattern
In this example, both the income of rural people and
biodiversity values (MSA) were initially very low and
many people migrated to urban areas. However, since
19�0, the situation has changed: pasture has been con-
verted into secondary forests and plantations. Biodiver-
sity values improved, while incomes increased through
subsidies for forest plantation and payments for ecosys-
tem services. Source: CATIE, Turrialba, Costa Rica
Step 3: Analyse the future delivery of ecosystem goods, using local models
This example shows how a major ecosystem good (fod-
der) gets lost in a business-as-usual (baseline) scenario,
but can be maintained with an alternative, sustainable
policy package. Thus overgrazing can be avoided and
biodiversity loss halted, while well-fed livestock generate
income. Source: T. Struif-Bontkes, Wageningen, the Netherlands & J.J. Kessler,
AidEnvironment, Amsterdam, the Netherlands
To identify generic mechanisms, results from a number
of case studies are combined to identify sets of drivers
that lead to a lose-lose situation for biodiversity and
poverty. Poor to extremely poor communities have in
common that they depend on natural resources, have
no alternatives and are confronted with the increasing
scarcity of these resources (i.e. they are caught in the
poverty trap). Often, population growth is high to very
high and there is a lack of rural development policies.
Decoupling income from biodiversity loss in the Niguragua case
0 10 20 30 40 50 60 70 80Biodiversity loss (MSA)
0
2000
4000
6000
8000
10000
12000
14000Family income (Dollar)
1960 1970 1980 2000 2005 20150
10
20
30
40
50
60
70% of total land area
MSA
Secondary forest
Forest plantations
Primary forest
Open pastures
Land use change in Hojancha, Costa Rica
1980 1990 2000 2010 2020 2030 20400
20
40
60
80
100
Index (1980=100)Fodder per cow
Sustainable scenario
Baseline scenario
Availability of ecosystem services in the Mali case
9 MNP The International Biodiversity Project
TOOL 4 What can we do about it: Assessments
Governments develop and implement Biodiversity Strategy and Action Plans, Socio-Economic Development
Plans and Poverty Reduction Strategy Papers at national, regional and global level. Assessments are needed to
answer the key questions that policy makers ask in a coherent manner:
• What is changing? • Why is it changing? • Why is it important? • What can we do about it?
Global assessments
Models and indicators developed by the IB project team are used in evaluating socio-economic and environ-
mental policies that may have an effect on land use, climate and biodiversity. Using these tools, the IB project
team has contributed to e.g. UNEP’s Global Environmental Outlooks, OECD assessments, the Millennium
Ecosystem Assessment and the 2nd Global Biodiversity Outlook.
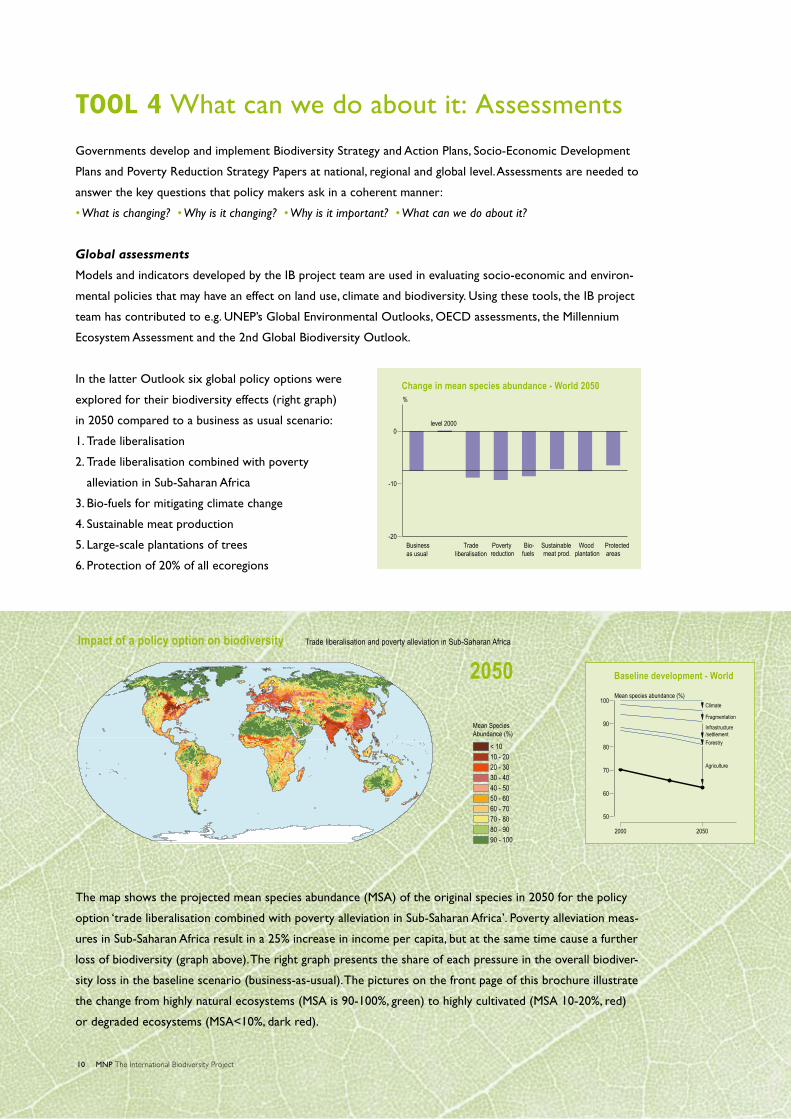
In the latter Outlook six global policy options were
explored for their biodiversity effects (right graph)
in 20�0 compared to a business as usual scenario:
1. Trade liberalisation
2. Trade liberalisation combined with poverty
alleviation in Sub-Saharan Africa
3. Bio-fuels for mitigating climate change
4. Sustainable meat production
�. Large-scale plantations of trees
6. Protection of 20% of all ecoregions
The map shows the projected mean species abundance (MSA) of the original species in 20�0 for the policy
option ‘trade liberalisation combined with poverty alleviation in Sub-Saharan Africa’. Poverty alleviation meas-
ures in Sub-Saharan Africa result in a 2�% increase in income per capita, but at the same time cause a further
loss of biodiversity (graph above). The right graph presents the share of each pressure in the overall biodiver-
sity loss in the baseline scenario (business-as-usual). The pictures on the front page of this brochure illustrate
the change from highly natural ecosystems (MSA is 90-100%, green) to highly cultivated (MSA 10-20%, red)
or degraded ecosystems (MSA<10%, dark red).
Mean Species Abundance (%)
< 1010 - 2020 - 3030 - 4040 - 50 50 - 6060 - 70 70 - 8080 - 9090 - 100
Impact of a policy option on biodiversity Trade liberalisation and poverty alleviation in Sub-Saharan Africa
2050
Businessas usual
Tradeliberalisation
Poverty reduction
Bio- fuels
Sustainablemeat prod.
Wood plantation
Protected areas
-20
-10
0
%
level 2000
Change in mean species abundance - World 2050
2000 2050
50
60
70
80
90
100Mean species abundance (%)
Agriculture
Forestry
Infrastructure/settlement
Fragmentation
Climate
Baseline development - World
10 MNP The International Biodiversity Project
Collaborating on assessments
In national and regional assessments, the specific physical characteristics and policy issues of the area can be
taken into account. To this end the global input in the generic indicators and models is replaced by national data
to analyse the causes of biodiversity change and explore policy options. In collaborative projects the IB team
can help partners produce such assessments. For national assessments the following national data can be used:
- land-use data
- data on pressures
- socio-economic scenarios
- policy options
- poverty incidence
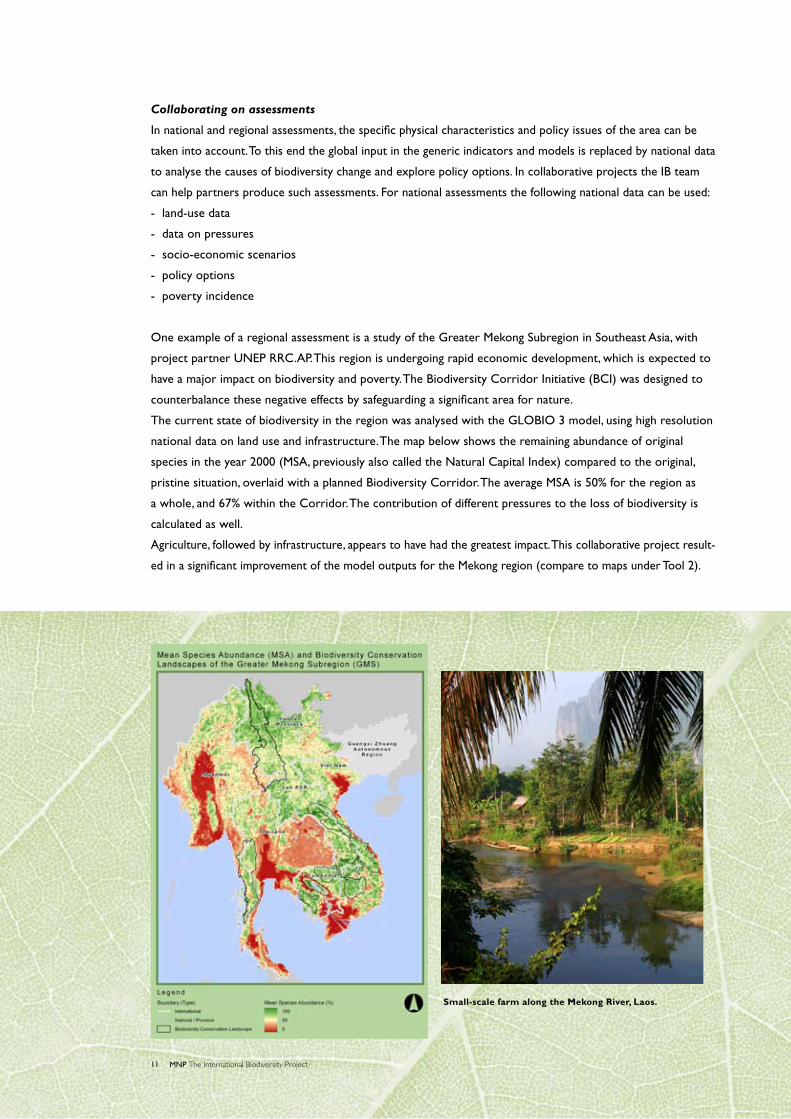
One example of a regional assessment is a study of the Greater Mekong Subregion in Southeast Asia, with
project partner UNEP RRC.AP. This region is undergoing rapid economic development, which is expected to
have a major impact on biodiversity and poverty. The Biodiversity Corridor Initiative (BCI) was designed to
counterbalance these negative effects by safeguarding a significant area for nature.
The current state of biodiversity in the region was analysed with the GLOBIO 3 model, using high resolution
national data on land use and infrastructure. The map below shows the remaining abundance of original
species in the year 2000 (MSA, previously also called the Natural Capital Index) compared to the original,
pristine situation, overlaid with a planned Biodiversity Corridor. The average MSA is �0% for the region as
a whole, and 6�% within the Corridor. The contribution of different pressures to the loss of biodiversity is
calculated as well.
Agriculture, followed by infrastructure, appears to have had the greatest impact. This collaborative project result-
ed in a significant improvement of the model outputs for the Mekong region (compare to maps under Tool 2).
11 MNP The International Biodiversity Project
Small-scale farm along the Mekong River, Laos.
© MNP May 2006
MNPThe Netherlands Environmental Assessment Agency (MNP) is one of four independent assessment agencies
in the Netherlands, which together give substance to the World Bank’s ‘People-Planet-Profit’ concept. The
MNP’s primary task is to provide the Dutch government with information on a wide variety of environmental
issues that is based on its extensive scientific knowledge and expertise. Policy makers use MNP research
findings to develop, implement and enforce environmental policy. MNP underpins government policy with
its modelling, risk and impact assessment results. Operating within the remit of the Dutch Environmental
Management Act and the Nature Conservation Act, the MNP charts the current status of the environment
and nature in collaboration with a range of scientific institutes and other national assessment agencies. MNP
contributes to broad, ecologically based political and social debate. It also supports the international assess-
ment activities of various bodies within the European Union and the United Nations. The MNP teams share
their knowledge and expertise with national and regional governments as well as with supranational bodies
around the world.
ContactBen ten Brink, project leader
The Netherlands Environmental Assessment Agency (MNP)
PO Box 303
3�20 AH Bilthoven
The Netherlands
telephone: 00 31 30 2�4 2210
e-mail: [email protected]
FundingNetherlands Ministry of Housing, Spatial Planning and the Environment (VROM)
Netherlands Ministry of Agriculture, Nature and Food Quality (LNV)
Netherlands Ministry of Foreign Affairs, Directorate-General for International Cooperation (DGIS)
PartnersSNV Vietnam
Centre for Natural Resources and Environment, Vietnam
UNEP Regional Resource Centre for Asia and the Pacific
Bureau of Fisheries and Aquatic Resources, Philippines
Kenya Wildlife Services
The Council for Scientific and Industrial Research, South Africa
Centro Internacional de Mejoramiento de Maiz y Trigo, Mexico
El Colegio de la Frontera Sur, Mexico
Sistema Nacional de Información Ambiental, Nicaragua
University of Central America, Nicaragua
SNV Nicaragua
Centro Agronómico Tropical de Investigación y Enseñanza, Costa Rica
Ecociencia, Ecuador
Ukraine Land Resource Management Center
AIDEnvironment, The Netherlands
Alterra, Wageningen UR, The Netherlands
SARVision, The Netherlands
European Centre for Nature Conservation, The Netherlands
UNEP-World Conservation Monitoring Centre, UK
UNEP-GRID Arendal, Norway
University of British Colombia (The Sea Around Us Project), Canada
Private consultants